Article

Combining Microwave Pretreatment with Iron Oxide Nanoparticles Enhanced Biogas and Hydrogen Yield from Green Algae

1
College of Power and Energy Engineering, Harbin Engineering University, Harbin 150001, China
2
Department of Mechanical Engineering, Faculty of Engineering, Islamic University of Madinah, Medina 42351, Saudi Arabia
3
Department of Textile Engineering, Balochistan University of Information Technology, Engineering and Management Sciences, Quetta 87300, Pakistan
4
Department of Engineering Sciences, PN Engineering College, National University of Sciences and Technology, Karachi 75350, Pakistan
*
Author to whom correspondence should be addressed.
Processes 2019, 7(1), 24; https://doi.org/10.3390/pr7010024
Submission received: 15 December 2018 / Revised: 27 December 2018 / Accepted: 2 January 2019 / Published: 7 January 2019
(This article belongs to the Special Issue Hydrogen Production Technologies)

Abstract

:
The available energy can be effectively upgraded by adopting smart energy conversion measures. The biodegradability of biomass can be improved by employing pretreatment techniques; however, such methods result in reduced energy efficiency. In this study, microwave (MW) irradiation is used for green algae (Enteromorpha) pretreatment in combination with iron oxide nanoparticles (NPs) which act as a heterogeneous catalyst during anaerobic digestion process for biogas enhancement. Batch-wise anaerobic digestion was carried out. The results showed that MW pretreatment and its combination with Fe3O4 NPs produced highest yields of biogas and hydrogen as compared to the individual ones and control. The biogas amount and hydrogen % v/v achieved by MW pretreatment + Fe3O4 NPs group were 328 mL and 51.5%, respectively. The energy analysis indicated that synergistic application of MW pretreatment with Fe3O4 NPs produced added energy while consuming less input energy than MW pretreatment alone. The kinetic parameters of the reaction were scientifically evaluated by using modified Gompertz and Logistic function model for each experimental case. MW pretreatment + Fe3O4 NPs group improved biogas production potential and maximum biogas production rate.

1. Introduction

Anaerobic digestion (AD) is a microbial-mediated process which is widely used for the conversion of complex organic waste to renewable energy in the form of biogas [1]. The synergistic catalysis of various microorganisms without oxygen determines the biological route of the AD process. The organic matter conversion to biogas follow four main conversion phases namely; hydrolysis, acidogenesis, acetogenesis, and methanogenesis [2]. During the hydrolysis stage complex polymeric organic matter including carbohydrates, proteins, and fats transform into simple organic monomers by the action of hydrolytic bacteria. The monomers such as sugar, amino acids, and fatty acids are then converted into volatile fatty acids (VFAs) under the action of fermentative bacteria during the second stage called as acidogenesis. During the third phase, acetogenic bacteria transforms VFAs into acetic acid and hydrogen (H2) gas. Methanogenic bacteria transform acetic acid and H2 into methane (CH4) and carbon dioxide (CO2) [3]. The quality of biogas in terms of composition varies depending on biomass, precursors, additives and the conversion process. In general, biogas contains 50–75% methane and 25–45% carbon dioxide, in addition to small amounts of other gases and typically has a calorific value of 21–24 MJ/m3 [4].
One of the potential feedstocks for biogas generation by AD process is algal biomass [5]. Algae are unicellular or multicellular organisms. In comparison with other biomass, they possess many benefits such as they can grow in natural and artificial systems, they can grow in fresh and marine water [6,7]. In addition, they have high biomass yield and greater carbon dioxide capture. Algal biomass can offer numerous biofuels such as biohydrogen, methane, biodiesel, bioethanol, and biogas [8]. The strong resistant algae cell wall is composed of three main components: biopolymers, cellulose, and hemicellulose. These components play a protective role in cells. Cellulose molecules are arranged regularly in the form of bundles. It also contains a small portion of pectin, protein, ash, and extracts, including soluble non-structural substances, non-structural sugars, nitrogen compounds, chlorophyll, and waxes [9]. However, the inter- and intra-molecular hydrogen bonds have made the dissolution of cellulose a difficult process in common solvents. This hinders or limits the anaerobic digestion of algal biomass during the hydrolysis stage.
Numerous pretreatment methods for algae can be used including biological (enzymatic), chemical (acid or alkali), physical (ultrasound, microwave, or shear force) and thermal methods [10]. However, selection of a pretreatment process is mainly reliant on its low capital cost, positive energy balance, and lesser operational cost to make AD process economically feasible [11]. Microwave (MW) pretreatment is the transmission of electromagnetic energy in the frequency range of 0.3 to 300 GHz. MW pretreatment involves no contact amongst the source and the chemicals [12]. Passos et al. [13] studied the effect of MW pretreatment on algae from High Rate Algal Ponds (HRAP). Results showed that MW pretreatment enhanced biogas production rate (25–75%) and successfully improved the digestibility of algal biomass. Several studies discussed MW pretreatment applied to waste activated sludge [14,15,16,17,18,19]. Almost all the studies reported an enhancement in sludge solubilization and biogas generation. In our previous study [20], optimization of MW pretreatment for an AD of Enteromorpha was carried out using response surface methodology. Results showed that 24.4 mL biogas/g dry algae was produced at the optimized MW pretreatment conditions after AD.
The concerns about expansion in the bioenergy sector during the past decade have driven a number of scientists and researchers to pursue innovative solutions for its production. Nanotechnology is one of the emerging branches of science. It deals with dimensions less than 100 nm. It is the art of manipulating individual atoms. It is the most striking and fertile field which allows researchers to work at the molecular level [21]. In the field of bioenergy, nanotechnology can be applied for feedstock modification and more efficient catalysis. Minerals are needed for microorganism development [4]. Liu et al. [22] reported that minerals deliver upright atmosphere for anaerobic bacteria inside a digester and enhance biogas and methane generation. In another study, Qiang et al. [23] stated that in the presence of iron, cobalt, and nickel, methanogenic bacteria grow quickly during enzyme production. Heavy metal ions such as Co, Cu, Fe, Mo, Ni, and Zn have been documented as essential for several reactions during AD by Luna-deRisco et al. [24]. Micronutrients such as Co, Ni, Fe, Mg, and Ca are crucial for a variety of chemical, biochemical, and microbiological reactions related to VFA utilization, biogas generation, and cell lysis [25]. Nanoparticles (NPs) of micronutrients had an augmented effect on biogas production. Cascals et al. [26] applied 100 ppm (100 mg/L) of Fe3O4 NPs (7 nm) to organic waste in an anaerobic digester under mesophilic conditions (37 °C) for 60 days. Results showed an enhancement of 180% in biogas and 234% increase in methane yield. The authors mentioned that Fe2+ act as a unique source, which disintegrates the organic matter and increases biogas production in the anaerobic bacterial reactor. Suanon et al. [27] studied the metal distribution conversion during AD of wastewater sludge under the presence of Fe3O4 NPs. Batch anaerobic system was used under mesophilic conditions (37 °C). Methane production increases by 1.25 and 0.9 times by 0.75 g and 1.5 g per 500 mL dose of Fe3O4 NPs, respectively. The addition of Fe3O4 NPs showed an improvement of metals stabilization in the digestate resulted in an enhancement of biogas and methane production. Abdelsalam et al. [28] examined the influence of Fe3O4 NPs with different concentrations (5, 10, and 20 mg/L) on biogas and methane yield from the AD of cattle manure (CM) slurry. Anaerobic fermentation of CM was carried out batch-wise at operating temperature and mixing rate of 37 ± 0.3 °C and 90 rpm for a hydraulic retention time (HRT) of 50 days. The study indicated that the addition of 20 mg/L Fe3O4 NPs increases biogas production by 1.66 times and methane production by 1.96 times. Our previous work [29] investigated the effect of Fe3O4 NPs on biogas yield from anaerobic digestion of green algae (Enteromorpha). Results showed that the 10 mg/L of Fe3O4 NPs cumulative increase in biogas production was 28%. It was observed that during the less effective domain NPs had no additional effect as a controlled sample. However, approximately after 60 h of the digestion process, NPs showed the incremental effect on biogas production. It has been suggested that combining the pretreatment with NPs may result in an early dissolution of the algae cell wall and provide faster action by NPs on stimulation of microorganisms to achieve high cumulative biogas yield with positive energy balance. Therefore, the objective of the present study is to examine the effect of combining a microwave (MW) pretreatment of Enteromorpha with Fe3O4 NPs. Energy ratio was calculated, and established prediction models are used to substantiate the experimental results of this work for the approximation of biogas generation during AD.

2. Materials and Methods

2.1. Raw Material

Anaerobic sludge was acquired from Harbin Wenchang Sewage Treatment Plant, Harbin, Heilongjiang province, China. Total suspension solids (TSS) of sludge were 6390 mg/L whereas Volatile Suspension Solids (VSS) were 2545 mg/L. The Enteromorpha was attained from the Institute of Hydrobiology of The Chinese Academy of Science, Wuhan, China. It was air-dried in the drying oven and then sealed in a bottle with a breathable film on the top. Each biodigester contained 60 mL of sludge and 20 g of Enteromorpha powder. The protein, fat and ash content of Enteromorpha were 13.20%, 1.06%, and 21.77%, respectively. Fe3O4 NPs (spherical shape with an average size < 100 nm were purchased from China Metallurgical Research Institute, Beijing, China. The concentration of NPs in the biomass was 10 mg/L. Similar NP concentration has been used in our previous study [29] and other studies [30,31]. In order to reduce the agglomeration of NPs, suspensions for the given concentration by adding distilled water containing sodium dodecylbenzene sulfonate (SDS) 0.1 mM was prepared [32].

2.2. Experimental Setup

The MW pretreatment was performed before AD. A household Panasonic microwave oven (1180 W) was used. The Enteromorpha solution was stirred after every minute. The MW pretreatment condition was liquid:solid, pretreatment time and pretreatment power of 20:1, 6 min and 600 W, respectively [20]. The batch-wise AD experiments were conducted through the anaerobic batch system. The laboratory glass bottles (working volume = 500 mL) were used as biodigesters and operated for 108 h. The biodigesters were airtight with rubber plugs. Nitrogen gas was purged through a digester for 5 min at the start to create anaerobic condition [33]. The environment inside digester has been retained at 37 °C [31] and 150 rpm mixing speed. The gas chromatography (SP-2100A, BFRL Co., Beijing, China) was employed to determine hydrogen content % (v/v) of the biogas. Thermogravimetric analysis (TGA) was conducted to explore the decomposition of algae intercellular organic compounds using TA Instruments Q50. TGA was performed at a heating rate of 20 °C/min from 40 to 600 °C under a constant nitrogen flow rate of 50 mL/min. A medical syringe with a long needle was used to collect the samples from air-tight bottles and transferred to small tubes covered with rubber stoppers to avoid gas loss. The biogas generation was measured twice a day whereas its composition was observed once. Each experiment was conducted in triplicate to reduce likely errors, and the average values are indicated. OriginPro 8 software was used to perform one-way ANOVA analysis of results, p < 0.05 was considered to be statistically significant.

2.3. Energy Balance Analysis

The energy assessment was evaluated via calculation of energy input needed for pretreatment and the enhancement in biohydrogen yield for pretreated Enteromorpha [11]. The input energy and output energy were calculated using Equations (1) and (2). The energy ratio (Equation (3)) was calculated as the energy output over energy input. If energy ratio value is greater than 1, it means that the energy yield from hydrogen generation during AD was higher in comparison with the energy required for MW pretreatment. It should be noted that this energy analysis does not include the energy required to dry biomass and other processes for precursors.
E i = P × t V × T S
where:
  • Ei = Energy input (kJ/gVS)
  • P = Power required for pretreatment (W)
  • t = Microwave pretreatment time (s)
  • V = Volume of biomass (L)
  • TS = Total solid in biomass (g TS/L)
E o = Δ P × ε 10 6
where:
  • Eo = Energy output (kJ/gVS)
  • ΔP = Hydrogen yield (ml H2/gVS)
  • ε = Calorific value of hydrogen (120,000 kJ/m3)
Δ E = E o E i

2.4. Mathematical Kinetic Models

The AD process performance with the combined effect of MW pretreatment and Fe3O4 NPs was mathematically evaluated via modified Gompertz model Equation (4) [34] and Logistic Function model Equation (5) [35]. OriginPro 8 software was used to determine kinetic parameters for both models. The software uses an iterative method by employing the Levenberg-Marquardt (L-M) algorithm to estimate parameters for describing reaction kinetics. Akaike Information Criterion (AIC) test was performed to asses which model is better describing the kinetics of the AD process [36]. The model with lower AIC value suggests a better fit and predicting capability. For each model, the AIC value and Akaike’s weight value was calculated by using Equations (6) and (7) [37]:
B = B p · exp ( exp ( MBPR 2.7183 B p · ( BPDT t ) + 1 ) )
B = B p 1 + exp [ 4 MBPR BPDT t B p + 2 ]
where:
  • B = Cumulative biogas volume at digestion time t (mL)
  • BP = Biogas production potential (mL)
  • MBPR = Maximum biogas production rate (mL/h)
  • BPDT = Biogas production delay time (h)
  • t = Total digestion time (h)
AIC = { N l n R S S + 2 K N ,   w h e n   N K 40 N l n R S S N + 2 K + 2 K ( K + 1 ) N K 1 ,   when   N K < 40
Akaike s   weight = e 0.5 Δ A I C 1 + e 0.5 Δ A I C
where:
  • N = Number of points
  • RSS = Residual sum of square
  • K = Number of model parameters
  • ΔAIC = The relative difference between the two AIC values

3. Results and Discussion

3.1. Biogas and Hydrogen Production

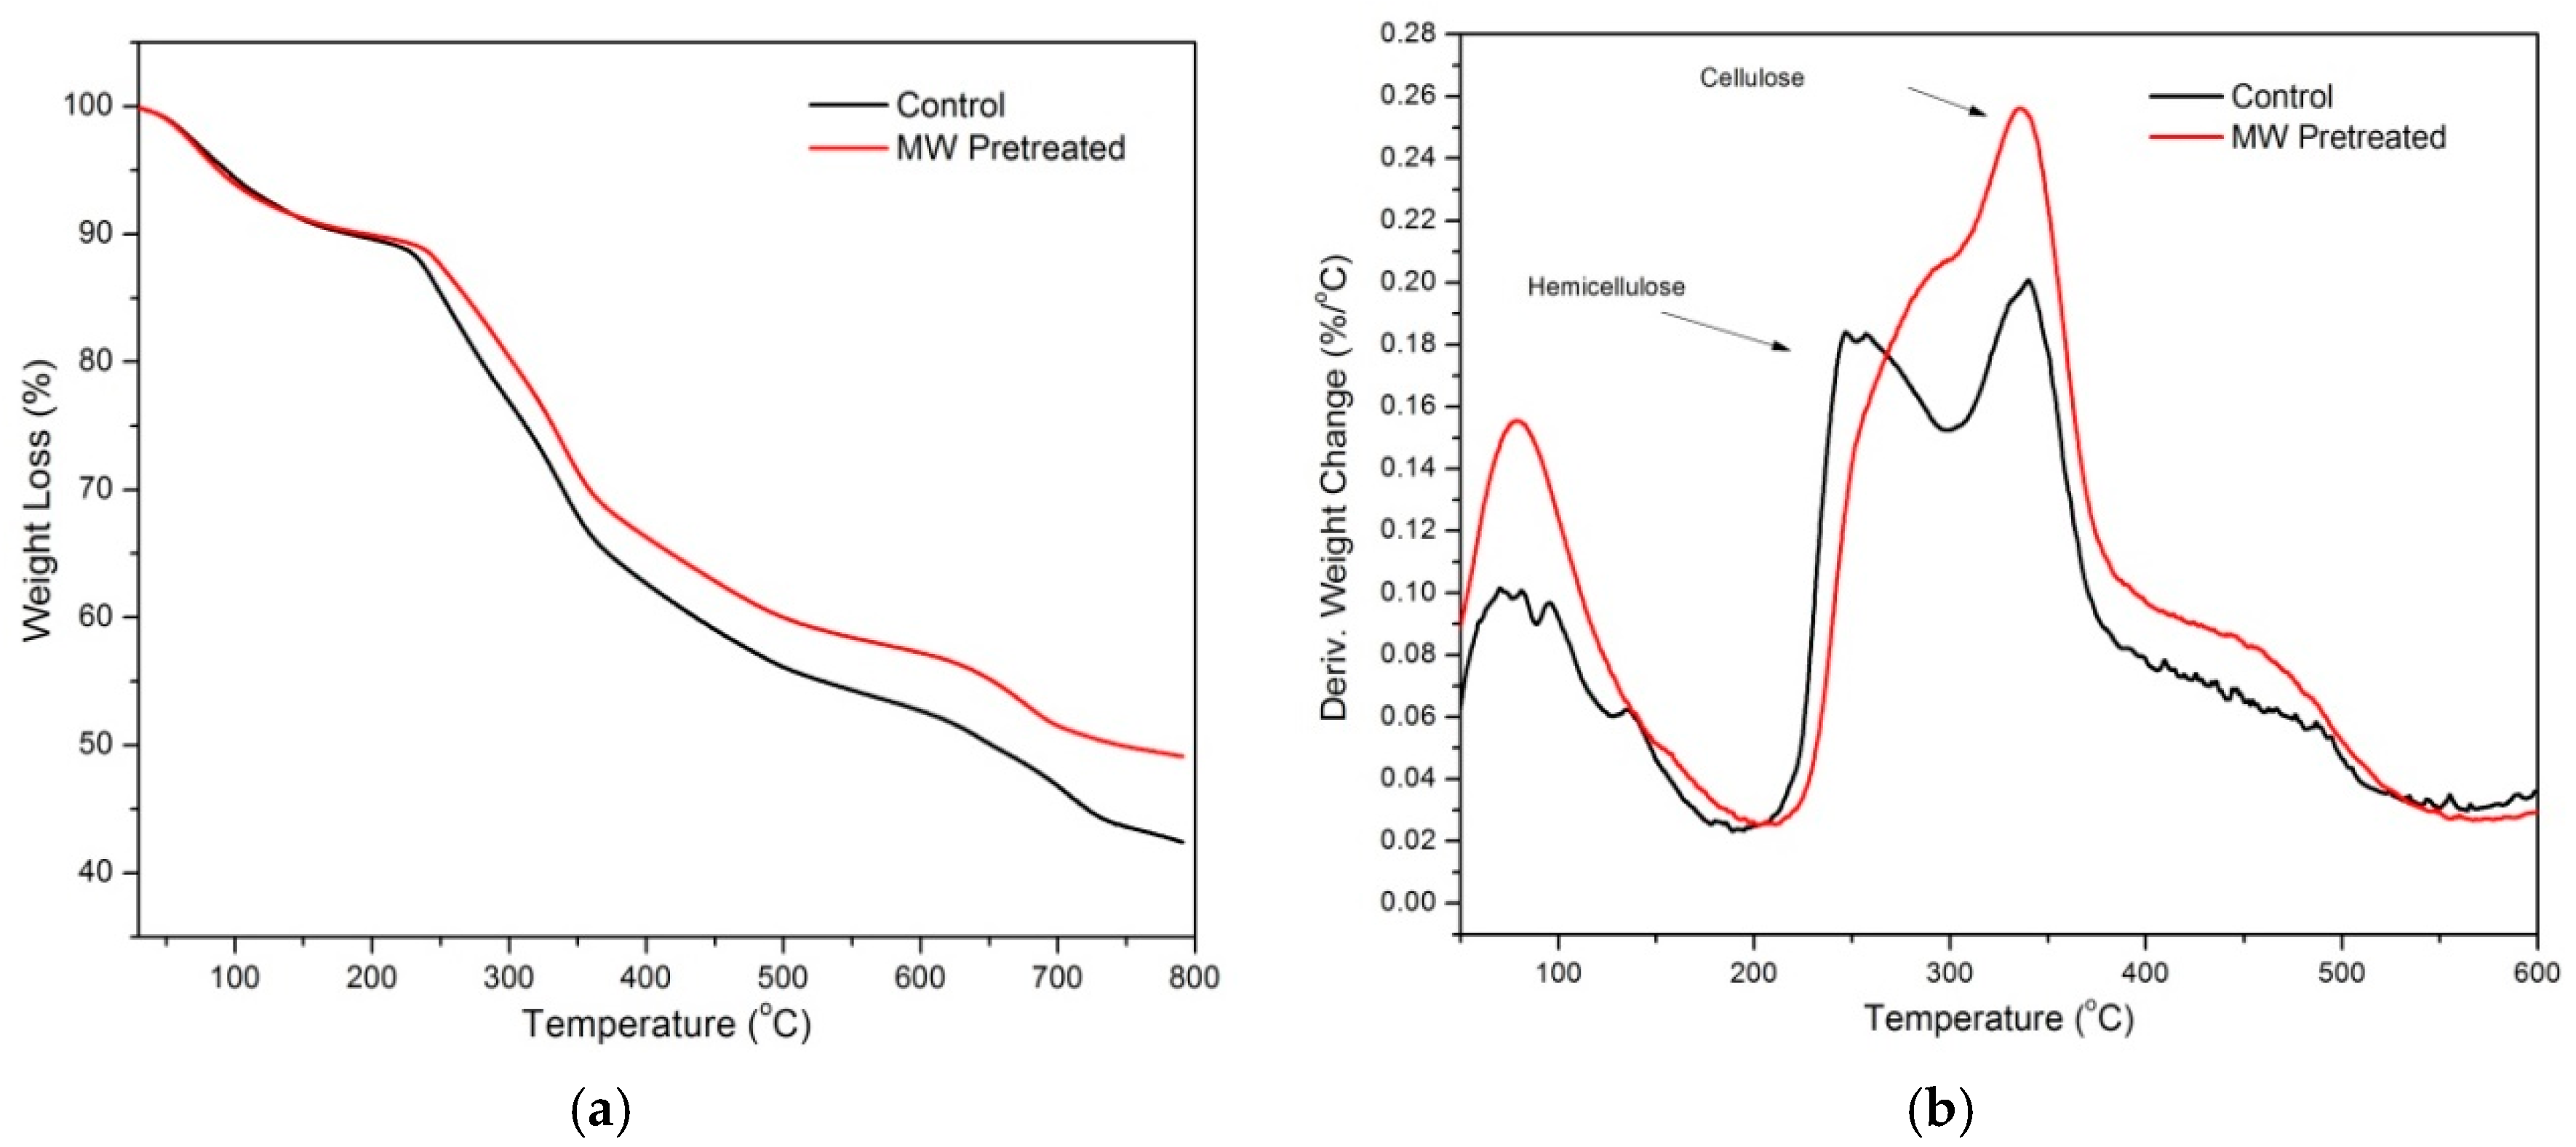
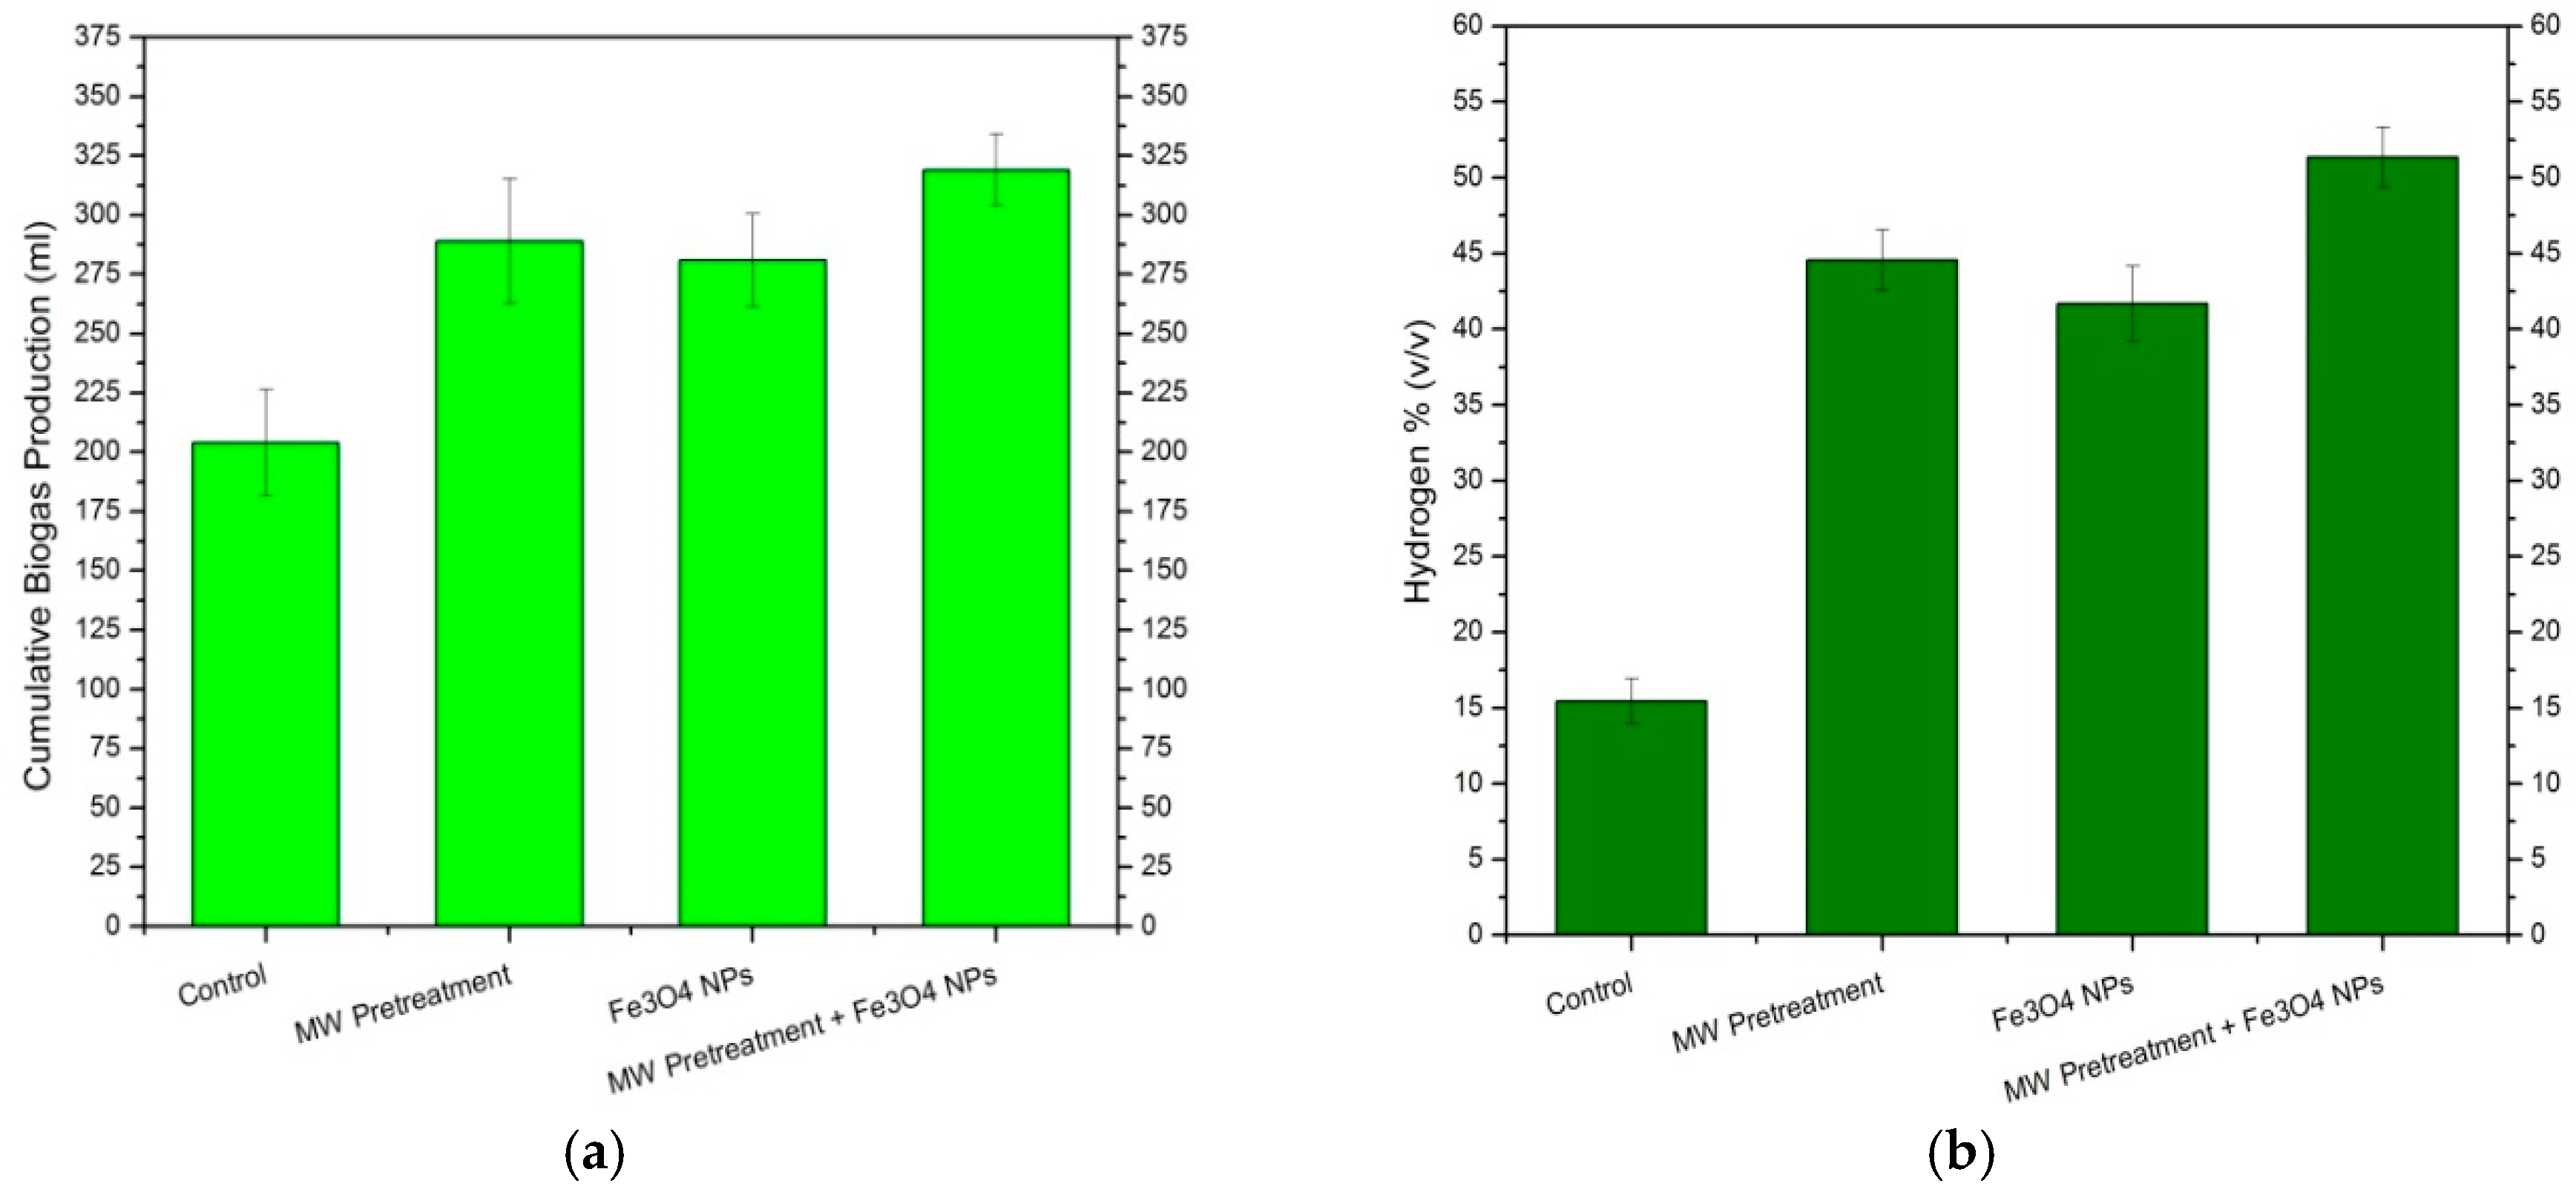
Biogas production influenced by MW pretreatment and its combination with Fe3O4 NPs is shown in Figure 1. It is to be noted that all treatments improved the biogas production as compared to control. The maximum total biogas yield of 328 mL was achieved by MW pretreatment + Fe3O4 NPs group. The MW pretreatment and Fe3O4 NPs individually produced 302 and 289 mL, respectively. The Enteromorpha cell wall comprises an external layer and an internal layer. The external layer is an electron dense polymeric matrix in which glycoprotein and carbohydrates are present, whereas cellulose and hemicellulose exist in the internal layer [38]. During the initial stage, the increase in biogas in combined Fe3O4 NPs and MW pretreatment groups is credited to the pretreatment method. MW pretreatment rises the lysis rate which results in the increasing effect on biogas production [39]. MW pretreatment hydrolyzes the glycosidic bond present in carbohydrates and polysaccharides which turns into simple sugars. The dissolution of the algae cell wall by MW pretreatment can clearly be elucidated by the results shown in Figure 2 and Table 1. The TGA and Difference Thermo Gravimetry (DTG) graphs show better degradation of MW pretreated samples as compared to the control sample. The first mass loss region ranging from 50 °C to 200 °C corresponds to evaporation of moisture and degradation of organic species. As can be noted, MW pretreatment shows a smooth single peak at a temperature of 80 °C while the control sample shows small peaks at the temperature of 69 °C, 81 °C, and 96 °C. The first mass loss values of T5% was decreased from 94 °C to 88 °C and the second stage T10%, increased from 183 °C to 196 °C for control and MW pretreated, respectively. Moreover, DTG is shown in Figure 2b, two peaks are showing the presence of hemicellulose and cellulose in the control sample at a temperature of 251 and 341 °C. It can be observed that MW pretreatment destroyed the hemicellulose to a greater extent making it available for anaerobic bacteria to produce biogas [40]. However, the peak height (max. rate of degradation) of cellulose peak for control at 341 °C is slightly affected and is shifted to 0.26 from 0.20%/°C due to MW pretreatment. This showed that MW destroyed the organic species and hemicellulose to a greater extent while the structure of cellulose was slightly altered and opens, which may account for increased biogas production. Similar results are reported for cellulose effects in the literature [41].
In a later stage, further dissolution of internal layer occurred by the attack of NPs. The hydrolysis of cellulose by NPs produce oligosaccharides such as cellobiose and cellodextrin [42]. The biopolymers (proteins, carbohydrates, and lipids) released by dissolution of the cell wall are then changed into amino acids, simple sugars, peptides and volatile fatty acids [40]. The maximum cumulative biogas and amount of hydrogen produced during the experiment are shown in Figure 3a,b. Fe3O4 NPs + MW pretreatment group produced the highest amount of biogas and highest hydrogen content (% v/v).
Similar results have been obtained by Abdelsalam et al. [31]. The authors studied the influence of Fe3O4 NPs with AD of CM slurry. Biogas enhancement of 1.7 times than the control was reported. In another study, Suanon et al. [43] stated an enhancement of 1.27 times in biogas by Fe3O4 NPs. Cascals et al. [26] mentioned that Fe2+ act as a unique source, which disintegrates the organic matter and increases biogas production in the anaerobic bacterial reactor. According to Zhang and Lu [44], Fe3O4 NPs accelerate the reaction kinetics, increase biogas yield and reduce lag time. Our results are in agreement with Passos et al. [13] who stated an increased biogas production rate and a high degree of biomass solubilization by MW pretreatment of algae from HRAP. Zheng et al. [15] studied the effect of MW irradiance on primary sludge solubilization. The results showed that MW pretreatment improved soluble chemical oxygen demand (SCOD) in sludge and the biogas production was enhanced by 37%.

3.2. Energy Assessment

The energy generated (biohydrogen) from Enteromorpha AD for all groups (i.e., output energy, Eo) was calculated as shown in Table 2. The highest Eo (20.28 kJ/gVS) was achieved by MW pretreatment + Fe3O4 NPs group. For Fe3O4 NPs, MW pretreatment and Control groups, Eo amount of 14.45, 16.15, and 3.93 kJ/gVS was produced, respectively. This shows that all the treatments resulted in an increased output energy as compared to the control sample. Energy assessment of algal biomass AD process was conducted for estimating the feasibility of the MW pretreatment and its combined effect with Fe3O4 NPs. For this purpose, the output energy was divided by the energy needed for MW pretreatment (i.e., energy input, Ei) for MW pretreatment and MW pretreatment + Fe3O4 NPs groups. For both, the MW pretreatment + Fe3O4 NPs group and MW pretreatment alone, the energy ratio was higher than one. However, the energy ratio of combined effect is higher (i.e., 1.87) as compared to MW pretreatment alone (i.e., 1.49). This indicates that the enhancement in hydrogen production obtained was enough for covering the MW energy input to the AD system, which may be described by the spontaneity in the AD process after the applied treatments.

3.3. Mathematical Kinetic Models

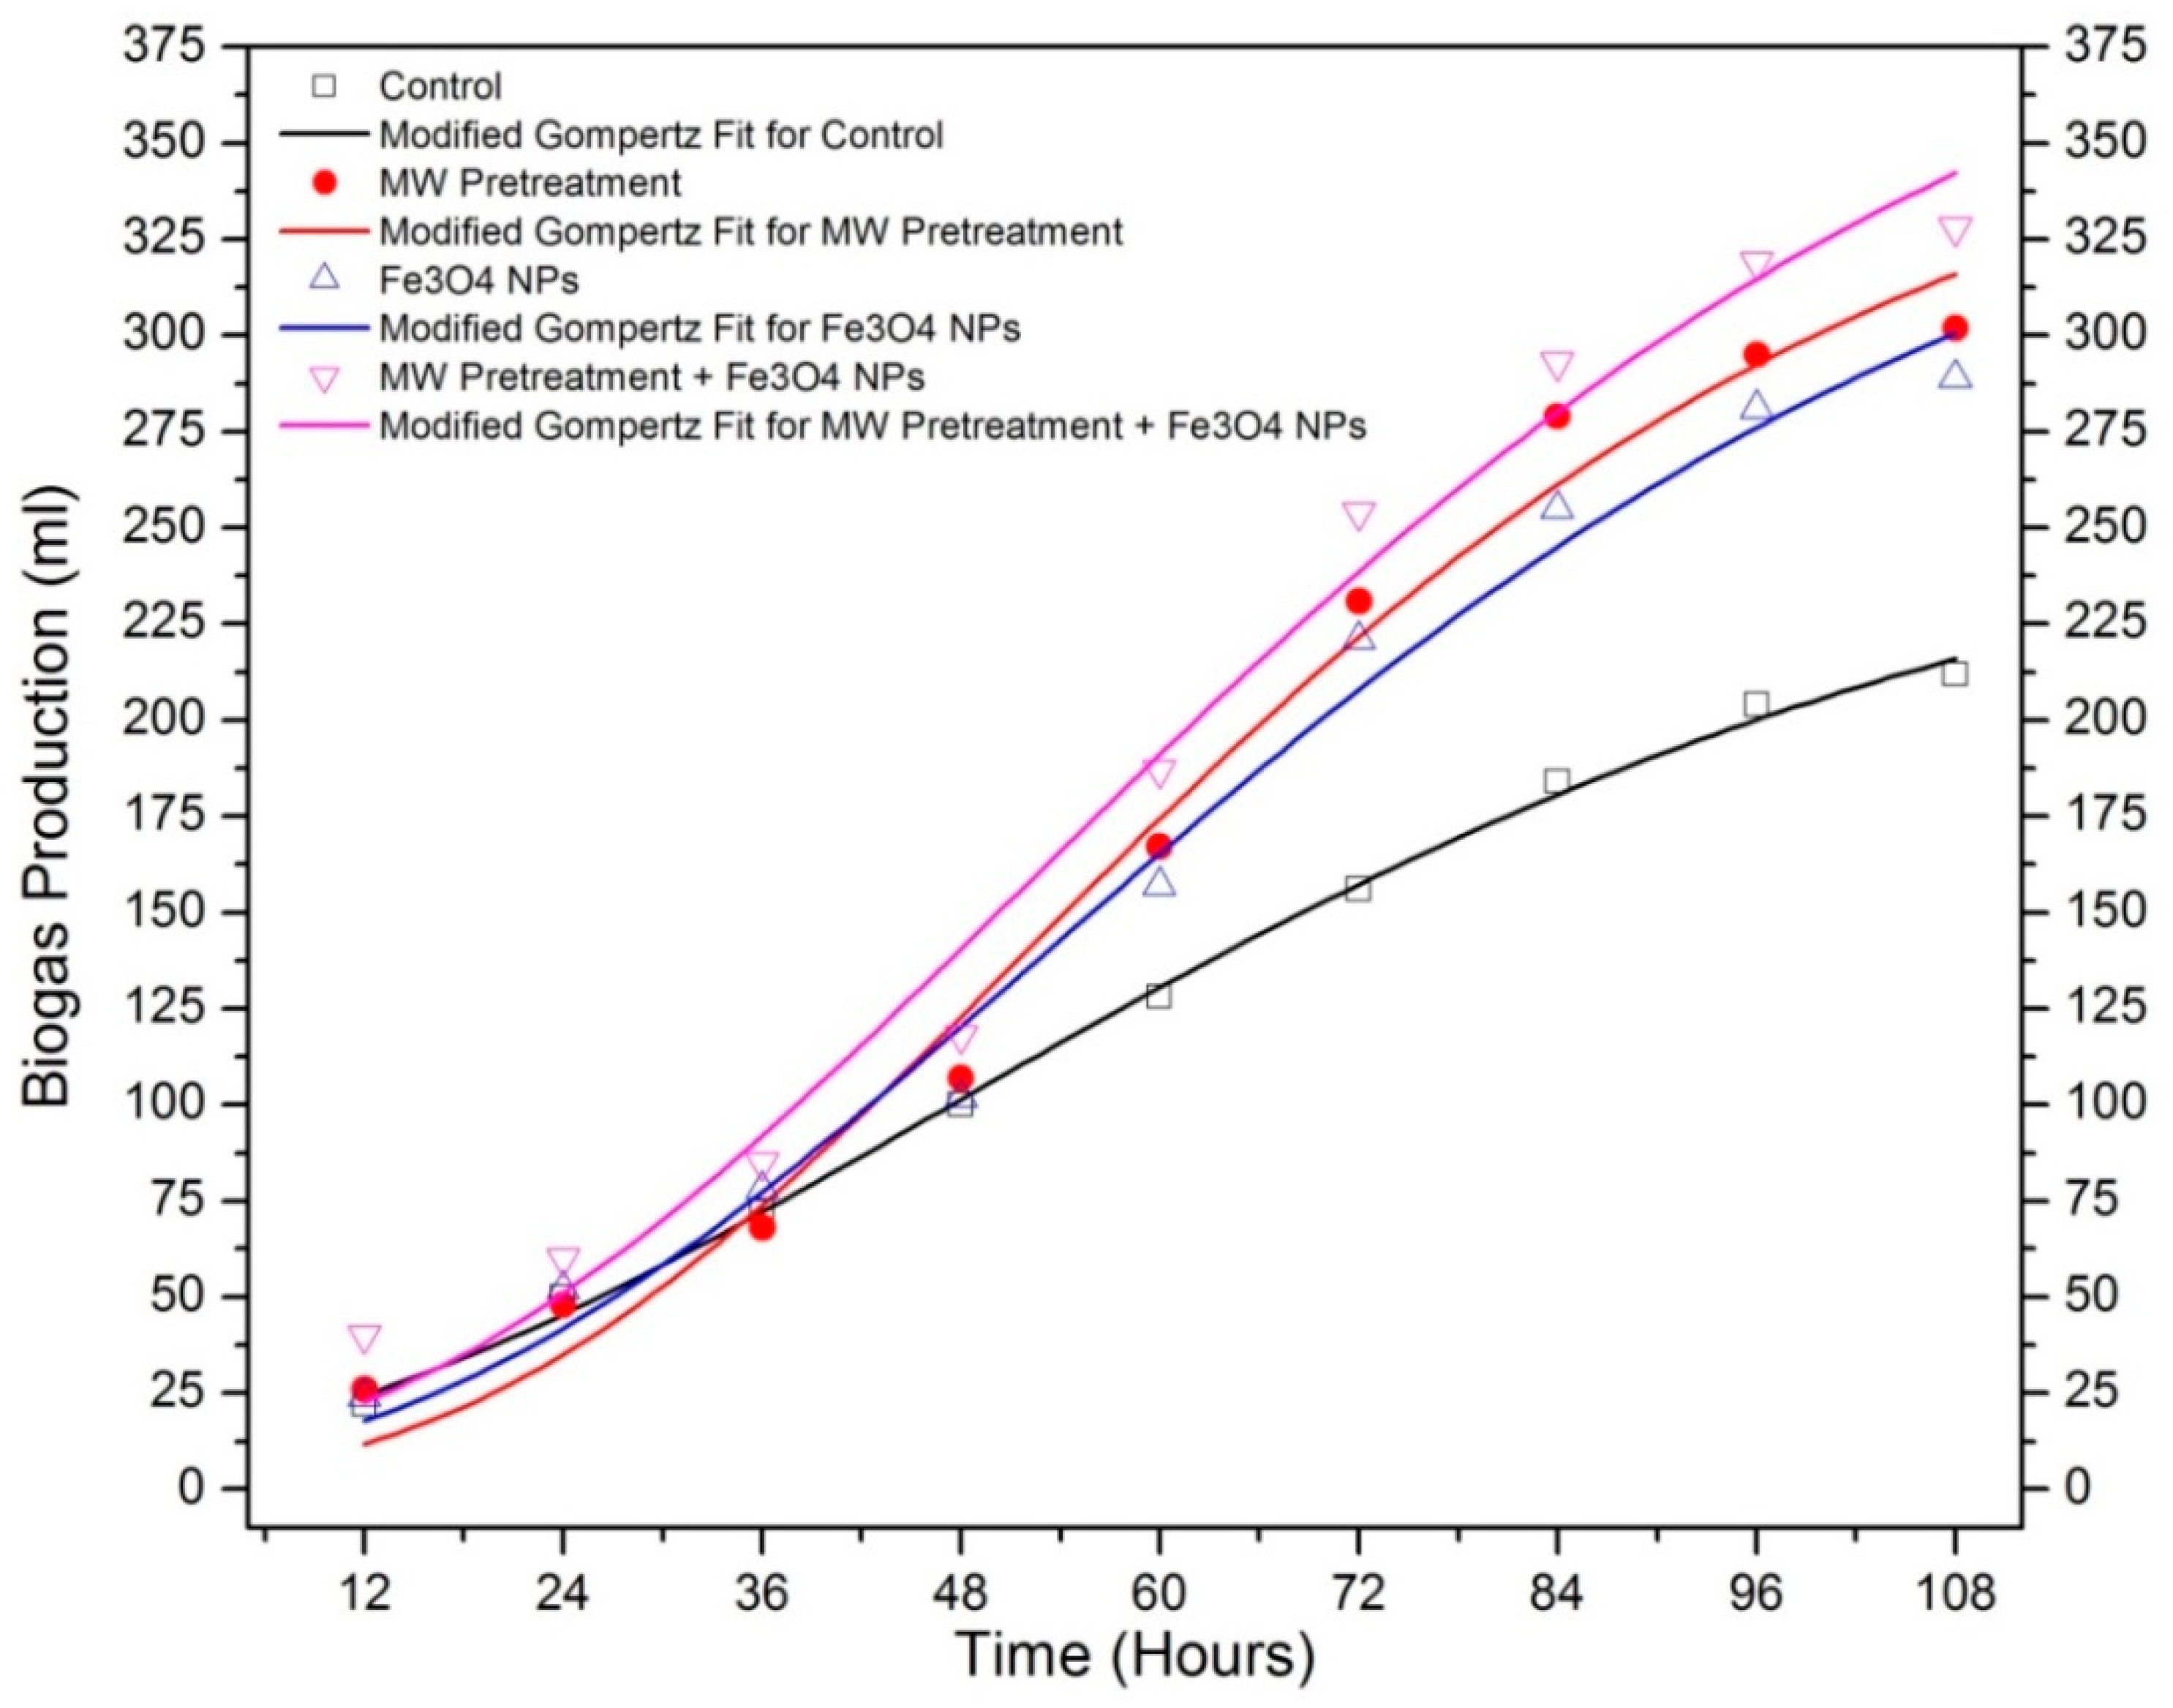
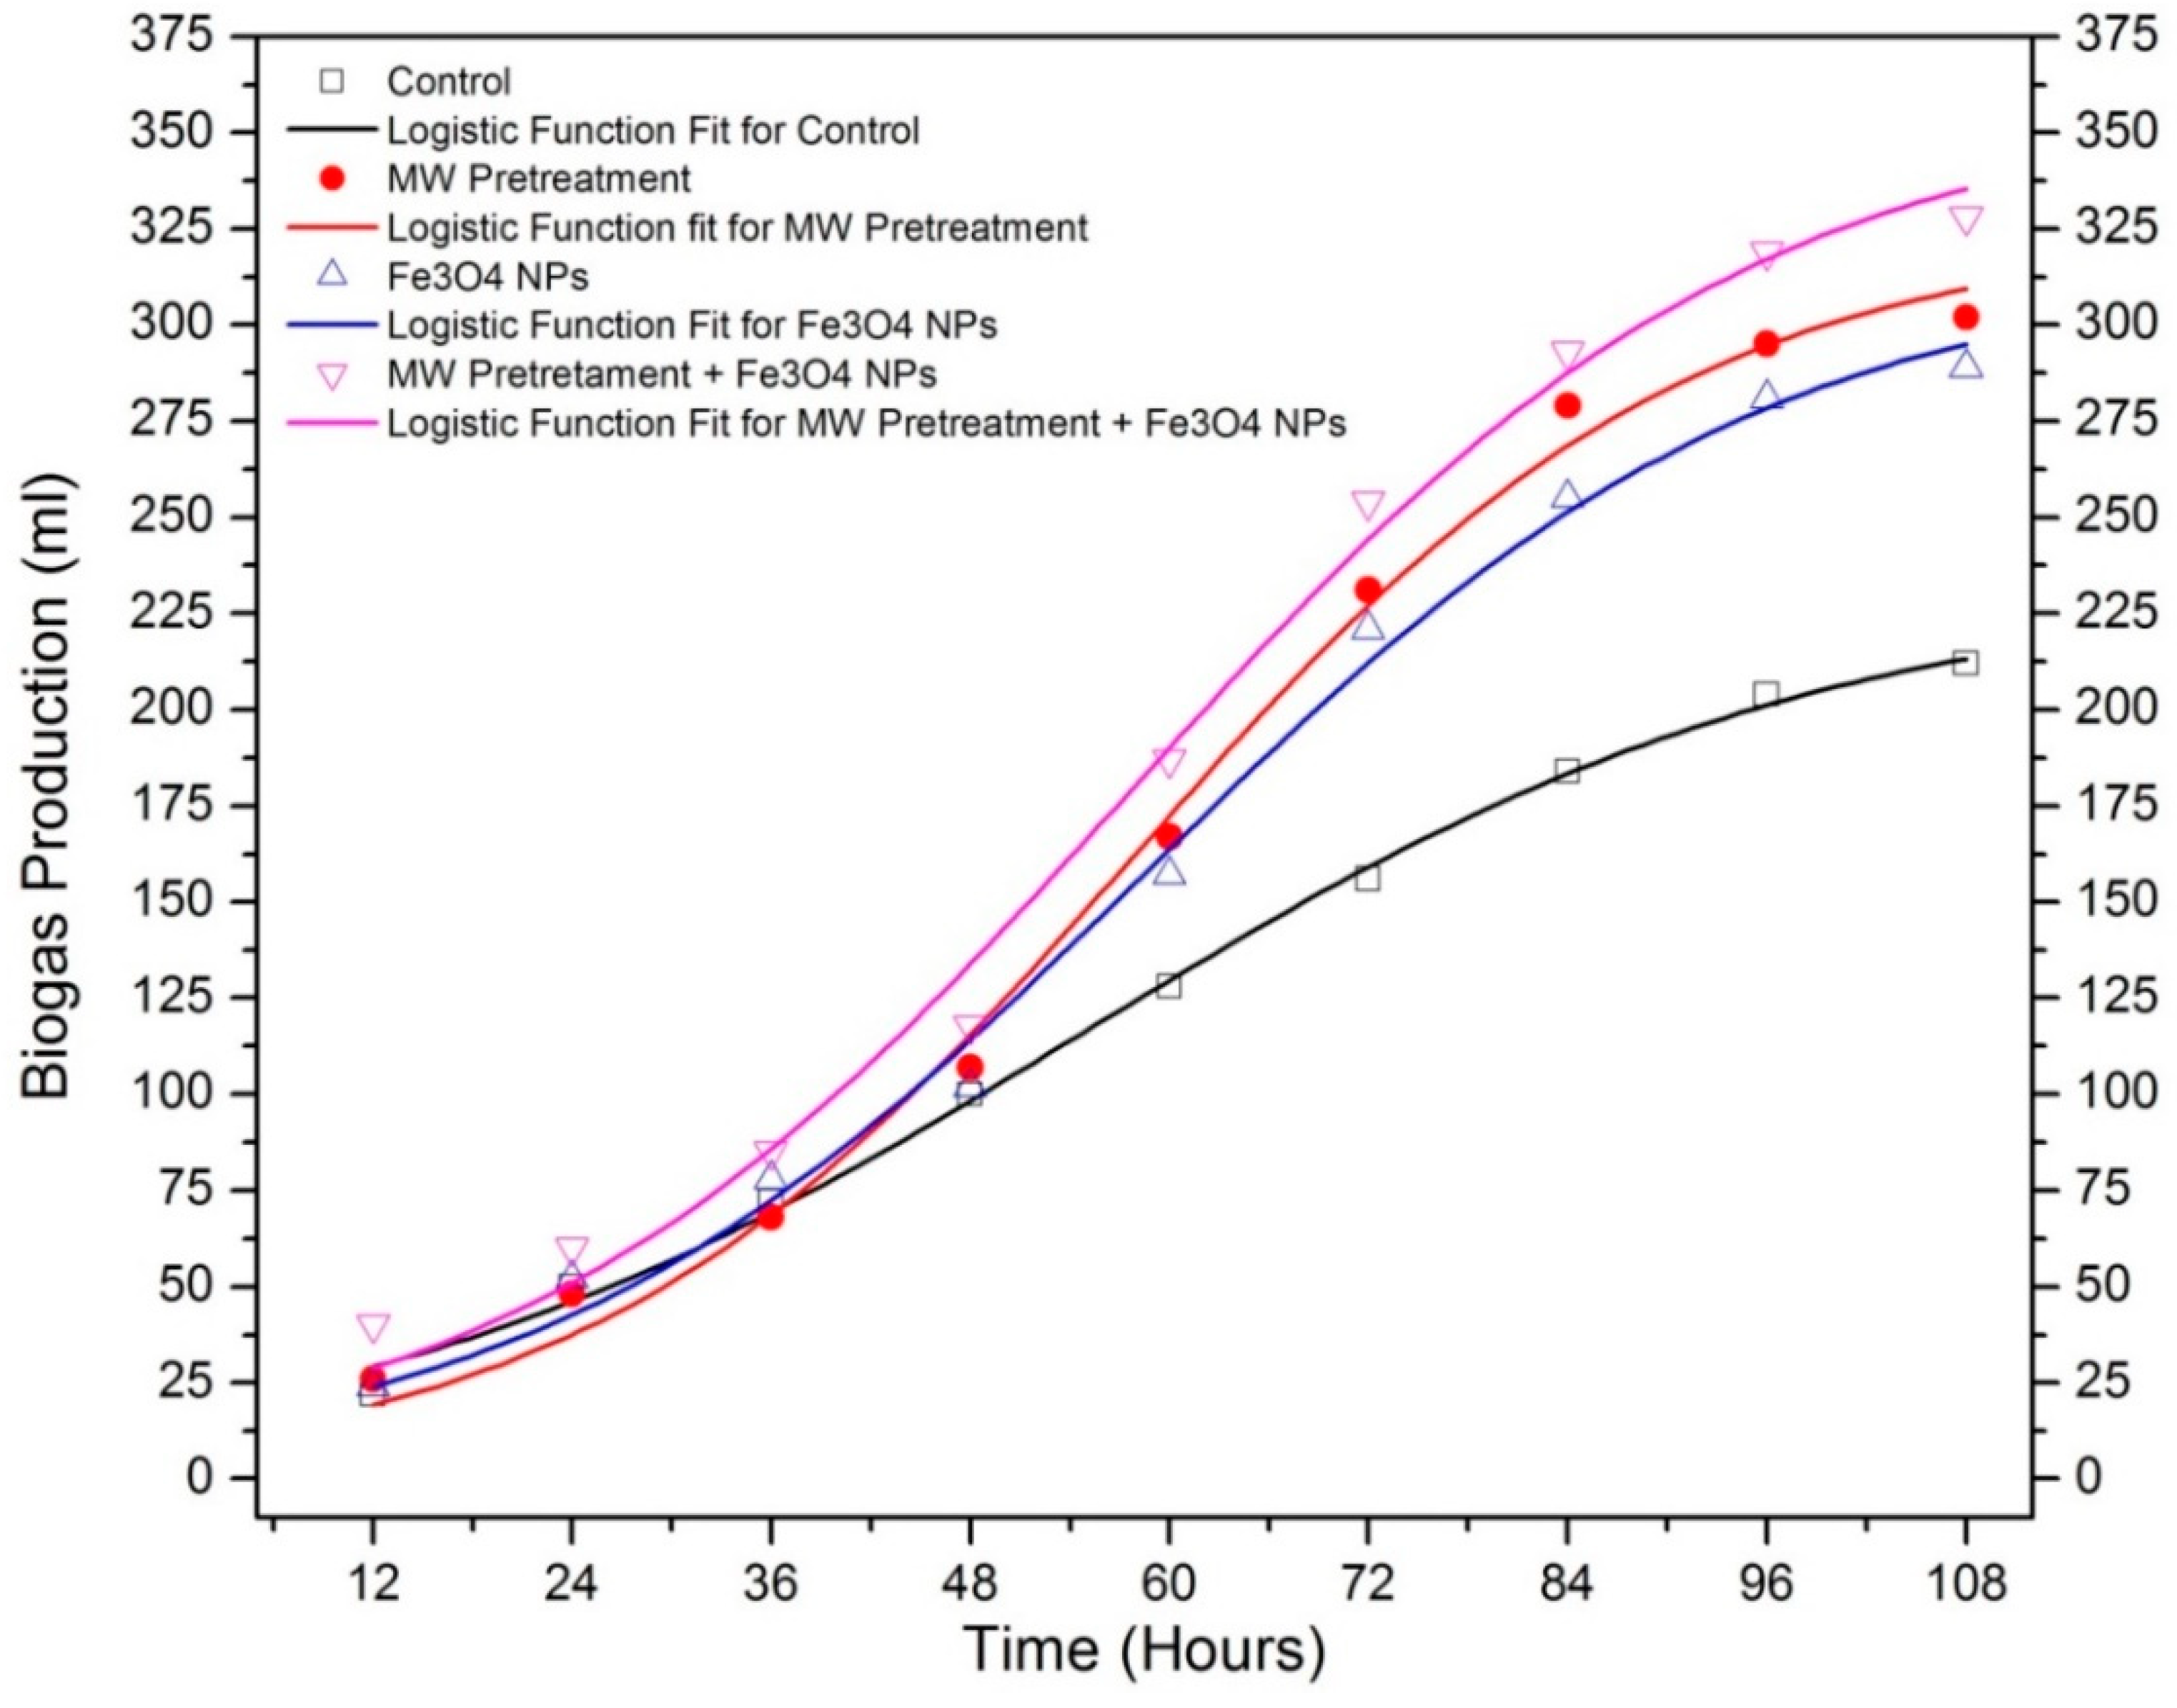
Kinetic parameters for the cumulative biogas produced by Enteromorpha AD were found out using modified Gompertz and Logistic Function models [34,35]. The results obtained from the kinetic study using the modified Gompertz and Logistic model are given in Table 3 and Table 4, respectively. Figure 4 and Figure 5 showed the contrast of predicted and experimental cumulative biogas yield by all groups. When applying the modified Gompertz model, maximum biogas production rate (MBPR) for control was 2.46 mL/h. For MW pretreatment, Fe3O4 NPs and MW pretreatment + Fe3O4 NPs, the MBPR found to be 4.32, 3.77, and 4.23 mL/h, respectively. Correspondingly, for the Logistic model, the maximum biogas production rate (MBPR) for the untreated, MW pretreatment, Fe3O4 NPs, and MW pretreatment + Fe3O4 NPs were 2.62, 4.87, 4.23, and 4.77 mL/h respectively. It is determined by both the kinetic models that combined effect of MW pretreatment and NPs had improved the biogas generation rate and reduced the lag phase time with respect to other groups. The decrease in lag phase was observed due to early hydrolysis of algae cell walls at the first stage of AD by MW pretreatment. This resulted in a faster consumption of sugar by anaerobic bacteria in later stages of AD. The correlation coefficient for the modified Gompertz model and Logistic Function model was above 98.01% and 99.18%, respectively. This suggests that both the models were fitting well with the experimental data. Table 5 shows the obtained results for the Akaike Information Criterion (AIC) test. AIC suggests that the modified Gompertz model has a lower AIC value and hence proved to be a better model to use in this case.

4. Conclusions

The combined effect of MW pretreatment and Fe3O4 NPs showed improvement in biodegradability of green algae. The cumulative enhancement in biogas yield for MW pretreatment, Fe3O4 NPs and Fe3O4 NPs + MW pretreatment was 42.45%, 36.32%, and 54.71%, respectively. The energy assessment showed the high energy ratio of 1.87 is achieved by Fe3O4 NPs + MW pretreatment group. The experimental data of these results are further modeled via modified Gompertz and Logistic function model. Akaike Information Criterion (AIC) test highlighted that the modified Gompertz model is nearly matching with the experimental data. This study suggested that positive energy balance occurs when MW pretreatment is combined with Fe3O4 NPs for an AD of algal biomass. This study is applicable to all lignocellulose and other biomass with resistant cell walls or cellulose structure to improve the hydrolysis stage to produce a high amount of energy. The energy analysis indicates that combining MW pretreatment with small concentrations of Fe3O4 NPs causes added output energy. The results suggest an energy efficient way of producing biohydrogen and can easily be scaled-up for commercial-scale biohydrogen production. This aspect can produce fruit bearing results in the future production of biohydrogen via AD technology. In addition, cost-benefit analysis, optimization of process parameters, bioreactors design and more efficient energy conversion methods for biohydrogen could be the future scope of research for improved commercial and economic feasibility.

Author Contributions

All the authors contributed equally to the work. All authors have read and approved the final manuscript.

Funding

This research was financially supported by the National Key R&D Plan of China (2017YFC1404605), the Natural Science Foundation of China (Grant No. 51579049 and 51509044), the Fundamental Research Funds for the Central Universities (HEUCFG201820), the High Tech Ship Program (17KJ-003) and the Research on 130,000 GT cruise ship development.

Conflicts of Interest

The authors declare no conflict of interest.

Nomenclature

EiEnergy input (kJ/gVS)
PPower required for pretreatment (W)
tMicrowave pretreatment time (s)
VVolume of biomass (L)
TSTotal solid in biomass (g TS/L)
EoEnergy output (kJ/gVS)
ΔPHydrogen yield (mL H2/gVS)
εCalorific value of hydrogen (120,000 kJ/m3)
BCumulative biogas volume at digestion time t (mL)
BPBiogas production potential (mL)
MBPRMaximum biogas production rate (mL/h)
BPDTBiogas production delay time (h)
tTotal digestion time (h)
NNumber of points
RSSResidual sum of square
KNumber of model parameters
ΔAICThe relative difference between the two AIC values
MWMicrowave
ADAnaerobic digestion
CO2Carbon dioxide
H2Hydrogen
H2SHydrogen Sulfide
CH4Methane
VFAsVolatile Fatty Acids
HRAPHigh Rate Algal Ponds
CMCattle Manure
HRTHydraulic Retention Time
NPsNanoparticles
TSSTotal Suspension Solids
VSSVolatile Suspension Solids
SDSSodium Dodecylbenzene Sulfonate
TGAThermogravimetric analysis
(L-M)Levenberg-Marquardt
AICAkaike Information Criterion
SCODSoluble Chemical Oxygen Demand
DTGDifference Thermo Gravimetry

References

  1. Zhang, Q.; Hu, J.; Lee, D.J. Biogas from anaerobic digestion processes: Research updates. Renew. Energy 2016, 98, 108–119. [Google Scholar] [CrossRef]
  2. Panico, A.; Antonio, G.; Esposito, G.; Frunzo, L.; Iodice, P.; Pirozzi, F. The Effect of Substrate-Bulk Interaction on Hydrolysis Modeling in Anaerobic Digestion Process. Sustainability 2014, 6, 8348–8363. [Google Scholar] [CrossRef] [Green Version]
  3. Mao, C.; Feng, Y.; Wang, X.; Ren, G. Review on research achievements of biogas from anaerobic digestion. Renew. Sustain. Energy Rev. 2015, 45, 540–555. [Google Scholar] [CrossRef]
  4. Ganzoury, M.A.; Allam, N.K. Impact of nanotechnology on biogas production: A mini-review. Renew. Sustain. Energy Rev. 2015, 50, 1392–1404. [Google Scholar] [CrossRef]
  5. Solé-Bundó, M.; Salvadó, H.; Passos, F.; Garfí, M.; Ferrer, I. Strategies to Optimize Microalgae Conversion to Biogas: Co-Digestion, Pretreatment and Hydraulic Retention Time. Molecules 2018, 23, 2096. [Google Scholar] [CrossRef] [PubMed]
  6. Bharathiraja, B.; Chakravarthy, M.; Ranjith Kumar, R.; Yogendran, D.; Yuvaraj, D.; Jayamuthunagai, J.; Praveen Kumar, R.; Palani, S. Aquatic biomass (algae) as a future feed stock for bio-refineries: A review on cultivation, processing and products. Renew. Sustain. Energy Rev. 2015, 47, 634–653. [Google Scholar] [CrossRef]
  7. González-Fernández, C.; Sialve, B.; Bernet, N.; Steyer, J.P. Comparison of ultrasound and thermal pretreatment of Scenedesmus biomass on methane production. Bioresour. Technol. 2012, 110, 610–616. [Google Scholar] [CrossRef] [PubMed]
  8. Ghimire, A.; Kumar, G.; Sivagurunathan, P.; Shobana, S.; Saratale, G.D.; Kim, H.W.; Luongo, V.; Esposito, G.; Munoz, R. Bio-hythane production from microalgae biomass: Key challenges and potential opportunities for algal bio-refineries. Bioresour. Technol. 2017, 241, 525–536. [Google Scholar] [CrossRef]
  9. Satyanarayana, K.G.; Mariano, A.B.; Vargas, J.V.C. A review on microalgae, a versatile source for sustainable energy and materials. Int. J. Energy Res. 2011, 35, 291–311. [Google Scholar] [CrossRef]
  10. Córdova, O.; Santis, J.; Ruiz-Fillipi, G.; Zuñiga, M.E.; Fermoso, F.G.; Chamy, R. Microalgae digestive pretreatment for increasing biogas production. Renew. Sustain. Energy Rev. 2018, 82, 2806–2813. [Google Scholar] [CrossRef]
  11. Córdova, O.; Passos, F.; Chamy, R. Physical Pretreatment Methods for Improving Microalgae Anaerobic Biodegradability. Appl. Biochem. Biotechnol. 2018, 185, 114–126. [Google Scholar] [CrossRef]
  12. Appels, L.; Houtmeyers, S.; Degrève, J.; Van Impe, J.; Dewil, R. Influence of microwave pre-treatment on sludge solubilization and pilot scale semi-continuous anaerobic digestion. Bioresour. Technol. 2013, 128, 598–603. [Google Scholar] [CrossRef]
  13. Passos, F.; Solé, M.; García, J.; Ferrer, I. Biogas production from microalgae grown in wastewater: Effect of microwave pretreatment. Appl. Energy 2013, 108, 168–175. [Google Scholar] [CrossRef]
  14. Climent, M.; Ferrer, I.; del Mar Baeza, M.; Artola, A.; Vázquez, F.; Font, X. Effects of thermal and mechanical pretreatments of secondary sludge on biogas production under thermophilic conditions. Chem. Eng. J. 2007, 133, 335–342. [Google Scholar] [CrossRef] [Green Version]
  15. Zheng, J.; Kennedy, K.J.; Eskicioglu, C. Effect of low temperature microwave pretreatment on characteristics and mesophilic digestion of primary sludge. Environ. Technol. 2009, 30, 319–327. [Google Scholar] [CrossRef] [PubMed]
  16. Sólyom, K.; Mato, R.B.; Pérez-Elvira, S.I.; Cocero, M.J. The influence of the energy absorbed from microwave pretreatment on biogas production from secondary wastewater sludge. Bioresour. Technol. 2011, 102, 10849–10854. [Google Scholar] [CrossRef]
  17. Eskicioglu, C.; Kennedy, K.J.; Droste, R.L. Characterization of soluble organic matter of waste activated sludge before and after thermal pretreatment. Water Res. 2006, 40, 3725–3736. [Google Scholar] [CrossRef]
  18. Park, W.-J.; Ahn, J.-H.; Hwang, S.; Lee, C.-K. Effect of output power, target temperature, and solid concentration on the solubilization of waste activated sludge using microwave irradiation. Bioresour. Technol. 2010, 101, S13–S16. [Google Scholar] [CrossRef]
  19. Eskicioglu, C.; Kennedy, K.J.; Droste, R.L. Enhanced disinfection and methane production from sewage sludge by microwave irradiation. Desalination 2009, 248, 279–285. [Google Scholar] [CrossRef]
  20. Feng, R.; Zaidi, A.A.; Zhang, K.; Shi, Y. Optimisation of Microwave Pretreatment for Biogas Enhancement through Anaerobic Digestion of Microalgal Biomass. Period. Polytech. Chem. Eng. 2018, 63, 65–72. [Google Scholar] [CrossRef]
  21. Antonio, F.; Antunes, F.; Gaikwad, S.; Ingle, A.P. Nanotechnology for Bioenergy and Biofuel Production. In Green Chemistry and Sustainable Technology; Springer: Berlin, Germany, 2017; pp. 3–18. ISBN 978-3-319-45458-0. [Google Scholar]
  22. Liu, L.; Zhang, T.; Wan, H.; Chen, Y.; Wang, X.; Yang, G.; Ren, G. Anaerobic co-digestion of animal manure and wheat straw for optimized biogas production by the addition of magnetite and zeolite. Energy Convers. Manag. 2015, 97, 132–139. [Google Scholar] [CrossRef]
  23. Qiang, H.; Niu, Q.; Chi, Y.; Li, Y. Trace metals requirements for continuous thermophilic methane fermentation of high-solid food waste. Chem. Eng. J. 2013, 222, 330–336. [Google Scholar] [CrossRef]
  24. Luna-delRisco, M.; Orupõld, K.; Dubourguier, H.C. Particle-size effect of CuO and ZnO on biogas and methane production during anaerobic digestion. J. Hazard. Mater. 2011, 189, 603–608. [Google Scholar] [CrossRef] [PubMed]
  25. Menon, A.; Wang, J.; Giannis, A. Optimization of micronutrient supplement for enhancing biogas production from food waste in two-phase thermophilic anaerobic digestion. Waste Manag. 2017, 59, 465–475. [Google Scholar] [CrossRef] [PubMed]
  26. Casals, E.; Barrena, R.; Garcia, A.; Gonzalez, E.; Delgado, L.; Busquets-Fite, M.; Font, X.; Arbiol, J.; Glatzel, P.; Kvashnina, K.; et al. Programmed iron oxide nanoparticles disintegration in anaerobic digesters boosts biogas production. Small 2014, 10, 2801–2808. [Google Scholar] [CrossRef]
  27. Suanon, F.; Sun, Q.; Mama, D.; Li, J.; Dimon, B.; Yu, C.P. Effect of nanoscale zero-valent iron and magnetite (Fe3O4) on the fate of metals during anaerobic digestion of sludge. Water Res. 2016, 88, 897–903. [Google Scholar] [CrossRef]
  28. Abdelsalam, E.; Samer, M.; Attia, Y.A.; Abdel-Hadi, M.A.; Hassan, H.E.; Badr, Y. Influence of zero valent iron nanoparticles and magnetic iron oxide nanoparticles on biogas and methane production from anaerobic digestion of manure. Energy 2017, 120, 842–853. [Google Scholar] [CrossRef]
  29. Zaidi, A.A.; RuiZhe, F.; Shi, Y.; Khan, S.Z.; Mushtaq, K. Nanoparticles augmentation on biogas yield from microalgal biomass anaerobic digestion. Int. J. Hydrogen Energy 2018, 43, 14202–14213. [Google Scholar] [CrossRef]
  30. Abdelsalam, E.; Samer, M.; Attia, Y.A.; Abdel-Hadi, M.A.; Hassan, H.E.; Badr, Y. Effects of Co and Ni nanoparticles on biogas and methane production from anaerobic digestion of slurry. Energy Convers. Manag. 2017, 141, 108–119. [Google Scholar] [CrossRef]
  31. Abdelsalam, E.; Samer, M.; Attia, Y.A.; Abdel-hadi, M.A.; Hassan, H.E.; Badr, Y. Comparison of nanoparticles effects on biogas and methane production from anaerobic digestion of cattle dung slurry. Renew. Energy 2016, 87, 592–598. [Google Scholar] [CrossRef]
  32. Khan, S.Z.; Yuan, Y.; Abdolvand, A.; Schmidt, M.; Crouse, P.; Li, L.; Liu, Z.; Sharp, M.; Watkins, K.G. Generation and characterization of NiO nanoparticles by continuous wave fiber laser ablation in liquid. J. Nanopart. Res. 2009, 11, 1421–1427. [Google Scholar] [CrossRef]
  33. Xia, A.; Jacob, A.; Tabassum, M.R.; Herrmann, C.; Murphy, J.D. Production of hydrogen, ethanol and volatile fatty acids through co-fermentation of macro- and micro-algae. Bioresour. Technol. 2016, 205, 118–125. [Google Scholar] [CrossRef] [PubMed]
  34. Syaichurrozi, I.; Budiyono; Sumardiono, S. Predicting kinetic model of biogas production and biodegradability organic materials: Biogas production from vinasse at variation of COD/N ratio. Bioresour. Technol. 2013, 149, 390–397. [Google Scholar] [CrossRef] [PubMed]
  35. Deepanraj, B.; Sivasubramanian, V.; Jayaraj, S. Effect of substrate pretreatment on biogas production through anaerobic digestion of food waste. Int. J. Hydrogen Energy 2017, 42, 26522–26528. [Google Scholar] [CrossRef]
  36. Rawlings, J.O.; Pantula, S.G.; Dickey, D.A. Applied Regression Analysis: A Research Tool, 2nd ed.; Springer: New York, NY, USA, 1998. [Google Scholar]
  37. Wong, C.S.; Li, W.K. A note on the corrected Akaike information criterion for threshold autoregressive models. J. Time Ser. Anal. 1998, 19, 113–124. [Google Scholar] [CrossRef]
  38. Demuez, M.; Mahdy, A.; Tomás-Pejó, E.; González-Fernández, C.; Ballesteros, M. Enzymatic cell disruption of microalgae biomass in biorefinery processes. Biotechnol. Bioeng. 2015, 112, 1955–1966. [Google Scholar] [CrossRef] [PubMed]
  39. Mahdy, A.; Mendez, L.; Ballesteros, M.; González-Fernández, C. Enhanced methane production of Chlorella vulgaris and Chlamydomonas reinhardtii by hydrolytic enzymes addition. Energy Convers. Manag. 2014, 85, 551–557. [Google Scholar] [CrossRef]
  40. Kavitha, S.; Yukesh Kannah, R.; Yeom, I.T.; Do, K.-U.; Banu, J.R. Combined thermo-chemo-sonic disintegration of waste activated sludge for biogas production. Bioresour. Technol. 2015, 197, 383–392. [Google Scholar] [CrossRef]
  41. Shah, A.H.; Li, X.; Xu, X.D.; Wang, S.; Bai, J.W.; Wang, J.; Liu, W.B.; Sciences, M. Effect of alkali treated walnut shell (Juglansregia) on high performance thermosets, study of curing behavior, thermal and thermomechanical properties. Dig. J. Nanomater. Biostruct. 2018, 13, 857–873. [Google Scholar]
  42. Ehimen, E.A.; Holm-Nielsen, J.-B.; Poulsen, M.; Boelsmand, J.E. Influence of different pre-treatment routes on the anaerobic digestion of a filamentous algae. Renew. Energy 2013, 50, 476–480. [Google Scholar] [CrossRef]
  43. Suanon, F.; Sun, Q.; Li, M.; Cai, X.; Zhang, Y.; Yan, Y.; Yu, C.P. Application of nanoscale zero valent iron and iron powder during sludge anaerobic digestion: Impact on methane yield and pharmaceutical and personal care products degradation. J. Hazard. Mater. 2017, 321, 47–53. [Google Scholar] [CrossRef]
  44. Zhang, J.; Lu, Y. Conductive Fe3O4 nanoparticles accelerate syntrophic methane production from butyrate oxidation in two different lake sediments. Front. Microbiol. 2016, 7, 1316. [Google Scholar] [CrossRef]
Figure 1. Biogas production influenced by microwave (MW) pretreatment and its combination with Fe3O4 nanoparticles (NPs).
Processes 07 00024 g001
Figure 2. Thermogravimetric analysis (TGA) (a) and Difference Thermo Gravimetry (DTG) (b) of algae before and after MW pretreatment.
Processes 07 00024 g002
Figure 3. Cumulative biogas production (a) and hydrogen % v/v by different treatment conditions.
Processes 07 00024 g003
Figure 4. Modified Gompertz model fitting for experimental data.
Processes 07 00024 g004
Figure 5. Logistic Function model fitting for experimental data.
Processes 07 00024 g005
Table 1. Thermogravimetric Analysis (TGA) and Difference Thermo Gravimetry (DTG) results of Enteromorpha before and after microwave (MW) pretreatment.
SampleT5% (°C)T10% (°C)Yc (%) at 600 °CCellulose DTG Peak (°C)Hemicellulose DTG Peak (°C)
Control9418342341251
MW Pretreated8819649336297
Table 2. Results for Energy Analysis.
Ein (kJ/gVS)Eout (kJ/gVS)Energy Ratio
Control-3.93-
MW Pretreatment10.8016.151.49
Fe3O4 NPs-14.45-
MW Pretreatment + Fe3O4 NPs10.8020.281.87
Table 3. Kinetic Parameters from the Modified Gompertz Model.
ParameterTreatments
ControlMW PretreatmentFe3O4 NPsMW Pretreatment + Fe3O4 NPs
Bp (mL)268.11374.09374.528426.354
MBPR (mL/h)2.4684.3263.7734.236
BPDT (h)0.2870.8160.6720.618
R20.997280.982270.984570.98017
Predicted Biogas Yield (mL)215.891315.977300.682342.302
Measured Biogas Yield (mL)212302289328
Difference between measured and predicted biogas yield (%)1.834.624.044.36
Remarks: BP, Biogas production potential; MBPR, Maximum biogas production rate; BPDT, Biogas production delay time; R2, Correlation Coefficient.
Table 4. Kinetic parameters from the Logistic Function Model.
ParameterTreatments
ControlMW PretreatmentFe3O4 NPsMW Pretreatment + Fe3O4 NPs
Bp (mL)232.56324.72316.10358.53
MBPR (mL/h)2.6284.8704.2304.771
BPDT (h)0.4431.0230.8870.839
R20.996510.994140.992980.99184
Predicted Biogas Yield (mL)213.244309.394295.084335.453
Measured Biogas Yield (mL)212302289328
Difference between measured and predicted biogas yield (%)0.582.442.102.27
Remarks: BP, Biogas production potential; MBPR, Maximum biogas production rate; BPDT, Biogas production delay time; R2, Correlation Coefficient.
Table 5. Akaike’s information criterion (AIC) test results.
ModelRSSNAICAkaike Weight
Modified Gompertz Model77.44757937.371390.75284
Logistic Function Model99.19747939.598990.24716
Remarks: RSS, the Residual sum of the square; N, Number of Points; AIC, Akaike’s Information Criterion.