1. Introduction
The coupling of concentrated solar thermal power to industrial processes (hybridization) is a technology under development with a very high potential to reduce greenhouse gas emissions [
1], but concentrated solar power can also be used for the production of fuels. The different technologies involving high temperature concentrated solar power aimed at the conversion of solar energy to chemical fuels are currently being thoroughly investigated. The main activities and efforts are focused on the endothermic reactions and processes, and on identifying and developing improved receivers and reactors for carrying out such thermochemical processes [
2]. Solar reactors represent a promising technology for a future sustainable energy system. As an example, energy carriers such as hydrogen can be produced in solar reactors and stored, for its later use during the period when solar energy is not available. Also the production of liquid fuels (after a Fischer-Tropsch stage) is being investigated. Different solar reactors have been demonstrated for several chemical processes and scales.
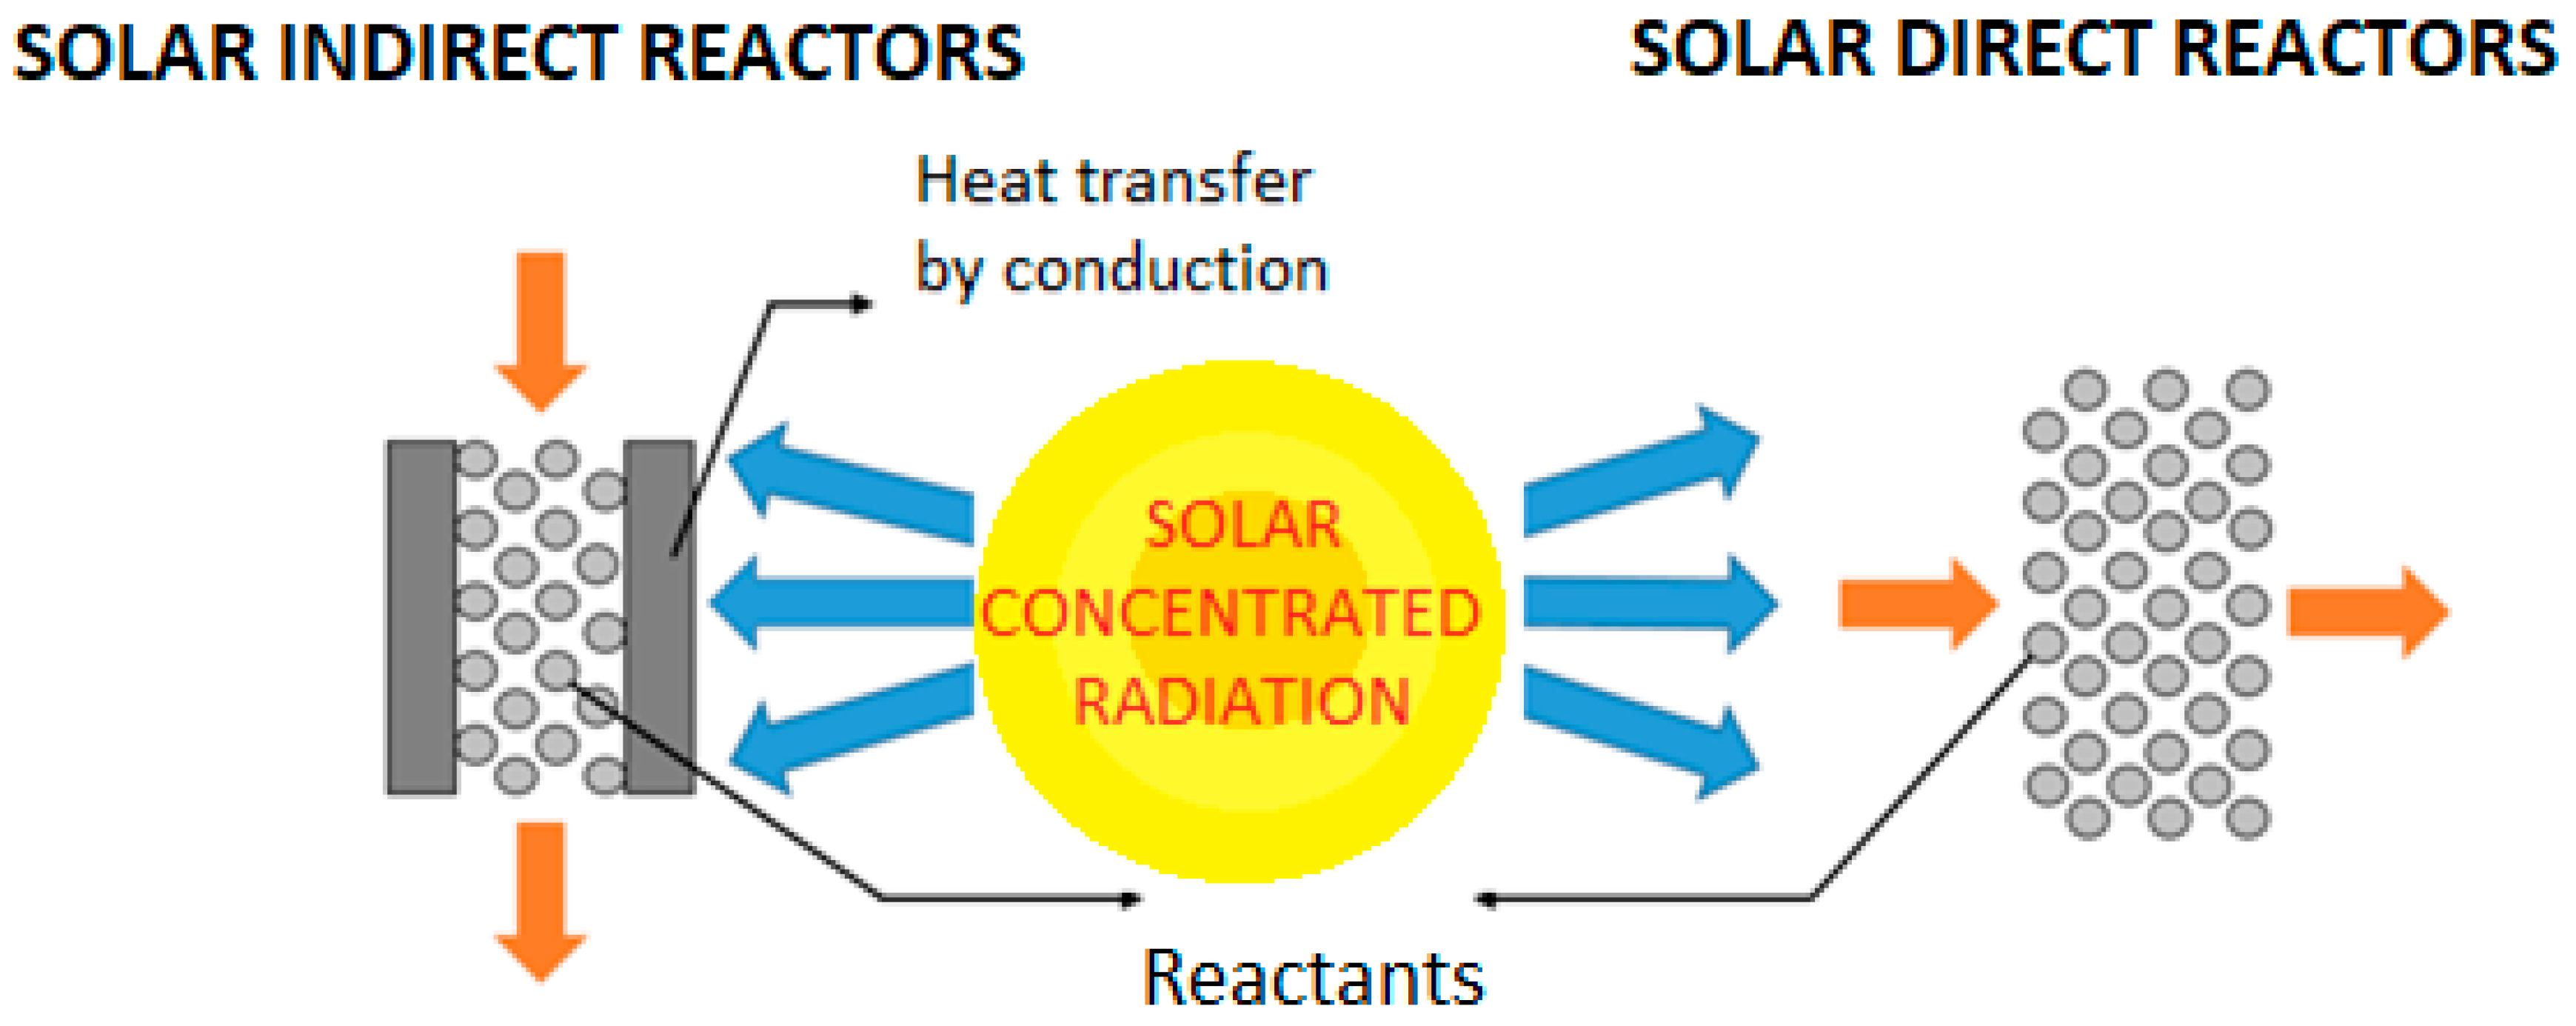
The solar reactor is the component where solar concentrated energy is received and transformed into thermal energy. As such process is involving high radiation fluxes and high temperatures, an appropriate design of the receiver requires to reduce radiation, convection and conduction losses, as well as electrical consumption. The design must also promote the heat transfer towards the absorbent media where the active zone of the reactor is located, usually meant to host an endothermic chemical reaction. A smooth temperature profile is also desired in order to reduce thermal stresses and enhance the mechanical durability of the reactor components. Depending on the heat integration typology solar reactors are classified into indirectly or directly irradiated (
Figure 1).
There have been several research and demonstration activities of solar reactors, covering different chemical processes and different scales. However, most processes and reactors identified in the literature are focused on methane reforming, at a laboratory scale (<1 kW) [
3], pilot scale (1–100 kW) [
3,
4] and also commercial scale (>100 kW) [
5,
6]. There are other possible chemical processes such as gasification [
7,
8,
9,
10] and water splitting by means of thermochemical cycles, also at a laboratory scale [
11,
12,
13], pilot scale [
14,
15] or commercial scale [
16].
Given the significant importance of the coupling between radiation, heat transfer, fluid mechanics and chemical reactions in solar reactors, Computational Fluid Dynamics (CFD) tools are increasingly being used for the thermal design and optimization of the operating conditions. Since the early work by Meier [
17] in 1996 (focused on hydrogen production with ferrites thermochemical cycles), the number of studies based on CFD simulations have significantly increased over the last years. CFD can be used to guide the design process by predicting results of temperature fields, heat flux distributions, and other variables of interest, and can be used for the main reactor types such as particle reactors, volumetric reactors and tubular reactors [
18,
19,
20].
One of the most demanding issues in terms of computational times is radiation modelling. A set of different radiation models can be found in the literature for solar reactor modeling, being one of the most considered the Discrete Ordinate model (DO) [
21,
22,
23,
24,
25]. In such studies, the boundary condition for the radiation flux is typically defined as a uniform or Gaussian distribution with a unidirectional vector [
17,
21,
22,
23,
26,
27,
28]. However, if the radiation flux must consider the different directions of rays (which is the real case when the radiation flux is coming from a parabolic dish or a heliostat field), it is more advisable to use the Monte Carlo model (MC), as it is a more practical approach for implementing the ray directions [
27,
28,
29,
30,
31,
32]. When the volumetric absorption of thermal radiation can be neglected the surface-to-surface (S2S) radiation model is also used [
33,
34].
For the design of tubular reactors, some studies with CFD tools can be also found in the literature. In such reactor models the air movement in the cavity volume is typically considered as a laminar flow, in particular for the studies using a quartz window at the aperture. The modelling results of the studies are generally validated with experimental data, where in general a good agreement is reported (with a maximum error in temperature lower than 10%). Therefore, CFD techniques can be considered as a useful and accurate tool to be considered for solar reactor design and for the optimization of the operating conditions.
In this work, a 100 kW
th multi-tubular cavity reactor for hydrogen production integrated in a solar tower was designed, built and tested in the framework of the SolH2 project (Hydrogen production from high temperature thermal solar energy, referenced in acknowledgements section), with the main goal to demonstrate the technological feasibility of solar thermochemical water splitting cycles as one of the most promising carbon-free options to produce hydrogen from renewable sources. This paper is an extended version of the conference paper published in SolarPACES 2016 International Conference [
35].
The design of the reactor was developed to fulfill the hydrogen requirements, the temperature levels required for the process, and the corresponding inlet and outlet gas temperatures and efficiency. A CFD model and simulation analysis of the solar reactor was carried out as part of the design process in order to assess and optimize the temperature distribution and the absorbed radiation flux among the reactor tubes, as it is explained in the next sections. The experimental testing carried out at the Plataforma Solar de Almería (PSA) in Spain is also presented. The experimental measurements for the 100 kWth multi-tubular reactor have been used to validate the CFD model.
2. Materials and Methods
The reactor was built and installed in the SSPS-CRS (Small Solar Power Systems-Central Receiver Solar power plant) facility of the Plataforma Solar de Almería, located in Tabernas desert, Spain. The Plataforma Solar de Almeria is the largest European experimental facility on concentrating solar energy. The SSPS-CRS plant consists of an autonomous heliostats field and a 43 m height tower. The facility collects direct solar radiation by means of a field consisting of 91 heliostats, each of them with a surface of 39.3 m2. The heliostats are distributed in 16 rows in a 150 × 70 m field. The tower is 43 m high and has two metallic testing platforms, at heights of 26 and 32 m respectively. The maximum thermal power delivered by the field onto the receiver aperture is 2.0 MW. This plant has been used in the past to perform testing of a wide variety of solar receivers and applications, in the range of 200–350 kW thermal power. The test facility has been transformed into a suitable test rig to host research initiatives in solar hydrogen production, such as HYDROSOL–Plant (Solar Hydrogen via Water Splitting in Advanced Monolithic Reactors for Future Solar Power plants), SYNPET (Solar gasification of petcoke), among others.
The use of a cavity geometry for the solar reactor intends to approach a blackbody absorber in order to capture solar energy and reduce thermal emission losses (convective and radiative losses). The basic sketch of the reactor and plant is depicted in
Figure 2.
Solar radiation is concentrated from the heliostat field into the receiver aperture. It spreads inside the cavity and is absorbed by the alumina tubes and also by the internal walls, where heat is also transferred to the tubes by conduction. A carrier gas enters the reactor by the upper part manifold, flowing downwards along the tubes which are filled up with ferrite pellets. The outlet gas circulates towards a heat exchanger used to preheat inlet gases, and is then cooled down in a second heat exchanger in order to precondition the gas temperature for the chromatography system. The outlet gases are not stored, and a small sample is directed to the chromatograph to analyze the composition.
2.1. Solar Reactor
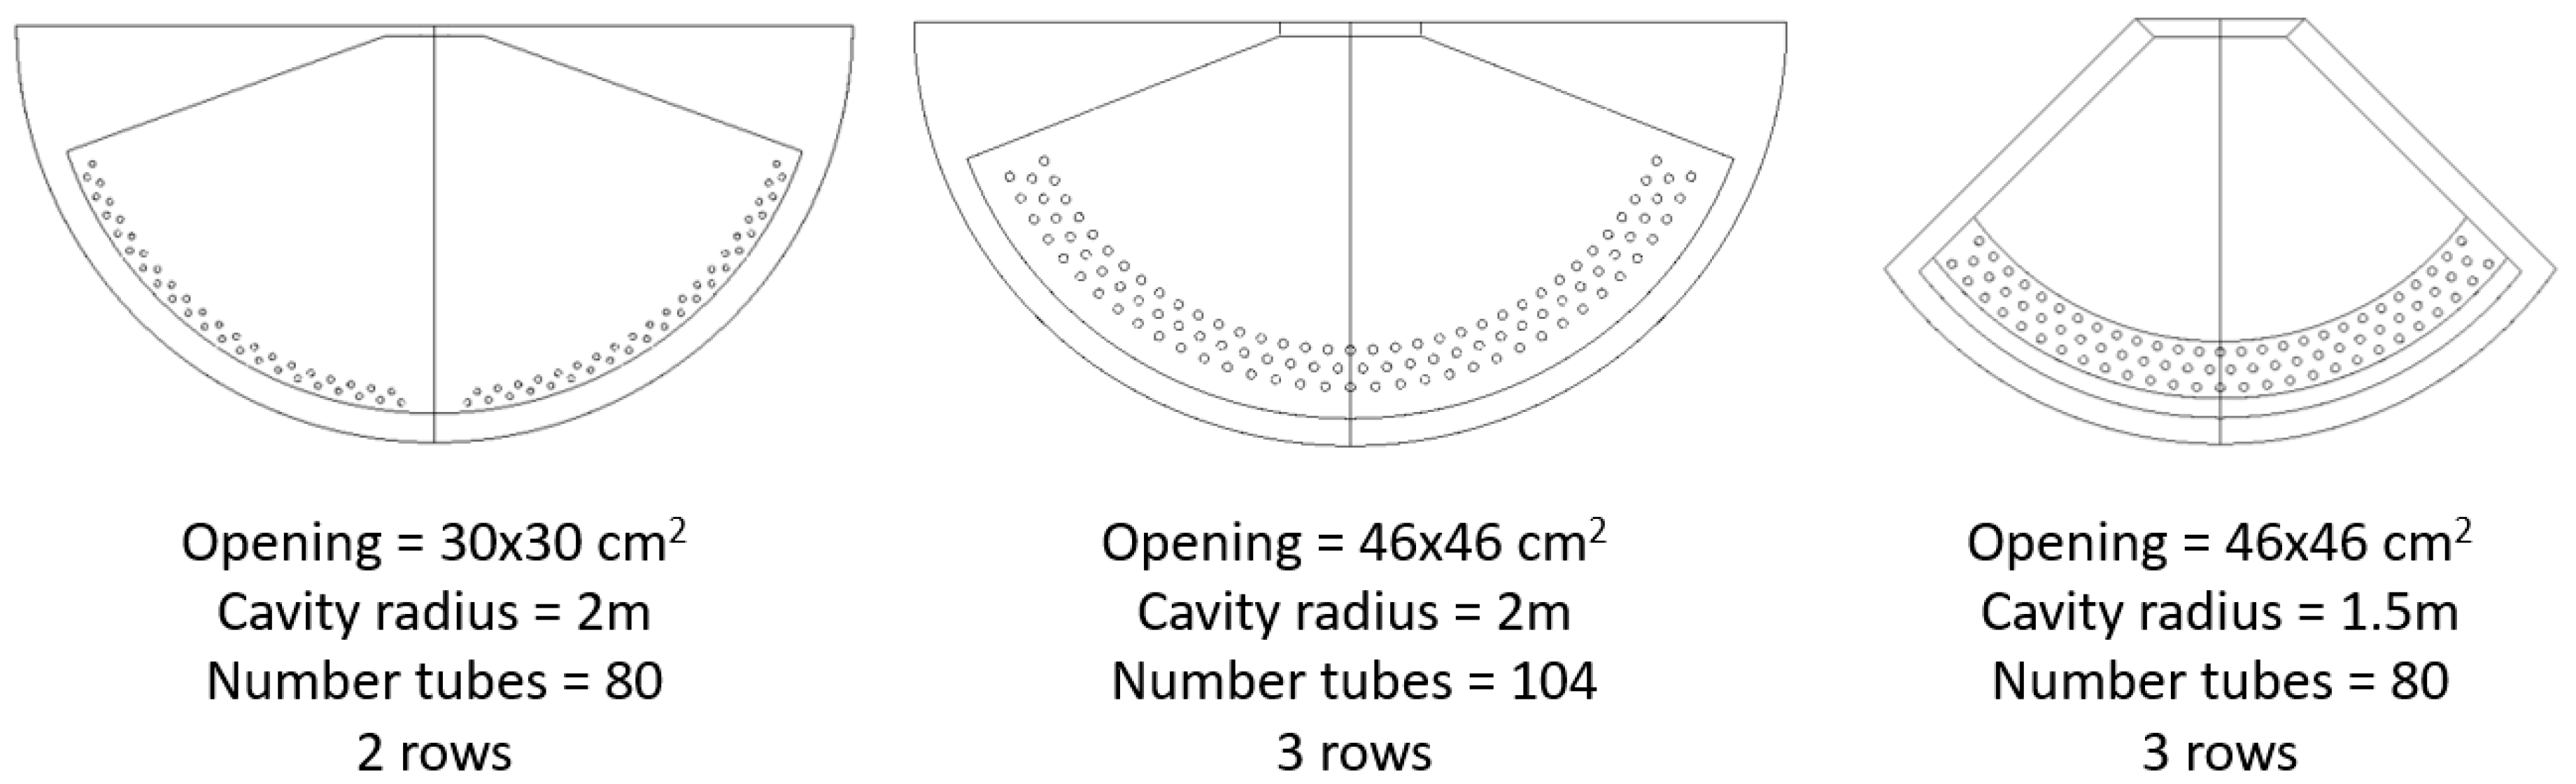
According to the hydrogen production specifications and the initial geometry conditions, a first design for the solar reactor was proposed. The initial design consisted of a 2 m radius semi-cylindrical cavity with a square opening of 30 × 30 cm
2. Inside the cavity there were 80 tubes positioned in a staggered arrangement in 2 rows (
Figure 3, left). That design was finally dismissed due to the following reasons: first, the empty space in the middle of the rows in front of the opening, and secondly the too small aperture for the incident radiation delivered by the heliostat field, which resulted in an increase of the temperature difference within tubes and the spillage at the aperture.
The next reactor version was designed in order to avoid the issues found in the original design. The dimensions of the opening were increased up to 46 × 46 cm
2 and the tubes distribution was modified. Tubes were placed in 3 rows in a staggered arrangement, increasing the number of tubes up to 104. The tubes located at both extremes, receiving less direct radiation, were intended to be used as a preheating heat exchanger (
Figure 3, middle). Despite the improvements, this design was also dismissed, as the larger cavity radius involved a significantly slower transient thermal heating, and the efficiency of the preheating exchangers at both extremes was low.
The final design consists of a semi-cylindrical shape, with a 1.5 m internal cavity radius and 80 tubes positioned in three rows in staggered arrangement. The design included tubes in front of the opening (
Figure 3, right).
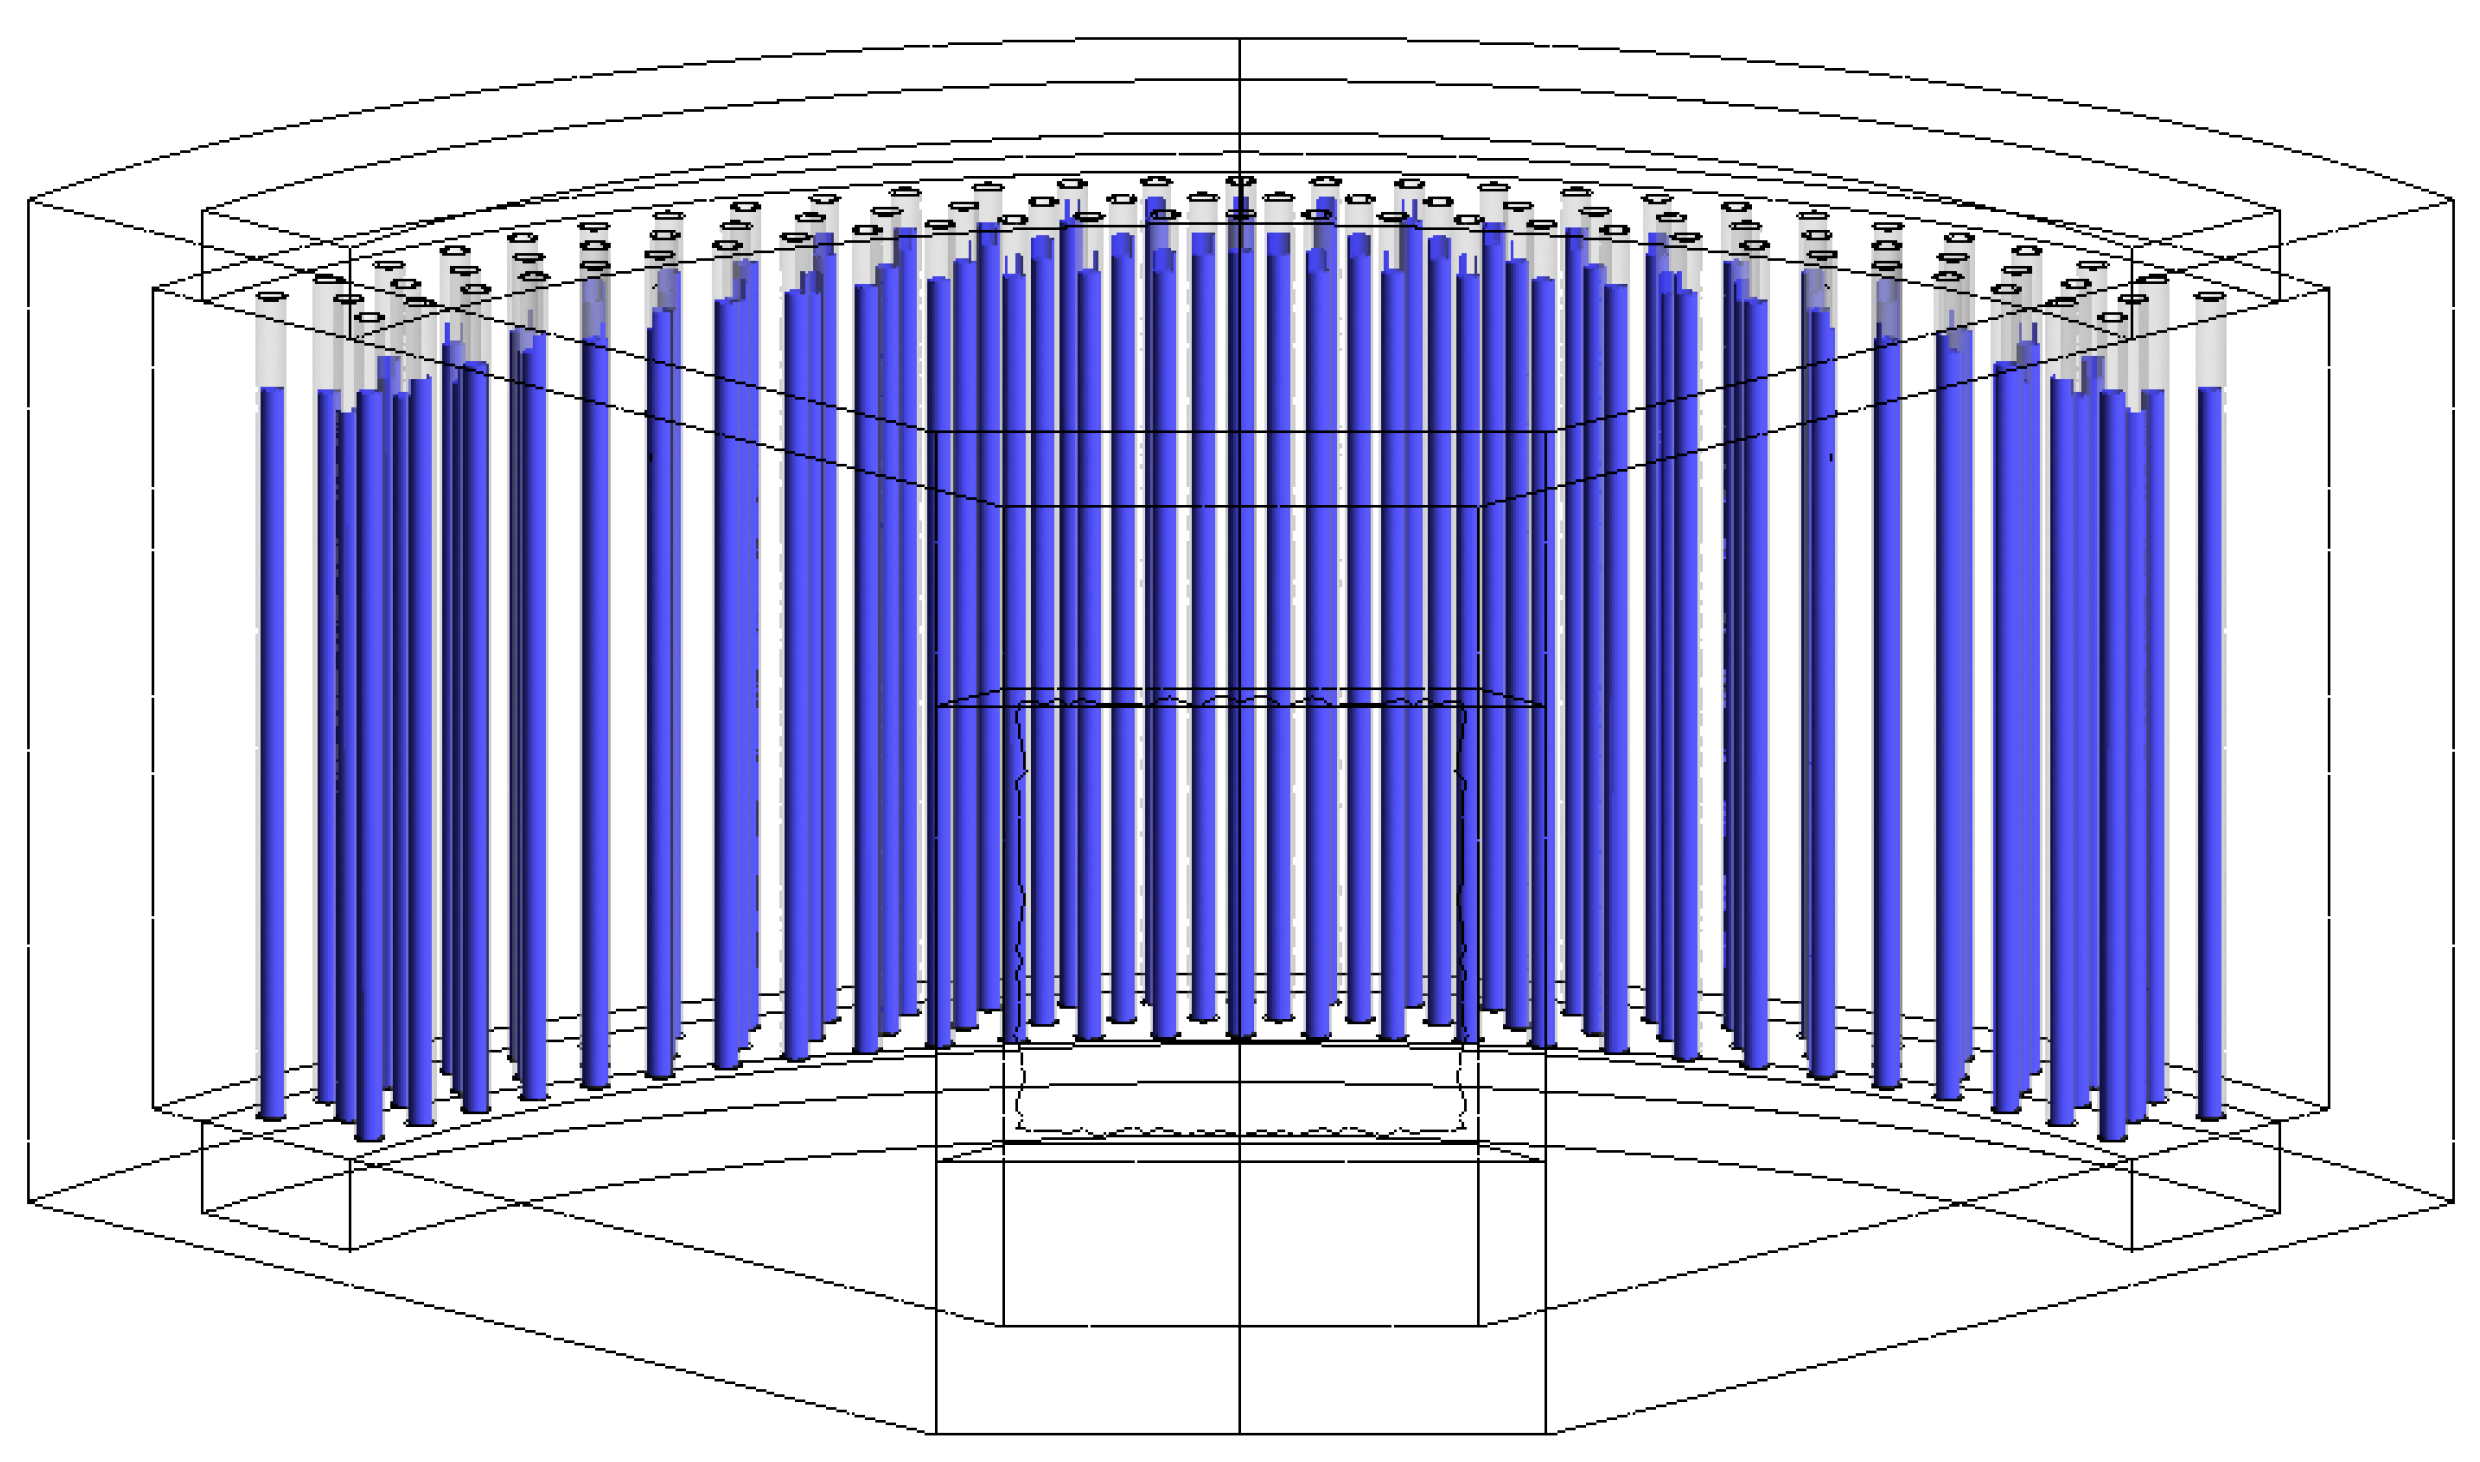
All design steps were modelled and simulated with CFD tools (ANSYS-CFX software, Version 14.0, ANSYS Inc., Canonsburg, PA, USA) using a Monte Carlo surface-to-surface radiation model, in order to analyze the incident radiation flux on the walls and on the tubes, and the resulting temperature distributions and heat transfer to the process side of the reactor (the interior of the tubes). The final design was built as result of the SolH2 project (see
Figure 4) and a thermal characterization of the reactor was carried out. The tubes have a length of 1.2 m and a total volume of 566 cm
3. Tubes are filled with small pellets of mixed ferrites, cylindrically shaped in order to increase the reaction surface and enhance the gas flow through them.
2.2. Flux Measurement System
The radiation flux measuring system is used to characterize the power arriving to the aperture of the cavity. It is based on capturing the irradiance distribution on a moving Lambertian target with a high resolution CCD (couple-charged device) camera [
36]. The bar intercepts the concentrated beam in the measuring plane, which is located as close to the receiver as possible. The distribution of relative intensity is recorded as gray-scale map, and represents the shape of the flux distribution at the receiver´s aperture. A radiometer is used to calibrate the system, where the gray-scale values of the pixels of the image are correlated with the corresponding irradiance value measured by the radiometer.
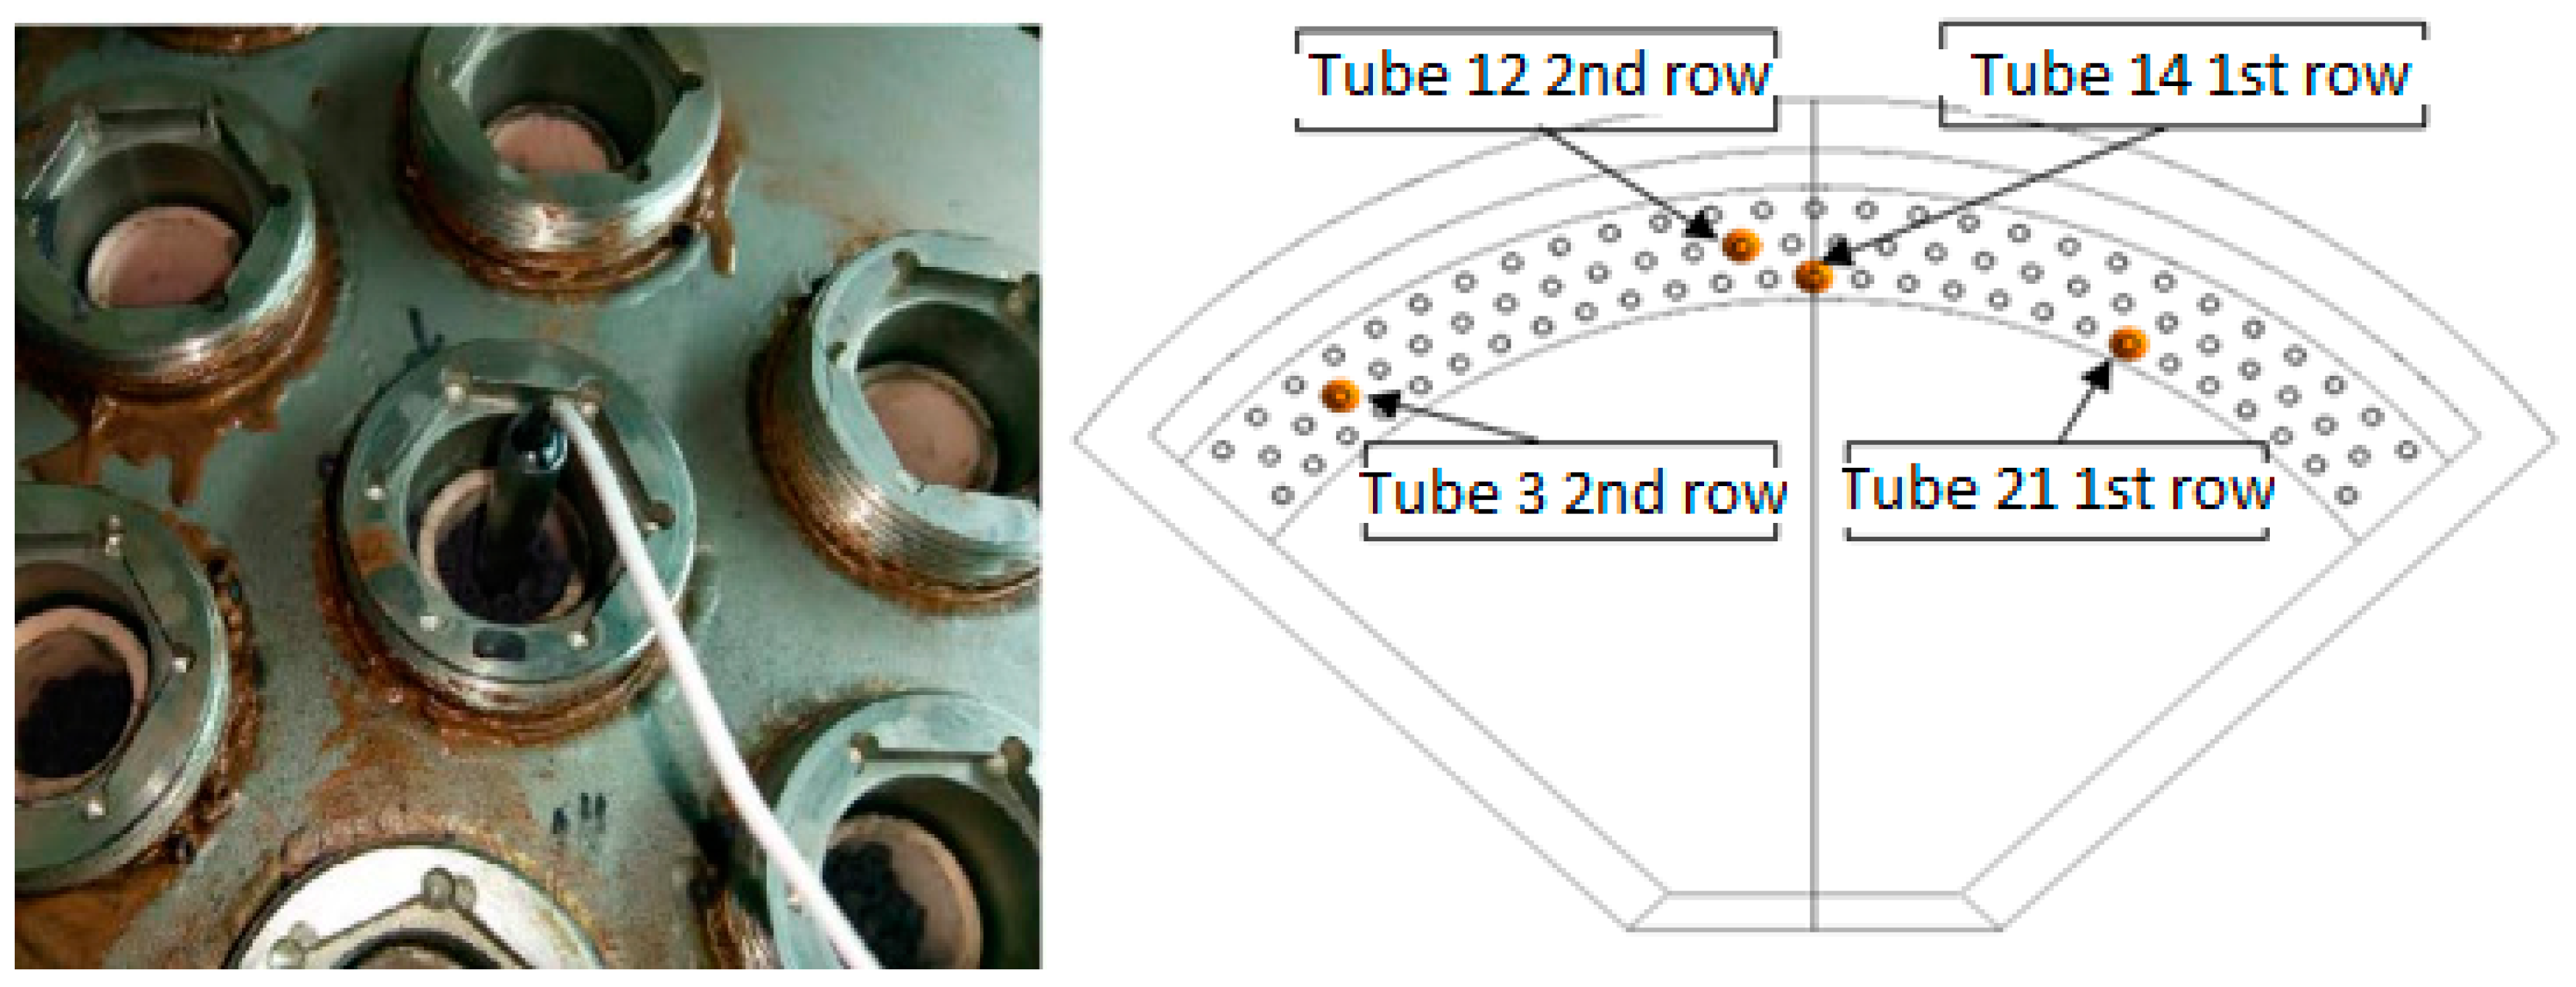
Temperatures at different locations within the reactor are also measured. Four thermocouples are included inside the reactor tubes in order to characterize the thermal behavior of the tubes, and also to compare the experimental tests with the CFD results. The thermocouples are installed in the middle of the tube (at 0.6 m), for tube 14 and tube 21 in the first row, and tube 3 and 12 in the second one, as depicted in
Figure 5.
2.3. Thermal Tests
The preliminary experiences with alumina tubes showed that they were very sensitive to temperature gradients. Some tubes were broken in previous tests due to thermal stresses caused by temperature gradients along the tube length. Such evidences, together with the reactor design requirement for a homogenous temperature distribution, made necessary an appropriate strategy for the heliostats field. The final strategy used was the following: first, only two groups of heliostats were focused on the aperture, and then the number of groups was increased until the required reactor temperature was achieved. With 20 heliostats focused, a total power of 44.1 kW can be delivered inside the cavity and a temperature of 750–800 °C is reached. Finally, with 36 heliostats and an incident power about 80 kW, 1200 °C were reached [
37]. As the thermochemical cycle is based on two steps (activation and hydrolysis) this solar reactor design concept implies a discontinuous hydrogen production over the operation time. Therefore, a sequential mode of operation was implemented in order to couple the operation of the plant and heliostat field with the mixed ferrites thermochemical cycle, which consists of two reaction stages.
The study presented here was carried out the vernal equinox, which is a representative day of the year. The test was performed with nitrogen and without water vapor (thus without hydrogen production), with a total mass flow in the tubes of 40 kg/h and gas inlet temperature of 70 °C. The exact procedure to focus the groups of heliostats is described below (and depicted in
Figure 6), and it was designed to enable the solar radiation to impinge on all the alumina tubes: first, groups 1 and 2; then group 3 and then continued with groups 4 and 5. The power ramp was done progressively without waiting for the stabilization of the tubes temperature. Then, groups 10 and 11 were included and finally groups 8 and 9 (
Figure 6). All groups contain both nearby and distant heliostats in order to favor the homogeneity of the radiation flux [
37]. Once the final configuration of the heliostats was active, the incident radiation flux and direction of rays at the opening were measured as described in
Section 2.2. Such measurements were used as radiation boundary conditions for the definition of the CFD model and simulations.
2.4. Computational Fluid Dynamics (CFD) Model
The commercial software ANSYS-CFX 14.0 [
38] has been used for the modelling and resolution of the fluid flow and heat transfer in the solar multi-tubular reactor. The geometry of the reactor and the definition of the operating conditions (radiation flux at opening and mass flow and temperature for the inert gas) are required for the model. The modeling methodology described in Tapia et al. [
39] was used for the development of the CFD model. The methodology was derived for tubular solar reactors. Fluid-dynamics model for the air within the cavity and carried gas flowing along the tubes is considered, as well as thermal models for al processes involved (conduction, convection and radiation). This methodology proposes the Shear Stress Transport (SST) turbulence model for the air within the cavity when no quartz window is used, due to its better accuracy for the thermal boundary layer resolution. The Monte Carlo model is proposed for the radiation modelling, in order to enable the definition of a matrix of rays at the opening (accounting for the real directions of the radiation distribution at the opening). The S2S (surface-to-surface) model is defined as the media (air) is a nonparticipating media (no volumetric absorption of thermal radiation). There are two main modelling domains, as described below:
Cavity: the design of the cavity is focused on achieving both a high optical efficiency and a uniform temperature distribution. The minimum temperature must be greater than the required temperature for the hydrogen production process. A mesh and a radiation factor (number of histories in Monte Carlo model) independence analysis are included in the model development. The radiation factor independence analysis is required in order to ensure that the number of histories used in the Monte Carlo model is enough to correctly calculate the radiation and temperature field (i.e., a higher number of histories do not influence the results). The cavity model includes the thermal insulation to avoid losses.
Reactor (tubes): the reactor design starts once the cavity design is closed. The main goals are a complete thermal balance of the reactor, identifying hot/cold spots, and determining the reaction volume which achieves the required conditions. The tubes are modelled considering its thickness, and the ferrite pellets in the reactor interior are modelled as a porous media.
For a properly defined CFD analysis, it is necessary to previously carry out a mesh analysis in order to ensure that results are independent of the mesh used in the simulations. A mesh independence analysis was carried out at the beginning of the simulation process in order to identify the optimized computational mesh. The mesh is refined near wall and high gradient regions (for both temperature and velocity values). After mesh and radiation factor analysis were done, it was concluded that the final mesh featured 1.9 million nodes and 9.0 million elements. The final mesh is depicted in
Figure 7. A hybrid mesh has been used, with tetrahedral elements in the cavity volume and hexahedral elements in the tube interior and wall thickness. A set of prism layers was placed at the fluid side of the reactor and tubes walls in order to ensure the appropriate resolution of the viscous and thermal boundary layers. The heat conduction through the tube wall thickness was resolved with three hexahedral elements.
The minimum radiation factor (number of histories in the Monte Carlo model) determined to be required for this reactor is 65 × 10
6, which is clearly higher than the default value of 1 × 10
4. The value of 65 × 10
6 histories was determined from the radiation factor independence analysis (depicted in
Figure 8), where the standard deviation of the irradiation heat flux (%SD) over the reactor surfaces is calculated as a function of the number of histories. The parameter %SD reveals the degree of accuracy of the radiation calculation in the Monte Carlo model [
38], where a value less than 30% is required for an appropriate accuracy [
38]. The Monte Carlo radiation solver computes the standard deviation error based on Poisson statistics. The user-specified number of histories is divided into several groups. Histories are selected from each group and their physical interactions (emission, absorption, reflection) are tracked through the domain. At the end of the calculation, each group provides values for the quantities of interest, such as irradiation heat flux or absorbed radiation. The mean value and standard deviation of each quantity of interest are computed from the groups. The normalized standard deviation (parameter %SD) is computed by dividing the standard deviation by the mean value.
Figure 8 shows that 65 × 10
6 histories were required for reducing the %SD parameter below 30%, and thus this value was used for the simulations. Obviously, a higher number of histories requires a higher computational time for the resolution of the model. This is also presented in
Figure 8.
The concentrated solar radiation enters the cavity receiver through the opening. The incident radiation flux and direction vectors were provided by CIEMAT/PSA according to the experimental tests and flux measurements as described in
Section 2.2 and
Section 2.3. The direction of the rays, as implemented in the CFD model, is presented in
Figure 9. The total solar power entering the cavity is 80 kW.
The carrier gas (nitrogen) is fed to the inlet collector located on the top of the reactor, and flows downwards along the tubes finally reaching the outlet collector. The fluid flow inside the cavity and tubes, air and nitrogen respectively, is assumed to be turbulent and laminar respectively. Ideal gas approximation is use in the model, and air is defined as transparent to radiation, so that surface-to-surface radiation model is used without volumetric absorption. The reactor walls are considered as opaque surfaces, diffusely emitting and reflecting. The Monte Carlo model with surface to surface radiation model is used. The heat transfer by conduction within the tubes and porous media (ferrite pellets) is included in the same simulation where the radiation behavior is analyzed (and also heat transfer by convection between carrier gas and porous media within the tubes), therefore avoiding the need for decoupling the models. Thus, all relevant thermal processes are included in a single model and simulation. The following physical properties were considered: specific heat capacity of the nitrogen gas at constant pressure is 1041 J/kg·K and dynamic viscosity, density and thermal conductivity were defined as functions depending on temperature. The pressure drop in the porous media (ferrite pellets within the tubes) was modelled by Darcy’s law with linear and quadratic coefficients as introduced in the previous model by the authors [
39]. Pressure drop was 50 kPa. The thermal conductivity of silicon carbide and alumina are also defined as functions depending on temperature. The surface emissivity of the diffusely-reflecting cavity inner wall (silicon carbide) and the tubes (alumina) are 0.3 and 0.8 respectively. The nitrogen gas boundary conditions (flow rate and temperature) were defined in order to replicate the experimental test (
Section 2.3). The effect of the cavity insulation at the external walls was included in the model by defining an external heat transfer coefficient of 0.128 W/m
2·K (which was calculated to be equivalent to the insulation material heat conduction resistance and external heat convection resistance). All simulations were carried out in steady-state mode, thus considering nominal operating conditions and no transient effects.
The summary of physical models and boundary conditions used in the simulation is presented in
Table 1.
All simulations were carried out in a HP Z600 workstation, running on parallel on 8 processors. The simulation time for the final mesh used was in the range of 5 days per simulation.
3. Results and Discussion
The results of the thermal tests and the comparison between the experimental measurements and the CFD model results is shown in this section. The time-evolution of the reactor temperatures during the experimental test until achieving the steady state for the final configuration of the heliostat field (80 kW) is presented in
Figure 10. The steady state CFD results are also presented in
Figure 10 (thus, for the final time only). The black stepwise curve in
Figure 10 represents the number of heliostats used, indicating the progressive use of the heliostats during the start-up of the reactor, as described in
Section 2.3. Black dots represent the thermal power delivered to the cavity as a results of the increasing number of heliostats being used. Colored lines represent the experimental time-evolution of the reactor temperatures during the heating-up process until reaching steady state conditions. Finally, the set of four colored dots at the final time represent the CFD results for the tubes temperature corresponding to the experimental thermocouple locations.
It can be observed that the total heating-up ramp is taking 4 h, where during the last 1.5 h all the heliostats involved are focused.
The maximum temperature differences between experimental thermocouples and CFD results is featured by tube 21 for the first row and tube 3 in the second row. These tubes are located close to the cavity extremes so the incident radiation flux is lower than at the middle cavity tubes. A further analysis for the direction radiation flux defined in the model and also the details of the mesh at the opening (where the rays direction is defined) needs to be done.
The detailed experimental and CFD results are shown in
Table 2. It is observed that the CFD temperature results are lower than the experimental temperature data for all thermocouples. This fact could be caused by larger convection losses in the CFD simulations than in the real experimental tests, as well as difference between the considered and real materials emissivity. However, the CFD model results for the central tubes (12 1st row and 14 2nd row) are presenting an excellent agreement with respect to the experimental values. The maximum temperature error in CFD simulations is around 11.5% which is in the same range as others studies [
24,
27,
29,
32]. It can be also observed that errors are very small at central tubes, and larger at the side tubes. The reason for this difference is under investigation. As the incident radiation received by central and side tubes is not the same (mainly direct incident radiation from the heliostat field for central tubes, and reflections and receiver emissions for side tubes) it is possible that either the material emissivity or the accuracy of the radiation model is not fully appropriate for representing the real radiation field within the cavity. This is however still under investigation in order to better assess the reason for this behavior.
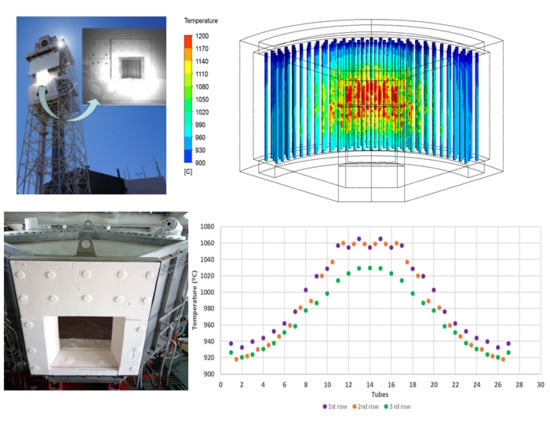
The CFD simulations also allow to evaluate the temperature distribution in tubes.
Figure 11 (top) shows that temperature in tubes located at the cavity edges are lower than the rest of the tubes. Outer wall temperatures of the tubes are ranging from less than 900 °C at the top of the edge tubes to over 1200 °C at the middle of the tubes located at the centre of the cavity. The effect of the carrier gas inlet temperature is also observed, as the upper part of tubes is clearly presenting colder temperatures, and then is quickly heated up due to the heat transfer from the incident solar radiation.
Figure 11 (bottom) depicts the average temperature at the outer surface of each tube. Average temperature is above 900 °C for all tubes. A Gaussian temperature distribution is clearly observed, with higher temperatures at the center due to the peak incident radiation. In general, temperatures are higher for the first row (receiving direct radiation), with temperatures of the second row nearly as high as for the first row (due to the staggered arrangement of the tubes). Third row is clearly presenting a lower temperature as the shadow effect of the first and second rows is significant and there is less direct incident radiation. Additionally, other differences between tube rows can be observed. Near the cavity extremes, the behavior of the second row is approaching the behavior of the third row. This is because at this locations direct radiation is becoming less pronounced, and secondary reflections and emission from nearby hot surfaces is governing the radiation heat transfer. This is not the case for the tubes at the center of the cavity, where first and second row receiving a direct radiation flux are presenting very similar temperatures, whereas third row is around 30 °C colder due to the shadow effect mentioned above. On average, temperature differences among the different tubes is around 120–140 °C, and thus temperature distribution can be considered relatively homogenous inside the cavity for the purpose of the endothermic process.
The total volume of the ferrite pellets achieving the required temperature level for the endothermic reaction has been calculated from the results of the CFD simulation. This is graphically presented in
Figure 12. This is an indication of the efficiency of the reaction volume (i.e., how much volume of the reactor is actually active for the chemical reaction). In this case, simulation results show that 90.4% of the ferrite domain achieves the required process temperature (900 °C). Only the ferrite pellets at the top corners at both sides of the reactor are not achieving the required process temperature (
Figure 12). The total reactor volume efficiency could be further enhanced with a better energy integration of the reactor and system, for example by exchanging energy of the outlet nitrogen gas flow with the inlet nitrogen flow, in order to preheat this stream and feed the reactor tubes with a preheated carrier gas flow. Apart from achieving higher temperatures at the upper part of the tubes, mechanical and thermal stresses would be also reduced, thus enlarging the life time of the reactor.
It must be considered that the carrier gas flow distribution among the 80 tubes is also relevant for the final performance of the reactor. A highly non-uniform distribution could lead to a lack of carrier gas in tubes with less flow, or to an unnecessary cooling at the tube entrance in tubes with excessive flow. The pressure drop caused by the ferrite pellets is expected to contribute to the uniformity of the gas flow among the different tubes, but in order to verify this the mass flux per tube can be analyzed from the CFD results. This is presented in
Figure 13, where a slight non-uniformity is observed, with higher gas flow at the side tubes and lower gas flow in the central tubes. However, differences are less than 10% and this has been considered as acceptable. The reason for the slight non-uniformity is caused by the properties of the carrier gas (density and viscosity). The side tubes are colder than the central tubes as observed in
Figure 11, thus with a higher gas density and lower viscosity. The effect of this is that pressure drop is reduced along the side tubes with respect to the central tubes, and this is causing that a slightly higher gas mass flow is processed by the side tubes.
The thermal balance of the reactor is presented in
Table 3. Both convection and radiation losses at the opening of the cavity have been calculated as a result of the CFD modelling. Convection losses represent 13 kW (16% of the total incoming thermal power) and radiation losses 19 kW (accounting for 24% of the total power). Finally, 6.3 kW can be transferred by the reactor towards the reaction media inside the tubes, representing a thermal efficiency of 7.9% for the solar reactor.
Thermal efficiency has been defined as the ratio between useful heat (heat transferred to the process, i.e., inner side of the reactor tubes) and incoming radiation into the reactor. Optical efficiency is defined as the ratio between radiation absorbed by the tubes and the incoming radiation. The latter mainly depends on reactor geometry and optical properties. Regarding thermal efficiency, values reported in the literature are in a very wide range. For instance, Ma et al. [
40] obtained thermal efficiencies between 27% and 90% depending on working conditions such as the gas flow rate. Values reported in
Table 3 show that conduction heat losses through the reactor walls represent 52.26% of the incoming radiation power, where the opening convection and radiation heat losses represent 39.81%, and the useful heat to the process 7.93%. It is therefore concluded that there is a clear room for increasing thermal efficiency by reducing conduction heat losses (i.e., improvement of reactor isolation) in order to enhance the overall mean temperature in the cavity.


 ,
, 


