1. Introduction
Reverse osmosis (RO) has become an important means of solving the water resource crisis due to its simplicity, low energy consumption, and relatively low operating costs. However, the price of producing fresh water is still 1.25–2.5 times that of direct fresh water [
1]. In the RO seawater desalination process, electricity consumption accounts for half of the water costs. Reducing electricity consumption can greatly reduce the water production costs involved in RO seawater desalination [
2]. The main methods to reduce electricity consumption include using energy recovery devices, improving equipment efficiency, and developing new equipment [
3]. An integrated sea-water desalination power recovery motor pump directly recovers pressure energy from concentrated seawater and pressurizes the raw seawater while recovering power. This type of pump is used to replace traditional high-pressure pumps, energy recovery devices, and booster pumps, and the volumetric efficiency and mechanical efficiency of its port plate pair directly affect water production energy consumption [
4].
Temperature and flow velocity play critical roles in the force and flow behaviors of hydraulic components. Excessive temperature reduces the viscosity of the hydraulic medium, which aggravates internal leakage, accelerates component wear, and shortens service life. Meanwhile, increasing flow velocity intensifies flow resistance and viscous friction, resulting in pressure loss, lower system efficiency, and higher energy consumption [
5,
6]. Therefore, understanding the thermo-hydraulic and tribological behaviors of port plate pairs is essential for improving the performance of axial piston pumps and motors.
In recent years, extensive studies have been carried out on the dynamic characteristics and structural optimization of port plate pairs in axial piston machines. Existing research can be broadly classified into four aspects. First, the dynamic responses of port plate pairs, including pressure pulsation, flow fluctuation, vibration, and variable-displacement characteristics, have been widely investigated under different operating conditions [
7,
8,
9,
10]. Second, structural optimization of the port plate pair, such as triangular grooves, sealing rings, and biomimetic surface textures, has been explored to improve leakage, load-carrying capacity, and frictional performance [
11,
12,
13]. Third, fluid–structure interaction, thermo-elastohydrodynamic lubrication, and other multi-physics coupling approaches have been employed to analyze the coupled evolution of film thickness, pressure distribution, temperature field, and thermal deformation, demonstrating higher prediction accuracy than conventional single-field models [
14,
15,
16,
17,
18,
19,
20]. Fourth, combined numerical and experimental studies have examined the effects of inlet pressure, rotational speed, clearance, and spring stiffness on distribution characteristics, leakage behavior, and mechanical efficiency [
21,
22,
23,
24].
In summary, previous investigations into the port plate pair of piston pumps have predominantly concentrated on pressure pulsation, cavitation, leakage behavior, and oil-film support performance, yielding significant achievements in these areas. Nevertheless, research on the design methodology of the port plate pair is still insufficient. This gap is particularly pronounced in seawater hydraulic systems, where no well-established design framework is currently available to enhance the efficiency of the valve plate pair under seawater-lubricated conditions. In this paper, according to the structural characteristics of the port plate pair in the integrated seawater desalination power recovery motor pump, the fluid reverse thrust between the port plate pairs was studied. This study aims to determine the optimal residual compression force coefficient for the port plate pair by analyzing temperature distribution under rated (7 MPa) and maximum (8.5 MPa) pressures using fluid-solid thermal multi-field coupling.
2. Working Principle and Structure
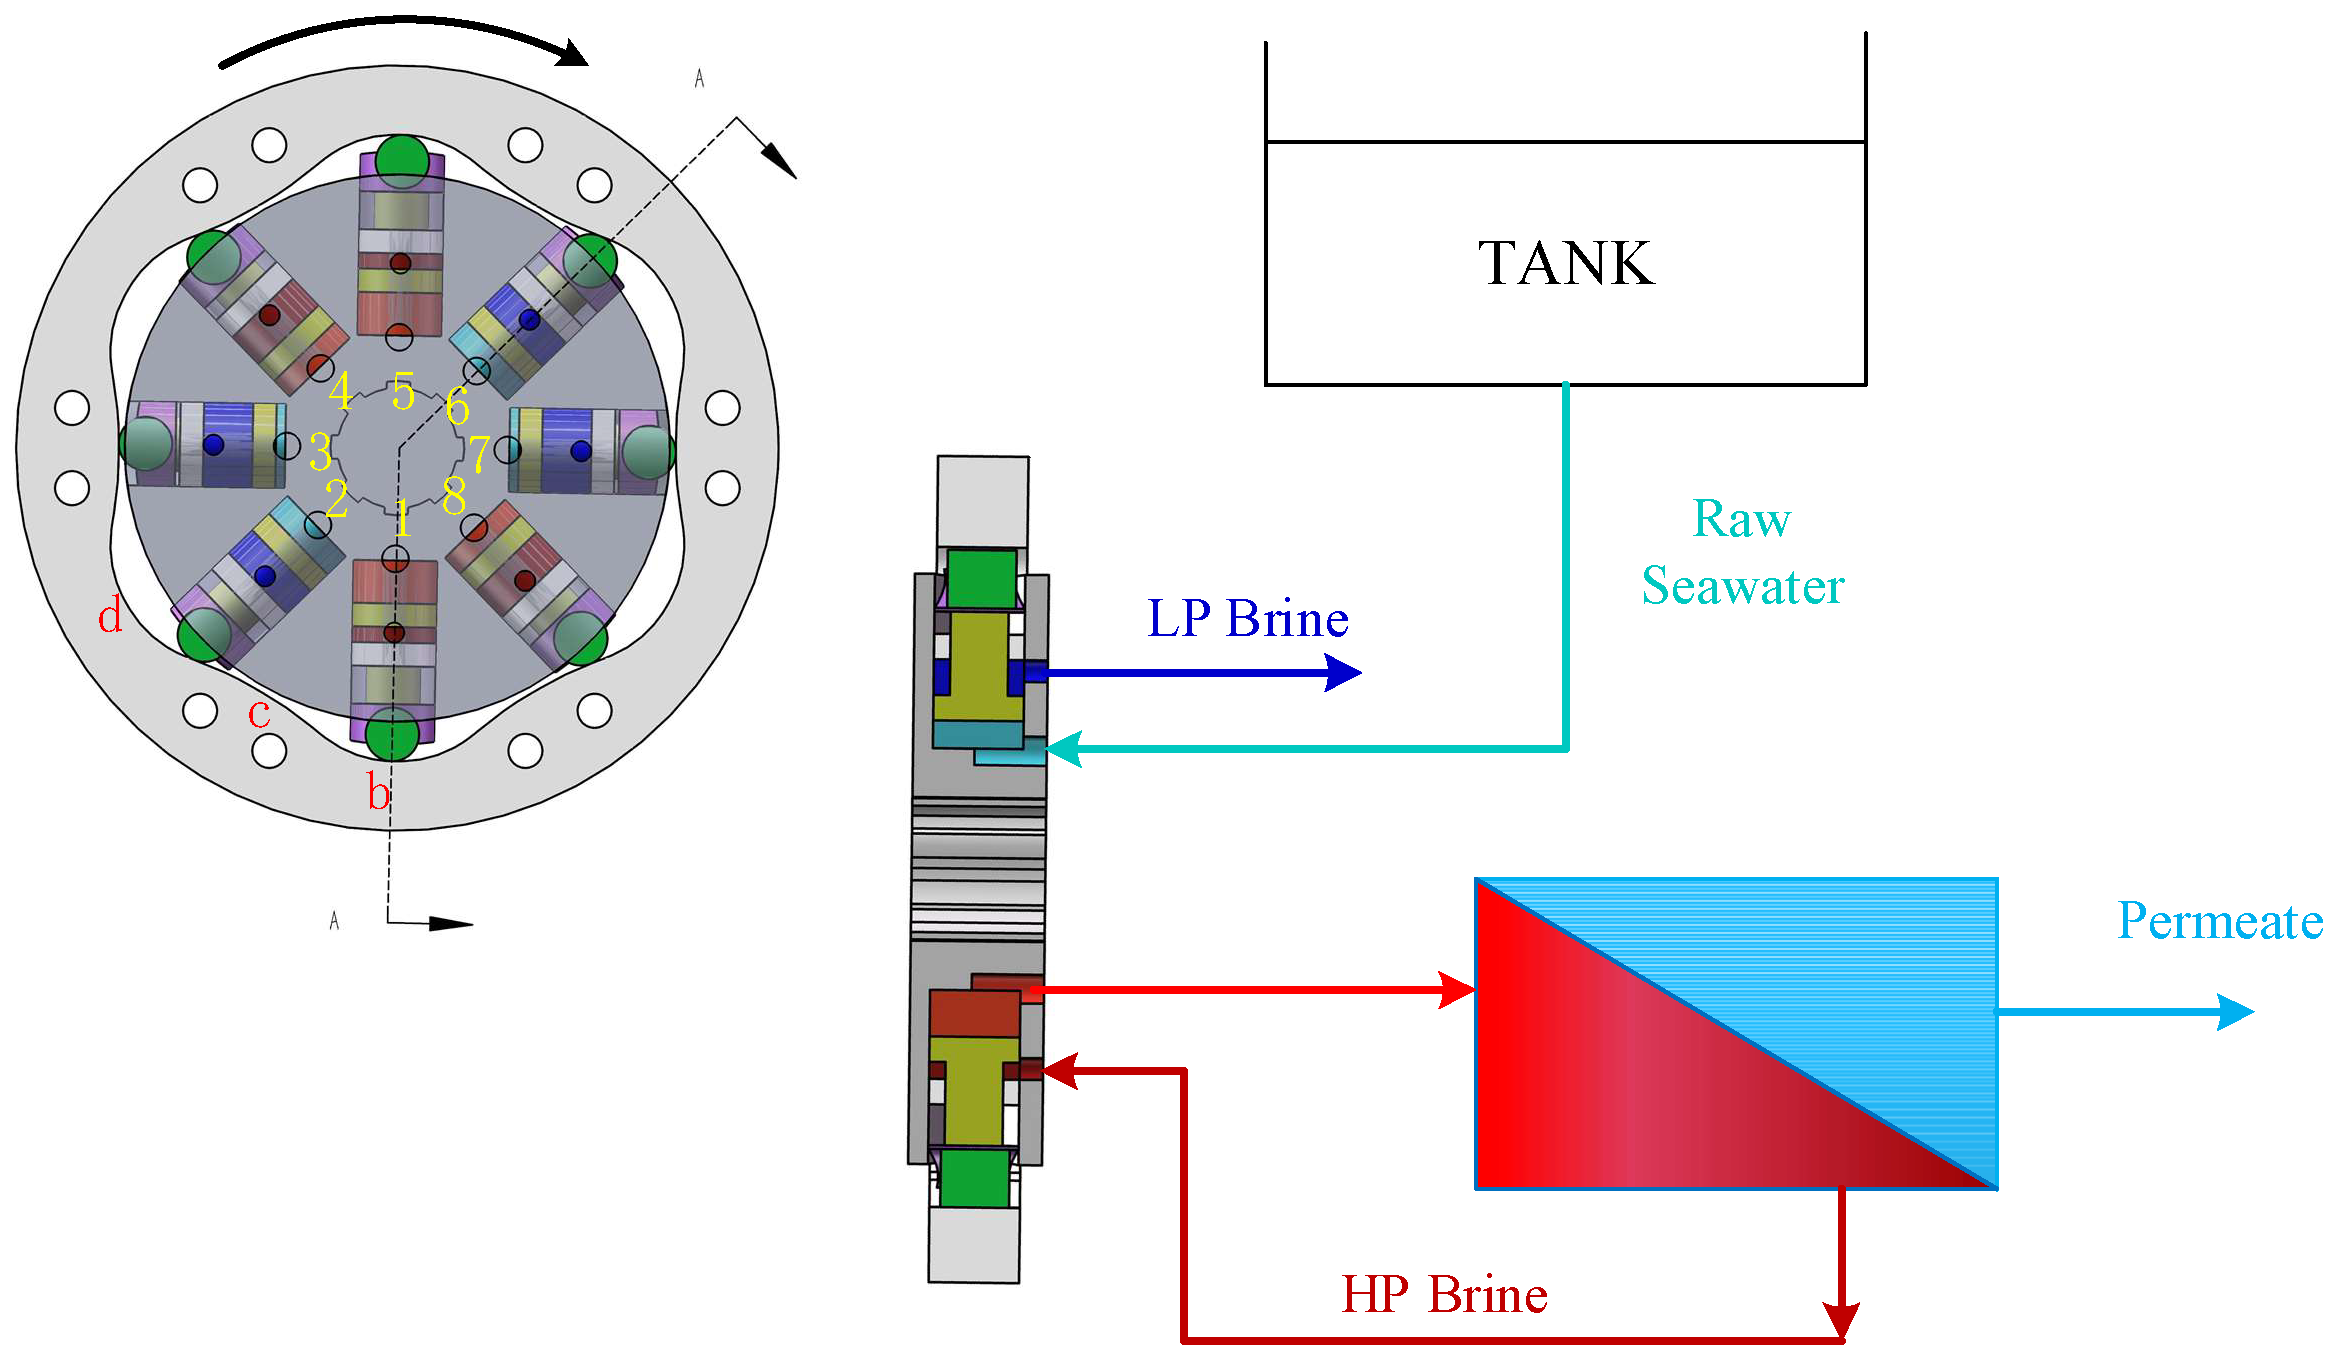
The integrated seawater desalination power recovery motor pump integrates the energy recovery function inside the high-pressure pump. Its working principle is shown in
Figure 1. The raw seawater and the concentrated seawater with pressure energy were simultaneously introduced into the pump.
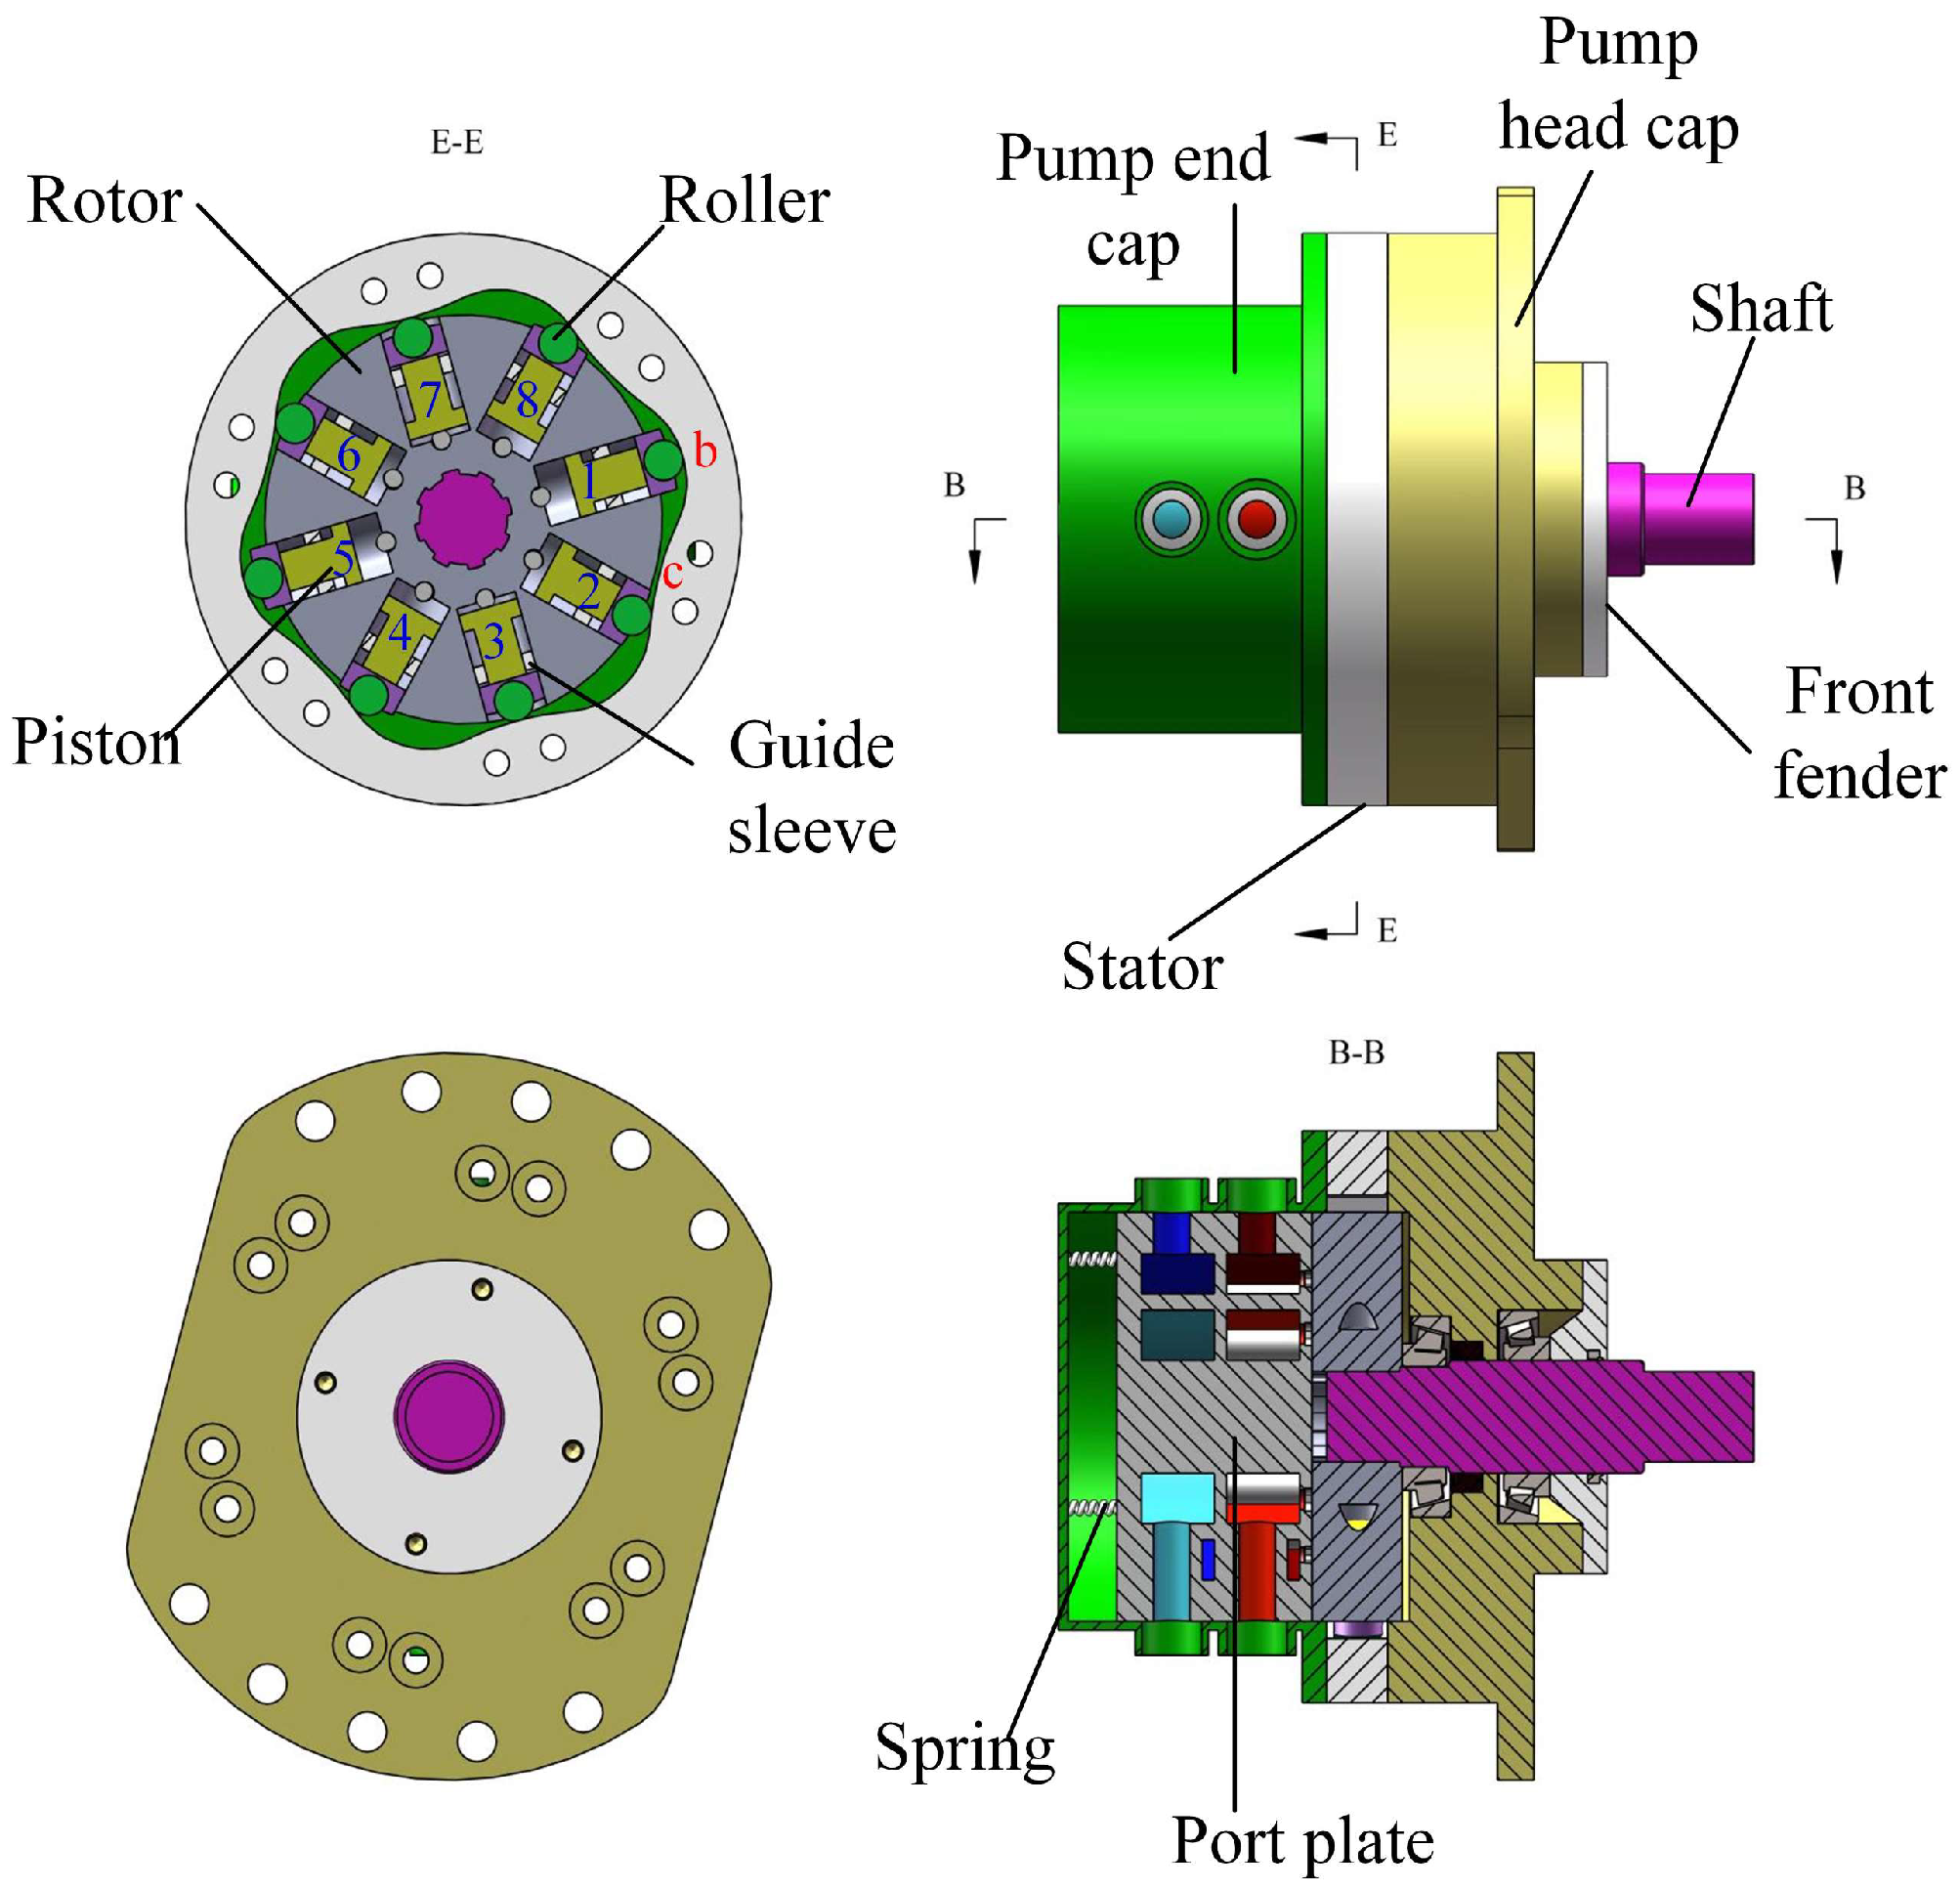
Figure 2 displays the specific structure of the pump, which is composed of a stator, a rotor, a port plate, pistons, and related accessories.
In
Figure 1, the rodless end of the piston is the working chamber of the raw seawater, whereas the piston end with a rod is the working chamber of the concentrated seawater. Pistons 1, 4, 5, and 8 are operated to pressurize the raw seawater and recover the pressure energy of the concentrated seawater, whereas pistons 2, 3, 6, and 7 are used to induct the raw seawater and discharge the concentrated seawater.
The working process of the pump is illustrated using piston 1 as an example. The motor drives the rotor to rotate clockwise. The roller is always in contact with the stator and moves along it. As the roller moves from the far point “b” to the near point “c”, it forces piston 1 to retract in the radial direction along the rotor. The high-pressure concentrated seawater enters the rod end of the piston from the membrane through the port plate. The concentrated seawater exerts pressure on the annular area of the piston to provide a driving force for the piston to retract along the radial direction of the rotor. The mechanical energy provided by the motor is combined with the pressure energy of the high-pressure concentrated seawater to pressurize the raw seawater. Subsequently, the feedwater pressure required by the membrane is achieved, and the pressurization of the raw seawater during the pressure energy recovery process of the concentrated seawater is achieved. Piston 1 retracts completely as it approaches point “c”. When piston 1 passes the near point “c”, it starts to protrude outward, and the pre-treated raw seawater enters the rodless cavity through the port plate. The concentrated seawater is then discharged from the rod cavity into the port plate. As the rotor continues to rotate, piston 1 moves to the far point “d”. At this moment, piston 1 is restored to the same phase as its initial position; thus, it completes the working cycle. The raw seawater flows into the rodless working chamber of piston 1 and flows out of the chamber through the port plate. Similarly, the concentrated sea water flows into the rod cavity and flows out of the chamber.
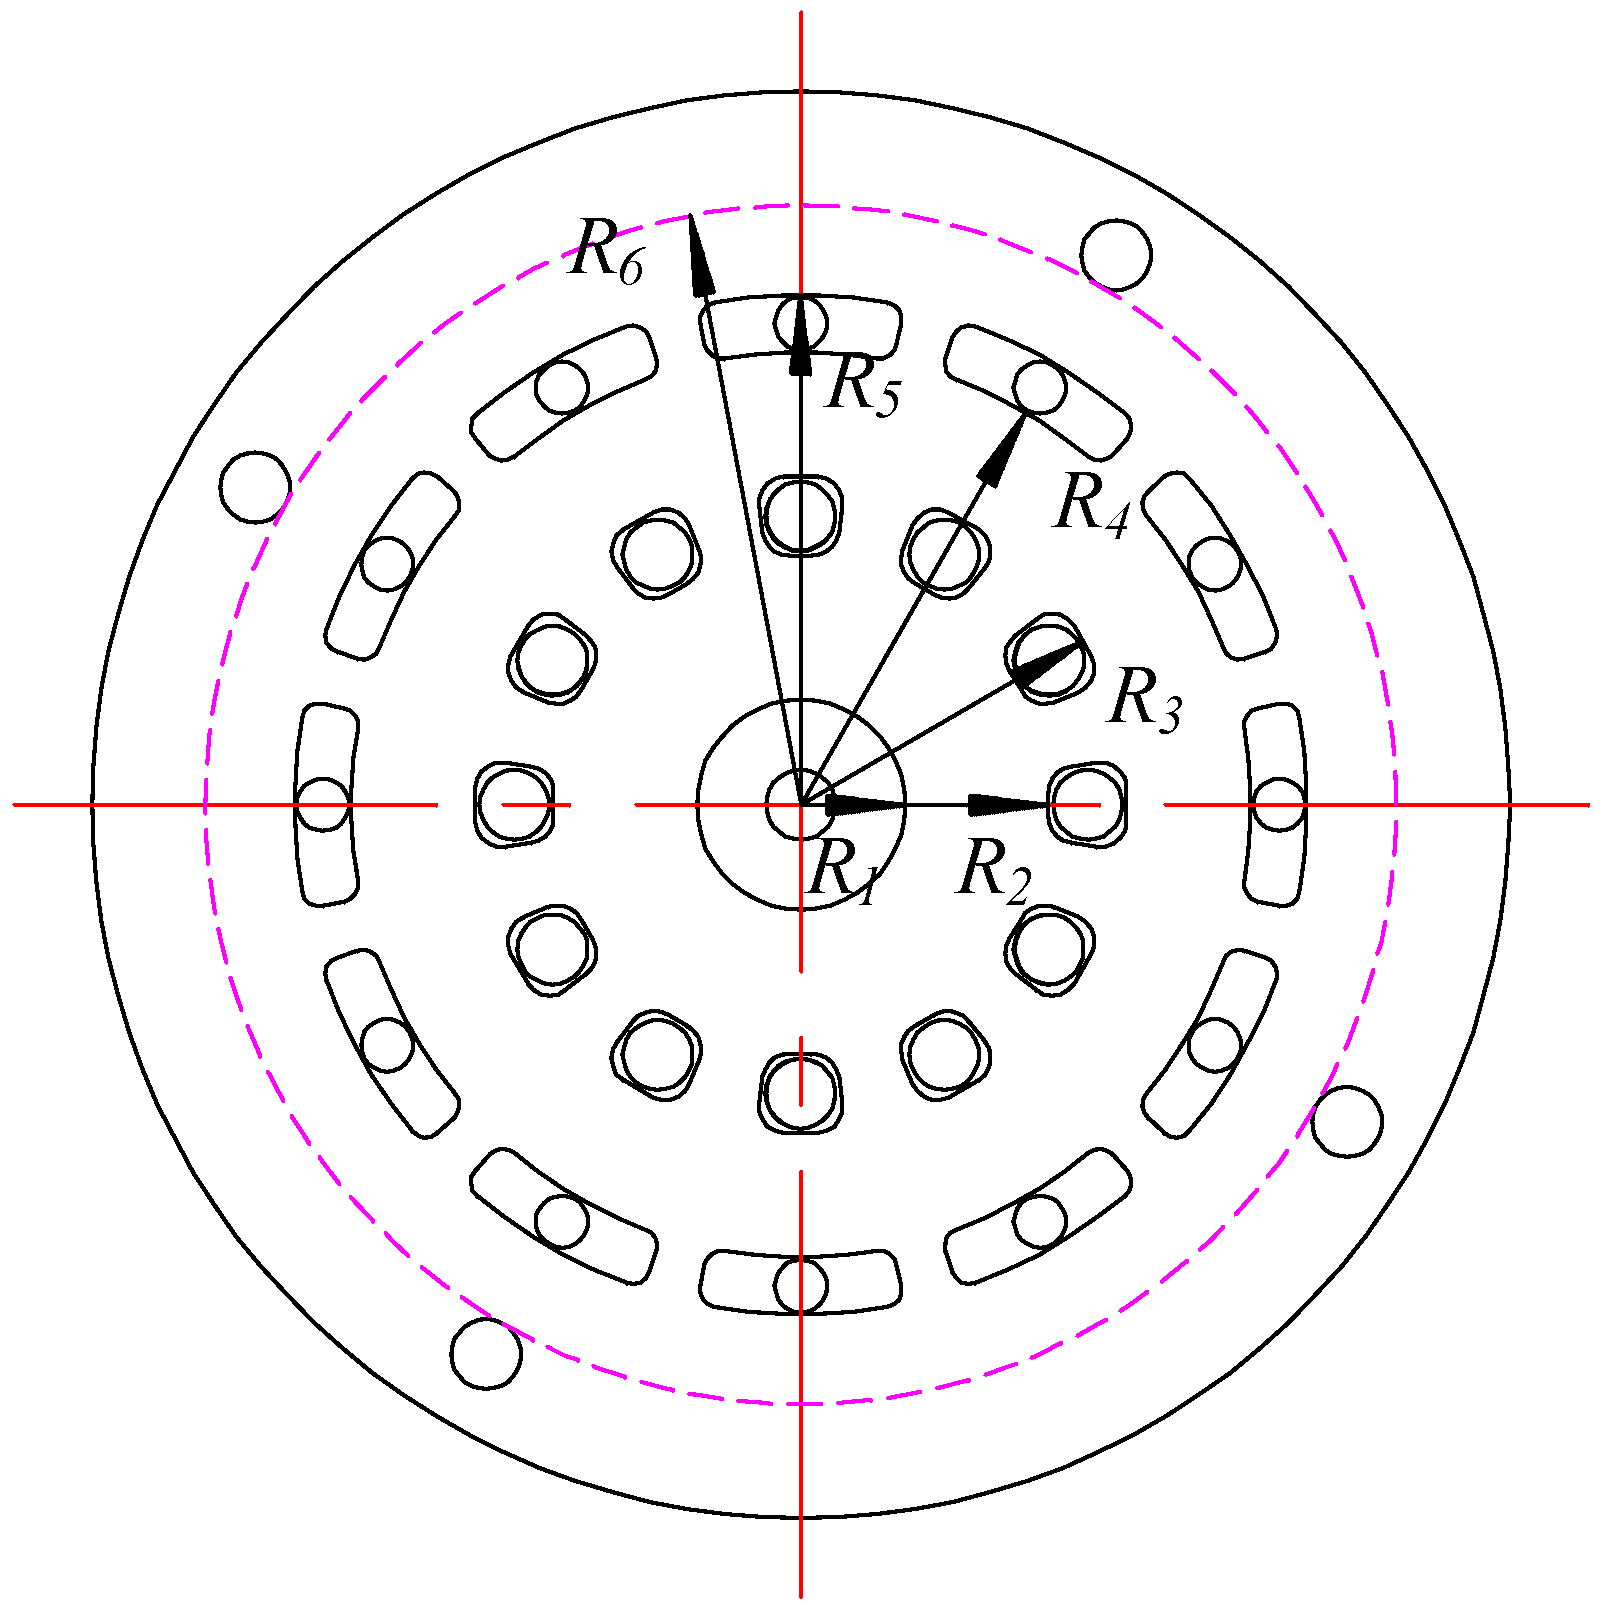
The raw seawater window and concentrated seawater window at the bottom of the rotor of the integrated seawater desalination power recovery motor pump are sequentially connected to the corresponding waist-shaped inlet and outlet on the port plate, completing the distribution process of the raw seawater and concentrated seawater. The port plate pair consists of a port plate and a rotor. The end face structure of the port plate is shown in
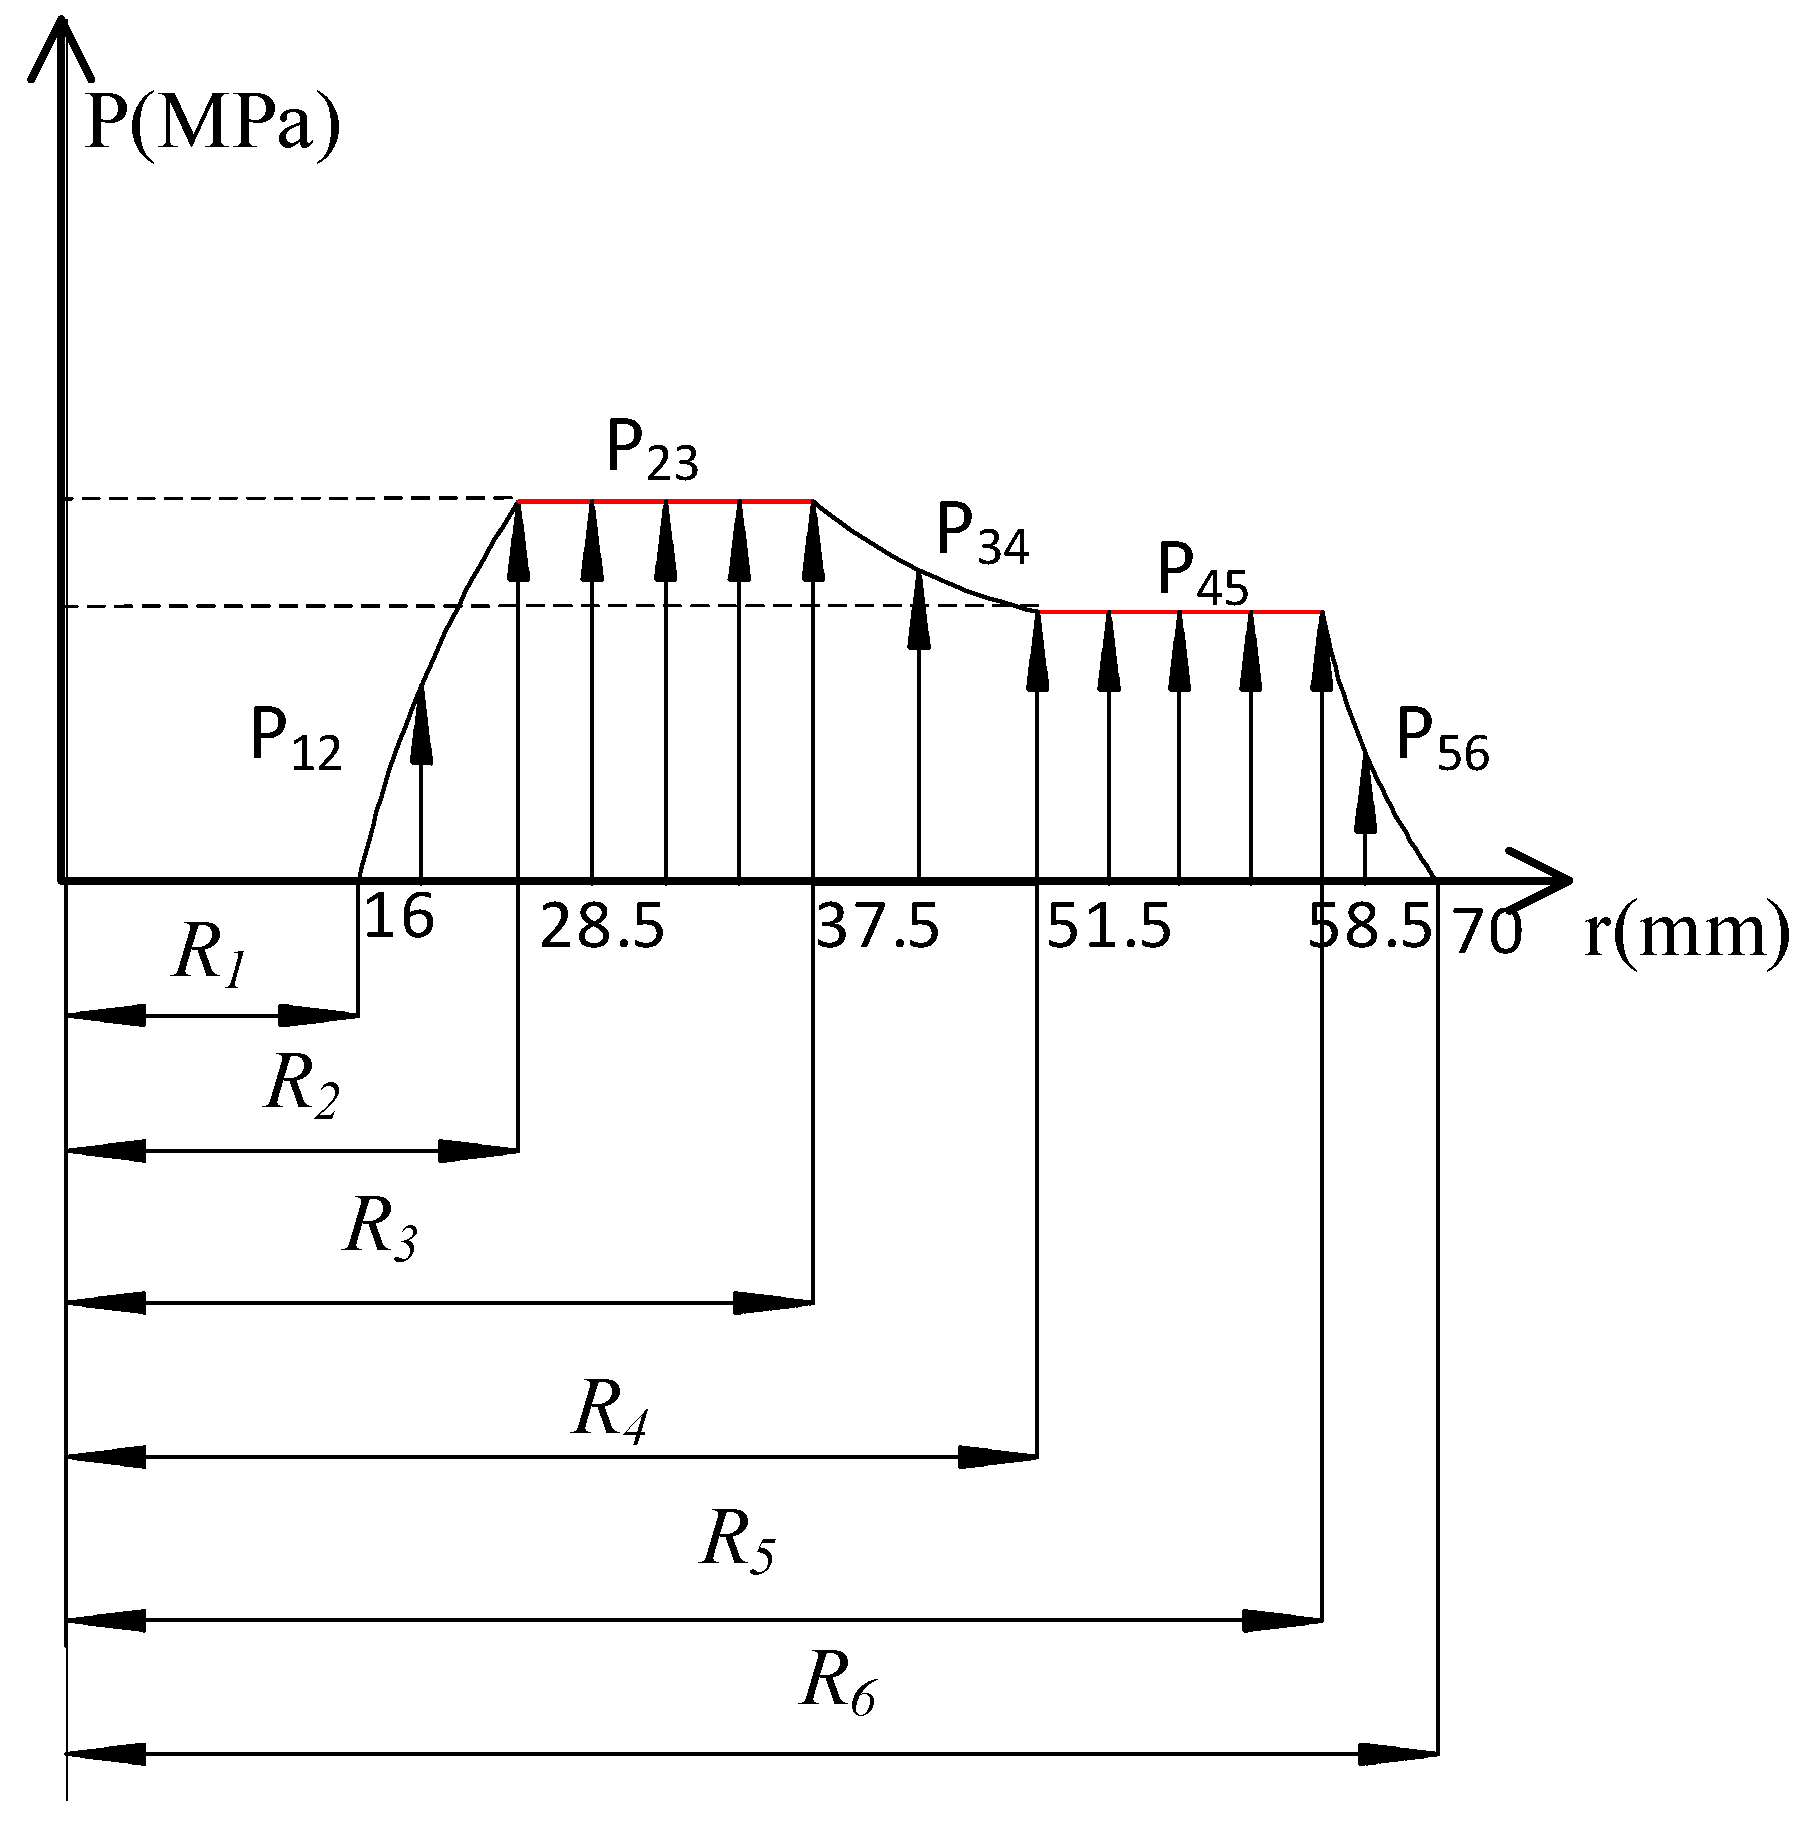
Figure 3. A portion of the seawater flowing through the waist-shaped window of the port plate seeps into the friction pair between the port plate and the rotor. The pressure of seawater forms a reverse thrust between the two. The internal pressure distribution of the port plate is shown in
Figure 4, with the horizontal axis representing the radial radius and the vertical axis representing the pressure.
The seawater flow between the port plate and the rotor is simplified as radial laminar flow [
25,
26]. The pressure at any point with a radius of r centered on the axis of the port plate is as follows [
27]:
In the expressions, Pr is the raw seawater pressure (MPa) and Pb is the concentrated seawater pressure (MPa). R
1 is the inner radius of the inner seal band. R
2 is the outer radius of the inner seal band, which is also the inner radius of the concentrated seawater waist-shaped window. R
3 is the inner radius of the middle seal band, which is also the outer radius of the concentrated seawater waist-shaped window. R
4 is the outer radius of the middle seal band, which is also the inner radius of the raw seawater waist-shaped window. R
5 is the inner radius of the outer seal band, which is also the outer radius of the raw seawater waist-shaped window. R
6 is the outer radius of the outer seal band. P
12 is the internal pressure within the inner seal band. P
23 is the pressure in the annular region where the concentrated seawater waist-shaped window is located. P
34 is the pressure within the middle seal band. P
45 is the pressure in the annular region where the raw seawater waist-shaped window is located. P
56 is the pressure within the outer seal band. The waist-shaped window of the raw seawater in the port plate and the waist-shaped window of the concentrated seawater have equal angles. The hydraulic reverse thrust between the port plate pairs is:
where
is the starting angle and
is the termination angle.
The clamping force of the port plate pair is:
where
is the remaining compression coefficient.
The residual compression force coefficient is generally used to characterize the magnitude of the compression force and the remaining compression force. The remaining clamping force can ensure volumetric efficiency, but excessive clamping force can easily cause an increase in friction power loss and the local high temperature of the port plate. However, if the compression force is too low and exceeds the rated pressure, it will cause excessive leakage, resulting in a decrease in the volumetric efficiency and an increase in temperature between the port plate pairs.
3. Numerical Calculation of Fluid–Solid Heat Multi-Field Coupling in the Port Plate Pairs
3.1. Fluid–Solid Thermal Multi-Field Coupling Model
When the working pressure of the integrated seawater desalination power recovery motor pump is less than the design value of 7 MPa, the clamping force tightly presses the port plate onto the rotor. Due to the working rotation, most of the frictional power between the port plates is converted into heat. Part of the heat is released through heat exchange between the port plate, rotor, shell, and the environment, while the rest of the heat is exchanged with the internal fluid. Therefore, the port plate is a typical fluid–solid thermal coupling system.
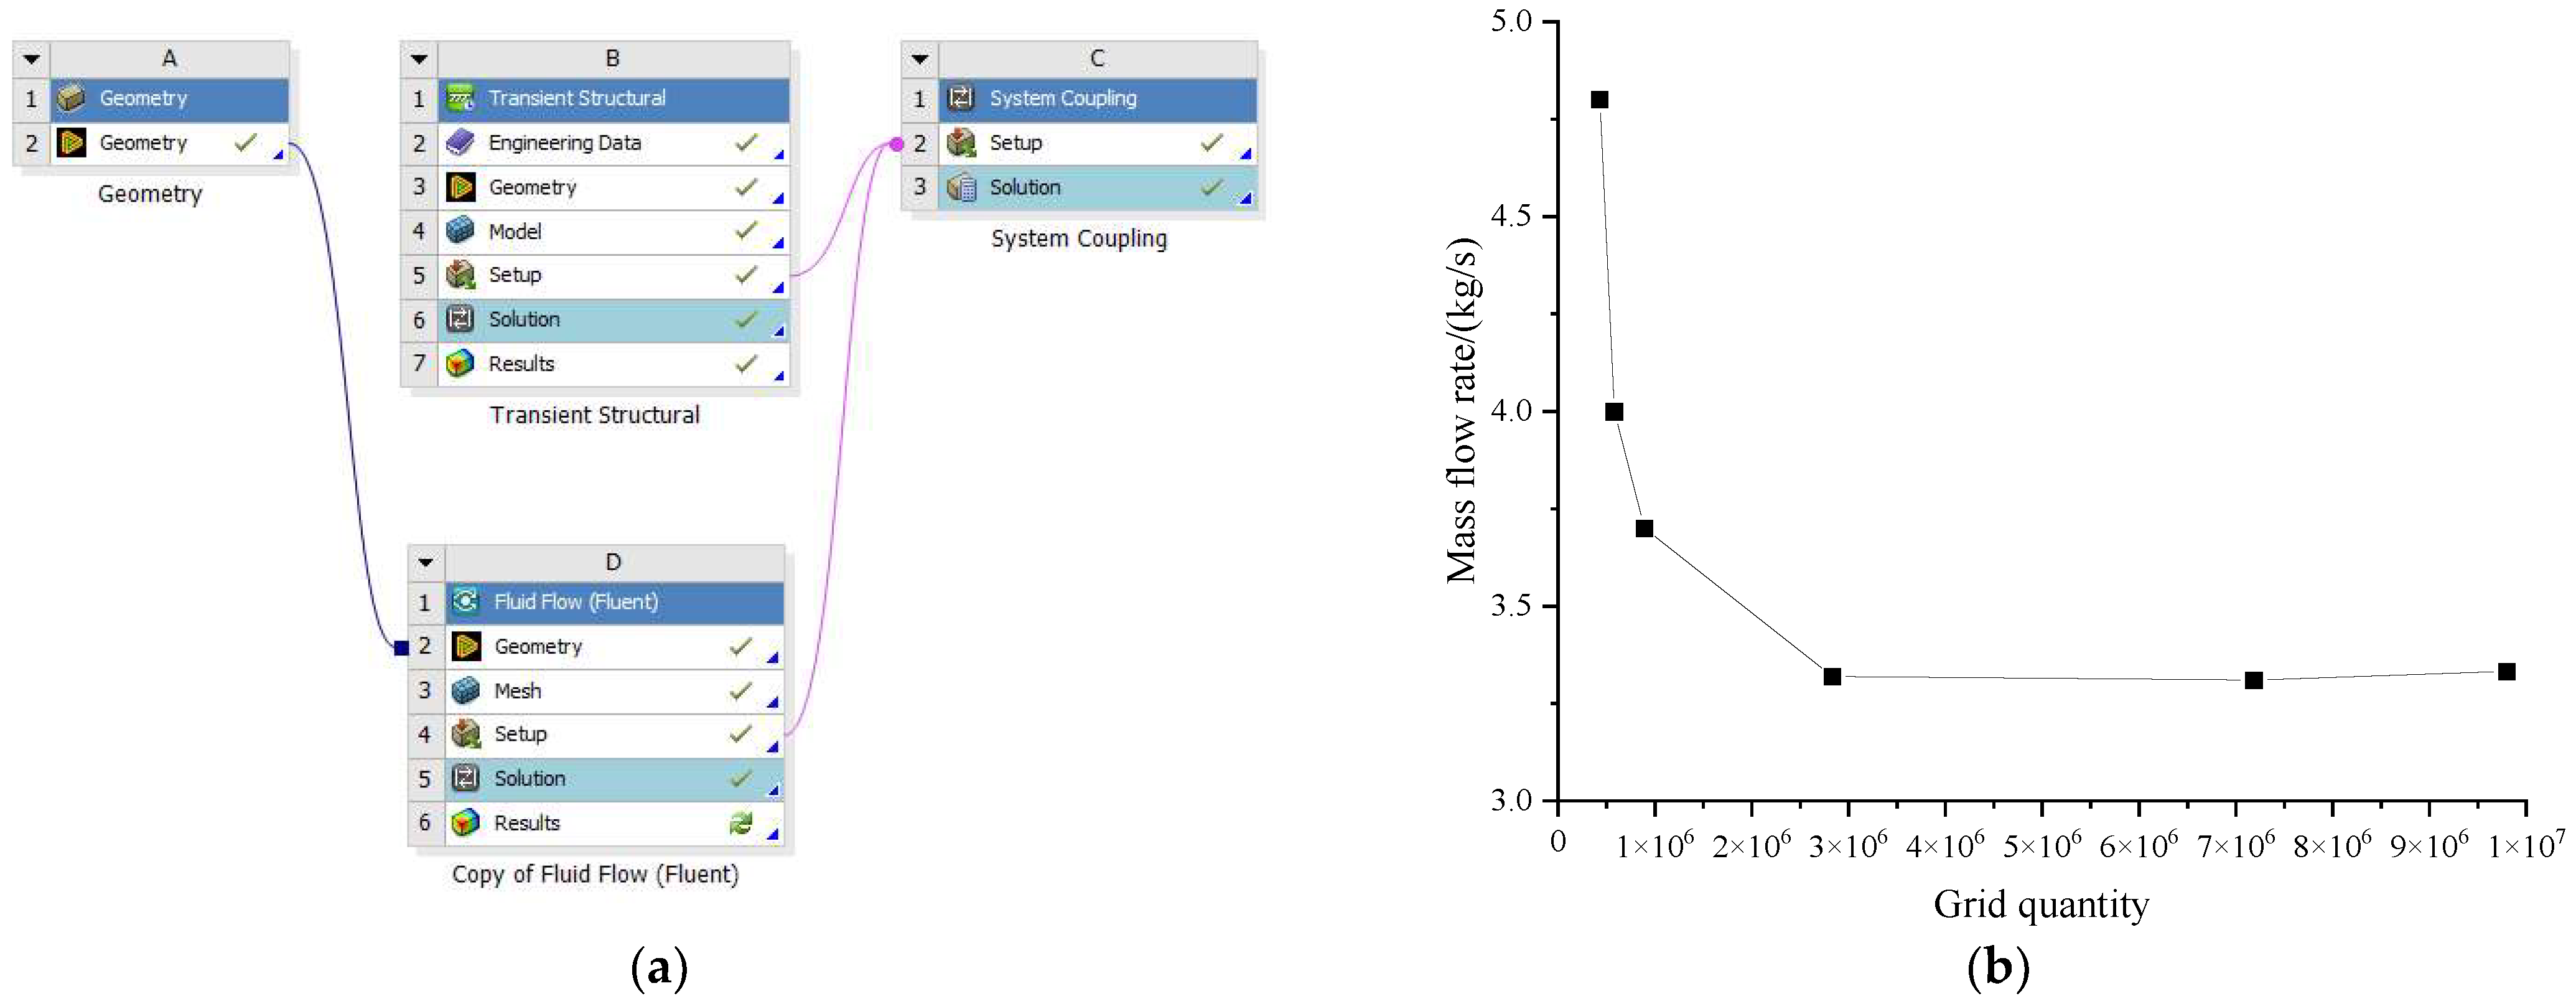
A multi-field coupling system was established based on the ANSYS Workbench2023 platform. A bidirectional sequential coupling analysis method was adopted. The material of the rotor, port plate, and piston was selected as 2507 duplex stainless steel, whose thermophysical properties are provided as follows. The thermal expansion coefficient is 13.7 × 10
−6 K
−1 within the temperature range of 20–100 °C. The thermal conductivity is no more than 14.2 W/(m·K), and the specific heat capacity is less than or equal to 460 J/(kg·K). the APDL command language was used to change the unit type to a solid227 unit containing a thermal structural unit; and the type and size of the motion pair, the fixed constraints of the port plate, and the contact type in the transient structural module were set. The interface between the rotor and the port plate was set as a friction contact pair on the contact tool, with a friction coefficient of 0.2, a maximum grid element of 0.002 m, and a speed of 870 r/min. System coupling constraints were introduced, with the coupling surface being the interface between the rotor and the port plate and their internal fluid domain, and they were set for all data transmission. The data exchange time step was set to 0.0002 s. The APDL command stream statement was inserted, and the ambient temperature was set to 27 °C. The contact heat transfer coefficient between stainless steel was set to approximately 8.3 KW/(m
2·°C) under the conditions of 2.96 MPa and 220 °C [
28,
29,
30].
A 3D model of the flow distribution pair was imported into the Fluent2023 module, the boundary and interface were named, and sliding mesh technology was used to transfer data between the rotor fluid domain and the flow distribution plate fluid domain through the interface. In the Fluent settings toolbar, the boundary conditions were set, mainly including a raw seawater inlet pressure of 0.05 MPa, a raw seawater outlet pressure of 6.5 MPa, a concentrated seawater inlet pressure of 5.5 MPa, and a concentrated seawater outlet pressure of 0 MPa. The piston motion law was loaded through the user-defined function, and the dynamic grid option was activated. The temperature unit was changed to Celsius, the solution mode was selected to be a pressure-based transient mode, and the SST k-omega model was adopted for the turbulence model. Energy options were activated, the material library was loaded as seawater, and the rotor basin was set to have a sliding grid in unit area conditions, rotating along the axis at a speed of 870 r/min.
Using the number of grids as the independent variable and the mass flow rate of the raw seawater outlet as the judgment criterion, we verified the grid independence. It can be seen in
Figure 5 that, when the number of grids is less than 2,500,000, the mass flow rate of the raw seawater calculated by Fluent is large and the mass flow rate varies greatly along with the change in the number of grids. When the number of grids reaches more than 3,300,000, the mass flow of raw seawater calculated by Fluent tends to be stable. If the number of grids is increased, the calculation amount will increase and the calculation accuracy will not be significantly improved, which will consume a lot of computing resources and time. It can be determined that the simulation results are not dependent on the grid.
3.2. Numerical Calculation
3.2.1. Distribution of the Fluid–Solid Thermal Field at Rated Pressure
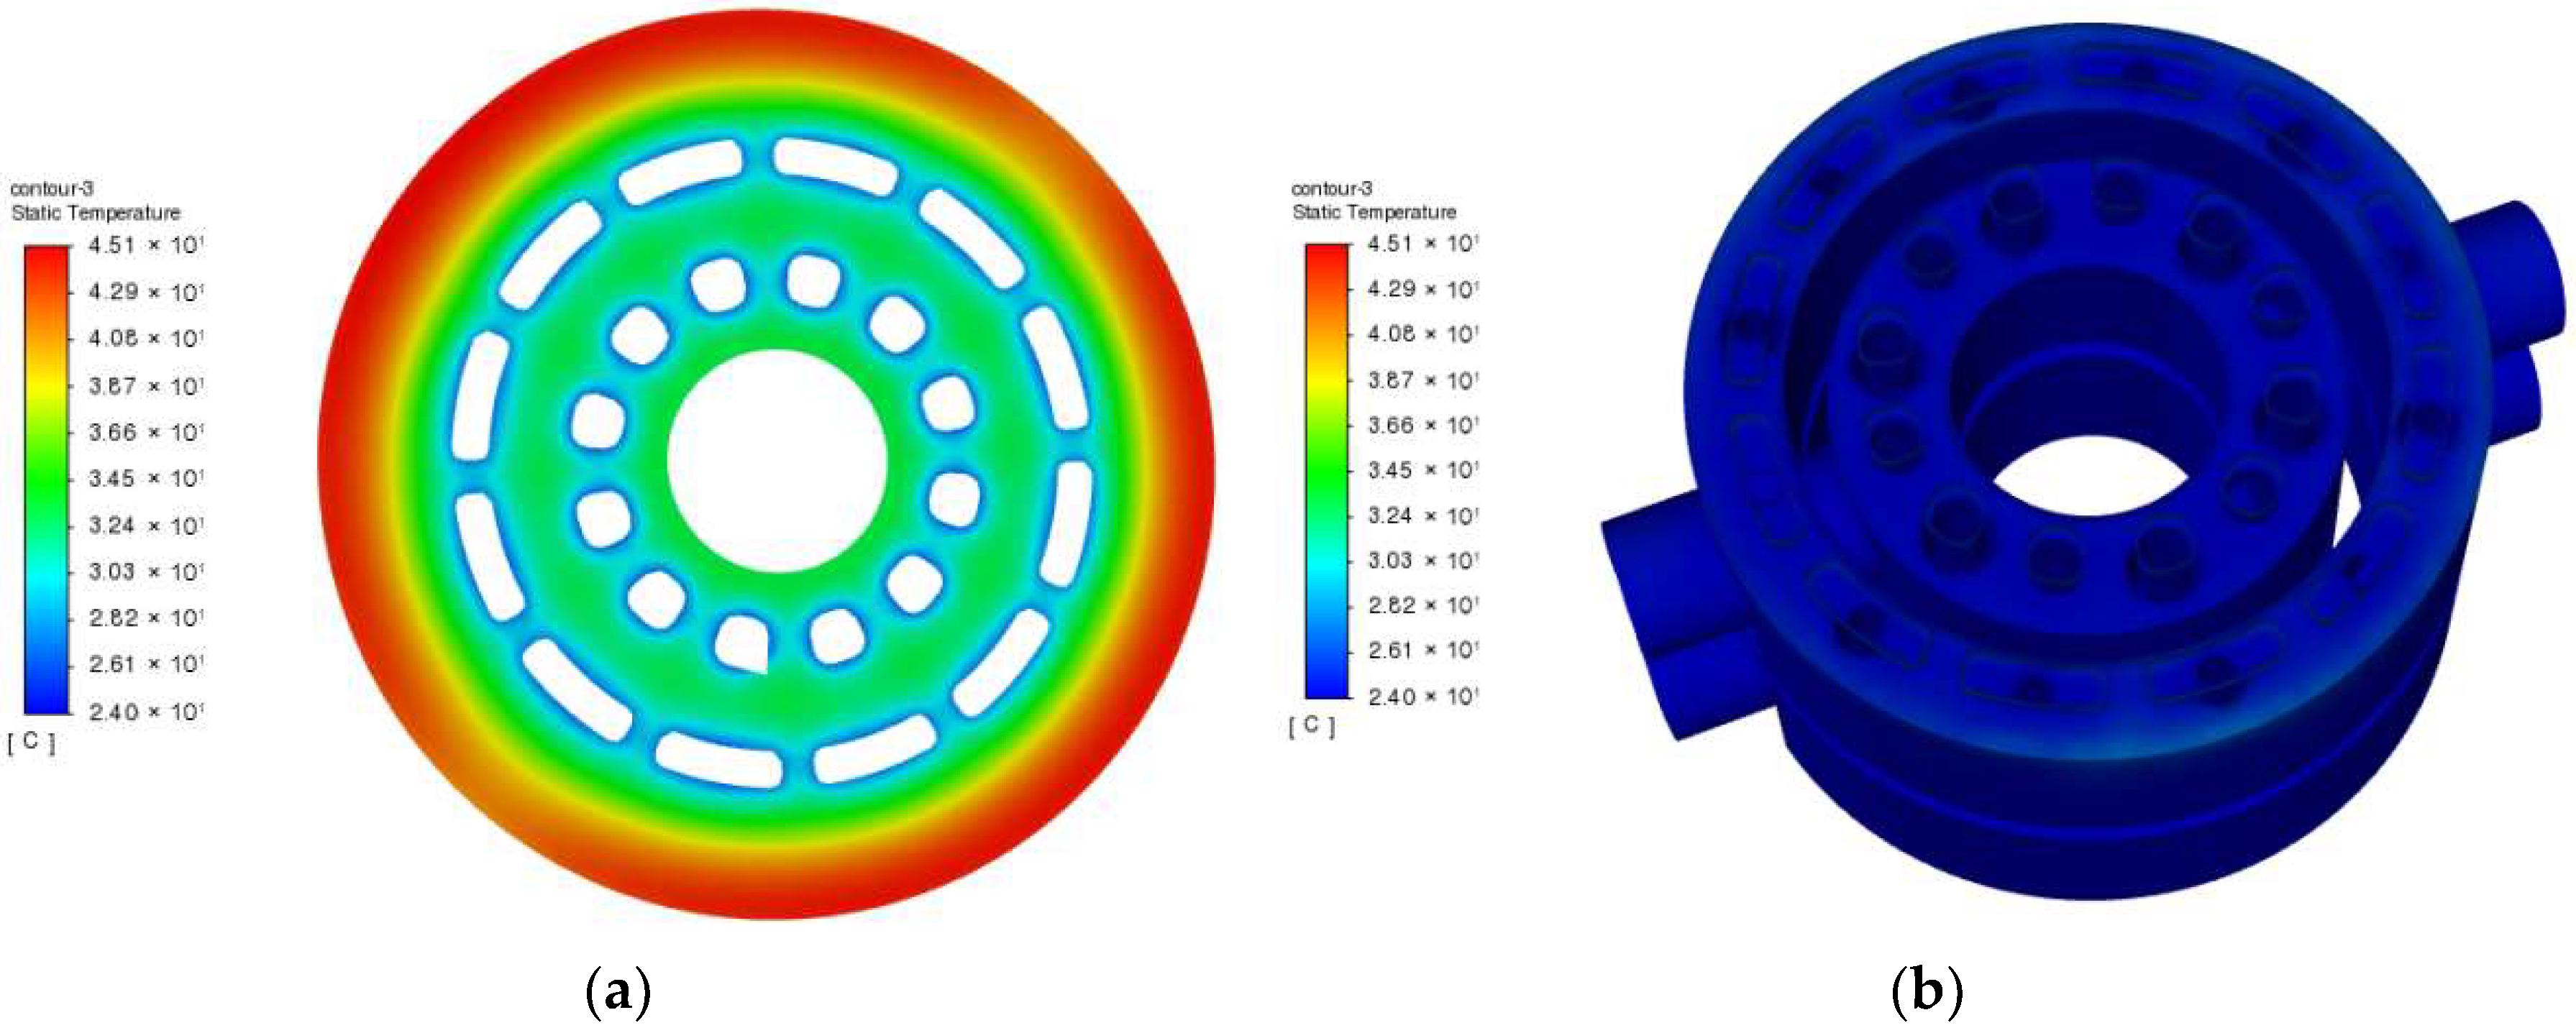
Figure 6 shows the temperature distribution of the port plate and internal seawater when the remaining compression coefficient is 1.05. From
Figure 6a, it can be seen that the highest temperature on the friction surface between the port plate and the rotor reaches 45.1 °C, with the highest temperature on the outer side. The temperature decreases as it approaches the center of the circle. This is mainly due to the rotation of the rotor relative to the port plate, with a larger outer diameter and a higher linear velocity, resulting in higher heat generation. On the annular zone of the distribution waist of the raw seawater and concentrated seawater, a low-temperature zone appears, and the closer this zone is to the distribution waist, the lower the temperature is. This is because there is a continuous flow of low-temperature seawater inside the port plate; so, its temperature is close to the temperature of seawater.
Figure 6b is a cloud map of the temperature distribution of seawater inside the port plate. It can be observed from the figure that only a small temperature change occurs near the top surface of the port plate, which is the friction surface between the port plate and the rotor. The temperature inside the fluid domain of the raw seawater pressure remains almost unchanged. Due to the high temperature on the outer side of the port plate, the concentrated seawater comes into direct contact with the high-temperature port plate, and the velocity at the boundary layer is low, causing significant changes in the pressure area of the concentrated seawater in direct contact with it. The highest temperature reaches 30.4 °C, and the temperature in the concentrated seawater discharge area is close to the initial temperature of 24 °C.
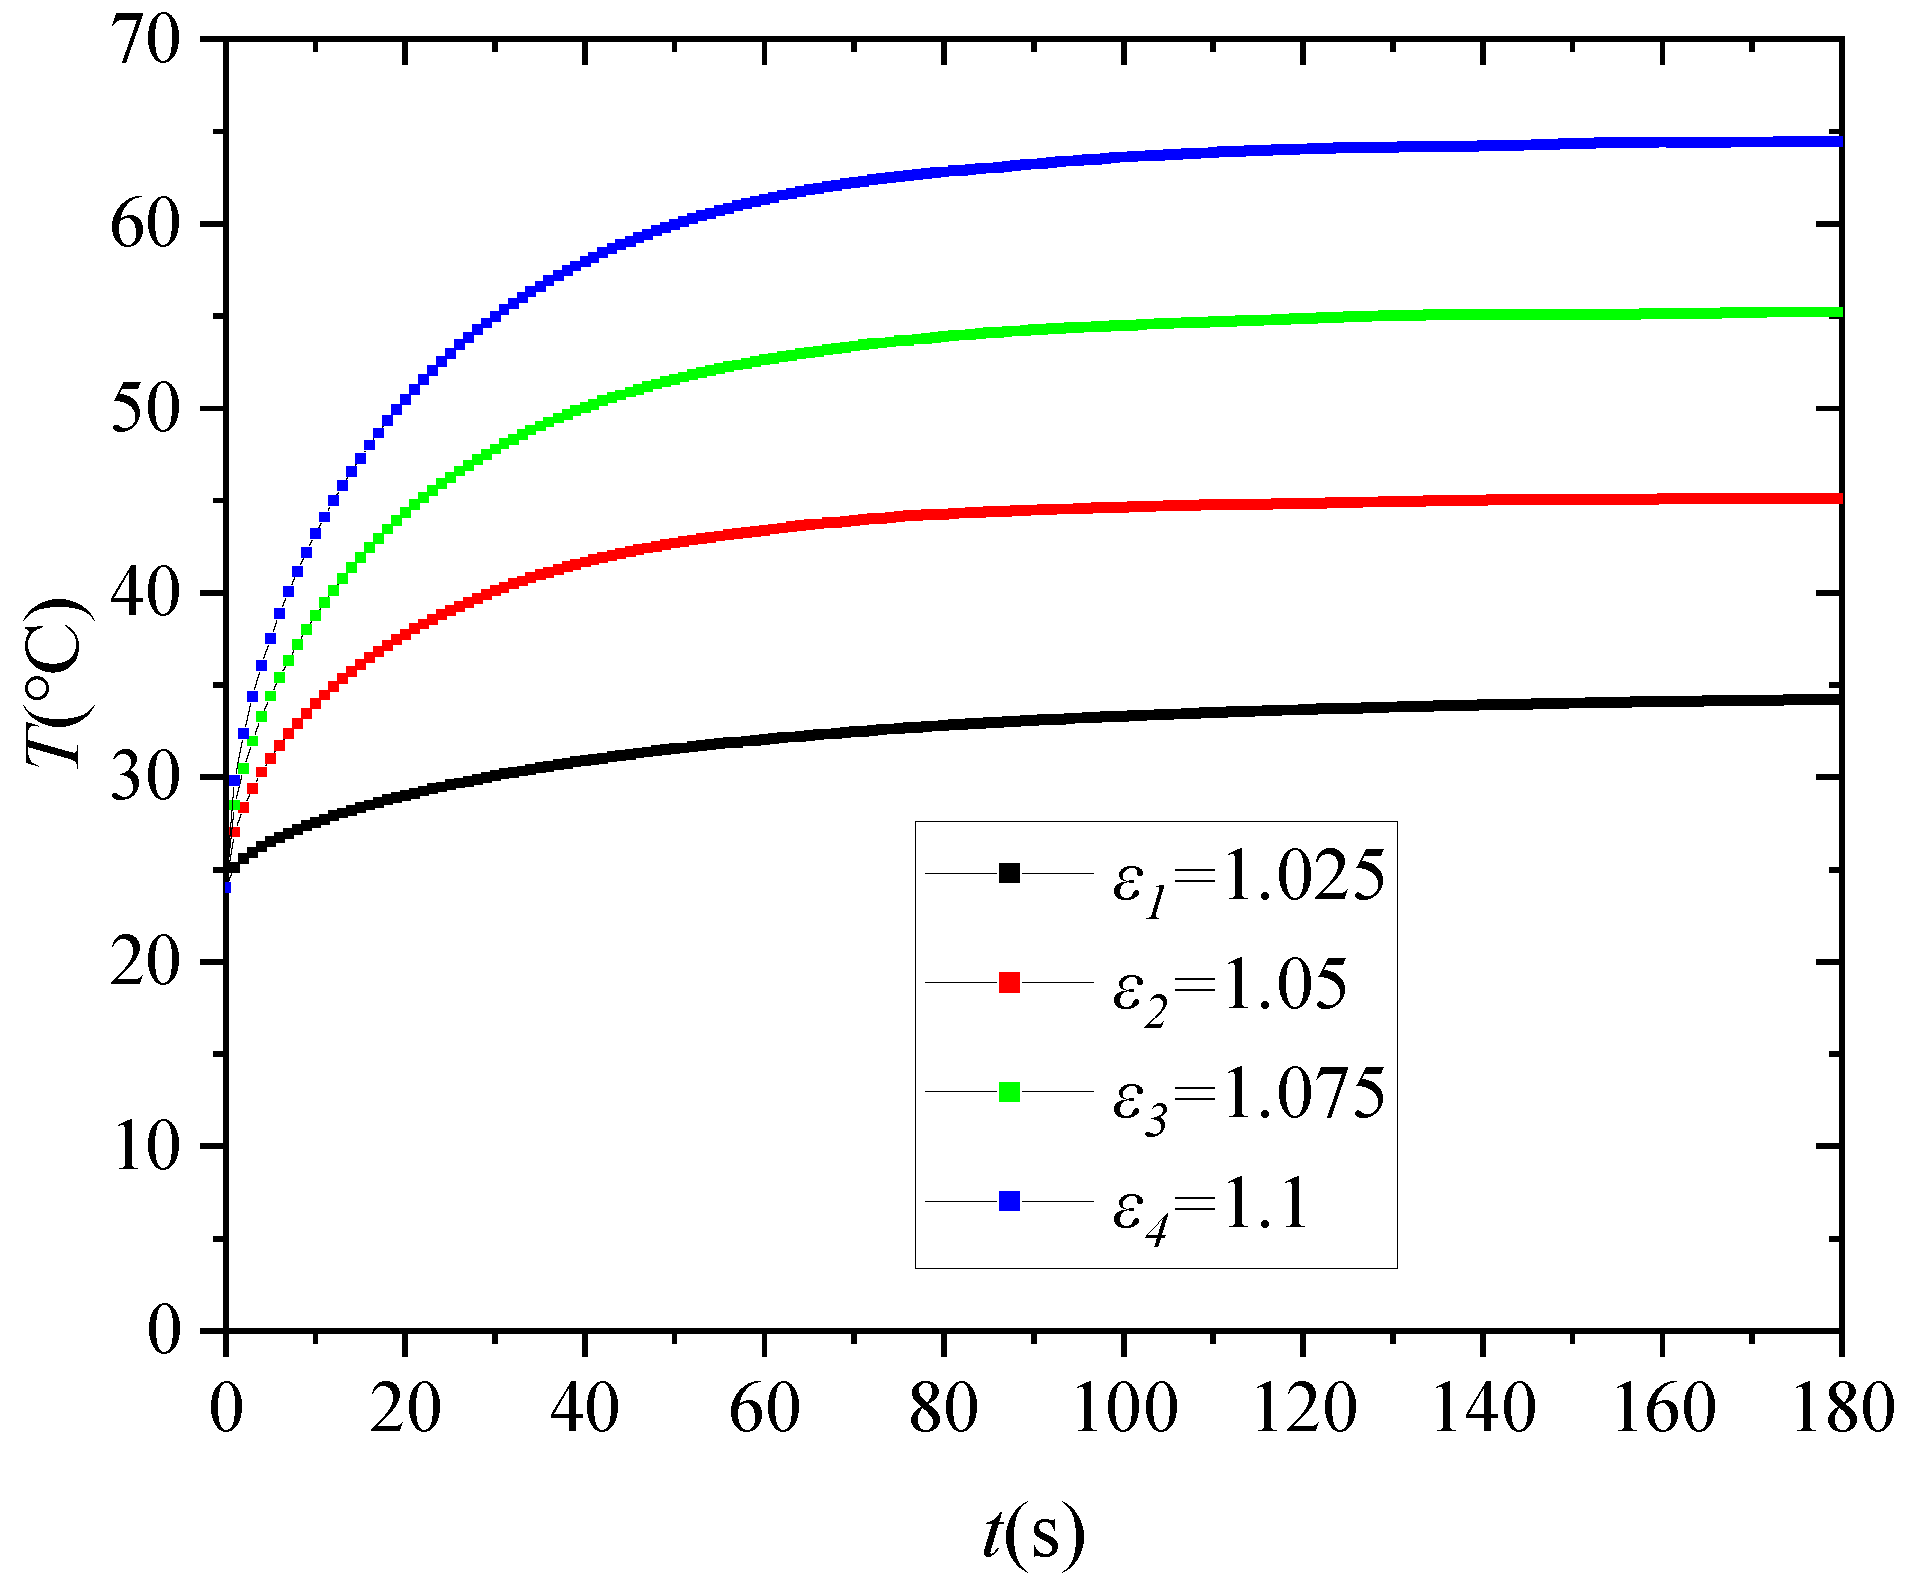
Figure 7 shows the variation pattern of the highest temperature on the friction surface of the port plate, with the remaining compression force coefficient gradually increasing from 1.025 to 1.1. It can be seen that the increase in the compression force coefficient leads to a rapid increase in the highest temperature and a faster rate of temperature rise. When the residual compression coefficient is 1.025, the temperature rise rate is only 0.36 °C/s. However, when the residual compression coefficient increases to 1.1, the temperature rise rate reaches 2 °C/s. Within 120 s, almost all remaining compression coefficients reach a thermal equilibrium state. Based on
Figure 4,
Figure 5,
Figure 6 and
Figure 7, as the residual compression force coefficient increases from 1.025 to 1.05, the temperature rises by 10.7 °C. When the coefficient increases from 1.075 to 1.1, the temperature increment is only 9.2 °C. Therefore, there is no strict linear correlation between the increment in residual compression force and the corresponding temperature increment. This is because, as the temperature increases, the temperature difference between the port plate and seawater is greater, and seawater can carry away higher heat.
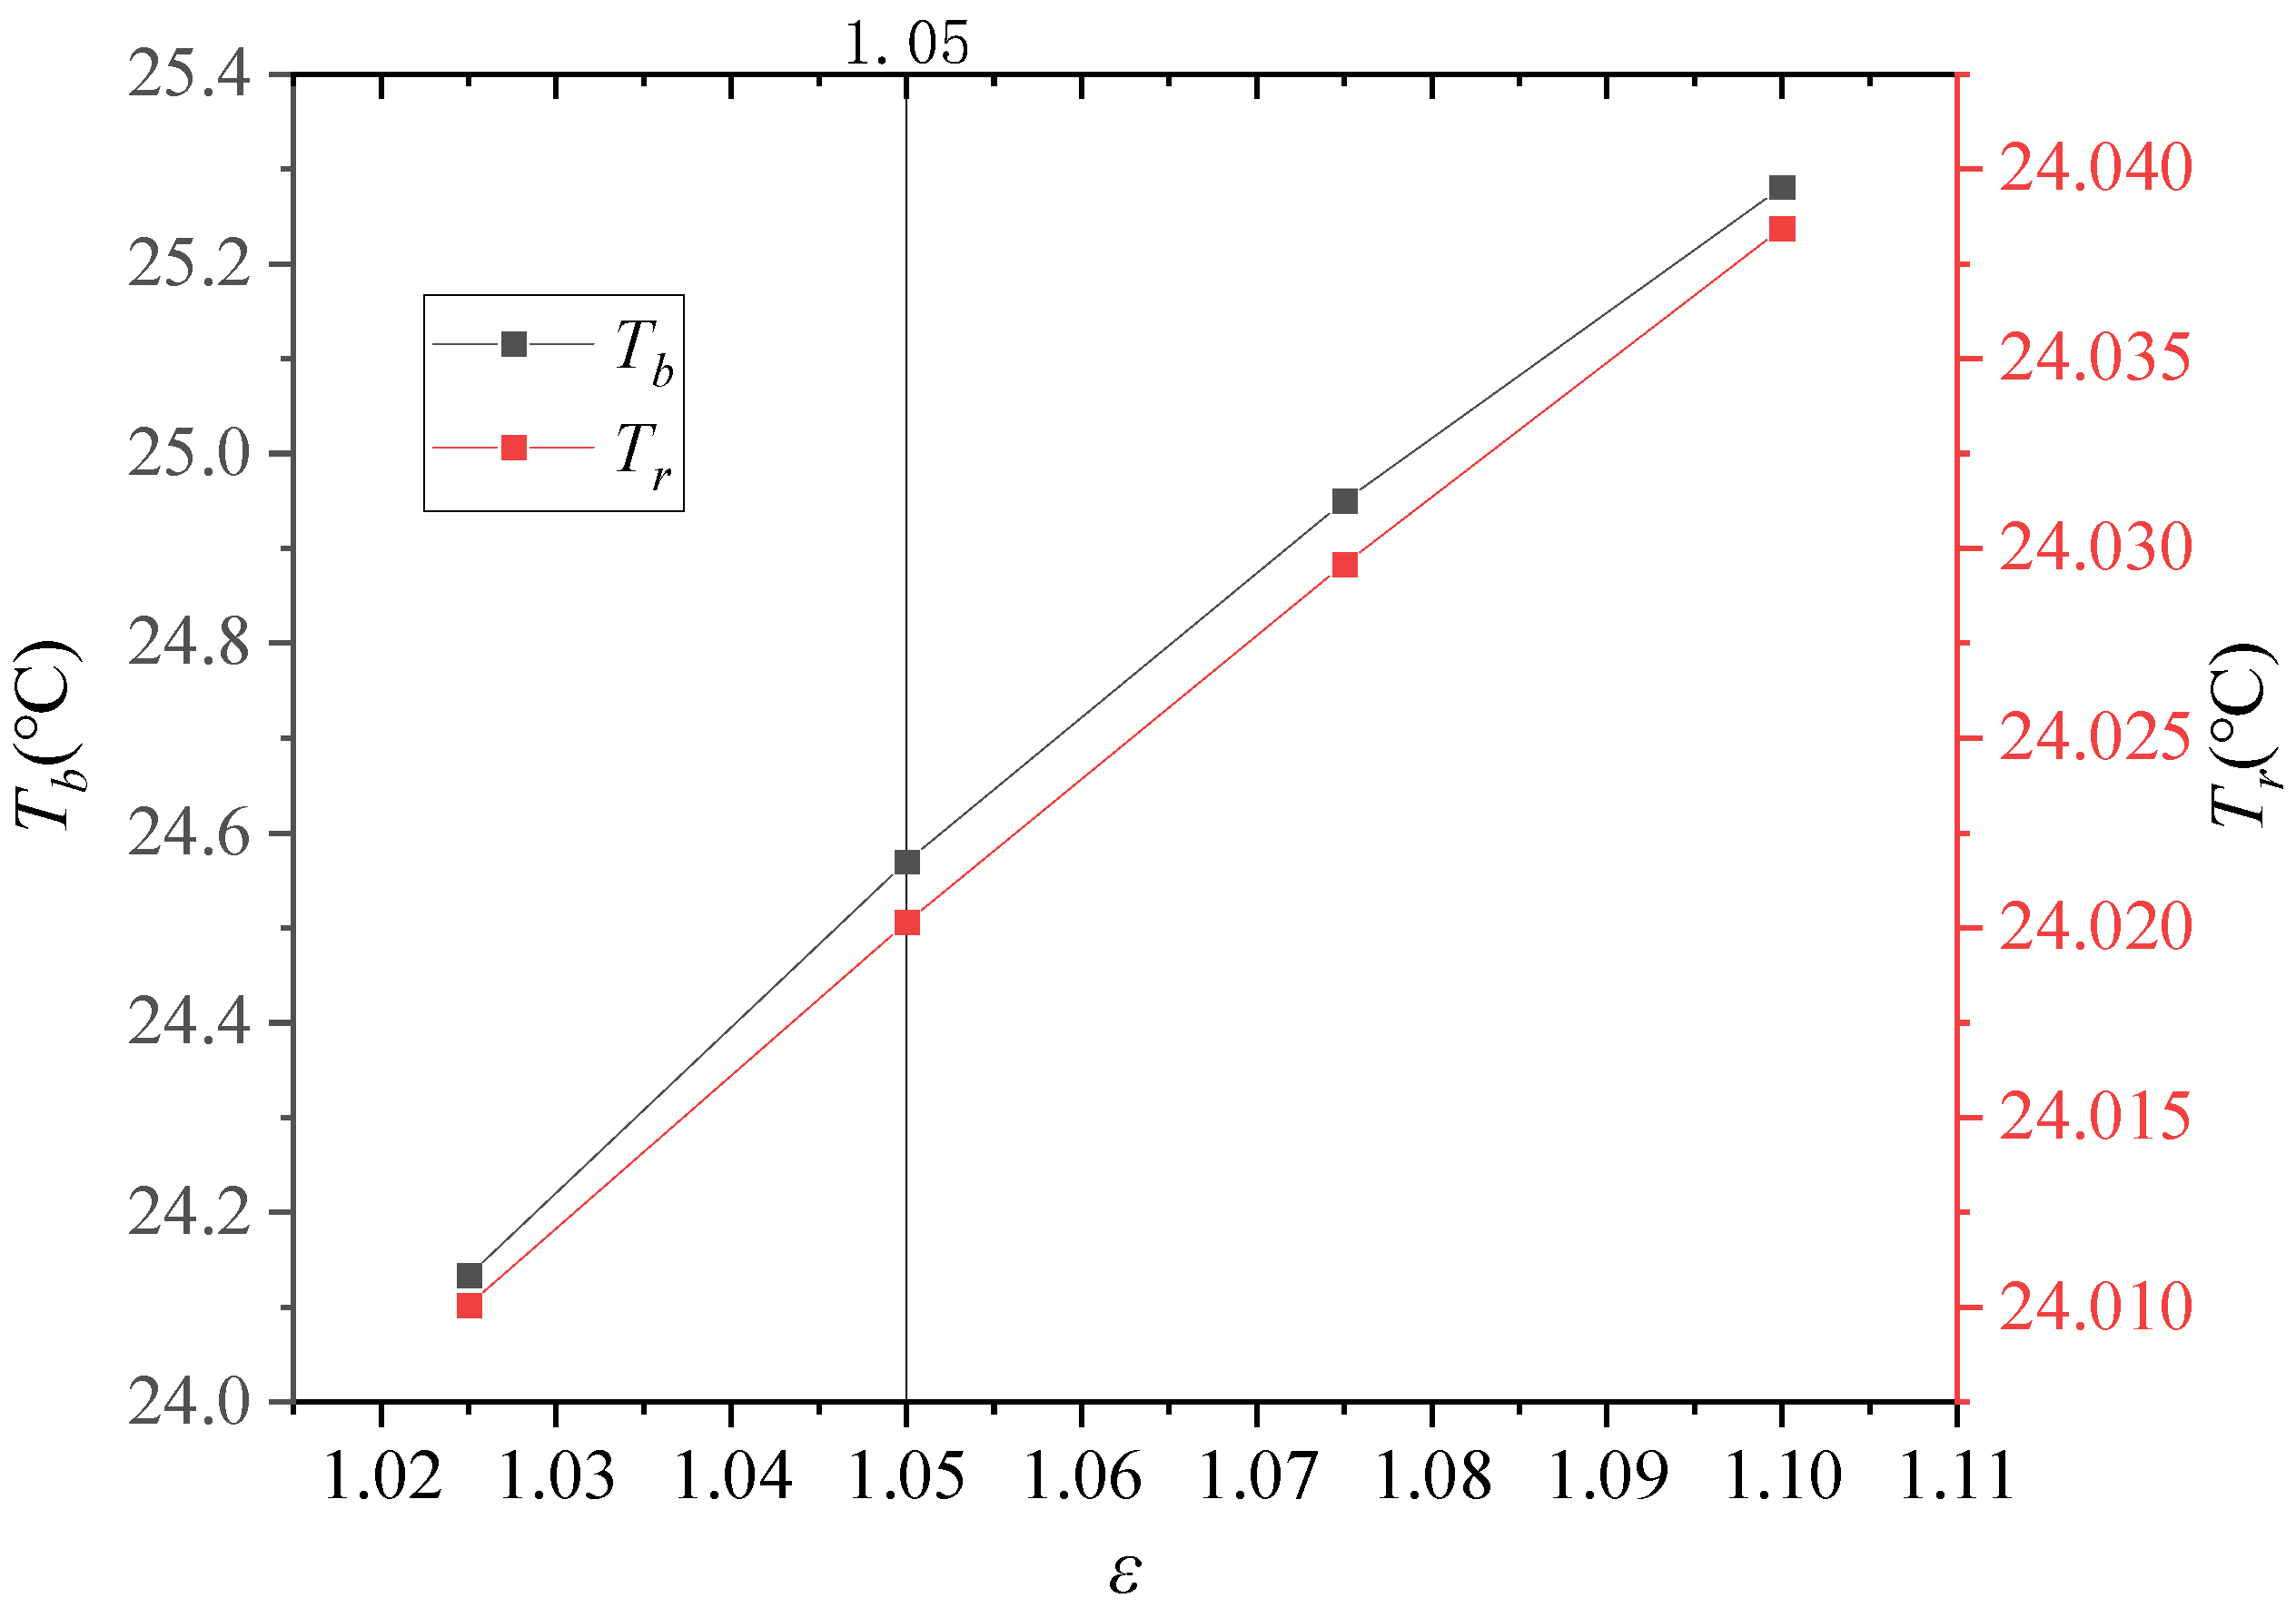
Figure 8 shows the variation pattern of the average temperature at the discharge ports of raw seawater and concentrated seawater for different residual compression force coefficients. In the figure, black represents the average temperature at the discharge port of concentrated seawater, and red represents the average temperature at the pressure outlet of raw seawater. From the graph, it can be observed that, regardless of the remaining pressure coefficient, the average temperature at the outlet of concentrated seawater is higher than the average temperature at the outlet of the raw seawater pressure, and both average temperatures increase with the increase in the remaining pressure coefficient. When the remaining compression coefficient is 1.025, the raw seawater temperature is 24.0 °C, an increase of only 0.01 °C, while the temperature of concentrated seawater is 24.1 °C.
The average temperature at the outlet of concentrated seawater reaches a maximum of 25.3 °C, while the maximum temperature at the raw seawater pressure outlet is only 24.0 °C. There are two main reasons for this. The first reason is that the raw seawater fluid domain is located near the center of the inner ring, while the concentrated seawater fluid domain is located in the outer ring. The temperature on the outer side of the port plate is significantly higher than that on the inner side, and the temperature difference between concentrated seawater and the port plate is larger, resulting in a higher heat exchange intensity. The second reason is that the flow rate and velocity of raw seawater are higher than those of concentrated seawater, which means that more fluids participate in convective heat transfer in raw seawater, and therefore, less heat is carried away by the unit volume rate of raw seawater.
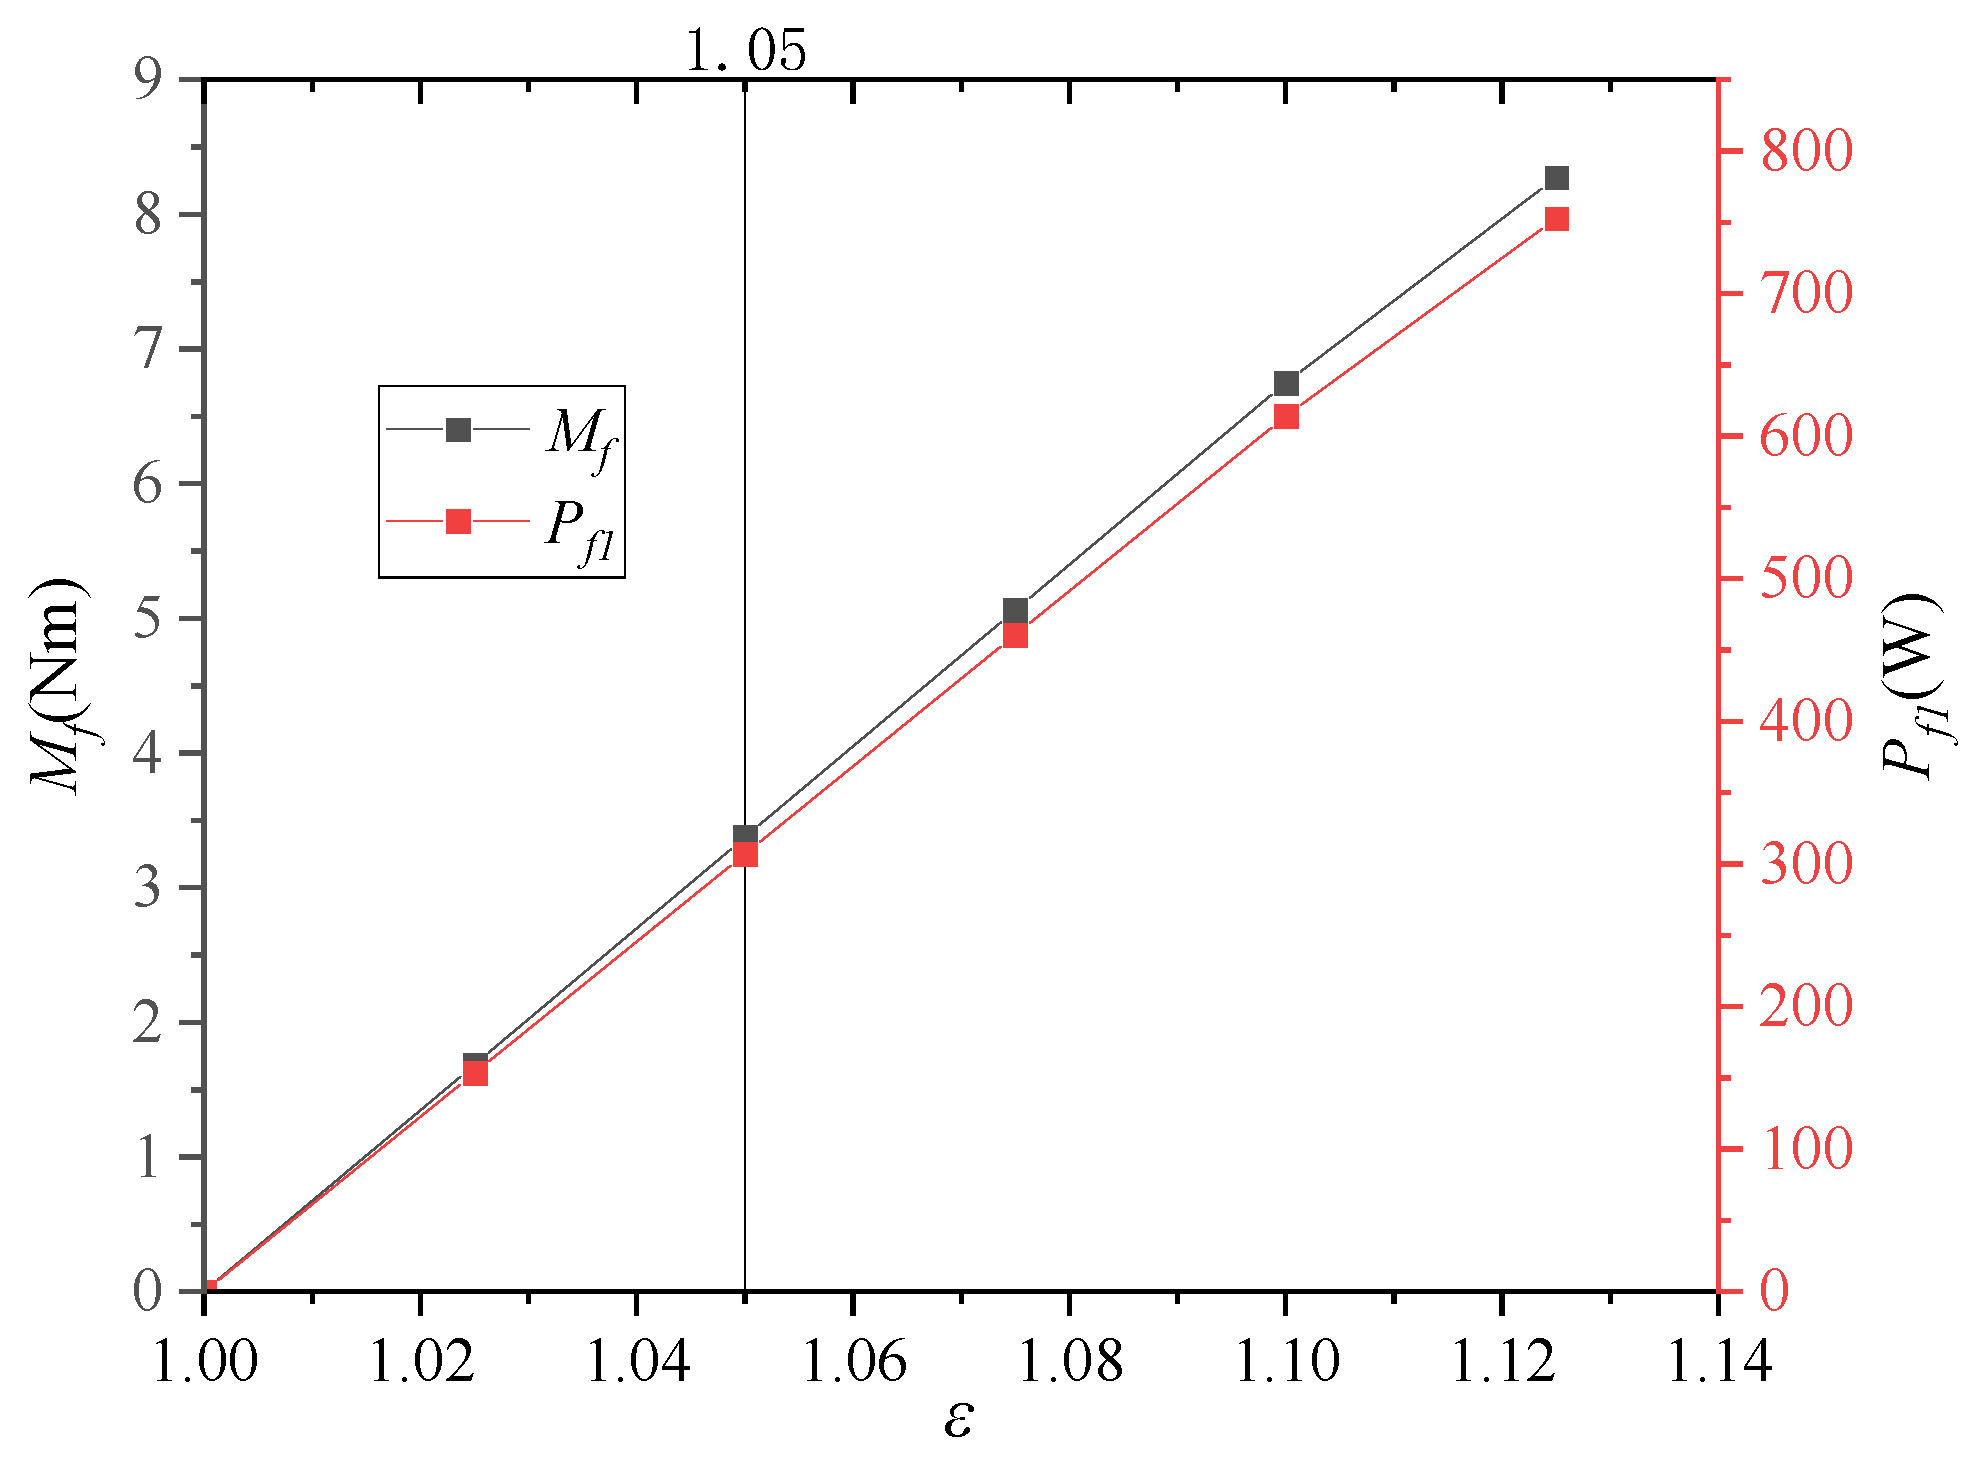
Figure 9 describes the relationship between the friction torque and power loss of the port plate pair and the residual compression force coefficient. As the residual compression force coefficient increases, the friction torque and power loss increase linearly. When the residual compression force coefficient reaches 1.05, the power loss is 307 W, and when the residual pressure force coefficient increases to 1.1, the power loss reaches 615 W. Frictional power represents wasted power. The higher the frictional power, the lower the overall efficiency of the pump. Therefore, reducing frictional power is always desirable.
3.2.2. Fluid–Solid Thermal Field Distribution at Maximum Pressure
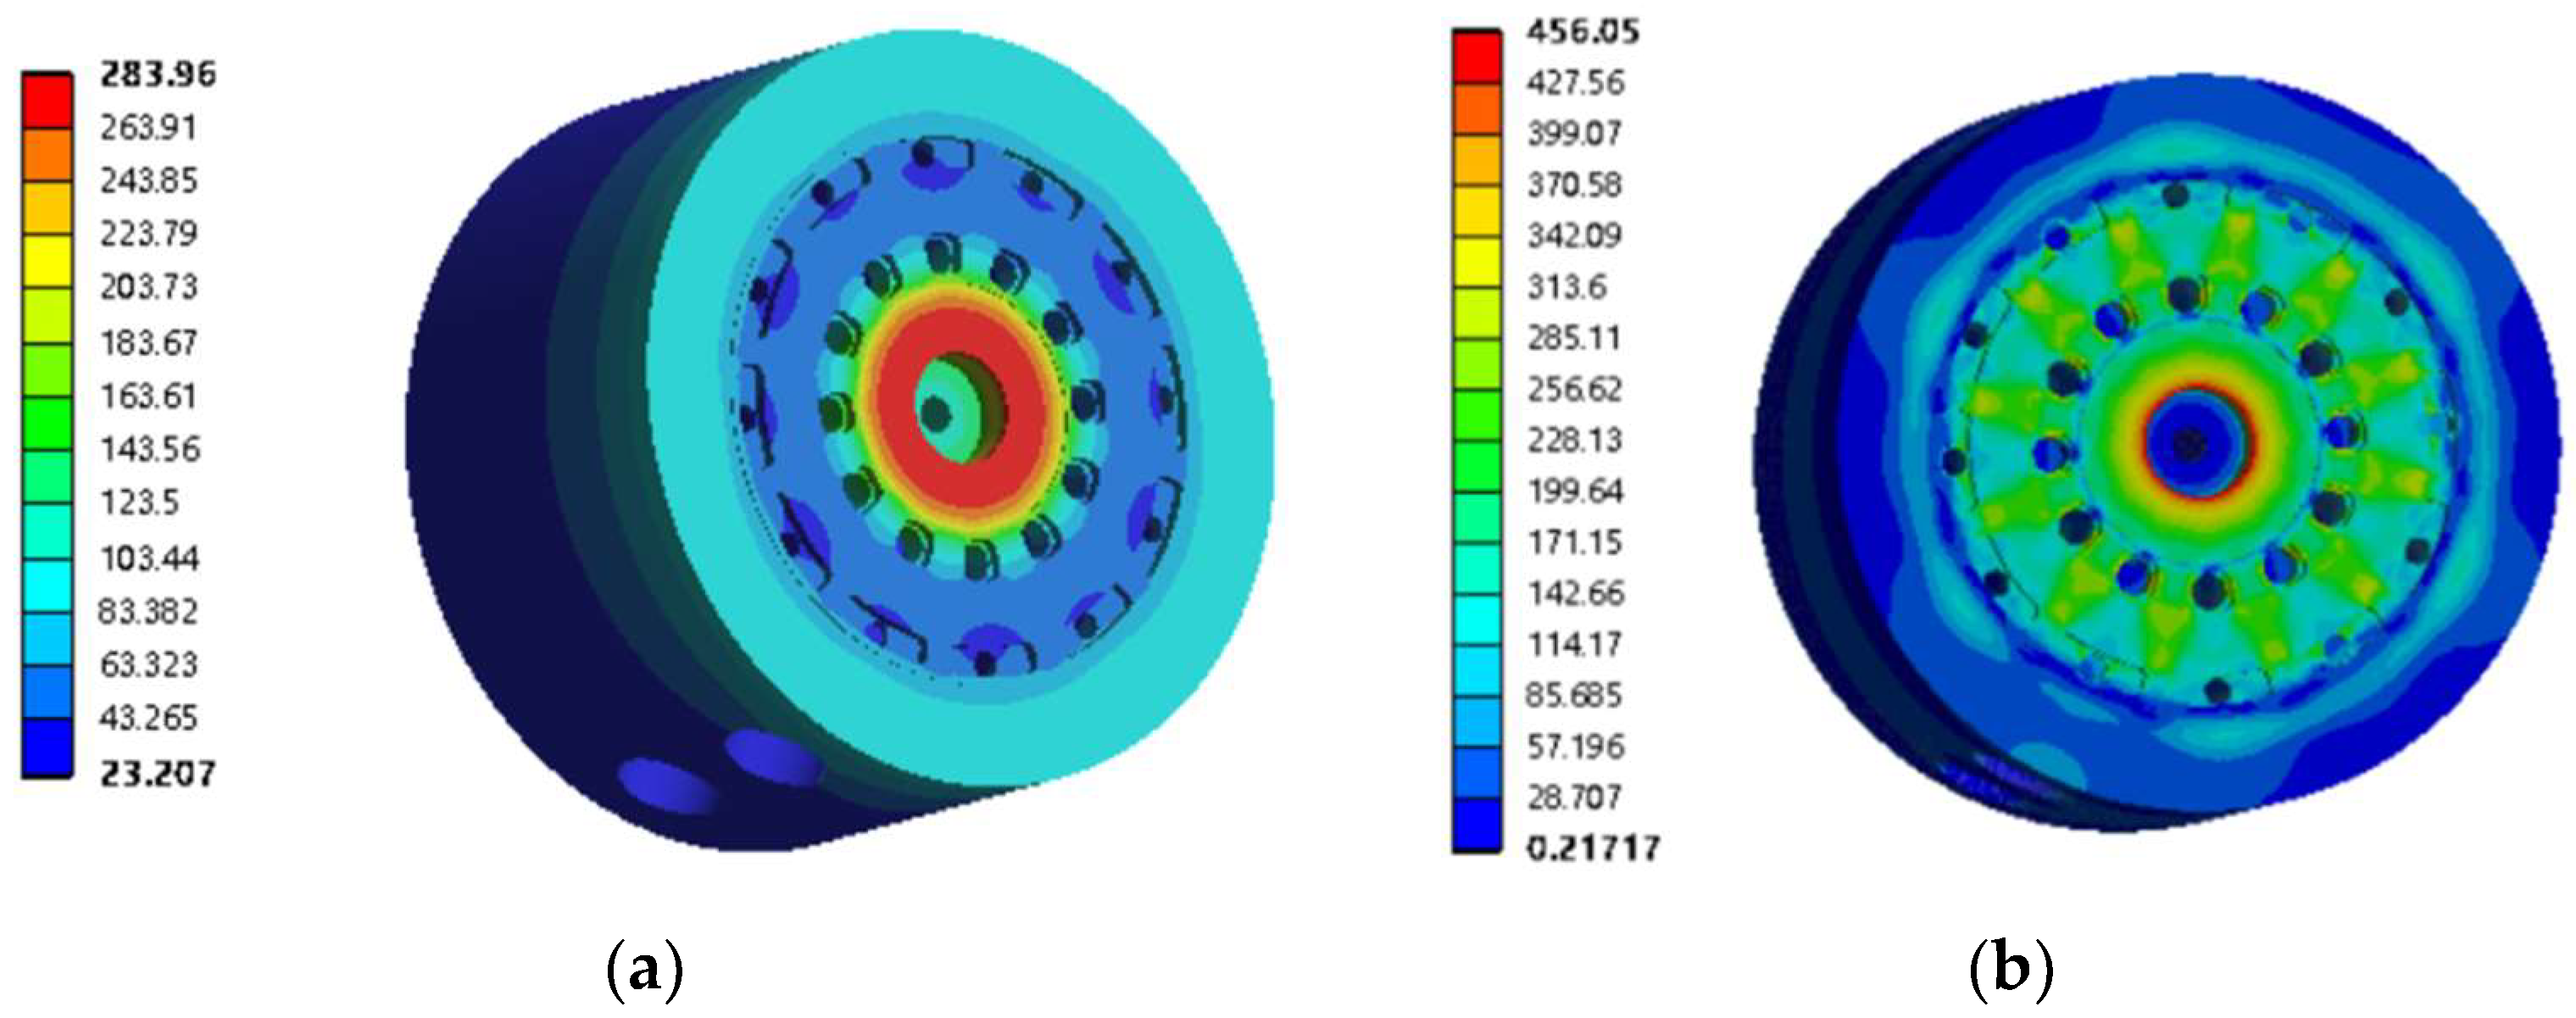
Figure 10 shows the temperature distribution cloud map and equivalent thermal stress cloud map of the port plate at the highest working pressure with a residual compression force coefficient of 1.05. From
Figure 10a, it can be seen that the highest temperature occurs in the sealing strip inside the port plate, reaching 248 °C, and the temperature gradually decreases radially outward. The temperature near the waist of the raw seawater distribution is significantly lower than the temperature of the inner sealing strip. There are two reasons for this phenomenon. First, the temperature of the raw seawater entering the distribution waist is much lower than the temperature of the port plate, causing strong convective heat transfer. The raw seawater carries away some of the heat, resulting in a local temperature decrease. Second, due to the pressure difference driving the flow leakage inward from the waist of the raw seawater distribution, higher power loss and heat generation occur, and the heat flow direction is radially inward. The low-temperature zone appears in the middle sealing strip between the raw seawater distribution waist and the concentrated seawater distribution waist, mainly because the pressure difference between the concentrated seawater and the raw seawater is lower than the pressure difference between the inner and outer sealing strips, resulting in smaller leakage and lower heating power. On the outer sealing strip, the temperature gradually increases radially outward, reaching a maximum temperature of 108 °C. However, the maximum temperature is much lower than that of the inner sealing strip, mainly because the pressure of concentrated seawater is lower than that of raw seawater, resulting in less energy loss caused by leakage flow.
Due to the installation limitations of the port plate, excessive temperature changes inevitably result in local thermal stress concentration, and the magnitude of temperature and stress directly affects the service life of the port plate. Therefore, it is necessary to conduct a stress analysis on the port plate.
Figure 10b shows the stress distribution cloud map of the port plate. It can be observed from the figure that there is a periodic high thermal stress area on the middle sealing strip. The temperature inside the raw seawater distribution waist and outside the concentrated seawater distribution waist is high, and the material undergoes thermal expansion and compression toward the middle. However, the metal wall thickness at the distribution waist is relatively thin, and the distribution waist undergoes slight deformation to release some thermal stress. However, the transition area is a completely solid domain. Therefore, the local thermal stress increases to 290 MPa. The highest thermal stress occurs on the inner sealing strip, mainly due to it having the highest temperature and large temperature gradient, as well as limitations in the installation space near the flow distribution waist and flow distribution. When 2507 stainless steel is exposed to temperatures at or near 475 °C for a long duration, spinodal decomposition of the ferrite phase occurs, leading to the formation of Cr-rich α’ phase and consequent material embrittlement, known as “475 °C embrittlement”. The yield strength of 2507 is approximately 550 MPa at room temperature. Above 550 °C, the strength drops sharply to 350 MPa. Under the short-term maximum operating pressure, a residual compression force coefficient of 1.05 satisfies the short-term service requirements and provides sufficient time for system alarm and adjustment.
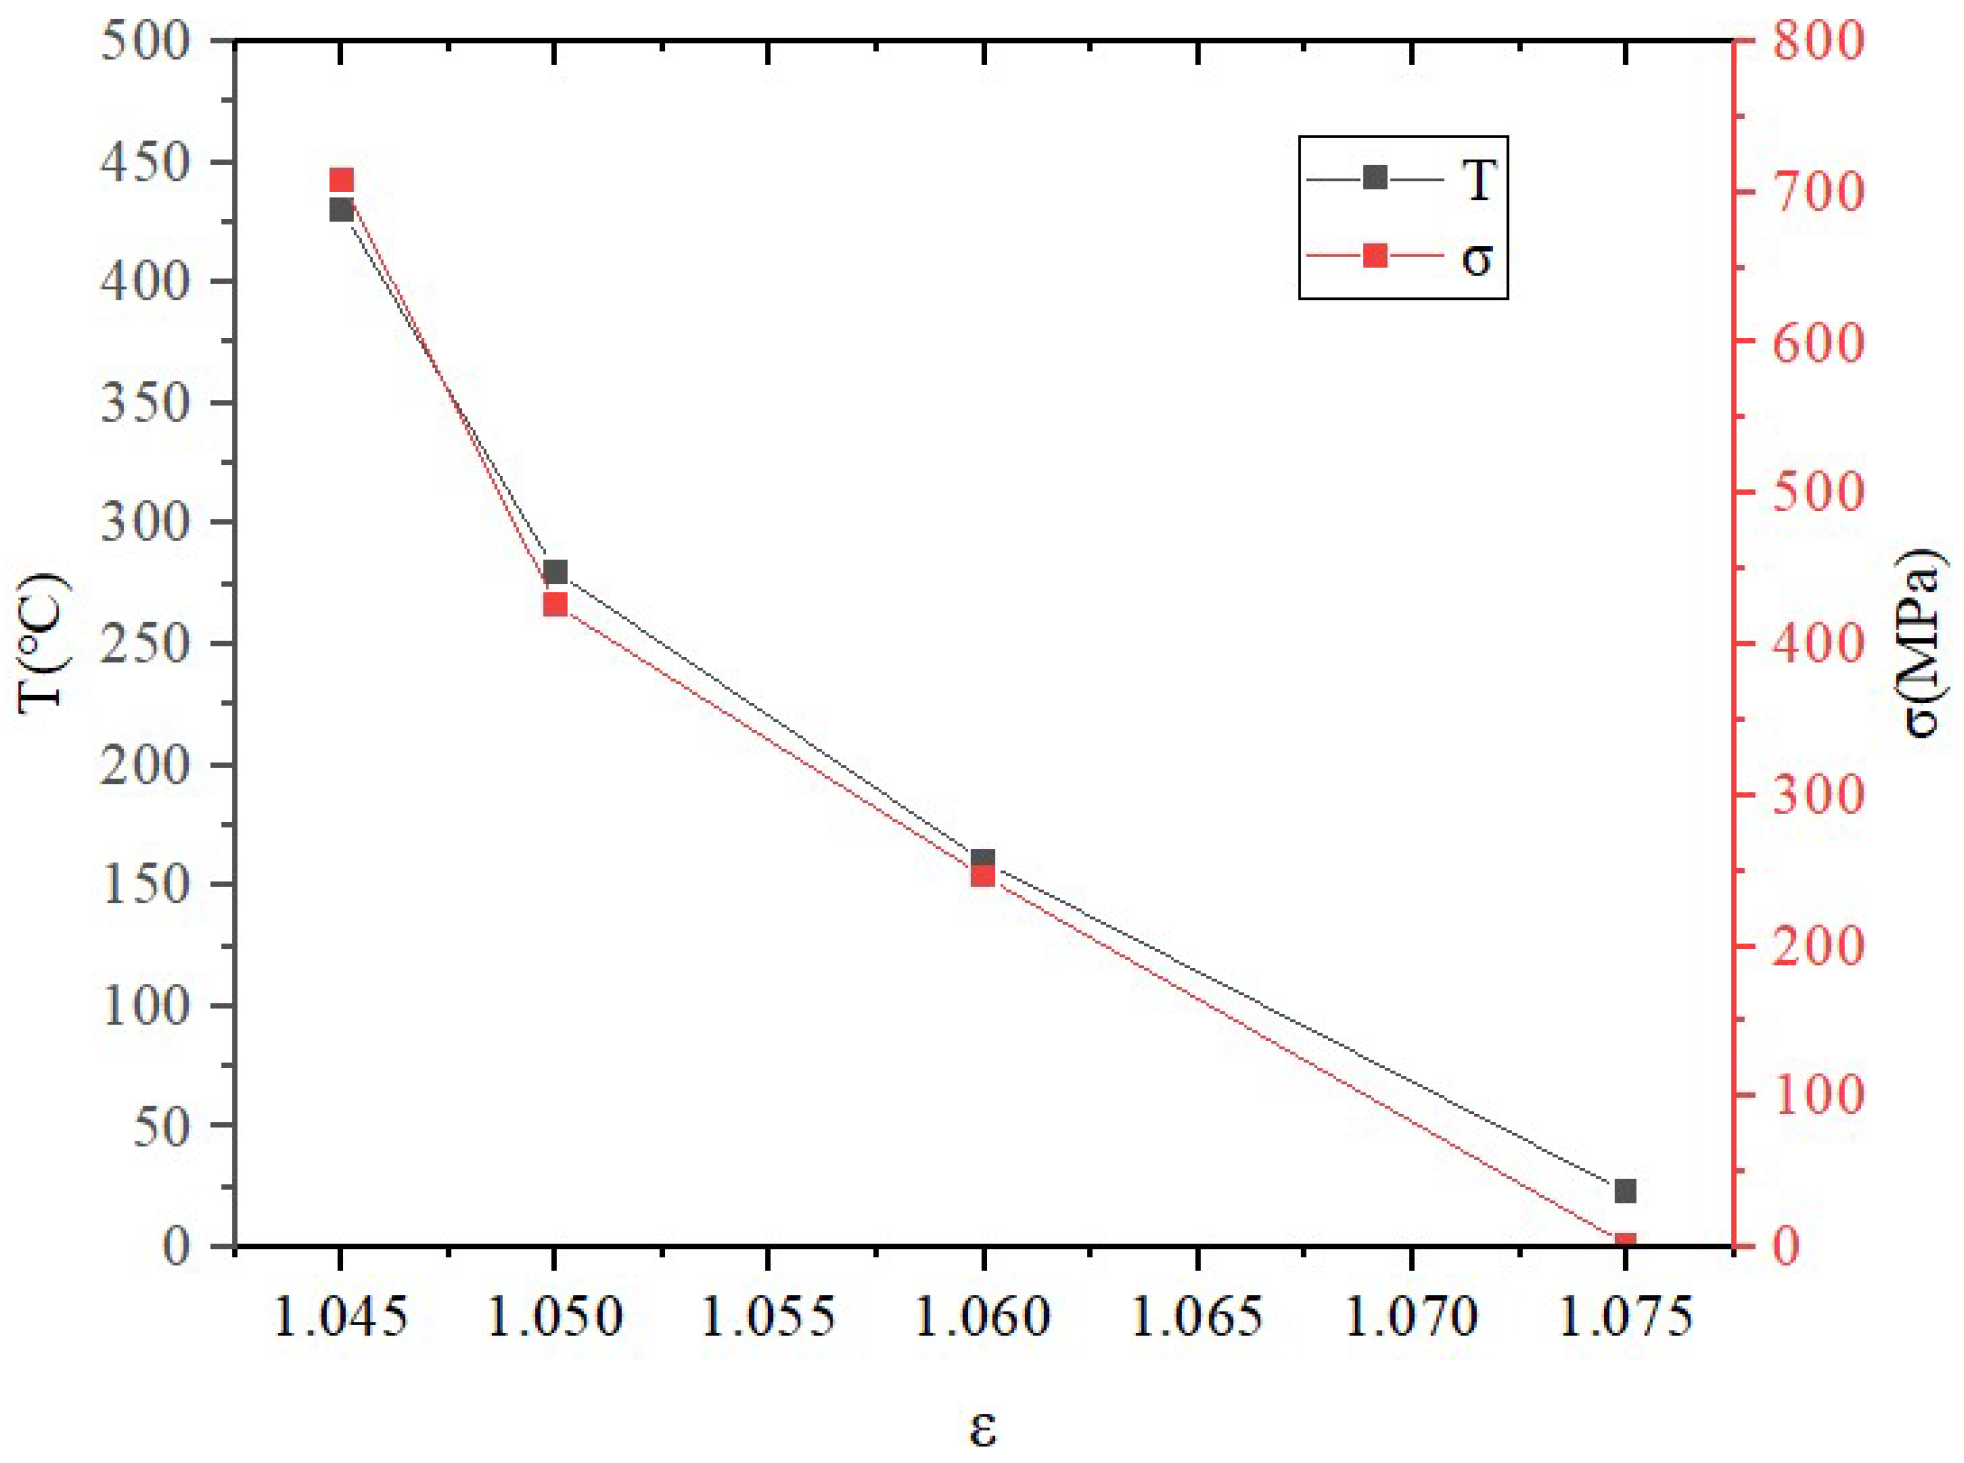
From
Figure 11, it can be observed that the temperature and thermal stress changes in the port plate pair caused by the decrease in the residual compression force coefficient are very drastic. Each 0.01 increase in the residual compression force coefficient leads to a temperature reduction of approximately 36%. In the operation of integrated motor pumps, when entering the short-term maximum working pressure condition, if the residual pressure coefficient of the port plate pair is too small, it will cause the temperature of the port plate pair to be too high. When breaking away from the maximum working pressure and entering the rated working pressure, due to the presence of residual clamping force, the gap between the flow port plate pairs disappears, and the flow port plate pairs enter a dry friction state. Due to the high local temperature and thermal stress of the flow port plate pairs at this time, this can easily cause the phase transformation of the metal structure, cause the port plate and rotor to bite each other, and reduce the service life of the integrated motor pump.
4. Discussion
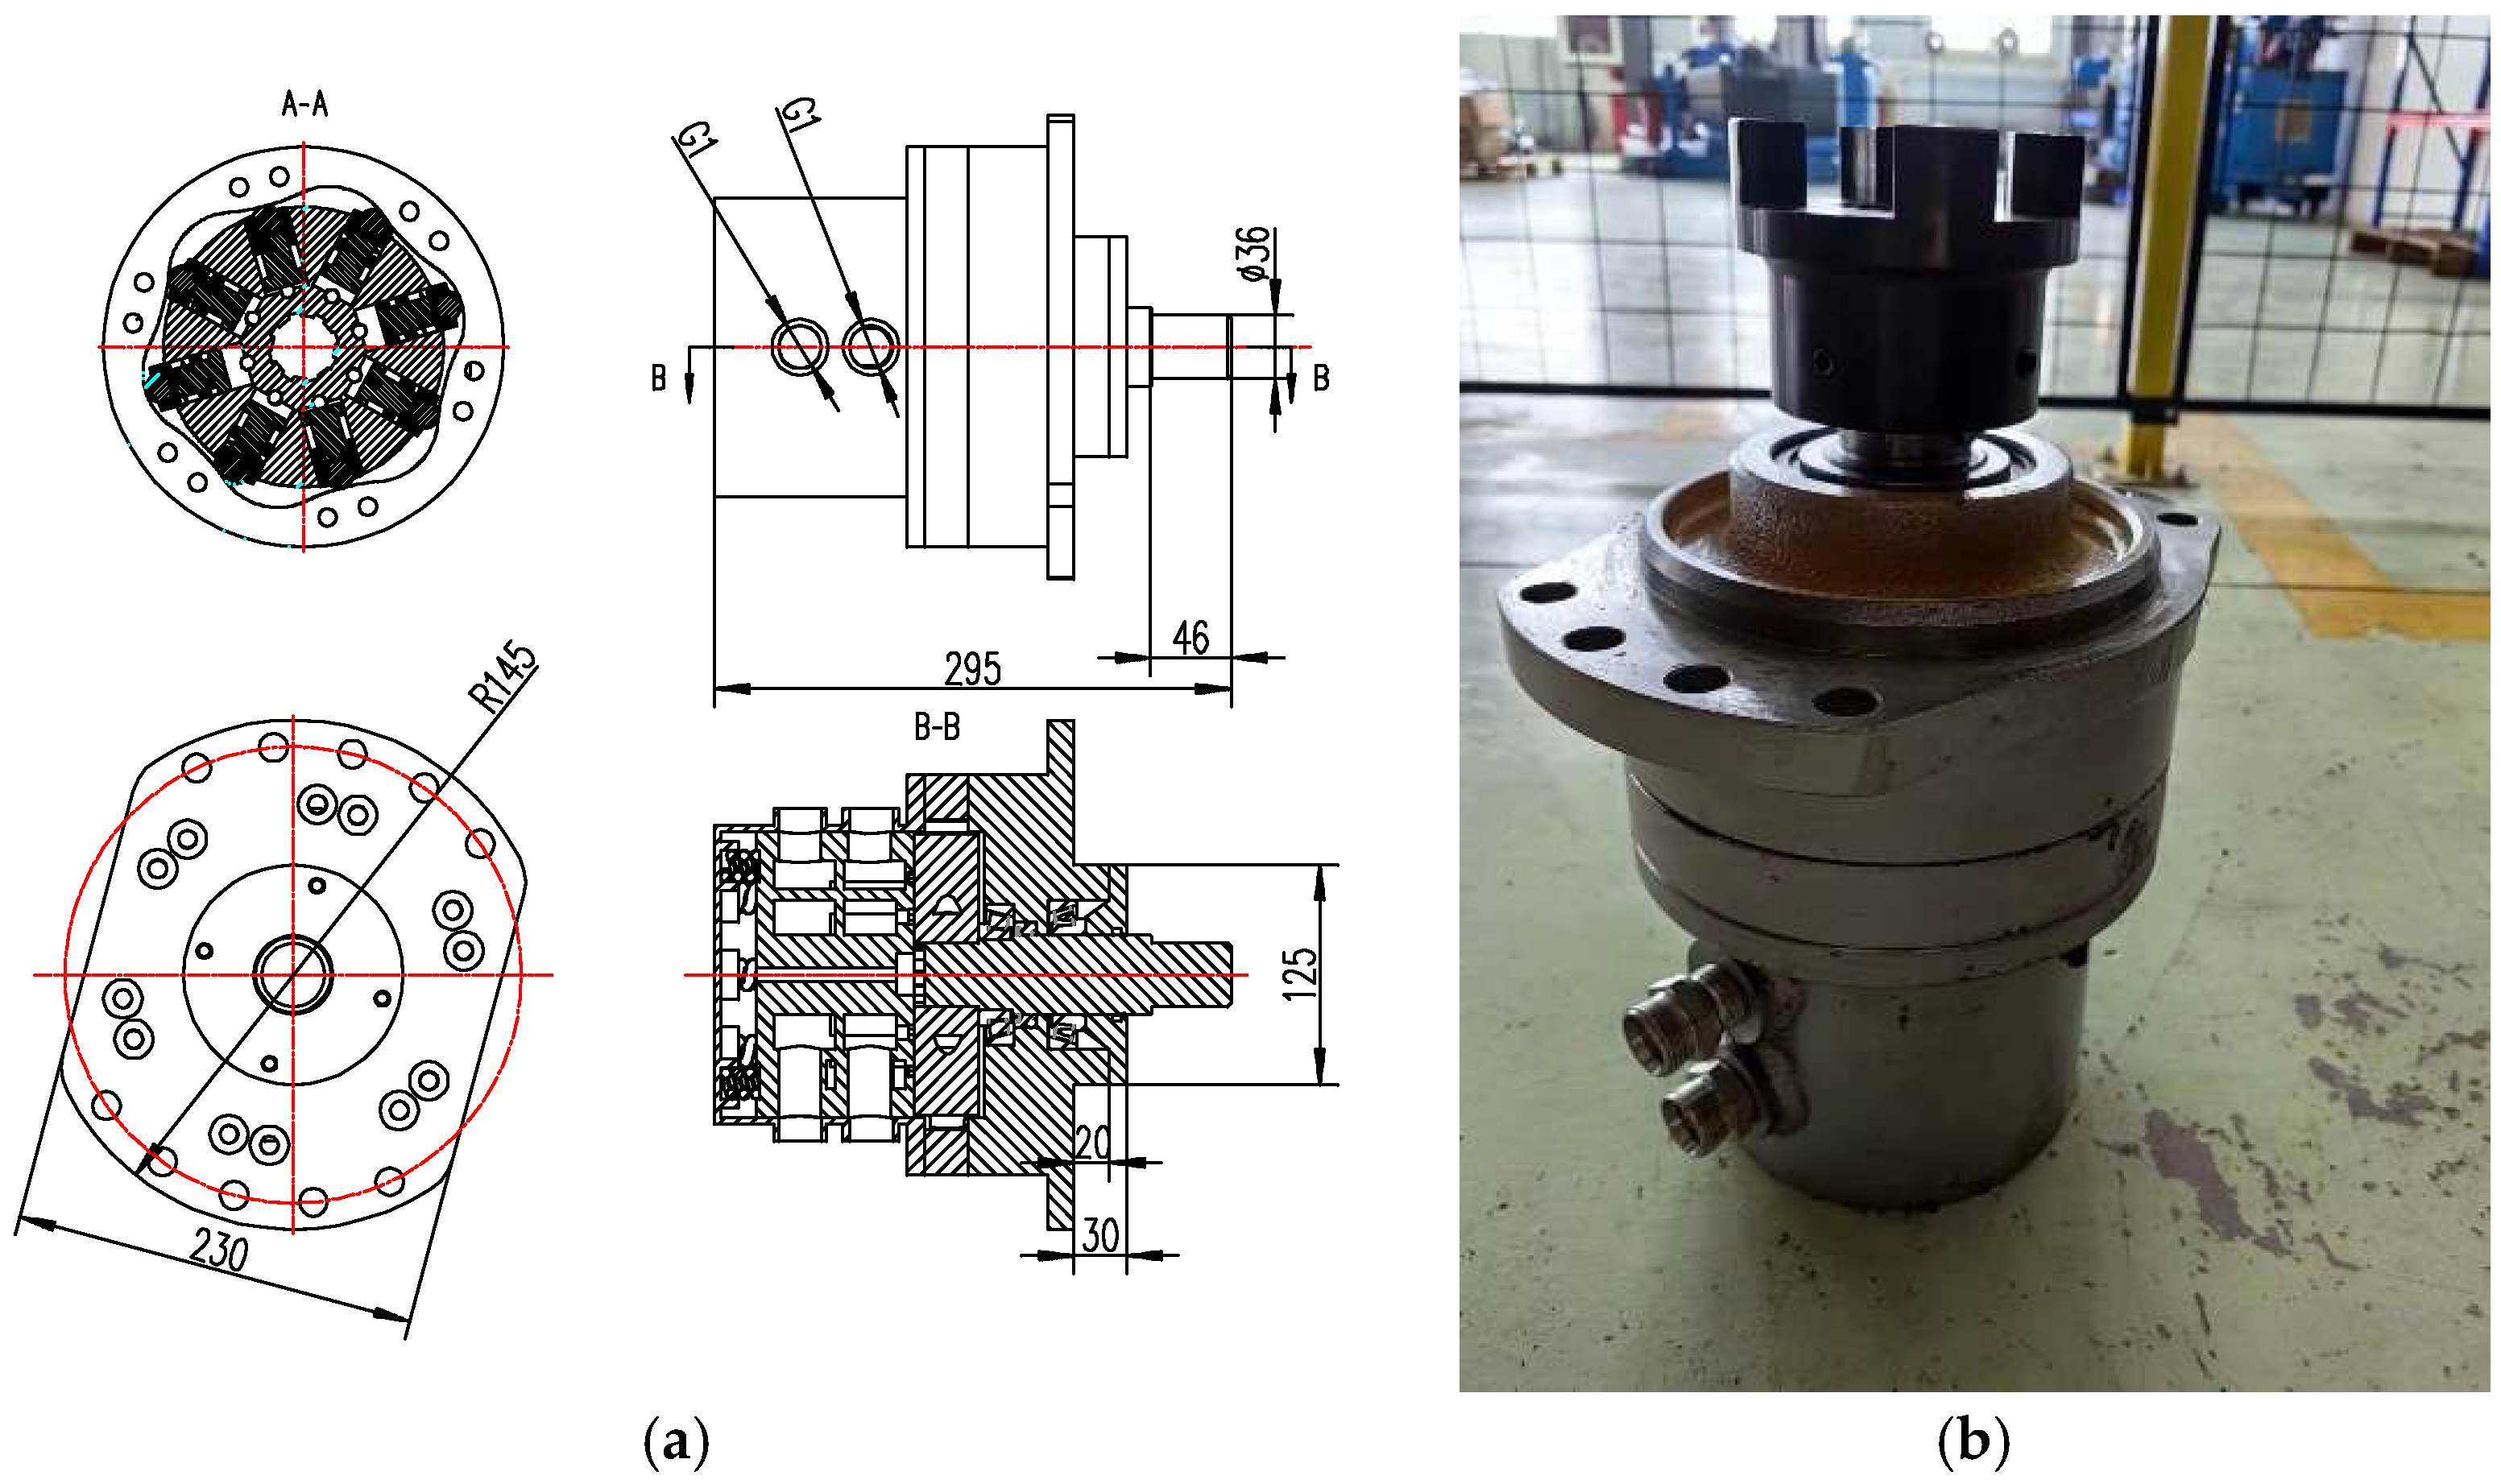
Figure 12 is a two-dimensional assembly diagram of an integrated seawater desalination power recovery motor pump device prototype, mainly including a drive shaft, right end cover, housing, guide rail, rear end cover, rotor, roller, guide sleeve, roller sleeve, piston, port plate, and compression spring. The roller, roller sleeve, and piston form a piston component, and the drive shaft is driven by a half-shaft. The front section of the shaft is connected to the coupling, speed and torque sensor, and motor through a flat key. The rear end is a splined shaft that fits the rotor assembly. The front cover is used to fix the bearings in place and install mechanical seals, playing a role in dust prevention, sealing, and other functions. The pump body is connected to the guide rail and rear cover by bolts.
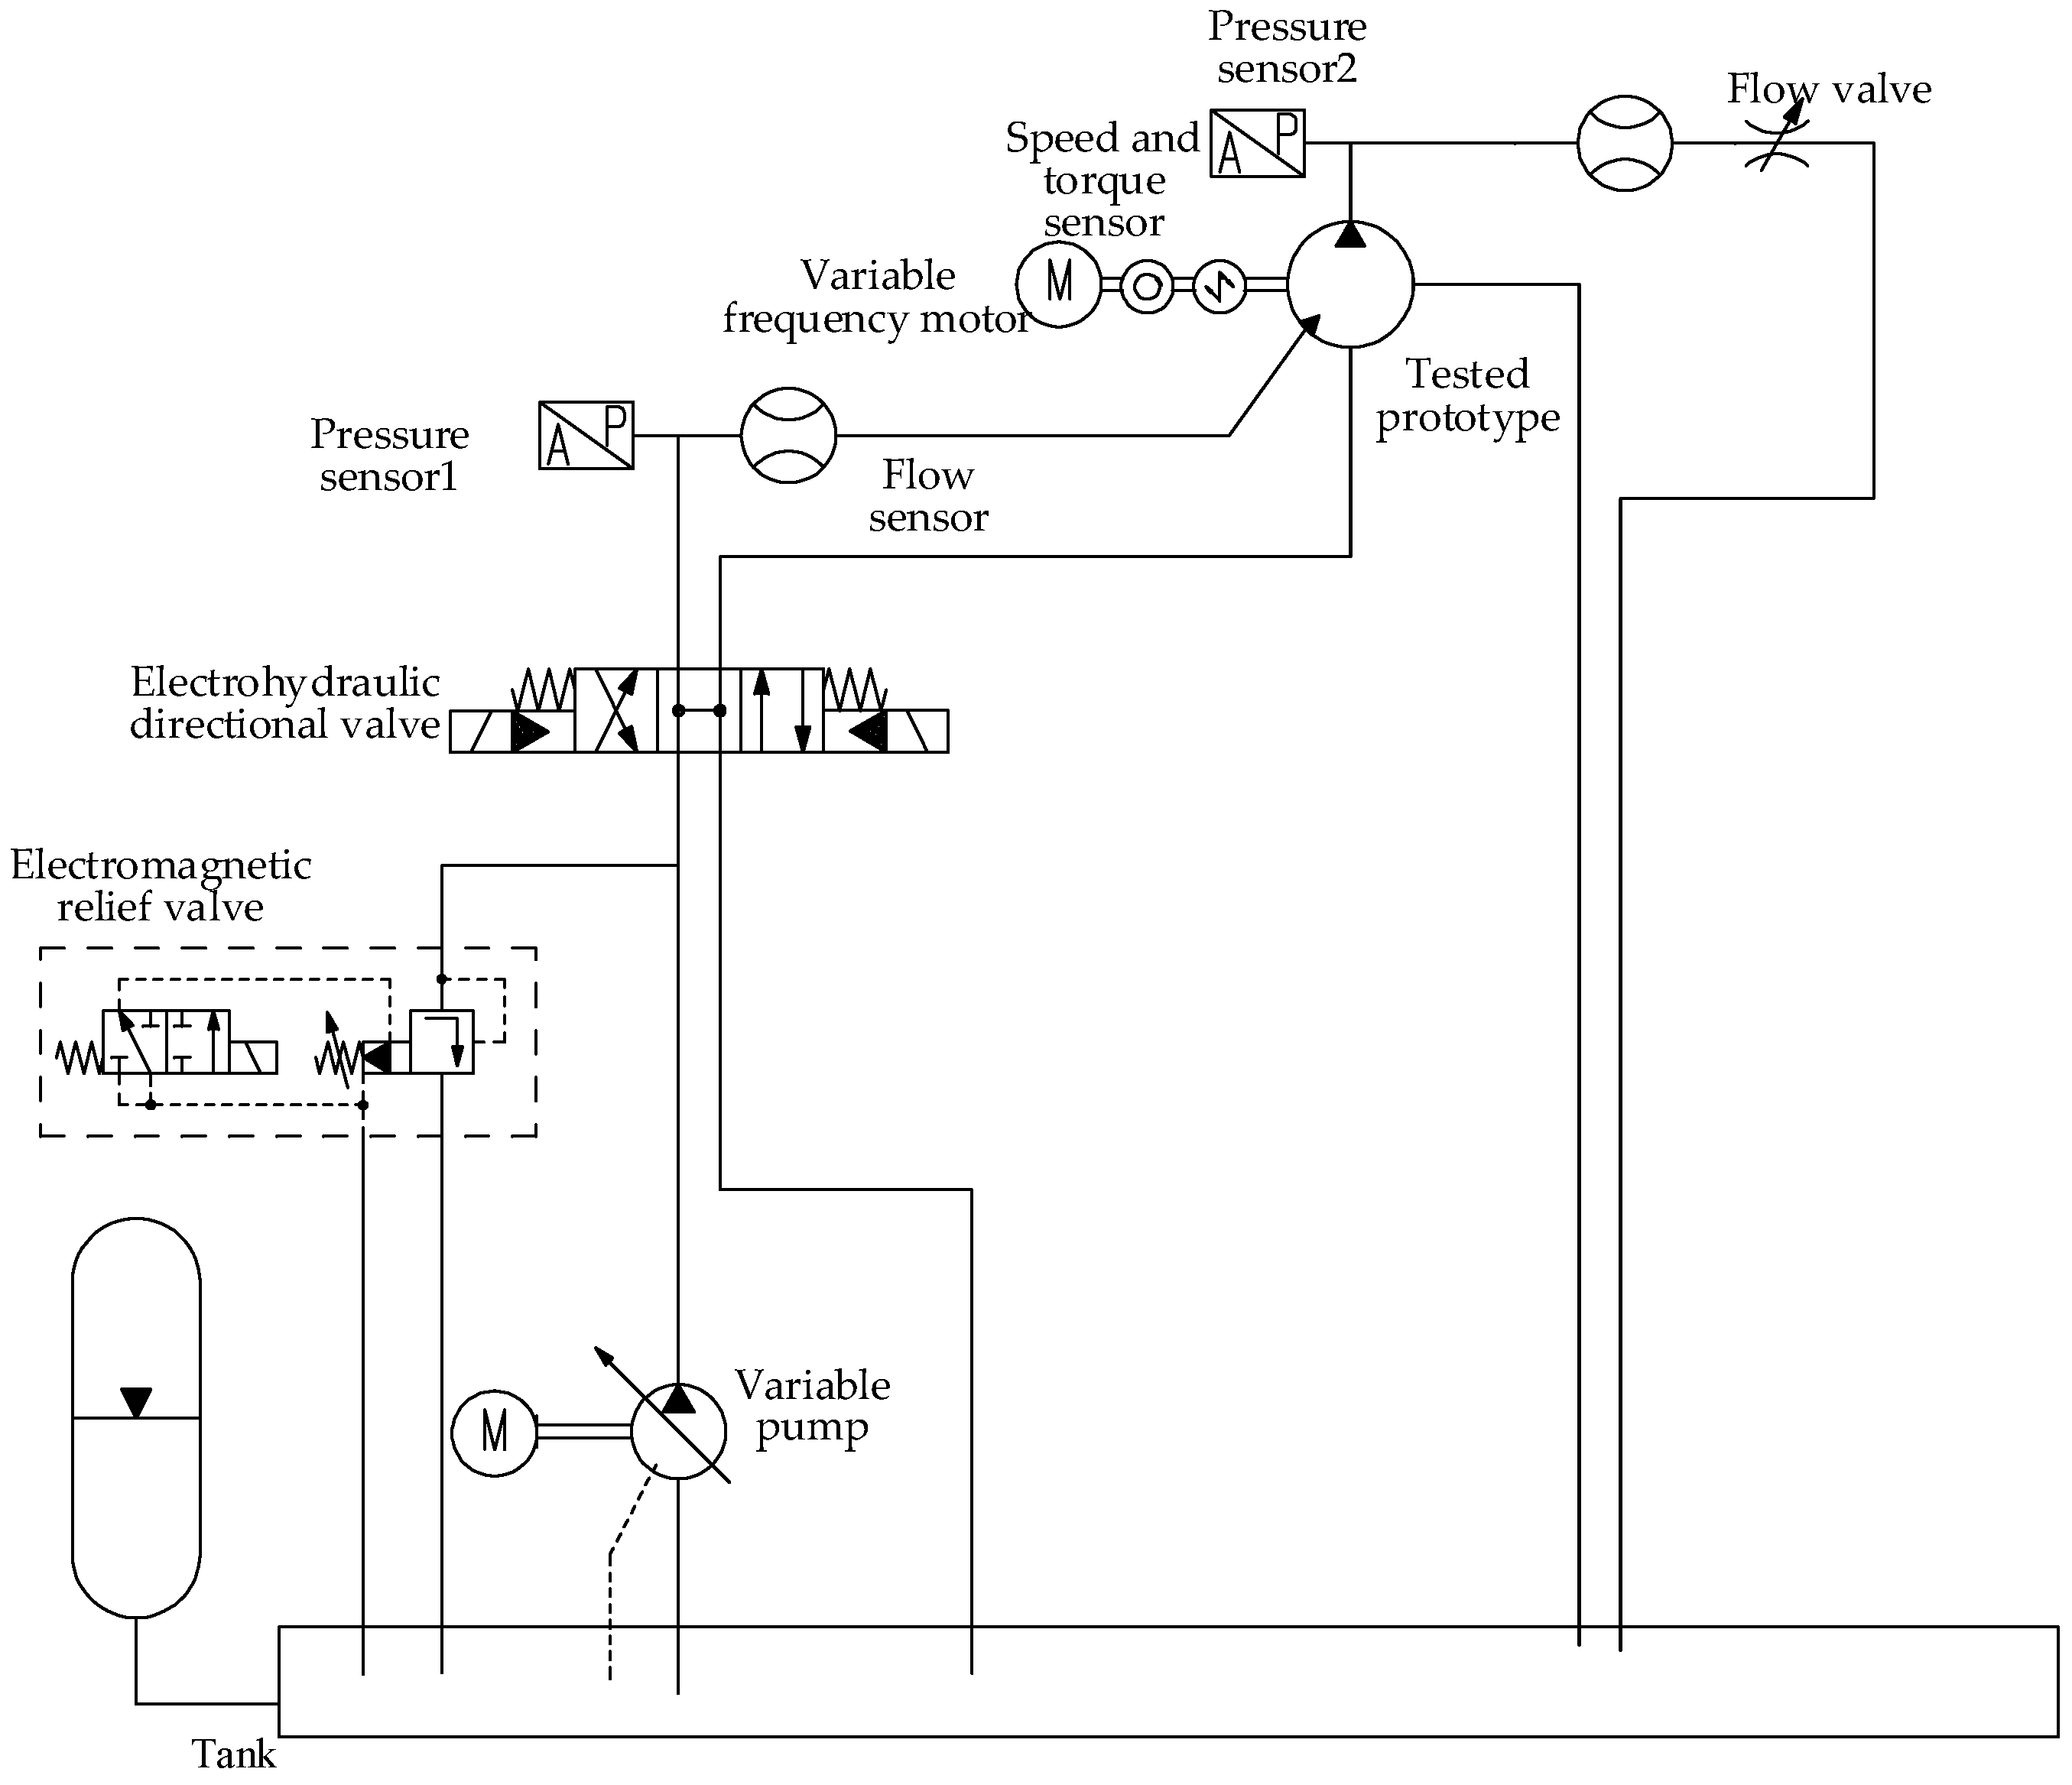
The integrated seawater desalination power recovery motor pump device is used for loading tests, mainly to test its pressure, flow rate, and temperature characteristics. The experimental loading system mainly consists of a constant pressure variable pump, an electromagnetic relief valve, a pressure sensor, a flow sensor, a speed and torque sensor, a variable frequency motor, a closed oil tank, and an electro-hydraulic directional valve. The temperature sensor is a split-type thermal resistor with an output signal of 4–20 mA. A hole was drilled from the rear end toward the top surface of the port plate. The pitch circle where the hole center is located is 12 mm smaller than the outer diameter of the port plate. The bottom of the hole is 3 mm away from the top surface of the port plate. The sensor probe was inserted into the hole, and a sealing ring was installed to prevent seawater from affecting the temperature measurement. The schematic of the experimental system is shown in
Figure 13.
We inserted air into the air bag inside the closed water tank and stopped inflation when the seawater pressure reached 0.05 MPa. The variable frequency motor of the drive prototype was set at a speed of 870 r/min, and then, the motor of the constant pressure variable pump was turned on. After starting, the flow valve was adjusted. When pressure sensor 2 detected that the pressure had reached 6.5 MPa, the flow valve was stopped. We adjusted the pressure of the electromagnetic relief valve. When the detection pressure of pressure sensor 1 reached 5.5 MPa, we stopped adjusting the electromagnetic relief valve. Finally, the whole system was powered off and left stationary for 2 h so that the internal temperature could reach room temperature.
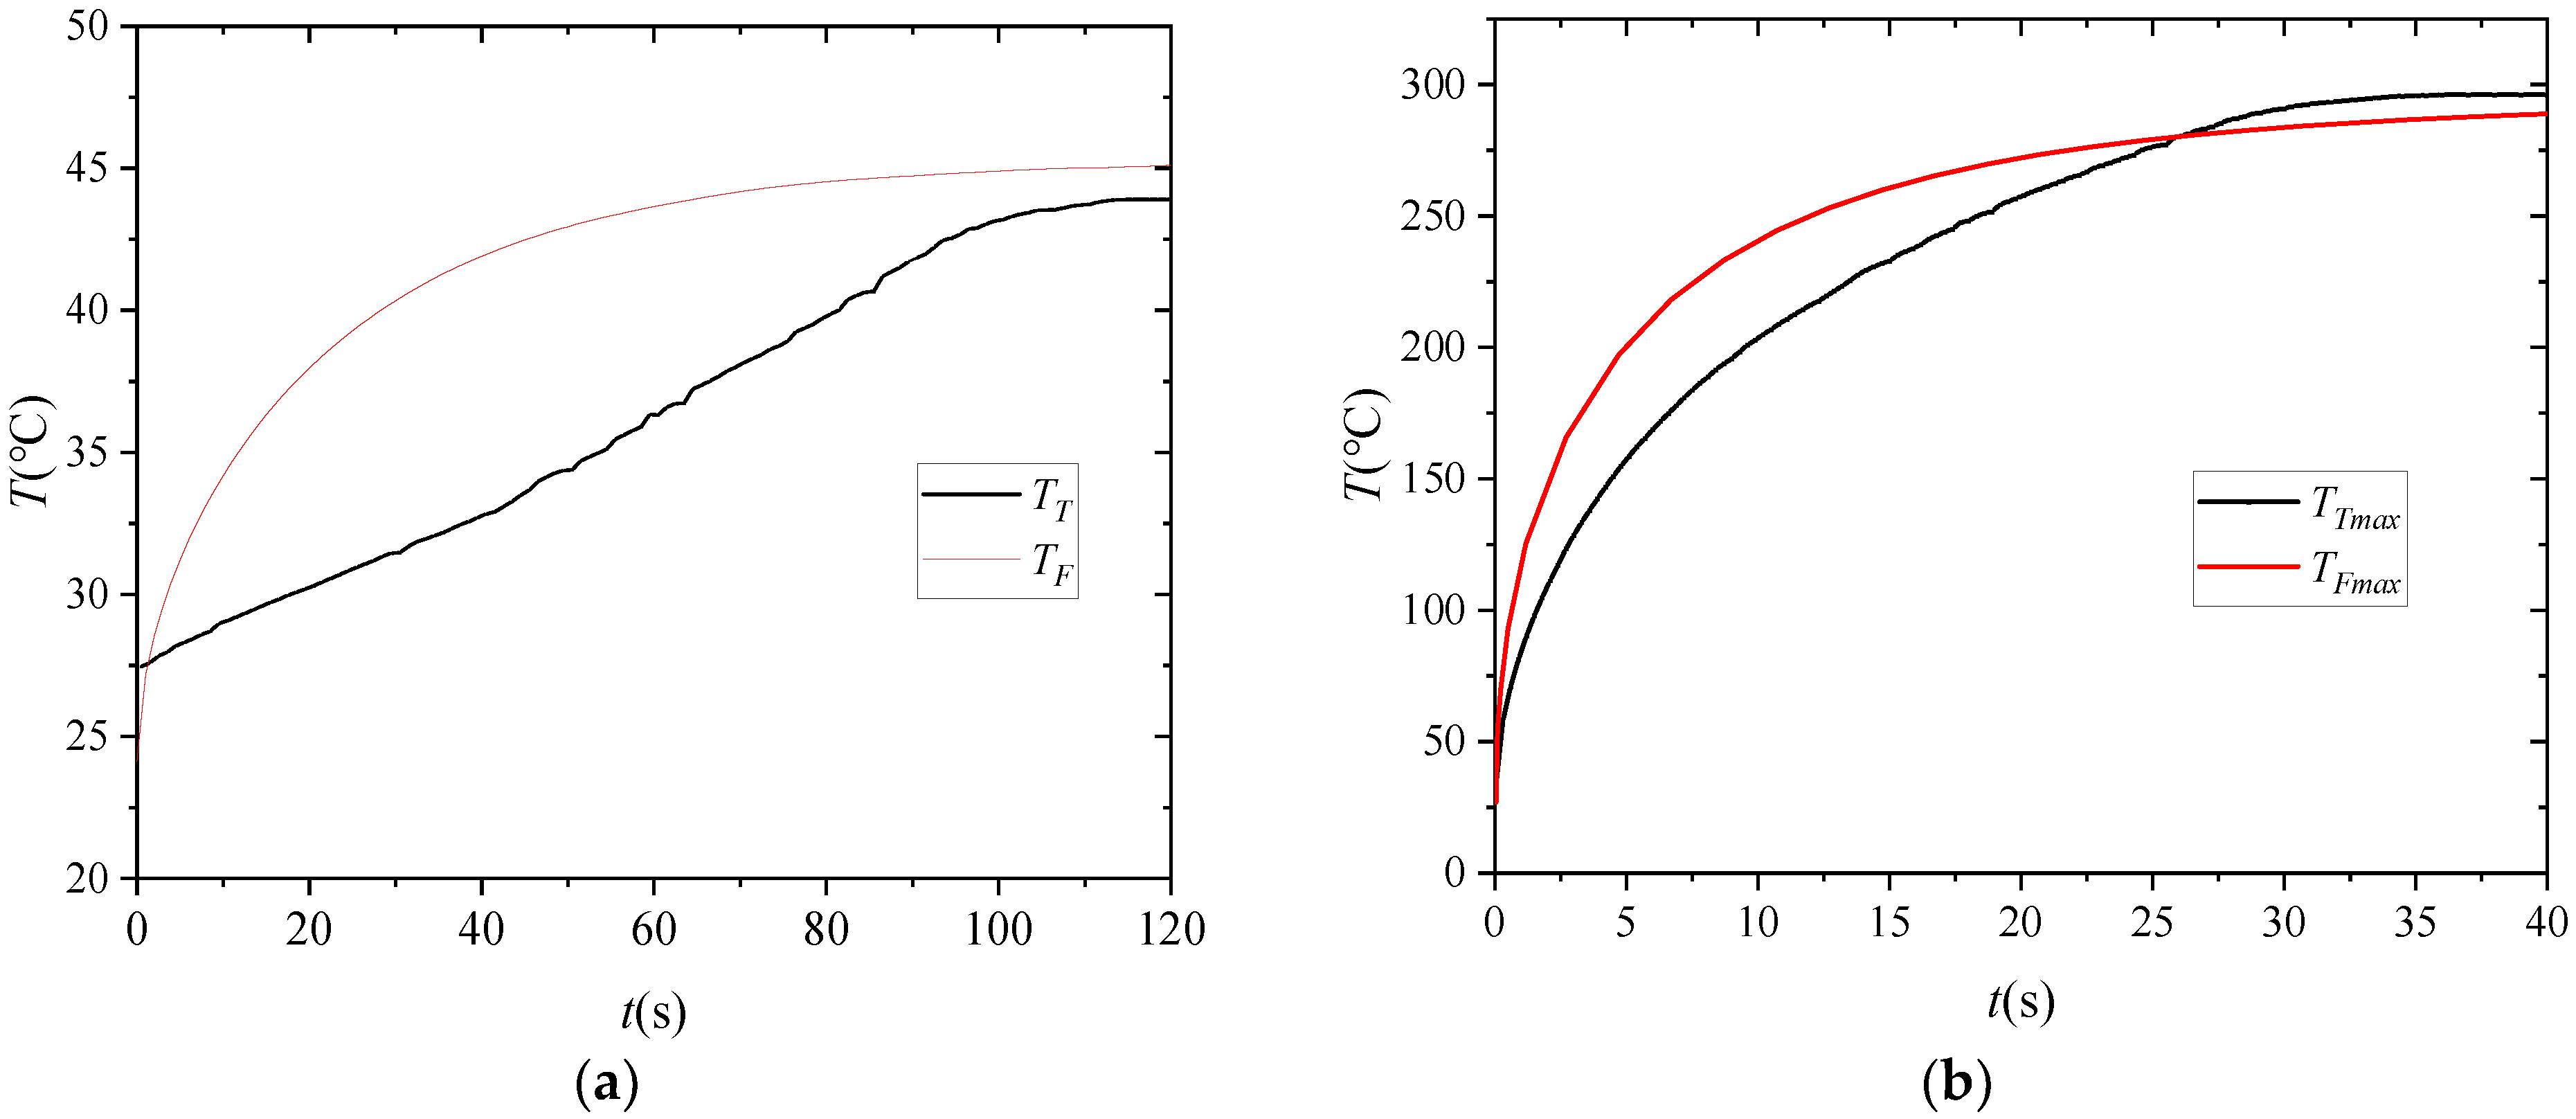
Five repeated tests were carried out, with an interval of 2 h between each test to ensure the device returned to room temperature. The average value of the five test datasets was adopted; the temperature curve measured by the temperature sensor inside the port plate can be seen in
Figure 14. The red color in
Figure 14a represents the simulated temperature curve, while the black color represents the experimental test curve. From the figure, it can be observed that the simulated temperature has a high-temperature rise rate in the first 10 s; then, it rapidly decreases, tends to stabilize, and finally stabilizes at 45.1 °C. The temperature curve obtained from experimental testing shows an approximate linear temperature rise, which eventually stabilizes at 43.9 °C. The final temperature difference between the simulation and experiment is 1.18 °C, with an accuracy of 97.31%. The main reasons for the error are twofold. First, the clamping force of the port plate is adjusted by the spring located inside the rear cover, and there may be an error between the frictional heat power and the simulation set value, and the fabricated rotor and port plate exhibit a certain surface roughness. Micro amounts of water can be retained in the concave regions, which provides a certain lubrication effect and reduces the frictional thermal power. In addition, direct contact between the port plate and the rear cover leads to partial heat dissipation, whereas the rear cover is not included in the simulation. These factors collectively result in a lower experimental temperature compared with the simulated temperature. Second, the port plate is in contact with the rear cover, which can carry away some of the heat through thermal conduction, and the leaked seawater inside can exchange heat with the port plate to carry away some of the heat.
Figure 14b shows the temperature curve for the highest pressure of 8.5 MPa. The red color represents the simulated temperature curve, and the black color represents the experimental test curve. From the figure, it can be observed that the temperature rise rate of the simulated temperature curve is significantly higher than that of the experimental temperature curve. This is similar to
Figure 14a, mainly due to the ideal environment set by the simulation. In the experimental test, there is leakage in the port plate pair, and seawater can remove some of the heat from local gaps. When reaching steady-state conditions, the experimental test temperature is 9 °C higher than the simulated temperature, mainly because the clamping force of the valve plate is adjusted by the spring located in the rear cover. Due to processing errors, the clamping force is lower than the design value, and the leakage power loss increases at the highest pressure, resulting in a higher temperature. At the rated pressure, due to the small clamping force and friction power loss, the local temperature is lower than the simulated temperature.
5. Conclusions
A fluid–solid heat multi-field coupling model of an integrated seawater desalination power recovery motor pump device was constructed in this study, and the temperature changes in the port plate pair under different residual pressure coefficients and maximum working pressure were analyzed. The numerical calculations and experimental results indicate the following.
With the increase in the remaining compression force coefficient, the friction torque and power loss increase, and the temperature gradually increases. Increasing remaining compression force coefficient from 1.025 to 1.1 raises the maximum temperature from 45.1 °C to 66.4 °C at rated pressure. The temperature rise rate of the port plate also increases with the increase in the compression force, reaching a maximum of 2 °C/s.
At the highest working pressure, as the residual clamping force coefficient decreases, the leakage flow rate and leakage power loss increase, causing a sharp increase in the temperature of the port plate pair, with it reaching a temperature of 243 °C and leading to local thermal stress concentration.
Based on the temperature characteristics of the port plate pair under different working pressures, the residual compression force coefficient was determined to be 1.05, corresponding to a compression force of 33,019 N. This value balances power loss (307 W) against acceptable temperature rise. A design method is proposed, utilizing the local temperature characteristics of the port pair as the range for determining the residual compression force coefficient, to achieve the goal of reducing energy consumption and improving efficiency. The approach of using temperature characteristics to determine the residual compression coefficient can be extended to similar axial piston pump designs.





 ,
,