Article

Flexural Failure Characteristics and Fracture Evolution Law of Layered Composite Rock Mass

1
Heilongjiang Longmei Jixi Mining Co., Ltd., Jixi 158100, China
2
College of Mining Engineering, Heilongjiang University of Science and Technology, Harbin 150022, China
3
Ordos Haohua Hongqingliang Mining Co., Ltd., Ordos 017000, China
*
Author to whom correspondence should be addressed.
Processes 2026, 14(6), 888; https://doi.org/10.3390/pr14060888
Submission received: 11 February 2026 / Revised: 6 March 2026 / Accepted: 9 March 2026 / Published: 10 March 2026

Abstract

To address the engineering challenges of frequent flexural deformation and instability of composite roadway roofs and the difficulty in accurately controlling the support strength range during deep coal mining, this study takes the soft–hard interbedded composite roof of the working face in the West No. 1 Mining Area of Shuangyang Coal Mine in Shuangyashan as the engineering background. Typical fine sandstone (hard rock) and tuff (soft rock) from the on-site roof were selected to prepare layered composite specimens, and indoor four-point bending tests were conducted. Combined with theoretical calculations, strain monitoring, and acoustic emission (AE) real-time localization technology, the regulatory mechanisms of three key factors—lithological combination, loading rate, and span—on the flexural mechanical properties, deformation and failure modes, and fracture evolution laws of layered composite rock masses were systematically investigated. The research results show the following: (1) The flexural performance of layered composite rock masses is dominated by the interlayer interface effect. Their flexural strength is 46.7% and 41.1% lower than that of single hard rock and soft rock specimens, respectively, and the competitive mechanism between interface slip and delamination fracture is the core inducement of strength deterioration. (2) The strength and deformation characteristics of layered composite rock masses exhibit a significant loading rate effect. When the loading rate increases from 0.002 mm/s to 0.02 mm/s, the flexural strength decreases by 51.8% and the mid-span deformation deflection reduces by 50.1%. High loading rates will exacerbate the deformation mismatch between soft and hard rock layers, trigger premature failure of interface bonding, and inhibit the full development of structural plastic deformation. (3) Increasing the span significantly optimizes the flexural bearing performance of layered composite rock masses. When the span increases from 170 mm to 190 mm, the flexural strength increases by 65.7% and the mid-span deformation deflection synchronously increases by 65.7%. A large span can extend the flexural deformation path, promote the coordinated deformation of rock layers, and suppress local stress concentration. (4) The flexural failure of layered composite rock masses is dominated by Mode II shear cracks, while single-lithology specimens are mainly dominated by Mode I tensile cracks. Loading rate and span significantly change the crack propagation mode and energy release law. This study establishes a calculation method for the equivalent flexural stiffness of layered composite rock masses and reveals the mesoscopic mechanism of flexural failure of heterogeneous layered rock masses. The research results can provide a theoretical basis and experimental support for the optimization of support schemes and the prevention and control of roof collapse hazards for composite roofs of deep coal mine roadways.

1. Introduction

With the year-by-year increase in the mining depth of coal mines in China, the problem of surrounding rock stability of composite roadway roofs has become a key bottleneck restricting the safe and efficient exploitation of deep resources [1,2,3]. Composite roofs are usually formed by the alternating superposition of rock strata with significant differences in mechanical properties, and their inhomogeneity, weak interface effect and coupling effect of dynamic mining-induced stress render the roadway roofs prone to delamination, flexural fracture and sudden roof collapse accidents [4], which seriously endangers the safe production of coal mines.
Aiming at the flexural deformation and failure of composite roofs, scholars have commonly conducted three-point or four-point bending tests to investigate the mechanical properties of composite rock mass during the process of flexural deformation and failure. Wang et al. [5] carried out three-point bending tests on limestone with precast fissures and analyzed the evolution laws of strain field and fractures during flexural deformation by means of digital speckle correlation monitoring. Ren et al. [6] combined three-point bending tests with fractal dimension analysis to quantify the influence of fracture surface roughness on composite fracture strength and verified the applicability of fractal theory in cross-scale damage characterization. Zhang et al. [7] performed three-point bending tests on coal–rock composites and revealed the effect of strength on the fracture surface characteristics of layered composite rock mass under flexural failure. Song [8] prepared composite cuboid specimens to conduct three-point bending tests, systematically studied the influences of rock strength and thickness on fracture surfaces, and unveiled the crack development laws of layered composite rock mass during flexural failure. Zhao et al. [9] carried out three-point bending tests on rock samples to determine the influence of precast fissures on the peak load of rock mass and elaborated the calculation formula for the flexural strength of three-point bending beams. Xu et al. [10,11] fabricated layered composite rock mass specimens with fine sandstone and conducted three-point bending tests, analyzing the interface mechanical characteristics throughout the entire deformation and failure process as well as the effects of interlayer contact on peak load and maximum displacement. Song et al. [12] selected layered composite rock mass with two types of interface forms to perform four-point bending tests and investigated the deformation and energy evolution of layered rock mass.
Regarding the fracture evolution process of composite rock masses, scholars at home and abroad have revealed the influences of various factors on the fracture evolution of layered composite rock masses through laboratory tests. Huang et al. [13] conducted laboratory tests on soft–hard interbedded rock masses and obtained the quantitative relationship between the thickness of the soft layer and fracture propagation. Teng et al. [14] investigated the damage and fracture process as well as acoustic emission (AE) characteristics of layered composite rock masses under uniaxial compression and identified the crack development law using CT scanning. Nian et al. [15] carried out numerical simulations on composite rock masses with weak interlayers and found that microcracks mainly initiate at the interfaces and loading plate areas. Zhong et al. [16] analyzed the entire process of fracture development based on fracture mechanics and studied the effects of joint fractures on the fracture characteristics of layered composite rock masses. Wang et al. [17] analyzed the influences of different confining pressures and dip angles on fracture development and evolution from the perspective of the mechanical behavior of composite assemblage materials. Jian et al. [18] elaborated on three types of fracture failure and the fracture development process by using the statistical theory of continuous damage mechanics and derived a rock damage constitutive model under triaxial compression conditions. Lin et al. [19] performed uniaxial compression tests on jointed soft–hard composite rock masses, and analyzed the effects of joint angle, ligament angle and out-of-plane joint position on the crack propagation behavior of specimens through the b-value, AE counts and cumulative ringing counts. Li et al. [20] conducted uniaxial cyclic compression tests on composite coal–rock specimens, constructed a damage variable evolution model by combining dissipated energy and AE parameters, and revealed the dominant role of coal–rock interface slip in overall instability. Dong et al. [21] studied the re-crushing characteristics of coal–sandstone composite broken masses under dynamic loading and found through fractal dimension analysis that the cumulative AE counts of composite rock masses fall between those of single-lithology rock masses, and the energy release exhibits a multi-peak characteristic, which reflects the phased failure of different components. Liu et al. [22] revealed the nonlinear damage evolution of composite roof rock masses under different stress paths through multifractal analysis and found that AE parameters are correlated with the dynamic changes of the fractal spectrum.
In summary, existing studies still have three core limitations: (1) The three-point bending test cannot eliminate the shear stress interference induced by concentrated loads, making it difficult to reproduce the real stress state of the pure bending section of the roadway roof, which leads to a deviation between the test results and on-site engineering practice. (2) Existing studies mostly focus on the influence of a single factor on the strength of homogeneous or composite rock masses, and there is insufficient systematic research on the interface effect, crack type transformation mechanism, and damage evolution law of flexural failure of layered composite rock masses under the coupling of multiple factors, including lithological combination, loading rate, and span. (3) Existing studies have failed to clarify the main controlling factors of the flexural failure of composite roofs, and it is difficult to establish a direct correlation between test results and on-site support design, resulting in insufficient engineering guidance.
On this basis, this paper takes the composite roof of the No. 4 working face in the West No. 1 Mining Area of Shuangyang Coal Mine in Shuangyashan as the research object. Soft-hard interbedded specimens composed of fine sandstone and tuff are prepared to carry out four-point bending tests so as to eliminate the interference of shear stress and reproduce the real bending stress state of the roadway roof. The effects of lithological combination, loading rate and span on the flexural mechanical properties and deformation modes of the composite rock mass are systematically investigated. Combined with strain monitoring and acoustic emission (AE) localization technology, the fracture evolution law and mesoscopic mechanism of the composite rock mass during the whole process of flexural failure are revealed. Finally, the core innovations and engineering application value of this study are clarified, which can provide theoretical support for the support design and hazard prevention and control of deep coal mine roadways with composite roofs.

2. Test Scheme for Four-Point Bending of Layered Composite Rock Mass

2.1. Test Design Concept

This study takes the composite roof of the No. 4 working face in the West No. 1 Mining Area of Shuangyang Coal Mine in Shuangyashan as the engineering prototype. The roof of this working face features a typical structure of alternating fine sandstone (hard rock) and tuff (soft rock) layers, whose occurrence characteristics are highly consistent with those of composite roofs in deep roadways of coal mines in northeast China. Specifically, the fine sandstone is dominated by 65–75% quartz and 15–20% feldspar, presenting a medium-fine-grained structure with a grain size of 0.1–0.5 mm, cemented by siliceous + calcareous materials with moderate cementation degree. The tuff is mainly composed of 50–60% volcanic glass and 20–25% plagioclase, exhibiting a silty structure with a grain size of <0.05 mm, cemented by volcanic ash with weak cementation degree. The fine sandstone and tuff cores used in the tests were all collected from the on-site roof strata of the aforementioned working face to ensure consistency between the test materials and engineering practice. Meanwhile, these two rock types were selected as typical representatives of hard and soft rock layers, and their strength difference was utilized to reflect the common roof lithological combination characteristics of coal mines in north China. The specimens were bonded by marble adhesive under pressure to ensure interlayer bonding strength, thereby simulating the natural cementation state of rock strata.
Under deep mining conditions, the roadway roof is subjected to bending moments at both ends under the following working conditions: ① After roadway excavation, the redistribution of the in situ stress field causes the roof strata to form a cantilever beam effect due to self-weight and overlying strata load, with the coal–rock masses at both ribs serving as fixed supports to bear the bending moment. ② Under the influence of mining activities, the advance abutment pressure of the working face is transmitted to the roadway roof, resulting in a flexural stress state where the middle of the roof is in tension and both ends are in compression. ③ The layered roof undergoes delamination deformation due to lithological differences, and the differential displacement at the interface between hard and soft rock layers induces additional bending moments.
Cracks generated by rock mass failure under loading are classified into Mode I (tensile) cracks and Mode II (shear) cracks based on fracture mechanics characteristics: Mode I cracks are dominated by tensile stress, with crack surfaces perpendicular to the tensile stress direction, and rock masses on both sides of the crack undergo normal separation. Visually, the crack surfaces are relatively flat, and the fractures show vertical penetration without obvious rock dislocation traces. Mode II cracks are dominated by shear stress, with crack surfaces parallel to the shear stress direction, and rock masses on both sides of the crack undergo tangential relative slip. Visually, the crack surfaces are rough, and the fractures show inclined propagation, accompanied by obvious interlayer dislocation and friction traces.
The four-point bending test simulates the above working conditions through fixed support boundary conditions at both ribs. The pure bending zone generated by this test is highly consistent with the stress state in the maximum bending zone of the roof. Compared with the three-point bending test, the four-point bending test eliminates the interference of shear stress and can accurately capture the flexural failure process dominated by Mode I tensile cracks.
The test span was determined based on the geometric similarity criterion: taking the actual span of the on-site roadway (3.4–3.8 m) as the prototype, the test span was set to 170–190 mm according to a similarity ratio of 1:20. The specimen size and span/height ratio were designed in accordance with the ISRM rock bending test standards and the Standard for Engineering Rock Mass Test Methods (GB/T 50266-2013) [23]. The loading rate was set to 0.002–0.02 mm/s by referring to rock mechanics test specifications and on-site excavation disturbance rates, so as to simulate the disturbance effect of different underground excavation speeds on the roof. A combined internal and external monitoring method was established: high-speed cameras and strain gauges were used to monitor the deformation trends and fracture development on the specimen surface, while acoustic emission (AE) monitoring was adopted to track the internal fracture evolution process of the specimens. These multiple monitoring methods were jointly applied to explore the flexural failure characteristics and fracture evolution laws of the layered composite rock mass.

2.2. Test System

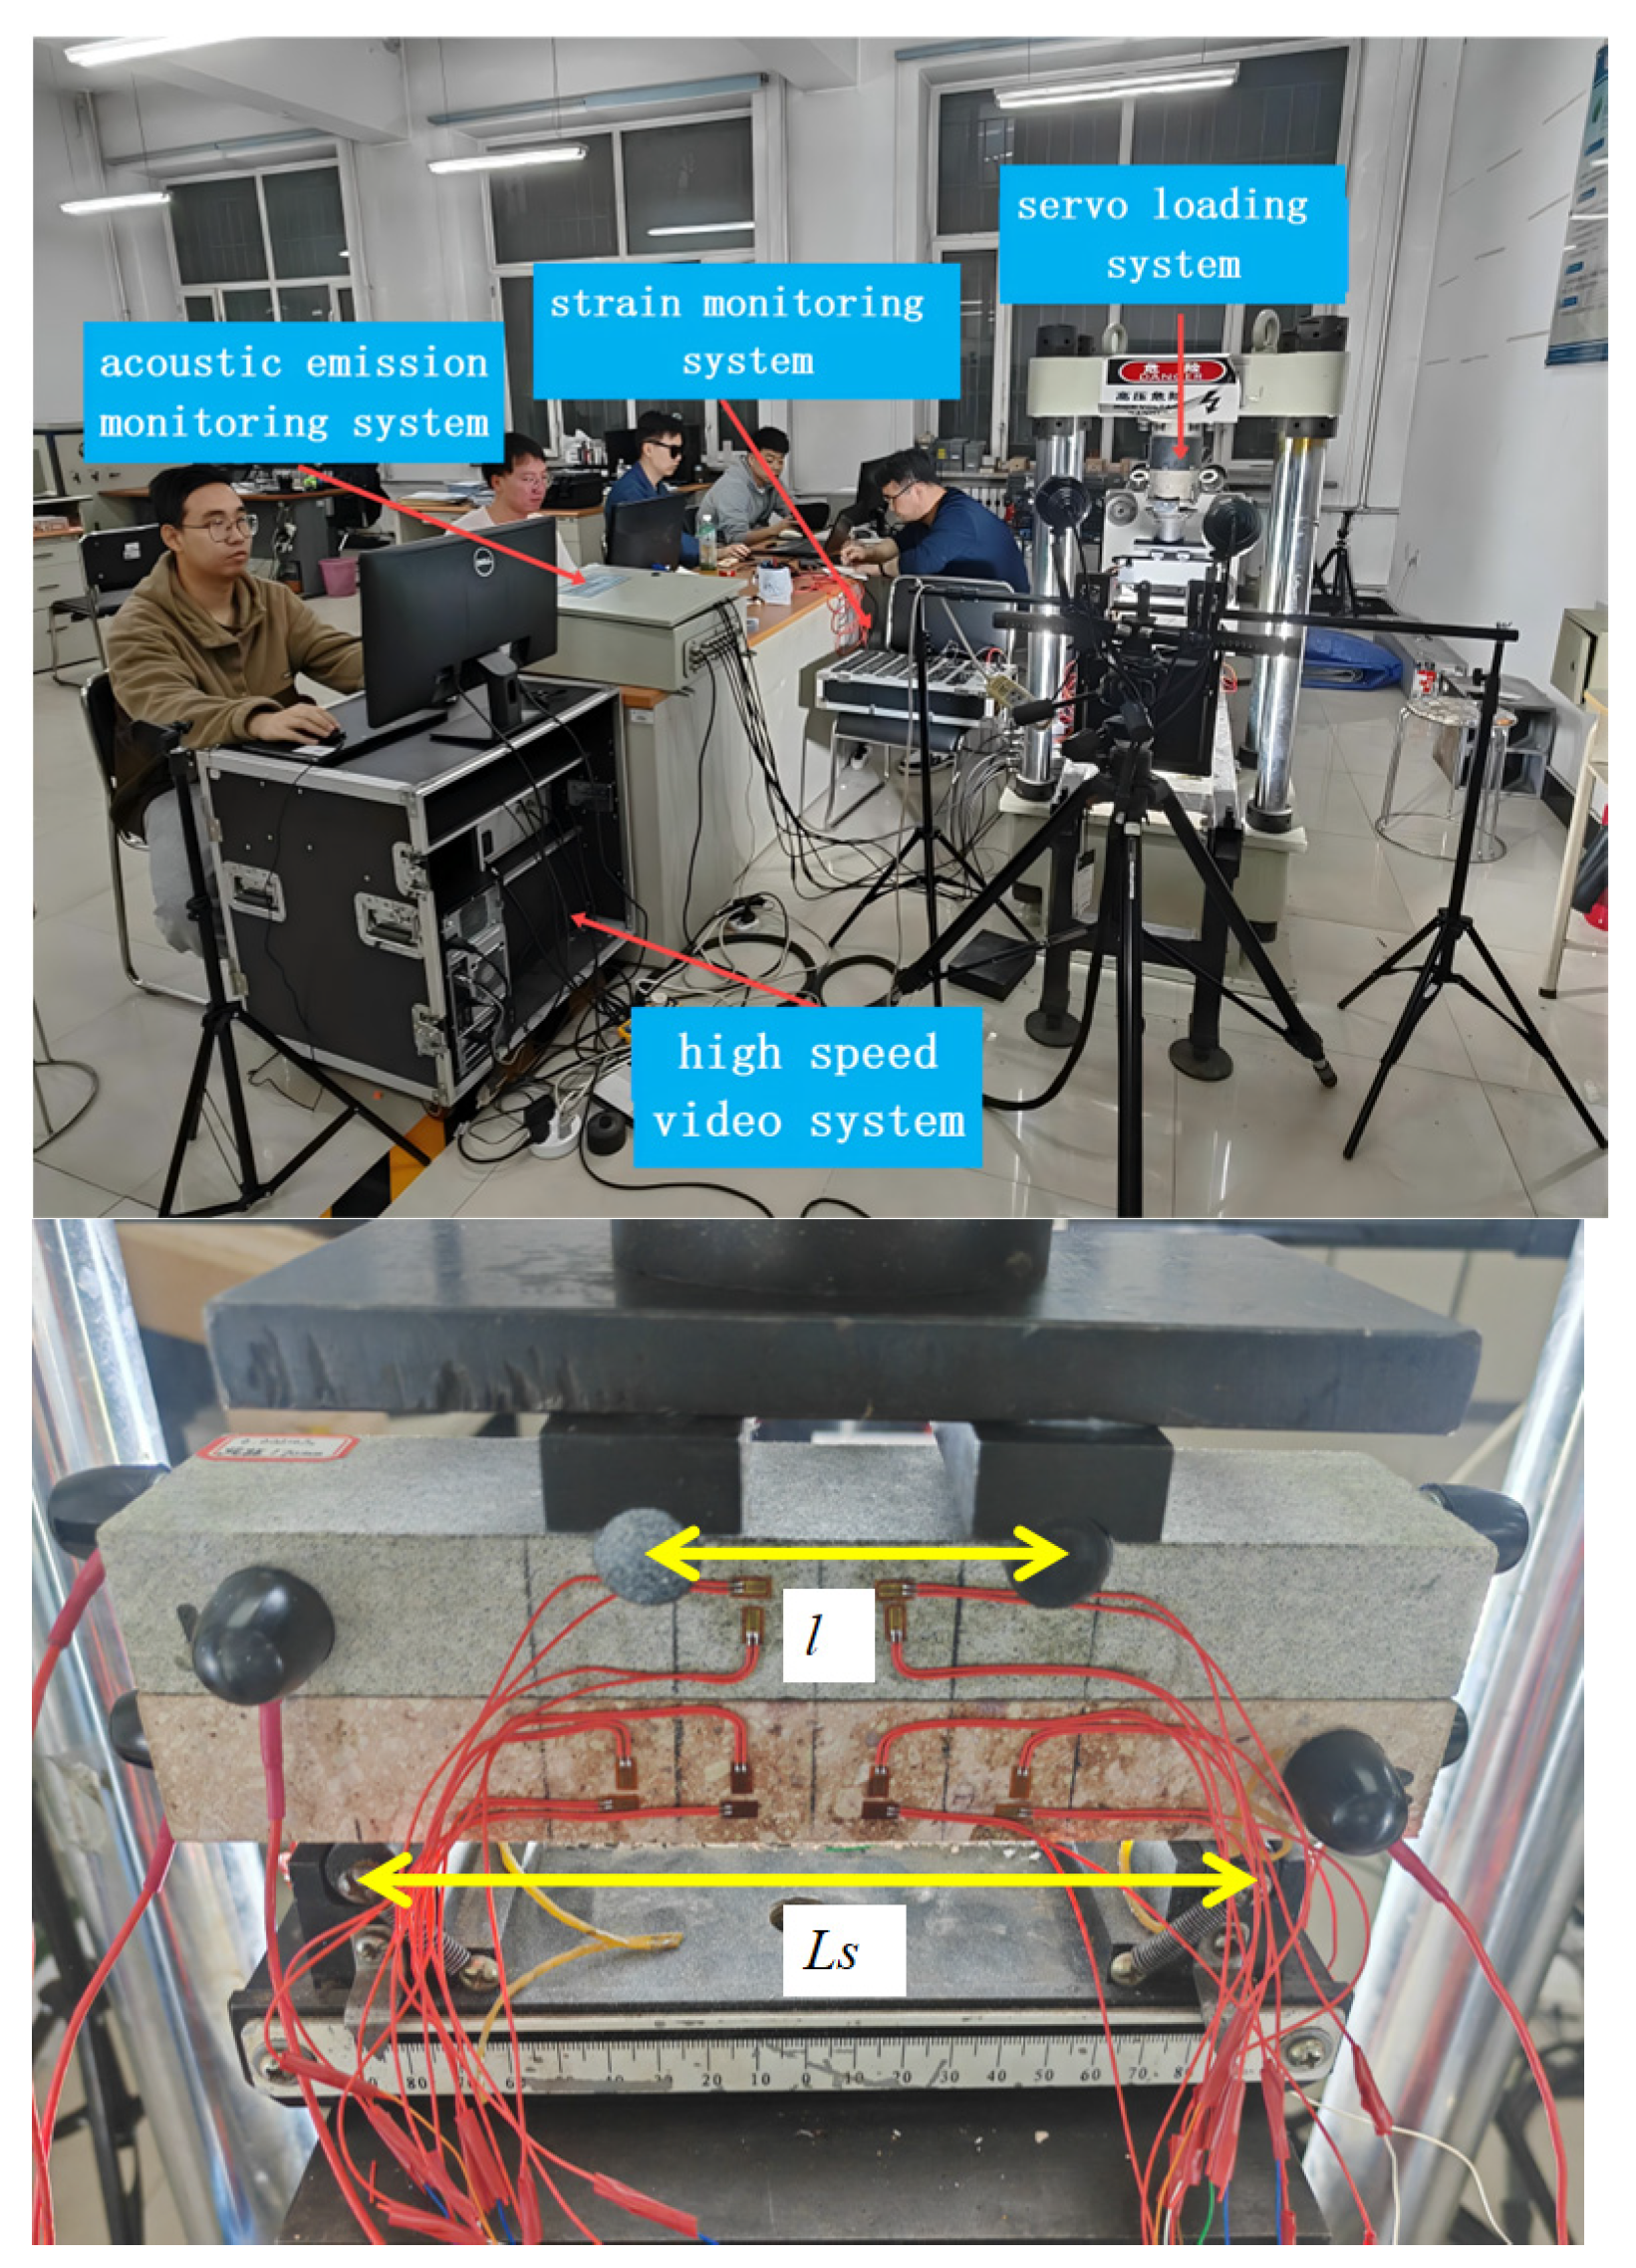
In this experiment, the TYJ-500kN servo-controlled rock testing system (Changchun, China) equipped with four-point bending steel fixtures was adopted to conduct the four-point bending mechanical tests. An SH-II acoustic emission (AE) system (Princeton, NJ, USA), uT7160 static strain gauge (Suzhou, China) and SONY high-definition digital camera (Tokyo, Japan) were used for real-time data acquisition and monitoring, as shown in Figure 1.
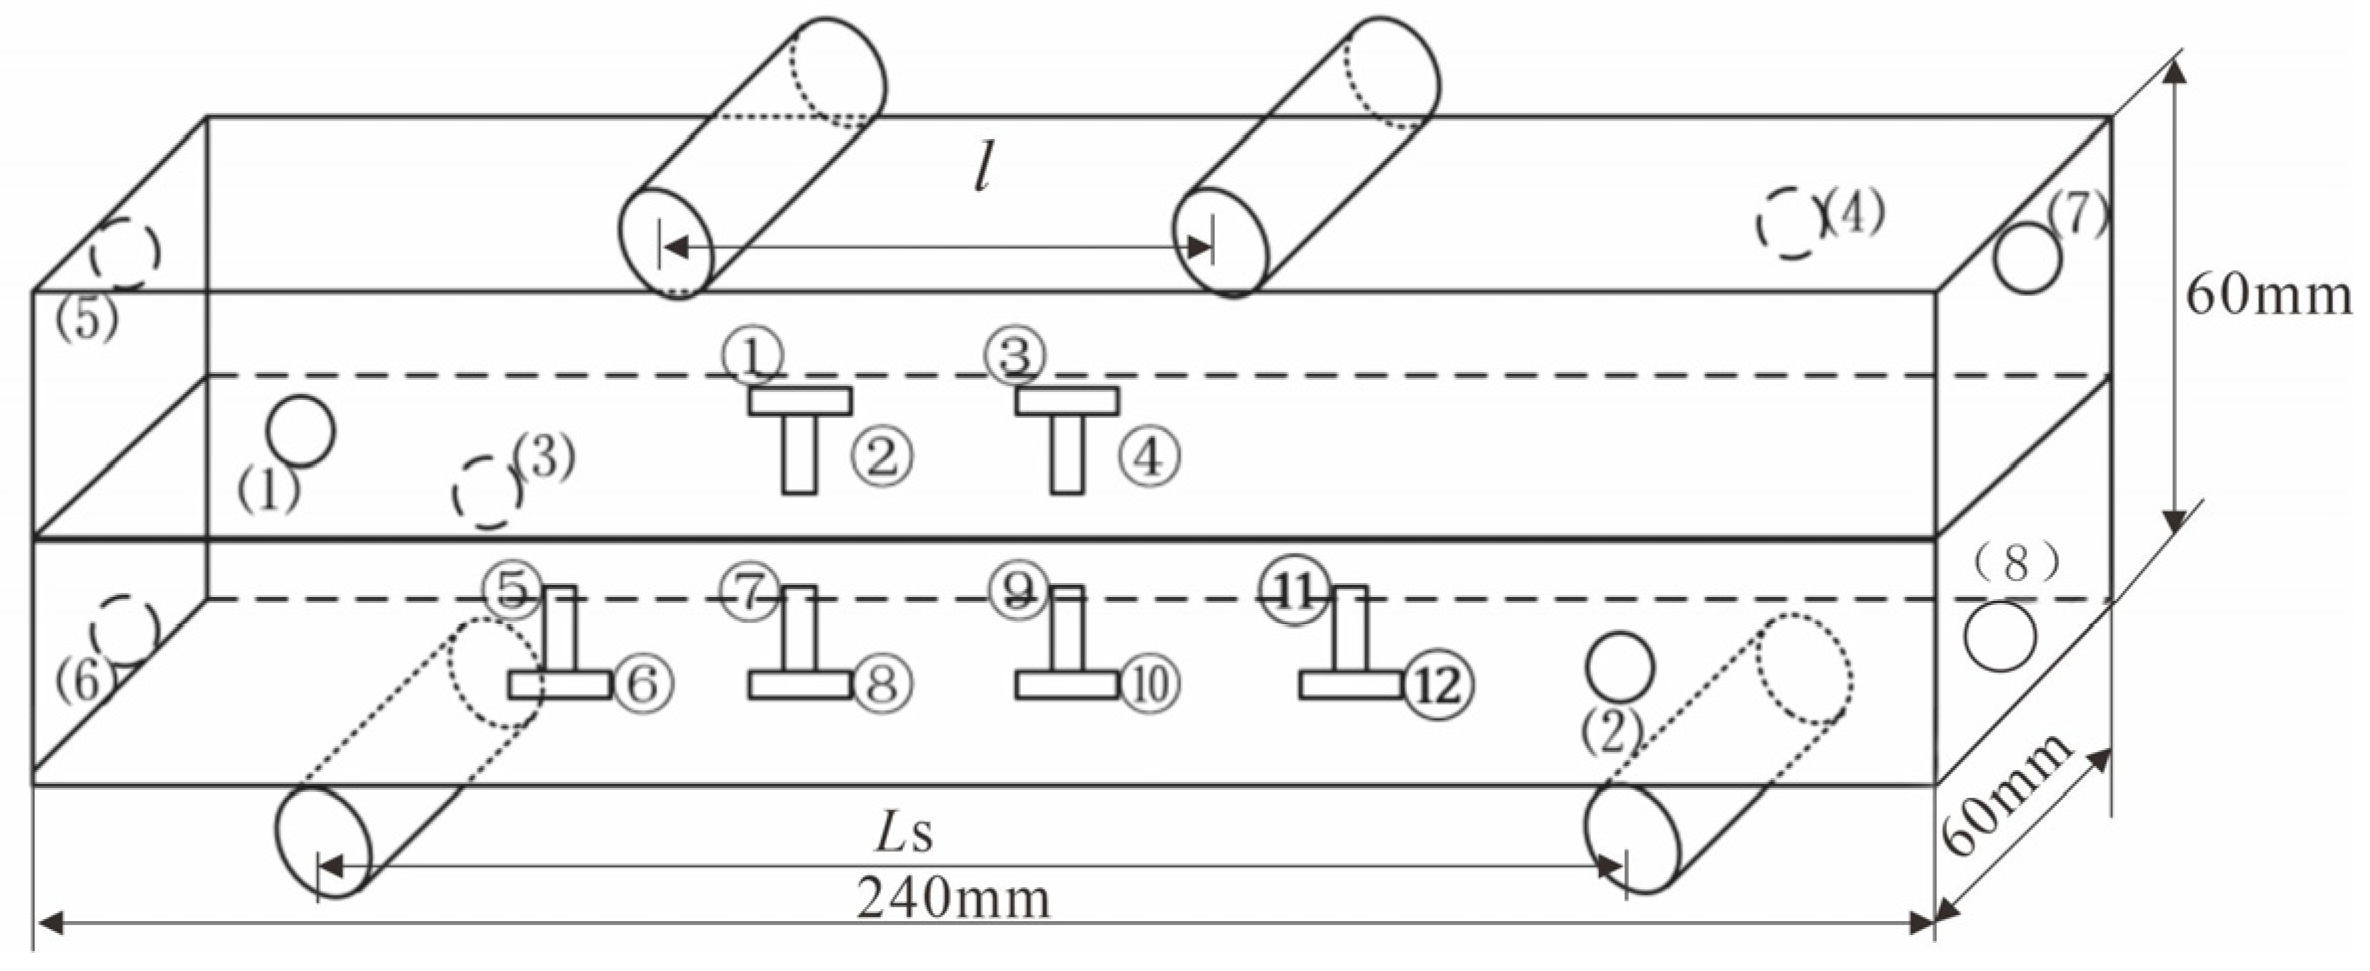
During the test, the acoustic emission (AE) monitoring system was set with a sampling frequency of 1 MHz, a threshold value of 40 dB, and a preamplifier gain of 40 dB. Eight probes were symmetrically arranged on the front and rear surfaces of the specimen to achieve accurate full-space localization of AE events. Strain gauges were symmetrically bonded to the mid-span section along the height direction of the specimen to monitor the distribution and evolution of tensile and compressive strains during the bending process. The high-speed camera was set at a frame rate of 200 fps to record the entire process of crack initiation, propagation, and penetration on the specimen surface. The specific bonding positions of the AE probes and strain gauges, as well as the key dimensions of the specimen, are as follows: total length of 240 mm, cross-section of 60 mm × 60 mm, test spans of 170/180/190 mm, and loading point spacing of 60 mm. The strain gauges are symmetrically arranged along the height direction of the mid-span section, and the AE probes are symmetrically distributed on the front and rear surfaces of the specimen, as shown in Figure 2.

2.3. Test Scheme for Four-Point Bending of Layered Composite Rock Mass

2.3.1. Specimen Preparation

The fine sandstone and tuff used for specimen preparation were both obtained from intact rock cores of the roof of the No. 4 working face in the West No. 1 Mining Area of Shuangyang Coal Mine and processed in accordance with the Specifications for Rock Mechanics Tests and ISRM (International Society for Rock Mechanics) recommended standards. Single-lithology specimens: Dimensions are 240 mm × 60 mm × 60 mm.
Layered composite specimens: Adopt a binary superimposed structure with fine sandstone as the upper layer and tuff as the lower layer. Each single rock layer has dimensions of 240 mm × 60 mm × 30 mm, and the overall dimensions after superimposition are consistent with those of single-lithology specimens to ensure the span/height ratio of the specimens meets the requirements of bending tests. Epoxy marble adhesive for stone materials was used for interlayer bonding. Through standardized tests, the mechanical properties of this adhesive are as follows: compressive strength of 85 MPa, tensile strength of 12 MPa, and elastic modulus of 38 GPa. These parameters are highly matched with those of fine sandstone, which can avoid the bonding layer becoming a controlling weak plane affecting the mechanical properties of the specimens. The bonding process is detailed as follows: ① Precision grinding was performed on the bonding surfaces of the rock layers to ensure a flatness error ≤ 0.02 mm, and surface dust was cleaned with anhydrous ethanol. ② A 0.3 mm thick layer of marble adhesive was uniformly applied on the bonding surfaces. After accurately aligning the two rock layers, a constant pressure of 0.5 MPa was applied, followed by curing at room temperature for 72 h. ③ After curing, non-destructive testing was conducted on the specimens using an ultrasonic detector to eliminate specimens with bonding surface defects, ensuring interlayer bonding quality and simulating the natural cementation state of rock strata.

2.3.2. Test Scheme

Three groups of variables were set in this test, namely, lithological combination, loading rate, and span. Each group included 3 parallel specimens, and the average value was taken as the final result to eliminate the influence of specimen discreteness. Based on the different variables in the four-point bending test, the specimens, with varying lithologies, loading rates, and spans were coded as “A”, “B”, and “C” respectively, with the corresponding variable conditions indicated thereafter. Thus, the designations of the specimens for the four-point bending test under different variable conditions are as follows: A-S-1~A-S-3, A-T-1~A-T-3, A-ST-1~A-ST-3, B-0.001-1~B-0.001-3, B-0.02-1~B-0.02-3, C-170-1~C-170-3, and C-180-1~C-180-3.
All tests were performed using a displacement-controlled loading method, and four-point bending tests were conducted on layered composite rock masses under the conditions of different lithologies, different loading rates and different spans. The A group of tests comprised four-point bending tests on rock specimens with different lithologies, with lithology as the variable (i.e., pure fine sandstone, layered composite rock mass and pure tuff). The displacement loading rate was set at 0.002 mm/s, and loading was continued until the specimens lost their bearing capacity. The B group consisted of four-point bending tests on layered composite rock masses with different loading rates, where layered composite rock masses were used as the test specimens and displacement loading rate was the variable (0.002 mm/s, 0.01 mm/s and 0.02 mm/s), with loading applied until the specimens lost their bearing capacity. The C group consisted of four-point bending tests on layered composite rock masses with different spans, in which layered composite rock masses served as the test specimens and span was the variable. The spacing of the upper loading indenters was fixed at 60 mm, with the test span L S set at 190 mm, 180 mm and 170 mm, respectively. The displacement loading rate was set at 0.002 mm/s, and loading was performed until the specimens lost their bearing capacity. In addition, b denotes the cross-sectional width and h represents the rock mass thickness of the specimens, with all specimen variables detailed in Table 1.

3. Analysis of Four-Point Bending Deformation of Layered Composite Rock Mass

3.1. Basic Theory and Data Processing of Four-Point Bending Test

When a four-point bending rectangular member is in the ultimate state of flexural failure, the maximum stress occurs at the lower surface of the member’s mid-span, which can be used as the flexural strength of the member. At this point, taking the maximum load applied by the testing machine, the calculation formula for the flexural strength is obtained as follows:
R b b = 3 F b b l b h 2
where F b b denotes the maximum load applied by the testing machine (N); R b b denotes the flexural strength (MPa); l denotes the spacing between the upper and lower loading points (m); b denotes the width of the rectangular member (m); h denotes the cross-sectional height of the specimen (m).
For a homogeneous material beam, the calculation formula for the mid-span deflection is as follows:
f = F b b l 3 48 E I
where f denotes the mid-span deflection (m); E denotes the elastic modulus of the material (Pa); I denotes the moment of inertia of the cross-section (m4). For a rectangular cross-section, I = bh3/12.
The deformation deflection of single-material specimens can be obtained using Equation (2). However, the direct adoption of the parameters of fine sandstone or tuff for binary composite members will result in significant errors. According to the calculation method for the equivalent flexural rigidity of composite beams in Mechanics of Materials, the equivalent flexural rigidity of composite beams must be determined by the equivalent section method—this method involves converting the cross-sectional widths of different materials into the equivalent cross-section of a single material through the elastic modulus:
b T = b T E T E S
where b T denotes the equivalent cross-sectional width of tuff after conversion (m); b T denotes the original cross-sectional width of tuff (m); ES and ET denote the elastic moduli of fine sandstone and tuff, respectively (Pa).
Due to the differences in the materials of the two components, the position of the neutral axis does not coincide with the geometric center, with the specific expression given as follows:
y c = A S y c S + A T y c T A S + A T
where yc denotes the ordinate of the neutral axis from the lower edge of the cross-section (m); AS and A T denote the cross-sectional area of fine sandstone and the equivalent cross-sectional area of tuff, respectively (m2); y c S and y c T denote the ordinates of the geometric centers of the fine sandstone cross-section and the tuff cross-section from the lower edge of the cross-section, respectively (m).
Meanwhile, the total moment of inertia can be obtained by separately calculating the equivalent moment of inertia of each rock stratum and then superimposing the results:
I e q = I S + A S ( y c S y c ) 2 + I T + A T ( y c T y c ) 2
where Ieq denotes the total equivalent moment of inertia of the composite beam (m4); IS and I T denote the moments of inertia of the equivalent cross-sections of fine sandstone and tuff about their respective centroidal axes, respectively (m4).
Thus, the expression for the equivalent flexural rigidity in the material deformation expression is derived as follows:
( E I ) e q = E s I e q
Based on the aforementioned basic theory of the four-point bending test, the flexural strength and mid-span material deformation deflection of the specimens were calculated, with the results presented in Table 2.

3.2. Strength Analysis of Layered Composite Rock Mass via Four-Point Bending Test

3.2.1. Strength Analysis of Layered Composite Rock Mass with Different Lithologies via Four-Point Bending Test

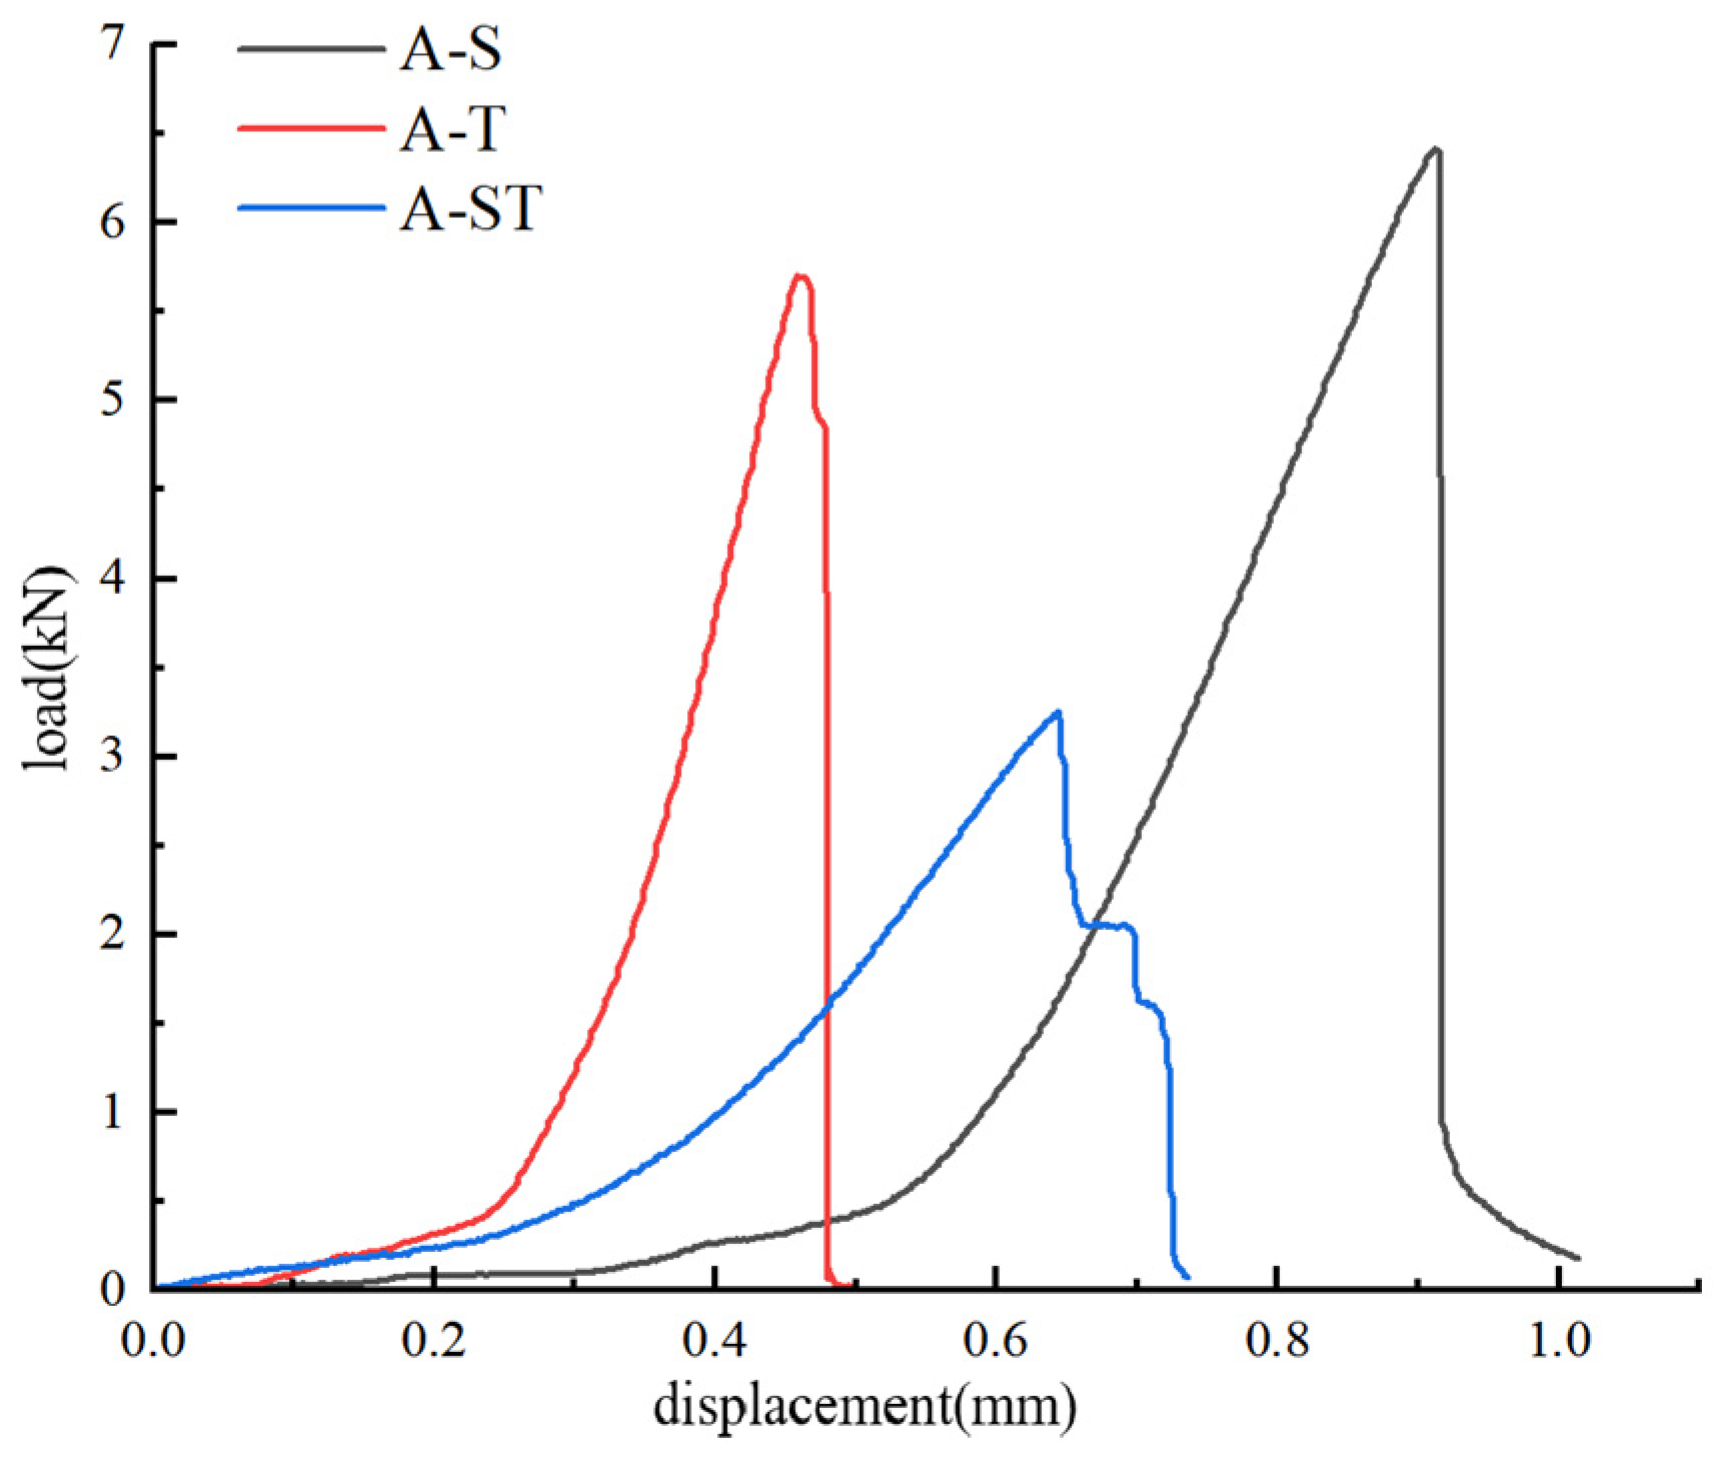
Figure 3 presents the load–displacement curves of layered composite rock masses with different lithologies. Combined with Table 2, the flexural strength of pure fine sandstone specimens reaches 5.25 MPa, which is higher than 4.75 MPa of pure tuff specimens, with the strength difference rate between the two reaching 10.5%. However, when forming layered composite rock masses, the overall flexural strength of the composite members drops sharply to 2.80 MPa, a reduction of 46.7% and 41.1% compared with pure fine sandstone and pure tuff specimens, respectively. It can be seen from Figure 3 that the peak loads of pure fine sandstone and pure tuff specimens are 6.41 kN and 5.70 kN, respectively, which are significantly higher than that of the fine sandstone–tuff layered composite rock mass (3.25 kN). Compared with pure fine sandstone and pure tuff specimens, the flexural strength and peak load of layered composite rock masses exhibit an obvious weakening characteristic.
The results of the four-point bending test indicate that lithology plays a decisive role in the bearing characteristics of layered composite rock masses, and the flexural performance of layered composite rock masses is lower than that of single-lithology rock masses. Furthermore, according to the calculation based on the four-point bending deformation theory, under the action of four-point bending load, the neutral axis shifts toward the fine sandstone layer with higher strength, resulting in the tuff layer bearing excessive tensile stress and thus losing its bearing capacity earlier. After the tuff generates fractures at the initial stage of bearing of the layered composite rock mass, the remaining structure is only borne by the upper fine sandstone layer alone, showing the progressive failure characteristics of the layered structure. As a result, the bearing capacity of the layered composite rock mass is significantly weaker than that of single-lithology rock masses.

3.2.2. Strength Analysis of Layered Composite Rock Mass Under Different Loading Rates via Four-Point Bending Test

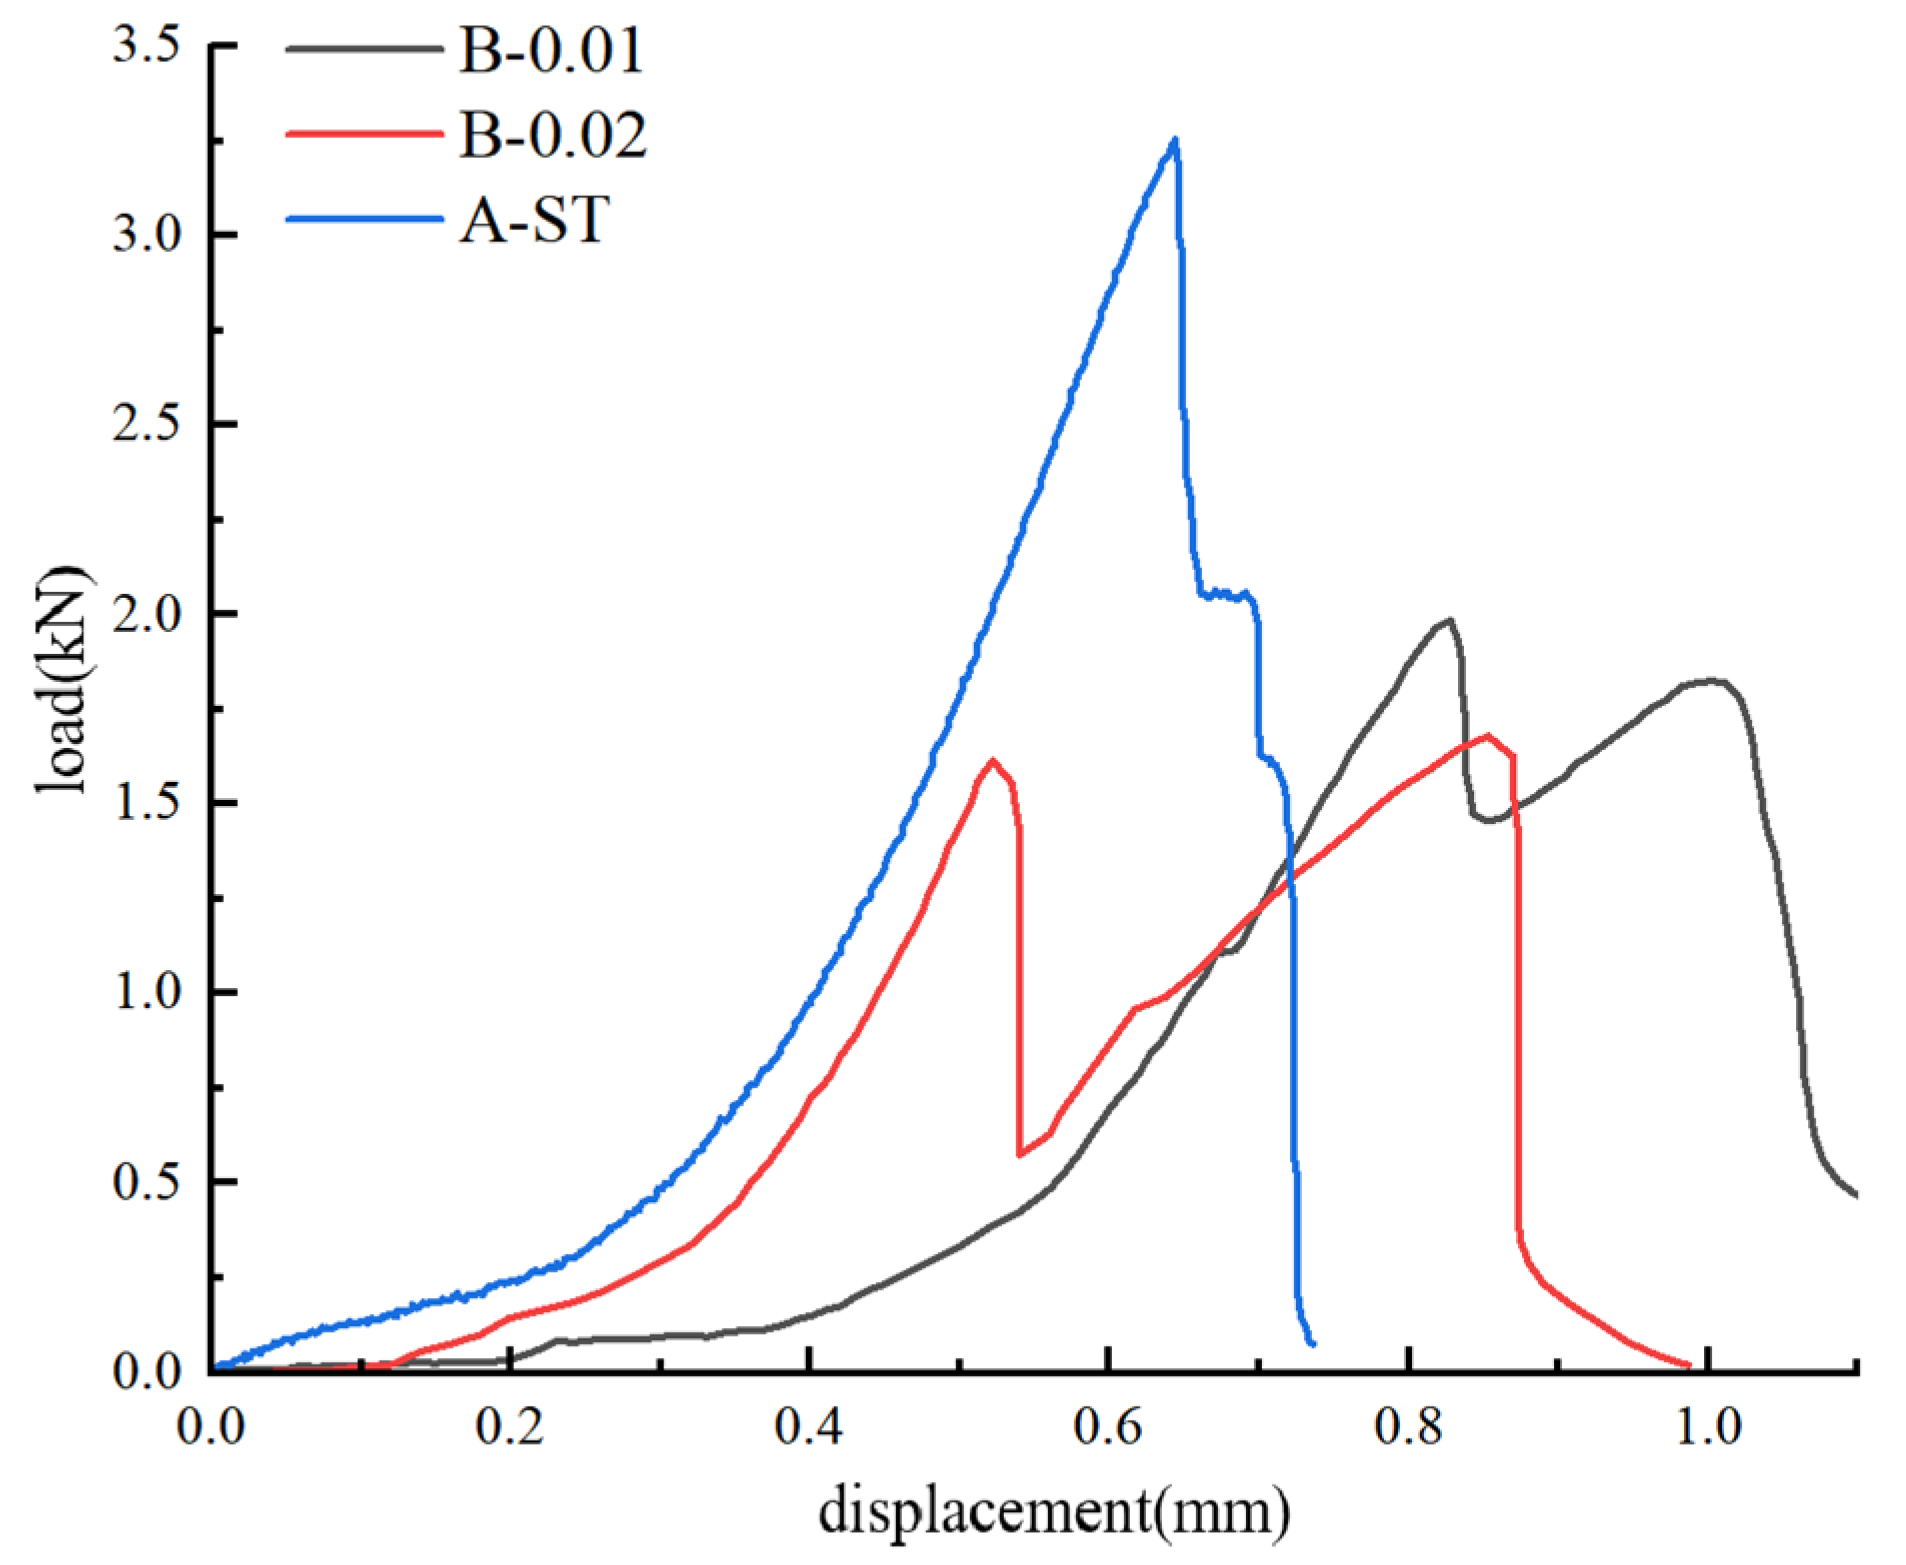
Figure 4 presents the load–displacement curves of layered composite rock masses under different loading rates. According to Table 2, the flexural strength of layered composite rock mass specimens is 1.35 MPa under the loading rate of 0.02 mm/s; when the loading rate decreases to 0.002 mm/s, the flexural strength increases to 2.80 MPa, with an increase rate of 107.4%. As the loading rate decreases from 0.02 mm/s to 0.002 mm/s, the peak load is reached when obvious macroscopic fracture development occurs in the lower tuff layer of the composite rock mass, increasing from 1.62 kN to 3.25 kN with an increase rate of 100.6%. Subsequently, after the lower tuff layer forms throughgoing fractures, the rock mass starts to take the upper fine sandstone layer as the bearing structure, and a peak load borne by the upper fine sandstone layer is generated, whose value increases from 1.68 kN to 2.06 kN with an increase rate of 22.6%.
With the decrease of loading rate, the flexural strength of the layered composite rock mass is significantly enhanced. The increase rate of the peak load reaches 100.6%, indicating that the lower tuff layer is more sensitive to the loading rate due to its maximum deformation at the same period. However, the increase rate of the second peak load during the instability stage is 22.6%, which is significantly smaller than that of the first peak load. This shows that the fracture development degree of fine sandstone is relatively mild under the condition of increased loading rate, and it is less affected by the loading rate. In contrast, as a component with stronger brittle properties, the fracture propagation of tuff is more easily disturbed by the loading rate, resulting in a significant attenuation of flexural strength. Under the influence of high loading rate, an abnormal situation occurs where the initial peak load (1.62 kN) is lower than the later peak load (1.68 kN). This indicates that in addition to the influence of the rock mass’s own properties on the flexural strength and peak load, there are other factors improving the overall stability of the layered composite rock mass, namely, the high strain rate leads to the lag of the complete loss of bonding effect at the interface behind the fracture of the tuff layer.
The conventional understanding that “higher loading rates lead to higher rock strength” only applies to homogeneous, intact, and low-porosity rock materials. The failure of such rocks is controlled by the initiation and propagation of primary fractures within the matrix. Under high loading rates, fractures lack sufficient time to initiate and propagate, and the material requires higher stress to drive fracture penetration; thus, the macroscopic strength increases with the increase of loading rate.
However, the layered composite rock mass studied in this paper is a heterogeneous soft–hard interbedded structure with natural weak interface planes. Its failure mode is not the tensile fracture of a single rock matrix, but is dominated by interlayer deformation mismatch, interfacial bonding failure, and the loss of the synergistic bearing mechanism between soft and hard rock layers—which is essentially different from the failure mechanism of homogeneous rocks. The authors attribute this difference to the following three core effects:
Strain rate sensitivity mismatch effect between soft and hard rock layers: The brittleness and strain rate sensitivity of tuff (soft rock) are much higher than those of fine sandstone (hard rock). Under high loading rates, external loads are input instantaneously, leading to asynchronous strain responses between soft and hard rock layers. The interlayer deformation difference increases instantaneously, generating significant shear stress at the interface, which causes premature failure of the interfacial bonding layer. The synergistic bearing mechanism of the composite beam is destroyed at the initial stage of loading, and the structure transitions from “integral beam-like bearing” to “separate bearing of the two rock layers”. The lower tuff layer undergoes rapid brittle fracture, resulting in a significant reduction in overall strength.
Crack evolution mode transition effect: Under low loading rates, microcracks have sufficient time to initiate and propagate in the mid-span tensile zone, dominated by Mode I tensile cracks, and the structure exhibits progressive failure with full exertion of bearing capacity. Under high loading rates, energy cannot be gradually dissipated through plastic deformation and progressive damage but is concentrated and rapidly released at the weak interface planes, triggering instantaneous penetration of Mode II shear cracks along the interface. Interlayer delamination develops rapidly, eventually leading to premature structural instability and a significant reduction in peak strength.
Energy dissipation mechanism difference effect: Under low loading rates, the externally input energy is gradually dissipated through interfacial friction and progressive microcrack propagation, allowing for the structure to sustain loads continuously, with the peak load corresponding to the penetration of the main mid-span crack. Under high loading rates, energy is released instantaneously and concentrated, with most of the energy used for interfacial bonding failure and interlayer delamination rather than the propagation of the main mid-span crack. The structure undergoes overall instability before the main crack is fully developed; thus, the macroscopic peak strength is significantly reduced.

3.2.3. Strength Analysis of Layered Composite Rock Mass Under Different Spans via Four-Point Bending Test

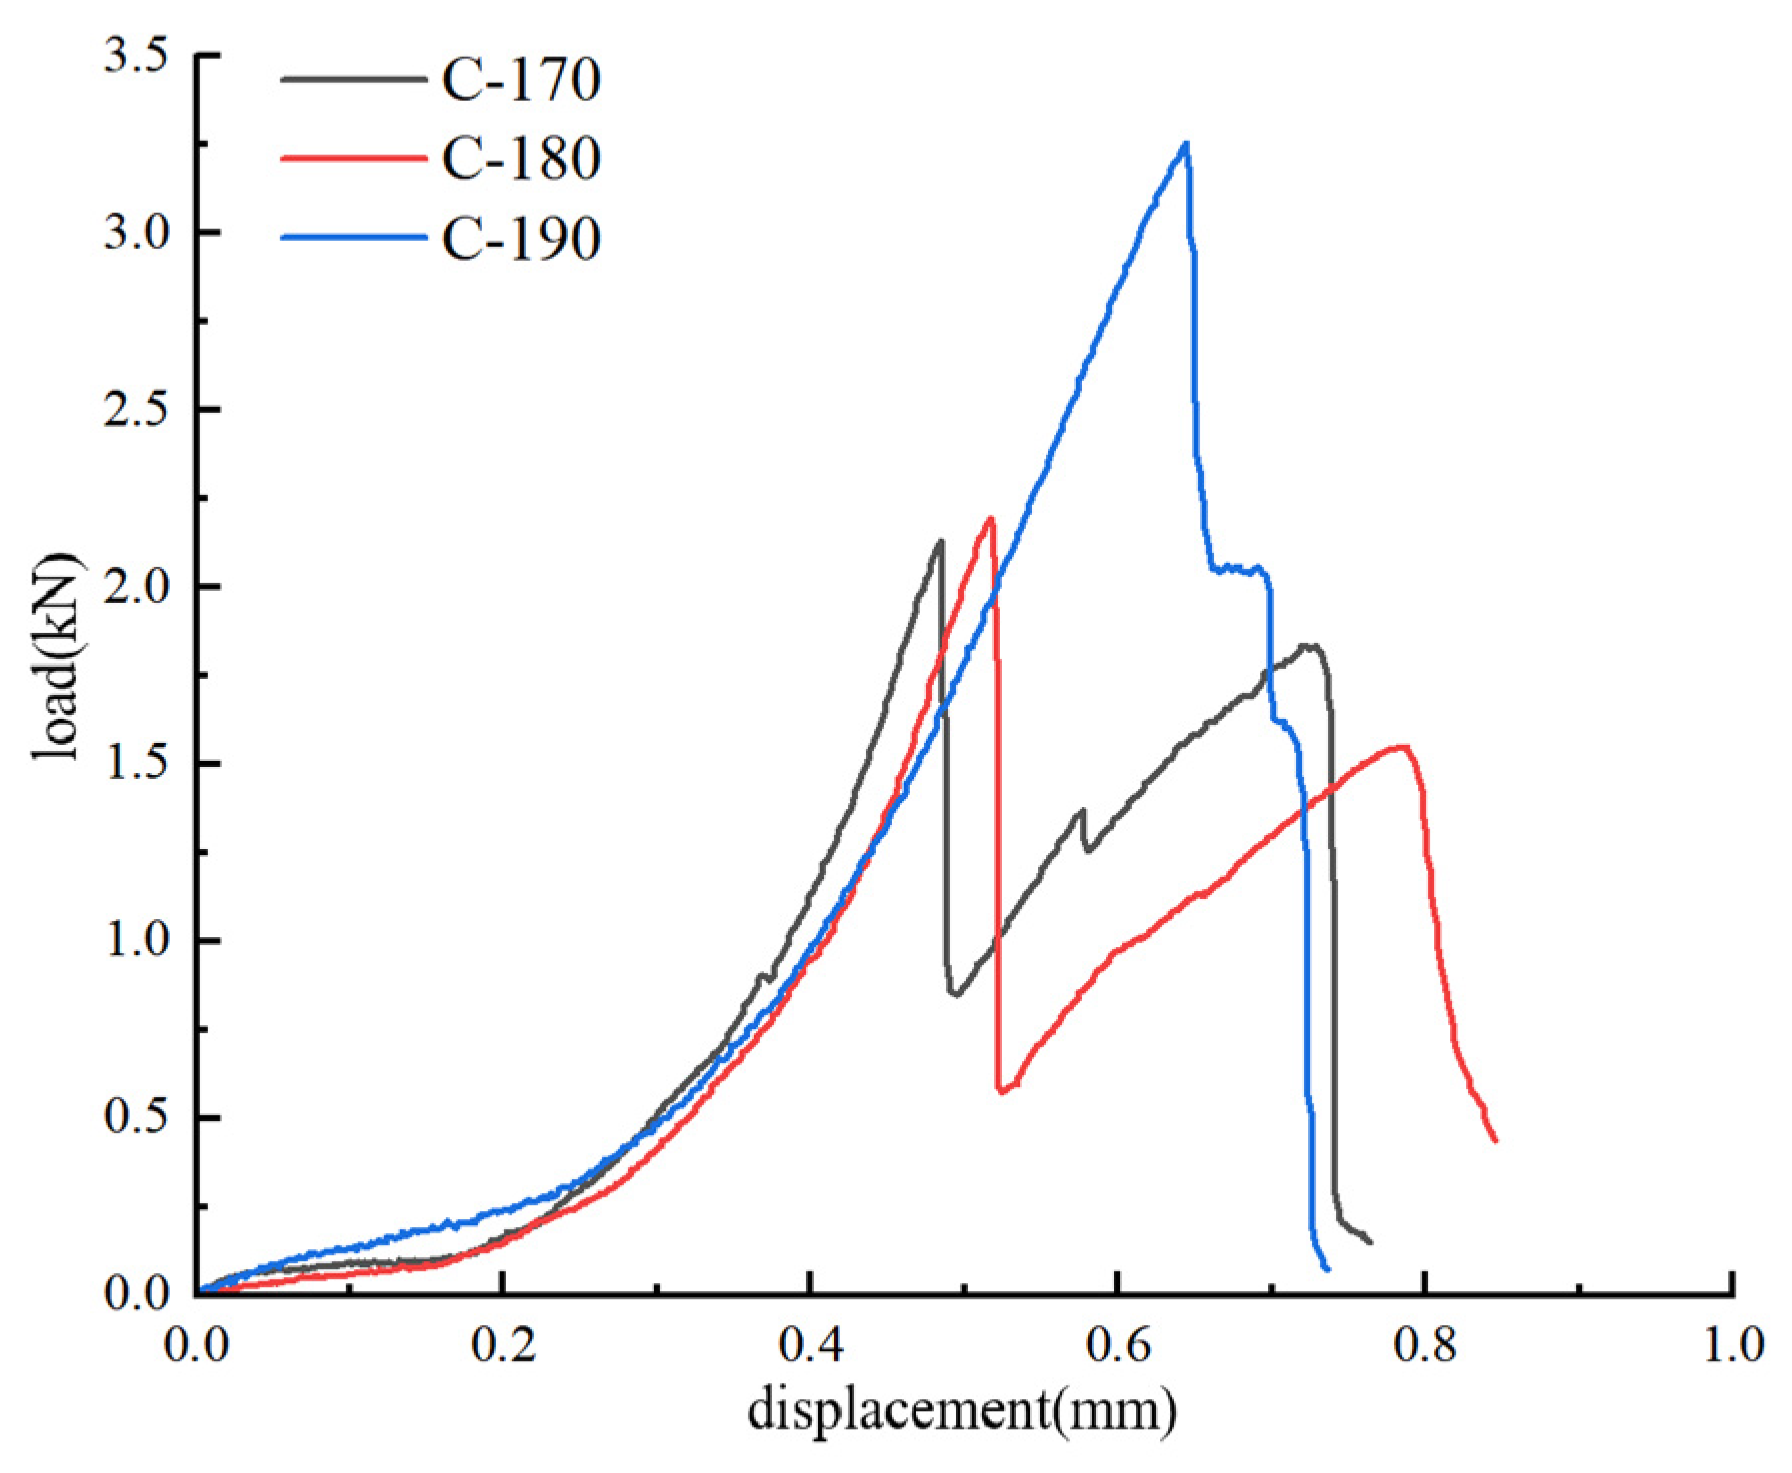
Figure 5 presents the load–displacement curves of layered composite rock masses under different spans. According to Table 2, the flexural strength of the layered composite rock mass member with a span of 190 mm is 2.80 MPa. Under the conditions of spans of 170 mm and 180 mm, the flexural strengths are 1.69 MPa and 1.77 MPa, respectively, with a decrease of 39.6% and 36.8% compared with that of the 190 mm span. When the span increases from 170 mm to 190 mm, the initial peak load shows a monotonous change characteristic: it is 2.13 kN at a span of 170 mm, reaches 2.20 kN at a span of 180 mm, and surges to 3.25 kN at a span of 190 mm, increasing by 3.3% and 52.6% respectively compared with the initial peak load at the 170 mm span. The later peak load reached when the upper fine sandstone layer is unstable shows a trend of first decreasing and then increasing: it is 1.83 kN at a span of 170 mm, decreases to 1.55 kN at a span of 180 mm (a decrease of 15.3% compared with that at the 170 mm span), and rises back to 2.06 kN at a span of 190 mm.
The flexural strength of the layered composite rock mass with a 190 mm span is significantly greater than that with 170 mm and 180 mm spans. There is an intensity difference between the flexural strength, the initial and later peak loads, which is inconsistent with the linear positive correlation between bending stress and span in the elastic beam theory. This indicates that the material mechanics theory under the homogeneous assumption is difficult to explain the strength improvement caused by the span effect of layered composite rock masses. When the span is increased, in addition to considering its own physical properties, the influence of interface bonding strength or interface friction energy consumption also needs to be taken into account.
Increasing the span, on the one hand, the layered composite rock mass can release the accumulated stress through bending deformation; on the other hand, before the bonding effect of the interface is completely lost, the tensile deformation of the lower surface of the fine sandstone layer of the rock mass is obvious, and the compressive deformation of the upper surface of the tuff layer of the rock mass is significant. The opposite movement trends of the two show a mutual competition mechanism, making the layered composite rock mass closer to a single-lithology rock mass in performance at the initial stage of deformation. Even if there is partial delamination at the interface, the friction between them can prevent interface dislocation to a certain extent.
When the span is close to three times the height of the specimen, that is, the flexural strength of the layered composite rock mass with a 180 mm span is closer to that with a 170 mm span, the bending stress distribution and the interlayer interface strength reach a dynamic balance. When bending deformation occurs, microcracks preferentially propagate along the interface, thereby triggering layered failure of the layered composite rock mass, reducing the synergistic bearing capacity of fine sandstone and tuff, and at this time, the own bearing capacity of the rock mass dominates.
In summary, before the instability of the load–time curves of layered composite rock masses with different spans, the curve growth trend presents a “U-shaped” pattern, and the bending deformation phenomenon is obvious. This indicates that the bending deformation of the layered composite rock mass is dominant, while the influence of brittle failure is negligible. In the instability failure stage, the curve of the layered composite rock mass shows a “V-shaped” trend with obvious brittle failure. At this time, under the condition of high load loading, the cracks in the fine sandstone layer develop significantly toward the loading points.

3.3. Analysis of Bending Deformation and Failure of Layered Composite Rock Mass via Four-Point Bending Test

3.3.1. Analysis of Bending Deformation and Failure of Layered Composite Rock Mass with Different Lithologies via Four-Point Bending Test

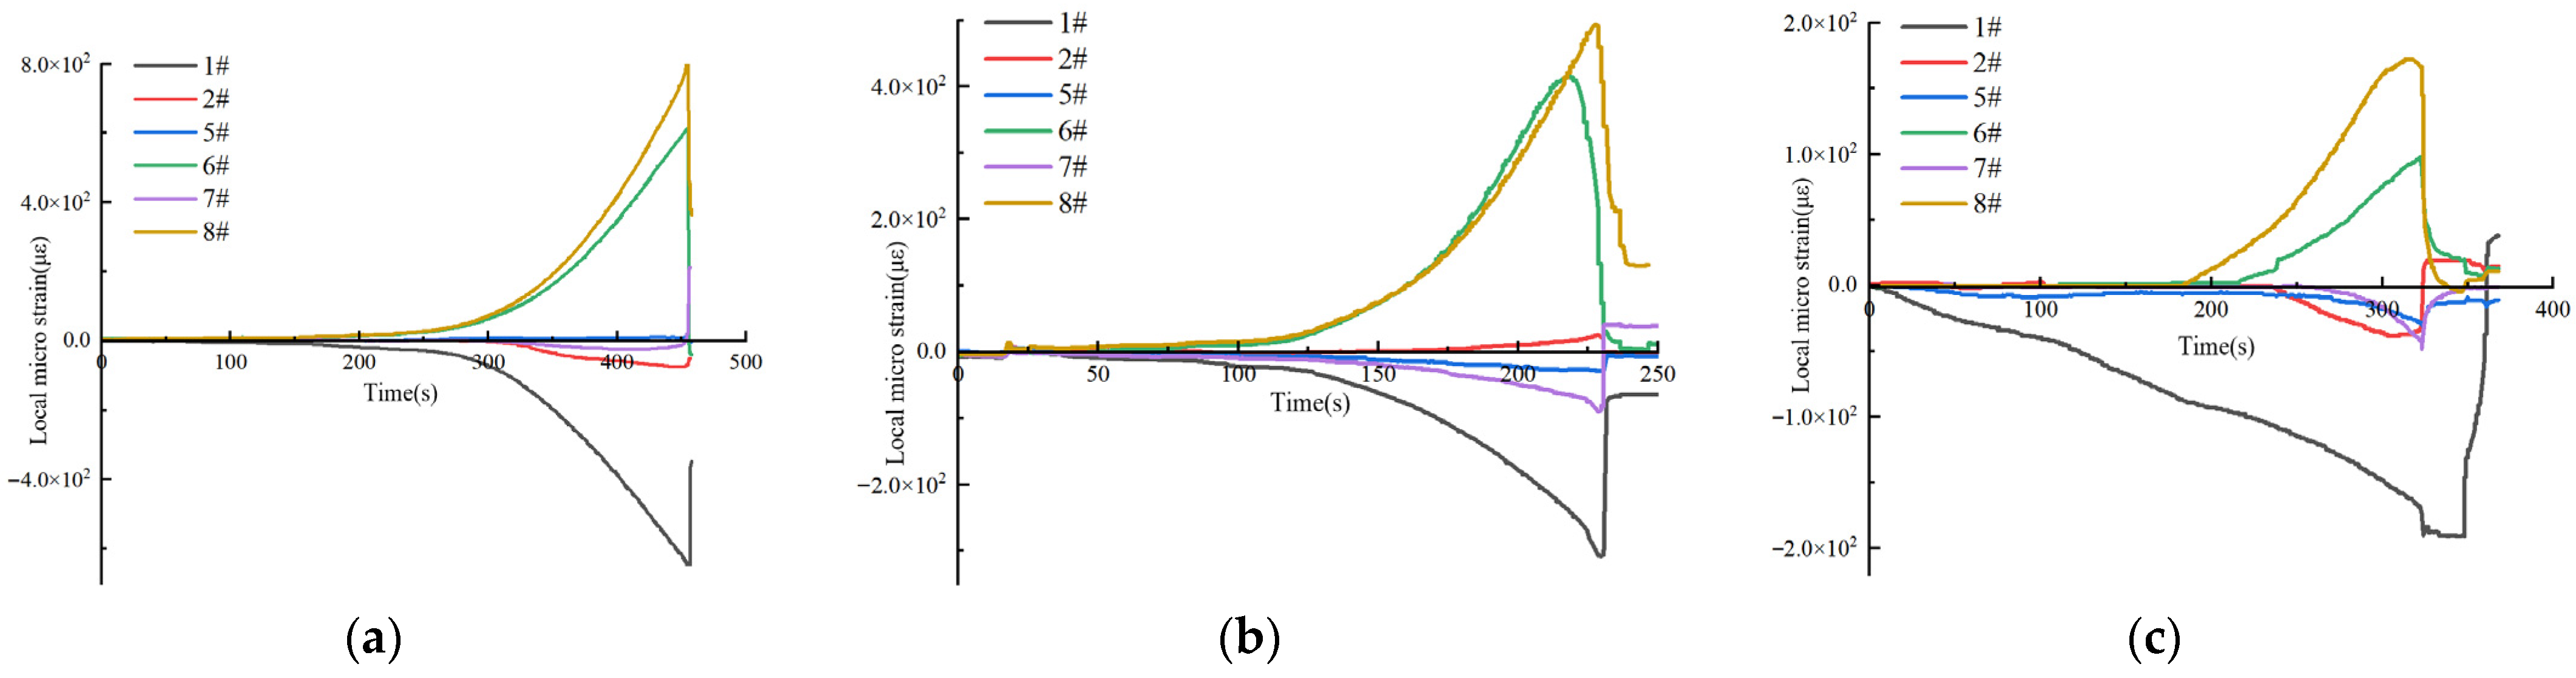
Figure 6 shows the local strain curves of layered composite rock masses with different lithologies. It can be seen from Figure 6a that the cracking time of the pure fine sandstone specimen is 456 s, the local microstrain monitored by strain gauge 8 reaches 841, and the microstrain of strain gauge 1 reaches −645. The local microstrain–time curve shows that the local microstrain of fine sandstone increases nonlinearly with loading time, the initial strain accumulation rate is low, and the deformation accelerates in the later stage due to the expansion of internal microcracks. This indicates that the pure fine sandstone specimen has high bending deformation capacity, and under the condition of low loading rate, its deformation process is dominated by progressive plastic deformation.
It can be seen from Figure 6b that the cracking time of the pure tuff specimen is shortened to 231.5 s, the local microstrain at 8 strain gauge is reduced from 841 (of the pure fine sandstone specimen) to 494, and the microstrain at 1 strain gauge reaches −306. This indicates that both the tensile strength and bending deformation capacity of tuff are significantly lower than those of fine sandstone. The tuff rapidly transitions from the compaction stage to the elastic stage at the initial loading stage, and then undergoes brittle instability failure within 88 s. At this time, the pure tuff specimen is dominated by the elastic deformation mechanism, and the mid-span tensile cracks penetrate rapidly.
It can be seen from Figure 6c that the cracking time of the lower tuff layer of the fine sandstone–tuff layered composite rock mass is 322 s, corresponding to 172 μ ε at strain gauge 8 and −184 μ ε strain gauge 1. The cracking time of the upper fine sandstone layer is 346.28 s, corresponding to 190 μ ε at strain gauge 8. Due to the short time interval, the cracks developed to the positions of strain gauges 2 and 7, resulting in damage to these two strain gauges. The cracking time of the layered composite rock mass is between that of the pure tuff specimen and the pure fine sandstone specimen. The strain distribution of the layered composite rock mass at the initial loading stage presents in homogeneity: the fine sandstone layer bears a large initial strain because it is in the lower layer, and the fine sandstone layer gradually shares the load through interface stress transfer, thus delaying the overall failure process. Meanwhile, the numerical differences between the maximum compressive strain and the maximum tensile strain of the pure fine sandstone specimen, pure tuff specimen, and layered composite rock mass are 196, 188, and 12, respectively. There are significant differences in local strain between the single-lithology specimens and the layered composite rock mass, indicating that the existence of the interface reduces the integrity of the member, leading to slow coordinated deformation performance of some rock layers during the bending deformation process.
Combined with the position data of strain gauges, a neutral axis is formed in the middle of the single-lithology rock mass, with the upper part of the neutral axis being the compression zone and the lower part being the tension zone. After the flexural failure of the lower part of the binary composite specimen, interface dislocation occurs, making the fine sandstone and tuff each form a neutral axis, which follows the same law as that of single-lithology rock masses—i.e., the upper part of the neutral axis is the compression zone and the lower part is the tension zone. Significant strain gradients are recorded by strain gauges 2, 5, and 7, verifying the phenomenon of stress concentration at the interface. This phenomenon transforms the deformation mode of the layered composite rock mass from the homogeneous deformation of a single material to layered deformation. Among them, the brittle failure of the tuff layer is partially inhibited by the slight deformation of the fine sandstone layer, resulting in the compaction time of the layered composite rock mass being better than that of the pure tuff specimen, thereby improving the overall flexural capacity of the layered composite rock mass. When excessive deformation occurs in the lower rock mass, leading to interlayer dislocation between the fine sandstone and tuff, the flexural capacity decreases significantly.

3.3.2. Analysis of Bending Deformation and Failure of Layered Composite Rock Mass Under Different Loading Rates via Four-Point Bending Test

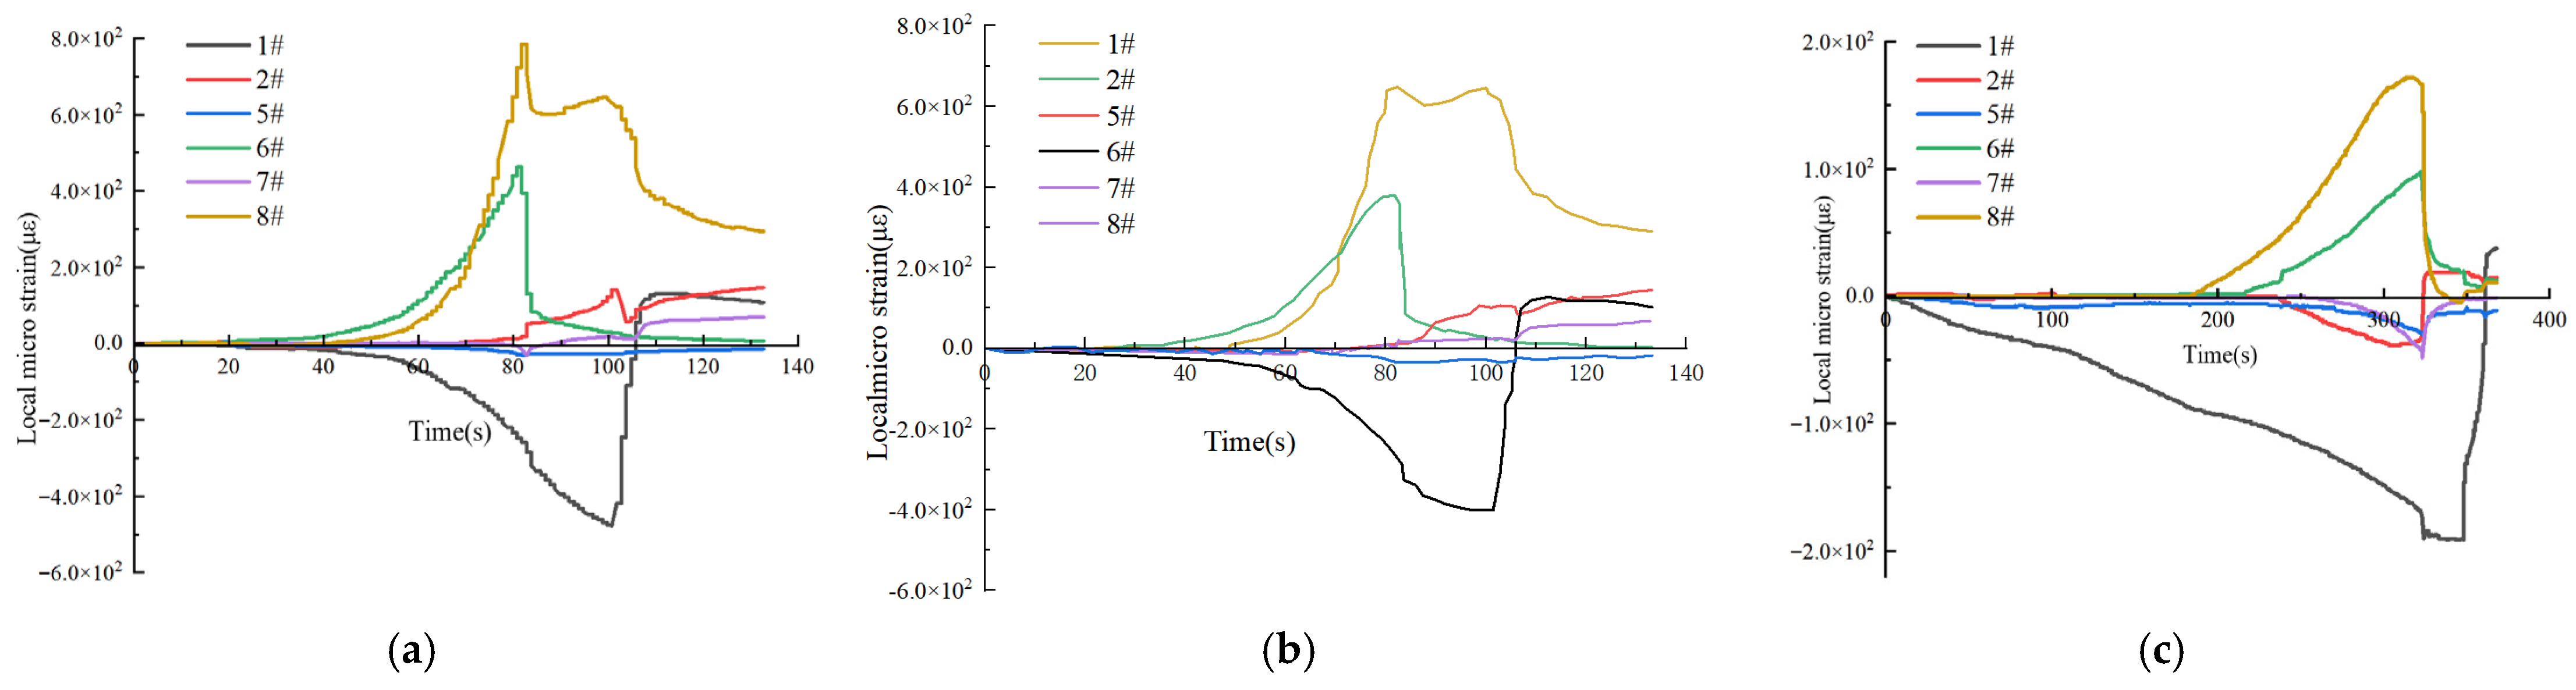
Figure 7 shows the local strain curves of layered composite rock masses under different loading rates. Compared with low-speed loading, the cracking time of the lower tuff layer of the layered composite rock mass is reduced by 296.9 s under high-speed loading conditions, and the development time of macroscopic cracks in the upper fine sandstone layer during layered failure is shortened from 346.28 s to 41.65 s. The loading rate shows a negative correlation with the mid-span deformation deflection and rock layer failure instability time of the layered composite rock mass. When the layered composite rock mass reaches the initial peak load under the high-speed loading condition of 0.02 mm/s, the microstrain at the position of strain gauge 1 is −142, the microstrain value of strain gauge 2 does not change significantly, and the microstrain of strain gauge 6 is 215, which is higher than 162 of strain gauge 8. This indicates that the synergistic advantage of rock mass bending deformation has not been fully exerted, and the numerical changes are more characterized by the development of microcracks along the shortest path between loading points. However, the more extreme deformation of the mid-span area at the moment of failure prevents the strain caused by the development of other cracks. When the layered composite rock mass reaches the later peak load, the microstrain of strain gauge 2 is 152, and the microstrain of strain gauge 1 is −370. Under high loading rate conditions, external loads accumulate rapidly inside the layered composite rock mass, leading to stress concentration, and there is a phenomenon that the effective length of the layered composite rock mass does not participate in deformation. The increase in loading rate inhibits the full development of plastic deformation, accelerates the brittle failure process, and leads to more disorderly crack development. Compared with the low-speed loading of 0.002 mm/s, the local microstrain–time curve shows a gentle upward trend, and the bending deformation characteristics are more obvious. Under high-speed loading conditions, the layered composite rock mass is closer to brittle fracture with a small initial deformation range and sudden loss of bearing capacity.
Under the low-speed loading condition of 0.002 mm/s, strain gauges 2, 5, and 7 show small differences in the changes to longitudinal strain data, indicating that the interlayer bonding effect is obvious. The opposite deformation trends of the two lithologies inhibit the strain gradient at the interface, prompting the two lithologies (fine sandstone and tuff) to cooperatively share the load, which further delays the development of mid-span cracks caused by bending deformation and forces the layered composite rock mass to be closer to the pure fine sandstone specimen in terms of crack development time. At this time, part of the load of the lower tuff layer is borne by the upper fine sandstone layer, which prolongs the bending deformation time of the tuff—i.e., the brittle properties of the tuff are inhibited by the ductile characteristics of the fine sandstone, and the overall bending deformation is dominated by progressive layered slip.
When the loading rate is 0.01 mm/s, the microstrain of strain gauge 8 is 785 and that of strain gauge 1 is −319 when the layered composite rock mass reaches the initial peak load; when it reaches the later peak load, the microstrain of strain gauge 8 is 646 and that of strain gauge 1 is −469. Compared with rock samples under high-speed loading, it shows improved bending deformation capacity, but the continuity of the local microstrain–time curve is worse. The deformation deflection at a loading rate of 0.002 mm/s is 63.4% higher than that at 0.01 mm/s, and the specimen deformation increases significantly with the decrease of loading rate, indicating that the time-dependent deformation characteristics of the material dominate under low-speed conditions; when the loading rate exceeds 0.01 mm/s, the decreasing rate of deformation deflection slows down, indicating that the brittle mechanism dominated by the strain rate effect tends to be saturated.
The deformation coordination of the layered composite rock mass weakens with the increase of loading rate. Under the working condition of 0.002 mm/s, the cracking time of tuff is 322 s, and its mid-span deformation deflection is quite different from that of the single-lithology rock mass, indicating that the interface stress redistribution effectively coordinates the difference in bending deformation. However, at 0.02 mm/s, the cracking time of tuff is 25.1 s, and the difference in deformation deflection increases significantly. The interface synergistic effect is weakened due to strain rate mismatch. This indicates that an excessively high loading rate may aggravate the layered deformation of the layered composite rock mass and reduce its overall flexural stability.

3.3.3. Bending Deformation and Failure of Layered Composite Rock Mass Under Different Spans via Four-Point Bending Test

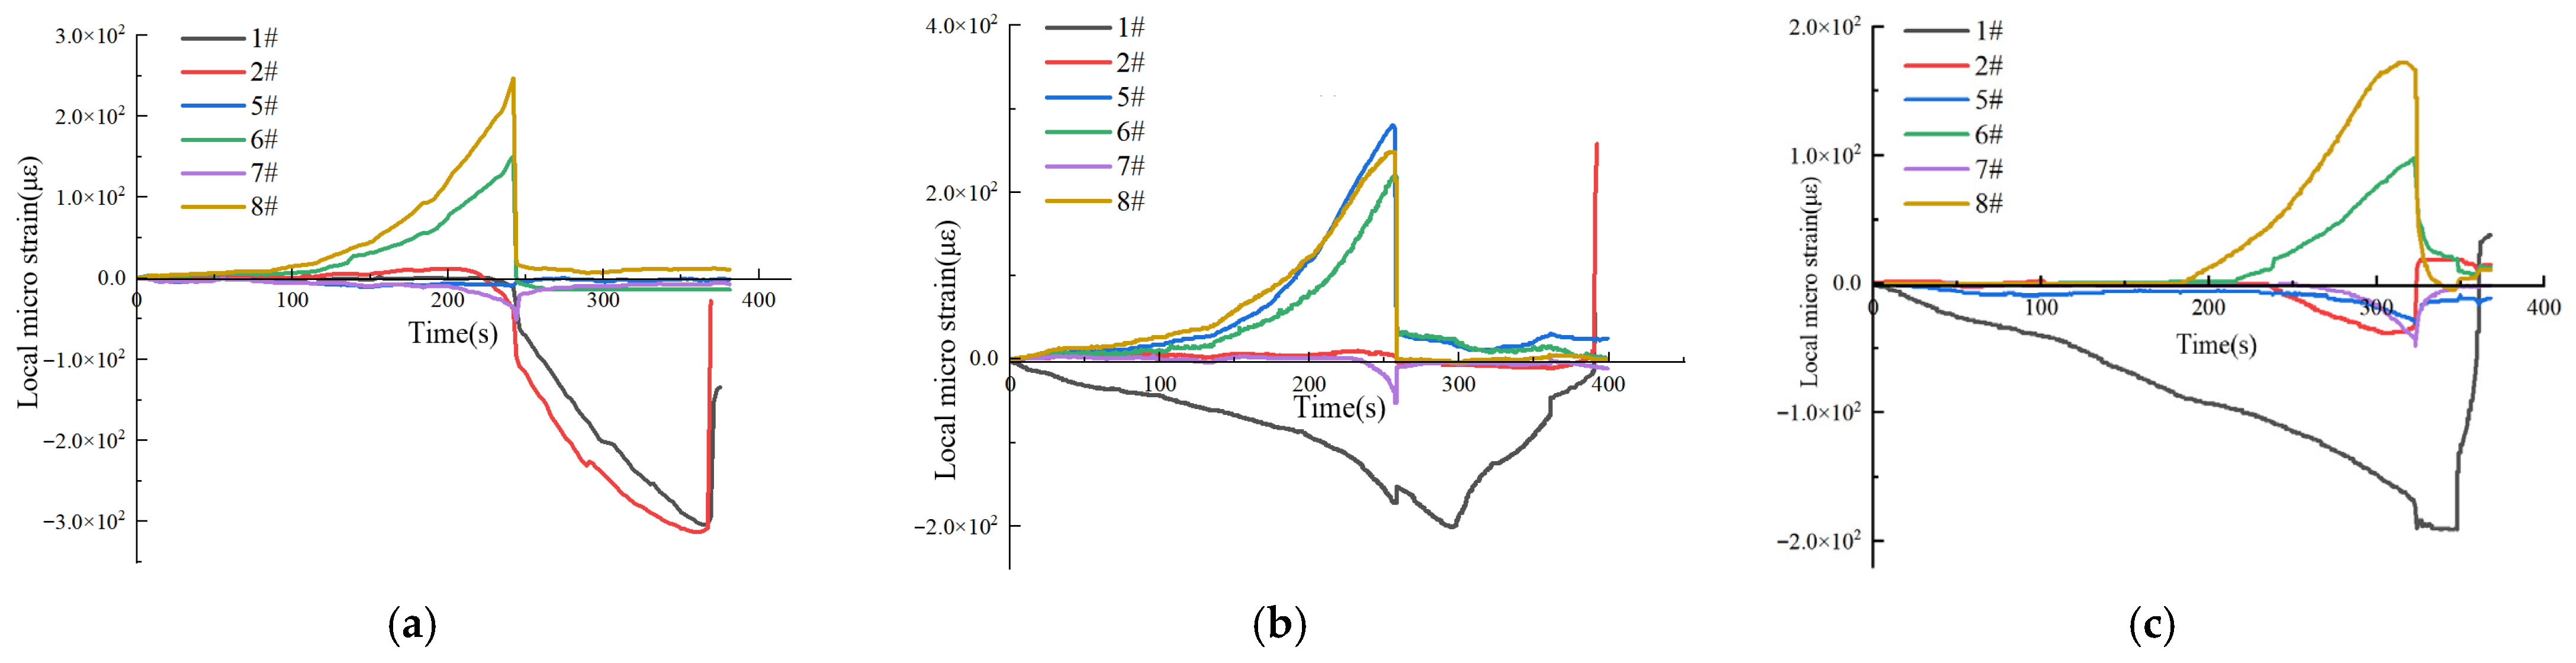
Figure 8 shows the local strain curves of layered composite rock masses under different spans. When transitioning from a low span to a high span, the development time of macroscopic cracks in the lower tuff layer of the layered composite rock mass increases from 242 s to 322 s, and the cracking interval between the upper fine sandstone layer and the tuff layer decreases from 118 s to 24.28 s. This indicates that the span has a regulatory effect on the failure and instability time of different lithological rock layers of the layered composite rock mass. The increase in span improves the effective length for bearing the load, allowing for the rock mass to release stress through bending deformation and delay the stress concentration in the lower tuff layer. The upper fine sandstone layer is more susceptible to local load fluctuations due to the span and accelerates crack propagation according to the degree of stress concentration when mid-span cracks occur. Under spans of 170 mm and 180 mm, severe strain fluctuations are recorded by the data of strain gauges 2 and 5. Under the 170 mm span condition, strain gauges 2 and 1 are damaged simultaneously and have the same value, which is inconsistent with the division of stress-bearing areas. This indicates that the layered composite rock mass undergoes brittle failure and cracks develop to the positions of the strain gauges to produce such a phenomenon. When the span increases to 180 mm, obvious numerical changes of strain gauge 2 only occur when the fine sandstone layer is damaged, and the value of strain gauge 5 is higher than that of strain gauge 8. This shows that the layered composite rock mass with a 180 mm span begins to show bending deformation characteristics, but some areas undergo brittle failure. However, in the final failure stage, mid-span cracks develop rapidly, and the areas showing brittle failure only remain in the microstrain range.
Span variation significantly affects the interface stress transfer efficiency by changing the specimen geometric configuration. Under the small span working condition of 170 mm, when the layered composite rock mass reaches the initial peak load, the microstrain of strain gauge 8 is 247 and the absolute value of the microstrain of strain gauge 2 is 109, which is higher than the 62 of strain gauge 1. The abnormal values of the strain gauges indicate that the geometric size of the layered composite rock mass with a 170 mm span limits bending deformation, making the fine sandstone layer bear more compressive strain. When the layered composite rock mass reaches the later peak load, strain gauge 2 reaches −313 μ ε at 360 s and strain gauge 1 reaches −308 μ ε 367 s. This indicates that when the span decreases, the brittle failure performance of the layered composite rock mass is significantly enhanced, and the overall instability of the layered composite rock mass occurs before the lower part of the upper fine sandstone layer can convert from compressive strain to tensile strain.
When the span is 180 mm, the microstrain of strain gauge 1 is −172 and the microstrain of strain gauge 5 is 280, which is higher than the 248 of strain gauge 8, when the layered composite rock mass reaches the initial peak load. After the crack penetration of the tuff layer in the layered composite rock mass, the strain gauge monitoring becomes more disorderly. Before the strain gauge 1 reaches the crack development of the fine sandstone layer, the strain value increases to −199 μ ε and then decreases rapidly, and the strain gauge fails after the overall instability of the rock mass. Other strain gauges show slight tension, indicating that the bending deformation increases and the interlayer bonding effect fails faster. The combined effect of the two leads to confusion in the strain gauge monitoring data.
When the span is less than 180 mm, the bending deformation of the layered composite rock mass is dominated by brittle layered failure, and the microstrain curve shows chaotic local tension/compression stress due to brittle failure; when the span exceeds 180 mm, the deformation mode transitions to progressive failure dominated by the bending failure of the layered composite rock mass, and the local strain becomes regular.
The high toughness of fine sandstone enables it to absorb energy through ductile deformation under large-span conditions, while the brittle characteristics of tuff are amplified by stress concentration at small spans. During the period between the two peak loads, the mid-span deformation deflection under the conditions of 170 mm span and 180 mm span are 4.58 × 10⁻³ mm and 5.42 × 10⁻³ mm, respectively. Increasing the span by 10 mm results in an increase of 18.3%, indicating that increasing the span can optimize the deformation matching degree between lithologies by extending the load path and improve the overall flexural performance of the layered composite rock mass.

4. Crack Development Analysis of Layered Composite Rock Mass

4.1. Statistical Analysis of Crack Types in Layered Sandstone Based on Experimental Observations

Based on fracture mechanics theory and experimental image monitoring results, the classification and judgment criteria of rock crack types in this test are presented in Table 3. During the failure process of layered composite rock masses, Mode I and Mode II cracks often dominate alternately, and Mode II cracks induced by rock layer interface slip are the key inducement for the instability of layered structures.
In the four-point bending test, the statistical results of fissure development forms for each group of specimens are summarized in Table 4.

4.2. Crack Development Analysis of Layered Composite Rock Mass with Different Lithologies via Four-Point Bending Test

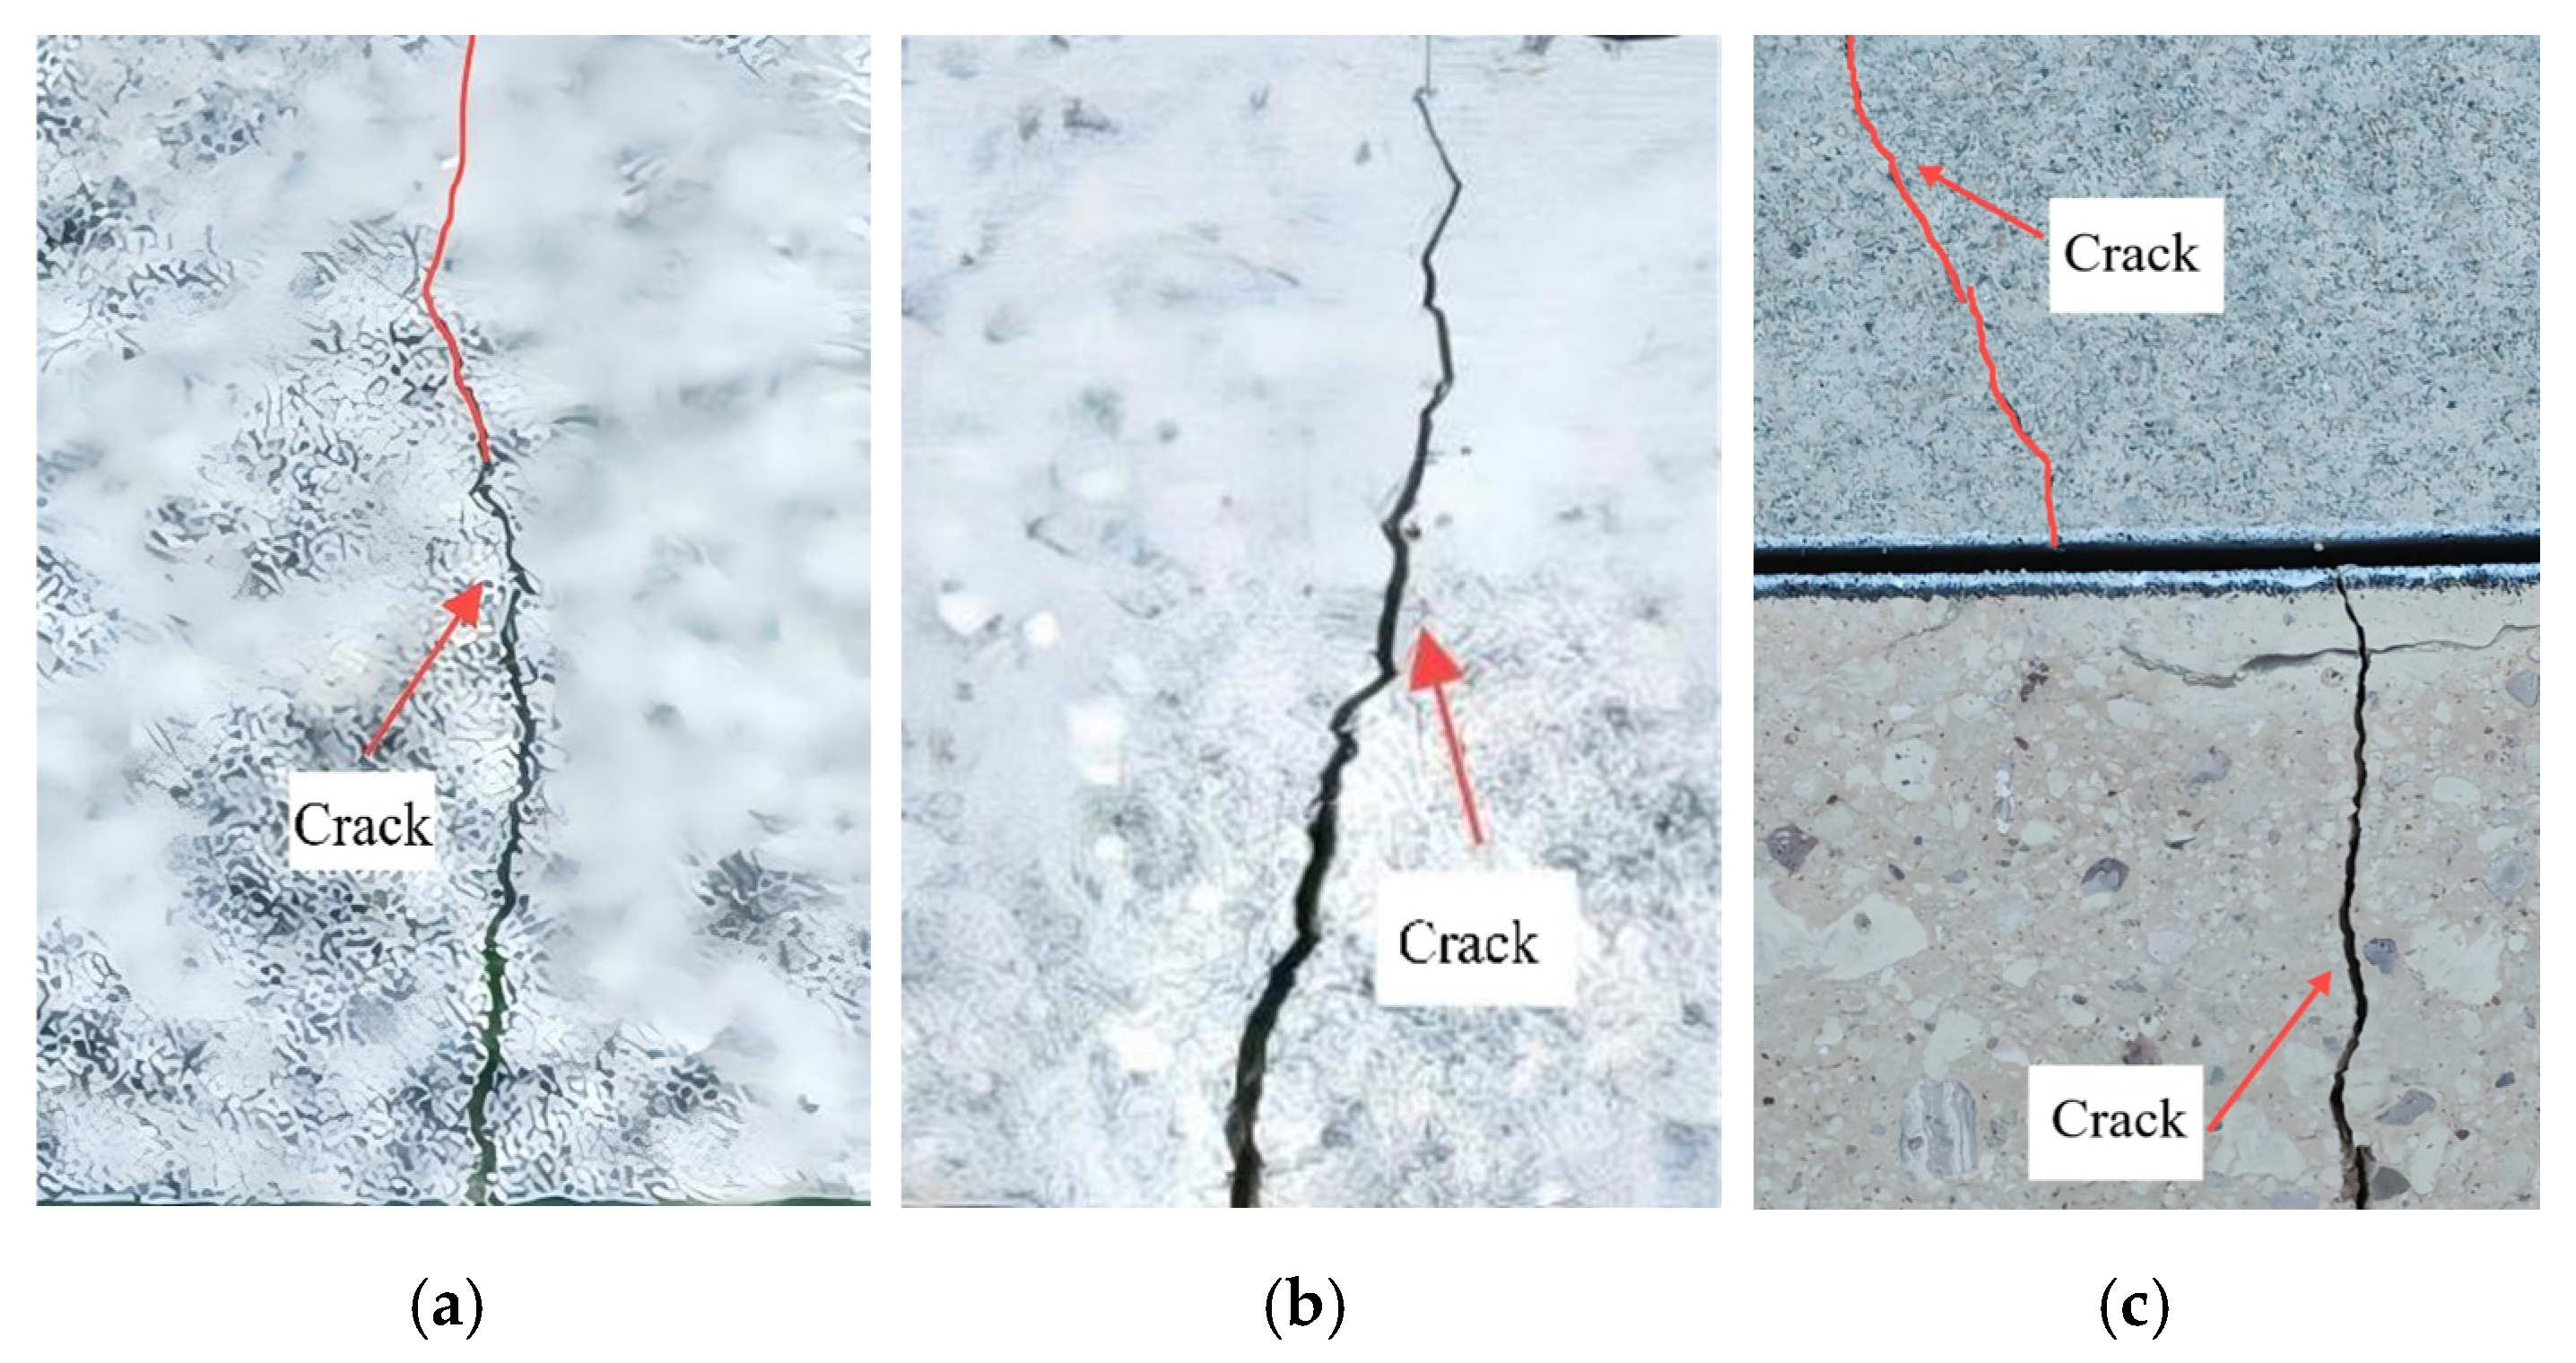
It can be seen from Figure 9 that the pure fine sandstone specimen has high flexural strength, and the crack propagation presents progressive characteristics. Strain gauge data show that microcracks gradually accumulate along grain boundaries in the elastic stage, and a penetrating Type I main crack is formed after the peak load. The fracture surface has high roughness, indicating ductile fracture characteristics; the flexural strength of the pure tuff specimen is 4.75 MPa, with significant brittleness. Cracks initiate in the mid-span area and then penetrate rapidly, and the fracture surface is smoother than that of the pure fine sandstone specimen, accompanied by a small number of radial secondary cracks.
Compared with pure single-lithology rock mass specimens, the layered composite rock mass exhibits an obvious layered failure phenomenon, and the cracks generated at the interface are Type II cracks. When no macroscopic cracks develop in the lower tuff layer, the layered composite rock mass bears the load as a whole, and a peak load is generated when the lower tuff layer reaches the critical state of crack initiation. During the development of cracks in the lower layer, the bearing capacity decreases significantly. Although the tuff layer loses its bearing capacity due to penetrating failure, it is difficult to observe the compaction stage of the upper fine sandstone layer at this time because it is in a high-load period, which manifests as elastic deformation. The second peak load is reached when the overall instability occurs. Due to the short interval between the layered fracture stage and the complete instability stage—and in practical engineering—rock layer layered fracture is a serious instability accident, and separately dividing the stages is not consistent with reality. Therefore, the unified layered fracture stage and bending instability stage are referred to as the instability failure stage. The crack path of the layered composite rock mass is regulated by the interface mechanical properties. Interface bonding enables the compressive strain of the lower rock mass to inhibit the tensile strain of the upper fine sandstone, delays crack penetration, and finally the local strain is significantly lower than that of the pure fine sandstone specimen. This indicates that the interface bonding can significantly improve crack resistance, but it is necessary to prevent interlayer dislocation leading to stress concentration.

4.3. Crack Development Analysis of Layered Composite Rock Mass Under Different Loading Rates

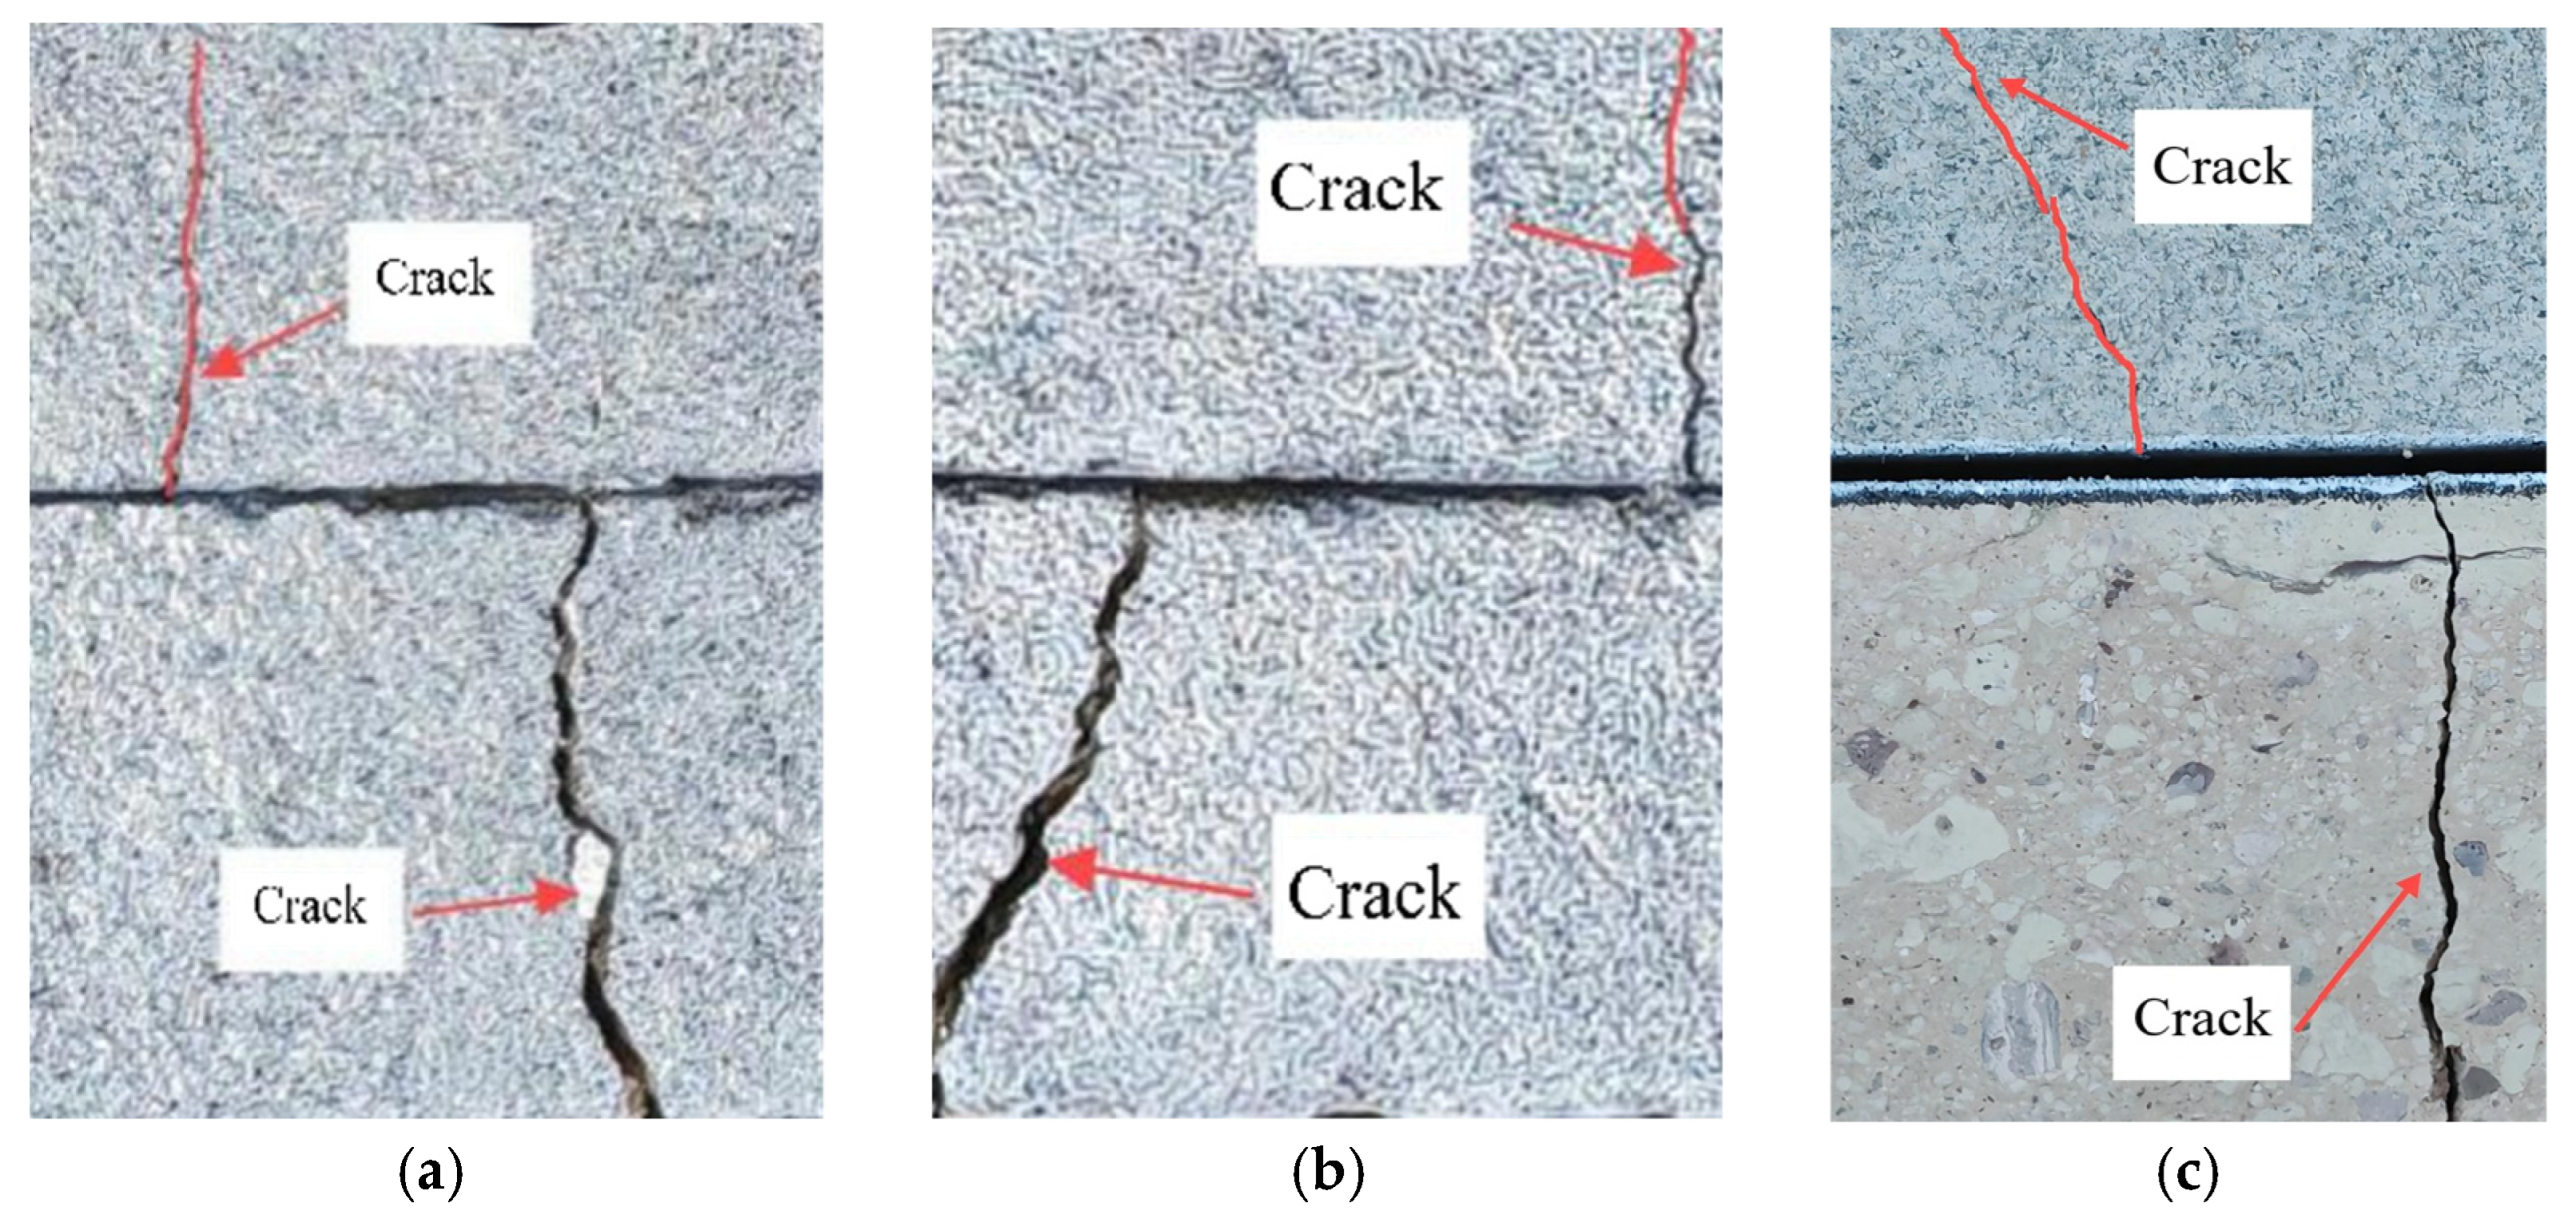
It can be seen from Figure 10 that under low-speed loading conditions, microcracks at the interface are dominated by accumulation, with a low propagation rate and tortuous crack paths. The accumulated energy is gradually released through plastic deformation, avoiding sudden instability failure caused by insufficient bearing capacity. The gentle strain gradient at the interface recorded by strain gauge 2 indicates high stress transfer efficiency, which delays the initiation of the main crack.
Under high-speed loading conditions, the external energy input rate exceeds the energy dissipation capacity of the interface, resulting in the sudden penetration of Type II and Type I cracks. The crack path is straight with significant brittle fracture characteristics. Strain gauge 2 records an instantaneous strain jump, with a peak microstrain of 152, indicating that local stress overload triggers unstable crack propagation.
In this experimental design, 0.01 mm/s is taken as the critical rate. When the loading rate is higher than 0.01 mm/s, the interface cooperative bending deformation effect of the layered composite rock mass weakens, and the crack propagation mode transforms from “plastic accumulation” to “brittle dominance”, showing that rate control is crucial to suppressing sudden failure.
In addition, under low-speed loading, the macroscopic crack development time of the layered composite rock mass is 322 s, which falls between 231.5 s for the tuff specimen and 456 s for the fine sandstone specimen. This indicates that the interfacial synergistic effect delays layered failure. Under high-speed loading, however, the overall instability of the layered composite rock mass occurs at only 41.7 s, implying reduced interfacial stress transfer efficiency and aggravated layered failure.
This phenomenon can also be explained by the time-dependent crack propagation mechanism. At low loading rates, the crack tips have sufficient time to seek weak zones, resulting in longer crack paths and higher crack propagation resistance. Meanwhile, during the slow crack development, frictional slip gradually occurs at the interfacial contact surface. The rock mass dissipates the internally accumulated energy through friction, further slowing down the development of the main crack.

4.4. Crack Development Analysis of Layered Composite Rock Mass Under Different Spans

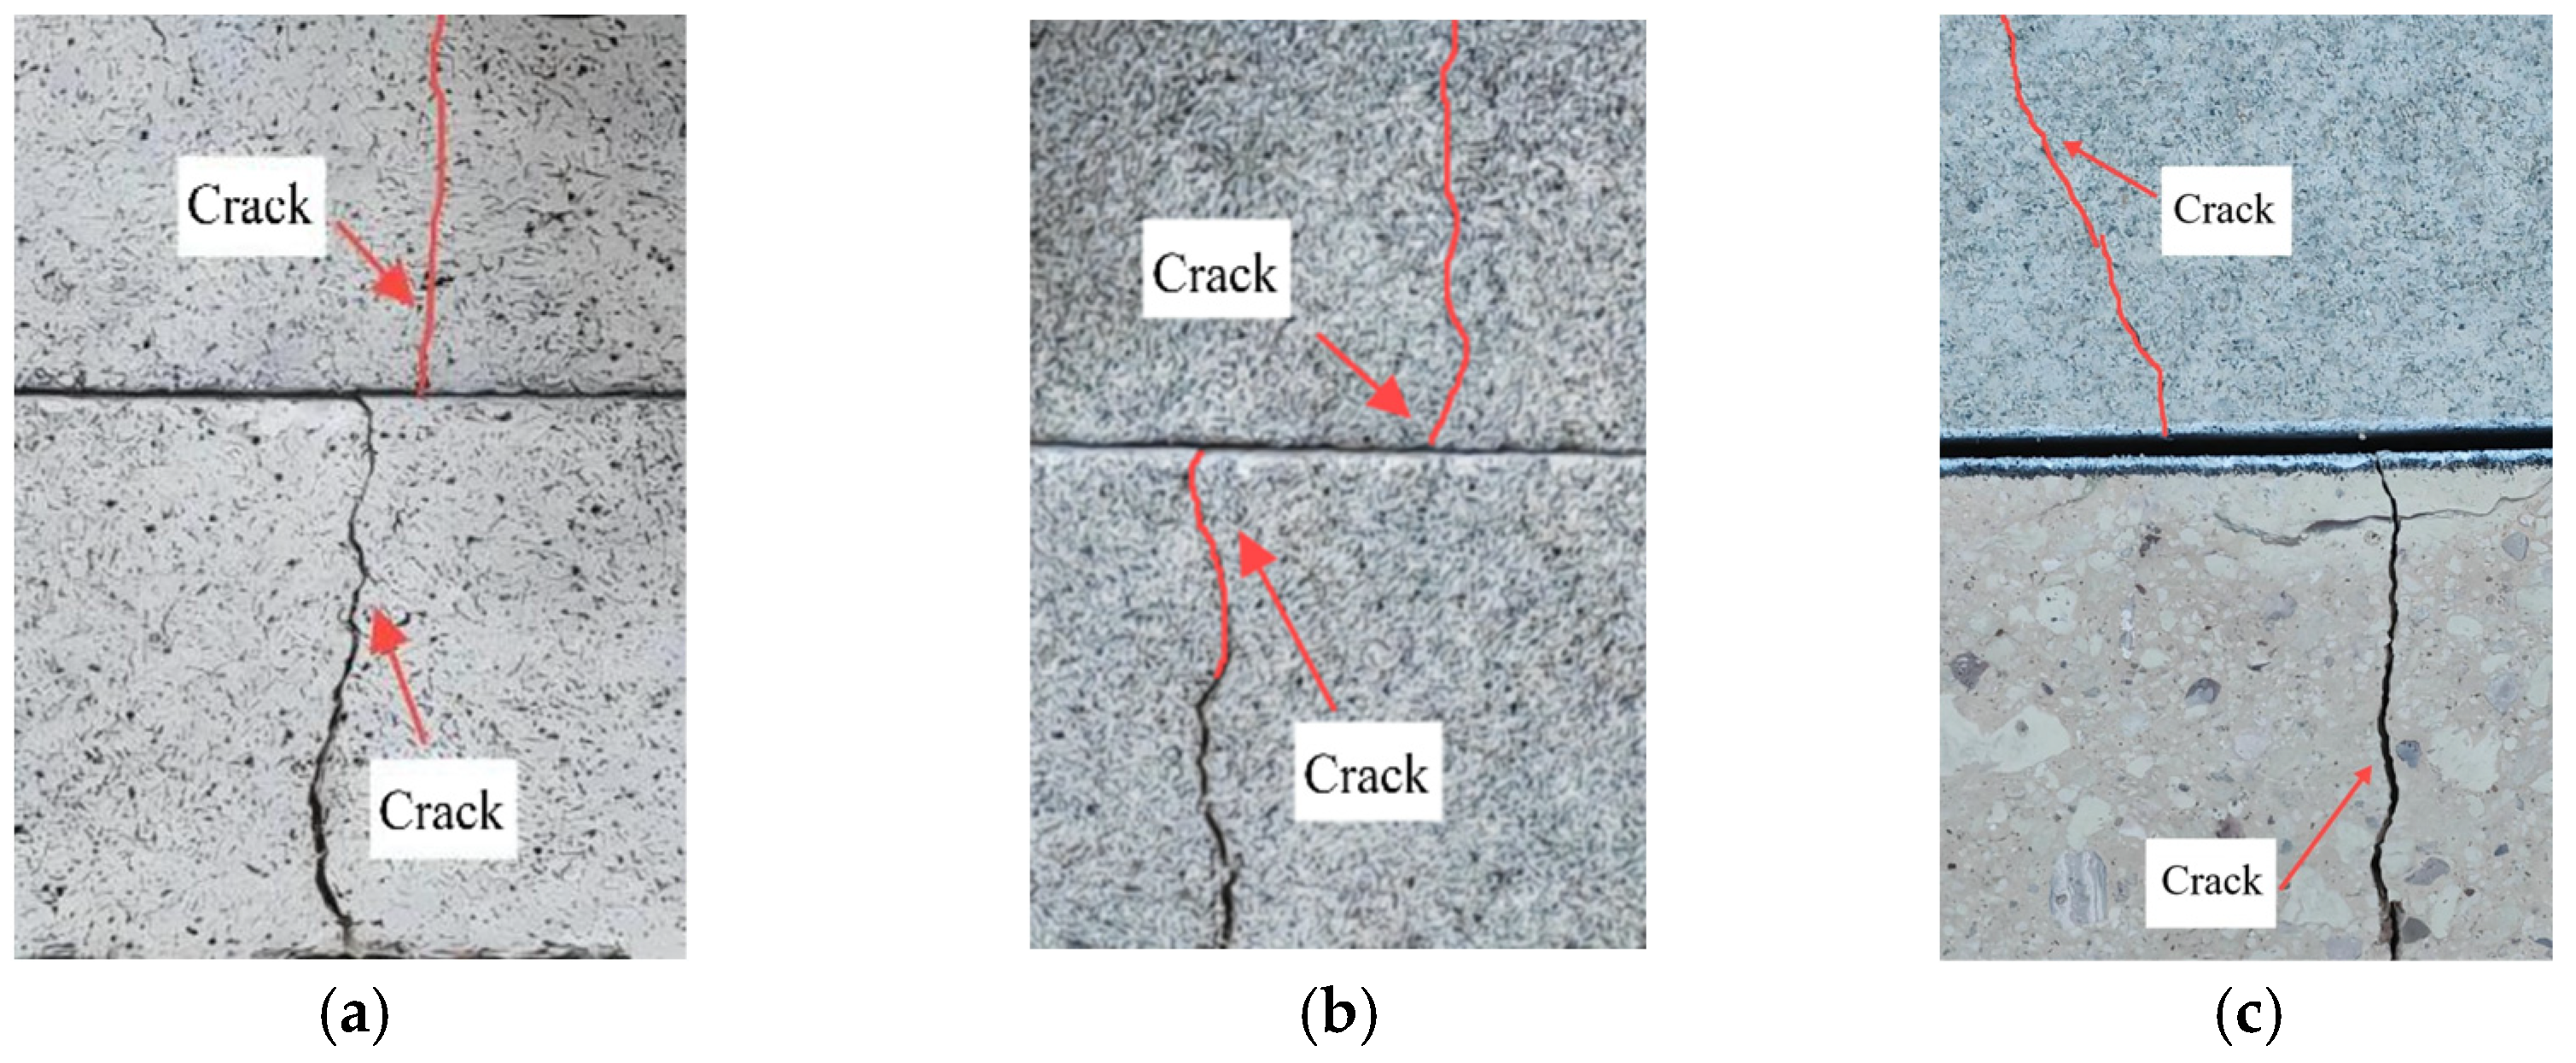
It can be seen from Figure 11 that for the layered composite rock mass with a small span of 170 mm, the load is concentrated near the loading points. Type II cracks first occur in the contact area at the interface. Type I cracks rapidly initiate in the mid-span region of the lower tuff layer at 242 s, showing vertical development and a short propagation path with a propagation time of 118 s, and no obvious bending deformation is observed. The sharp increase in the strain gradient at the interface recorded by strain gauge 2 indicates a significant stress concentration effect. Under the medium span of 180 mm, the crack initiation position shifts toward the mid-span, but the interface remains the stress concentration zone, and Type II cracks at the interface become more obvious. The crack development path begins to show an inclined propagation trend. Under the large span of 190 mm, the bending stress is distributed uniformly. Cracks initiate at the mid-span and propagate obliquely along the interface, with longer paths, longer propagation times and finer cracks. The absolute value of the mid-span strain recorded by strain gauge 2 decreases from 97 μ ε at 170 mm to 35 μ ε . This shows that increasing the span raises the effective bearing length of the layered composite rock mass and leads to a uniform distribution of bending stress at the mid-span interface.
The peak local tensile strain of the lower tuff layer decreases from 247 μ ε at 170 mm to 172 μ ε at 190 mm. Increasing the span leads to a more uniform bending stress distribution by extending the load path, which delays the tensile stress concentration in the mid-span of the tuff. This difference in stress distribution postpones the fracture of the tuff layer, but the interface slip increases synchronously.

5. Acoustic Emission Response Law of Layered Composite Rock Mass in Four-Point Bending Test

5.1. Acoustic Emission Characteristic Analysis of Layered Composite Rock Mass

5.1.1. Characteristics of Acoustic Emission Ring Count of Layered Composite Rock Mass with Different Lithologies

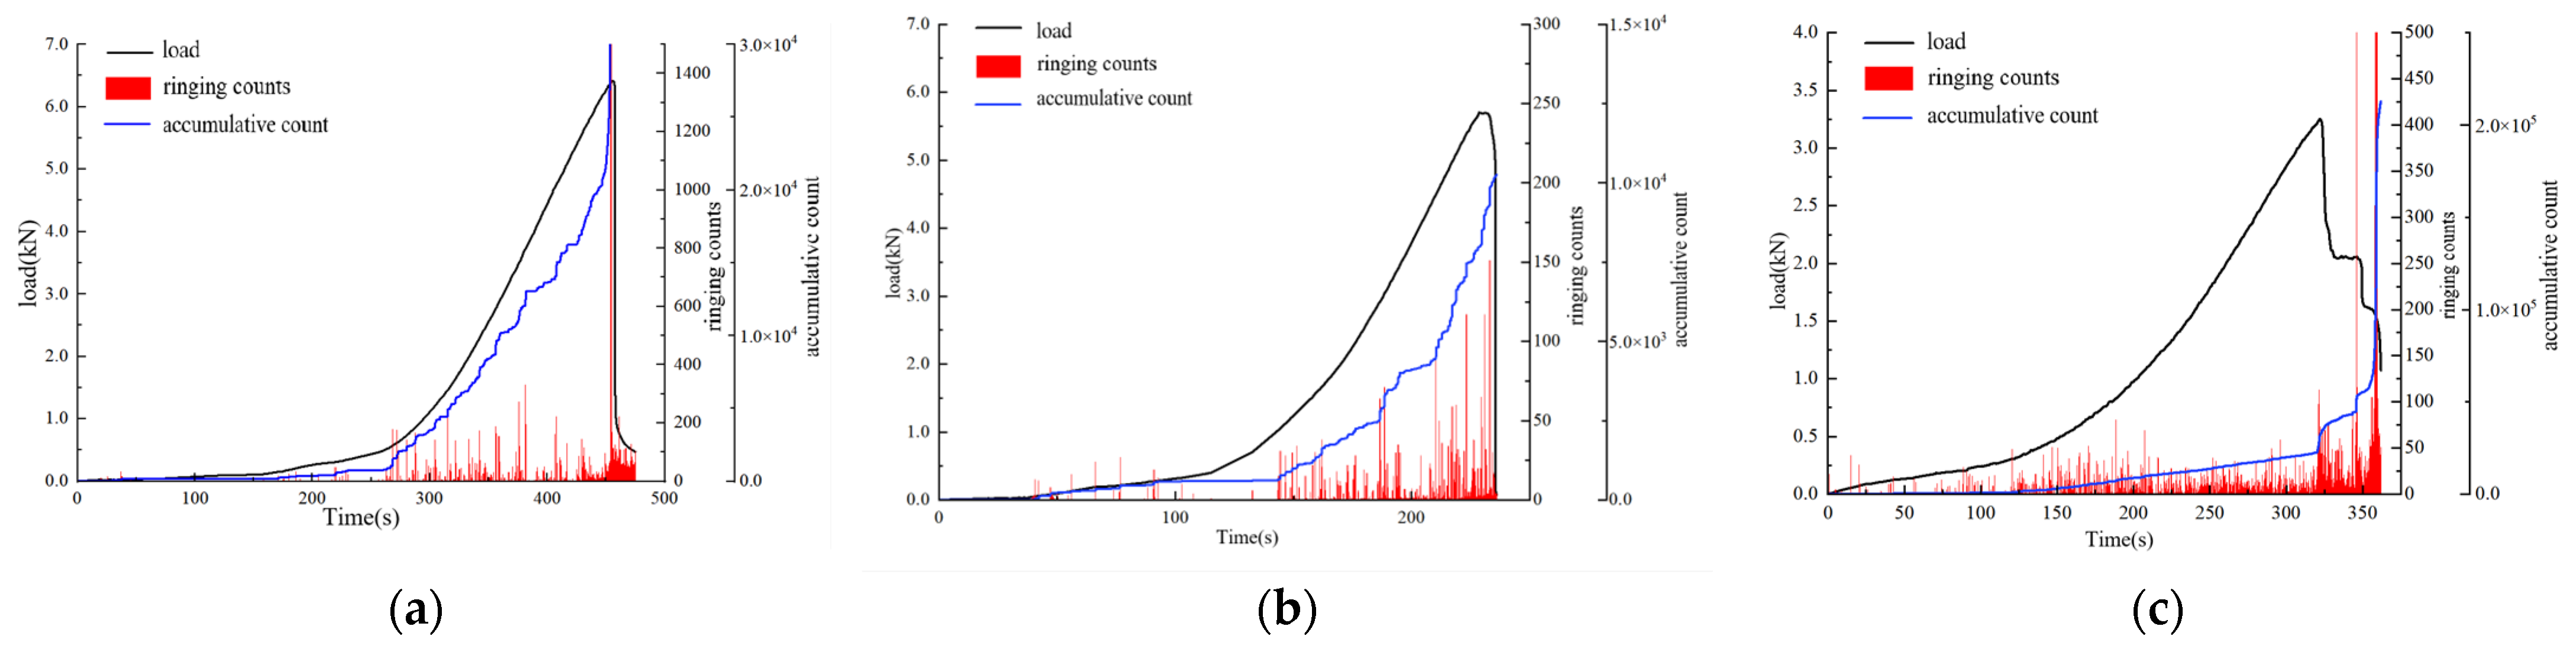
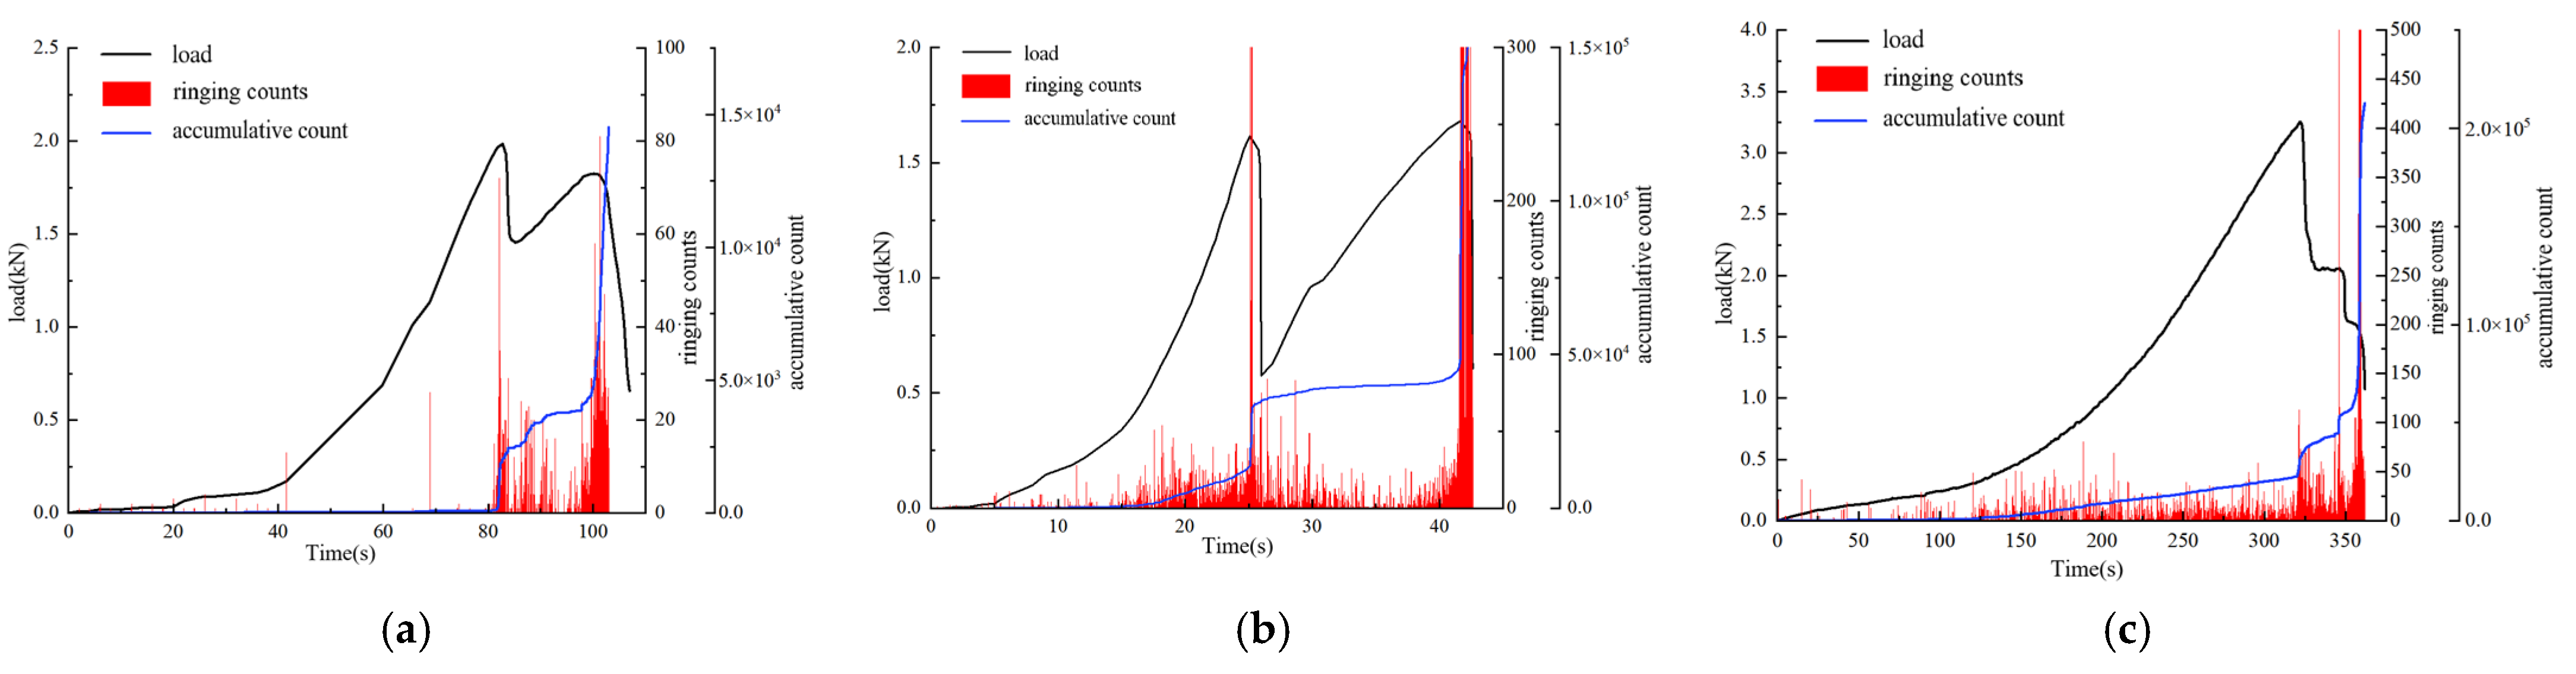
Figure 12 shows the AE ring count curves for specimens of different lithologies. As can be seen from Figure 12a, the AE response of the pure fine sandstone specimen can be divided into three stages: ① Material compaction stage: The duration is 0–262.8 s. At the initial loading stage, the ring count remains at a low level (below 40 counts), and the cumulative ring count increases slowly to less than 852 counts. This stage is mainly caused by the closure of internal pores and the adjustment of microcracks in the rock, generating a small number of low-frequency signals with low AE energy. ② Elastic deformation stage: The duration is 262.8–456 s. The ring count stays in the range of 0–332 counts, which first rises with time and then decreases near the tensile failure time of 456 s. Compared with the compaction stage, the ring count is generally more intensive, and the cumulative ring count surges from 852 counts to 247,787 counts. The AE signals are dominated by low frequency and low amplitude, indicating that the interior of fine sandstone undergoes uniform deformation and the propagation of microcracks is restricted. ③ Instability failure stage: When the load reaches the peak value of 6.41 kN, the peak energy reaches 36,523 m v μ s , and the ring count reaches 1507 counts before starting to decay, dropping to 32 counts at 457 s. This indicates that Mode I cracks penetrate rapidly along the mid-span region, accompanied by the concentrated release of high-frequency and high-energy events. The final fracture surface of the specimen is rough, showing typical brittle fracture characteristics. In summary, the cumulative ring count of the pure fine sandstone specimen is 253,986 counts, which is significantly higher than 50,996 counts of the layered composite rock mass. This indicates that the development of internal microcracks in the pure fine sandstone is more active. The good integrity keeps the rock mass in a high-stress state for a long time and finally triggers the rapid propagation of the main crack.
As can be seen from Figure 12b, the acoustic emission (AE) response of the pure tuff specimen can be divided into three stages: ① Material compaction stage: The duration is 0–144.0 s. The ring count remains at an extremely low level, and no AE signal is detected for most of the time, with values below 30 counts. This indicates that the internal structure of tuff is dense, with few initial micro-defects or microcracks. ② Elastic deformation stage: The duration is 144.0–231.5 s. The ring count ranges from 1 to 117 counts and shows an overall upward trend. During 195.5–207.7 s, the AE signals are significantly lower than in other periods of the elastic stage, implying that pure bending deformation dominates in this interval with little crack development. However, due to the short time interval, the stage as a whole still follows the rule that crack development accelerates with increasing bending deformation. ③ Instability failure stage: After the load reaches the peak value of 5.70 kN, the peak energy reaches 30,815 m v μ s , and the ring count reaches 151 counts before starting to decay, dropping to 14 counts at 232 s. The main Mode I crack penetrates rapidly, and the fracture surface is smooth with a small number of radial secondary cracks, indicating that the brittle fracture characteristic of tuff is more significant. In summary, the AE characteristics of the pure tuff specimen are significantly different from those of fine sandstone. The cumulative ring count and event number of pure tuff are much lower than those of fine sandstone, and its failure process shows a “short-term burst” mode, verifying its material characteristics of low strength and high brittleness. The number of developed microcracks decreases obviously, which may be related to the frictional slip between cemented mineral particles.
As can be seen from Figure 12c, the acoustic emission (AE) response of the layered composite rock mass can be divided into three stages: ① Material compaction stage: The duration is 0–188.0 s. The ring count is more frequent than that of the single-lithology specimens, staying within 81 counts and remaining at a low level. The difference in ring count between the single specimens and the layered composite rock mass indicates that while pore closure and microcrack adjustment take place inside the rock, micro-slip begins to occur at the bonding interface, but the degree is slight and negligible. ② Elastic deformation stage: The duration is 188.0–322.0 s. The ring count is within 113 counts, and the AE signals become more intensive. As the specimen undergoes elastic deformation, tensile deformation in the upper layer and compressive deformation in the lower layer appear at the interface, and the slip degree increases. Near failure, Type II cracks develop significantly, resulting in delamination between the fine sandstone layer and the tuff layer, and the lower tuff layer enters a damage accumulation stage dominated by tensile stress. ③ Instability failure stage: It is characterized by layered failure. After the load reaches the peak value of 3.25 kN, the tuff layer fractures. In summary, the peak energy reaches 16,225 m v μ s . A penetrating Type I crack forms in the mid-span region of the lower tuff layer, accompanied by obvious delamination at the interface. The upper fine sandstone enters an accelerated damage stage due to stress redistribution. The ring count shows obvious high-frequency fluctuations. At 346.28 s, the fine sandstone layer fractures, and the ring count surges to 1371 counts and then drops rapidly, indicating that the remaining structure has lost its bearing capacity.
The cumulative ring count of the layered composite rock mass is between those of the two single-lithology specimens and shows multi-peak characteristics, reflecting the competitive mechanism between interface slip (Type II cracks) and layered fracture (Type I cracks). Fine sandstone is dominated by a “gradual accumulation–concentrated release” pattern, tuff shows “low accumulation–sudden release”, while the layered composite rock mass presents “multi-stage accumulation–layered release”. The failure process of the layered composite rock mass exhibits obvious spatiotemporal differences. The fracture time of the lower tuff layer is 322 s, which is 24.28 s earlier than the 346.28 s of the upper fine sandstone layer, indicating that interfacial stress transfer delays the failure process of the upper layer.

5.1.2. Characteristics of Acoustic Emission Ring Count of Layered Composite Rock Mass Under Different Loading Rates

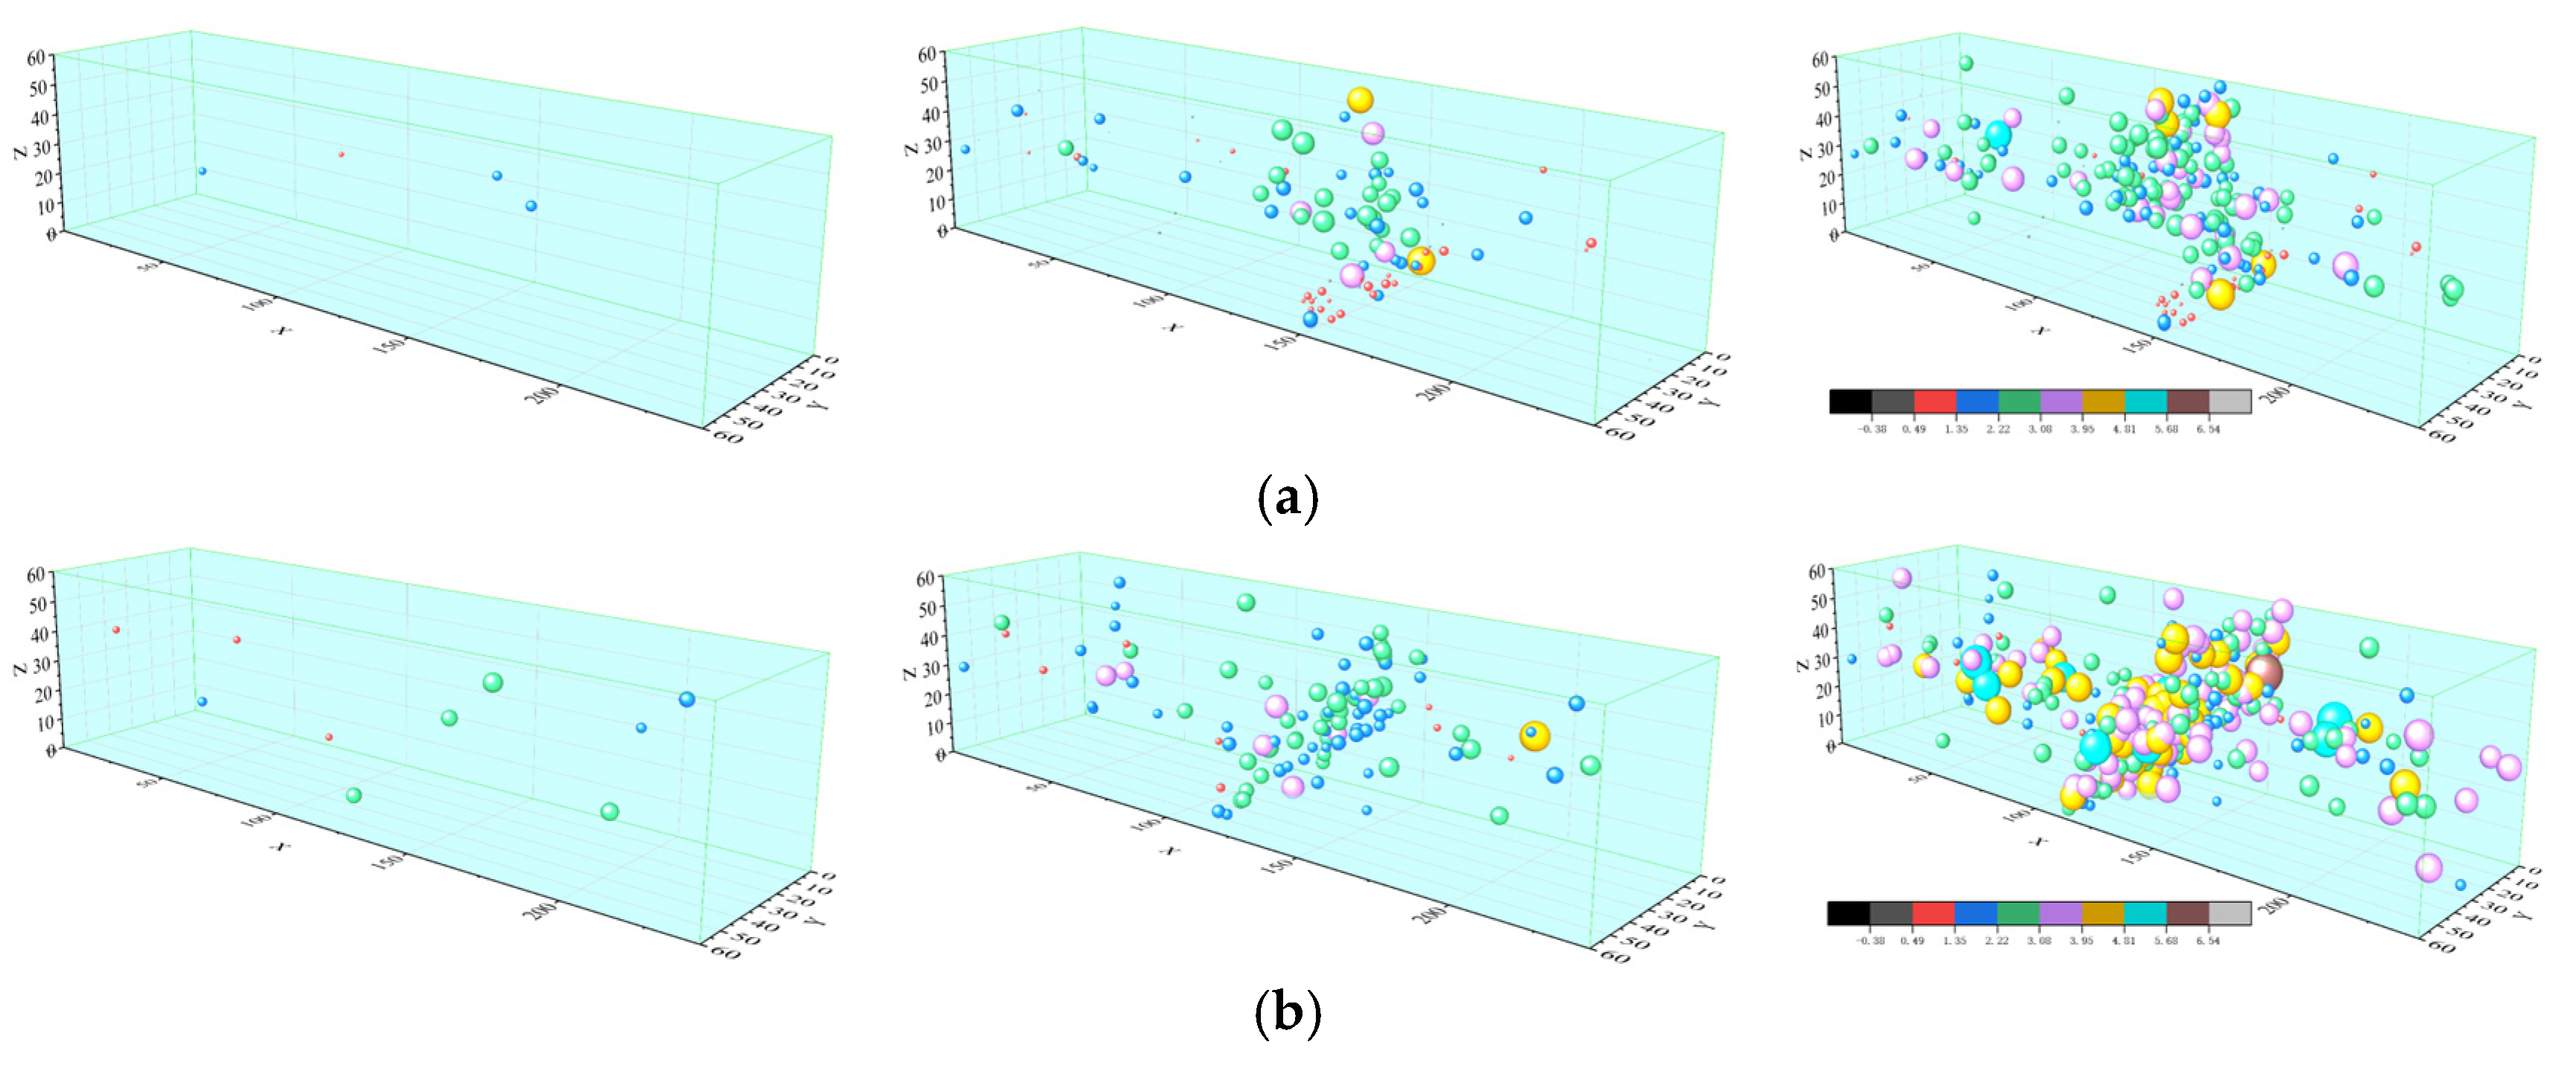
Under the condition that the span is 190 mm and all specimens are fine sandstone-tuff layered composite rock mass, a study was conducted on the characteristics of acoustic emission ring count in four-point bending tests of layered composite rock mass under different loading rates. The low-speed loading case of 0.002 mm/s has been analyzed in detail above and will not be discussed further. Figure 13 shows the variation characteristics of load, acoustic emission ring count and cumulative ring count of rock specimens under different loading rates.
At a loading rate of 0.01 mm/s, the three stages of the rock specimen are analyzed as follows: ① Material compaction stage: Acoustic emission signals are scarce, with the ring count below five counts, indicating few microcracks and insignificant crack development in the rock. ② Elastic deformation stage: The time range is 41.5–82.8 s. Two sudden increases in the ring count occur, reaching 13 and 26 counts respectively. The increase in loading rate leads to the instantaneous penetration of Type II cracks at the specimen interface during the elastic deformation stage. AE signals are concentrated at the fracture moment of the lower tuff layer, mainly caused by the development of Type I cracks. ③ Instability failure stage: The time range is 82.8–100.2 s. The ring count surges to 72 counts, then gradually decreases and rises again. Stress redistribution takes place in the fine sandstone layer, and Type I cracks develop rapidly. When the ring count rises to 81 counts, the fine sandstone layer fractures and the structure loses its bearing capacity, showing dominant brittle fracture.
At a loading rate of 0.02 mm/s, the three stages of the rock specimen are analyzed as follows: ① Material compaction stage: The duration is short. Compared with other loading rates, the acoustic emission signals are strong, and microcrack development is obvious. ② Elastic deformation stage: The AE signals show the characteristics of low amplitude and high frequency. The ring count is within 54 counts and reaches 5381 counts at 25.1 s, with a peak energy of 30,800 m v μ s , accompanied by a loud sound. ③ Instability failure stage: The duration is 16.6 s, which is obviously shorter than that under medium and low loading rates. The peak ring count is more extreme during crack development in the fine sandstone layer, showing obvious brittle failure characteristics, followed by a rapid drop and a significant reduction in energy release.
When the loading rate increases from 0.002 mm/s to 0.02 mm/s, the ring count shows an overall downward trend but the peak value becomes more prominent. This indicates that high-speed loading restricts the full propagation of microcracks but aggravates the failure degree of the layered composite rock mass. Under low-speed loading, energy is released in stages, while under high-speed loading, it presents a “single-peak” burst mode, with the peak energy increased by 90.3%. Further verification shows that the instantaneous sharp increase in strain gradient at the interface indicates that the early failure of interfacial bonding and the loss of interlayer cooperative bearing mechanism are the core reasons for the strength deterioration of composite rock mass under high loading rates.

5.1.3. Characteristics of Acoustic Emission Ring Count of Layered Composite Rock Mass Under Different Spans

Under the condition that the loading rate is 0.002 mm/s and all specimens are layered composite rock mass, the influence of span on the acoustic emission ring count characteristics of the specimens was analyzed. The acoustic emission ring count curves under different spans are shown in Figure 14.
As can be seen from Figure 14, under the span of 170 mm, the three stages of the specimen are analyzed as follows: ① Material compaction stage: The ring count is below 16 counts, and the acoustic emission signals are scarce. ② Elastic deformation stage: The time range is 141.8–242.0 s. During this period, the ring count gradually increases from 16 to 141 counts. At 176.8 s, the ring count is 45 counts, corresponding to the occurrence of Type II cracks. The cumulative ring count surges from 9143 to 10,856 counts at 242 s, indicating that the tuff layer reaches the critical state. ③ Instability failure stage: The cumulative ring count gradually rises from 10,856 to 19,8954 counts. At 287 s, the ring count jumps to 1167 counts, and local crushing occurs in the tuff layer in contact with the lower loading indenter. Under the span of 180 mm, the three stages of the specimen are analyzed as follows: ① Material compaction stage: The ring count is within 18 counts. Compared with the small-span layered composite rock mass, the compaction time is prolonged, with an overall decrease in both value and frequency. ② Elastic deformation stage: The ring count gradually climbs to 40 counts. Compared with the small-span specimen, it shows stronger fluctuation and insufficient concentration. When the ring count reaches 1102 counts, the tuff layer fractures. ③ Instability failure stage: After the fracture of the tuff layer, the loosening of the layered composite rock mass caused by the fracture is compacted again. The cumulative ring count increases gradually from 5273 to 36,364 counts, showing a long duration and sufficient crack development. When the span increases from 170 mm to 190 mm, the crack propagation changes from inclined propagation along the interface (dominated by Type II cracks) to vertical propagation at the mid-span (dominated by Type I cracks). Energy release is concentrated in the small-span specimen, while it is released in stages in the large-span specimen, with the cumulative ring count increased by 170.3% compared with the 170 mm span. Properly increasing the span can promote energy release through bending deformation of the specimen, thus enabling it to bear a higher load.

5.2. Localization and Evolution Analysis of Crack Development in Layered Composite Rock Mass Under Four-Point Bending

5.2.1. Localization and Evolution of Crack Development in Layered Composite Rock Mass with Different Lithologies

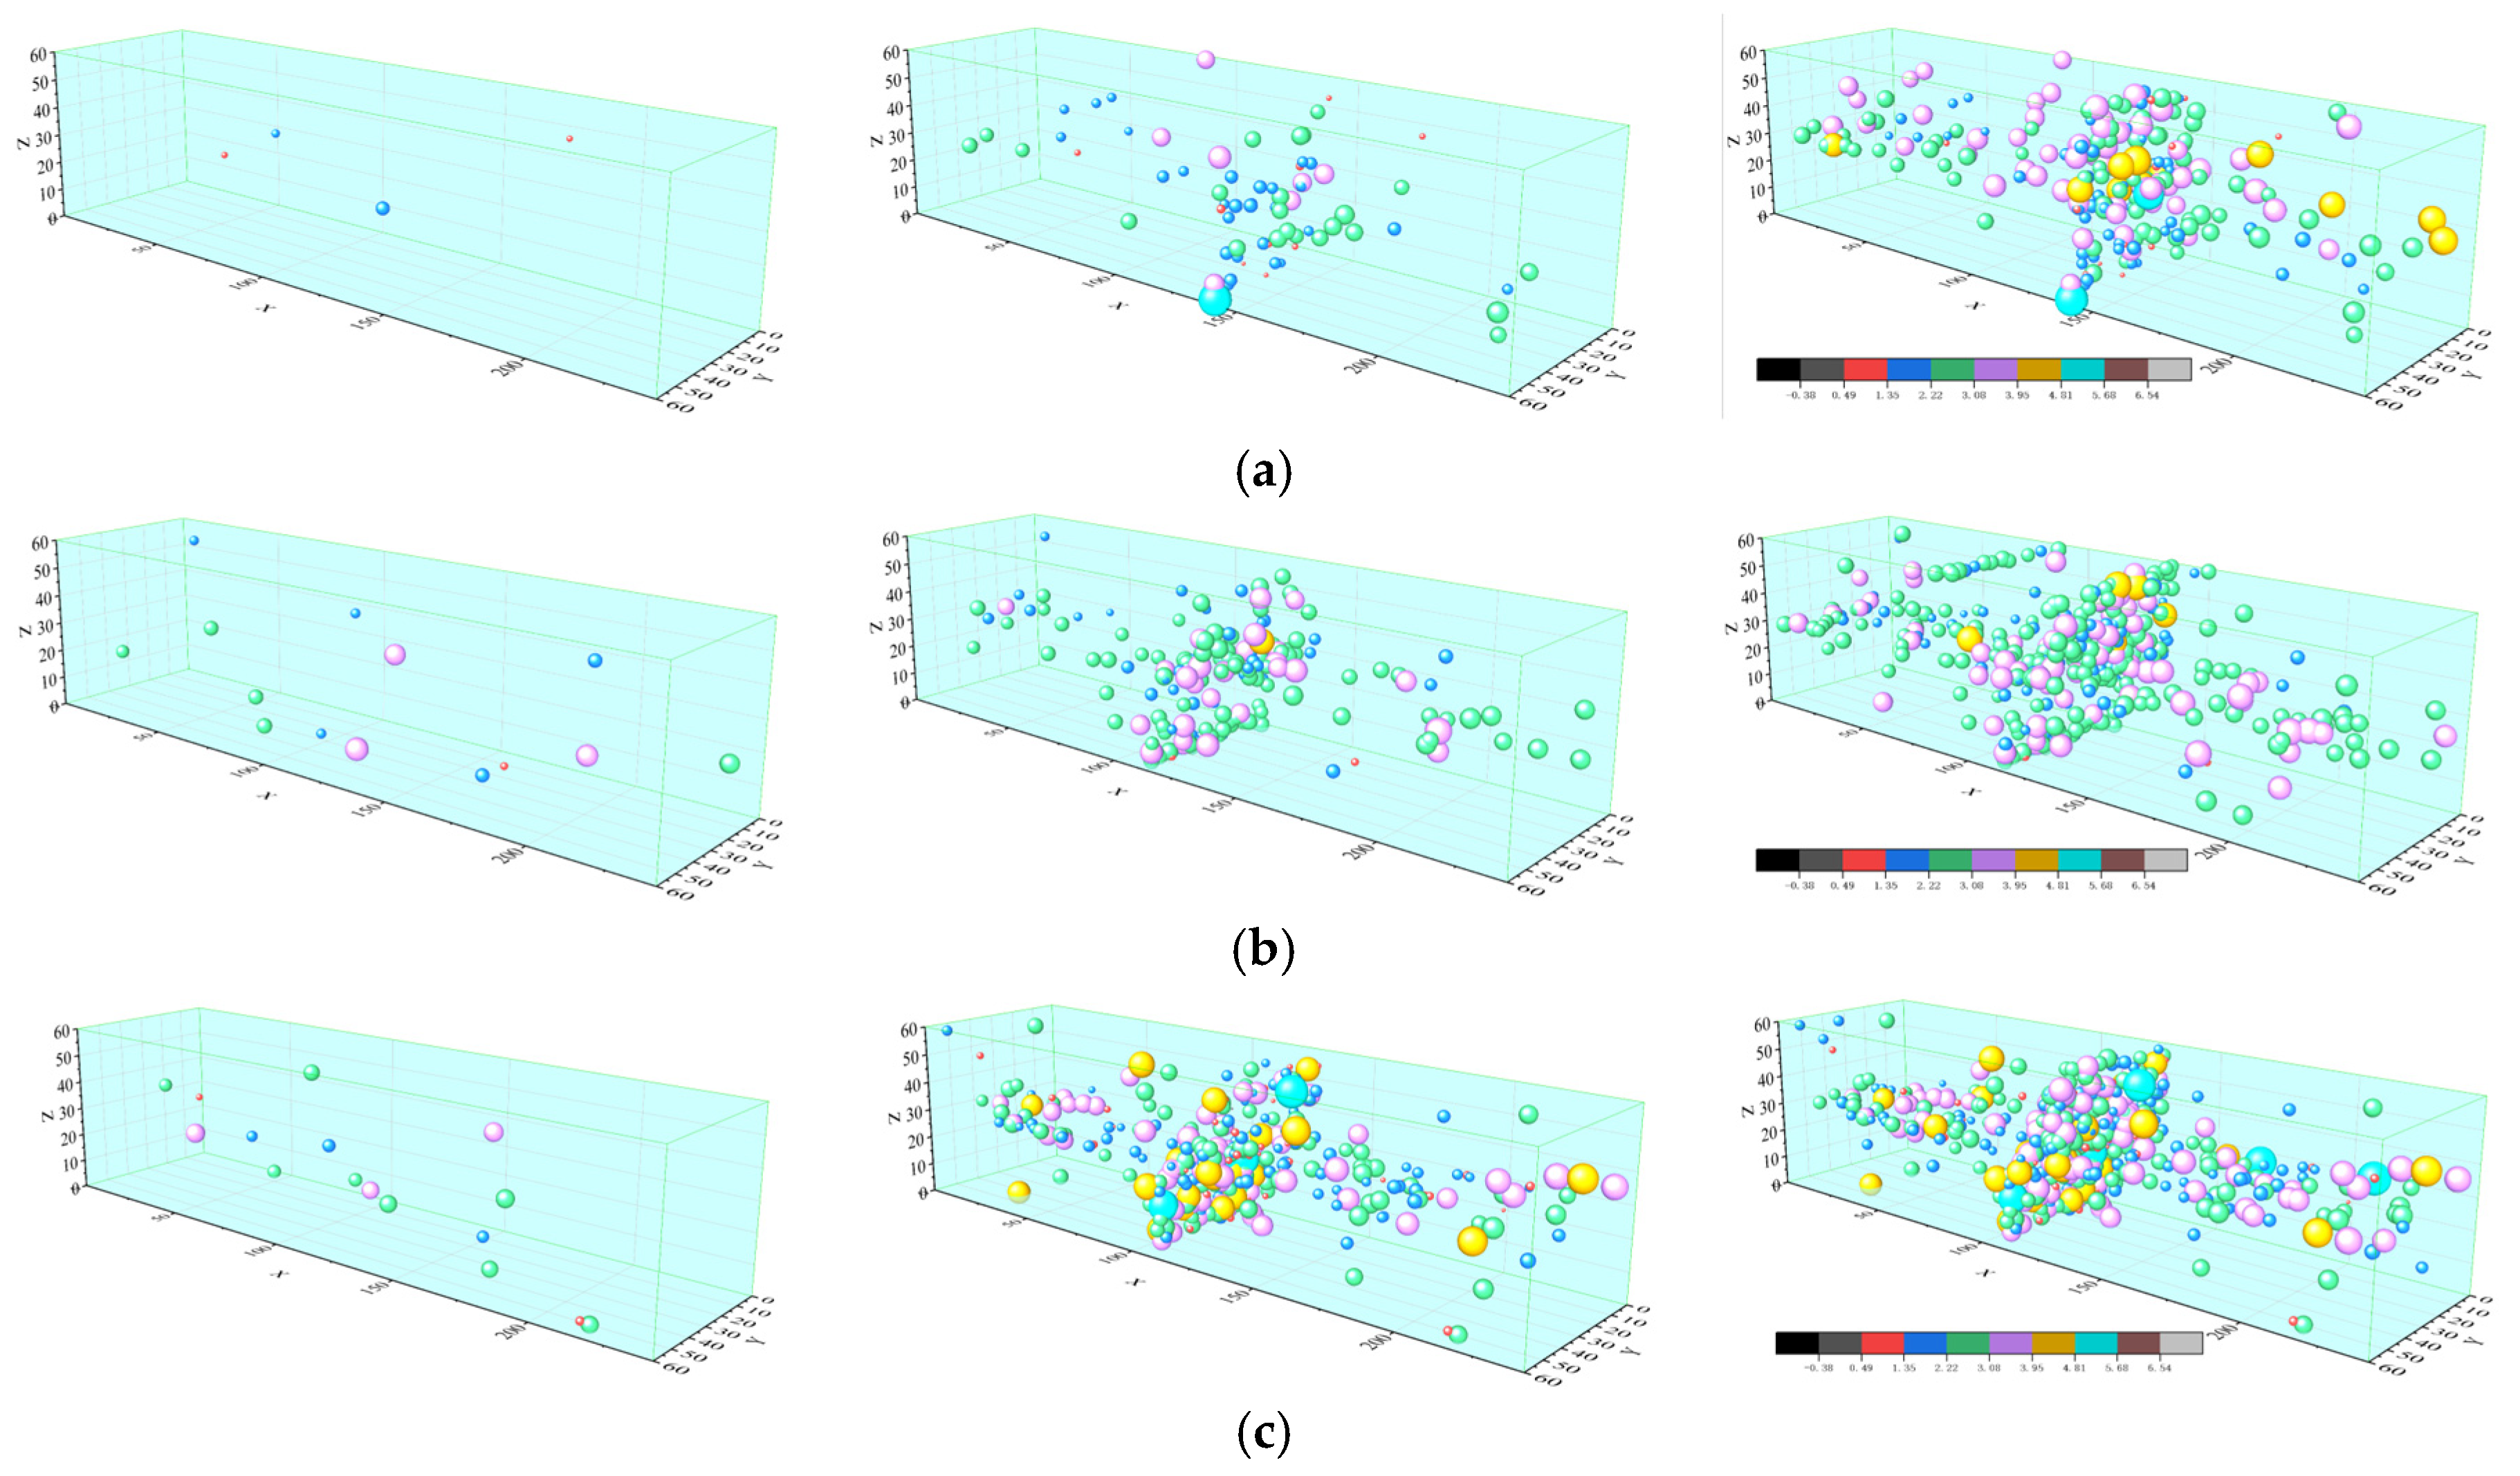
By fixing the y-coordinate, the size of the 3D scatter spheres in the location map represents the absolute energy of the acoustic emission (AE) signal at that point. By analyzing the occurrence and distribution of AE location points over time, the crack evolution law of specimens with different lithologies during four-point bending loading can be revealed. Based on the AE monitoring results of the four-point bending mechanical tests on rock specimens, AE event location maps were obtained, as shown in Figure 15.
As can be seen from Figure 15a, during the material compaction stage, the acoustic emission events of the pure fine sandstone specimen are mainly distributed in the middle of the specimen at x = 90–150 mm, with a small number of events, indicating that the initial microcracks mainly result from internal pore closure and local grain boundary adjustment. During the elastic deformation stage, 194 events occur. Due to the obvious bending deformation of the specimen, scattered event location points appear within the bending-affected zone, with a small amount distributed near the interface and gradually concentrated at x = 127 mm close to the mid-span. The points extend upward over time and begin to shift leftward near the geometric center of the specimen. Microcracks develop vertically along the mid-span region and gradually converge toward the mid-span, reflecting the stable propagation of tensile-stress-dominated Mode I cracks inside the fine sandstone layer. During the instability failure stage, multiple event location points appear instantaneously. Following the microcrack paths formed in the elastic stage, the location points burst intensively in the mid-span region, forming a vertically penetrating main crack zone accompanied by a small number of secondary cracks extending toward the loading points. This indicates that the brittle fracture of fine sandstone is characterized by the rapid penetration of the main crack, with concentrated energy release.
As can be seen from Figure 15b, during the material compaction stage, acoustic emission events are very few, and the location points are randomly distributed on the specimen surface, reflecting the high compactness of tuff and minimal initial damage. During the elastic deformation stage, the number of AE event location points gradually increases but is still mainly concentrated in a local area of the specimen (x = 112 mm) and develops toward the mid-span. The absolute energy of the signals is 101–103 aJ, which is relatively low, indicating slow crack development inside the tuff. Two high-energy location points appear at the neutral axis interface, showing that tuff enters a tensile stress concentration state in advance due to its low tensile strength. During the instability failure stage, the number of AE event location points increases rapidly and forms a dense distribution in the mid-span region of the specimen. The main Mode I crack penetrates quickly, with a smooth fracture surface and a small number of radial secondary cracks. The inversion results of crack development localization for the pure tuff specimen show that its failure process is characterized by a “short-term burst” with a small number of microcracks, confirming the sudden brittle fracture property of tuff.
As can be seen from Figure 15c, during the material compaction stage, the event location points of the layered composite rock mass are concentrated near the material interface, reflecting the early evolution trend of micro-slip (Type II) induced by interfacial bonding defects. The location points are scattered and few in number. During the elastic deformation stage, the event density in the lower tuff layer is significantly higher than that in the upper fine sandstone layer. Microcracks initiate at x = 109 mm and develop vertically, forming an obvious concentration in the interface region, showing the characteristics of interfacial slip and damage accumulation in the lower tuff layer. During the instability failure stage, the lower tuff layer fractures first, and the location points migrate to the upper fine sandstone layer. The fine sandstone layer fractures at x = 139 mm, forming a composite failure mode of vertical mid-span cracks (Type I) and interfacial slip zones (Type II). The fracture time of the lower tuff layer is earlier than that of the upper fine sandstone layer, indicating that interfacial stress transfer delays the failure process of the upper layer. The cumulative number of events is higher than that of single-lithology rock mass, which indicates that Type II cracks damage the internal bonding state of the layered composite rock mass and cause it to lose strength prematurely.
In summary, the pure fine sandstone specimen shows obvious bending deformation characteristics, and its location point distribution presents the feature of “gradual accumulation–concentrated release”. The pure tuff specimen exhibits more prominent brittleness, with its location points showing the characteristic of “low-density evolution–sudden diffusion”. The interfacial bonding strength of the layered composite rock mass is the main factor affecting the overall cooperative deformation, and the distribution of location points reflects the law of “interface-dominated–layered evolution”. Lithological differences govern interfacial stress transfer through the bonding interface. With the weakening and disappearance of interfacial bonding, the crack type and spatial distribution are further affected.

5.2.2. Localization and Evolution of Crack Development in Layered Composite Rock Mass Under Different Loading Rates

Based on the acoustic emission monitoring results of the four-point bending rock sample mechanical tests, the location points of acoustic emission events in the layered composite rock mass under different loading rates were obtained, as shown in Figure 16.
As can be seen from Figure 16a, at a loading rate of 0.01 mm/s, during the material compaction stage of the layered composite rock mass, the event location points are scattered at both ends of the specimen, indicating that interfacial slip is insignificant and microcrack development is restricted under low-speed loading. During the elastic deformation stage, the number of acoustic emission event location points increases rapidly and forms an obvious concentration at the interface and in the mid-span region of the lower tuff layer (x = 156 mm), with cracks tending to develop vertically toward the fine sandstone layer at x = 134 mm. This indicates that the rate of interfacial slip and damage accumulation in the lower tuff layer is accelerated. Compared with the layered composite rock mass under a lower loading rate, the number of events is significantly reduced and concentrated in the mid-span region. High-energy (104 aJ) location points appear on the upper surface of the fine sandstone layer at the mid-span, indicating that stress concentration has occurred in the fine sandstone layer. During the instability failure stage, the number of AE event location points increases sharply. A penetrating Mode I crack forms in the mid-span region of the lower tuff layer, and event location points accumulate at the interface, but their number is significantly less than that of other layered composite rock masses. This indicates that obvious delamination and debonding have occurred at the specimen interface before instability, causing the load to concentrate on the crack development path and making the fine sandstone layer suffer bending failure prematurely. The interfacial synergistic effect is weakened, and the failure process is more rapid.
As can be seen from Figure 16b, under the high loading rate, crack development shows more intense characteristics. During the material compaction stage, there are many event location points, and the event energy 101–103 aJ is higher than that under the low loading rate at the same stage 0–101 aJ, indicating obvious microcrack development. During the elastic deformation stage, the location points gather rapidly toward the mid-span region at x = 115 mm. Microcracks develop obliquely to the upper surface of the tuff layer at x = 125 mm and further concentrate at x = 152 mm. High-speed loading induces strain localization, which gradually propagates toward the loading points. This indicates that the specimen is less affected by bending failure, and the external energy input rate exceeds the energy dissipation capacity of the interface, leading to the dominance of brittle cracks. During the instability failure stage, the energy of event location points ranges from 102 to 106 aJ, far exceeding the absolute energy values under low and medium loading rates. The main crack deviates from the mid-span region as a whole and penetrates rapidly along the accumulation path of microcracks. It is manifested as the rock fracture after the inclined development of the tuff layer. High energy accumulation occurs at the interface, but interfacial slip is not obvious. The cumulative number of events is 38.04% lower than that under low-speed loading. The main crack shifts 27 mm to the right in a short time and then develops vertically. Finally, the layered composite rock mass loses its bearing capacity as a whole, indicating that high-speed loading restricts the full development of layered failure.
In summary, under low loading rates of 0.002–0.01 mm/s, interfacial slip and layered fracture act synergistically, and energy is released in stages. Even if specimen defects cause the main crack to initiate from the off-mid-span region, crack development in the later stage will still evolve toward the mid-span at x = 120 mm. Under high loading rates, brittle fracture dominates and energy is released concentratively. The uncertainty of the initial initiation position of the main crack increases, and the crack gradually propagates toward the loading indenter to form penetrating cracks. The increase in loading rate leads to the transition of location point distribution from interfacial diffusion to loading concentration.

5.2.3. Localization and Evolution of Crack Development in Layered Composite Rock Mass Under Different Spans

Based on the acoustic emission monitoring results of the four-point bending mechanical tests on rock specimens, the acoustic emission event location points of layered composite rock mass under different spans were obtained, as shown in Figure 17.
As can be seen from Figure 17a, the distribution of acoustic emission event location points of the layered composite rock mass under small-span conditions can be used to analyze its internal crack development characteristics. During the material compaction stage, there are four event location points, which appear near the loading points. This reflects that the bending stress is concentrated around the loading points under small span, and the interfacial damage is slight, indicating weak microcrack activity inside the layered composite rock mass. During the elastic deformation stage, the number of event location points is small and concentrated in the mid-span region at x = 141 mm, indicating that the small span restrains the interfacial shear stress and thus inhibits the propagation of Type II cracks. At 182 s, the number of interfacial event location points begins to increase sharply, and the overall energy is below 103 aJ, showing the characteristics of interfacial slip and damage accumulation in the lower tuff layer. During the instability failure stage, the number of acoustic emission event location points increases sharply, with the energy ranging from 101 to 104 aJ. A penetrating Mode I crack forms in the mid-span region of the lower tuff layer, accompanied by obvious delamination and debonding at the interface. The cumulative number of events reaches 239. Under small span, the specimen loses stability rapidly due to stress concentration, with intense but short-lived energy release. The crack development of the layered composite rock mass is mainly concentrated near the loading points, the stress concentration effect is significant, the crack propagation path is short, and the failure process is relatively rapid.
As can be seen from Figure 17b, under the span of 180 mm: During the material compaction stage, most event location points are uniformly distributed in the middle and lower parts of the specimen at z ≤ 40 mm, and their number begins to increase, indicating that the increase in span alleviates local stress concentration. During the elastic deformation stage, the event location points tend to concentrate at x = 90 mm and x = 150 mm, corresponding to the tensile/compressive stress zones caused by the neutral axis offset. This indicates that the interlayer stress distribution becomes unbalanced when the span approaches the critical value (three times the specimen height). Subsequently, obvious aggregation forms at the interface and in the mid-span region of the lower tuff layer at x = 112 mm, indicating accelerated interfacial slip and damage accumulation in the lower tuff layer, with microcracks developing in the fine sandstone layer at x = 136 mm. During the instability failure stage, the energy ranges from 101 to 103 aJ, which is lower than that of the small-span layered composite rock mass at the same stage. The cumulative number of events is 419, an increase of 75.31% compared with the 170 mm span. A penetrating Mode I crack forms in the mid-span region of the lower tuff layer, accompanied by obvious delamination and debonding at the interface, and obvious damage and crack propagation also appear in the upper fine sandstone layer. It can be concluded that with the increase in span, the crack development path of the layered composite rock mass begins to shift toward the mid-span, but still mainly occurs at the interface and in the lower tuff layer. The stress concentration effect is alleviated, while the crack propagation remains relatively concentrated.
As can be seen from Figure 17c, under the span of 190 mm: During the material compaction stage, the acoustic emission event location points of the layered composite rock mass are concentrated near the interlayer interface, reflecting the early evolution trend of micro-slip (Mode II) induced by bonding defects at the interface. The location points are scattered with a small quantity, and no obvious stress concentration area is formed in the specimen, which means the large span effectively optimizes the initial stress distribution of the rock mass. During the elastic deformation stage, the event density in the lower tuff layer is significantly higher than that in the upper fine sandstone layer. Microcracks initiate at x = 109 mm and develop vertically, forming an obvious aggregation in the interface region, which shows the characteristics of interfacial slip and damage accumulation in the lower tuff layer. The stress transfer between layers is more sufficient under the large span, and the microcrack development is more regular and gradual without sudden aggregation. During the instability failure stage, the lower tuff layer fractures first, and the location points migrate to the upper fine sandstone layer, which then fractures at x = 139 mm, forming a composite failure mode of vertical mid-span cracks (Mode I) in the tuff layer and interfacial slip zones (Mode II) between soft and hard rock layers. The fracture time of the lower tuff layer is 24.28 s earlier than that of the upper fine sandstone layer, indicating that the interfacial stress transfer under the large-span condition effectively delays the failure process of the upper fine sandstone layer. The cumulative number of acoustic emission events is higher than that of the layered composite rock mass under 170 mm and 180 mm spans—which means that the large span promotes the full development of internal microcracks in the rock mass—and the Mode II cracks caused by interfacial slip damage the internal bonding state of the layered composite rock mass, leading to premature loss of overall strength.
It can be concluded that the 190 mm large span further alleviates the local stress concentration of the layered composite rock mass and optimizes the interlayer stress transfer efficiency. The crack development path is completely dominated by the mid-span region, and the crack evolution shows a typical progressive failure characteristic from the lower tuff layer to the upper fine sandstone layer. Compared with small and medium spans, the large span makes the layered composite rock mass present a more obvious “bending deformation-damage accumulation-layered failure” evolution process, and the interfacial effect plays a leading role in the whole failure process.
In summary, when the span of the layered composite rock mass increases from 170 mm to 190 mm, the trend of crack development changes from interface-dominated to mid-span-dominated. The small-span layered composite rock mass shows intensified shear failure between loading points due to the size effect, while the large-span specimen optimizes stress distribution through bending deformation and delays the instability process.

6. Conclusions and Innovations

6.1. Conclusions

(1) Based on four-point bending tests, the influences of lithology, loading rate and span were analyzed. The flexural strength of layered composite rock mass is significantly lower than that of single-lithology rock mass, which is reduced by 46.7% and 41.1% compared with hard rock mass and soft rock mass, respectively. When the loading rate increases from 0.002 mm/s to 0.02 mm/s, the flexural strength of layered composite rock mass decreases by 51.8%. When the span increases from 170 mm to 190 mm, the flexural strength increases by 65.7%. The competition mechanism between interfacial slip and delamination fracture is the core inducement of strength deterioration.
(2) The bending deformation and failure of layered composite rock mass are characterized by small deformation amplitude and strong sensitivity to influencing factors, and the mid-span deflection is obviously lower than that of single-lithology rock mass. At a loading rate of 0.02 mm/s, the mid-span deflection is reduced by 50.1% compared with that at 0.002 mm/s, indicating that the increase in loading rate restrains the bending deformation capacity. When the span of layered composite rock mass increases from 170 mm to 190 mm, the mid-span deflection increases by 65.7%. The increase in span can prolong the bending deformation path, suppress local stress concentration, and improve the coordination of bending deformation of layered composite rock mass.
(3) Based on acoustic emission monitoring data, the crack evolution laws of layered composite rock mass under different lithology, loading rate and span were obtained. Layered composite rock mass is dominated by Mode II cracks, while single-lithology rock mass mainly develops Mode I cracks. Under low-speed loading, the ring count is low and dense, which promotes the accumulation of microcracks and the development of Mode I cracks; under high-speed loading, the ring count is high and concentrated, inducing brittle fracture with more prominent Mode II cracks. With the increase in span, the failure mode transits from brittle failure concentrated near loading points to bending failure dominated by the mid-span region.
(4) Mineral grain size and cement properties have significant effects on the strength and crack development of layered composite rock masses: the coarse-grain and strong cementation characteristics of fine sandstone lead to progressive development of microcracks along grain boundaries, showing good ductility. The fine-grain and weak cementation characteristics of tuff make microcracks prone to rapid penetration, with significant brittleness. The slip characteristics of interlayer cement directly dominate the development of Mode II cracks, which is an important internal cause of strength deterioration of composite rock masses.

6.2. Innovations

(1) Innovation in test method: The four-point bending test was adopted to eliminate the interference of shear stress, accurately restoring the real stress state of the pure bending section of deep roadway composite roofs, and solving the problem of large deviation between traditional three-point bending test results and engineering practice. A calculation method for the equivalent flexural rigidity of soft–hard interbedded composite rock masses was established, correcting the application error of the homogeneous material beam theory in layered composite rock masses.
(2) Innovation in mechanism cognition: The interfacial effect and mesoscopic mechanism of bending failure of layered composite rock masses under the coupling of multiple factors (lithology combination, loading rate, and span) were systematically revealed. The internal mechanism of strength deterioration of composite rock masses under high loading rates was clarified, resolving the cognitive contradiction with the conventional strain rate effect of homogeneous rocks, and improving the bending failure theory of layered rock masses.
(3) Innovation in damage characterization: Based on the synergy of strain monitoring, high-speed camera, and acoustic emission localization, the temporal and spatial evolution laws of Mode I/II cracks during the bending failure of composite rock masses were quantified. A full-process damage evolution model of “interfacial slip-delamination-overall instability” for layered composite rock masses was established, realizing the refined characterization of the full bending failure process of composite rock masses.

7. Engineering Applications

The research findings of this paper can provide direct theoretical guidance and technical support for the support design of composite roofs and roof disaster prevention and control in deep coal mine roadways. The specific engineering application values are as follows:
(1) For the composite roof in the West No. 1 Mining Area of Shuangyang Coal Mine, it is clarified that the interlayer interface is the core controlling weak surface for roof bending instability. It is proposed that the support of composite roofs should prioritize the use of full-length anchored bolts and cable bolts to enhance interlayer bonding and control interlayer delamination, rather than simply increasing support strength. This provides a core idea for optimizing the support scheme.
(2) Based on the law of the influence of loading rate on the strength of composite rock masses, it is confirmed that the excavation disturbance rate is a key inducement for sudden roof instability. An optimized scheme for advanced support of the working face is proposed: within the influence range of advanced abutment pressure, the support strength should be increased in advance to reduce the impact of excavation disturbance on the roof and avoid sudden roof collapse accidents under high disturbance rates. In the advanced support section of rapidly advancing working faces, compressible temporary support components should be added to reduce the high-speed loading effect caused by excavation disturbance, inhibit sudden brittle fracture of the roof rock mass, and optimize the working face advancing speed to control the loading rate of the roof rock mass below the critical value, thereby delaying crack development.
(3) Based on the research results of the span effect, the design of bolt/cable spacing for roadway roofs is optimized: by increasing the lateral support span of bolts/cables, the bending deformation path of the roof rock mass is extended, the coordinated deformation of rock layers is promoted, local stress concentration is suppressed, the overall flexural bearing capacity of the roof is improved, and the long-term stability of surrounding rock in deep roadways is guaranteed. At the same time, the effective bearing span of the roof should be appropriately increased to release stress through the bending deformation of the rock mass and suppress local stress concentration.
(4) Instability monitoring and early warning: Based on the evolutionary characteristics of acoustic emission ringing counts, it is taken as the core early warning indicator for composite roof instability. When the underground microseismic monitoring system detects that the ringing counts of the roof rock mass show the characteristics of “high value and concentrated burst”, it is judged as a precursor to brittle roof failure. In such cases, excavation operations should be stopped in a timely manner, and emergency support measures should be activated to prevent and control roof collapse accidents.


Author Contributions

Conceptualization, B.D.; Methodology, P.Y.; Validation, P.Y.; Resources, Z.Q.; Data curation, L.W.; Writing—original draft, L.W.; Writing—review and editing, Y.D. and Y.S.; Supervision, B.D.; Funding acquisition, Z.Q. All authors have read and agreed to the published version of the manuscript.

Funding

This study was financed by the Heilongjiang Provincial Natural Science Foundation of China (Grant No. JQ2025E012).

Data Availability Statement

The original contributions presented in this study are included in the article. Further inquiries can be directed to the corresponding author Lei Wang (E-mail: wanglei69@usth.edu.cn).

Conflicts of Interest

Authors Ping Yi and Zhaohui Qiu were employed by the company Heilongjiang Longmei Jixi Mining Co., Ltd. The remaining authors declare that the research was conducted in the absence of any commercial or financial relationships that could be construed as a potential conflict of interest.

Abbreviations and Terms Explanation

AEAcoustic emission
LSTest span
bCross-section width
hRock mass thickness
EIEquivalent bending stiffness
RbbFlexural strength of rock mass
FPeak load
uLocal microstrain
dDeflection at mid-span
fMidspan deflection
b T Midspan deflection
IEquivalent moment of inertia
yVertical distance from centroid to bottom fiber
AEquivalent cross-sectional area
btEquivalent width of tuff

References

  1. Liu, H.J.; Lin, L.; Li, J.K.; Li, T.Z. Optimization of the width of special-shaped narrow coal pillar for gob-side entry driving with staggered position outside the layered composite roof in fully mechanized top-coal caving mining. Coal Eng. 2022, 54, 12–17. Available online: https://kns.cnki.net/kcms2/article/abstract?v=JITlTmCwHjJTGaLMFGiuuxLlcbcIVixGjw2ftDXKn1eCqbqUXdwXDcezd0UCtKKggUiW9uueEYUOJfN-_TM4S1qD54n1cX9CFEan7jf8Fjtu27snl3v5bffcMSsdIv_O-qAcXTHwnewWAnhPSG0bRxyAycE0OCz6LXr-UbKxwck-03Y8OdfvrQ==&uniplatform=NZKPT&language=CHS (accessed on 10 February 2026).
  2. Liu, X.Y.; Yan, G.C.; Zhang, Y.F. Study on failure mechanism of roadway composite structure and grouting bolt support control technology. Min. Saf. Environ. Prot. 2019, 46, 102–106. Available online: https://kns.cnki.net/kcms2/article/abstract?v=L9QYEmxDei1xmsvoFDdDTeABf6JkFBZ3C5Iz8_B34sdIGOlRKta7zti8Xlk9xunkQqu_00VzGEFu13yreF95-jOTZ7hxRIkGR-Yx3fk1jsU60sis2fQ6aZlOxDhjAJ5PfX3QkPRA_ue3gJ83Xd98mdrHFfDTDvCdzVEIcmpZHRf5KihAqynx8jYCjob_oaOF&uniplatform=NZKPT&language=CHS (accessed on 10 February 2026). [CrossRef]
  3. Zhao, R.F. Surrounding rock control technology of gob-side entry retaining by roof cutting and pressure releasing in fully mechanized mining face. Coal Mine Mod. 2025, 34, 118–123. [Google Scholar] [CrossRef]
  4. Li, J.; Ma, N.J.; Wang, W.J.; Ren, J.J.; Lian, X.Y.; Ma, Z.K. Research progress of butterfly failure theory and its application. J. China Univ. Min. Technol. 2023, 52, 209–228. [Google Scholar] [CrossRef]
  5. Wang, L.F.; Zhang, S.; Wei, S.J.; Wang, M. Experimental study on the full-field deformation evolution law of rock failure. Coal Sci. Technol. 2019, 47, 83–89. [Google Scholar] [CrossRef]
  6. Ren, L.; Wu, S.Y.; Zhou, J.F.; Ai, T.; Liu, Y.; Zhang, R.; Zhang, C.P. Study on tension-shear composite fracture behavior of brittle rock based on NDB specimen. Adv. Eng. Sci. 2018, 50, 41–47. [Google Scholar] [CrossRef]
  7. Zhang, Z.H.; Chen, W.C.; Zhao, A.H.; Chen, D.R.; Lian, B.; Yang, Y. Effect of strength difference on the fracture surface of coal-rock combination under bending failure. Mod. Chem. Res. 2023, 06, 46–48. [Google Scholar] [CrossRef]
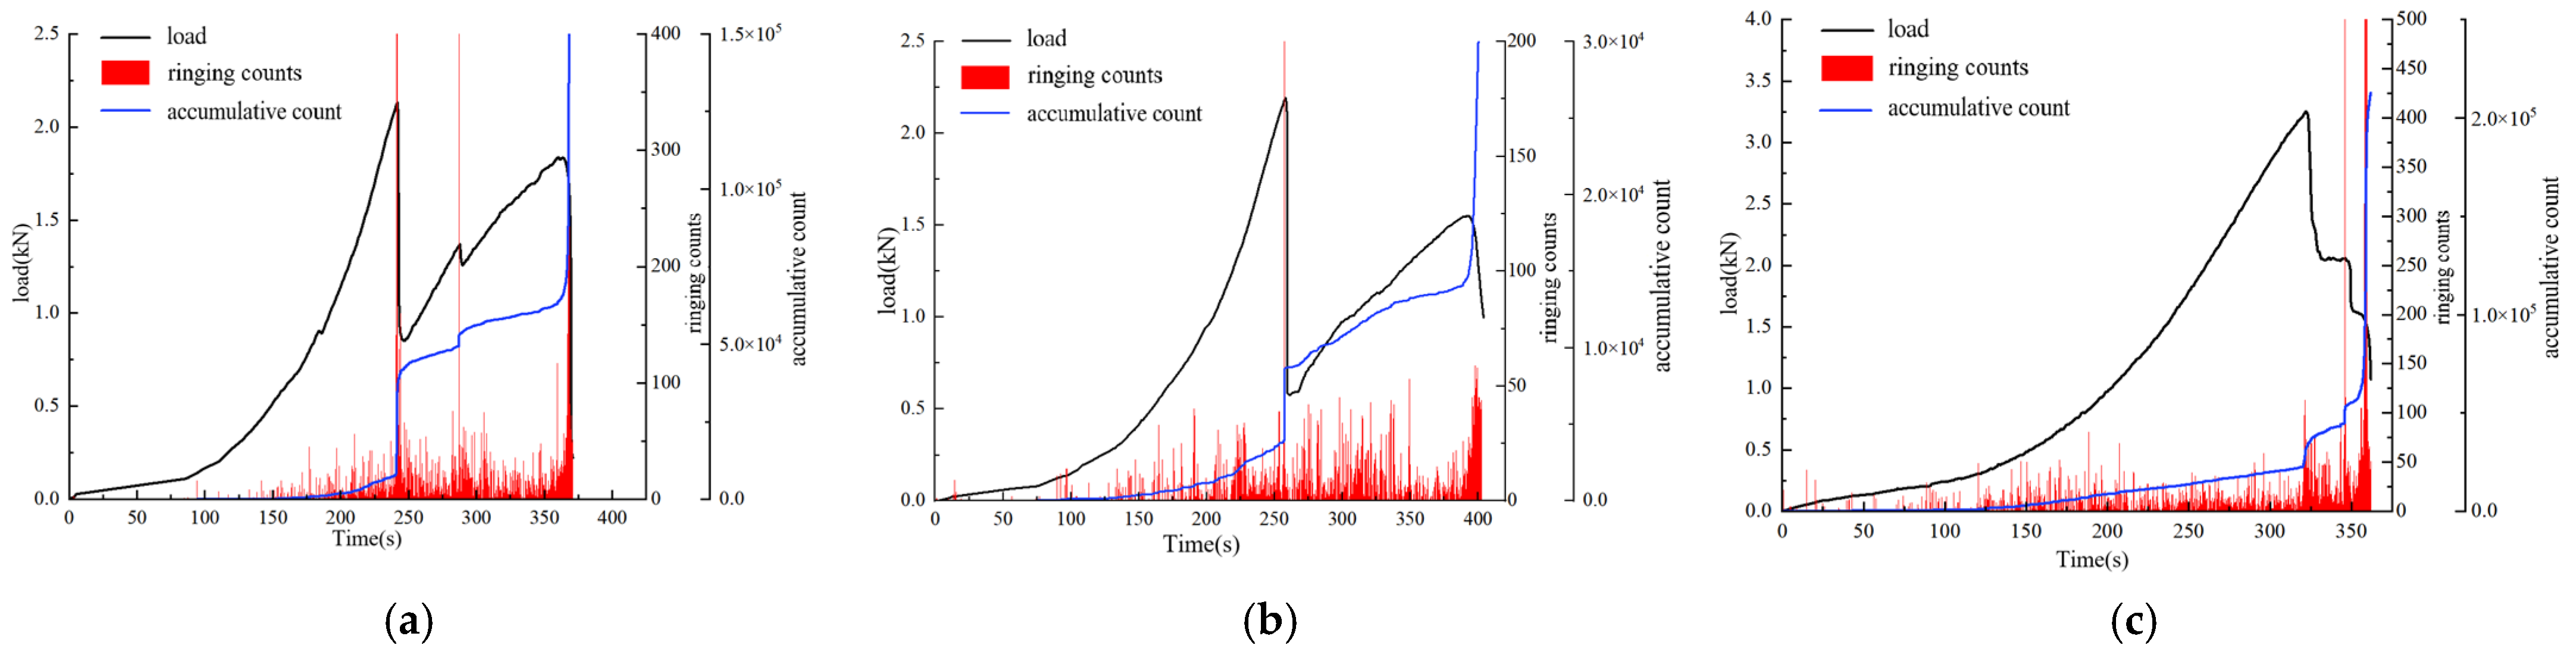
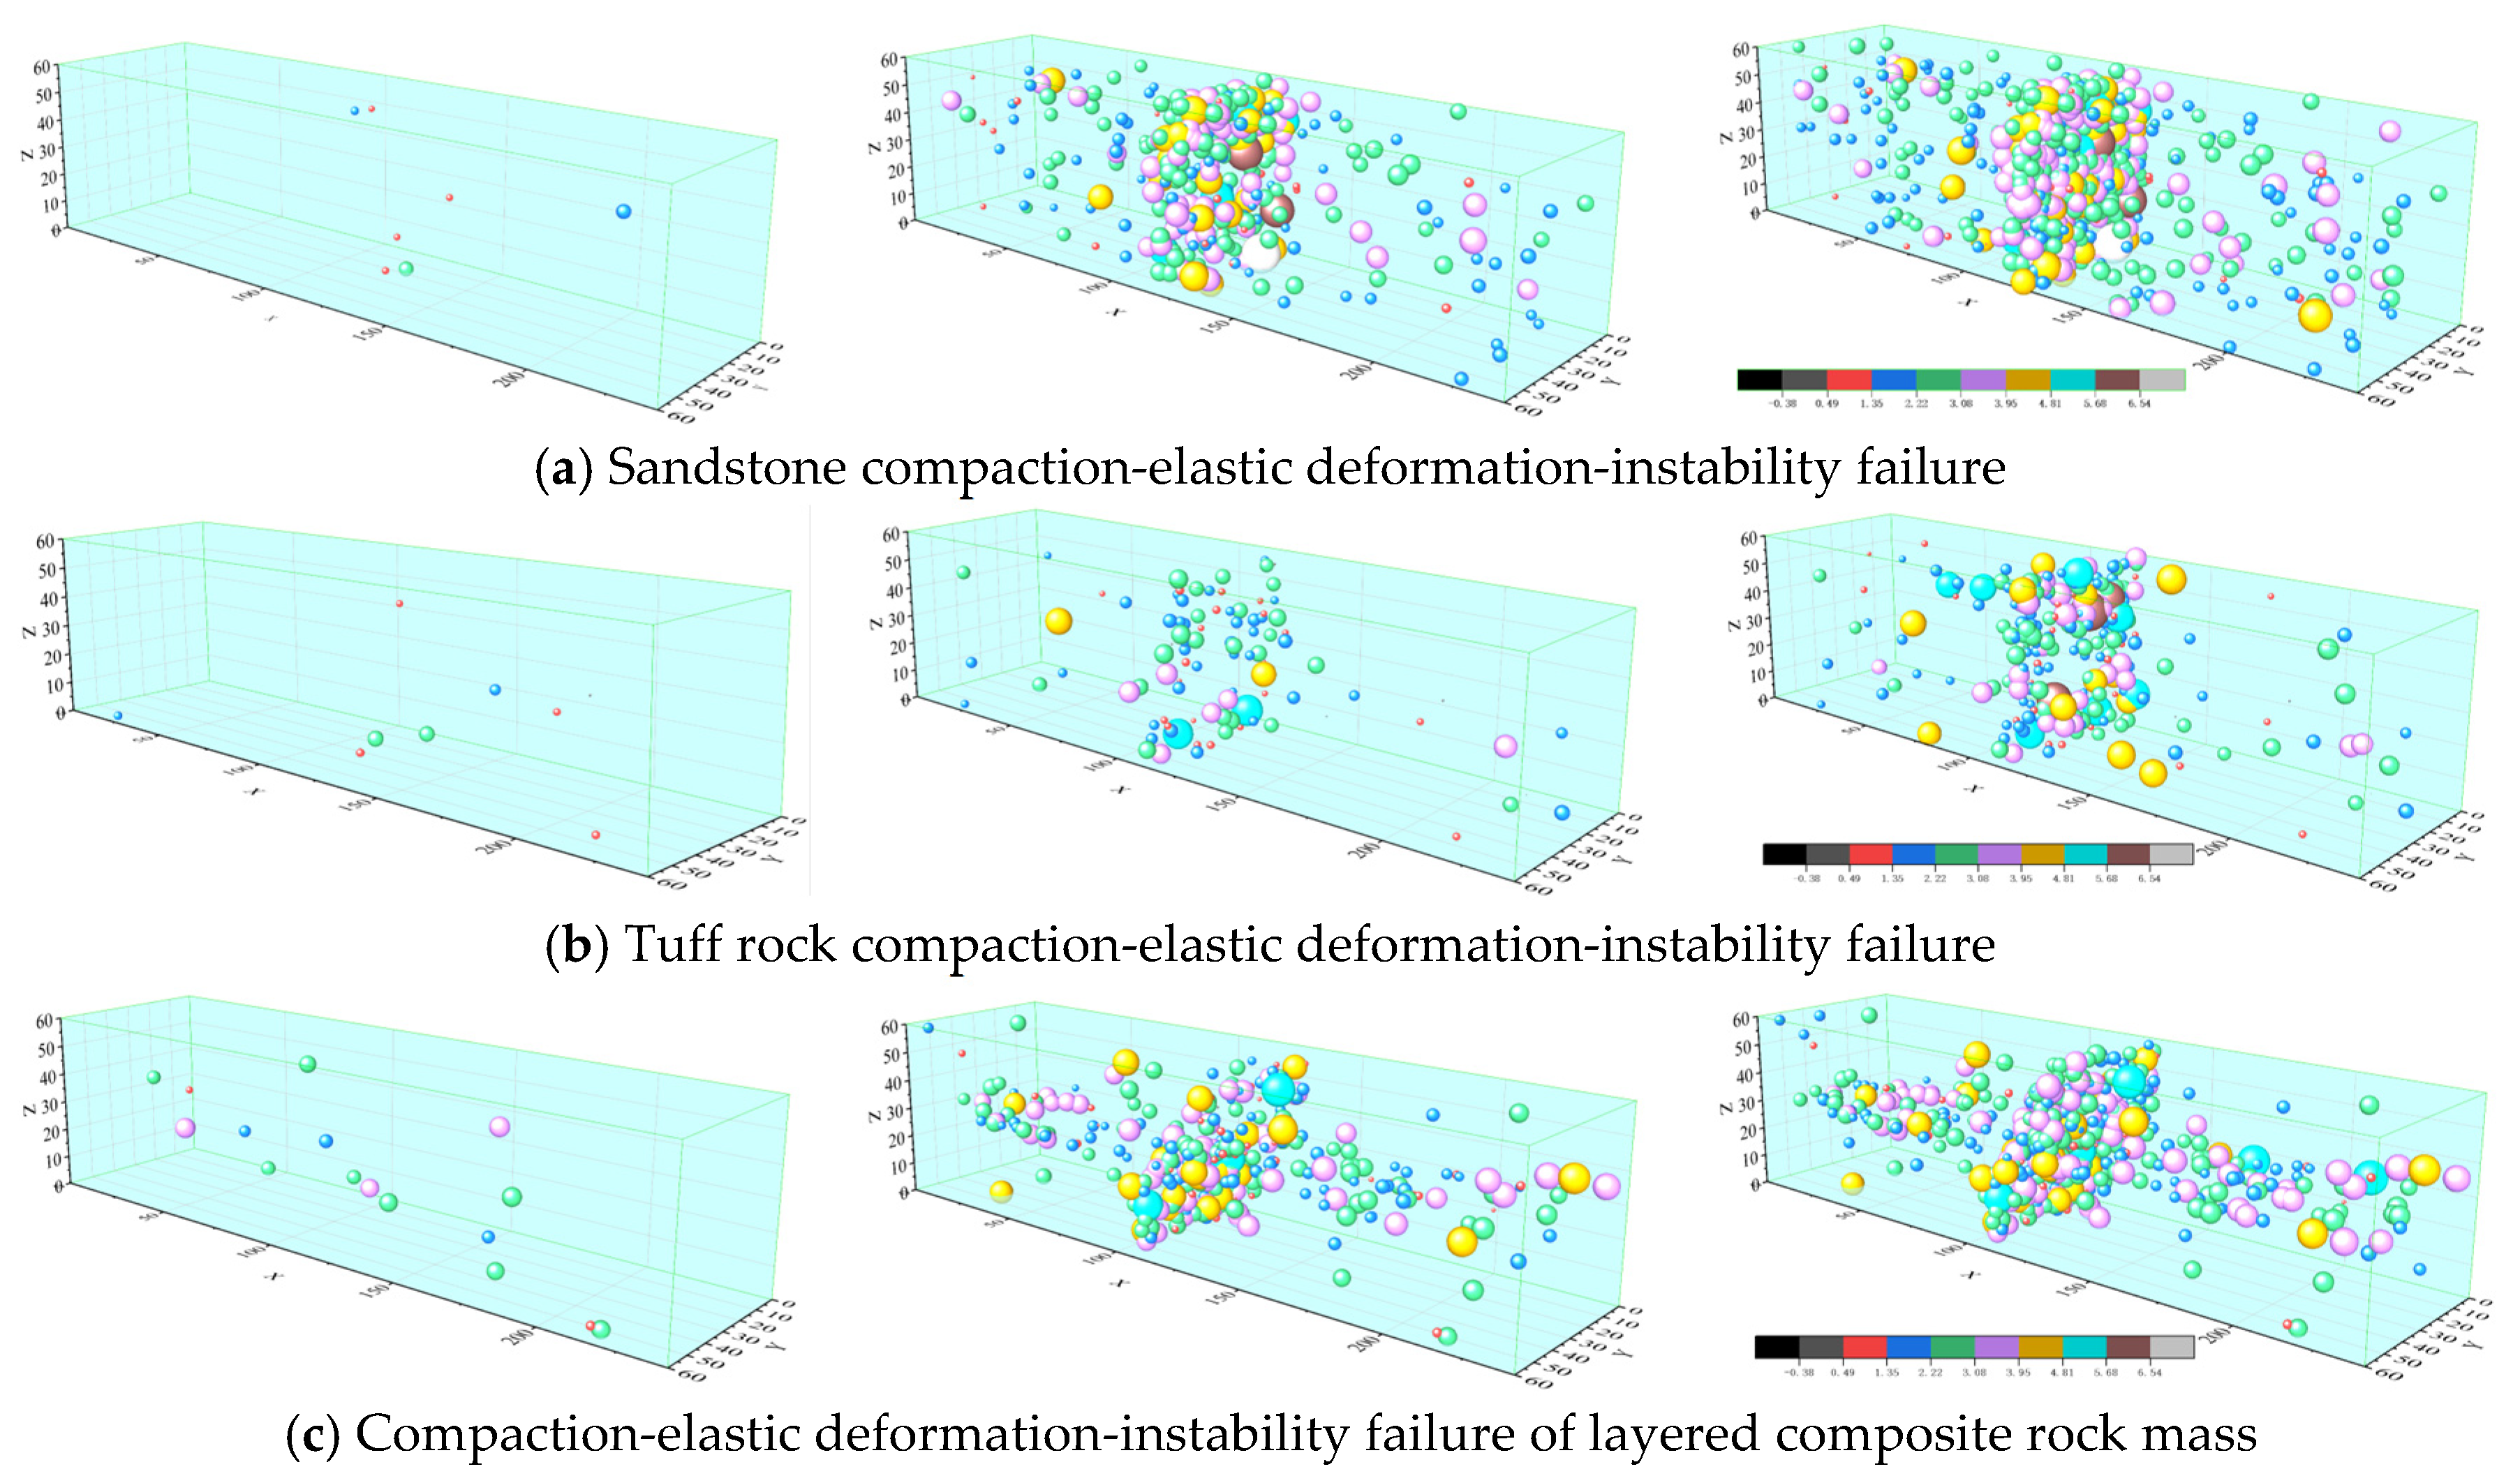
  8. Song, H. Experimental Study on the Fracture Surface Characteristic Law of Coal-Rock Combination Under Bending Failure. Master’s Thesis, Anhui University of Science and Technology, Huainan, China, 2020. [Google Scholar] [CrossRef]
  9. Zhao, Y.F.; Liu, L.Q.; Zhang, Y. Variation laws of microseismic and charge induction signals of brittle rock specimens under three-point bending. J. Exp. Mech. 2018, 33, 929–937. Available online: https://kns.cnki.net/kcms2/article/abstract?v=L9QYEmxDei3qLI9POMc-TJaDz8KD3r4LfEsWZ7Y5Rt4UrrcjQabU7g0fvxvluFUG3D6qyvIIjJCS16_4ZAOBGfHaXYsPLJIVPMET7-xiP1gHZrnaNFldAphGK2Kx7e3y_0oCfh3IXaWnKiTykXxc-0zz-q9PnO6fvnKGhyBudZIp9u7z5FnrQ1fav5q9ovw6&uniplatform=NZKPT&language=CHS (accessed on 10 February 2026).
  10. Xu, H.L.; Tan, A.F.; Song, Y.M.; An, D.; Zhang, Y.Y.; Du, Y.; Gao, H.J. Study on sliding deformation and failure characteristics of layered composite rock. Rock Soil Mech. 2024, 45, 42–52. [Google Scholar] [CrossRef]
  11. Xu, H.L.; Tan, A.F.; Song, Y.M.; Zhu, L.; An, D.; Du, Y.; Gao, H.J. Study on the contact surface mechanical characteristics of layered composite rock during the whole deformation and failure process. Rock Soil Mech. 2023, 44, 1683–1694. [Google Scholar] [CrossRef]
  12. Song, Y.M.; Zhang, Y.Y.; Deng, W.L.; Zhao, Y.Z.; Fan, H.Y. Experimental study on bending deformation and energy evolution of composite rock beam. J. Exp. Mech. 2024, 39, 463–473. Available online: https://kns.cnki.net/kcms2/article/abstract?v=L9QYEmxDei0SvjHEwAHz8j7XV5WnklsyntG3TeVuehbny04MBYnj1P5uJy23g8A7VlJYtBvzPwVy378itRUq0PpFqjMS1MtBGPeCR4j0TGNhY0L60icjw_98s3PGoWu8sWmDkmOCycp2L2zW3MHcHRnsOjSb5OXXtd618lo_h-bHFPKEK20vXu1JnVf3adje&uniplatform=NZKPT&language=CHS (accessed on 10 February 2026).
  13. Huang, F.; Zhou, Y.; Li, T.Y.; Hu, X.T. Laboratory experimental study on mechanical properties and failure modes of soft-hard interbedded rock mass. J. China Coal Soc. 2020, 45, 230–238. [Google Scholar] [CrossRef]
  14. Teng, J.Y.; Tang, J.X.; Wang, J.B.; Zhang, Y.N. Damage evolution law and fractal characteristics of layered composite rock mass. Chin. J. Rock Mech. Eng. 2018, 37, 3263–3278. [Google Scholar] [CrossRef]
  15. Nian, Y.; Wu, S.; Han, S. Numerical simulation of mechanical and fracture behavior of composite rock containing weak interlayers. Comput. Part. Mech. 2023, 11, 1681–1694. [Google Scholar] [CrossRef]
  16. Zhong, Z.B.; Hu, X.Z.; Deng, R.G.; Fu, X.M.; Lv, L. Study on compression-shear fracture mechanism of jointed rock mass with fissure filling. Chin. J. Rock Mech. Eng. 2018, 37, 3320–3331. [Google Scholar] [CrossRef]
  17. Wang, W.; Zhuang, Y.Y.; Liu, S.F.; Duan, X.L.; Cao, Y.J.; Yue, P.; Qian, Y.J. Study on triaxial compression mechanical properties and crack closure evolution law of blue sandstone-mortar composite. J. Hohai Univ. (Nat. Sci.) 2025, 67–75. [Google Scholar] [CrossRef]
  18. Jia, J.; Tao, T.; Tian, X.; Xie, C.; Jian, B.; Li, G. A damage constitutive model of layered slate under the action of triaxial compression and water environment erosion. Sci. Rep. 2024, 14, 8445. [Google Scholar] [CrossRef] [PubMed]
  19. Lin, H.; Li, S.; Zhang, X. Macro-micro failure and crack coalescence behavior of soft-hard composite rock with three parallel joints under uniaxial compression. J. Mater. Res. Technol. 2024, 29, 2947–2958. [Google Scholar] [CrossRef]
  20. Li, T.; Chen, G.; Qin, Z.; Li, Q. Analysis the characteristic of energy and damage of coal-rock composite structure under cycle loading. Geotech. Geol. Eng. 2022, 40, 765–783. [Google Scholar] [CrossRef]
  21. Dong, L.; Yan, M.; Chen, Y.; Yang, L.; Sun, D. Study on Mechanical and Acoustic Emission Characteristics of Backfill–Rock Instability under Different Stress Conditions. Sensors 2024, 24, 4112. [Google Scholar] [CrossRef]
  22. Liu, Y.; Meng, X. Dynamic multifractal characteristics of acoustic emission about composite samples with different stress loading and unloading conditions. Sci. Rep. 2024, 14, 7533. [Google Scholar] [CrossRef] [PubMed]
  23. GB/T 50266-2013; Standardization Administration of the People’s Republic of China. Standard for Test Methods of Engineering Rock Mass. China Planning Press: Beijing, China, 2013.
Figure 1. Four-point bending experimental equipment.
Processes 14 00888 g001
Figure 2. Bonding positions of acoustic emission probes and strain gauges. Note: ①–⑫ are strain gauge numbers; (1)–(8) are acoustic emission (AE) probe numbers; LS denotes the specimen span; l denotes the loading point spacing.
Processes 14 00888 g002
Figure 3. Load curves of laminated composite rock bodies with different lithologies.
Processes 14 00888 g003
Figure 4. Load curves for layered composite rock bodies with different loading rates.
Processes 14 00888 g004
Figure 5. Load curves for laminated composite rock bodies with different spans.
Processes 14 00888 g005
Figure 6. Local strain curves of layered composite rock bodies with different lithologies. (a) Fine sandstone monomer; (b) tuffite monomer; (c) layer composite rock mass.
Processes 14 00888 g006
Figure 7. Local strain curves of laminated composite rock bodies with different loading rates: (a) loading rate 0.01 mm/s; (b) loading rate 0.02 mm/s; (c) loading rate 0.002 mm/s.
Processes 14 00888 g007
Figure 8. Local strain curves of laminated composite rock bodies with different spans: (a) span 170 mm; (b) span 180 mm; (c) span 190 mm.
Processes 14 00888 g008
Figure 9. Fissure development paths in layered composite rock bodies of different lithologies: (a) fine sandstone; (b) tuff; (c) fine sandstone–tuff rock.
Processes 14 00888 g009
Figure 10. Fracture development paths in layered composite rock bodies with different loading rates: (a) loading rate 0.01 mm/s; (b) loading rate 0.02 mm/s; (c) loading rate 0.002 mm/s.
Processes 14 00888 g010
Figure 11. Fissure development paths of laminated composite rock bodies with different spans: (a) span 170 mm; (b) span 180 mm; (c) span 190 mm.
Processes 14 00888 g011
Figure 12. Ringing count curve of acoustic emission from different rock types: (a) fine sandstone monomer; (b) tuffite monomer; (c) layer composite rock mass.
Processes 14 00888 g012
Figure 13. Ringing count curve of acoustic emission at different loading rates: (a) loading rate 0.01 mm/s; (b) loading rate 0.02 mm/s; (c) loading rate 0.002 mm/s.
Processes 14 00888 g013
Figure 14. Ringing count curve of different span acoustic emissions: (a) span 170 mm; (b) span 180 mm; (c) span 190 mm.
Processes 14 00888 g014
Figure 15. Acoustic emission event location points of layered composite rock mass with different lithologies: (a) sandstone compaction–elastic deformation–instability failure; (b) tuff rock compaction–elastic deformation–instability failure; (c) compaction–elastic deformation–instability failure of layered composite rock mass.
Processes 14 00888 g015
Figure 16. Acoustic emission event location points of layered composite rock mass under different loading rates: (a) loading rate 0.01 mm/s; (b) loading rate 0.02 mm/s.
Processes 14 00888 g016
Figure 17. Acoustic emission event location points of layered composite rock mass under different spans: (a) span 170 mm; (b) span 180 mm; (c) span 190 mm.
Processes 14 00888 g017
Table 1. Specific parameters and variables for monolithic and layered composite rock masses.
Specimen No.bh L S l VariableMonitoring Method
/m/m/m/m
A-S-10.0620.0590.190.06Lithology: Fine sandstoneAE + Strain gauge
A-S-20.0620.0610.190.06Lithology: Fine sandstoneAE + Strain gauge
A-S-30.0590.0600.190.06Lithology: Fine sandstoneAE + Strain gauge
A-T-10.0590.0600.190.06Lithology: TuffAE + Strain gauge
A-T-20.0600.0600.190.06Lithology: TuffAE + Strain gauge
A-T-30.0610.0600.190.06Lithology: TuffAE + Strain gauge
A-ST-10.0600.0580.190.06Lithology: Fine sandstone + TuffAE + Strain gauge
A-ST-20.0600.0590.190.06Lithology: Fine sandstone + TuffAE + Strain gauge
A-ST-30.0600.0590.190.06Lithology: Fine sandstone + TuffAE + Strain gauge
B-0.01-10.0600.0600.190.06Loading rate: 0.01 mm/sAE + Strain gauge
B-0.01-20.0590.0600.190.06Loading rate: 0.01 mm/sAE + Strain gauge
B-0.01-30.0590.0600.190.06Loading rate: 0.01 mm/sAE + Strain gauge
B-0.02-10.0600.0600.190.06Loading rate: 0.02 mm/sAE + Strain gauge
B-0.02-20.0600.0600.190.06Loading rate: 0.02 mm/sAE + Strain gauge
B-0.02-30.0600.0600.190.06Loading rate: 0.02 mm/sAE + Strain gauge
C-170-10.0610.0620.170.06 L S = 170 mmAE + Strain gauge
C-170-20.0610.0610.170.06 L S = 170 mmAE + Strain gauge
C-170-30.0620.0610.170.06 L S = 170 mmAE + Strain gauge
C-180-10.0600.0620.180.06 L S = 180 mmAE + Strain gauge
C-180-20.0600.0610.180.06 L S = 180 mmAE + Strain gauge
C-180-30.0600.0600.180.06 L S = 180 mmAE + Strain gauge
Note: b denotes the cross-sectional width of the specimen; h denotes the rock mass thickness of the specimen; l denotes the spacing of upper loading indenters; LS denotes the test-set span.
Table 2. Four-point bending test results of laminated composite rock bodies.
Specimen No. E E 1 I t o t a l Peak LoadFlexural StrengthMid-Span Deformation Deflection
/GPa/kN·m2/kN/MPa / × 10 3 mm
A-S-142.686.15
A-S-242.685.98
A-S-342.687.10
Average42.686.415.2516.05
A-T-135.546.32
A-T-235.545.21
A-T-335.545.57
Average35.545.704.7517.43
A-ST-141.993.41
A-ST-241.993.19
A-ST-341.993.15
Average41.993.252.809.08
B-0.01-141.992.31
B-0.01-241.991.92
B-0.01-341.991.74
Average41.991.991.695.56
B-0.02-141.992.03
B-0.02-241.991.57
B-0.02-341.991.26
Average41.991.621.354.53
C-170-141.992.43
C-170-241.991.96
C-170-341.992.00
Average41.992.131.694.58
C-180-141.992.20
C-180-241.991.99
C-180-341.992.41
Average41.992.201.775.42
Table 3. Classification and judgment criteria of cracks in layered composite rock masses.
Crack TypeDominant StressCore CharacteristicsExperimental Judgment Criteria
Mode I (Tensile)Tensile stressOpening-type; crack surface is perpendicular to the direction of tensile stress, with no obvious rock displacement.AE location points are vertically distributed along the mid-span; strain gauges detect sudden tensile strain; high-speed cameras capture vertically penetrating cracks.
Mode II (Shear)Shear stressSlip-type; crack surface is parallel to the direction of shear stress, accompanied by significant rock displacement.AE location points are obliquely distributed along the rock layer interface; strain gauges detect sudden shear strain; high-speed cameras capture oblique cracks and interlayer slip.
Mixed Mode (I + II)Combined tensile–shear stressCombined development of vertical and oblique cracks, with local slip.The above two characteristics appear simultaneously; strain mutations and AE event aggregation are monitored both at the mid-span and rock layer interface.
Table 4. Four-point bending laminated composite rock body fissure development forms.
Specimen No.Crack TypeCrack Development Form
A-S-1Type I CrackThe crack vertically penetrates
A-S-2Type I CrackThe crack vertically penetrates
A-S-3Type I CrackThe crack vertically penetrates
A-T-1Type I CrackThe crack obliquely penetrates
A-T-2Type I CrackThe crack obliquely penetrates
A-T-3Type I CrackThe crack vertically penetrates
A-ST-1Type I Crack + Type II CrackThe lower part of the crack vertically penetrates, and the upper part obliquely penetrates
A-ST-2Type I Crack + Type II CrackThe lower part of the crack vertically penetrates, and the upper part vertically penetrates
A-ST-3Type I Crack + Type II CrackThe lower part of the crack vertically penetrates, and the upper part obliquely penetrates
B-0.01-1Type I Crack + Type II CrackThe lower part of the crack vertically penetrates, and the upper part vertically penetrates
B-0.01-2Type I Crack + Type II CrackThe lower part of the crack vertically penetrates, and the upper part vertically penetrates
B-0.01-3Type I Crack + Type II CrackThe lower part of the crack vertically penetrates, and the upper part vertically penetrates
B-0.02-1Type I Crack + Type II CrackThe lower part of the crack obliquely penetrates, and the upper part vertically penetrates
B-0.02-2Type I Crack + Type II CrackThe lower part of the crack obliquely penetrates, and the upper part vertically penetrates
B-0.02-3Type I Crack + Type II CrackThe lower part of the crack obliquely penetrates, and the upper part vertically penetrates
C-170-1Type I Crack + Type II CrackThe crack vertically penetrates
C-170-2Type I Crack + Type II CrackThe crack obliquely penetrates
C-170-3Type I Crack + Type II CrackThe crack vertically penetrates
C-180-1Type I Crack + Type II CrackThe lower part of the crack vertically penetrates, and the upper part vertically penetrates
C-180-2Type I Crack + Type II CrackThe lower part of the crack vertically penetrates, and the upper part obliquely penetrates
C-180-3Type I Crack + Type II CrackThe lower part of the crack vertically penetrates, and the upper part vertically penetrates
Disclaimer/Publisher’s Note: The statements, opinions and data contained in all publications are solely those of the individual author(s) and contributor(s) and not of MDPI and/or the editor(s). MDPI and/or the editor(s) disclaim responsibility for any injury to people or property resulting from any ideas, methods, instructions or products referred to in the content.