4.1. Proposed Early Warning Method and Working Procedure
The proposed method follows a complete, sequential process flow, including data preprocessing, feature optimization, multi-algorithm clustering, and voting-based decision making. Clustering analysis, as a core approach for feature-level data fusion, mainly realizes data classification based on the internal correlation and inherent logical connections within the raw datasets. Unlike traditional methods that rely on training models to assign weights to early warning indicators, this proposed technique involves significantly lower subjective interference and has been widely applied in various research fields, including mechanical fault diagnosis.
In the context of roadway excavation engineering, the excavation face, along with its matched supporting facilities, excavation equipment, and monitoring devices, can be integrated into a complete coal–rock dynamic system. Under conventional excavation speed conditions, the stress state of the coal–rock mass presents a periodic cyclic process of “stress concentration–stress release–stress re-concentration”, and the monitoring data collected by various monitoring systems fluctuate stably within a reasonable and fixed range. However, when a roadway roof disaster is imminent, the vibration field and stress field in the coal–rock medium will undergo drastic disturbances, which further leads to obvious “deviation” characteristics in the early warning indicator data monitored by the system.
Establishing an automatic identification algorithm to detect such abnormal data deviation characteristics can support the intelligent early warning of roadway roof disaster through microseismic monitoring, a technical route that is highly consistent with the unsupervised learning attribute of clustering analysis. The proposed method fully leverages the dynamic evolution rules of real-time monitoring data, explores the topological distribution characteristics of abnormal monitoring data, and thus provides a data-driven intelligent technical solution for the early identification and early warning of potential roof disaster.
Before conducting spatial–temporal early warning analysis, data normalization processing must be performed in advance to ensure the accuracy and comparability of subsequent analysis. For non-negative early warning indicators, the corresponding normalization calculation is carried out in strict accordance with Equation (1); for negative early warning indicators, the normalization formula applied is specified in Equation (2).
In this context, Wj stands for the j-th normalized early warning indicator, while xi refers to the j-th early warning index corresponding to the i-th sample. The subscript i ranges from 1 to mt, and j ranges from 1 to tn, where mt represents the total number of samples, and nt denotes the total count of early warning indicators.
In the research on early warning of roadway roof disaster, microseismic events with an energy release exceeding 104 J are classified as high-energy events. Due to the intense energy release feature of such events, they pose a significant threat to the stability and structural integrity of the roadway roof. In contrast, the operational state where no high-energy microseismic events are detected is defined as a low-risk state. Under this state, although there may still be potential safety hazards in the roadway roof, the overall risk remains at a relatively low level, which is manageable and controllable.
High-energy microseismic events can be further subdivided into two distinct categories based on their corresponding engineering consequences. Specifically, a high-energy event that does not trigger actual roof disaster is defined as a non-hazardous high-energy event. Although this type of event is accompanied by obvious energy concentration and release, it does not lead to catastrophic damages such as roadway collapse. This outcome is jointly influenced by multiple factors, including the spatial location of energy release, the mechanical properties of the roof rock mass, and the supporting effectiveness of the roadway support structure.
On the other hand, a high-energy event that directly triggers typical roadway disasters (such as roof disaster and surrounding rock collapse) is classified as a hazard-type event. This classification framework is established based on the coupling relationship between the intensity of energy release and the actual impact of disasters. It not only takes full account of the physical characteristics of microseismic energy release but also integrates the occurrence and evolution mechanisms of disasters in practical engineering scenarios. This framework provides a scientific and standardized criterion for the accurate classification of roadway roof risk levels, and lays a solid foundation for building a hierarchical, targeted roof disaster early warning system.
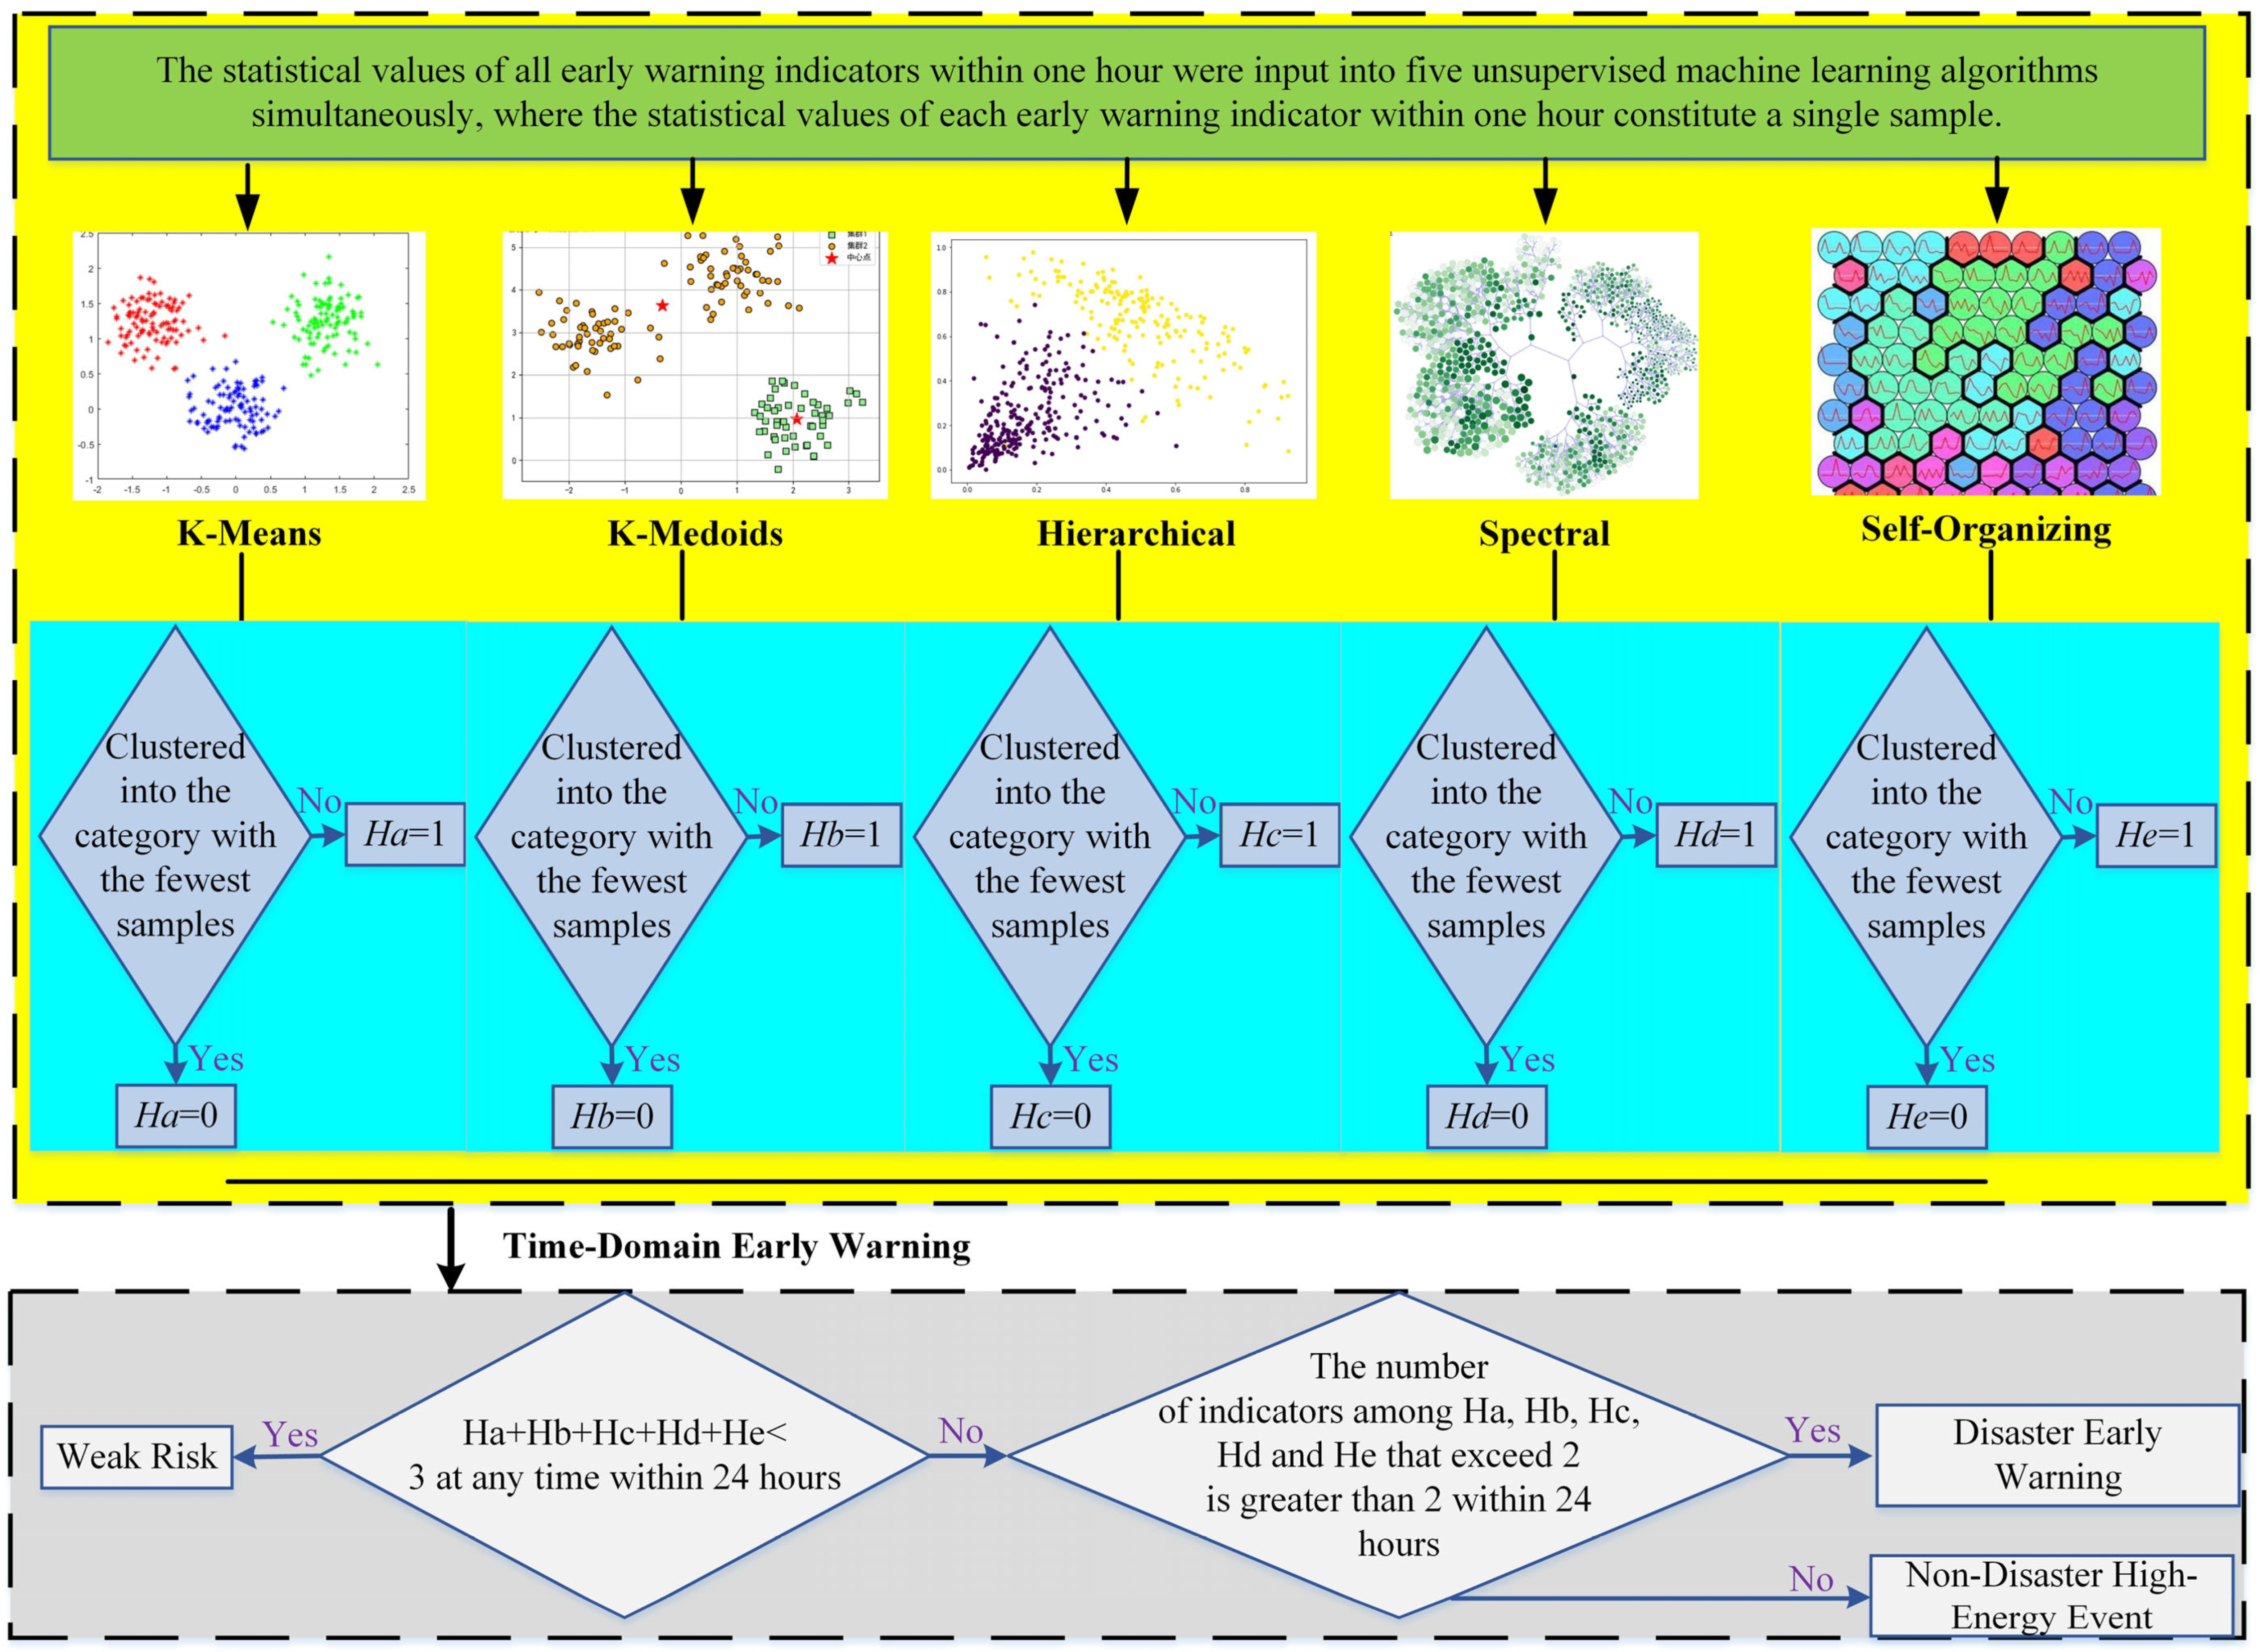
The detailed flow chart of the proposed early warning method is illustrated in
Figure 18. The entire early warning process consists of four sequential stages: data preprocessing, feature optimization, multi-algorithm clustering, and voting-based decision making.
At the data input stage, the statistical parameters corresponding to all early warning indicators in each time interval are treated as independent samples and synchronously imported into five typical unsupervised clustering algorithms, namely K-means clustering, K-medoids clustering, hierarchical clustering, spectral clustering, and self-organizing mapping. Each algorithm performs sample clustering in accordance with its inherent clustering mechanism, with the cluster number set to 3. Subsequently, decision variables (Ha, Hb, Hc, Hd, and He) are obtained by identifying whether each sample is classified into the cluster with the smallest sample size. The cluster number k = 3 is determined according to the physical classification of microseismic events and engineering risk levels, corresponding to the low-risk state, non-disaster high-energy event, and roof disaster, respectively. It conforms to the physical mechanism of coal–rock fracture and is verified to be the optimal number for clustering effect.
Ha, Hb, Hc, Hd, and He represent the judgment results of K-means, K-medoids, hierarchical clustering, spectral clustering, and self-organizing mapping algorithms, respectively. When an algorithm classifies a sample into the cluster with the smallest sample size, the corresponding variable is set to 1; otherwise, it is set to 0. Within a continuous 24 h period, G denotes the number of algorithms that identify at least one abnormal sample, and F denotes the number of algorithms that identify at least three abnormal samples. If G < 3, the state is low risk. If G ≥ 3 and F ≤ 2, it is a non-disaster high-energy event. If G ≥ 3 and F > 2, a roof disaster is identified, and an early warning is issued.
The setting of three clusters is designed to correspond to three typical operational scenarios: low-risk state, non-hazardous high-energy events, and actual disaster events, respectively. During the time-domain early warning phase, the risk level of roadway roof disaster is determined by calculating the sum of the five aforementioned decision variables and comparing the total value with the preset threshold. The specific determination criteria are as follows: within a continuous 24 h period, if fewer than three algorithms classify at least one sample in the corresponding time interval into the smallest cluster, the roof disaster is identified as low. Conversely, if no fewer than three algorithms assign at least one sample to the smallest cluster within 24 h, further verification is required to determine whether the number of algorithms that classify at least three samples into the smallest cluster exceeds two. If the number exceeds two, a formal disaster warning will be issued; otherwise, the scenario will be classified as a non-hazardous high-energy event.
This proposed method can be directly applied to the intelligent monitoring process of coal mine roadway roof stability, providing a standardized, process-oriented technical solution for disaster early warning.
The criteria for evaluating the effectiveness of the time-domain early warning process are clearly defined as follows: an early warning signal is deemed accurate if a roadway roof disaster occurs within 24 h after the warning is issued. Meanwhile, specific rules for counting the number of early warnings corresponding to different early warning methods are specified in detail below.
For a single machine learning algorithm, when the algorithm classifies a sample into the cluster with the smallest sample size and a roof disaster occurs within the subsequent 24 h window, this result is recorded as one valid judgment; otherwise, it is counted as one invalid judgment. For the integrated method combining unsupervised machine learning and group decision making, a complete judgment process is considered completed only when no fewer than three out of the five unsupervised machine learning algorithms assign at least one sample to the smallest cluster within a 24 h period.
In addition, the final total number of judgments for the aforementioned integrated method is determined by the third-highest value among the judgment counts obtained from the five individual unsupervised machine learning algorithms. This structured and standardized process effectively enhances the robustness and accuracy of microseismic early warning, making it more applicable to practical engineering scenarios.
All five clustering algorithms are set with the number of clusters k = 3, corresponding to low-risk state, non-disaster high-energy event, and roof disaster, respectively. Other parameters are set as default or optimal values recommended in the related literature to ensure clustering stability and effect (
Table 5).
4.2. Field Application Process and Validation Results
Before constructing a roadway disaster early warning model based on time-domain analysis, it is necessary to normalize all indicators in the warning indicator set for a specific period in the target mine. This step is designed to eliminate the negative impact of scale differences among various warning indicators on the model’s prediction accuracy, a key prerequisite for ensuring the reliability of the early warning model.
The normalization process maps raw monitoring data to a unified numerical interval, which not only enables effective comparison among different warning indicators in subsequent analysis but also optimizes the stability of the model and improves its prediction accuracy. This standardized normalization process is an essential link in the early warning workflow, laying a solid foundation for the subsequent construction of the time-domain early warning model and ensuring its adaptability to practical engineering scenarios.
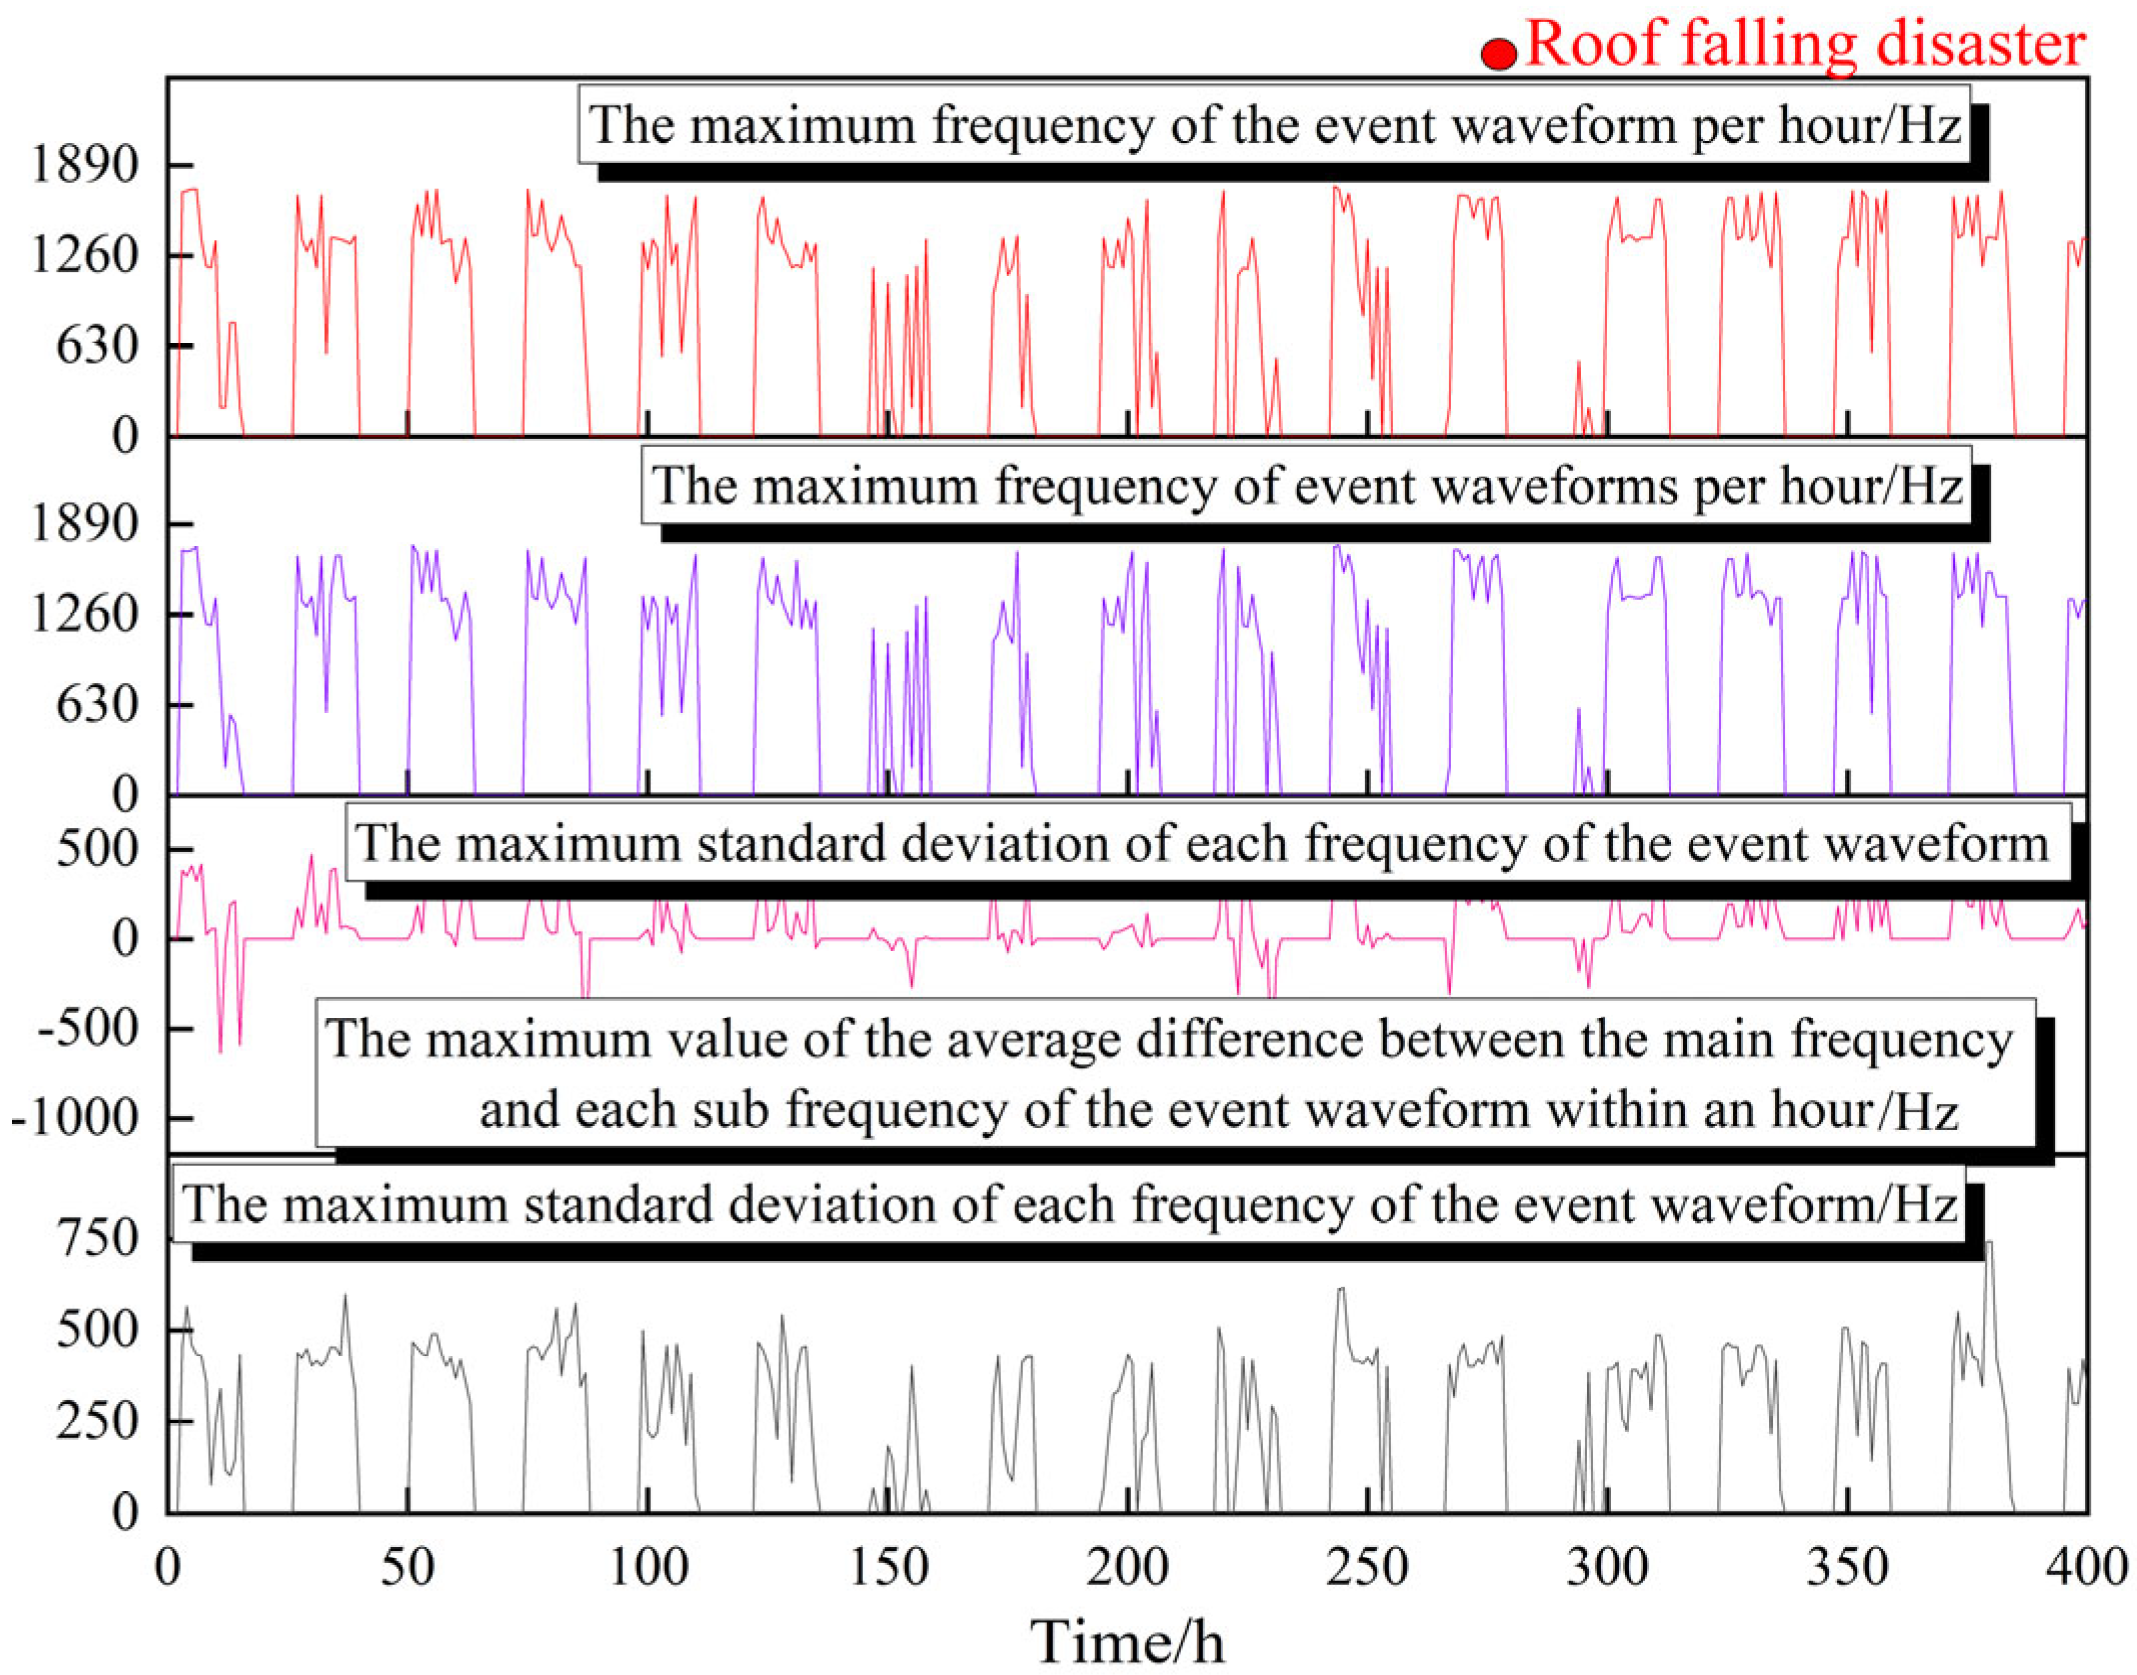
This study takes the excavation roadway of a coal mine in Shanxi Province as the engineering background and selects microseismic monitoring data collected from 7:05 am on 22 March 2025 to 7:05 am on 21 April 2025 (with a total duration of 720 h) to conduct in-depth research on intelligent early warning of roadway roof disaster.
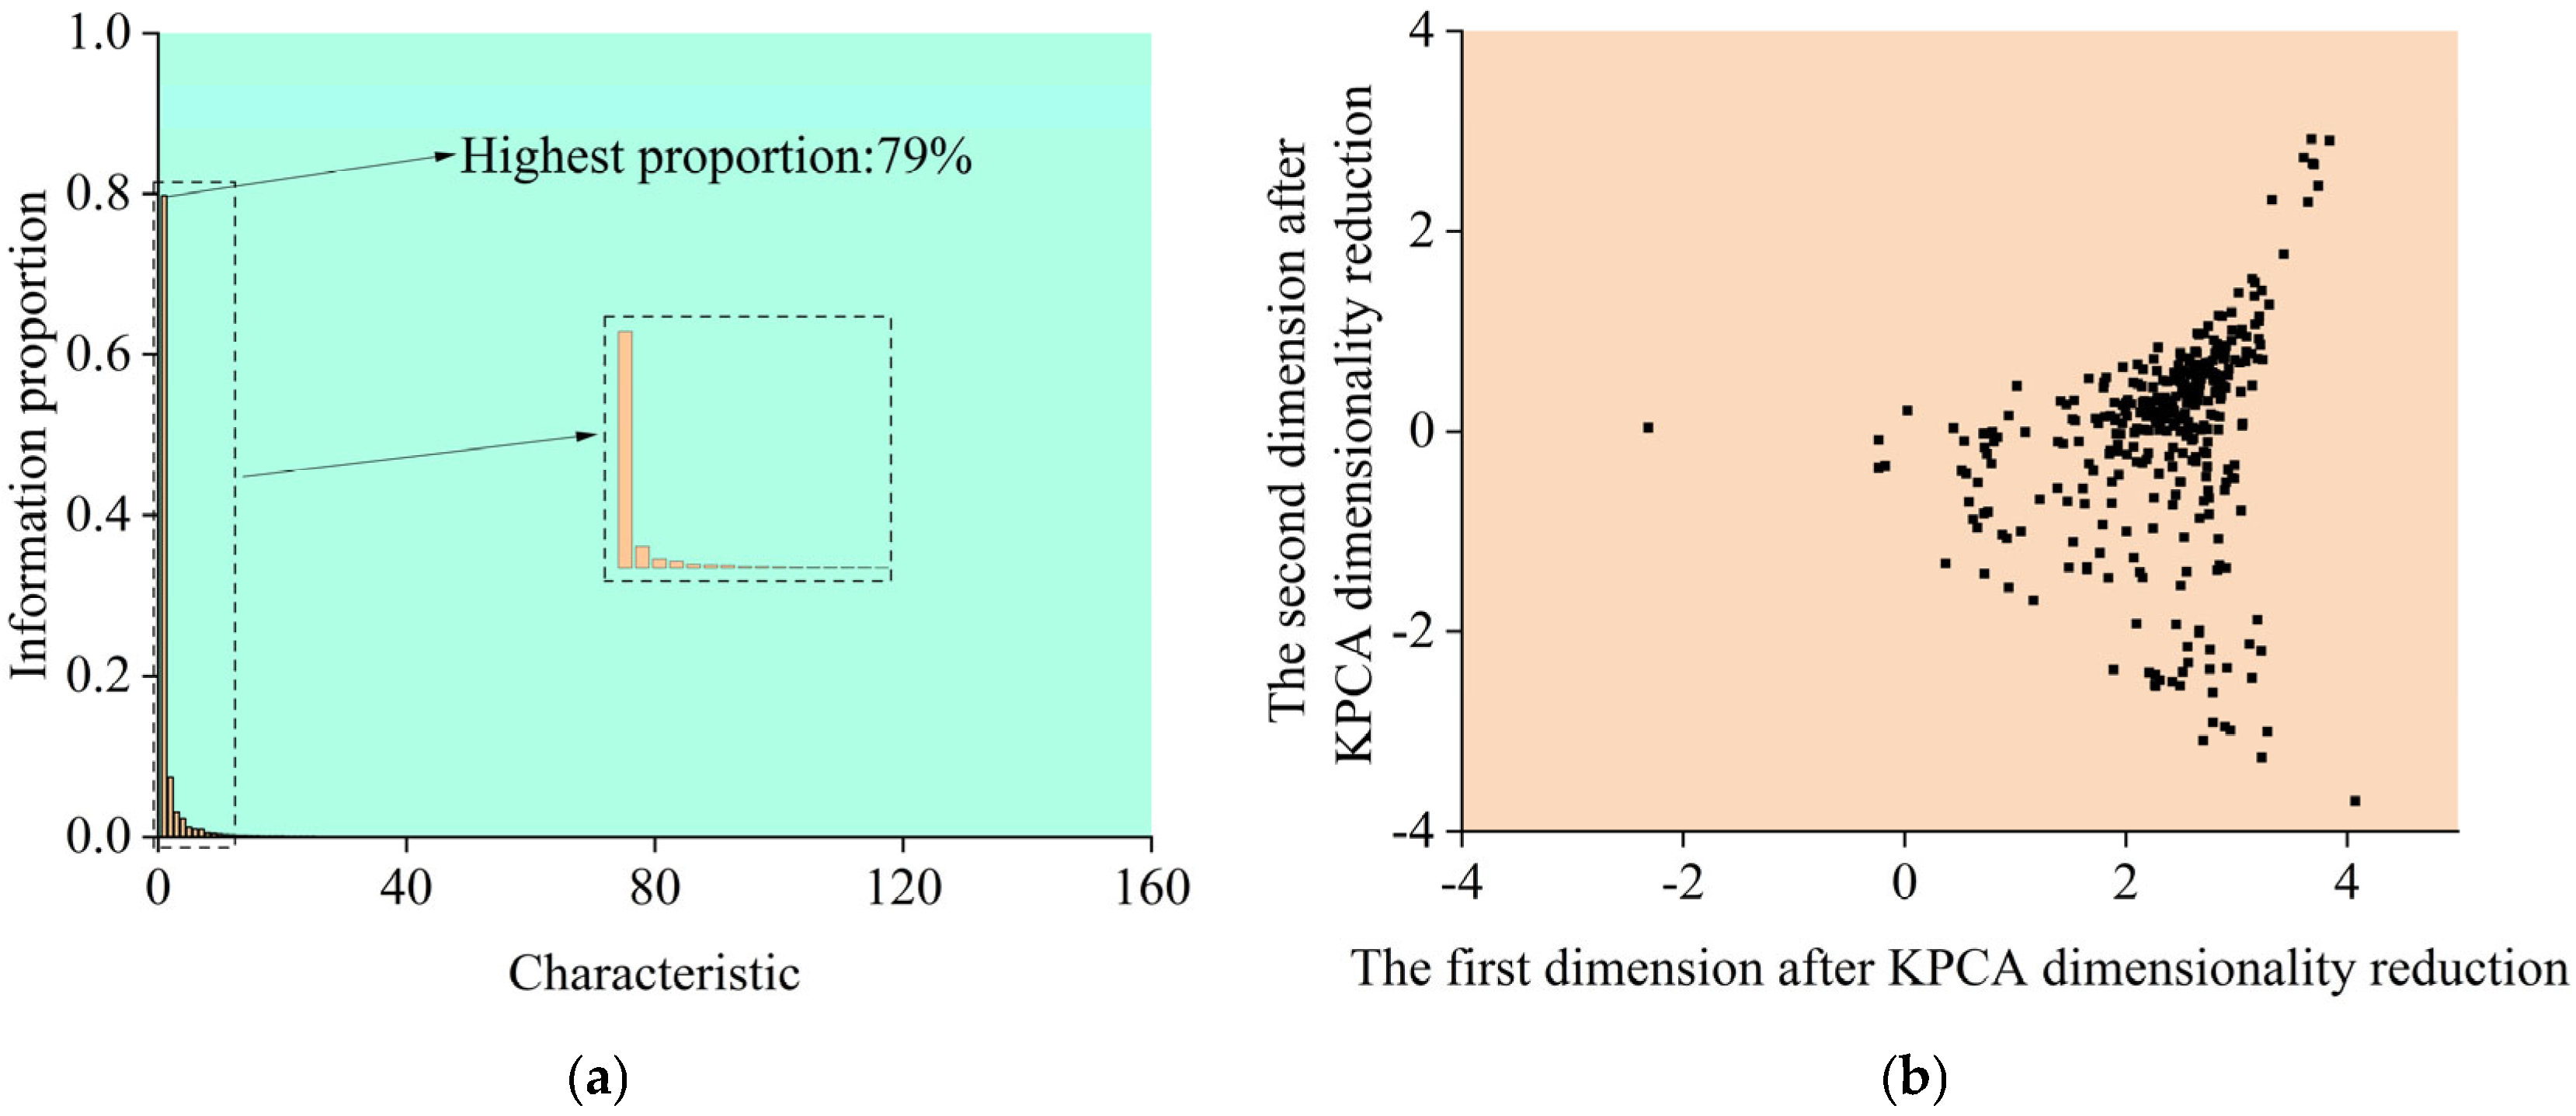
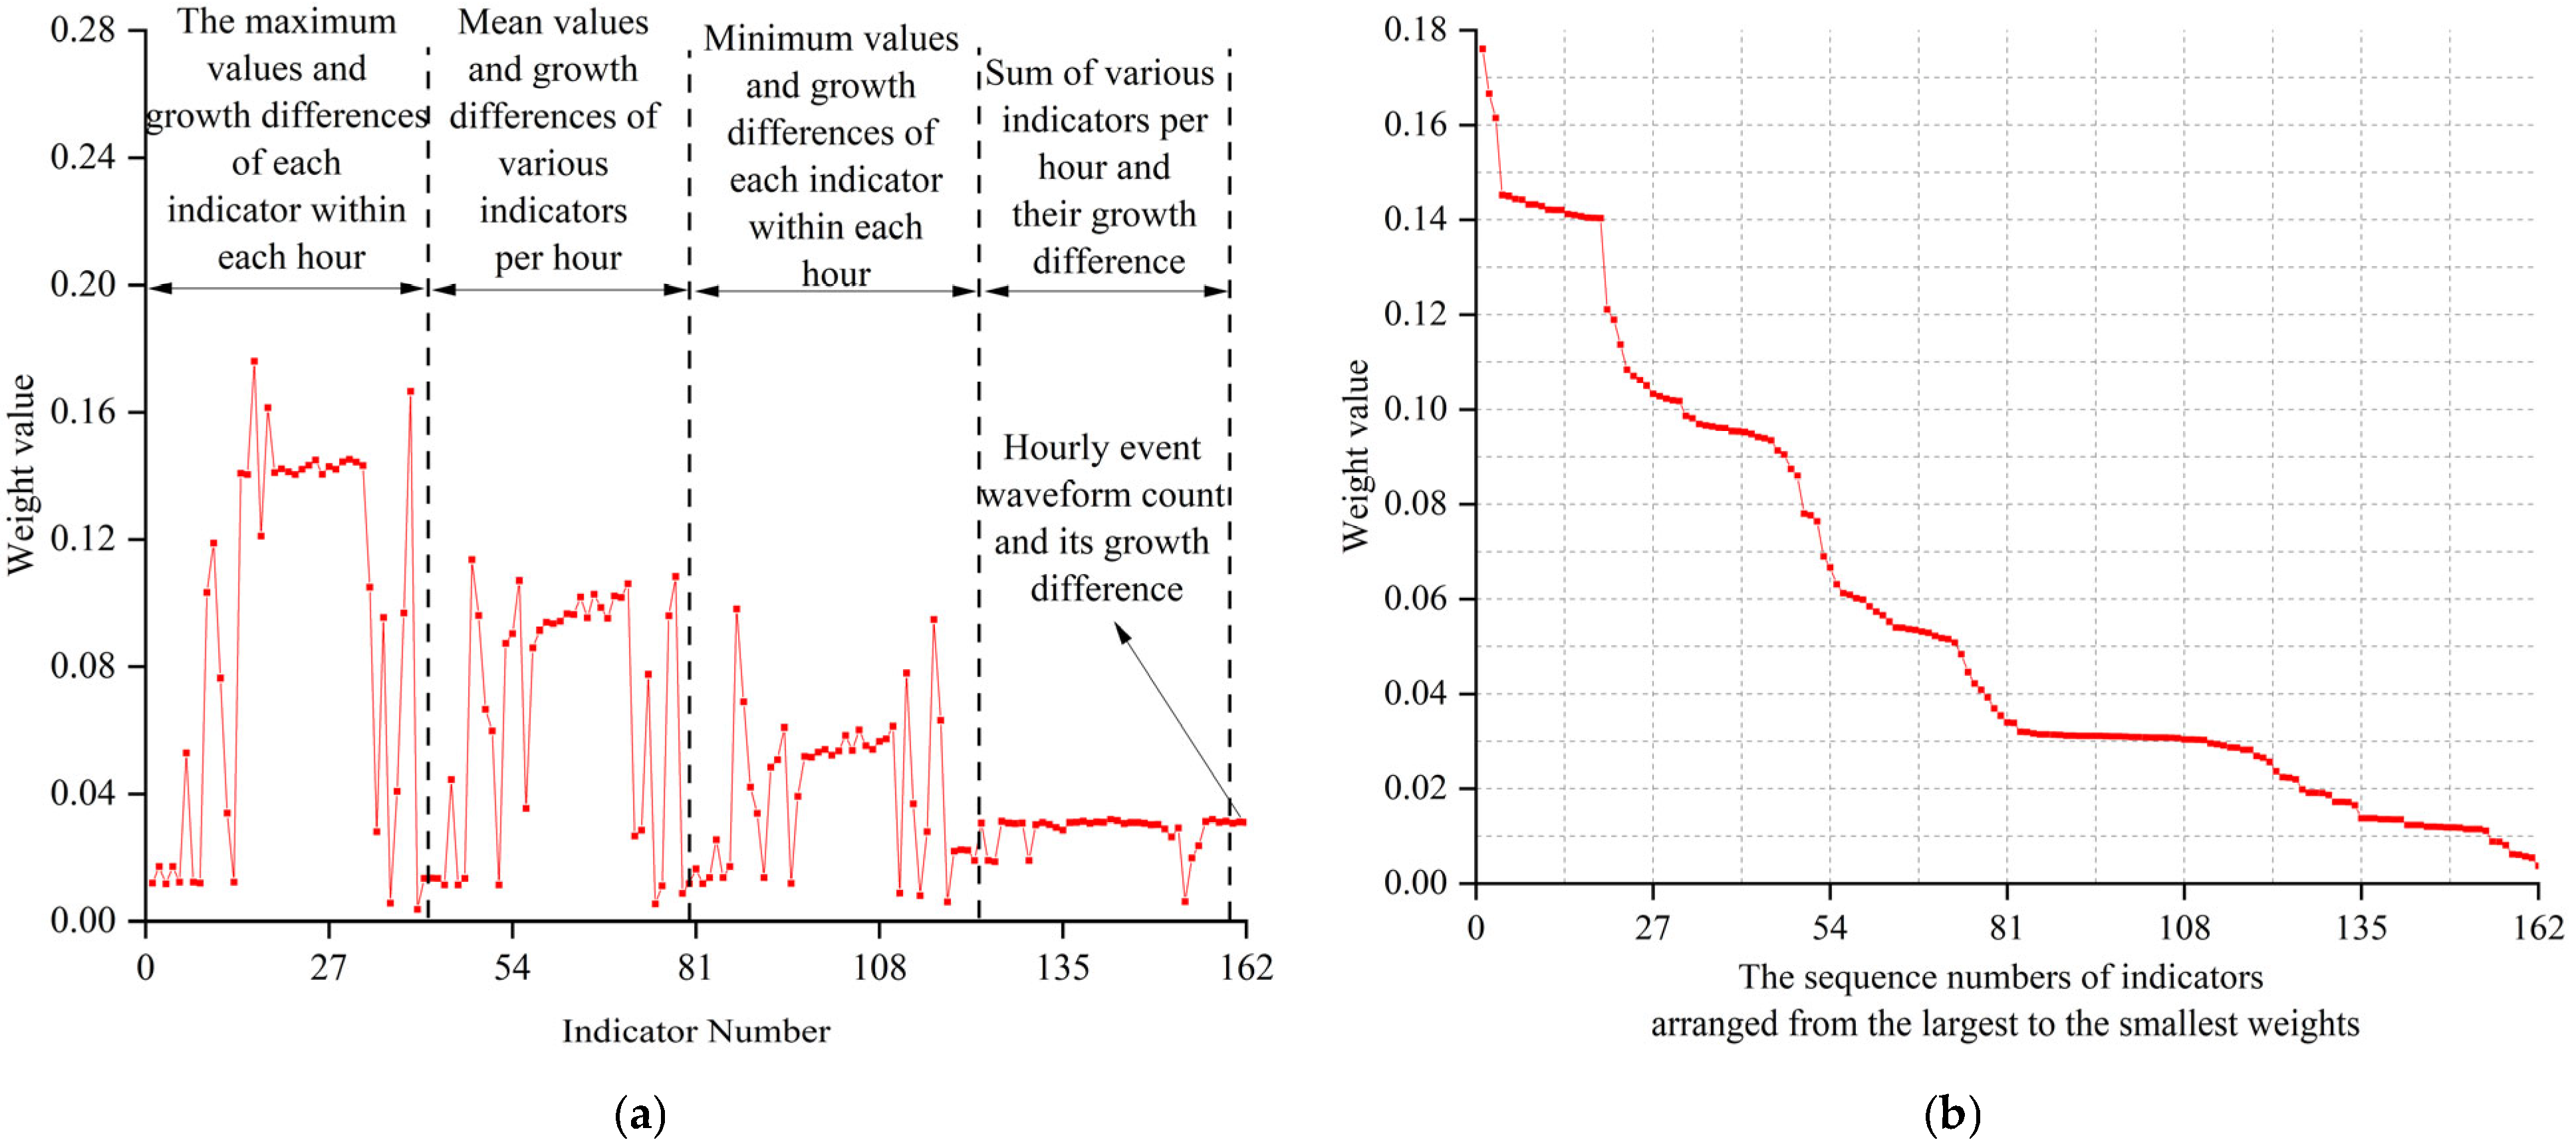
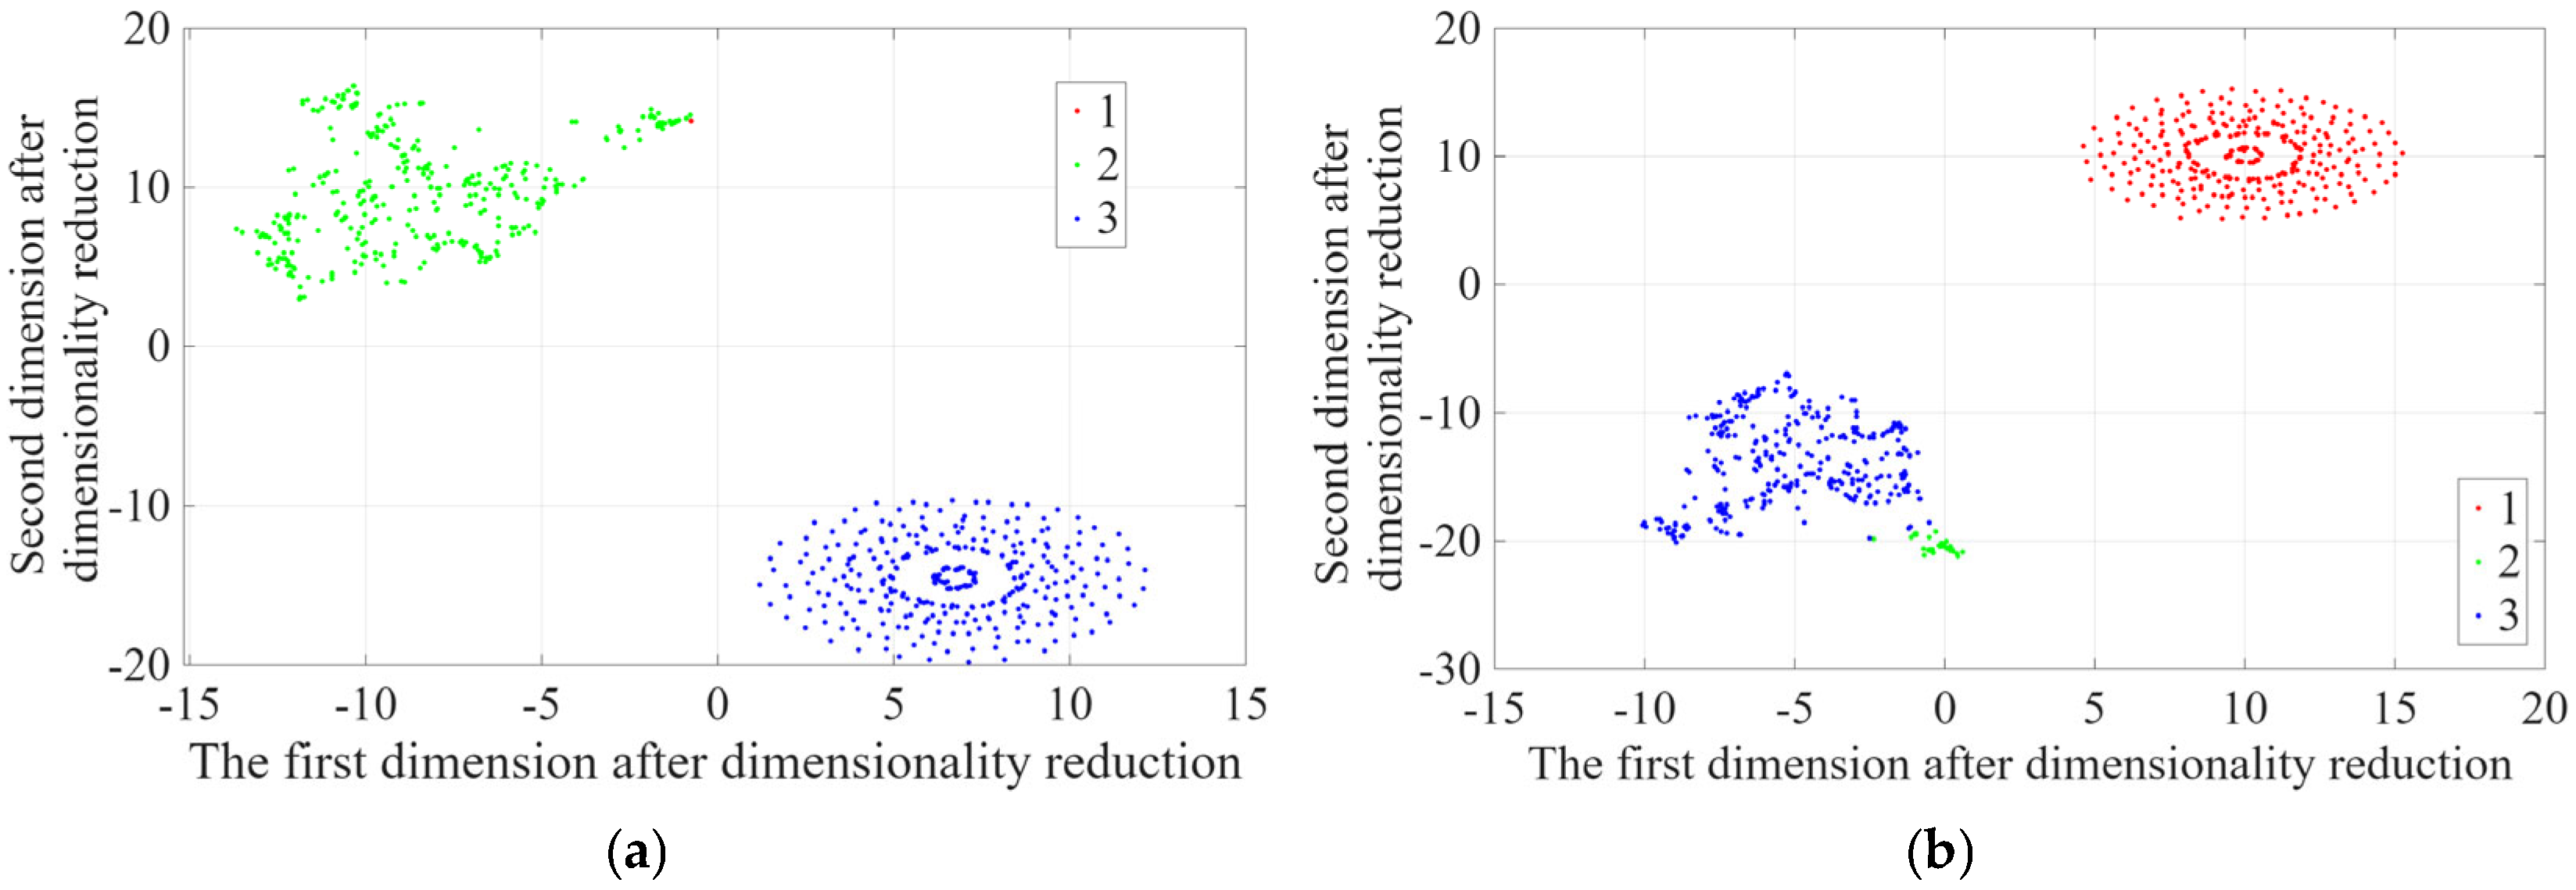
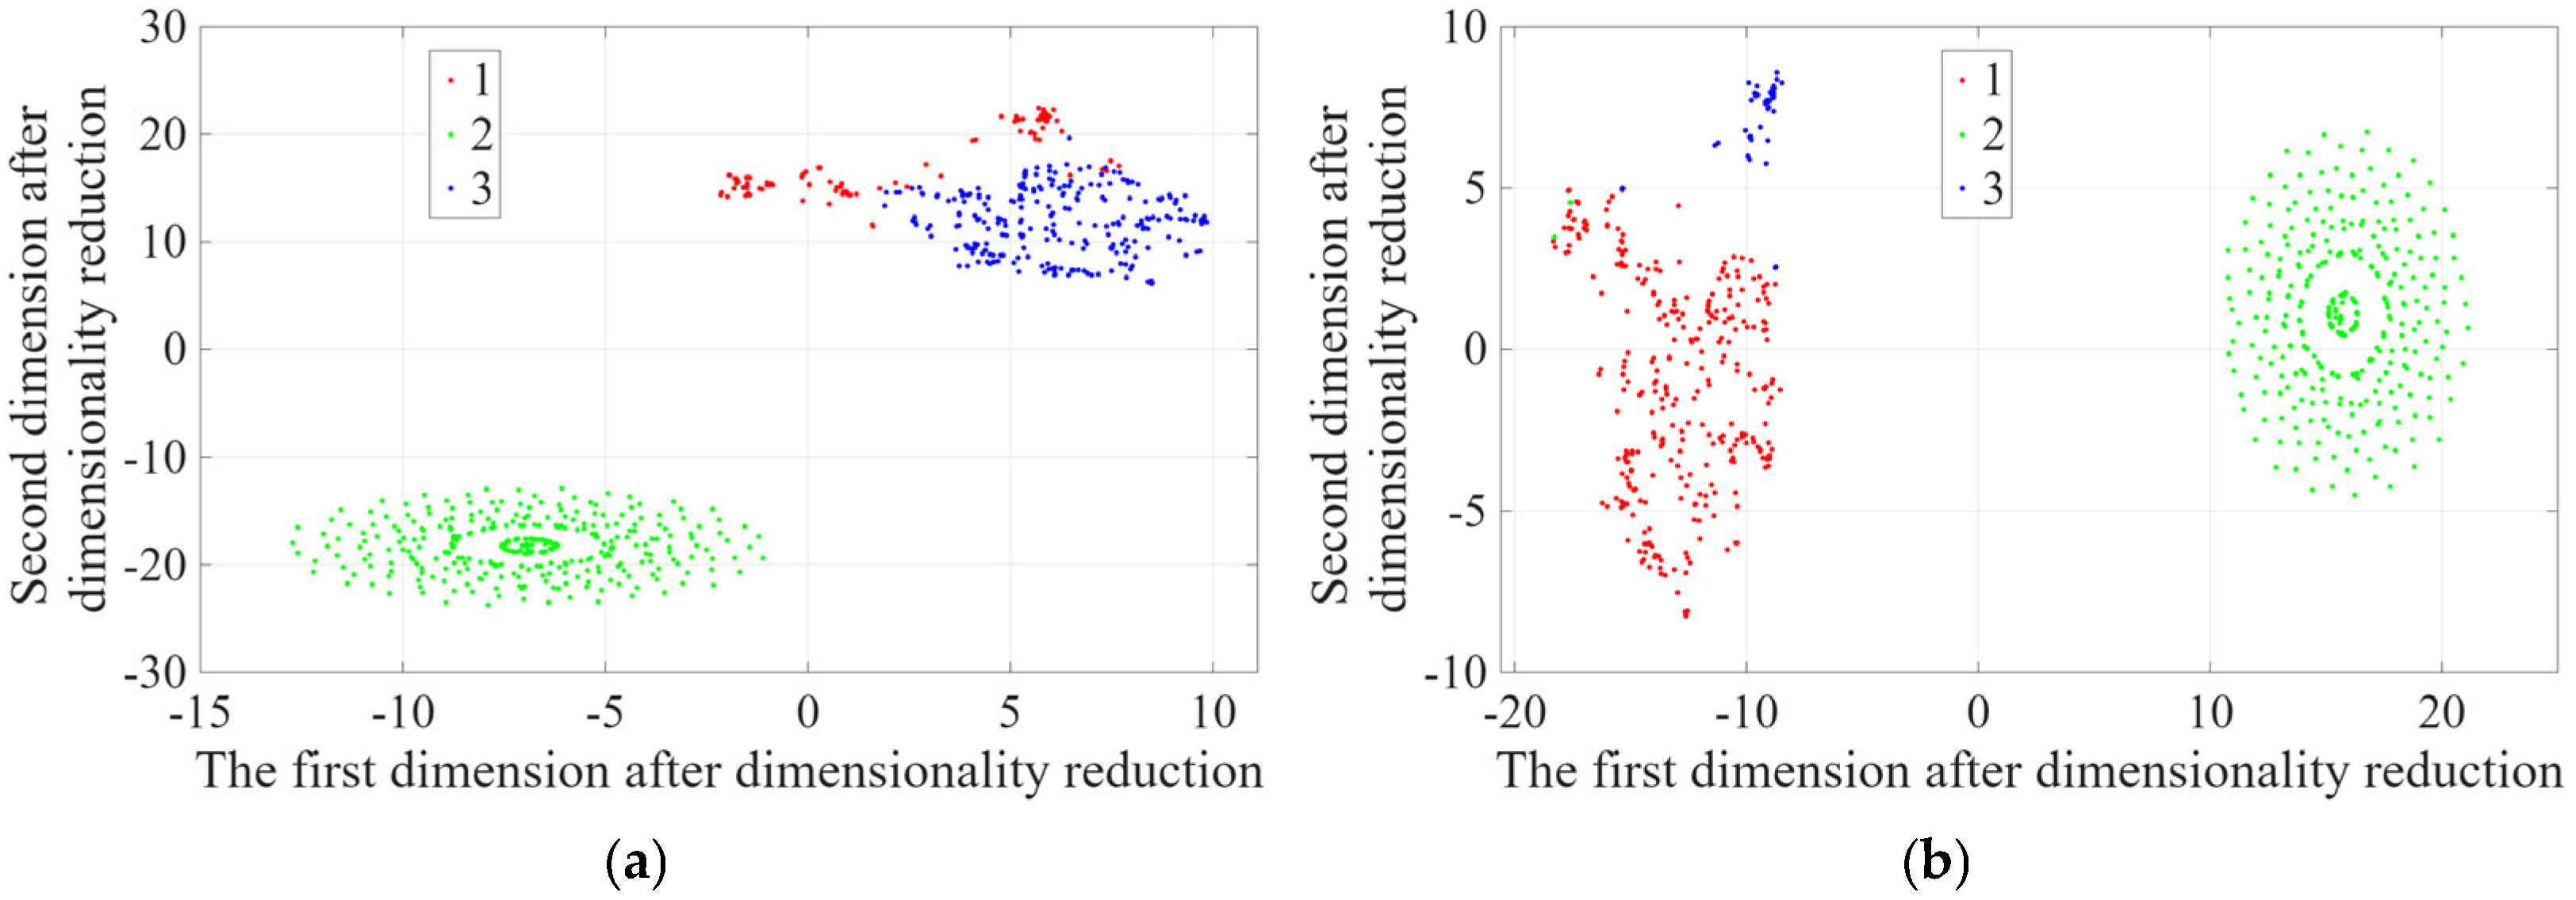
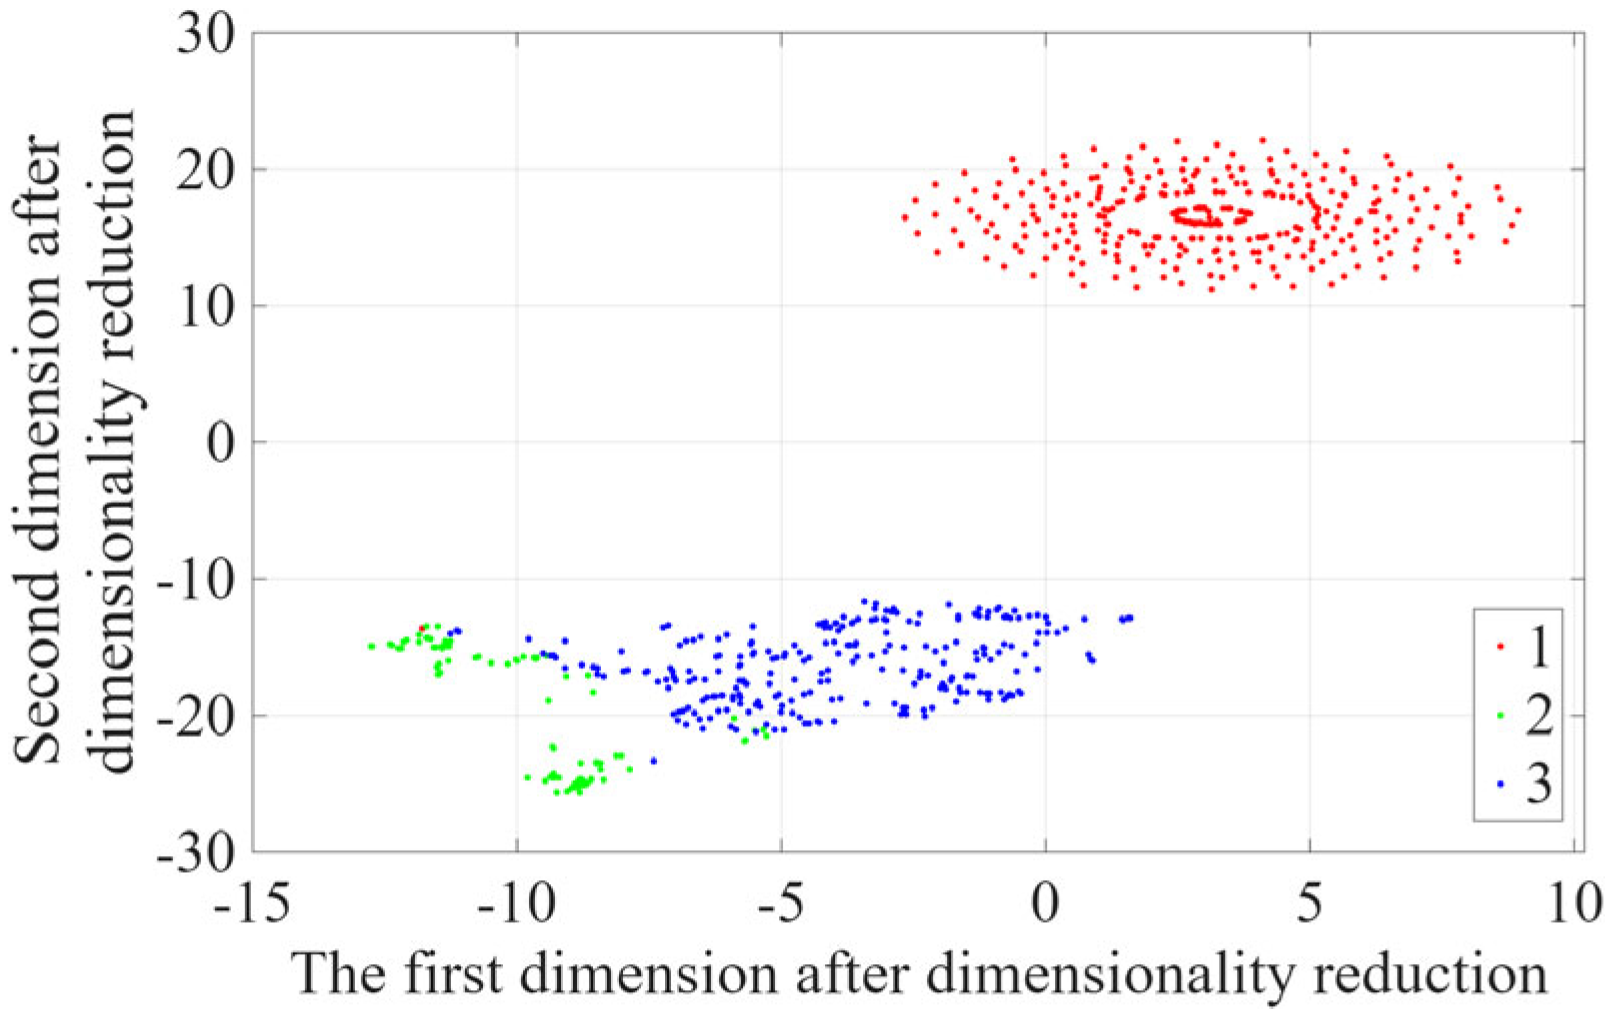
To explore the applicability of different clustering algorithms in the dimensionality reduction and clustering of microseismic data, a weight-based screening strategy was adopted: specifically, selecting warning indicators with a weight value greater than 0.08 as input variables. On this basis, five typical clustering algorithms were compared and analyzed, including K-means clustering, K-center clustering, hierarchical clustering, spectral clustering, and self-organizing map (SOM) clustering. The relevant analysis results are presented in
Figure 19,
Figure 20 and
Figure 21.
In these figures, the first and second dimensions obtained from dimensionality reduction are used as the horizontal and vertical axes, respectively, and different colors are employed to distinguish different clustering categories to visually present the clustering characteristics of each algorithm through data visualization.
The K-means clustering results show that the clustering categories are distributed in a scattered elliptical shape, with obvious overlaps in some regions. This phenomenon indicates that the K-means algorithm is highly sensitive to the selection of initial clustering centers, and its clustering results are easily affected by the density of data distribution, which leads to a limitation of ambiguous classification when dealing with data with non-uniform distribution.
In contrast, the K-center clustering algorithm demonstrates significant advantages in anti-noise performance by taking actual data points as cluster centers. As shown in the figures, the red clustering category presents a compact and concentrated distribution, while the number of discrete points at the edge of the green clustering category is significantly reduced. Compared with the K-means algorithm, the K-center algorithm has stronger robustness in processing noisy data, though it still has the defect of unclear definition of cluster boundaries.
The hierarchical clustering results present a tree-like hierarchical structure through two-dimensional mapping, where the purple clustering category forms independent circular clusters. This structure intuitively reflects the nested similarity characteristics among data points and is particularly suitable for revealing the inherent hierarchical relationships within the data.
Spectral clustering relies on similarity matrices for graph segmentation, and its cluster boundaries exhibit distinct separation characteristics (e.g., the precise partitioning of red and blue clusters along the x-axis). It has remarkable advantages in processing data with nonlinear manifold structures and can effectively capture the complex distribution patterns of microseismic data.
The self-organizing map (SOM) clustering maintains the topological relationship of the original data through a two-dimensional grid structure; the blue clustering category in the visualization presents a continuous band-like distribution, which clearly reflects the dynamic evolution law of microseismic signal characteristics.
Table 6 documents the details of high-energy microseismic events (with event energy exceeding 1 × 10
4 J) recorded during the roadway excavation process of a coal mine in Shanxi Province, covering the period from 7:05 on March 22, 2025, to 7:05 on April 21, 2025 (a total duration of 720 h). During this monitoring period, only one high-energy event was detected, and this event directly led to a roof disaster in the mining area.
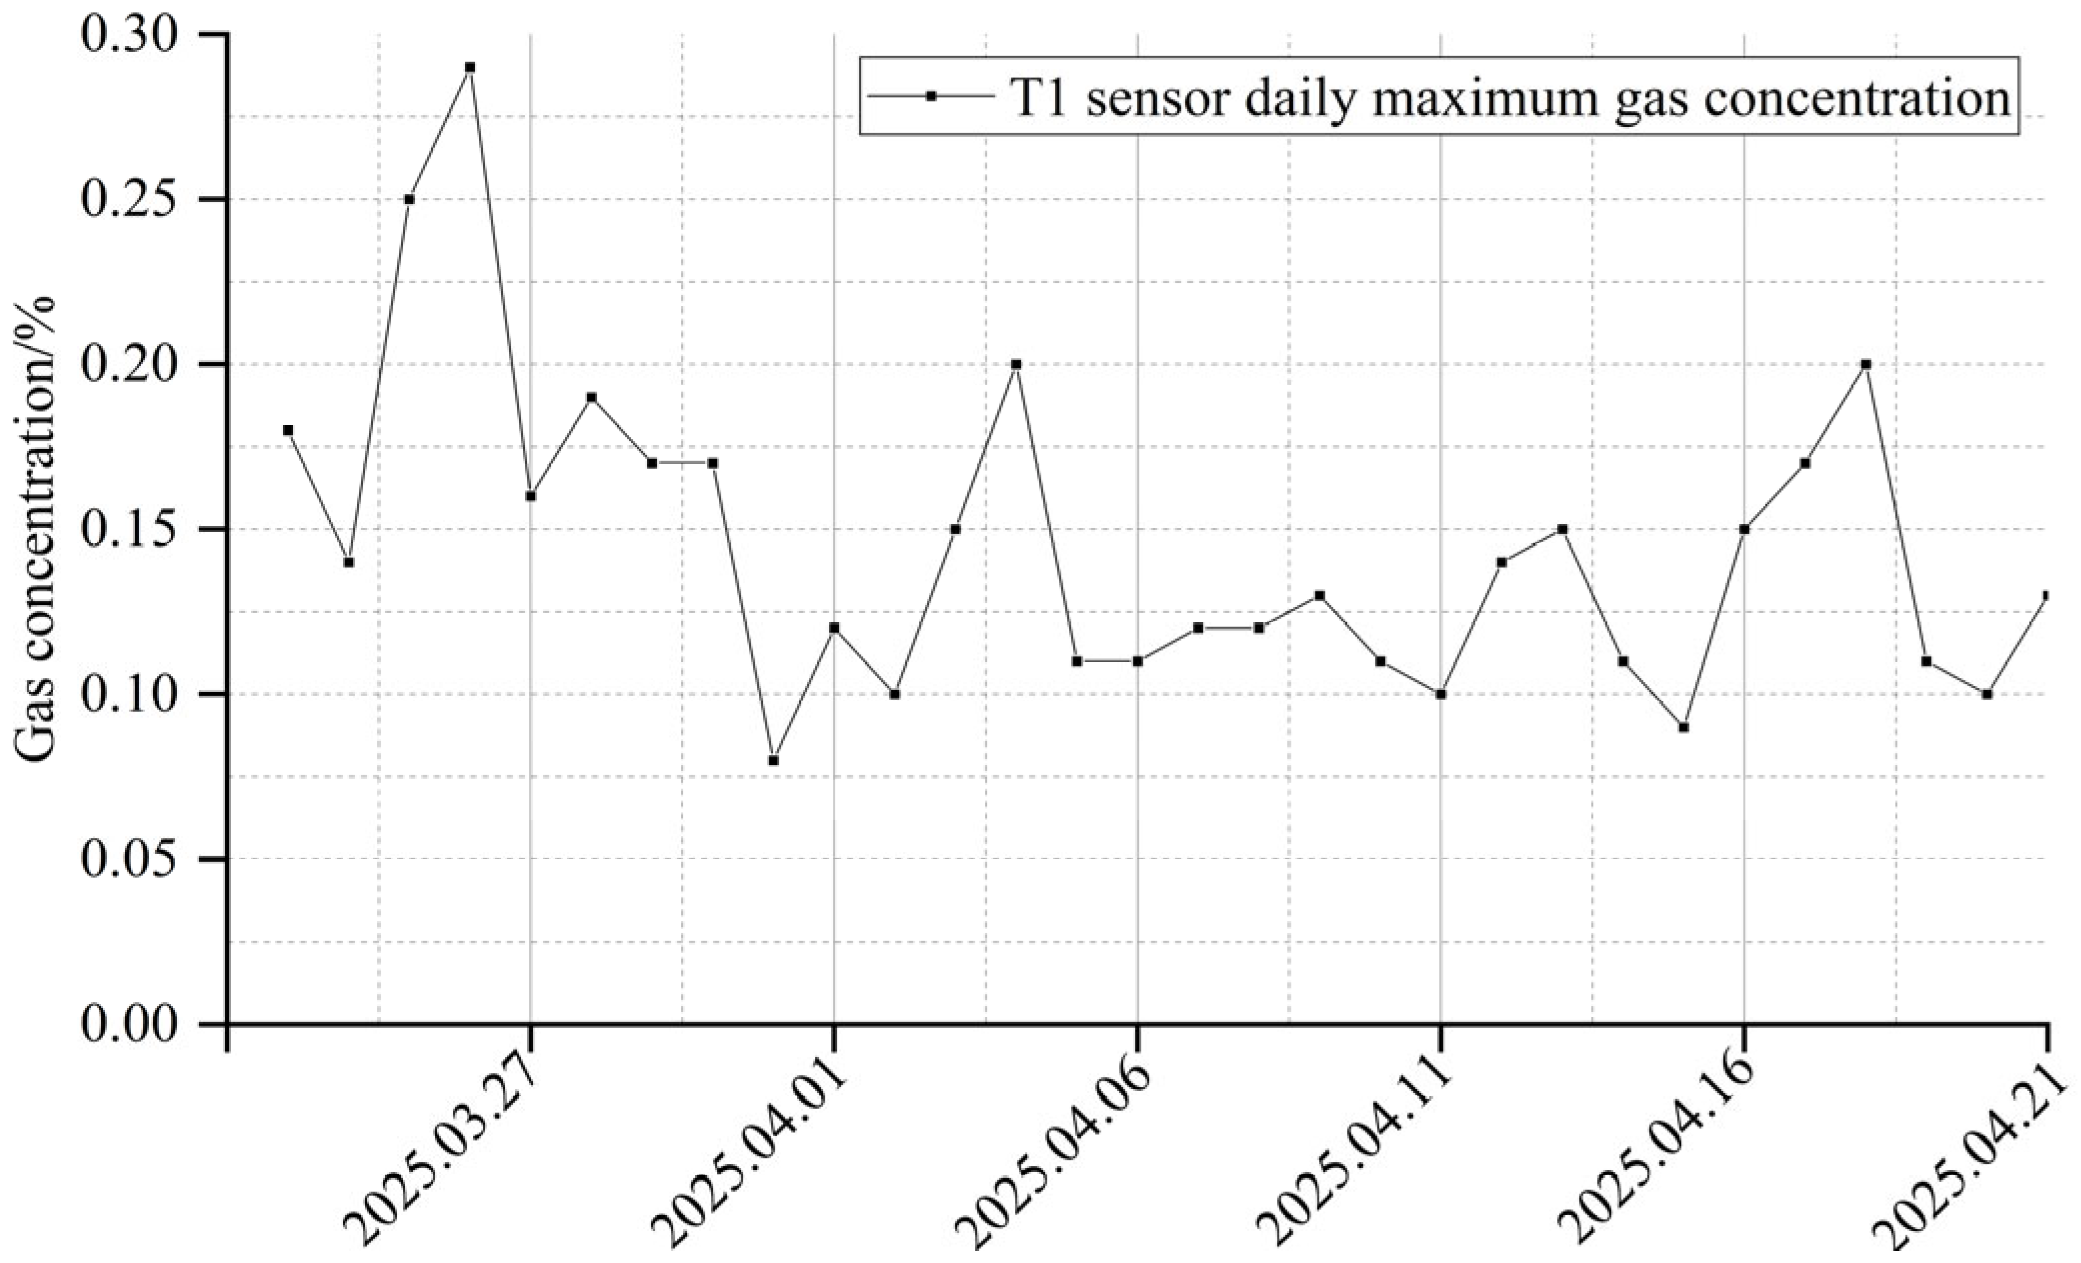
As shown in
Figure 22, the daily variation in the maximum gas concentration monitored by the T1 sensor during the period from 22 March 2025 to 21 April 2025 (a total monitoring period of 30 days) is clearly presented. From the perspective of the overall variation trend, during the 30-day monitoring process, although the daily maximum gas concentration exhibited certain fluctuations, all fluctuations were within the normal range, and there were no abnormal phenomena that exceeded the standard fluctuation threshold.
The daily gas concentration values fluctuated between 0.07% and 0.29% throughout the monitoring period, without any signs of sustained increase, sudden sharp jumps, or other abnormal variation trends that could indicate potential safety risks in the mining process. This indicates that the gas concentration in the mining area remained stable during the monitoring period, providing a safe operational environment for the roadway excavation process.
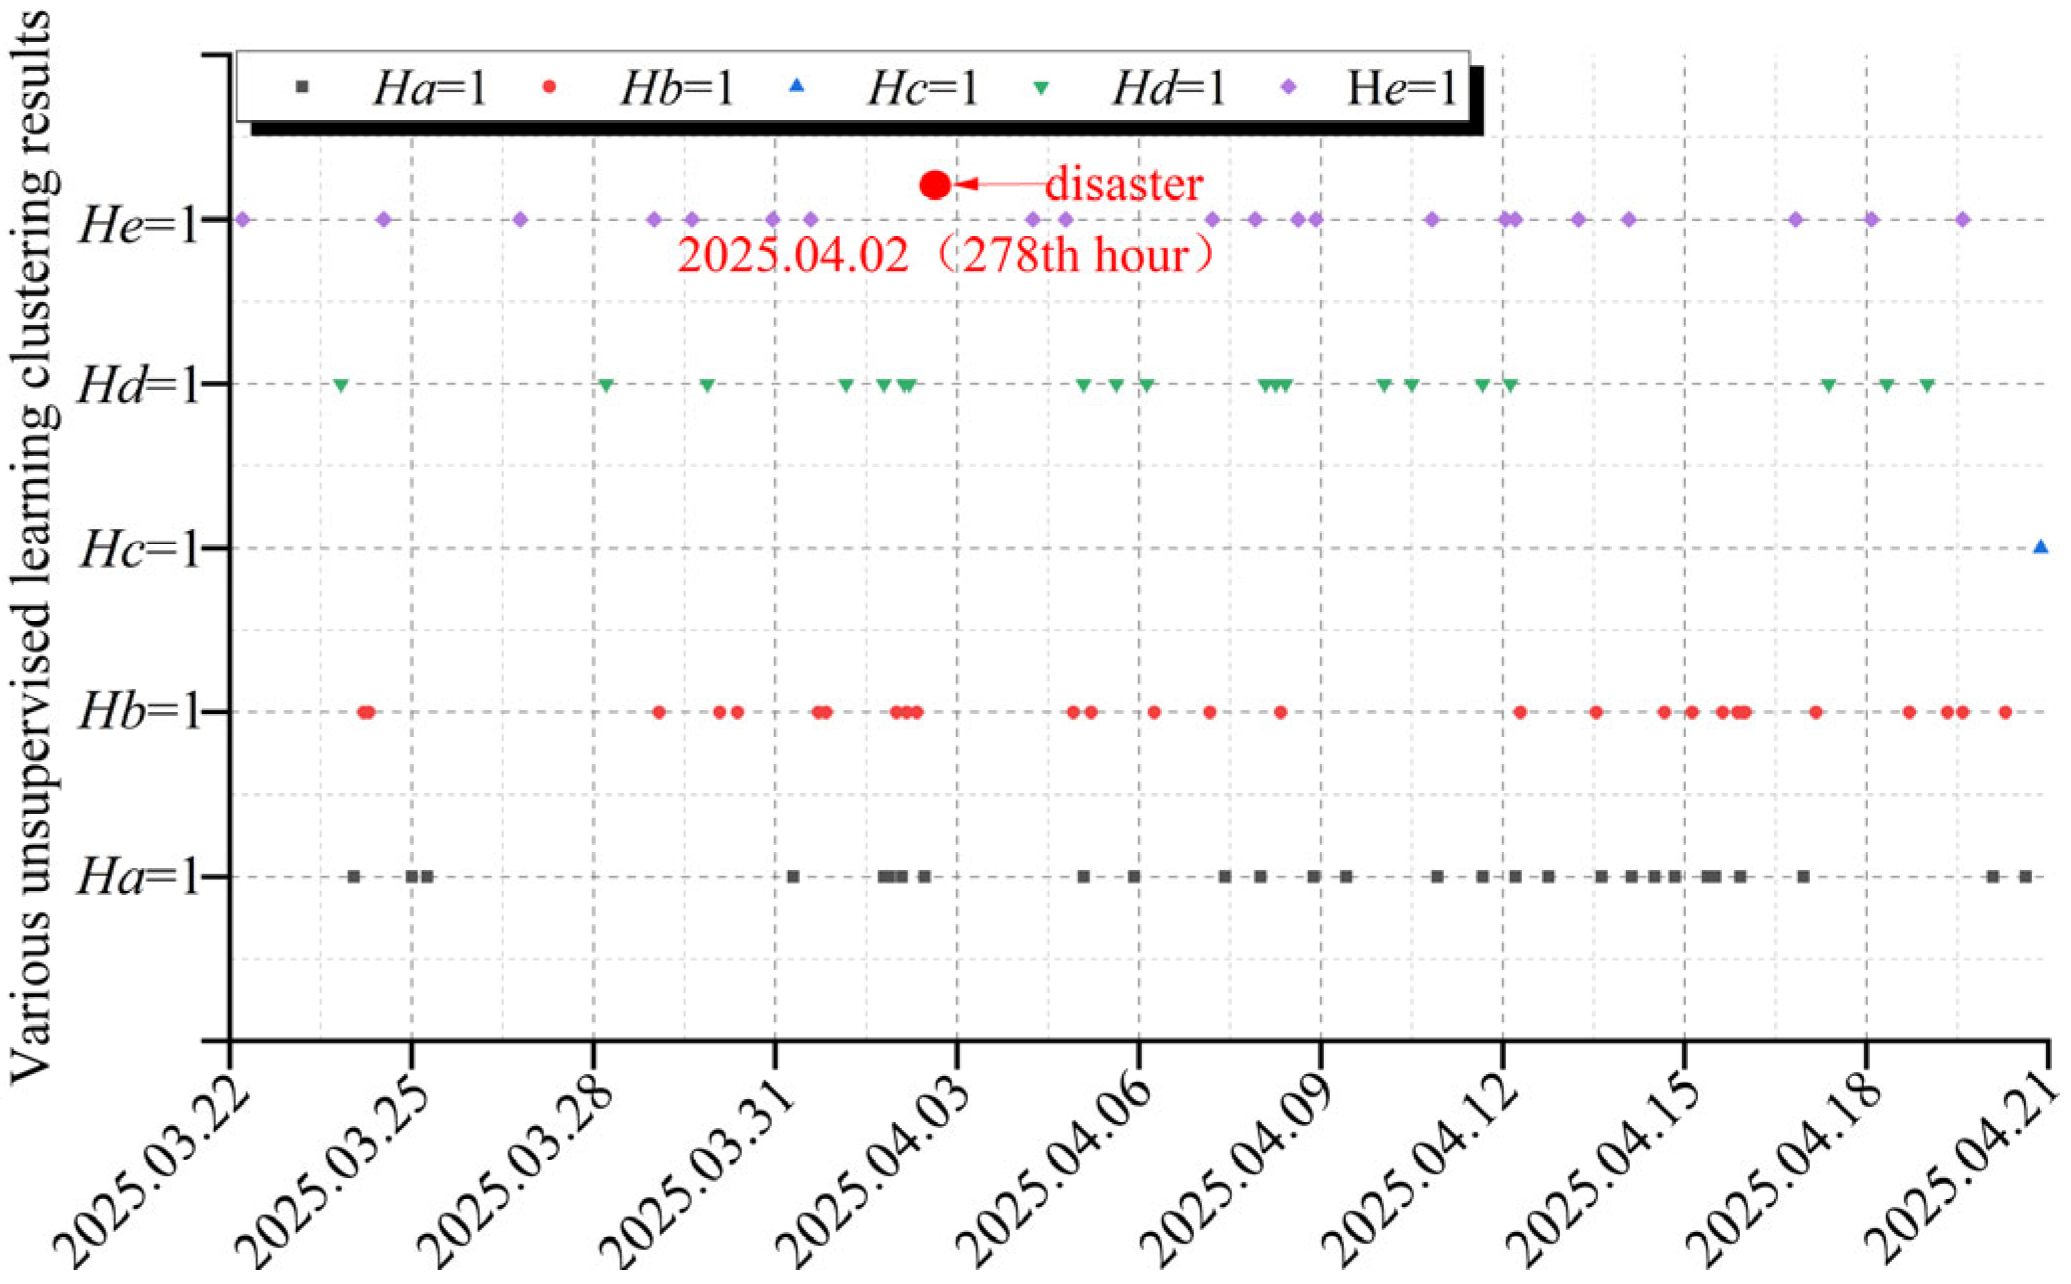
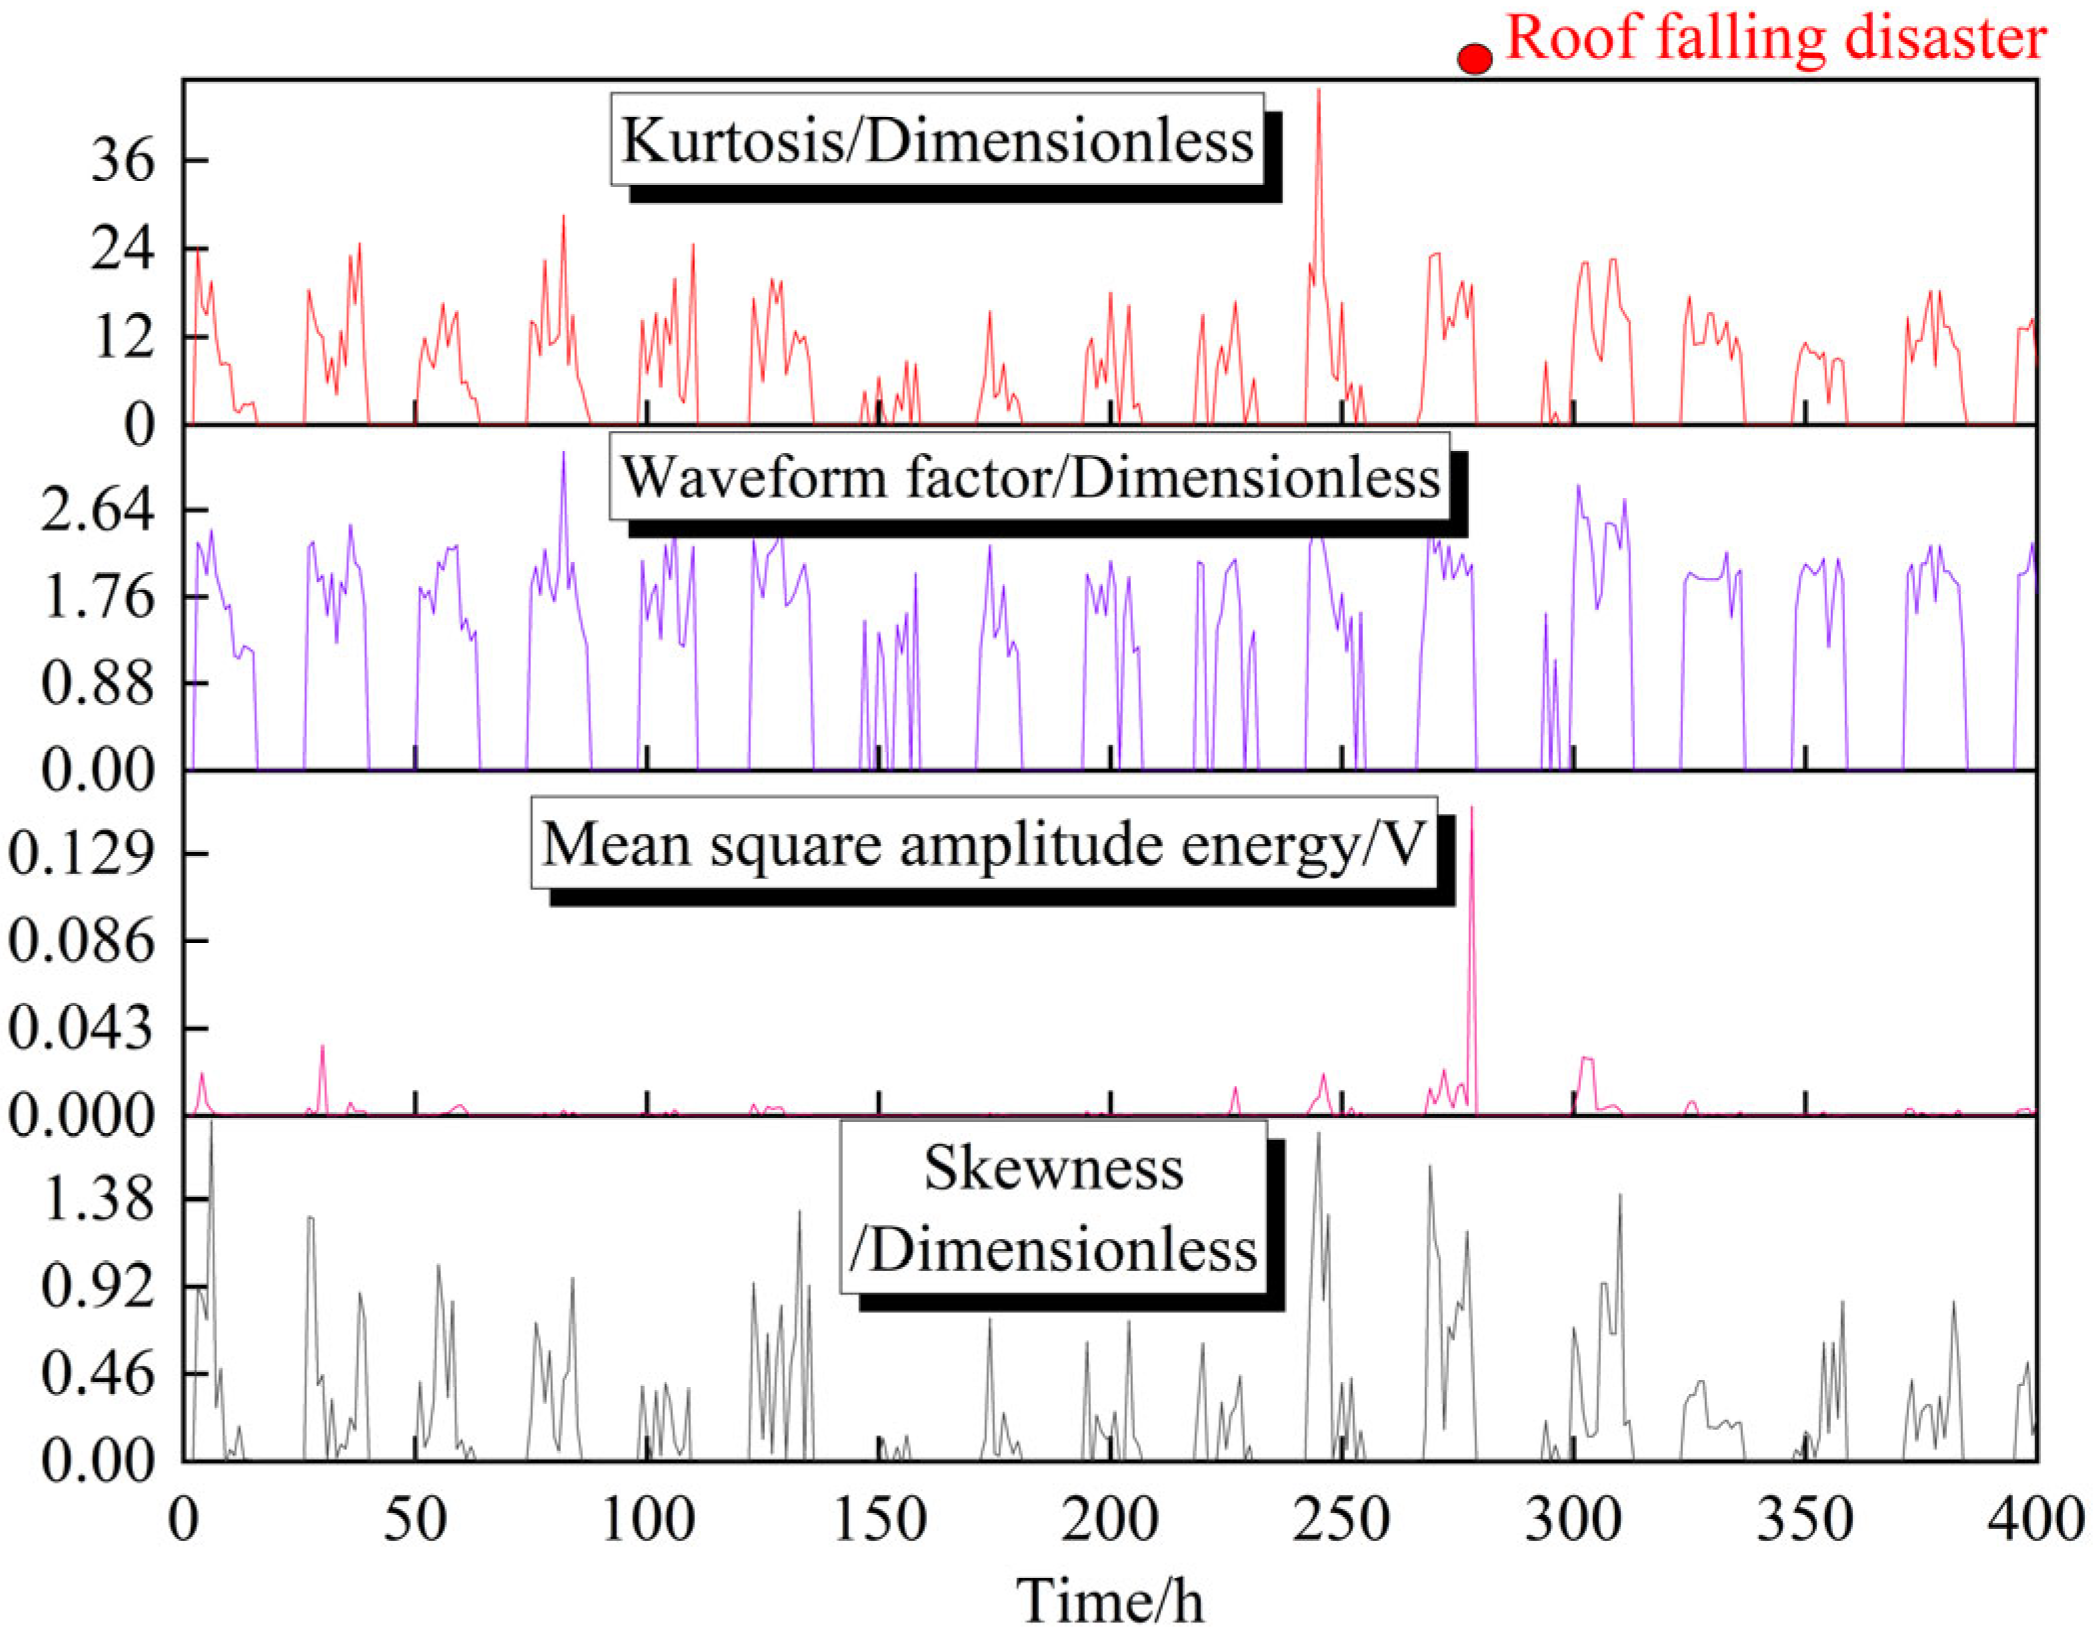
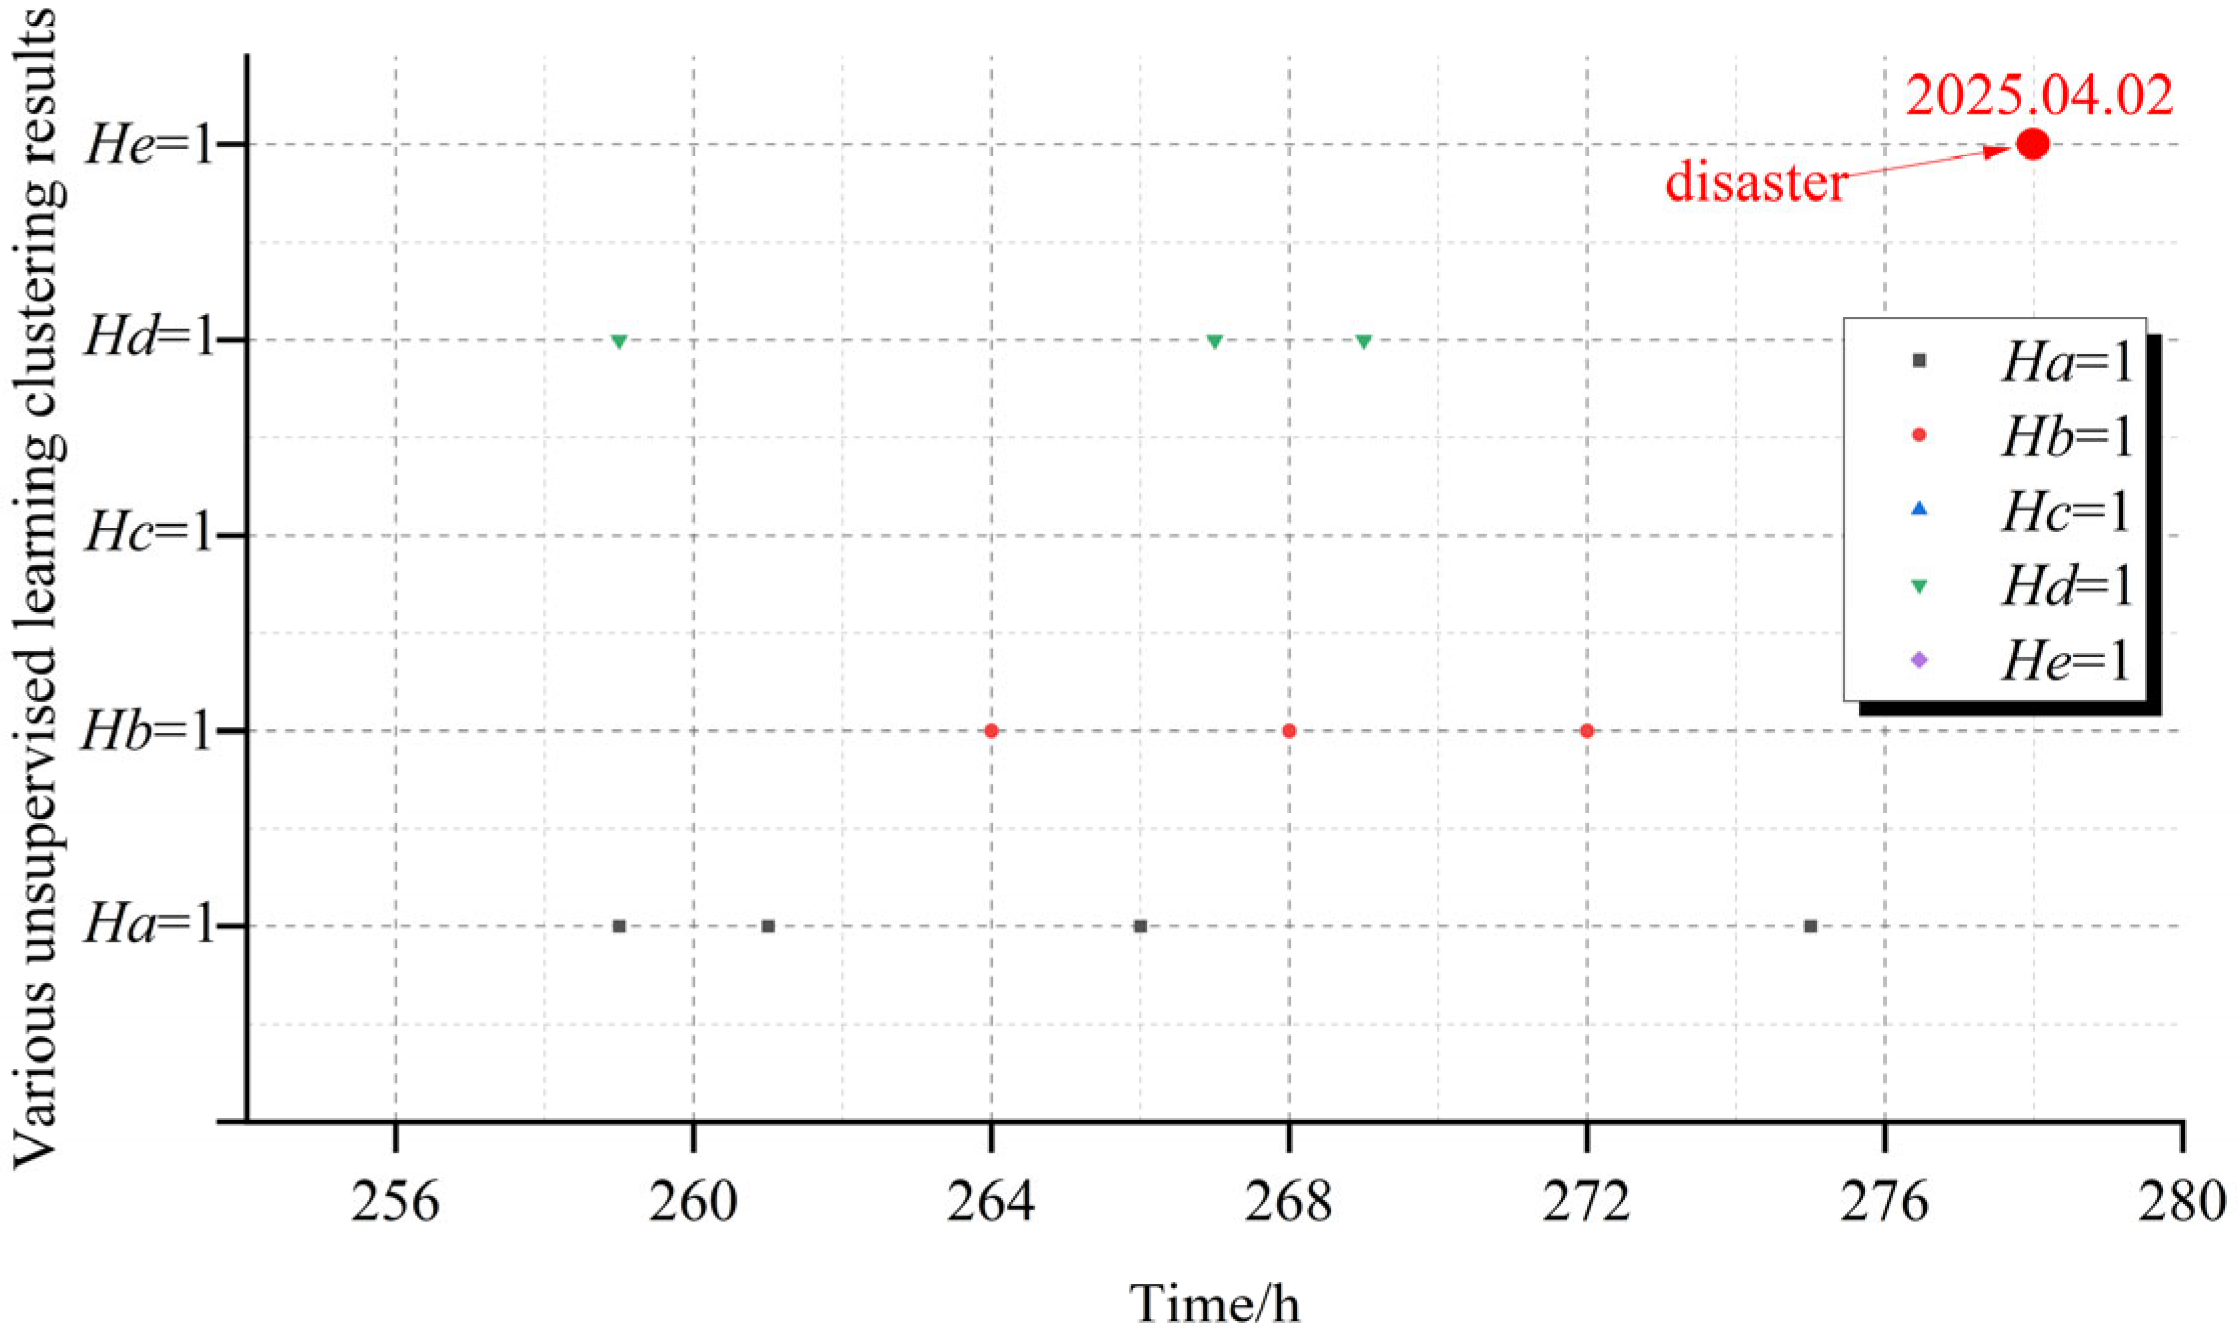
Based on
Figure 23 and
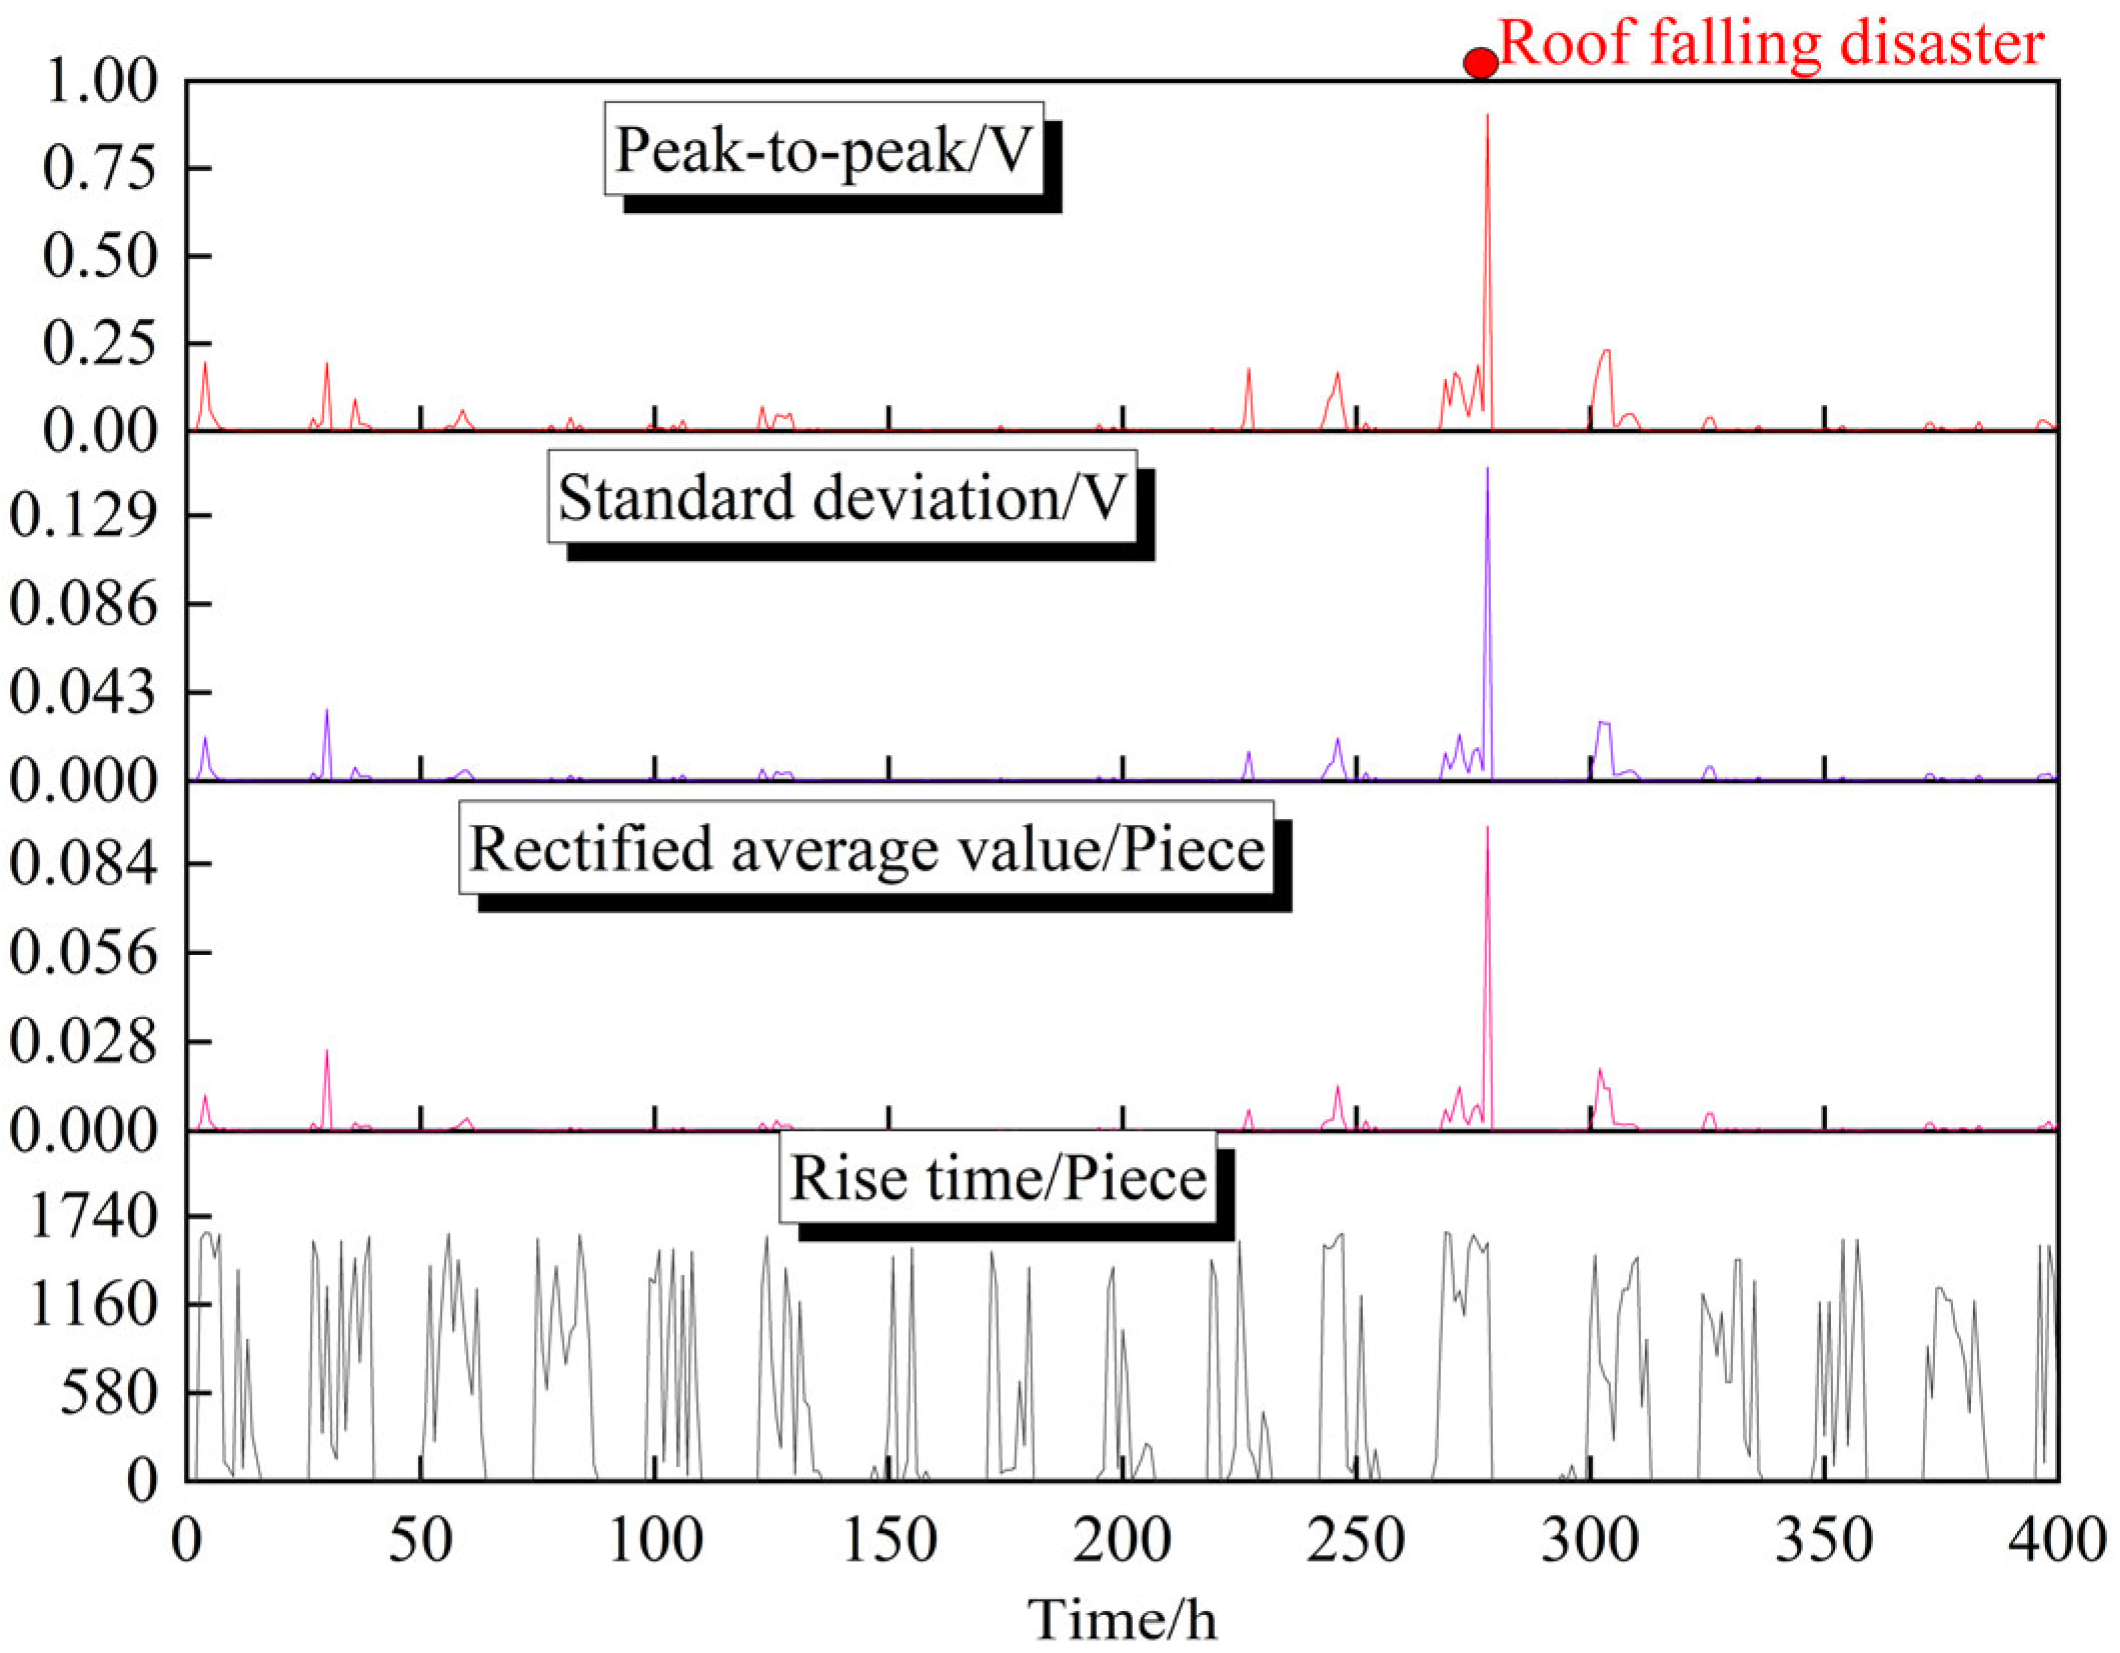
Figure 24, we conduct a comprehensive analysis of the early warning results for the warning indicators with input weights greater than 0.08. The analysis results show that at the 278th hour of the monitoring period (starting from 7:05 on 22 March 2025), a roof disaster occurred. Within 24 h prior to the disaster, the number of decision variables (
Ha,
Hb,
Hc,
Hd, and
He) with values exceeding 2 reached three, which fully meets the preset early warning criteria for roof disasters.
This result indicates that the selected warning indicators can effectively capture the potential risk signals of roof disaster before the disaster occurs, verifying the feasibility and effectiveness of the early warning method in practical engineering scenarios. However, during other monitoring periods, individual unsupervised machine learning algorithms exhibit certain limitations. Specifically, when processing complex and variable microseismic data, these single algorithms often misclassify weak dangerous states as actual dangerous states, leading to frequent misjudgments.
The root cause of this phenomenon lies in the fact that a single unsupervised learning algorithm is difficult to accurately identify the subtle differences between weak dangerous states and true dangerous states when faced with complex and variable microseismic data, which ultimately results in inaccurate judgment of disaster risks.
Based on the early warning results listed in
Table 7, obtained using warning indicators with input weights greater than 0.08, it can be observed that single clustering algorithms exhibit a significantly higher misjudgment rate. For the K-means and K-medoids algorithms, the overwhelming proportion of normal samples in the dataset causes the algorithms to frequently misclassify numerous normal signals as hazardous categories (
Ha = 1/
Hb = 1), which reveals a serious deficiency in identifying minority-class samples.
In the case of hierarchical clustering and self-organizing map algorithms, no disaster samples were successfully identified at all (Tp = 0). This issue arises because these methods rely heavily on sample density or topological structure, making it difficult for individual abnormal samples to form effective clustering centers and thus leading to missed detections.
In contrast, the ensemble decision-making mechanism issues a formal disaster warning when at least three of the five unsupervised machine learning algorithms assign no fewer than three samples to the cluster with the smallest sample size within the 24 h period preceding the disaster. The results demonstrate that the ensemble decision strategy achieved one true positive (Tp = 1) and zero false positives (Fp = 0), which validates the remarkable superiority of multi-algorithm collaborative decision making in enhancing the accuracy and reliability of microseismic early warning.
A total of 162 warning indicators, derived from the microseismic signals generated by the surrounding rock fracture during the mine excavation process in Shanxi, were simultaneously input into five unsupervised machine learning algorithms. On this basis, the unsupervised machine learning ensemble decision-making process was carried out.
The early warning results, as detailed in
Table 8, showed no significant fluctuations or effective early warning signals, which indicates the presence of redundant warning indicators in the initial indicator set. To address this issue, we adopted a weight-based indicator screening process, which successfully filtered out the indicators with weak contribution to the characterization of disaster risks. This screening process not only reduced the dimensionality of the model input but also effectively lowered the complexity of the early warning model, laying a solid foundation for the efficient operation of the subsequent early warning process.



 ,
,