1. Introduction
The transition toward renewable and low-carbon energy systems is among the central challenges facing Europe in the coming decades. Geothermal energy offers a unique opportunity to provide sustainable base-load heat, particularly in regions where favorable geological conditions intersect with growing energy demand. Lithuania, located on the edge of the Baltic sedimentary basin, hosts a distinct geothermal anomaly in its western territory [
1]. This anomaly is associated with Cambrian sandstone formations, at depths exceeding 2000 m, that can reach reservoir temperatures of up to 98 °C (see [
2]) and thus present a viable target for deep geothermal exploration. While local exploration has taken place intermittently since the 1990s, data remains fragmented, inconsistent, and often limited to a few productive horizons. As a result, much of the country’s geothermal potential has not been evaluated systematically.
This study seeks to address that gap by constructing a geothermal energy potential map for Western Lithuania, focusing on the Cambrian sandstone reservoirs. The methodology integrates sparse borehole data, geostatistical kriging, long-term reservoir simulations, and machine-learning-based (ML) predictions, with the goal of highlighting relative rather than absolute estimates of geothermal energy distribution. The novelty lies not only in the resulting maps but also in the framework itself: a replicable and adaptable workflow for assessing geothermal resources in data-limited environments.
The work draws methodological inspiration from previous studies conducted in Northern Europe. In particular, Arola et al. [
3] presented one of the first large-scale geothermal potential maps for Finland, demonstrating the feasibility of harmonizing heterogeneous datasets into a coherent national assessment. Similarly, Korhonen et al. [
4] introduced the infinite borehole field model in Budapest, which accounted for thermal interactions in densely built environments, and provided a strong conceptual link between thermogeological parameters and extractable technical potential. While the geological context of Lithuania differs substantially, these works serve as guiding examples for the spatial mapping approaches adopted here.
At the national level, apart from the country’s updates, the geothermal resources have been more comprehensively reviewed by Memon et al. [
5], who cataloged both Cambrian and Devonian aquifers and identified key research gaps. That review highlighted two needs, among others, that this article aims to resolve: the harmonization of the existing geophysical and reservoir data, as well as the application of modern numerical and machine-learning methods for the prediction and optimization of geothermal energy production. The present work addresses both needs directly. Moreover, it extends the findings of the authors’ earlier study on the geothermal potential of Cambrian reservoirs [
6], which was limited to a handful of fields. While that work demonstrated promising potential, it was constrained by limited data handling and relatively simplistic assumptions. The present study builds upon those lessons by implementing more rigorous data collection, weighting schemes for permeability and porosity, and improved integration of net-to-gross (NTG) ratios.
The earlier case study on the Vilkyčiai Cambrian field [
7] showed how repurposed hydrocarbon reservoirs could be harnessed for geothermal purposes, particularly through horizontal well design. In contrast to that highly localized approach, the current paper expands the scope to the regional scale, thereby complementing our portfolio of field-specific investigations.
This study focuses exclusively on the Cambrian reservoirs, as other potential collectors present significant limitations. The Gargždai–Kemeri complex, previously targeted by the Klaipėda geothermal plant, encountered severe reinjection difficulties that undermined its viability. Silurian barrier reefs, while investigated by Kaminskaitė-Baranauskienė et al. [
8], were found to be too unproductive to support large-scale development. The Devonian formations may still have promise, and perceptions of geothermal potential in Lithuania are gradually recovering.
Recent geothermal reservoir simulation practice coupled thermo–hydro–mechanical processes to capture temperature drawdown, pressure evolution, and injection-related geomechanical responses, in the enhanced geothermal system [
9]. Alongside long-established geothermal simulators, recent work highlights the growing role of modern open-source hydrothermal simulators designed for complex physics (like multi-phase thermal flow with fractures) and the multi-scale nature of the problem—from the reservoir scale to faults and fractures, down to the scale of the wells. One such geothermal flow simulator, ComPASS, which helps in the integration of scenario analysis and optimization studies, was developed in [
10]. These advances motivate a clear distinction between site-specific modeling supported by dense datasets and regional screening workflows that intentionally standardize assumptions to enable consistent comparison under limited subsurface control.
In parallel, ML methods are increasingly used in geothermal applications for spatial prediction of geothermal attributes (temperature fields, prospectivity indicators, etc.) and surrogate modeling to accelerate computationally intensive simulation-mapping or simulation-optimization workflows [
11]. Recent studies demonstrate that data-driven surrogates (including deep learning architectures) can approximate simulator outputs and substantially reduce the evaluation time in repeated scenario analysis [
12], while the importance of validation design, uncertainty awareness and separation between screening-level and reservoir-specific products is underlined as well. In this context, our study positions the neural network (NN) as a computational surrogate that accelerates regional-scale evaluation under standardized assumptions, while the physics-based simulator remains the reference model for the mapping pipeline.
The individual methodological components employed in this study (geostatistical kriging, mechanistic reservoir simulation, and neural network regression) are well established. The aim of this paper is not to introduce new algorithms for any of these components, but to demonstrate an implementable end-to-end regional screening framework for geothermal assessment under sparse and heterogeneous subsurface control. The framework differs from many prior mapping efforts by linking structured legacy-data compilation and harmonization with uncertainty-aware spatialization of key parameters, standardized performance evaluation through physics-based simulation and surrogate modeling to enable feasible regional-scale evaluation across scenarios. Within this scope, the resulting maps are intended to support comparative prioritization and follow-up planning, rather than site-specific reserve certification.
In summary, the present study combines geostatistical, numerical, and machine-learning approaches to construct the first integrated geothermal potential map of Western Lithuania. While the absolute values presented should not be interpreted as definitive, the results provide a much-needed relative comparison of Cambrian reservoir potential across the region, highlight promising zones for further exploration, and demonstrate a transferable methodological framework that can be applied to other data-scarce basins in Europe.
2. Materials and Methods
2.1. Geological Setting of the Study Area
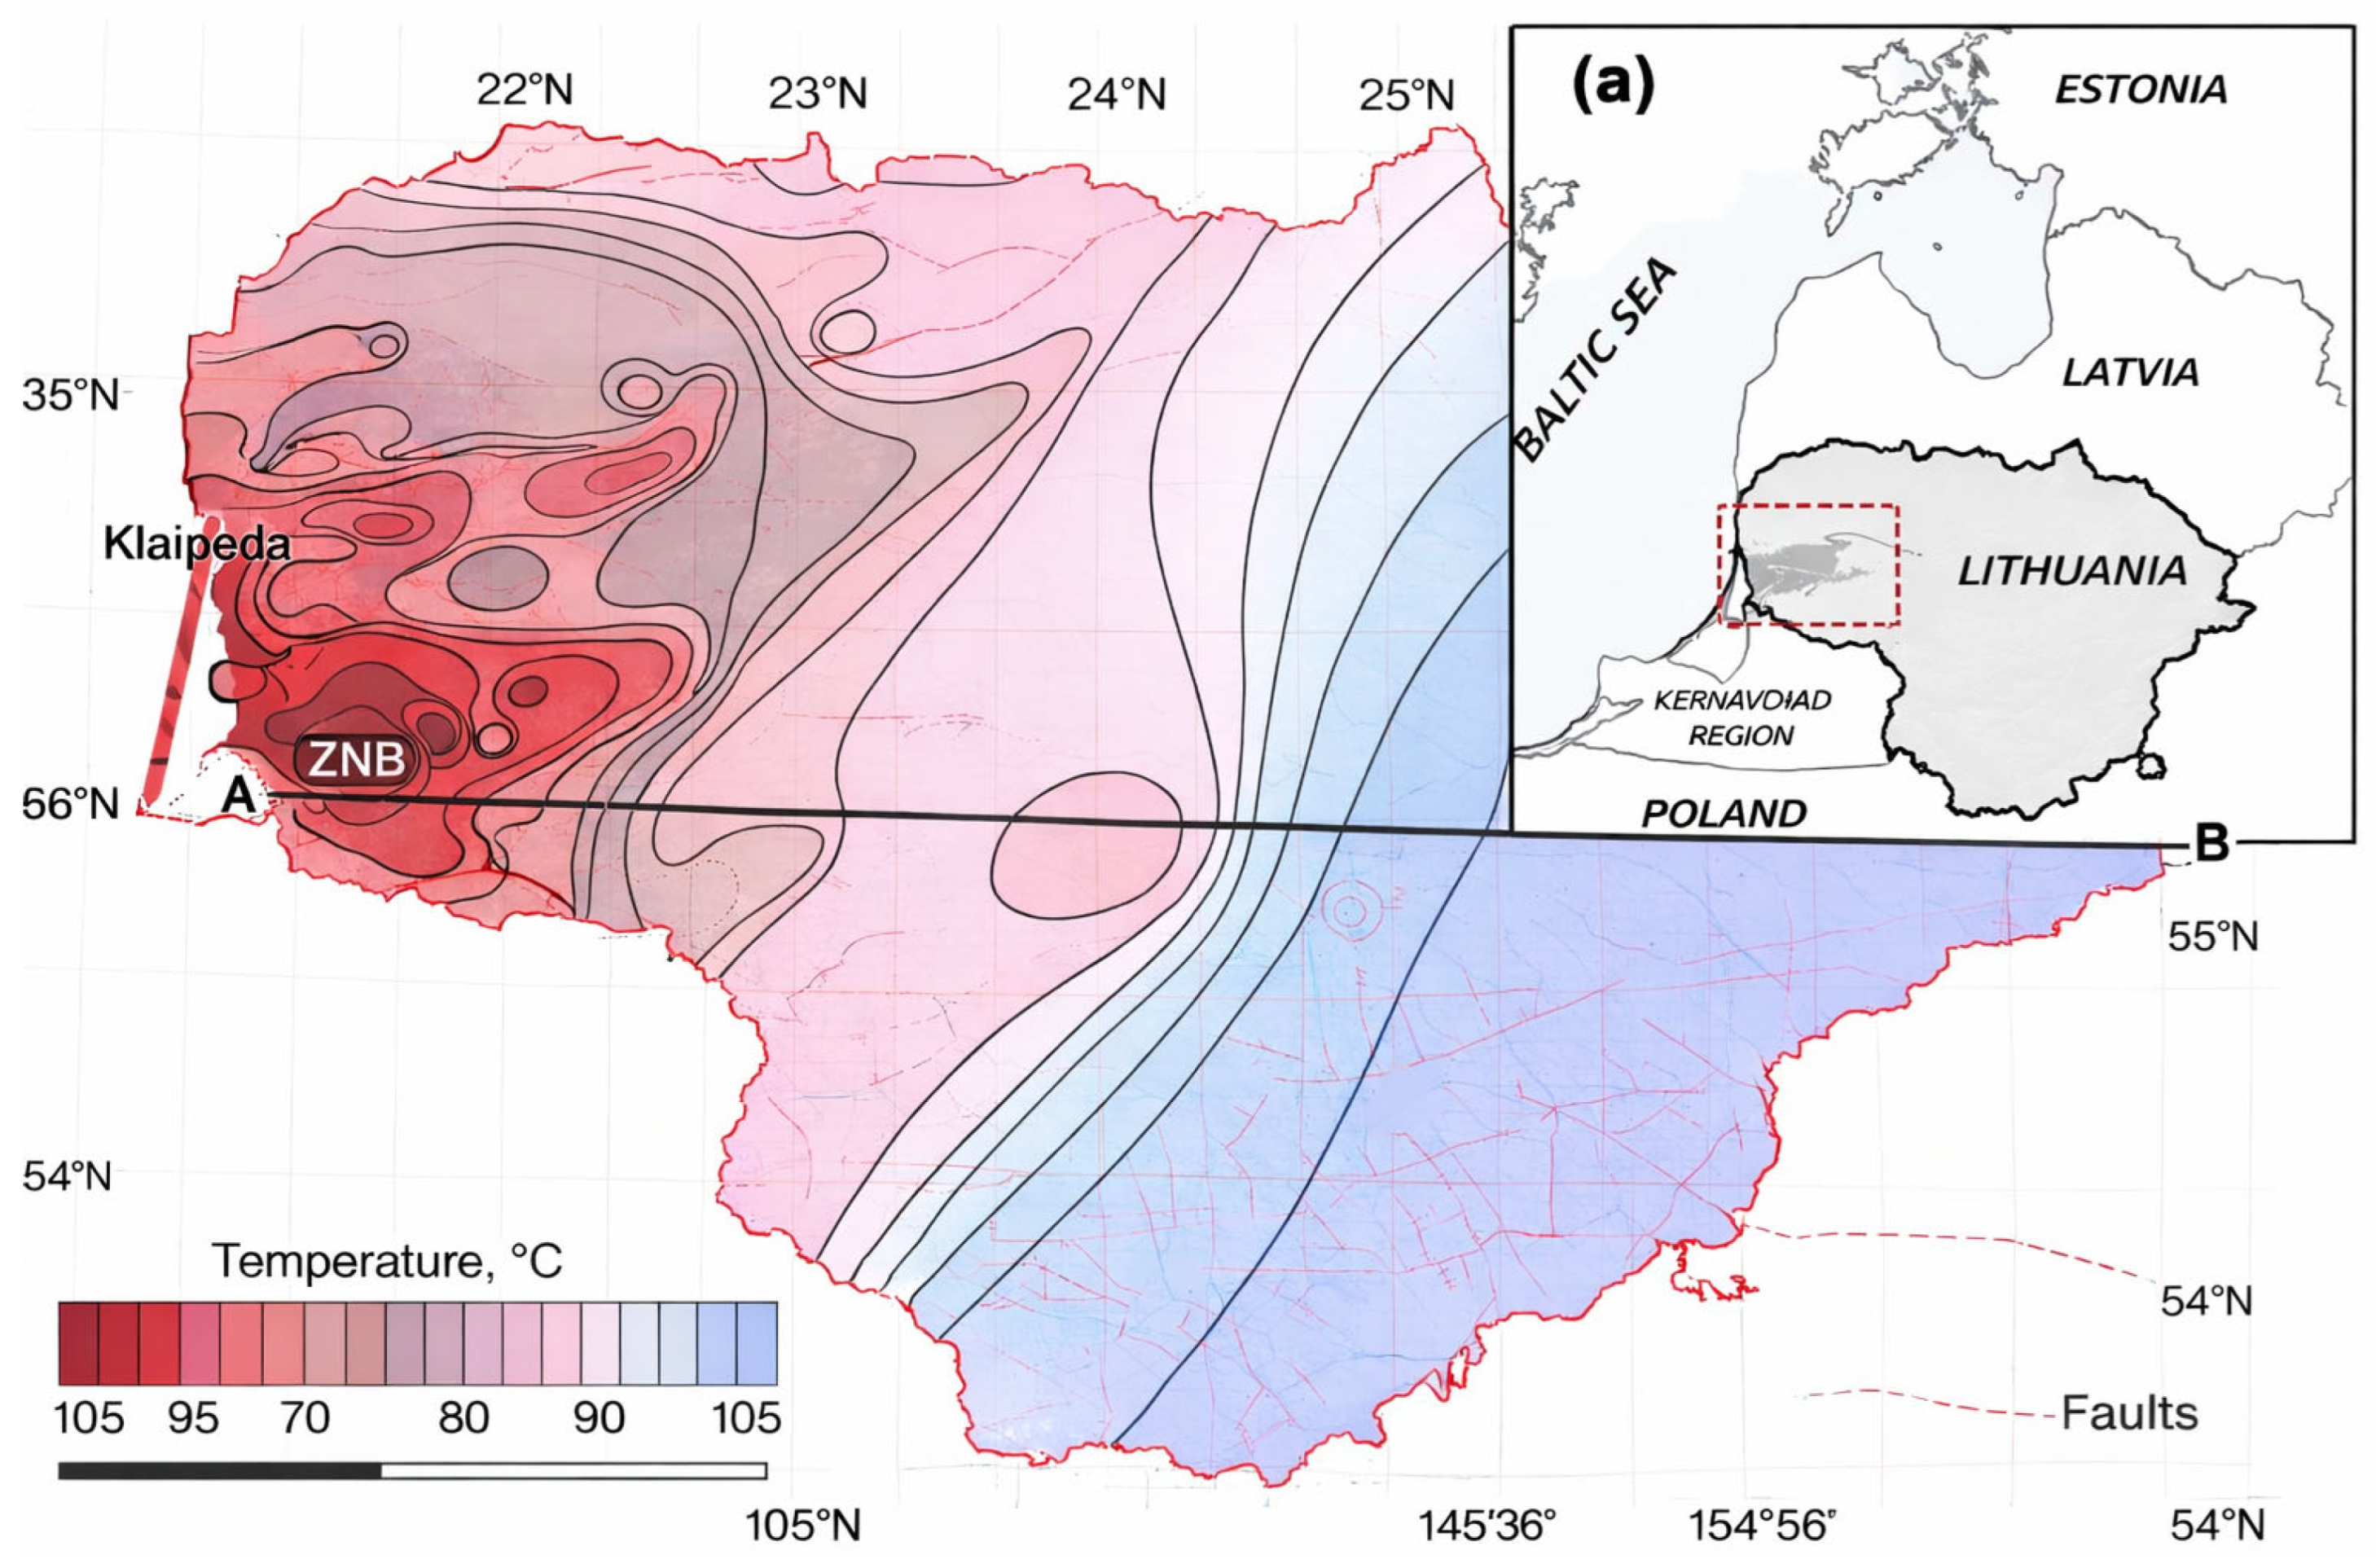
Western Lithuania hosts a well known southwestern geothermal anomaly within the otherwise stable East European Craton. The anomaly is commonly linked to radiogenic granitoid intrusions beneath the sedimentary cover (notably the Žemaičių Naumiestis Batholith) and is amplified by the thermal insulation of the thick sedimentary sequence, producing elevated regional heat flow and reported geothermal gradients reaching ~45 °C/km in the anomaly zone (
Figure 1).
The two main deep hydrothermal complexes in the region are the Lower Devonian sandstones (high porosity/permeability but lower temperatures, typically up to ~45 °C) and the Cambrian sandstone succession (higher temperatures, reported up to ~96 °C, but generally less favorable collector properties). This study targets the high-temperature Cambrian sandstone system in Western Lithuania, which is also the primary historical target for hydrocarbon exploration; consequently, the most informative legacy data (wells, tests, petrophysical summaries) cluster along structural trends and fault zones in the western part of the country (
Figure 1).
2.2. Workflow of the Study
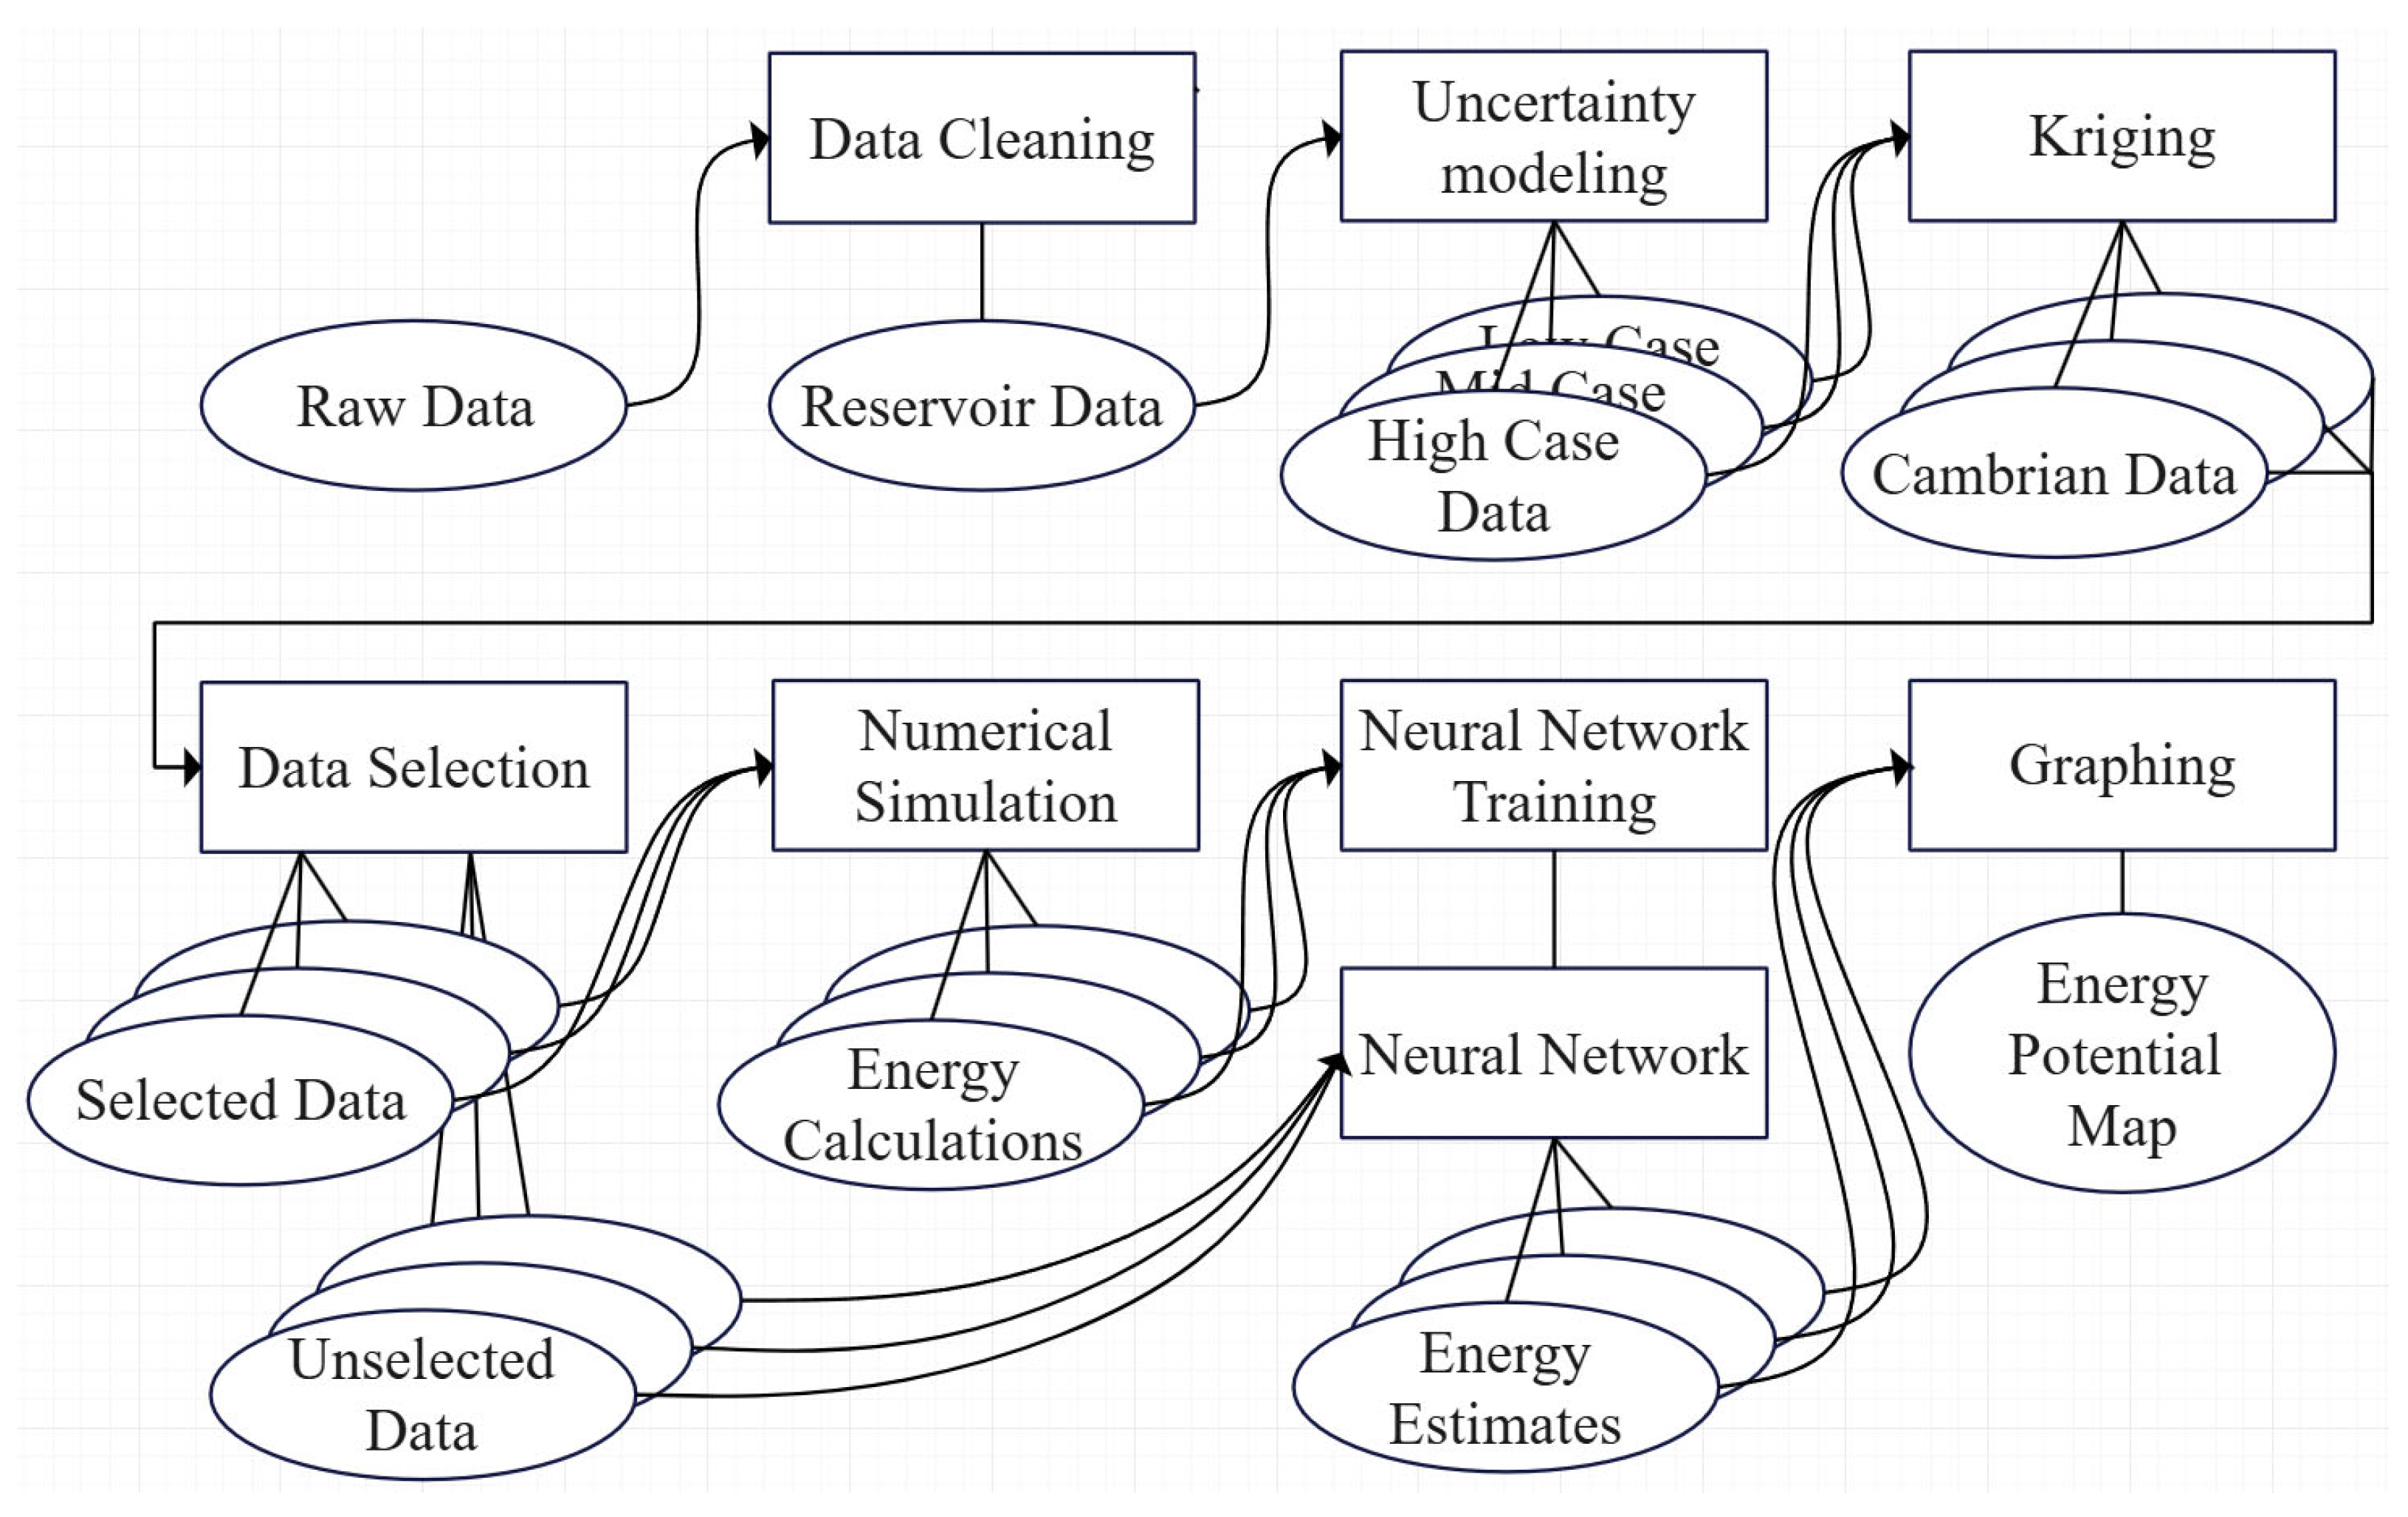
Figure 2 summarizes the workflow used to construct a regional geothermal potential map under sparse and heterogeneous data availability. The workflow is organized as a sequence of modular steps, in which each processing block produces an intermediate dataset that is used as input for the subsequent stage. In
Figure 2, ellipses represent datasets (inputs, intermediate products, and outputs) and rectangles represent the procedures applied to transform them. Detailed descriptions of the core components (data processing, kriging, numerical simulation, and neural network training) are provided in
Section 2.3,
Section 2.4,
Section 2.5 and
Section 2.6. The present subsection is included to clarify the overall data lineage and the rationale behind the intermediate steps that may otherwise be interpreted ambiguously.
The workflow begins with raw data compiled from legacy sources (archival reports, well logs, and related documentation). These inputs are processed through data cleaning, which removes defective or inconsistent entries and reconciles missing or non-comparable records, yielding a harmonized reservoir dataset that is suitable for quantitative analysis. To propagate uncertainty through later stages, the reservoir dataset is then subjected to multiplicative parameter altering, in which the old and two new sets are represented as low, mid and high cases. This step is used to evaluate the uncertainty range associated with data unavailability of a full reservoir characterization.
Each low, mid and high dataset is then spatialized using ordinary kriging, producing gridded Cambrian parameter fields for subsequent modeling. Because simulation at every grid cell is computationally costly, a data selection step is applied on the kriged grid to define a selected subset of grid cells used for numerical simulation and surrogate training. An unselected subset is reserved for later surrogate-based inference. The selection is designed to provide representative coverage of the mapped domain (indicated by kriging uncertainty metrics), so that the surrogate is trained on a dataset that reflects the variability expected in regional prediction.
For the selected subset, numerical simulation is performed under a standardized doublet configuration to obtain time-dependent production behavior and energy calculations (
Section 2.6). These performance indicators form the supervised targets for NN training, yielding a trained neural network surrogate that approximates the mapping from kriged reservoir properties to the selected energy indicator. The trained surrogate is then applied to the previously unselected grid cells to generate spatially complete energy estimates across the domain for each uncertainty case. Finally, the gridded estimates are used to produce the final energy potential map with a Lithuanian border overlay for clarity.
2.3. Data Collection and Reservoir Parameters
The dataset used in this study was compiled from historical reports, borehole measurements, and regional studies of Cambrian reservoirs. A total of 12 data points were picked among others, each corresponding to a well or a Cambrian reservoir location. Each entry contained six main reservoir descriptors and one target variable:
Porosity (φ), % (converted to a dimensionless fraction).
Permeability (K), mD (converted to m2).
Reservoir temperature (T), °C (converted to K).
Reservoir pressure (P), bar (converted to Pa).
Reservoir thickness (dz), m.
Net-to-gross ratio (NTG), % (converted to a dimensionless fraction).
Energy (ΔQ), MWh—an estimated output based on simulations.
Spatial coordinates (X, Y) were assigned using the Lithuanian LKS94 projection system. The dataset is heterogeneous in origin and collected at different times, with inconsistent interpretations used for different purposes, methods, etc. Therefore, the numerical values should not be considered exact, but rather indicative for identifying spatial patterns and relative distributions. Data processing mainly consisted of 4 steps:
Data collection—Compiling raw information from all accessible legacy sources, including archived reports, well logs, and historical records.
Data cleaning—Identifying and excluding entries that are erroneous, internally inconsistent, incomplete, or otherwise unsuitable for quantitative analysis.
Data harmonization—Standardizing heterogeneous inputs by reconciling units, formats, naming conventions, scales, and interpretation criteria, including the application of clearly stated domain-driven assumptions where required.
Data structuring—Assembling the finalized values into a uniform, machine-readable dataset (e.g., tabular and/or spatially referenced) that is suitable for kriging, simulation parameterization, and downstream modeling.
The available legacy reports rarely distinguish horizontal and vertical permeability, and net-to-gross (NTG) values were not reported consistently across sources, with non-uniform evaluation criteria. Where only tabulated intervals were available, we applied a consistent cutoff rule to define reservoir quality intervals (porosity ≥ 5% and permeability ≥ 0.01 mD) and used these intervals to compute representative values. In the study area, the Cambrian succession is approximately 150 m thick; however, the most detailed petrophysical reporting is concentrated in the upper Cambrian Deimena unit, which is also the primary target in historical hydrocarbon development. Because comparable measurements for the remaining Cambrian intervals are limited, the workflow uses the Deimena-derived petrophysical statistics as a practical proxy for the broader Cambrian package in this regional screening study.
Permeability measurements along a wellbore primarily capture vertical variability and do not directly constrain lateral continuity at the regional scale. Nevertheless, to obtain consistent single-value permeability inputs for regional modeling, we aggregated vertical measurements into representative effective permeabilities, using multiple standard averaging operators: weighted arithmetic and harmonic means, which provide optimistic and conservative bounds that are commonly used to bracket effective permeability in flow models; a weighted geometric mean, which is often appropriate for lognormal-type permeability distributions and provides a robust central tendency; and an unweighted arithmetic mean, included as a simple, transparent reference estimate and an optimistic counterbalance to the more conservative harmonic and geometric averages. Together, these aggregation choices provide a controlled way to reflect heterogeneity under sparse and heterogeneous reporting conditions.
Table 1 and
Table 2 summarize the harmonized input parameters used as the basis for kriging and subsequent simulations; they are provided here to ensure the traceability and reproducibility of the workflow.
Girkaliai data were taken from a well report [
13]—the porosity and permeability were averaged from tabular data, the reservoir temperature was interpolated using a provided gradient, the reservoir pressure was interpolated using a gradient that was calculated out of provided depth-pressure values, the total Cambrian was calculated as a proportion of Cambrian thickness and the sum of the effective layer.
Nausodis data were taken from the reservoir passport [
14]—porosity, permeability, temperature, pressure, and thickness were averaged accordingly, with NTG being calculated as the total thickness ratio with effective thickness.
Šilalė data were taken from the detailed exploration report of the Šilalė oil field [
15]—permeability was averaged from the tabular data and the reservoir pressure was interpolated using a gradient that was calculated from the provided depth-pressure values.
Šilutė, Ramučiai, Naumiestis, Rusnė, Vabalai and Žalgiriai data were clumped into one previous geothermal study focusing on the geothermal anomaly epicenter [
16]. Porosity and permeability averaged from tabular data, reservoir temperature values from a map provided by the Lithuanian Geology Survey [
2], Cambrian thickness values from another map provided by the Lithuanian Geology Survey [
17], and reservoir pressure values were calculated using the well depths and pressure gradient from the Girkaliai field, whereas the NTG values were derived by dividing the sum of explored interval lengths with the distance between highest interval top and lowest interval bottom ends.
Nida data were taken from a few documents (including [
18] and [
19]). From the assessment of geological and technical-economic conditions of the Nida settlement, we obtained the total thickness and effective thickness (as numerator for NTG) values, as well as the reservoir temperature values at different depths, from the first few pages describing different geological layers. They were extrapolated to the middle of the Cambrian layer, using this data to obtain the reservoir temperature value at the desired depth. From the borehole passport, we have obtained the length of Cambrian that has been drilled through (as denominator for NTG), as well as the reservoir pressure estimate, which was calculated by extrapolation to the well depth by using the gradient from the Girkaliai field. From the third one (which came as an Excel table in an attachment), we have obtained porosity and permeability using before-mentioned averaging techniques. Strangely, more data were present for vertical permeability than for horizontal, so the ratios between the two were calculated at the common points to populate the table with NaN values.
Diegliai data were taken from [
20]—porosity and NTG were averaged between two values by using productive and transitional zone thickness values, as the weights, permeability, reservoir temperature and pressure were averaged from the tabular data.
Šiūpariai data were taken from [
21]—permeability was obtained by connecting and averaging multiple data tables, the reservoir temperature was extrapolated from a singular data table and the Cambrian thickness was calculated by subtracting the interval ends.
2.4. Kriging Interpolation of Reservoir Properties
To achieve spatial continuity, ordinary kriging was applied to interpolate porosity φ, isotropic permeability K, temperature T, pressure P, thickness dz, and NTG across Western Lithuania. Predictions were produced on a regular grid, covering the study area with a 10 km padding beyond the convex hull of the wells, and a grid spacing of 3 km, covering the main Cambrian reservoir region of interest (25 × 30 cells that make up ~6750 km2 area). For each separate parameter, an empirical semivariogram was computed, using MATLAB’s variogram function with a conservative number of lag bins (≤5) and a maximum lag distance set to approximately half of the maximum pairwise well separation, to reduce instability associated with sparse sampling. A parametric Gaussian variogram model was then fitted by least-squares, estimating the nugget, sill, and range parameters. The fitted variogram model was subsequently used in an ordinary kriging system (kriging function) to obtain both the kriged estimate and the kriging variance at each grid node.
The spatial uncertainty was quantified using the kriging variance provided by the kriging system for each interpolated parameter. For reporting and scenario construction, kriging variance maps were normalized to a common [0, 1] range per parameter and aggregated into a composite uncertainty indicator (average normalized variance across parameters). This composite indicator was used to identify locations where predictions are comparatively well constrained by nearby data versus locations where predictions rely predominantly on spatial extrapolation. The uncertainty indicator is intended to support interpretation boundaries and scenario selection, rather than to claim deterministic accuracy under sparse data conditions.
To address the parameter uncertainty, three scenarios were established:
Low case: Reservoir properties multiplied by 0.9.
Mid case: Reservoir properties unmodified (1.0).
High case: Reservoir properties multiplied by 1.1.
These interpolated maps served as the foundation for reservoir simulations and subsequent neural network predictions.
2.5. Reservoir Simulation Model
To evaluate geothermal performance consistently across the region, we use simplified mechanistic box models representing a laterally extensive Cambrian reservoir segment populated with kriged properties. The subsurface model represents coupled fluid flow and heat transport under a standardized doublet concept (one injector–producer pair): pressure gradients drive brine circulation through the porous medium (Darcy-type flow), while heat is transported primarily by advection with the moving brine, and exchanged with the rock (effective thermal transport).
The low, mid and high cases each had 750 cells with 6 parameters attached to them. A total of 303 were selected out of each case for simulation by equal spacing, as well as ones with the biggest kriging variance value. Selected kriged points were used to initialize forward reservoir simulations. The objective was to estimate the thermal drawdown over time for a simplified doublet configuration, consisting of an injector and a producer well.
The simulation model contained certain assumptions. First of all, brine and rock property values were taken as default ones from the MRST (brine dynamic viscosity, density, heat capacity, etc.) and extended using built-in EOS; however, some of the more notable are specific heat capacity, the density of the rock from [
22], and the thermal conductivity of the rock from [
23].
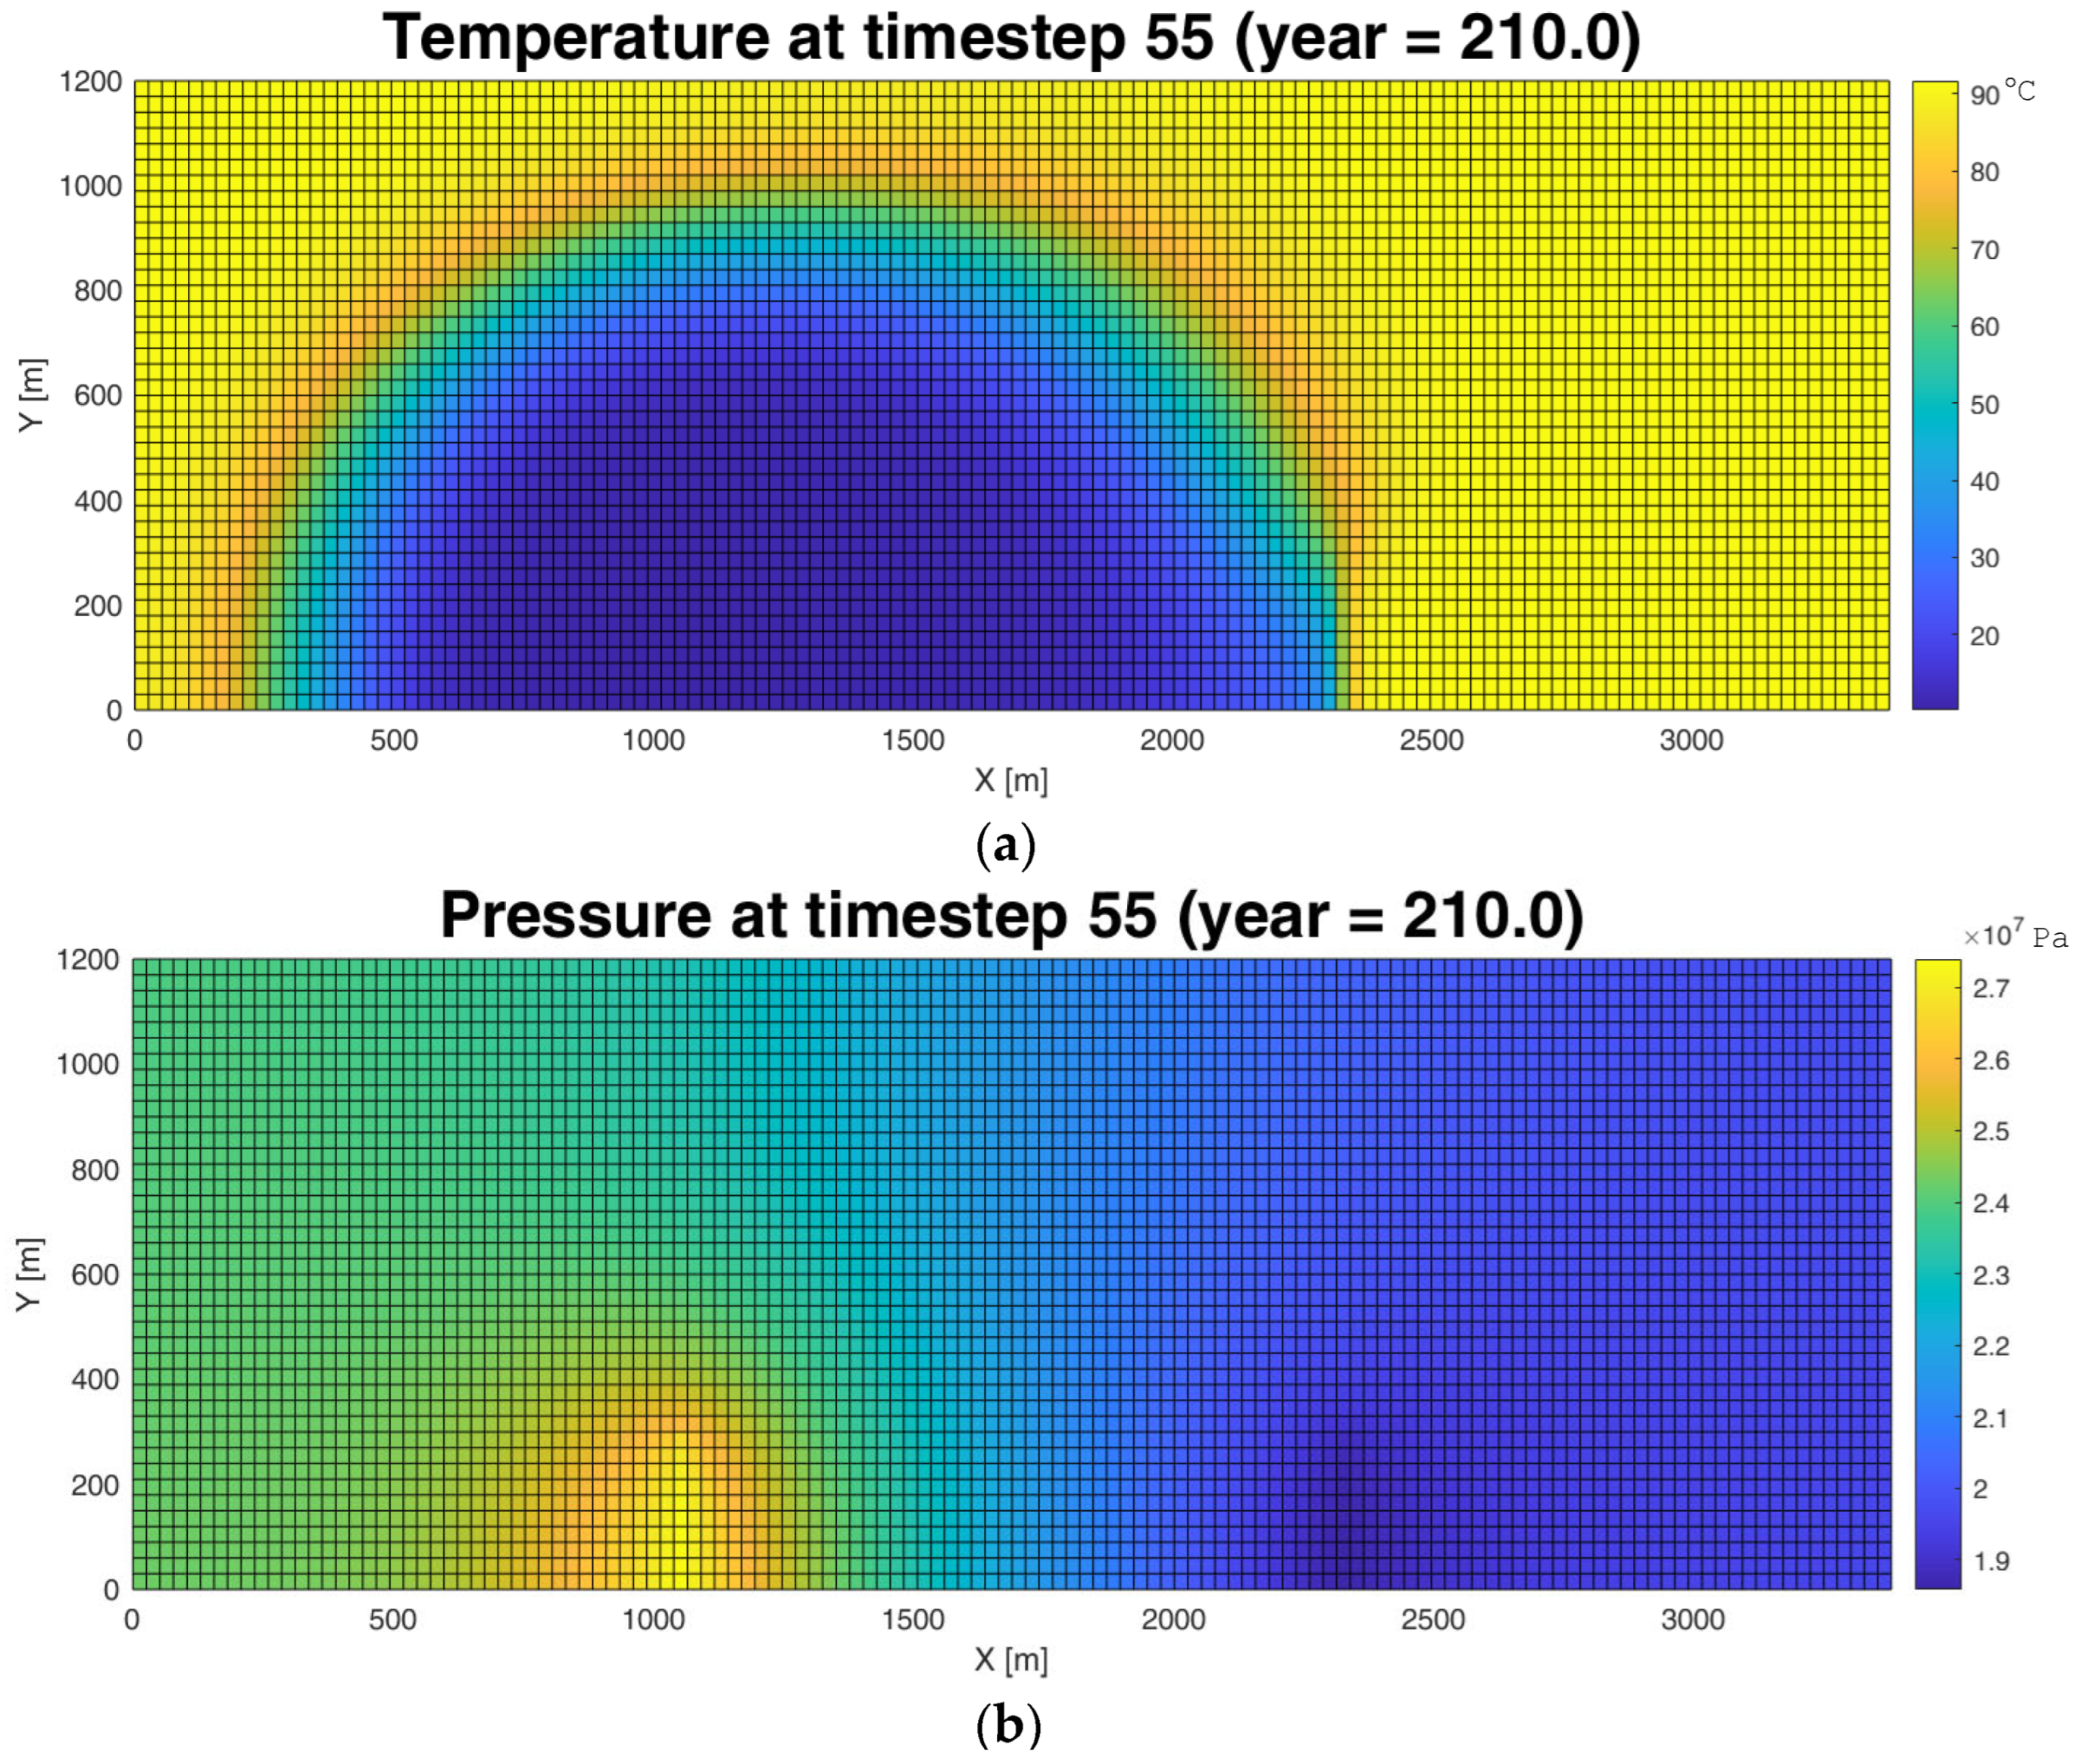
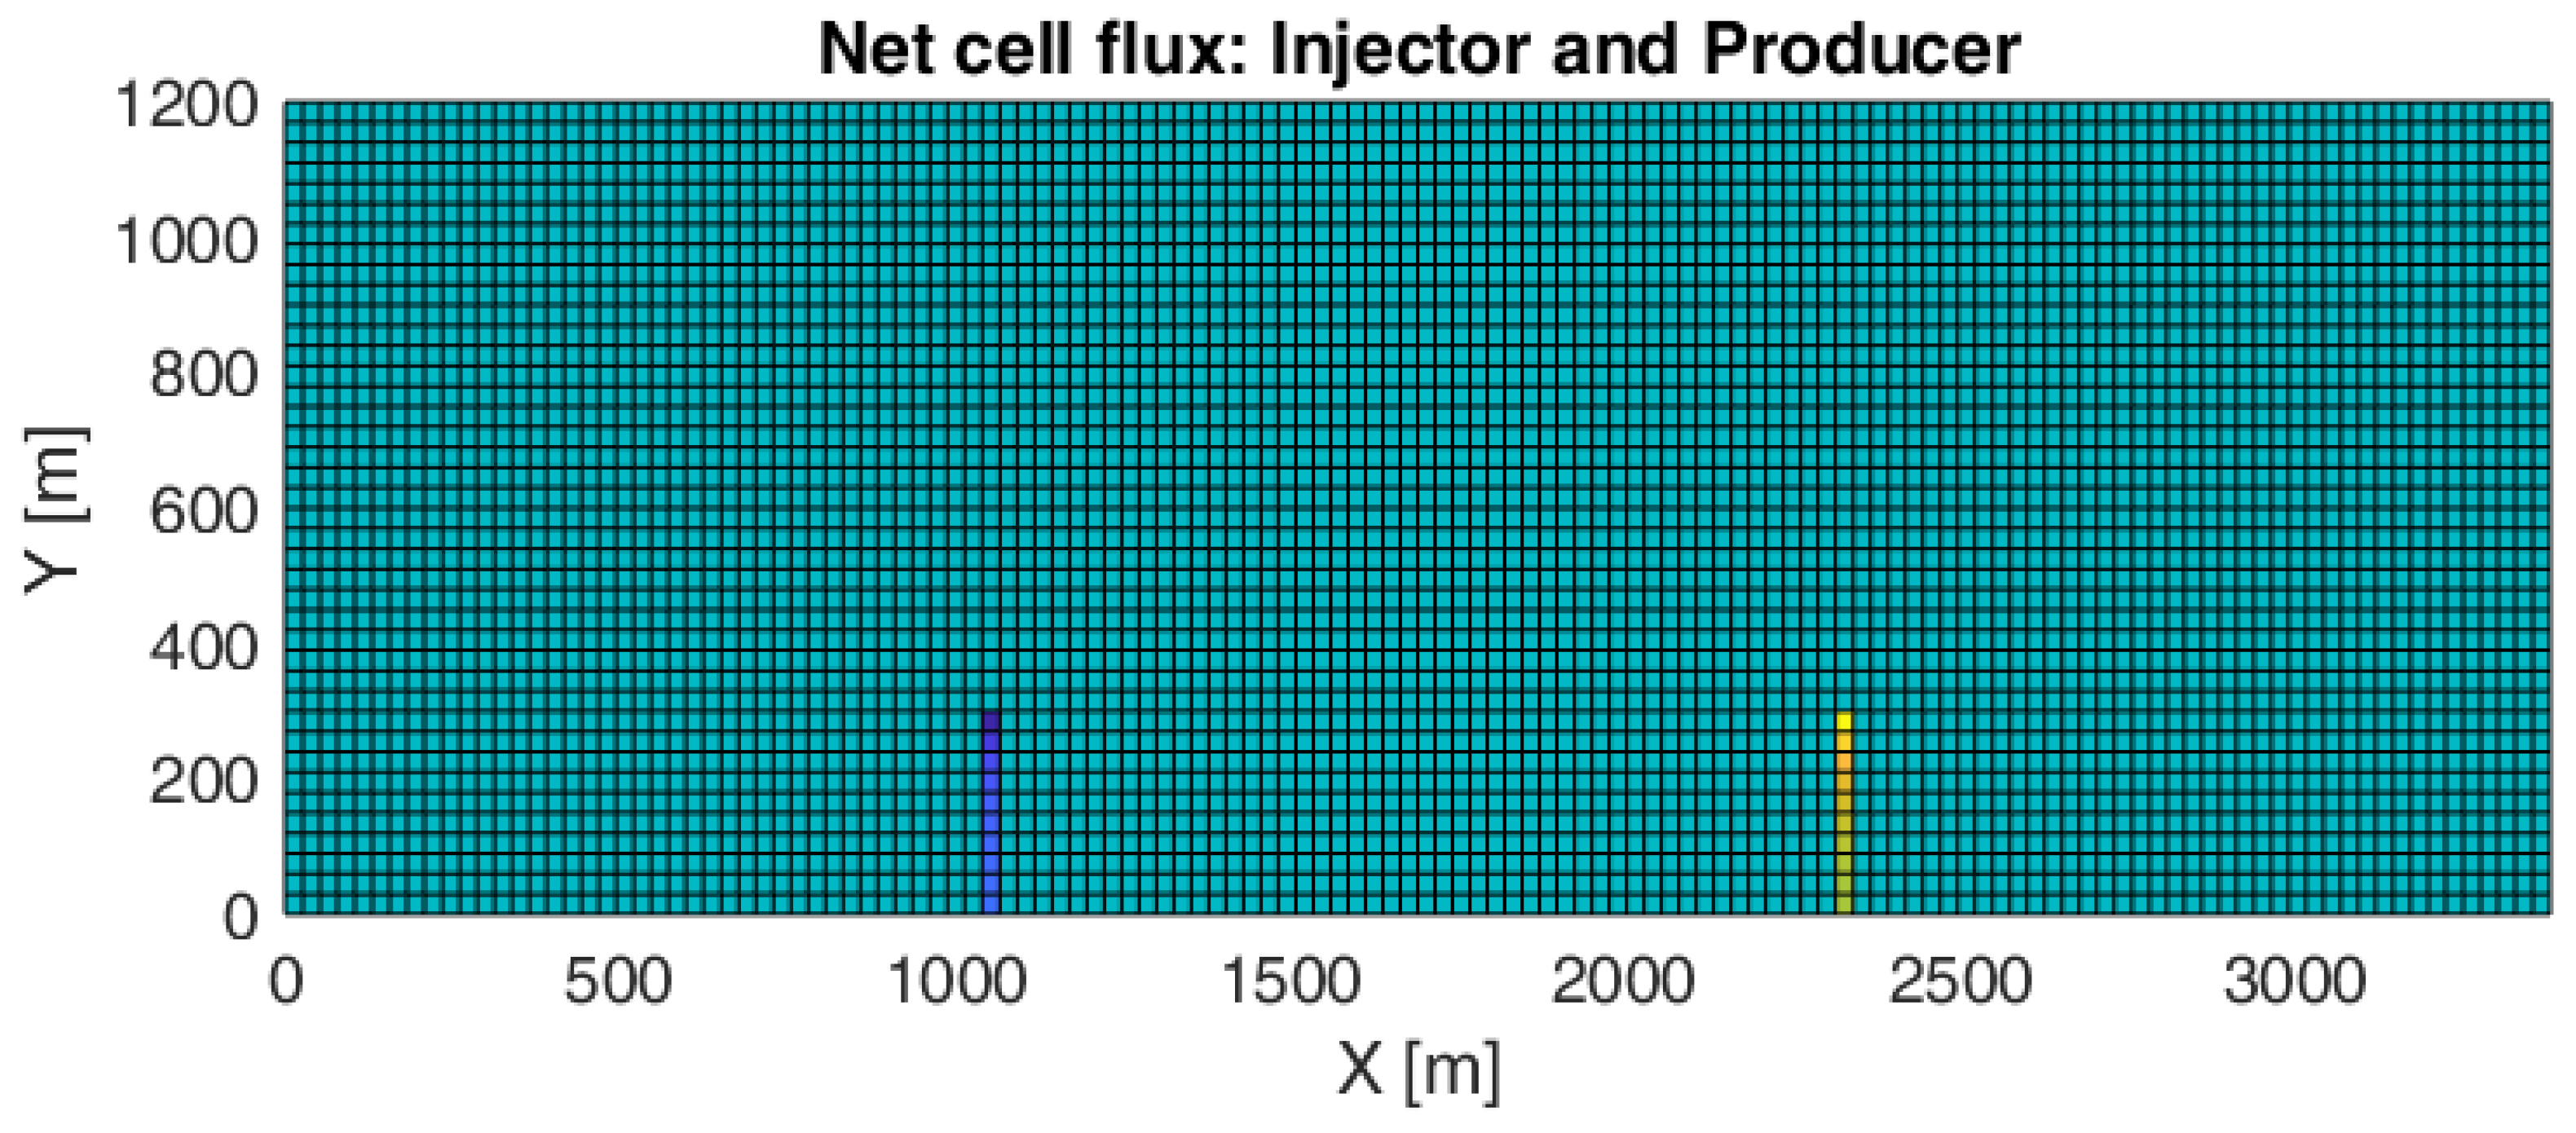
The system itself was modeled as a laterally extensive 3380 m × 1200 m × dz m (130 × 30 × 1 cells) reservoir section (
Figure 3) that was 2 km deep, with assumed horizontal well lengths of 600 m (0.15 m radius) each, spaced apart by a 1300 m stretch of reservoir, motivated by a previous study on well doublet positioning in Lithuanian Cambrian reservoirs for geothermal applications [
6]. Only half of the reservoir was simulated to reduce computational effort, relying on symmetry assumptions. The presented regional maps should not be interpreted as a volumetric geothermal reserve estimate. The workflow does not identify reservoir geometry or compute reservoir volume from the sparse wells; instead, reservoir extent and thickness are treated as geological inputs that are used to apply a consistent screening setup across the region. A reserve assessment would require additional inputs such as 3D structural surfaces, spatial thickness and facies models, and volumetric heat-in-place calculations, which are incompatible with this screening-focused study.
Box models were bound by Neumann no-flow conditions, meaning that we have assumed no aquifer support outside the domain. This was done in part to assume the possibility of repeated doublets outside the simulated field (repeated boundary condition).
The selection of horizontal wells instead of the vertical ones is motivated by the ability to extend the well as much as needed, more reservoir contact with the wells, a larger reservoir sweep, and by the observation that subsurface tends to be more heterogeneous along the layer. Due to the costs and risks associated with drilling very long wells, we have settled on a moderate-sized well with a length of 600 m, where it is large enough to improve contact area and injectivity, but short enough to avoid a friction pile-up along the wellbore and long simulation times.
The flow was stimulated by a pressure gradient created by BHP conditions with ΔP being 100 bar in total or and . Due to closed boundary conditions, the mass flow rate of production was somewhat automatically balanced by injection. For the generality and scarcity of data, the saturation of oil and gases were set to zero, meaning that the fluid was 100% brine.
Energy recovery was represented by the difference in produced vs. injected water temperatures, meaning that this did not take into account the energy losses of extracting the brine up the well, surface equipment efficiency, the energy required to extract the brine, etc. Simulations were terminated when the net thermal power dropped below 1 MW. The power was calculated out of the simulation-provided fluid fluxes, and the heat calculation used the power integral by interpolating point values between time points, using a triangular approximation.
2.6. Neural Network Surrogate Modeling
Conducting a large number of physics-based reservoir simulations for each spatial grid cell and uncertainty realization is computationally intensive; therefore, a neural network (NN) surrogate is trained to approximate the simulator’s input–output relationship. In this approach, the numerical simulator is treated as a deterministic mapping from the reservoir and operational descriptors (independent variables of porosity, permeability, temperature, thickness, and net-to-gross) to selected geothermal performance indicators (dependent variable of thermal power and cumulative extracted energy). The surrogate model is fitted using a representative subset of the simulation results and is later applied to rapidly infer the outputs across the remaining grid cells and scenarios, enabling an efficient regional-scale mapping. The surrogate is not intended to replace the underlying physical model; rather, it provides a computationally efficient approximation of simulator outputs under the same standardized assumptions and serves primarily to accelerate comparative regional screening.
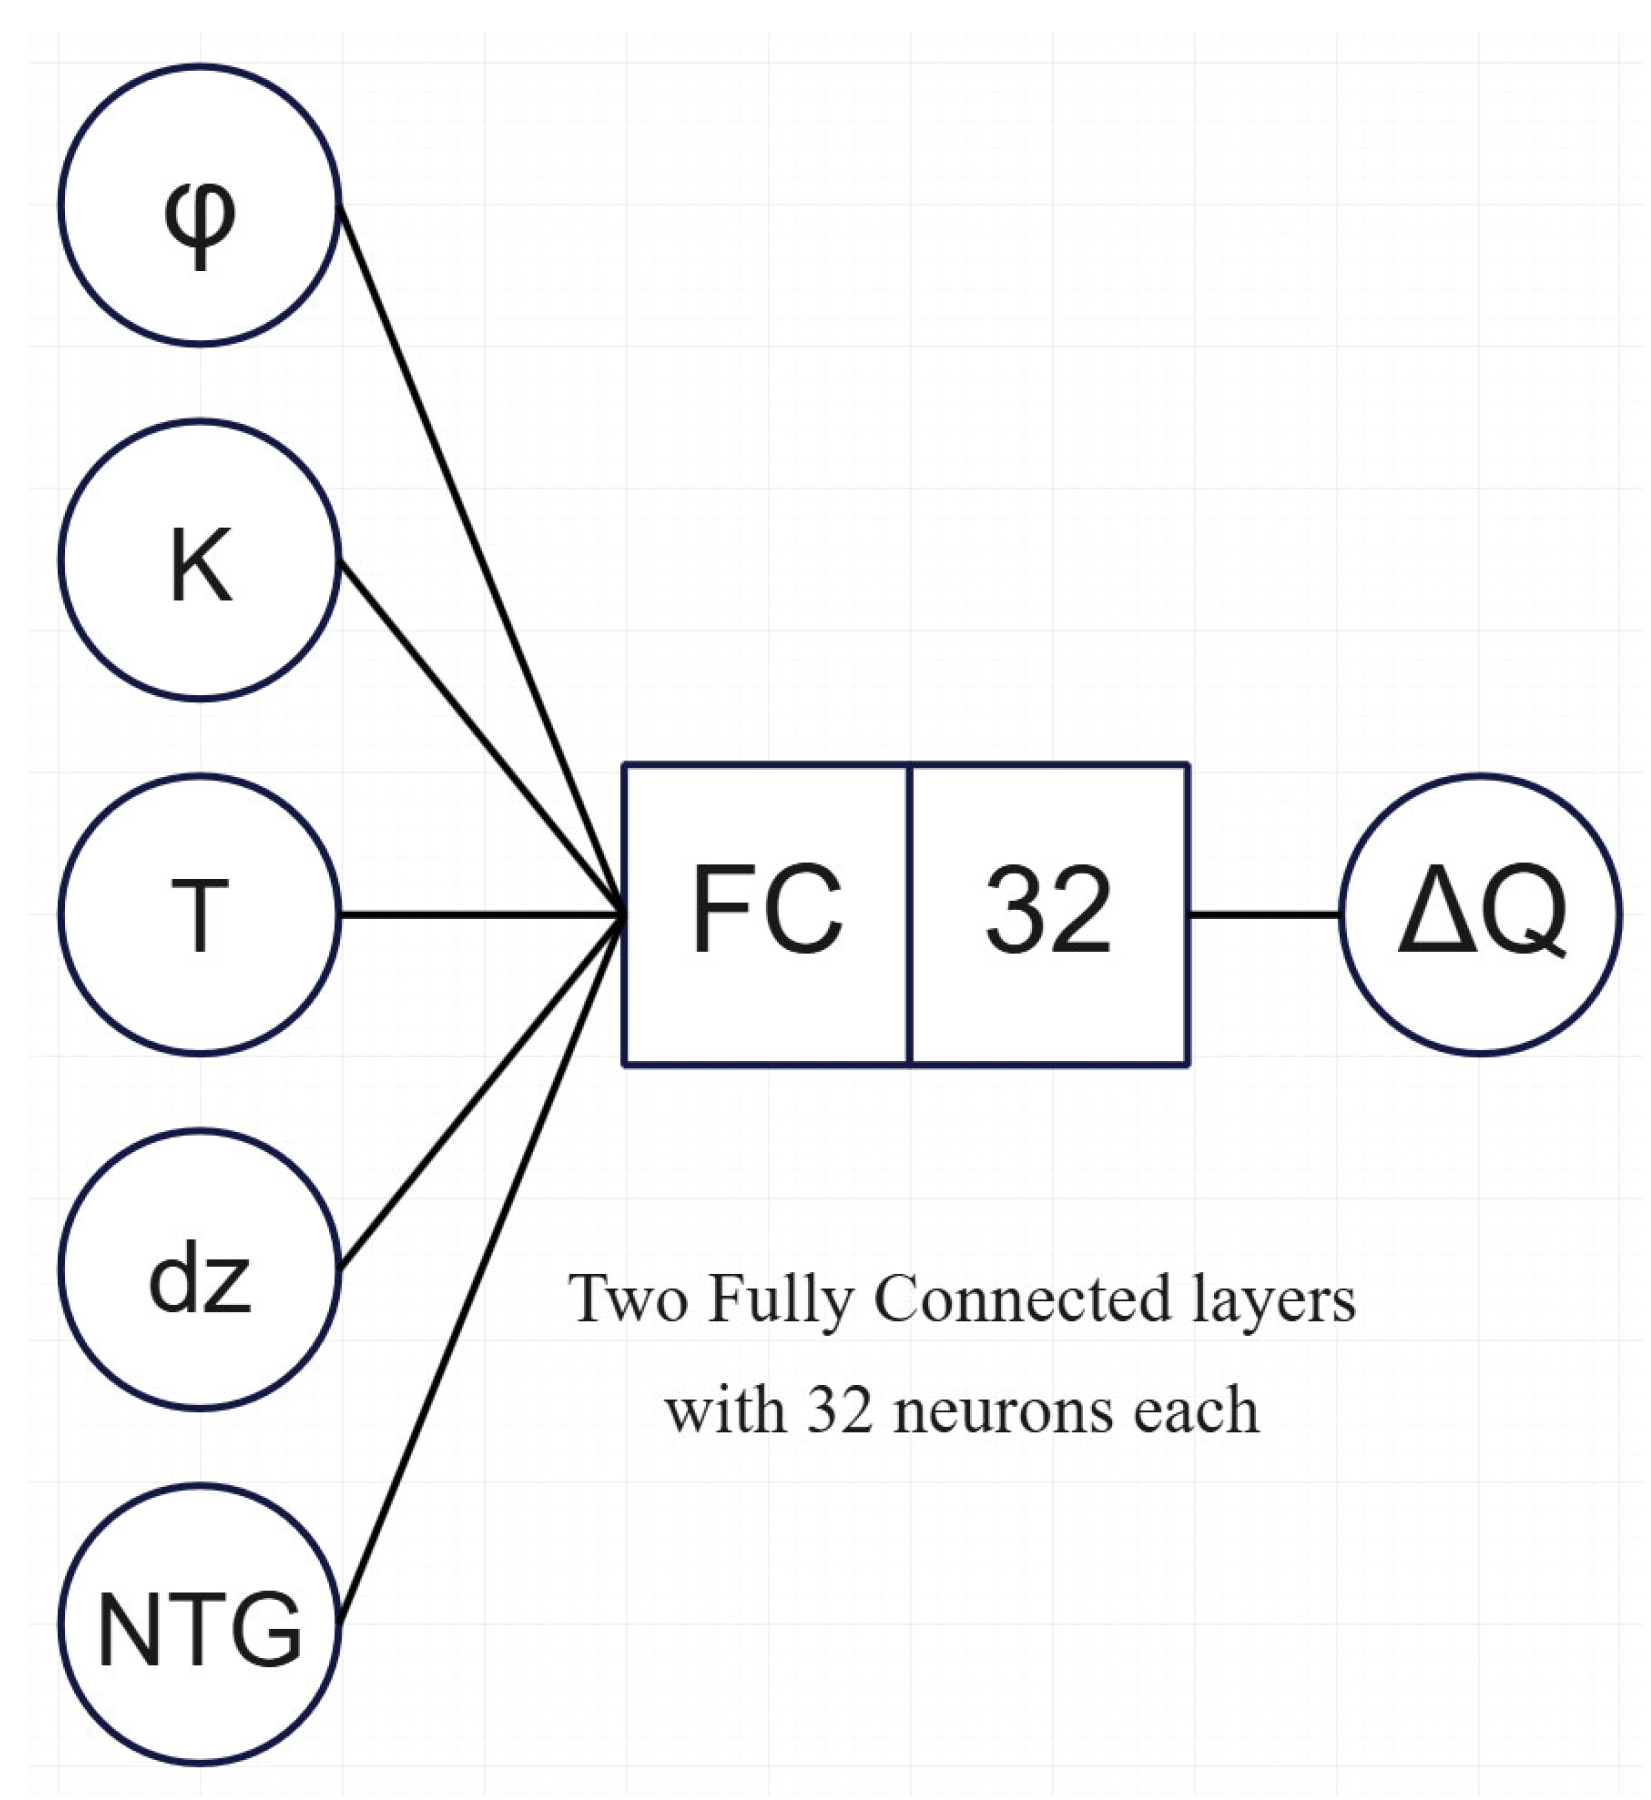
The neural network architecture and hyperparameters used in this study are summarized in
Table 3 and visually depicted in
Figure 4:
Normalization was applied using z-scores based on the training dataset. Validation and testing were used exclusively for guiding optimization and preventing over-fitting.
3. Results
All of the computations and according visualizations (for subsurface simulation, kriging, mapping, etc.) were made using MATLAB R2022b software, using built-in libraries.
3.1. Regional Kriging
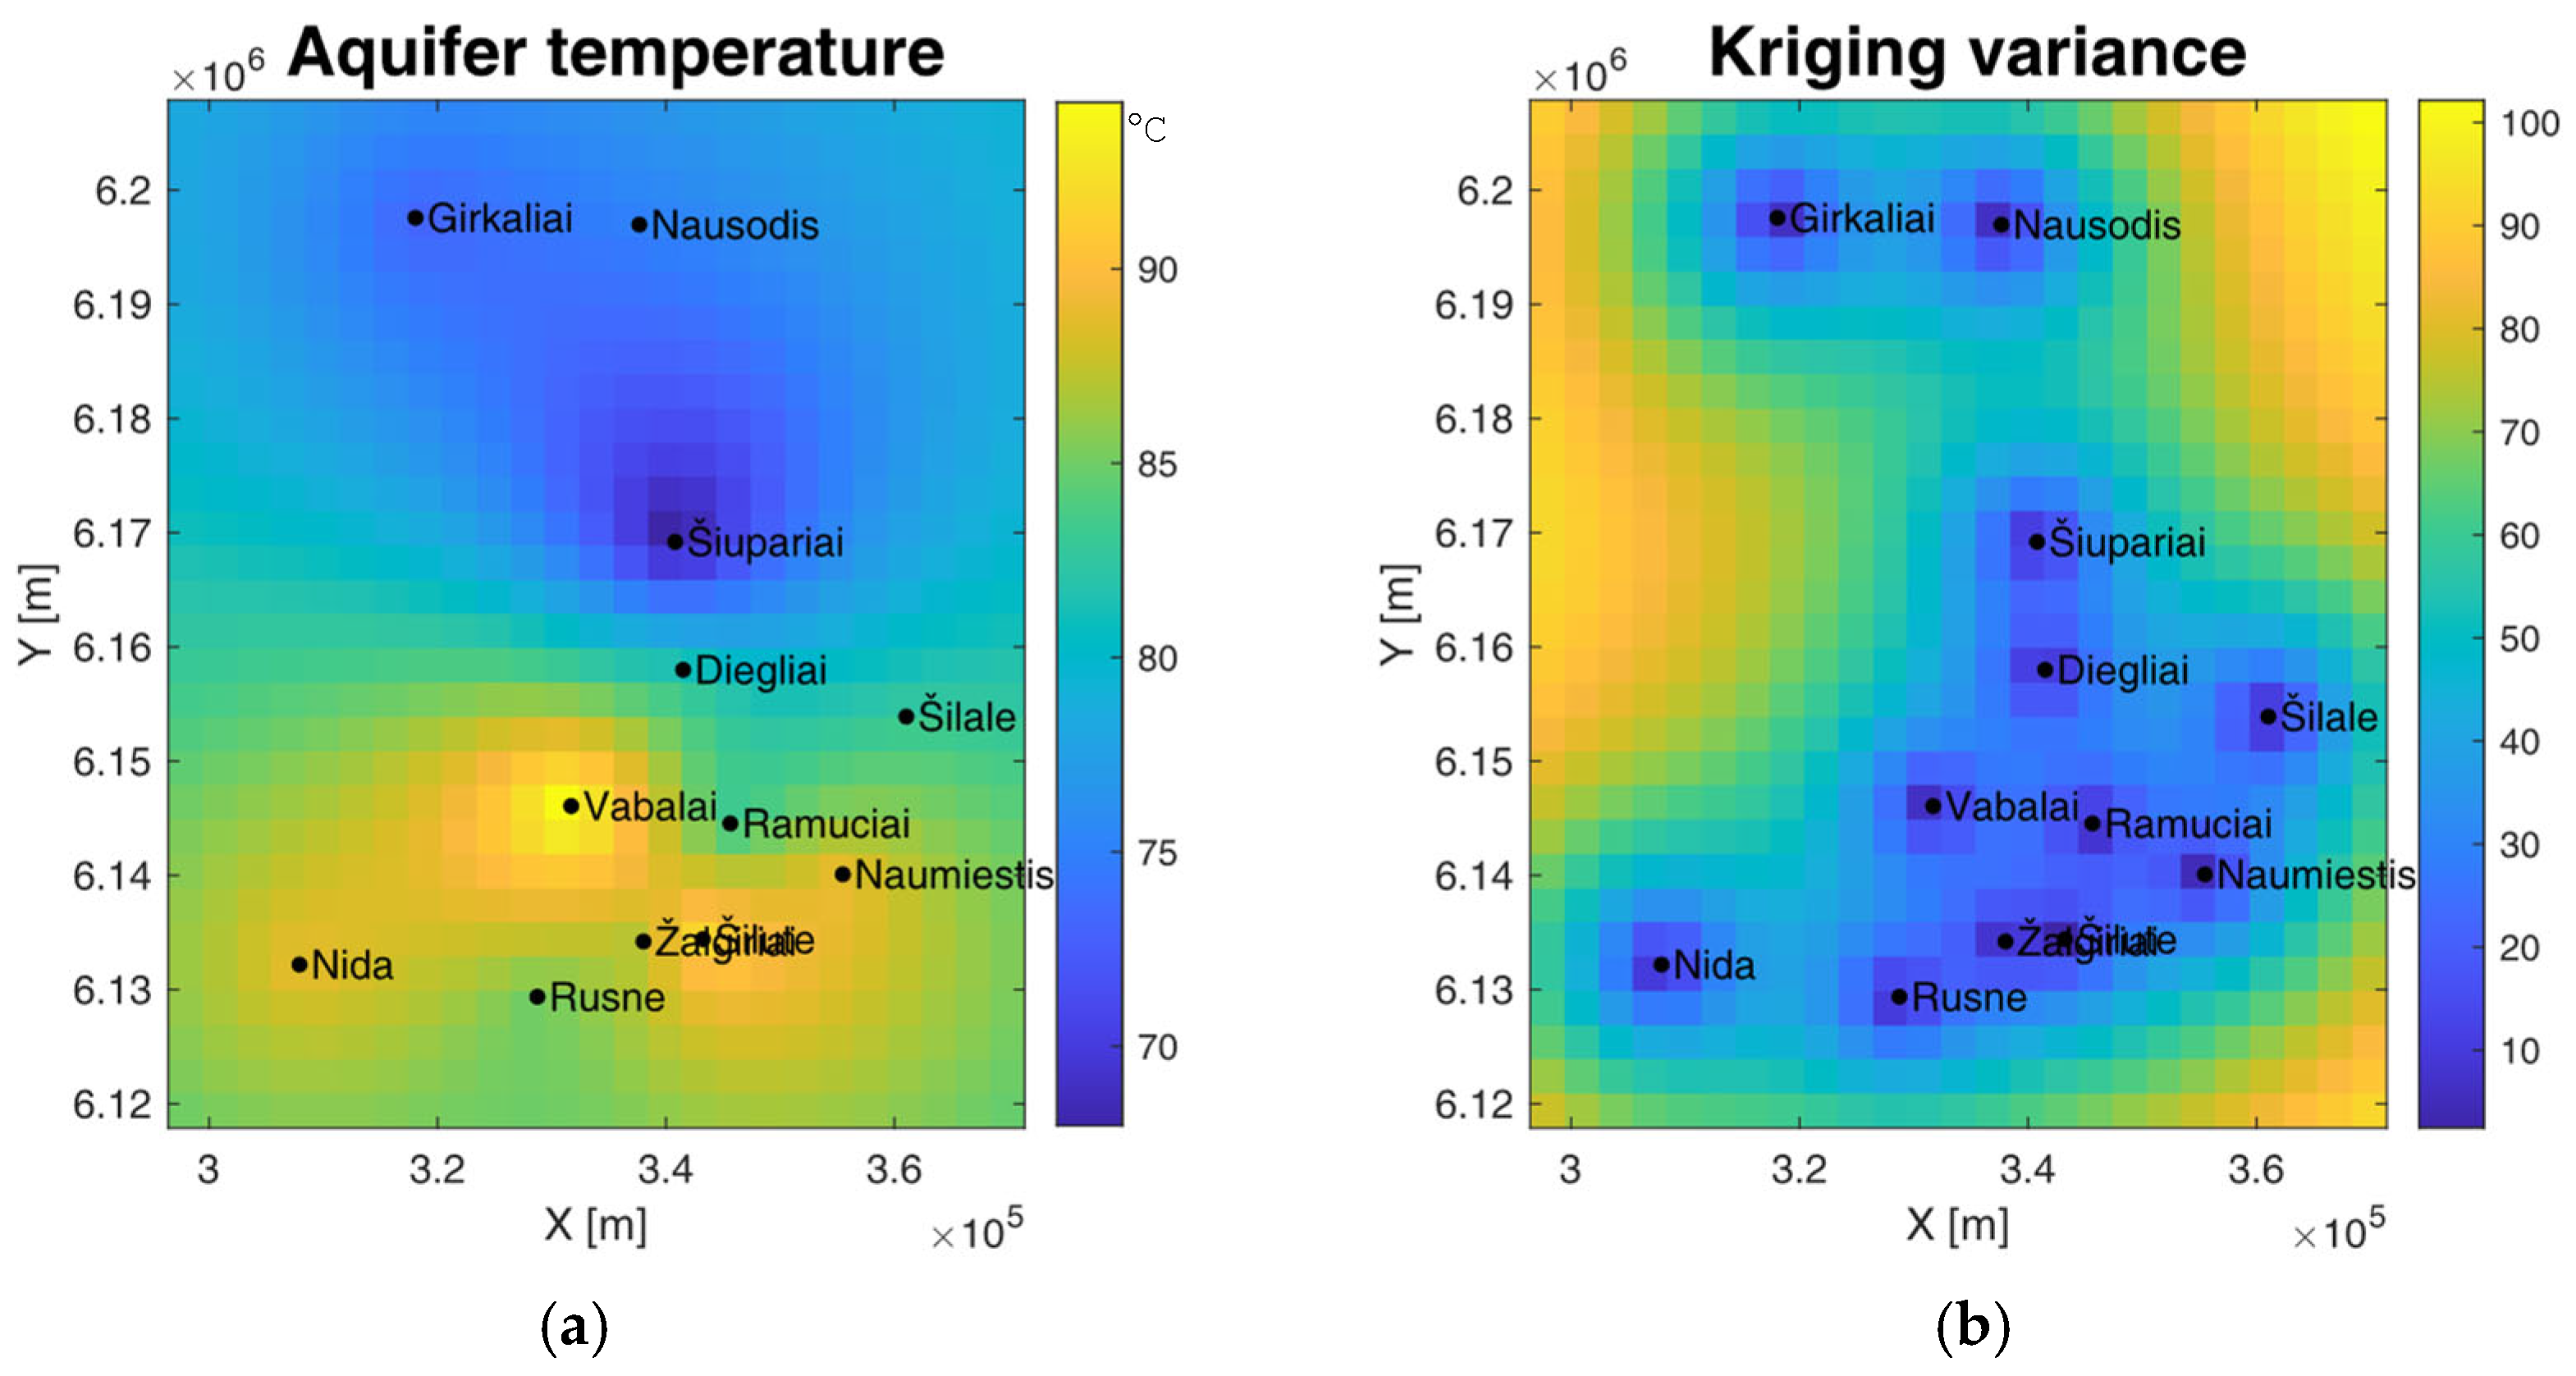
The proposed workflow integrates sparse legacy data harmonization, multi-parameter ordinary kriging, uncertainty scenario construction, physics-based reservoir simulation, and neural network surrogate prediction to produce regional screening maps. Under the available control (n = 12 wells), two implications follow. First, the kriged property fields are sensitive to the spatial configuration of the control points, and interpolation in data-poor zones is increasingly influenced by a small number of nearby wells. Consequently, uncertainty is not uniform across the region and is expected to increase with distance from the data support (
Figure 5). Second, because both the mechanistic simulations and the surrogate model are driven by spatialized property fields, rather than direct observations at every location, the reliability of the final indicators is fundamentally coupled to the interpolation step. In this context, the surrogate does not introduce new observational information; it accelerates the propagation of the physics-based model response across the spatial grid, under a standardized set of assumptions.
These implications motivate a conservative interpretation: the principal robustness of the maps lies in relative spatial ranking under consistent assumptions, whereas absolute magnitudes should not be interpreted as project-grade predictions. Locations with high predicted potential but also high interpolation uncertainty should be treated as candidates for targeted follow-up (additional wells, testing, or high-resolution geological modeling) prior to feasibility analysis. The workflow is therefore best viewed as a reproducible regional screening tool that organizes heterogeneous archival information into actionable priorities, while explicitly delineating where new data would most reduce uncertainty.
3.2. Reservoir Simulation
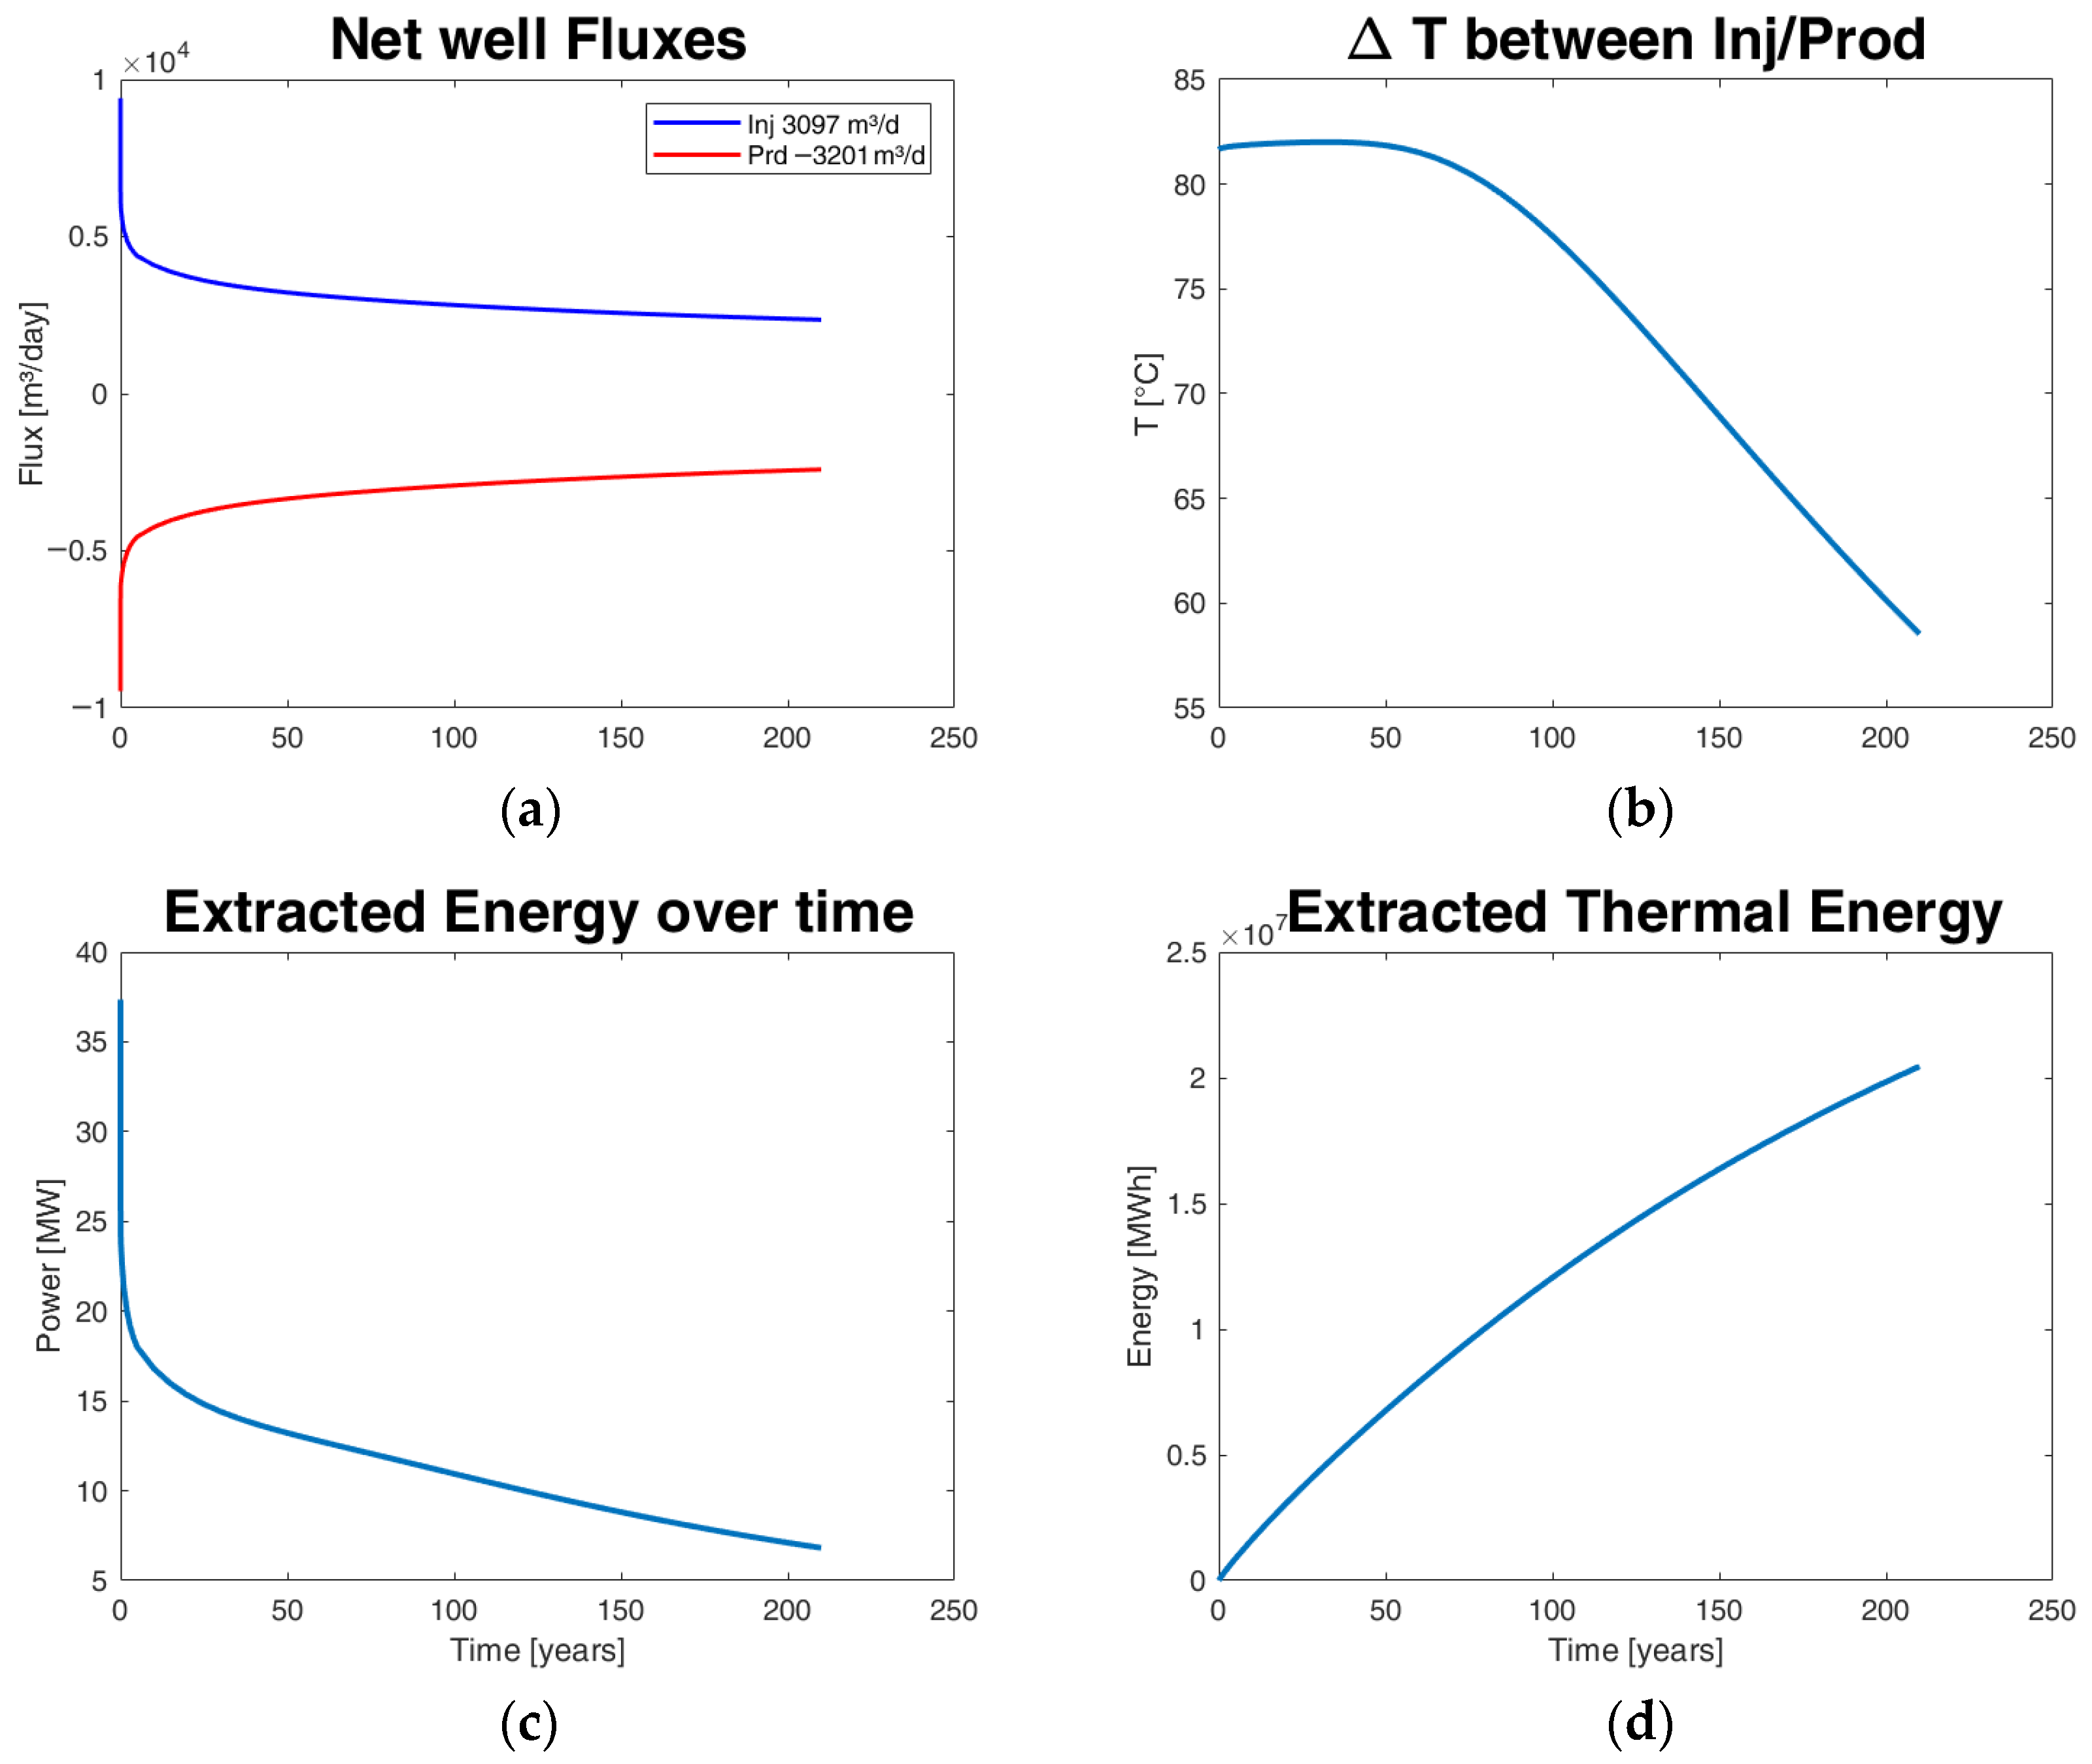
The model operated over extended geological timeframes, with simulations running for approximately 1500 years before reaching the cutoff. A snapshot of a simulation after a 210 year injection is presented in (
Figure 6), when the fluid flow stabilized and the cold water front reached the producer, reducing the temperature extracted. Although such durations exceed practical project lifespans (20–50 years), they highlight the long-term sustainability of geothermal systems (
Figure 7). Computed energies reached magnitudes in the order of 107 MWh (from 1.80 × 10
5 (low case) to 6.85 × 10
7 MWh (high case)): values which are not realistic in an absolute sense, but provide comparative insight into the distribution of geothermal potential.
3.3. Neural Network Training
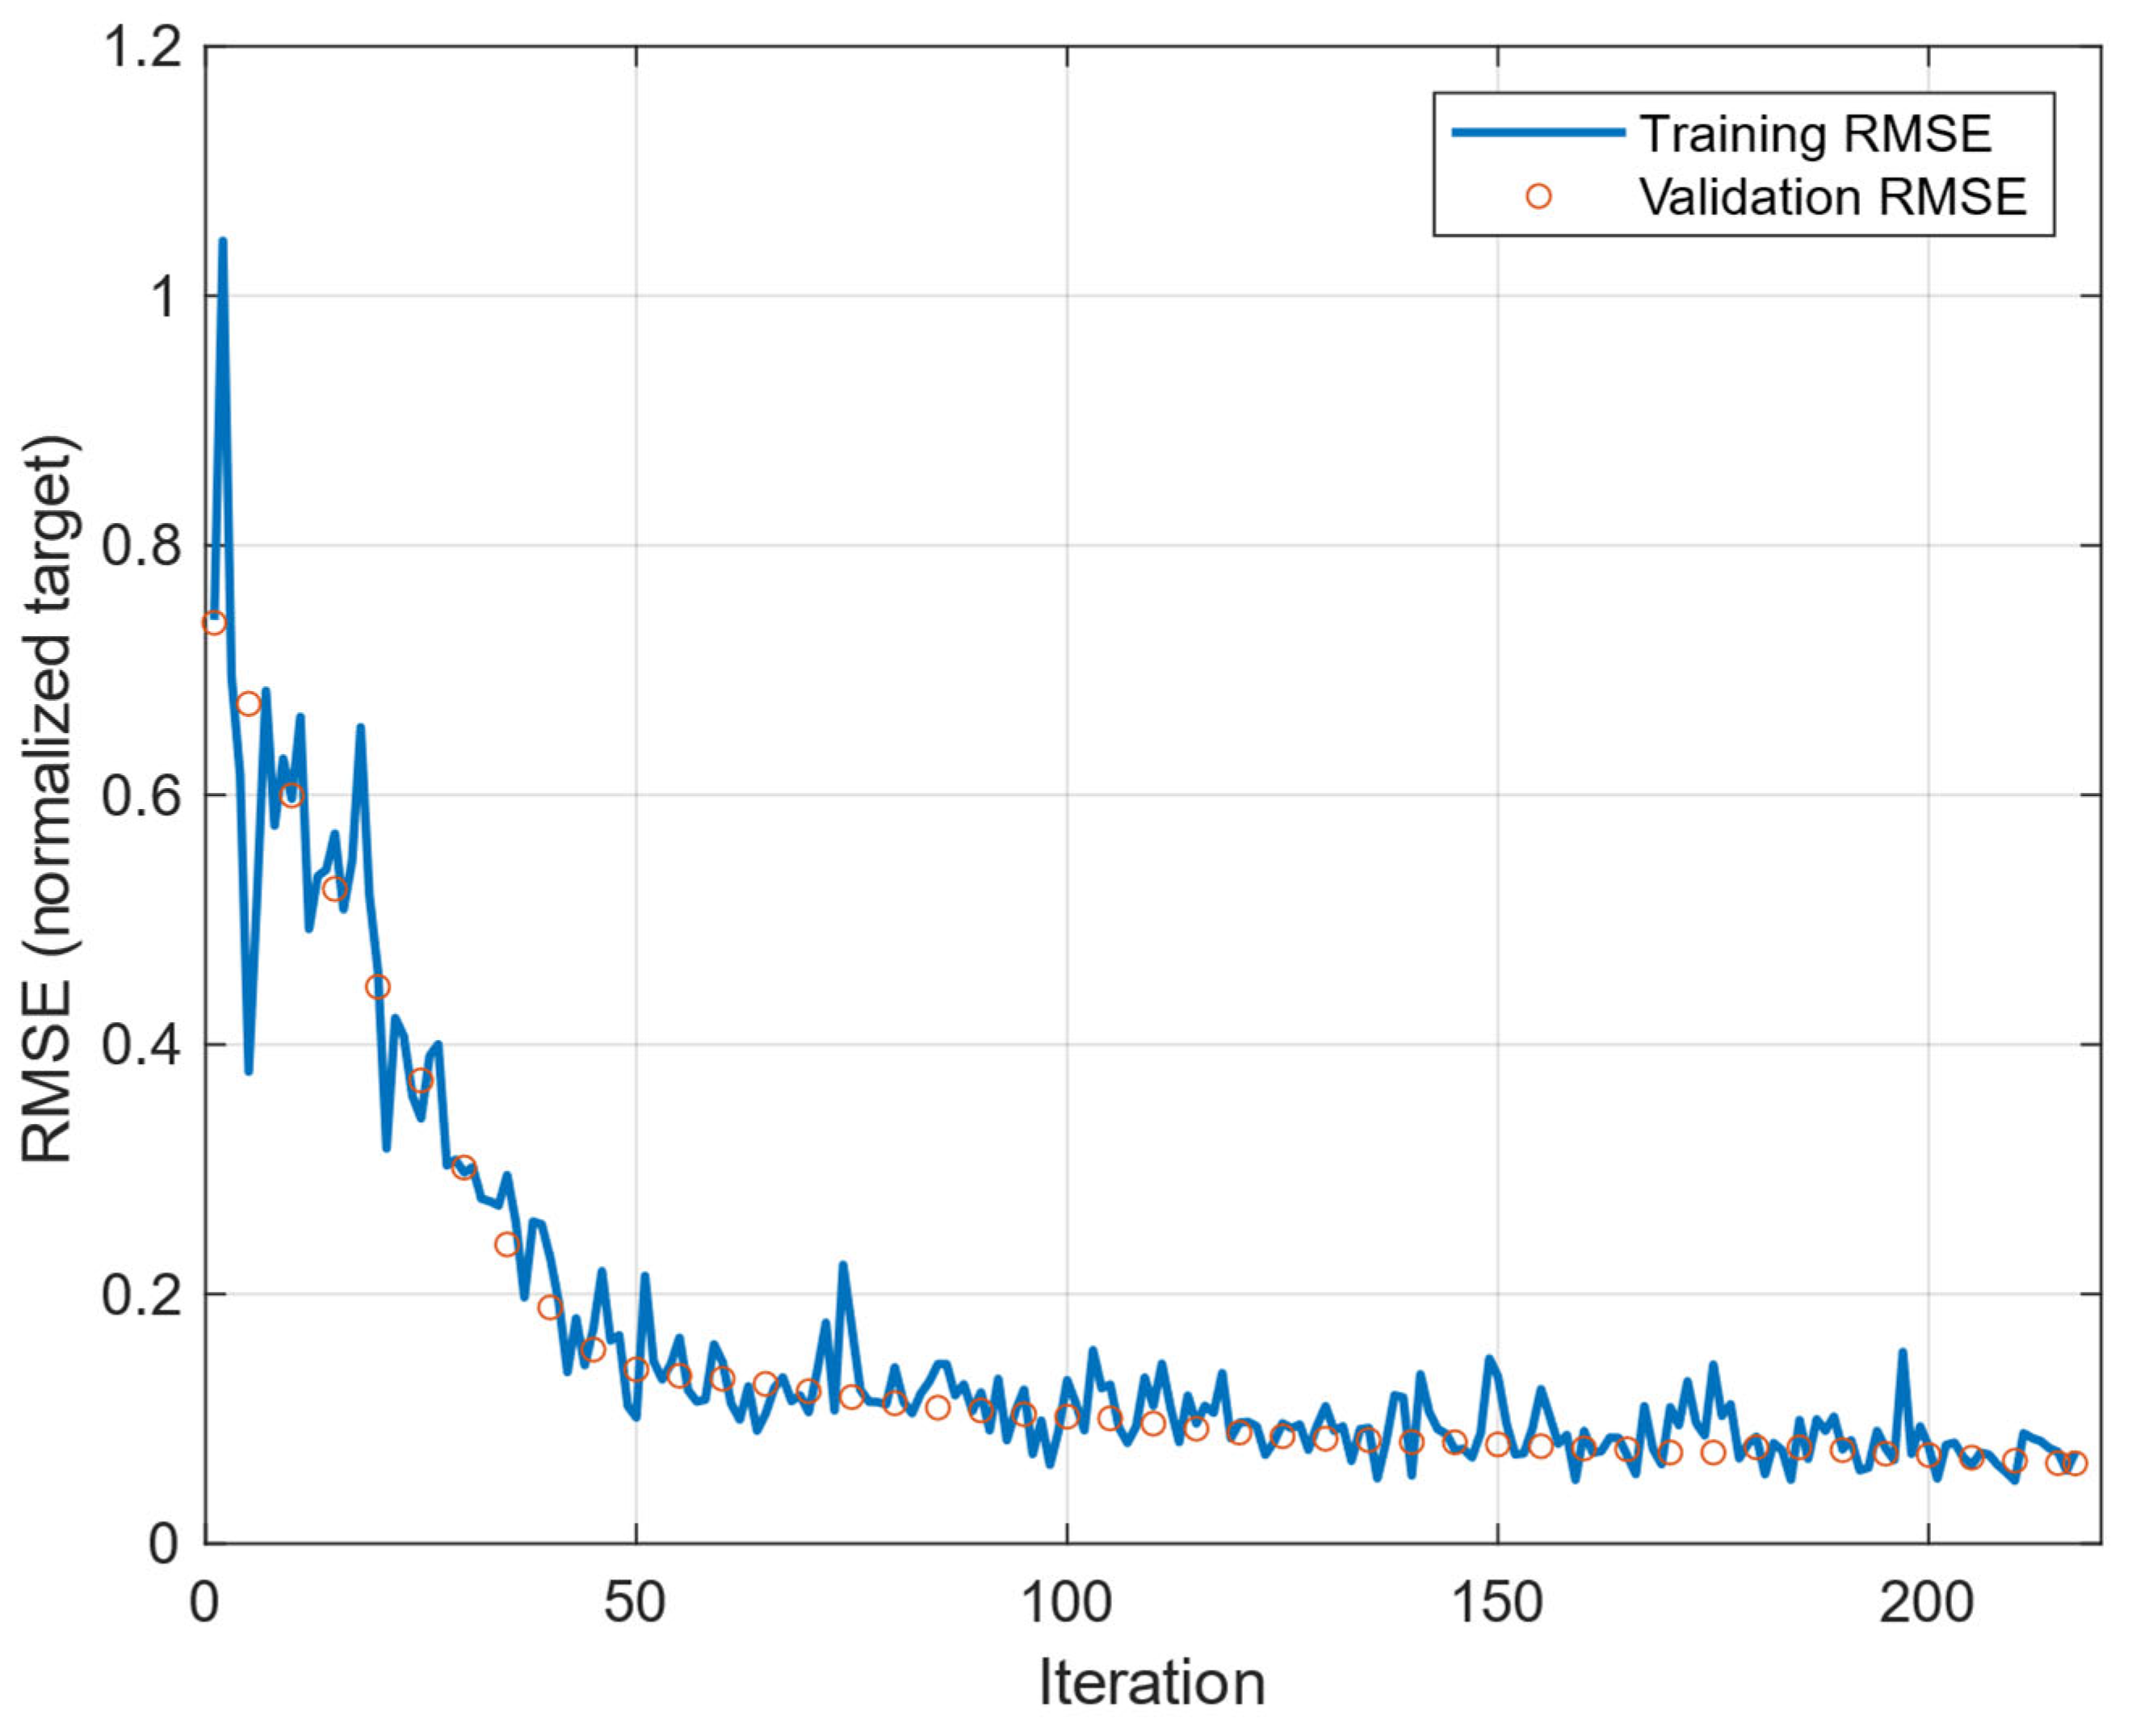
The trained NN was then used to predict the remaining energy values across the entire interpolated grid, effectively generating continuous maps of geothermal potential. Performance metrics such as the root mean square error (RMSE) and coefficient of determination (R
2) were calculated on the validation (RMSE of 0.0485 and R
2 of 0.997) and test sets (RMSE of 0.0586 and R
2 of 0.996) for the final network (see
Figure 8).
Model robustness for such a setup was evaluated via repeated random train/validation/test splits (Monte-Carlo cross-validation, 10 repeats). For each split, the network was trained using the validation set for monitoring, and performance was reported on R
2 in
Table 4.
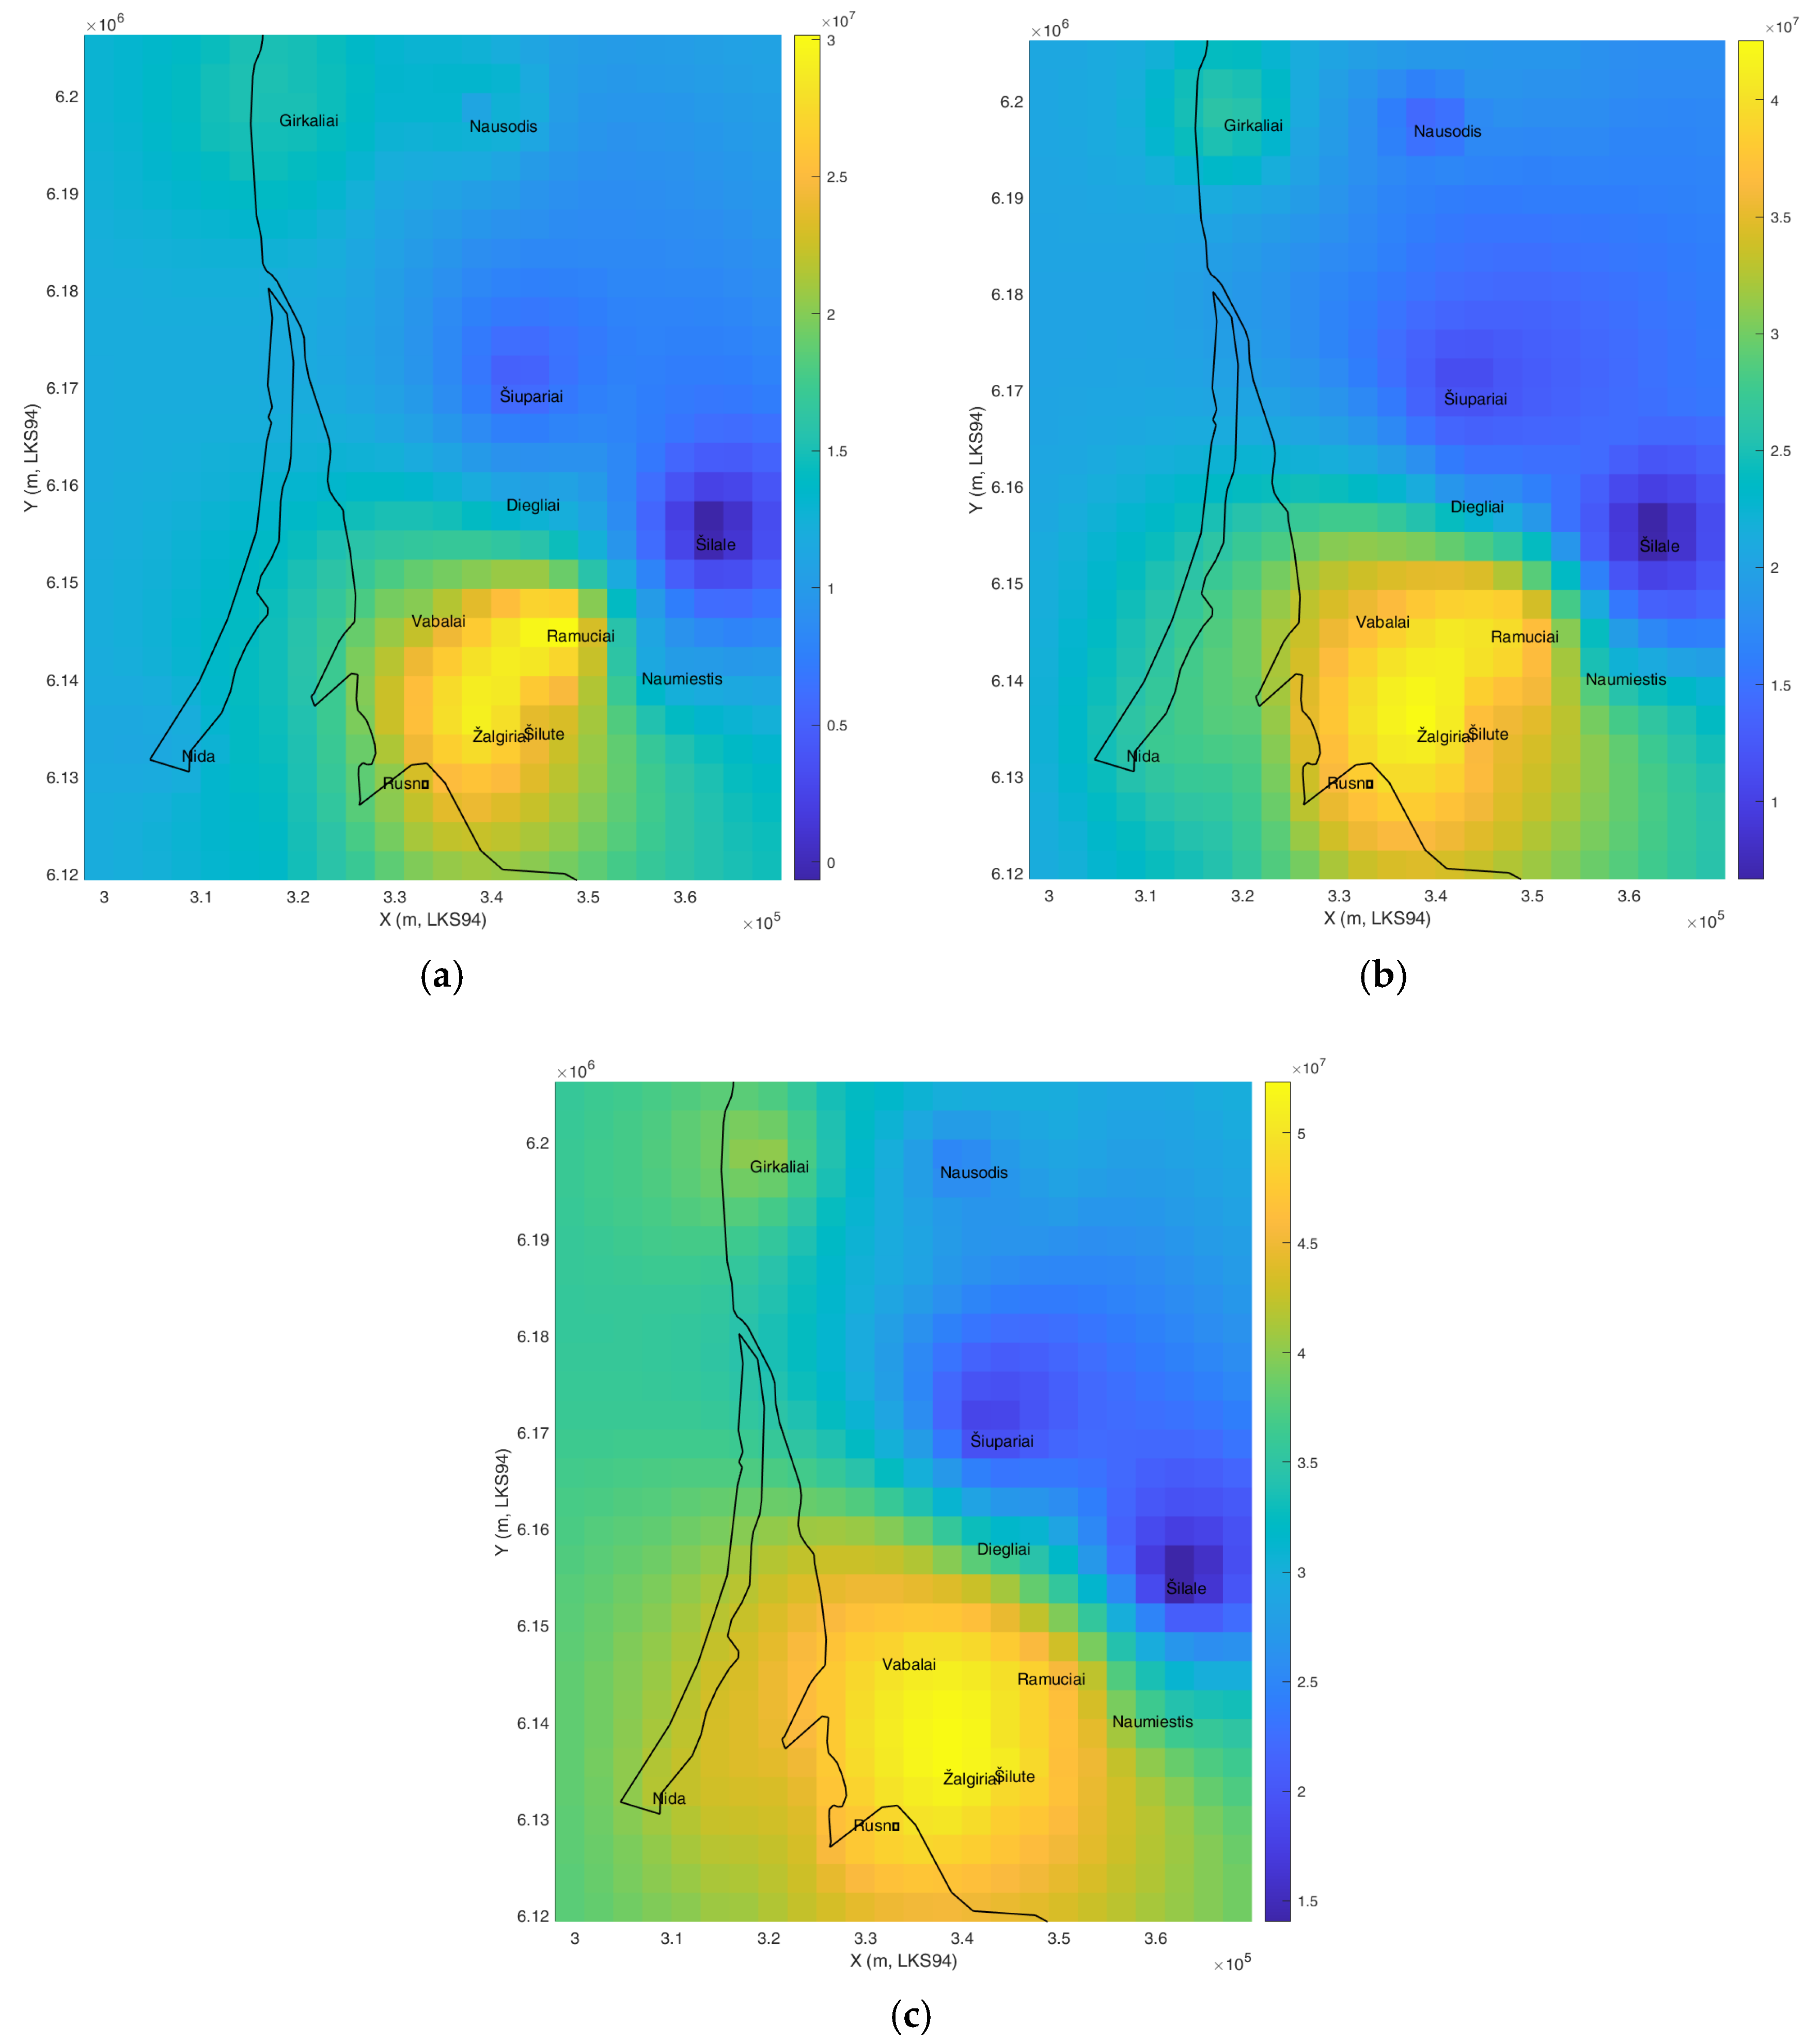
The results were visualized by overlaying the predicted energy distribution maps onto the Lithuanian border (
Figure 9). This was implemented in the script, which utilized shapefile data of Lithuania, reprojected into LKS94 coordinates. Energy distribution maps were rendered as color surfaces with national boundaries plotted on top to preserve the geographic context.
3.4. Geothermal Map
Figure 9 presents regional maps of the cumulative extracted-energy indicator for the low, mid, and high scenarios. The three cases differ not only in absolute scale but also in distribution shape, which is an expected consequence of the adopted uncertainty perturbations and the definition of the mapped indicator. In the present workflow, the mapped value is the cumulative thermal energy extracted under a standardized doublet configuration, integrated over time until the simulated net thermal power falls below 1 MW. Because this endpoint depends on both the instantaneous extraction rate and the duration for which the system remains above the cutoff, changes in reservoir properties can influence the indicator through two coupled mechanisms: by modifying the flow rate driven by the imposed pressure differential and by changing the rate of thermal drawdown and therefore the time to reach the cutoff.
Locations characterized by comparatively favorable properties (such as higher transmissibility or higher initial temperature) tend to naturally exhibit a larger absolute change in cumulative energy than locations with poor properties. This effect arises because higher permeability and NTG increase the circulation rate under fixed bottom-hole pressure constraints, while higher thickness and porosity increase effective storage and delay thermal decline, prolonging operation above the cutoff. This increase in reservoir properties seems to have a rightward skewing effect on the distribution density of the resulting extracted energy estimate. The low case map tends to have values on the lower part of its spectrum, whereas in the high case, the combined effect of higher flow capacity and delayed thermal drawdown extends the productive lifetime of the standardized doublet on the higher part.
Spatially, the maps exhibit coherent regional patterns rather than noise, reflecting the spatial structure inherited from the kriged input-property fields. The higher potential zone in the southern part of the map is consistent with the underlying combination of elevated temperatures and favorable reservoir parameters prescribed by the kriging-based interpolation for that region under standardized assumptions. However, areas closer to well control points are more strongly constrained by observations, whereas areas farther from control points are increasingly influenced by spatial extrapolation and thus have higher interpolation uncertainty. Accordingly, locations that appear to be highly favorable but are also associated with weaker data support should be prioritized as targets for a follow up data acquisition, rather than being treated as definitive development candidates. Nevertheless, the southern part of the map shows more promising areas for the geothermal exploration, which is exciting due to there being a considerable population of local residents. This is, however, to be taken with a grain of salt, as the data for this part of the map was taken out of a singular meta-study that was not very rigorous in its parameter value sourcing.
From a computational perspective, the study also illustrates the practical benefit of surrogate acceleration for regional screening. At this study scale, a single physics-based simulation requires approximately 1.5 min, whereas surrogate inference is effectively instantaneous, easily saving over 33.5 h in this small study alone. Therefore, replacing a full domain simulation with a surrogate yields a substantial reduction in computational cost while preserving consistency with the mechanistic simulator under the standardized assumptions. This advantage becomes increasingly significant as either the spatial resolution is refined or the mapped domain is expanded. For example, extending the analysis to the entirety of Western Lithuania would result in a disproportional increase in the number of simulations required. In contrast, the NN prediction time remains essentially negligible, making it a powerful tool for large-scale mapping and scenario exploration.
4. Discussion
The regional maps developed in this study are screening-level indicators of geothermal prospectivity under a consistent, standardized set of subsurface and operational assumptions. Within this scope, the primary contribution is not the estimation of site-specific reserves, but the integration of sparse and heterogeneous legacy datasets, geostatistical spatialization, physics-based performance simulation, and surrogate modeling into a single workflow that is capable of producing regional-scale decision support products. The resulting spatial patterns are consistent with the expected regional context of Western Lithuania [
24], where elevated temperatures and favorable conditions have been repeatedly associated with the southwestern geothermal anomaly and the broader Cambrian hydrothermal complex. Accordingly, the maps are most appropriately used to prioritize areas for follow-up investigation, rather than as definitive predictions for individual projects.
A key outcome is that the workflow enables relative comparison across the region while preserving the physical consistency of a mechanistic simulation model. In this respect, the approach aligns with widely used regional screening strategies in geothermal assessment, where simplified models and standardized development concepts are applied to identify promising zones before detailed structural interpretation and project-specific design. Compared with studies that directly estimate geothermal resources through detailed 3D geological modeling or dense well control [
7,
25], the present assessment operates under markedly more limited data conditions. The strength of the workflow is therefore its capacity to generate a coherent, reproducible regional synthesis from incomplete archival information and to provide a transparent pathway for progressive refinement as new data becomes available. The classical assessment literature emphasizes that geothermal resources can be appraised by several method families, including heat-flow methods and volumetric methods, with the latter being widely adopted for regional-scale assessments when subsurface constraints are limited [
26]. In the United States, the USGS assessment workflow similarly relies on the volume method for estimating recoverable heat from the thermal energy available in a reservoir, combined with uncertainty treatment and resource models that are aligned with field knowledge [
27]. In Europe and global contexts, geothermal atlas-style products are commonly presented as potential maps that are intended to support early decision-making and to guide subsequent data acquisition and detailed modeling, rather than to replace it [
28]. The assessment methodology is similarly based on a small number of parameters, in order to evaluate regions with very limited data coverage as well. Within this landscape, the contribution of the present work is to demonstrate an improved and yet equally implementable workflow that produces a coherent screening product under the specific constraints (such as that of Western Lithuania), where information is frequently archival, heterogeneous, and not readily available in a digital form; in this respect, the study complements prior Lithuania-focused assessments of the regional anomaly and hydrothermal complexes by providing a unified mapping workflow oriented toward comparative prioritization.
The use of a neural network surrogate is aligned with a growing body of energy systems and subsurface studies [
29] in which surrogate models are employed to reduce the computational burden of repeated simulation evaluations (e.g., scenario analysis and optimization [
12]). In this study, the NN surrogate is included as a pragmatic component for regional evaluation, rather than as a substitute for physics-based modeling. Its role is to approximate the simulator’s input–output relationship and thereby accelerate the evaluation of multiple uncertainty cases over a spatial grid. When used in this manner, the surrogate supports scalability and rapid scenario analysis, which are commonly required for regional screening studies.
Several methodological considerations delimit the interpretation of the results. First, the underlying observational control is sparse and derived from heterogeneous legacy sources, which necessitated harmonization and the use of representative aggregated parameters. Second, a number of modeling choices (e.g., well configuration parameters, boundary conditions, bottom-hole pressure constraints, injection temperature, and the stopping criterion) were selected to standardize the regional comparison, rather than to optimize any specific field development scenario. Third, the long simulation horizons employed are valuable for illustrating long-term sustainability behavior in an idealized setting, but they should not be interpreted as being directly representative of economic lifetimes. For these reasons, the maps are best interpreted in relative terms, where the spatial distribution of higher and lower indicators is more robust than the absolute magnitudes. Moreover, the reported thermal energy and power indicators represent the heat carried by the produced brine, relative to the injected brine, and do not account for surface losses, conversion efficiency, or other project-specific constraints that are required for techno-economic valuation.
From an applied perspective, the results highlight a practical pathway for advancing geothermal planning in regions where subsurface information is fragmented, non-digital, or distributed across archival sources. The workflow presented here is intentionally modular: improved geological constraints (e.g., structural interpretation, fracture information, refined thermophysical properties, etc.) can be incorporated without altering the overall methodology. Future studies may therefore extend this screening assessment toward site-specific feasibility by integrating higher-resolution geological models, calibrated boundary conditions, and operational constraints that are linked to realistic project lifetimes and surface-system performance.
5. Conclusions
In summary, the principal findings are that a modular regional screening workflow can be implemented under sparse well control that is consistent with volumetric and other rougher screening-level estimates of the area. The resulting maps enable comparative spatial prioritization of Cambrian prospectivity, and surrogate modeling provides substantial computational acceleration while preserving consistency with the underlying physics-based simulator.
This study demonstrates a reproducible regional screening workflow for potential geothermal assessment in Western Lithuania under sparse and heterogeneous subsurface data availability. The workflow consolidates legacy well information into harmonized reservoir parameter tables, spatializes key properties using ordinary kriging with uncertainty multipliers, evaluates standardized doublet performance through physics-based simulation for a representative subset of the regional grid, and applies a neural network surrogate to extend the performance indicators over the full domain in feasible computational time. The framework is intentionally modular and can be refined as additional digital datasets become available, including improved geological constraints, updated thermophysical parameters, and more realistic boundary and operational conditions.
The resulting regional maps provide a comparative view of relative geothermal potential within the Cambrian reservoir system under a consistent set of development assumptions. In this screening context, the workflow integrates 12 compiled reservoir control points into a gridded regional representation and evaluates uncertainty through low, mid and high scenarios (±10%). Standardized simulations were performed for a subsection of grid locations, producing cumulative extracted energy indicators on the order of 105–107 MWh across uncertainty cases (reported as comparative indicators, rather than project-grade magnitudes). The neural network surrogate reproduced simulation outputs with high predictive agreement (test R2 = 0.996, cross-validation mean R2 ≈ 0.99), enabling near-instant regional inference after training. In practical terms, the surrogate reduced the computational cost substantially: a single physics-based simulation required approximately 1.5 min, whereas surrogate predictions were effectively instantaneous, yielding a time saving of >33 h for the present study scale alone and providing a clear pathway to larger regional evaluations.
Collectively, these results indicate that actionable regional prioritization can be achieved in data-limited settings by coupling uncertainty-aware spatialization with standardized mechanistic performance evaluation and surrogate acceleration, thereby improving the efficiency of follow-up targeting and early stage decision support.
Future research should focus on refining key assumptions, strengthening collaboration with relevant institutions to improve data accessibility and quality, and extending the screening indicators toward project-level feasibility. In particular, subsequent work should incorporate surface-system losses and equipment inefficiencies, quantify pumping and parasitic power, and integrate economic and technical feasibility analyses so that the regional screening products can more directly inform development planning and investment decisions.