Article

Effects of Internal Fat Content and Screw Configuration on Extrusion Traits and Kibble Characteristics of High-Protein, Low-Starch Fish Feed

by
Lucas Bassi Scarpim
*,
Mayara Aline Baller
,
Leticia Graziele Pacheco
,
Stephanie Souza Theodoro
,
Dalton José Carneiro
and
Aulus Cavalieri Carciofi
Department of Animal Science, School of Agricultural and Veterinary Sciences, São Paulo State University (UNESP), Jaboticabal 14884-900, SP, Brazil
*
Author to whom correspondence should be addressed.
Processes 2026, 14(2), 310; https://doi.org/10.3390/pr14020310
Submission received: 8 December 2025 / Revised: 6 January 2026 / Accepted: 13 January 2026 / Published: 15 January 2026
(This article belongs to the Section Biological Processes and Systems)

Abstract

In aquaculture, feed production influences nutrition, performance, water quality, and overall profitability. This study evaluated the effects of three levels of internal fat (IF), resulting from the inclusion of 0%, 2%, or 4% fat in the preconditioner during extrusion, and their interaction with two extruder screw configurations: medium-shear (MS) and high-shear (HS), on kibble physical quality and extrusion parameters. Increasing IF resulted in a quadratic increase in amylose–lipid complexation under the HS configuration (p = 0.030; r2 = 0.9) and a linear reduction (p < 0.001) in specific mechanical energy (SME) with a strong negative Pearson correlation (r −0.9; p = 0.009) in both configurations. Fat inclusion also reduced mass temperature and die pressure (p < 0.05), leading to lower starch gelatinization degree (p < 0.05) from 87.9 ± 0.6% to 83.4 ± 0.3% in MS configuration and 95.6 ± 0.7 to 86.3 ± 0.8% in HS configuration, increased bulk and piece density (p < 0.001), and reduced radial expansion (p < 0.001). These changes decreased floatability (p < 0.05) and water stability, increasing mushiness (p < 0.01). Increased shear partially improved SME transfer, starch cooking, expansion, floatability, and mushiness; however, the negative effects of 4% IF could not be fully mitigated. Overall, higher IF compromised kibble structure, starch gelatinization, and floatability, while screw configuration resulted in only a limited compensatory effect.

1. Introduction

The growing global demand for aquaculture products has intensified the need for efficient feed formulation and processing strategies that optimize nutritional performance, kibble quality, and environmental sustainability [1]. Feed production is an essential component of aquaculture systems because nutrient requirements, feeding behavior, and digestive capacity vary widely among fish species [2]. Therefore, controlling the physical characteristics of extruded feeds, including bulk density, expansion, texture, integrity, and floatability, is important, as these attributes directly influence feed intake, water stability, and overall production efficiency [3,4,5].
Extrusion cooking is one of the most applied technologies in fish feed manufacturing due to its capacity to modulate the physical properties of the final product [6,7,8,9]. Among the factors, the configuration of the extruder screw, including its geometry, use of cut or uncut elements and steam-lock arrangement are key determinant of specific mechanical energy (SME) application and overall extrusion performance [10,11]. High-shear screw profiles promote greater mechanical energy input and cooking, whereas lower-shear configurations transfer less mechanical energy and, when combined with high-fat and low-starch formulations, tend to produce denser and less expanded kibbles [11,12]. Consequently, screw design is fundamental in determining kibble density, starch gelatinization, texture, expansion, overall kibble quality, and floatability [11,13,14]. An appropriate screw configuration optimizes processing performance, enhances physical and nutritional quality, and minimizes environmental impact [11,15].
In practice, the quality of extruded feeds is determined by the interaction between formulation characteristics and processing conditions [16]. Key formulation-related factors include lipid content [8], protein concentration [17], starch level and functionality [18], and feed moisture [19], which collectively influence melt viscosity, gelatinization potential, and structural development during expansion. From a processing perspective, SME, barrel temperature profile, moisture input, die pressure, screw geometry, and shear distribution are determinants of bubble formation, expansion, bulk density, texture, and water stability [10,20]. Recent studies consistently demonstrate that excessive lipid levels decrease friction and energy transfer and inadequate shear or moisture management limits starch transformation and compromises kibble integrity and flotation [8,21,22].
Beyond mechanical configuration, diet composition strongly influences extrusion parameters [23]. Lipids are important nutrients in fish diets, particularly for marine and carnivorous species that have limited capacity to utilize carbohydrates [24], as they provide a concentrated energy source [25], enhance feed palatability, and promote the absorption of fat-soluble nutrients [2]. From a processing standpoint, however, lipids act as lubricants within the extruder barrel and screw channel, reducing friction, mass viscosity, and mechanical energy transfer [23,26]. As a result, high levels of internal fat (IF) tend to decrease starch gelatinization, reduce expansion, increase kibble density, and impair structural integrity and quality [11,15,27].
Although previous research shows that excessive IF reduces kibble expansion and physical quality [12,28], the interaction between IF content and screw configuration is still not fully understood. This knowledge gap is particularly relevant for high-protein, low-starch formulations typical of carnivorous fish diets, such as Pseudoplatystoma reticulatum, Salminus brasiliensis, and Crenicichla lacustris, where the limited amount of starch restricts the potential for structural expansion during extrusion [5,29,30]. Thus, the central research question addressed in this study is the insufficient practical and mechanistic understanding of how increasing internal fat levels, under different shear applications, influence thermo-mechanical energy transfer and, consequently, the structural development and functional performance of extruded fish kibbles.
Therefore, the aim of this study was to evaluate the effects of three levels of IF content and two screw configurations in the extrusion of a high-protein, low-starch fish diet on processing parameters, kibble macrostructure, starch gelatinization, mushiness, and floatability rate.

2. Materials and Methods

The processing study was conducted in the extrusion laboratory of the Sao Paulo State University (UNESP), Jaboticabal, Sao Paulo, Brazil.

2.1. Experimental Design, Treatments, and Screw Configuration

The study was conducted using a completely randomized design and followed a factorial arrangement of treatments with three levels of mass IF content and two extruder screw configurations, totaling six experimental treatments. To simulate the effect of different IF levels, poultry fat was injected into the preconditioner in three different amounts: 0%, 2% and 4% of the dry recipe, on an as-fed basis. The IF levels were selected based on previous evidence, where Guy [30] demonstrated that fat levels greater than 2% reduce friction, SME transfer, and starch dispersion, negatively affecting expansion. Thus, 0% served as a control, 2% represented an intermediate level expected to produce the initial lubrication effects, and 4% was included to highlight the detrimental impacts on extrusion performance and kibble quality.
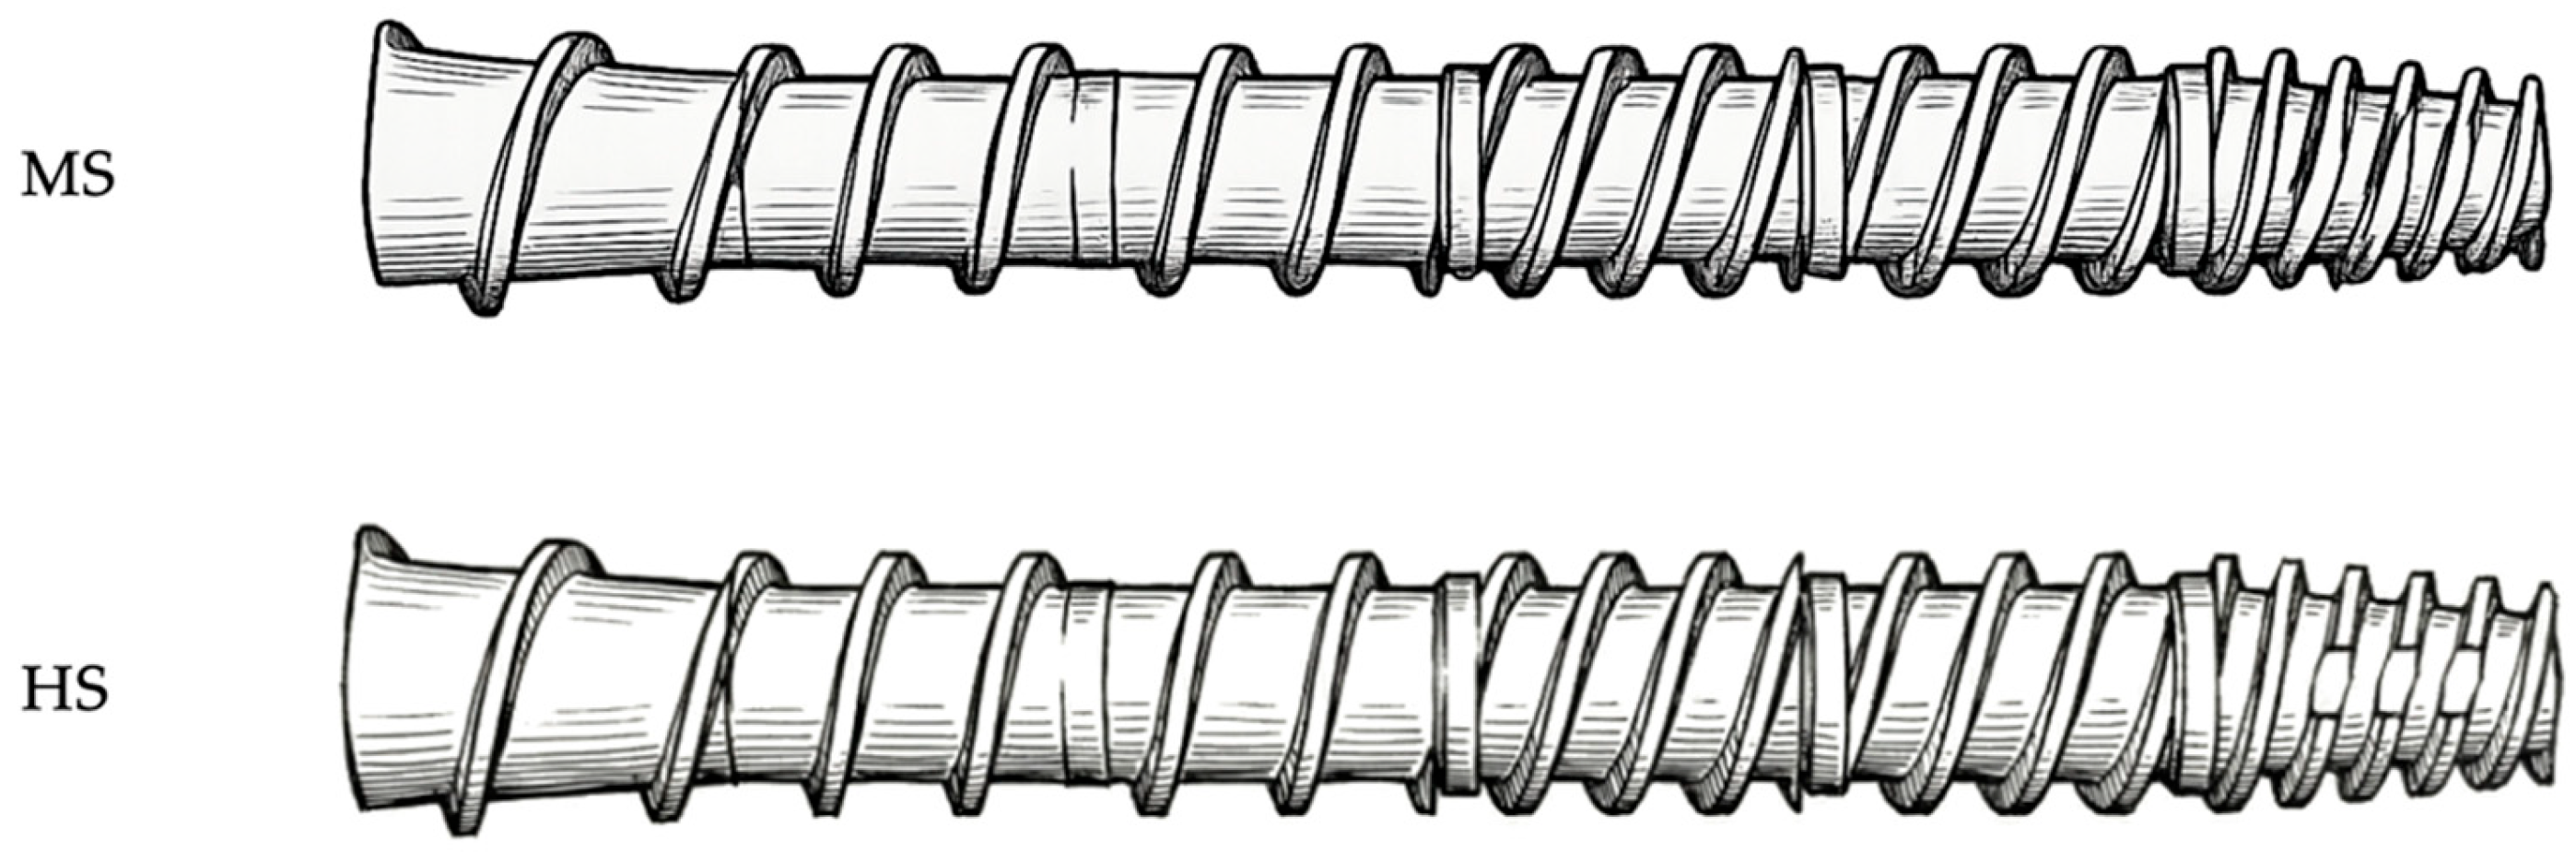
The two extruder screw configurations differed in the last two shear locks used and in the fourth screw design (Table 1; Figure 1). The extruder screw has 5 sections, a base of 60 mm, a diameter of 80 mm and a length of 800 mm. The medium shear (MS) treatment was configured as follows: first section—single flight screw and no steam lock; second section—single flight screw and small steam lock; third section—double flight uncut screw and small steam lock; fourth section—double flight uncut screw and small steam lock; fifth section—double flight cut cone screw. The high shear (HS) treatment was configured as follows: first section—single flight screw and no steam lock; second section—single flight screw and small steam lock; third section—double flight uncut screw and medium steam lock; fourth section—double flight uncut screw and medium steam lock; fifth section—double flight cut cone screw

2.2. Experimental Diets, Operation Conditions and Sample Collection

A feed for carnivorous fish was formulated to present high protein and low starch contents, with 8% internal lipid content (Table 1). The ingredients were weighed, mixed and ground in a hammer mill (Tigre Mixing and Grinding System—Moinhos Tigre Ltd., Sao Paulo, Brazil), operating at 3600 rotations per minute (rpm) with a screen sieve size of 0.8 mm.
The experimental diets were then extruded using a single screw extruder (Mex-250, Manzoni Industrial Ltd., Campinas, Brazil) with a capacity of 250 kg/h. A circular die with one opening of 4.5 mm in diameter was used, resulting in an open area of 15.9 mm2. Water and thermal energy by steam injection were applied only in the preconditioner, set for a mass temperature of approximately 90 °C and a mean mass retention time of 180 s. The extruder screw speed was set at 643 rpm for all treatments, and the cutting knife speed was fixed at 1368 rpm. Following extrusion, the extrudates were dried in a double-pass dryer at 110 °C for 28 min.
After a stabilization period of the extruder, defined as 60 min, all experimental diets were extruded for at least 60 min. The processing data and samples from the preconditioner, extruder, and dryer were collected every 15 min, resulting in a total of at least four collections per treatment, which were considered the experimental units. At each collection time, the following processing parameters were recorded: feed screw speed (rpm); preconditioner shaft speed (rpm); preconditioner steam flow (kg/h); preconditioner water flow (kg/h); preconditioner water temperature (°C); preconditioner discharge mass temperature (°C); extruder shaft speed (rpm); motor load (A); cutting knife speed (rpm); mass temperature before the extruder die (°C); mass pressure before the extruder die (bar); steam pressure (psig); ambient temperature (°C).
Kibble bulk density after extrusion and after drying (g/L) was recorded at each sampling time, measured as the weight of food corresponding to a volume of 1 L. The mass flow rate from the extruder was measured directly in a bucket at each sampling time. All samples collected from the preconditioner, extruder, and dryer at each observation time were stored at −20 °C for further analysis of dry matter content.

2.3. Chemical Analysis

The collected samples were thawed, homogenized, and ground in a knife mill (Mod MA-350, Marconi, Piracicaba, Brazil) fitted with a 1 mm screen sieve. After milling, the diets were analyzed following AOAC methods [31] methods to determine dry matter content (DM) by oven-drying (method 934.01); ash content by muffle-furnace incineration (method 942.05); crude protein content by the Kjeldahl method (method 954.01); crude fiber content (method 991.43); and fat content, which was measured both after acid hydrolysis (method 954.02) and by the ether-extract method performed without prior hydrolysis. The difference in lipid content between the methods was used to estimate the amount of complexed lipids. Dietary fiber (method 985.29) was measured using a combination of enzymatic and gravimetric procedures. Starch content was determined according to the method described by Hendrix [32]. To evaluate extrusion processing, the degree of starch gelatinization was measured by the amyloglucosidase method [33]. All analyses were carried out in duplicate and repeated when the differences between the results exceeded 5%.

2.4. Calculation Procedures

The SME applied during extrusion was calculated according to Riaz [11] for each treatment, as described below:
S M E   ( K W h / t )   =   ( 3   ×   V o l t a g e   ×   ( A w     A e )   ×   ( c o s   φ ) / M
where Voltage = 220 V; Aw = torque load working amperage; Ae = no torque load working amperage; cos φ = power factor; and M = mass flow rate from extruder (kg/h).
The specific thermal energy (STE; kW-h/ton) was determined by calculating the net thermal energy contributed by steam absorption per unit mass inside the preconditioner, divided by the raw material throughput (ton/h). Net steam absorption (kg/h) was calculated using a mass balance method. The corresponding thermal energy was obtained by multiplying the steam enthalpy (kJ/kg) from steam tables and adjusting it for the average mass temperature inside the preconditioner. Furthermore, the total specific energy (TSE; kW-h/ton) was computed as the sum of SME and STE, as described below:
Preconditioner mass balance equation:
M r a w   +   M w   +   M s   =   M s l   +   M p c
where Mraw = raw material mass; Mw = water mass; Ms = steam mass; Msl = steam loss mass; Mpc = preconditioner mass flow rate; Mf = final mass flow rate from extruder.
Extruder mass balance equation:
M p c   +   M w   =   M s l   +   M f
where Mpc = preconditioner mass flow rate; Mw = water mass; Msl = steam loss mass; Mf = final mass flow rate from extruder.
Preconditioner energy balance:
Q R   +   Q W   +   Q S   =   Q P c   +   Q S L   +   Q H L   +   Δ h
where QR = Raw material heat capacity; QW = Water input heat capacity; QS = Steam input heat capacity; QPc = Preconditioner product heat capacity; QSL = Steam loss heat capacity; QHL = Preconditioner heat loss by convection; ∑Δh = Reaction energy (kJ kg−1).
Extruder energy balance:
Q P c   +   Q W   +   Q s m e   +   Q b a r r e l   =   Q e x   +   Q S L   +   Δ h
where QPc = Preconditioner product heat capacity; QW = Water input heat capacity; Qsme = Mechanical energy amount; Qbarrel = Extruder heat loss by convection; Qex = Extruder product heat capacity; QSL = Steam loss heat capacity; ∑Δh = Reaction energy (kJ kg−1).
The amount of heat (Q) was obtained from the formula:
Q   =   m × c × T
where m = mass; c = specific heat capacity; T = temperature.

2.5. Kibble Macrostructure

For the macrostructure evaluation of the kibbles, 20 kibbles from the dryer of each treatment collection were used. Their length (le), diameter (de) in millimeters and mass (m) in gram (g) were measured. These values were used to calculate the radial expansion (RE) in mm, specific length (Lsp) in mm/g, and specific density (p) in kg/m3; according to the following equations:
R E = d e 2 / d d 2
L s p = l e / m e ( m m / g )
p = 4 m / ( π × d e 2 × l e )
where dd = die diameter.

2.6. Mushiness and Floatability Rate

The floatability rate (F) was determined using a methodology adapted from De Cruz et al. [14] and performed with dried kibbles from each treatment collection. The test was carried out in quadruplicate, with 100 kibbles (Fi) per replicate placed in a beaker containing 1000 mL of distilled water at 25 °C. After 20 min, the number of kibbles that sank in the container (Ff) was counted and F was calculated by subtracting the number of sunken kibbles from the initial amount, as shown in the equation below:
F   =   F i     F f
where Fi = 100 kibbles; Ff = Number of kibbles that sank after 20 min.
Static mushiness represents the overall capacity of a kibble to absorb water while maintaining its structural integrity over time under static conditions (i.e., without agitation). The static mushiness evaluation was carried out in four replicates per treatment. For each assay, 460 mL of distilled water at 25 °C and 30 g of kibbles were added to a beaker. Subsequently, it was allowed to stand for 60 min, after which the content of each beaker was poured into a sieve with openings 25% smaller than the dry kibble size. The sieve had been previously moistened, rinsed and tared. The material retained on the sieve was then weighed and recorded.
Complementary mushiness represents the extent to which a kibble loses structural integrity when immersed in water under static conditions. The complementary mushiness test was conducted with five kibbles per replicate and four replicates per treatment. Each kibble was placed in a plastic container with 50 mL of distilled water at 25 °C for 20 min. After this period, the kibble shape was evaluated by comparison with its initial form, and it was evaluated whether any particles had detached or dissolved.
The interpretation of this evaluation was performed qualitatively using scores assigned to each kibble. The scores were assigned on a scale of 1 to 5 where 1—the kibble increases in volume, floats, maintains its integrity, presents regular edges, and shows no detachment of particles; 2—the kibble increases in volume, floats, maintains its integrity, presents irregular edges, and shows slight detachment of particles; 3—the kibble increases in volume, sinks or floats, does not maintain its integrity, presents cracks, has irregular edges, and shows noticeable detachment of particles; 4—the kibble sinks, does not maintain its integrity, presents cracks, has irregular edges, and is partially disintegrated; 5—the kibble sinks and completely disintegrates. Each replicate received a cumulative score ranging from 5 (all kibbles scored 1) to 25 (all kibbles scored 5).

2.7. Statistical Analysis

The results of the extrusion process parameters, floatability rate, mushiness, starch gelatinization, lipid complexation, and macrostructure were evaluated using a 3 × 2 factorial arrangement, with three levels of mass IF content and two screw configurations, resulting in a total of six experimental treatments in a completely randomized design. The experimental unit was the treatment sampling, except for kibble macrostructure, where each individual kibble served as the experimental unit, with 20 replications per treatment. The assumptions of residual normality and homoscedasticity of variances were confirmed. Data were subjected to analysis of variance and the sums of squares of the model were separated into screw configuration, fat inclusion, and their interaction. When significant differences were found in the F test, the effects were evaluated using polynomial contrasts based on the fat inclusion. Values of p < 0.05 were considered significant. The analyses were performed using the Proc GLM procedure of SAS statistical software (SAS Institute, Cary, NC, USA, 2003) software version 3.6.3.

3. Results

The chemical composition of the extruded diets remained similar among treatments, except for lipid content, which increased linearly (p < 0.001) with the inclusion of fat in the preconditioner (Table 2).
Although the differences in crude protein content among treatments were not statistically significant, a downward trend was observed as IF level increased. This effect is likely associated with a fat dilution phenomenon, where the proportional increase in lipid content reduces the relative proportion of protein and other nutrients in the formulation. Since fat does not contribute to the nitrogen content measured by proximate analysis, increasing IF levels result in a lower crude protein percentage on a mass basis, without necessarily indicating true protein degradation or nutritional loss. A linear increase (p < 0.001) in dietary lipid levels was observed using both the acid-hydrolyzed fat method and the ether extract method performed without prior hydrolysis. A quadratic response (p = 0.030) in lipid complexation was observed under the HS configuration (Table 3), indicating interactions between formulation and shear affecting amylose–lipid complex formation.
Preconditioner temperature and discharge moisture showed no significant differences among treatments (p > 0.05; Table 4). Similarly, product moisture at the extruder outlet did not differ between screw configurations (p > 0.05). However, the increase in IF content had a direct effect on extrusion behavior, whereby product flow rate increased linearly (p = 0.022), while mass pressure before the die decreased linearly (p = 0.020), regardless of screw configuration. Increasing IF also resulted in a linear reduction in motor amperage and mass temperature before the die in both MS and HS configurations (p < 0.05), consistent with lubrication effects during extrusion.
The reduction in motor amperage directly resulted in a significant linear decrease in SME (p < 0.001) for both screw configurations. Although STE increased linearly (p = 0.006; Table 5) and SME decreased linearly, this led to a proportional increase in the STE/SME ratio (p < 0.001). Due to the reduction in SME, the overall TSE (SME + STE) decreased linearly with increasing IF content (p < 0.001), indicating a reduction in mechanical–thermal input to the mass.
Kibbles’ physical properties were directly affected by the increase in dietary lipid content. Bulk density increased linearly before and after drying in both configurations (p < 0.001), while specific kibble density showed the same pattern (p < 0.001). Radial expansion decreased linearly (p < 0.001) as IF increased, consistent with reduced TSE application. Kibble macrostructure and quality parameters were also affected (Table 6). Starch gelatinization, floatability rate, and static mushiness decreased linearly (p < 0.05) in both screw configurations as IF increased. Static mushiness, which represents kibble water absorption capacity, reduced linearly (p < 0.05), while complementary mushiness increased linearly (p < 0.001) in both screw configurations, indicating reduced structural integrity of the kibble.
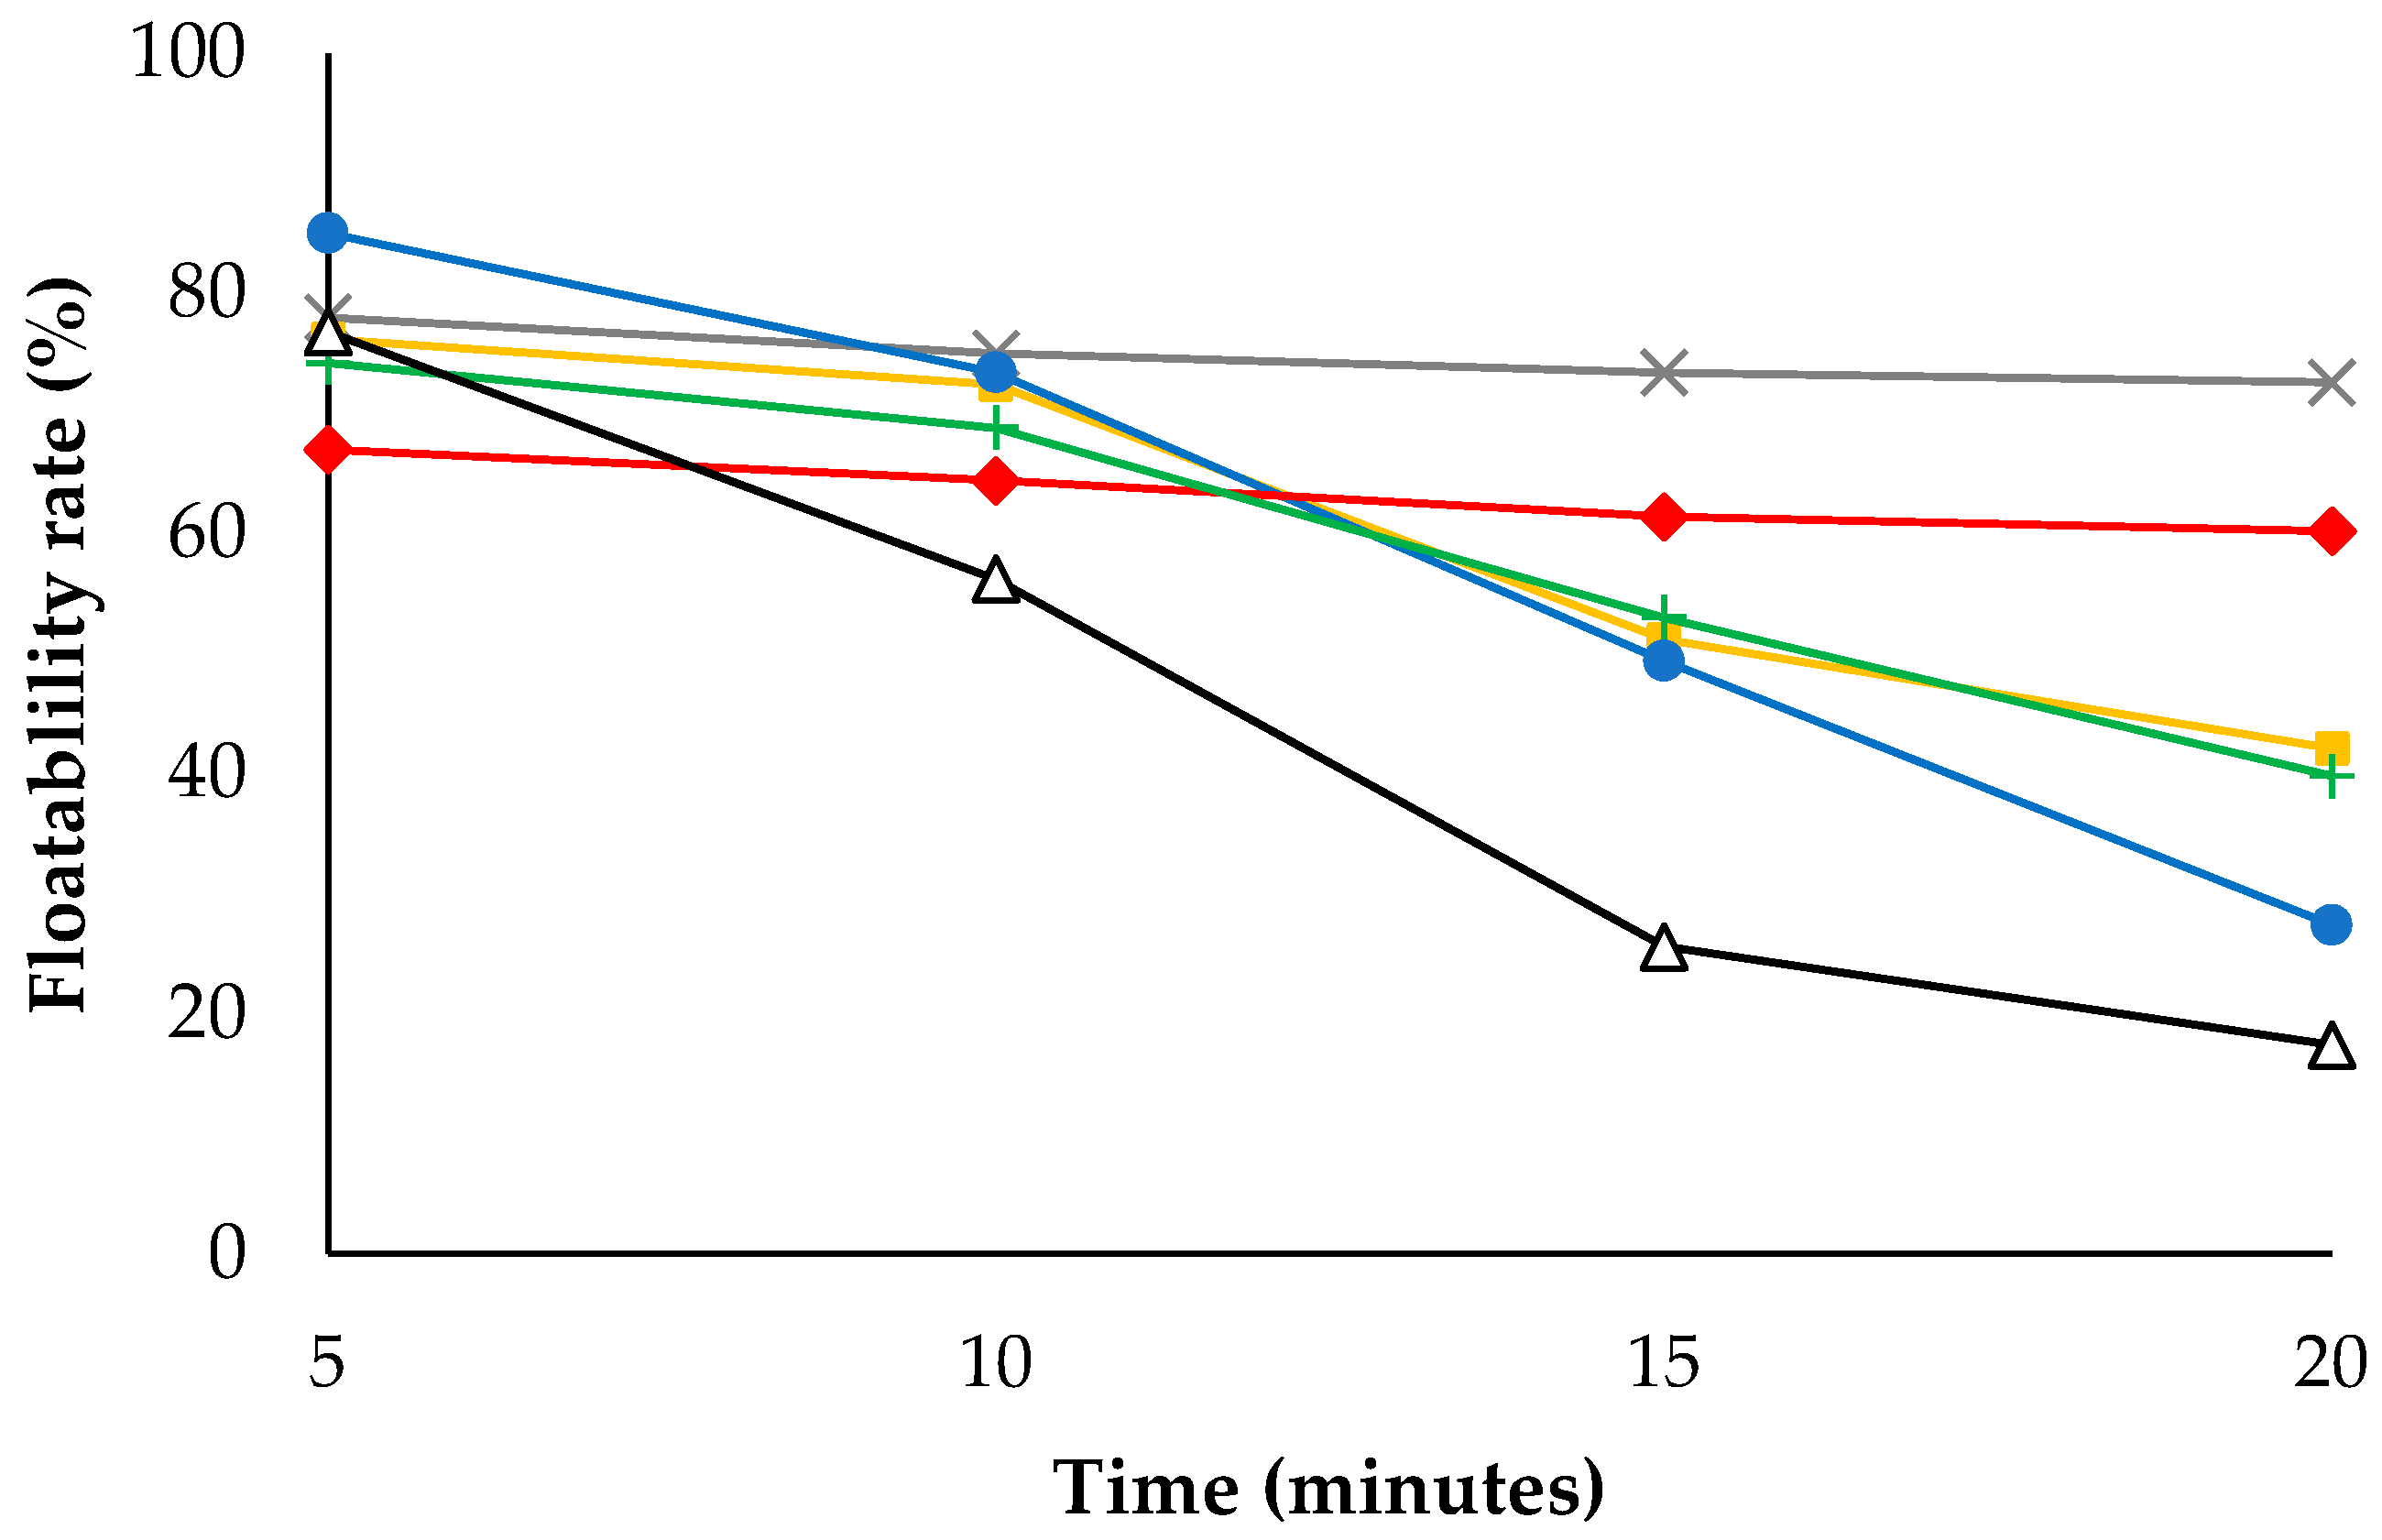
Floatability dynamics during the 20 min test (Figure 2 and Table 6) further reflected the structural changes induced by increasing IF content. In the MS configuration, floatability decreased linearly (p < 0.001) with increasing fat inclusion, declining from 60.2% at 0% fat to 39.8% at 2% fat and 17.4% at 4% fat. Similarly, in the HS configuration, floatability also decreased as IF content increased, dropping from 72.6% at 0% fat to 42.1% at 2% fat and 27.4% at 4% fat (p < 0.001). Across all fat inclusion levels, the HS configuration consistently resulted in higher floatability values than the MS configuration, although this difference did not fully offset the negative effects of increased IF content. The lowest floatability was observed in the MS treatment with 4% fat, while the highest value occurred in the HS configuration without fat inclusion.
Pearson correlation (r; Table 7) demonstrated strong, consistent relationships between IF inclusion, SME, and kibble quality traits. Increasing IF levels showed a strong negative correlation with SME (r −0.9; p = 0.009). As a consequence, starch gelatinization decreased proportionally (r −0.8; p = 0.037), while key structural quality indicators such as floatability (r −0.8; p = 0.046) and radial expansion (r −0.9; p = 0.035) were also negatively affected. Static mushiness increased as fat inclusion increased (r −0.9; p = 0.044), whereas complementary mushiness showed a positive association (r +0.8; p = 0.048), indicating weaker pellet integrity. In relation to bulk density, it increased linearly with fat inclusion (r +0.9; p = 0.038), reinforcing the loss of expansion capacity.
When SME was used as a predictor, higher SME was positively correlated with starch cooking (r +0.8; p = 0.048), floatability (r +0.9; p= 0.047) and radial expansion (r +0.9; p = 0.026). Similarly, SME was positively associated with static mushiness (r +0.8; p = 0.048) and negatively associated with complementary mushiness (r −0.9; p = 0.041), indicating hardness kibbles under higher energy processing. Bulk density decreased as SME increased (r −0.8; p = 0.039), confirming that greater energy application enhanced expansion.

4. Discussion

In extrusion, components such as lipids, proteins, carbohydrates, and fibers affect the thermo-mechanical behavior of the mass and, consequently, the characteristics of the final kibble [11]. In the present study, increasing fat inclusion in the preconditioner produced a clear linear increase in the dietary lipid content of the extruded diets, as expected. In addition, a quadratic response in amylose–lipid complexation was observed, with the HS configuration resulting in approximately 27% and 11% greater complexation at intermediate inclusion levels. This pattern suggests that IF availability and shear conditions interact to favor the formation of amylose–lipid complexes during processing.
The poultry fat included during preconditioning is mainly composed of long-chain fatty acids (C16–C18), characterized by a predominance of monounsaturated fatty acids, predominantly oleic acid (18:1n-9; approximately 37%), followed by linoleic acid (18:2n-6; approximately 24%) and moderate levels of saturated fatty acids, mainly palmitic (16:0; approximately 21%) and stearic acid (18:0; approximately 6%) [34]. Therefore, this lipid source represents a matrix rich in long-chain monounsaturated fatty acids, with a relevant polyunsaturated fatty acids n-6 fraction and comparatively lower saturated fatty acids contribution. Previous literature [7,35] indicates that long-chain fatty acids tend to favor amylose–lipid complex formation, whereas the degree of unsaturation may influence complex stability and crystallinity due to steric effects. In this context, the predominance of C16 and C18 fatty acids in poultry fat is consistent with the amylose–lipid complexation patterns observed in our study.
Similar patterns were reported by Baller et al. [36] and Amft et al. [37], who observed that increasing the availability of fluidizing agents, such as water, enhanced mass flow and reduced structural development during extrusion. In the present study, the inclusion of fat likely produced a comparable effect, since fat acts as a lubricant agent [26]. The extent to which lipids become encapsulated within the molten starch matrix depends strongly on lipid type and extrusion conditions [23,38]. The proportion of free, unbound lipids depends on both extrusion temperature and SME, as higher SME values tend to disrupt lipid–starch associations and promote lipid separation from the expanding matrix [39].
De Pilli et al. [40] demonstrated that low moisture content is a key determinant of amylose–lipid complex formation. The present findings extend this understanding, indicating that, in addition to moisture, the combination of dietary lipid content and screw configuration influences the extent and stability of these complexes during extrusion. The quadratic response observed in this study can be attributed to excessive lubrication at the highest IF content and the highest level of fat inclusion, which reduced SME and consequently limited the formation of amylose–lipid complexes [10,36,41]. However, feed formulations with high lipid content are not suitable for extrusion, as excess lipids impair extruder performance [42].
Regarding the preconditioner parameters, feed rate, discharge temperature and moisture remained consistent throughout extrusion, as intended. Variations in conditioning parameters can alter SME application and, consequently, affect kibble macrostructure. Changes in feed rate alter hourly throughput, which increases or decreases motor load; since SME calculation is based on energy consumption relative to mass flow, fluctuations in throughput directly modify SME delivery. Likewise, moisture input (steam + water) has a fluidizing effect: it facilitates material transport, promotes starch hydration, and decreases friction against the screws and barrel, thereby lowering SME. Conversely, lower moisture levels increase resistance to flow and energy demand. Temperature behaves in a similar manner: higher conditioning temperatures soften the material and promote melting, reducing SME, while lower temperatures increase resistance and elevate SME. These combined effects influence melt rheology, bubble formation, gelatinization, expansion, and ultimately kibble macrostructure [11,36,43,44,45].
The increase in lubrication promoted by dietary fat reduces friction between feed particles and between the feed and the barrel–screw surfaces [11]. This decrease in friction reduces resistance to mass flow, SME transfer, and mass pressure before the die [12,28], which may result in increases in product flow rate [46]. The increase in product flow rate at 4% of fat inclusion can be attributed to a combined effect rather than exclusively to lubrication. As previously discussed, higher lipid content reduces friction at the screw–barrel interface and decreases internal particle–particle resistance, improving material mobility and conveying efficiency [30]. In addition to this rheological effect, it is important to note that fat was injected into the system as a percentage of the total mass feed rate, based on the reference condition (0% IF). Therefore, increasing IF also resulted in a proportional increase in the total mass entering the preconditioner and extruder [10].
The reduction in SME reflects a decline in mechanical energy efficiency during extrusion [47,48]. A similar result was reported when whole soybeans were incorporated into dog diets [12]. Such reductions in energy efficiency are undesirable in feed manufacturing because insufficient mechanical energy may compromise cooking effectiveness and, consequently, product quality [49].
In the HS screw profile at 0% and 2% IF, the higher efficiency in application of mechanical shear and energy transfer is due to the increase in the restriction in mass flow rate, which favored starch gelatinization and expansion [12]. However, at 4% fat inclusion, the lubrication effect of fat became predominant. The higher IF levels reduced screw–barrel friction and particle–particle resistance, thereby decreasing melt viscosity, die pressure, and SME input to the material [46]. As a consequence, the thermo-mechanical energy available for starch transformation becomes limited, restricting expansion even under a high-shear configuration. This behavior is consistent with extrusion literature in high-fat feeds [8,21,22], which reports that increasing lipid levels reduces SME, die temperature, starch gelatinization, and expansion due to the lubricating effect of fat [22]. Therefore, the reduced improvement of the HS configuration at 4% IF appears to reflect a process-limiting condition resulting from excessive lubrication rather than inefficiency of the screw geometry itself.
Furthermore, the STE/SME ratio increased as a consequence of the reduction in SME. As a result, TSE decreased linearly, indicating that the modest increase in STE, associated with changes in the specific heat of the diet related to fat inclusion, was insufficient to compensate for the loss of SME application. Both SME and STE contribute to the chemical and physical transformations occurring during extrusion, as these changes depend on the TSE applied [10,45,50]. Compared with SME, STE becomes more influential when formulations contain high levels of protein, fat, or fiber, because such ingredients require greater thermal input to achieve adequate structural and textural development [51].
Fat exerts an important influence on extrusion by coating feed particles, limiting moisture absorption, and reducing heat transfer, which can impair cooking [27]. Lipids tend to coat feed particles, reducing water penetration and limiting starch hydration, which is essential for gelatinization and melt development. In addition, fat decreases frictional resistance and mechanical work, thereby lowering SME and the amount of thermal–mechanical energy available for cooking. Reduced friction and shear also depresses barrel temperature and heat transfer to the mass, which reduces starch transformation and kibble expansion. When lipid levels become excessive, these combined effects lead to denser kibbles, reduced structural integrity, and poorer floatability, as consistently reported in extrusion literature [11,30,47].
Starch gelatinization is a commonly used indicator of cooking degree, as higher gelatinization reflects more extensive thermal and mechanical transformation of starch [36,52]. In the present study, all diets exhibited high starch gelatinization values (>83%), which may be attributed to adequate STE [44,53]. Although water content has the greatest influence on specific heat and STE, as reported by Lewis [54], it remained stable across treatments. Nevertheless, the highest starch gelatinization (>95%) value was obtained when no fat was injected into the preconditioner under the HS configuration. This result corroborates previous studies showing that fat present in ingredients or externally added during extrusion tends to reduce starch gelatinization, as well as to decrease kibble expansion and increase bulk and specific density [10,23,47].
In the present study, as expected, the reduction in starch gelatinization was accompanied by increases in kibble density before and after drying of approximately 119 g/L and 84.6 g/L, respectively, when 4% of fat was added to the preconditioner. Rokey et al. [27] reported that a 1% increase in dietary fat within formulations containing up to 12% fat resulted in an increase of 16 g/L in product bulk density. In the present study, each 1% increase in fat beyond 8% led to substantially greater increases, approximately 30 g/L in bulk density before drying and 21 g/L after drying. This higher sensitivity to fat inclusion, compared with the findings of Rokey et al. [27], may be attributed to differences in diet composition, particle size, and extrusion conditions among studies [36,37,44,45,55].
The results of the complementary and static mushiness tests provide important information on kibble quality, water absorption, and structural integrity. The complementary mushiness test indicated a linear reduction in kibble integrity with increasing IF content, resulting in partially or completely disintegrated kibbles that rapidly sank. Such disintegration can negatively affect aquatic systems by increasing nutrient release into the water and promoting eutrophication [11,56]. From an environmental perspective, improving pellet integrity and reducing particle loss is highly relevant since feed represents the main source of nutrient input in aquaculture systems [57]. Recent nutrient budget analyses in intensive pond cultures demonstrate that commercial feed accounts for approximately 95–96% of total phosphorus input and is also the dominant source of nitrogen entering the system [57]. Despite this high input, nutrient utilization efficiency in aquaculture is only partial; typically, 35–50% of dietary nitrogen and around 28–31% of dietary phosphorus are retained in animal biomass, with the remaining fraction being lost as dissolved excretions, suspended particles, sediment accumulation, and effluent discharge [57,58]. Such nutrient losses are widely recognized as major contributors to nutrient enrichment of receiving waters and have been directly associated with eutrophication and harmful algal bloom events in aquaculture regions [58]. Therefore, improvements in pellet floatability and water stability, such as those promoted by optimized extrusion conditions, may contribute not only to feed efficiency but also to mitigating nitrogen and phosphorus loading to aquatic environments [57,58].
The static mushiness test is a useful indicator of the water absorption capacity of extruded kibbles. Highly expanded kibbles absorb more water than dense, hard kibbles because they contain a larger proportion of internal cellular cavities [36,59]. In contrast, lipids may accumulate on the kibble surface, within internal air cells, or become integrated into the matrix, increasing product density and reducing porosity [60]. Accordingly, the linear increase in kibble density resulting from fat inclusion led to a proportional reduction in water absorption.
For aquatic species, maintaining the physical integrity of kibbles is essential to ensure diet quality and effective nutrient delivery. The relevance of kibble stability also extends to environmental considerations, particularly eutrophication, which remains a major concern in aquaculture systems [61]. Eutrophication results from the accumulation of nutrients in water, and the disintegration of feed kibbles can contribute to this process by releasing fine particles and soluble nutrients into the environment [62,63]. Thus, maintaining kibble structural integrity is necessary to minimize nutrient leaching, support sustainable aquaculture practices, and preserve overall ecosystem health [5,56,61].
The floatability of extruded kibbles is strongly associated with piece density and bulk density [64], both of which are influenced by the balance between SME and STE applied during processing [14,36,44]. In the present study, the highest post-drying bulk density (412.8 g/L) was obtained in the MS configuration with 4% fat inclusion in the preconditioner. As kibble density increased, floatability declined proportionally: diets without fat added to the preconditioner exhibited floatability rates above 60%, those with 2% added fat showed rates of approximately 40%, and diets containing 4% fat displayed floatability values below 30%.
Traditionally, commercial fish feeds exhibit bulk densities ranging from 280 to 400 g/L, a range that typically ensures adequate floatability [15,27]. Glencross et al. [64] reported that extruded kibbles generally remain floating when their bulk density is below 530 g/L, which is consistent with the patterns observed in the present study. Similarly, Sørensen et al. [65] demonstrated that sinking velocity, buoyancy, and water stability are strongly influenced by pellet bulk density, further supporting our findings.
As shown in Figure 1, floatability decreased with increasing IF content, and this trend was consistent across both screw configurations. In the MS configuration, floatability declined from 60.2% in the control (0% fat) to 39.8% with 2% fat and only 17.4% with 4% fat. A similar pattern was observed in the HS configuration, where floatability decreased from 72.6% (0% fat) to 42.1% (2% fat) and 27.4% (4% fat). Across all fat inclusion levels, the HS configuration consistently produced higher floatability than the MS configuration, with differences of approximately 12 percentage points at 0% fat inclusion, 2 percentage points at 2% fat inclusion, and 10 percentage points at 4% fat inclusion. The sinking and floatability rates are important factors that should be considered in fish farming, due to the feeding and digestive behaviors of each fish species [3,4,5].
Pearson correlation analysis demonstrated strong associations among IF inclusion, SME, and kibble physical quality. When IF was considered as a variable, IF consistently reduced SME, confirming the lubricating effect of lipids inside the extruder barrel, which lowers friction and limits the transfer of SME to the material [10]. As a consequence, starch gelatinization declined, together with radial expansion and floatability, indicating reduced bubble formation and stabilization during expansion. At the same time, bulk density increased, and kibbles became structurally weaker after hydration, evidencing impaired matrix development [13,27,30].
Evaluating Pearson correlation through SME variable demonstrated that higher SME was associated with greater starch cooking, improved expansion, reduced kibble density, and superior flotation behavior. Kibbles processed under higher SME also exhibited stronger structural consistency, whereas lower SME was linked to softer and more fragile kibbles. Together, these relationships clearly demonstrate that the detrimental effects of high IF inclusion are largely mediated through its reduction in SME and the resulting limitations in thermo-mechanical transformation of the feed matrix, reinforcing the need to balance lipid inclusion with sufficient energy input during extrusion [13,49,66].

5. Conclusions

Increasing the IF content of the mass significantly affected extrusion performance and kibble physical quality. Higher fat levels reduced SME, leading to lower starch gelatinization and kibble expansion, as well as higher bulk and specific densities. These changes resulted in reduced floatability and lower structural integrity. Screw configuration influenced these responses, with the HS profile promoting greater structural development and higher floatability; however, when fat is injected via preconditioner at >2%, product quality was significantly compromised. This highlights the importance of controlling IF addition to maintain adequate physical characteristics and functional performance of extruded fish feeds. However, further in vivo studies are needed to evaluate the effects of IF on fish digestibility, feeding behavior, and overall production outcomes under practical farming conditions.

Author Contributions

Conceptualization, L.B.S. and A.C.C.; methodology, L.B.S., M.A.B., L.G.P. and D.J.C.; formal analysis, M.A.B. and L.G.P.; investigation, L.B.S., M.A.B., L.G.P. and S.S.T.; writing—original draft preparation, L.B.S.; writing—review and editing, A.C.C., L.G.P., S.S.T. and L.B.S.; supervision, A.C.C. All authors have read and agreed to the published version of the manuscript.

Funding

The authors would like to disclose that BRF Ingredients, BRF Pet Food, and Adimax Pet provided financial support to this study by supporting the Laboratory of Research in Nutrition and Nutritional Diseases of Dogs and Cats “Prof. Dr. Flavio Prada”, where the analyses were conducted, and that Manzoni Ltd. donated the extruder used in this study. Although the support provided included institutional funding to the laboratory and the donation of the equipment, the supporting companies had no role in the study design, data collection, data analysis, interpretation of results, or in the writing of the manuscript.

Data Availability Statement

The datasets presented in this article are not readily available because the data are part of an ongoing study. Requests to access the datasets should be directed to the corresponding author at lu-cas.scarpim@unesp.br.

Conflicts of Interest

The BRF Ingredients, BRF Pet Food, and Adimax Pet had no role in the design of the study; in the collection, analyses, or interpretation of data; in the writing of the manuscript, or in the decision to publish the results.

Abbreviations

The following abbreviations are used in this manuscript:
ddDie diameter
DMDry matter
FFloatability rate
FfFinal number of sunken kibbles
FiInitial number of kibbles
HSHigh shear configuration
IFInternal fat inclusion
LspSpecific length
MpcPreconditioner mass flow rate
MfFinal mass flow rate from extruder
MrawRaw material mass
MsSteam mass
MslSteam loss mass
MSMedium shear configuration
MwWater mass
pSpecific density
QR/QPc/QW/Qs/QSL/QHLHeat capacity/heat loss terms in mass and energy balances
rPearson correlation
RERadial Expansion
SEMStandard error of the mean
SMESpecific Mechanical Energy
STESpecific Thermal Energy
TSETotal Specific Energy

References

  1. Food and Agriculture Organization of the United Nations. The State of World Fisheries and Aquaculture 2010; FAO: Rome, Italy, 2010. [Google Scholar]
  2. Lall, S.P.; Tibbetts, S.M. Nutrition, feeding, and behavior of fish. Vet. Clin. N. Am. Exot. Anim. Pract. 2009, 12, 361–372. [Google Scholar] [CrossRef] [Scilit]
  3. Hardy, R.W. Feeding salmon and trout. In Nutrition and Feeding of Fish; Springer: Berlin/Heidelberg, Germany, 1998; pp. 175–197. [Google Scholar]
  4. Aarseth, K. Attrition of feed pellets during pneumatic conveying: The influence of velocity and bend radius. Biosyst. Eng. 2004, 89, 197–213. [Google Scholar] [CrossRef] [Scilit]
  5. Wang, H.; Ma, S.; Yang, J.; Qin, Y.; Cheng, H.; Xue, M.; Li, J.; Li, J. Optimization of the process parameters for extruded commercial sinking fish feed with mixed plant protein sources. J. Food Process Eng. 2021, 44, e13599. [Google Scholar] [CrossRef] [Scilit]
  6. Liu, K.; Frost, J.; Welker, T.L.; Barrows, F.T. Comparison of new and conventional processing methods for their effects on physical properties of fish feed. Anim. Feed Sci. Technol. 2021, 273, 114818. [Google Scholar] [CrossRef] [Scilit]
  7. Cai, C.; Tian, Y.; Sun, C.; Jin, Z. Resistant structure of extruded starch: Effects of fatty acids with different chain lengths and degree of unsaturation. Food Chem. 2022, 374, 131510. [Google Scholar] [CrossRef] [Scilit]
  8. Soker, P.D.; Kop, A.; Korkut, A.Y. The effects of different starch levels on the physical quality of high-oil extruded fish feed. Ege J. Fish. Aquat. Sci. 2024, 41, 82–89. [Google Scholar] [CrossRef] [Scilit]
  9. Sule, S.; Okafor, G.; Momoh, O.; Gbaa, S.; Amonyeze, A. Applications of food extrusion technology. MOJ Food Process. Technol. 2024, 12, 74–84. [Google Scholar] [CrossRef] [Scilit]
  10. Riaz, M.N. Extruders and Expanders in Pet Food, Aquatic and Livestock Feeds; AgriMedia GmbH: Clenze, Germany, 2007. [Google Scholar]
  11. Riaz, M.N. Extruders in Food Applications; CRC Press: Boca Raton, FL, USA, 2000. [Google Scholar]
  12. Kim, H.S.; Aldrich, C.G. Extrusion and product parameters for extruded dog diets with graded levels of whole soybeans. Anim. Feed Sci. Technol. 2023, 295, 115504. [Google Scholar] [CrossRef] [Scilit]
  13. Sørensen, M.; Nguyen, G.; Storebakken, T.; Øverland, M. Starch source, screw configuration and injection of steam into the barrel affect the physical quality of extruded fish feed. Aquac. Res. 2010, 41, 419–432. [Google Scholar] [CrossRef] [Scilit]
  14. De Cruz, C.; Kamarudin, M.; Saad, C.; Ramezani-Fard, E. Effects of extruder die temperature on the physical properties of extruded fish pellets containing taro and broken rice starch. Anim. Feed Sci. Technol. 2015, 199, 137–145. [Google Scholar] [CrossRef] [Scilit]
  15. Rokey, G. Petfood and fishfood extrusion. In The Technology of Extrusion Cooking; Springer: Berlin/Heidelberg, Germany, 1994; pp. 144–189. [Google Scholar]
  16. Li, M.H.; Lim, C.E.; Webster, C.D. Feed formulation and manufacture. In Tilapia; CRC Press: Boca Raton, FL, USA, 2024; pp. 517–545. [Google Scholar]
  17. Mosibo, O.K.; Ferrentino, G.; Alam, M.R.; Morozova, K.; Scampicchio, M. Extrusion cooking of protein-based products: Potentials and challenges. Crit. Rev. Food Sci. Nutr. 2022, 62, 2526–2547. [Google Scholar] [CrossRef] [Scilit] [PubMed]
  18. Huang, X.; Liu, H.; Ma, Y.; Mai, S.; Li, C. Effects of extrusion on starch molecular degradation, order–disorder structural transition and digestibility—A review. Foods 2022, 11, 2538. [Google Scholar] [CrossRef] [Scilit] [PubMed]
  19. Wang, B.; Dong, Y.; Fang, Y.; Gao, W.; Kang, X.; Liu, P.; Yan, S.; Cui, B.; Abd El-Aty, A. Effects of different moisture contents on the structure and properties of corn starch during extrusion. Food Chem. 2022, 368, 130804. [Google Scholar] [CrossRef] [Scilit] [PubMed]
  20. Dendegh, T.; Enefola, O.; Akpapunam, S.; Yelmi, B.; Abdullahi, M. Extrusion technology and its application in food processing-an overview. Trop. J. Eng. Sci. Technol. 2022, 1, 25–53. [Google Scholar]
  21. Pennells, J.; Salini, M.; Rombenso, A.; Simon, C.; Ying, D. The State-of-the-Art of Aquafeed Extrusion: Mechanisms, Challenges and Opportunities. Rev. Aquac. 2025, 17, e70002. [Google Scholar] [CrossRef] [Scilit]
  22. Wang, Q.; Sivakumar, K.; Mohanasundaram, S. Impacts of extrusion processing on food nutritional components. Int. J. Syst. Assur. Eng. Manag. 2022, 13, 364–374. [Google Scholar] [CrossRef] [Scilit]
  23. Ilo, S.; Schoenlechner, R.; Berghofe, E. Role of lipids in the extrusion cooking processes. Grasas Aceites 2000, 51, 97–110. [Google Scholar] [CrossRef] [Scilit]
  24. Cowey, C.; Sargent, J. Lipid nutrition in fish. Comp. Biochem. Physiol. Part B Comp. Biochem. 1977, 57, 269–273. [Google Scholar] [CrossRef] [Scilit]
  25. Watanabe, T. Lipid nutrition in fish. Comp. Biochem. Physiol. Part B Comp. Biochem. 1982, 73, 3–15. [Google Scholar] [CrossRef] [Scilit]
  26. Guy, R. Raw materials for extrusion cooking processes. In The Technology of Extrusion Cooking; Springer: Berlin/Heidelberg, Germany, 1994; pp. 52–72. [Google Scholar] [CrossRef] [Scilit]
  27. Rokey, G.J.; Plattner, B.; Souza, E.M.d. Feed extrusion process description. Rev. Bras. Zootec. 2010, 39, 510–518. [Google Scholar] [CrossRef] [Scilit]
  28. Desrumaux, A.; Bouvier, J.; Burri, J. Effect of free fatty acids addition on corn grits extrusion cooking. Cereal Chem. 1999, 76, 699–704. [Google Scholar] [CrossRef] [Scilit]
  29. Choudhury, G.S.; Gogoi, B.K. Extrusion processing of fish muscle: A review. J. Aquat. Food Prod. Technol. 1996, 4, 37–67. [Google Scholar] [CrossRef] [Scilit]
  30. Guy, R. Extrusion Cooking: Technologies and Applications; Woodhead Publishing: Sawston, UK, 2001; Volume 61. [Google Scholar]
  31. AOAC. Official Methods of Analysis of AOAC International, 18th ed.; AOAC International: Washington, DC, USA, 2010. [Google Scholar]
  32. Hendrix, D.L. Rapid extraction and analysis of nonstructural carbohydrates in plant tissues. Crop Sci. 1993, 33, 1306–1311. [Google Scholar] [CrossRef] [Scilit]
  33. Sá, F.; Vasconcellos, R.; Brunetto, M.A.; Filho, F.; Gomes, M.; Carciofi, A. Enzyme use in kibble diets formulated with wheat bran for dogs: Effects on processing and digestibility. J. Anim. Physiol. Anim. Nutr. 2013, 97, 51–59. [Google Scholar] [CrossRef] [Scilit]
  34. Campos, I.; Matos, E.; Maia, M.R.; Marques, A.; Valente, L.M. Partial and total replacement of fish oil by poultry fat in diets for European seabass (Dicentrarchus labrax) juveniles: Effects on nutrient utilization, growth performance, tissue composition and lipid metabolism. Aquaculture 2019, 502, 107–120. [Google Scholar] [CrossRef] [Scilit]
  35. Gu, M.; Luo, H.; Zhang, Z.; Ye, F.; Zhao, G. Efficient preparation of starch-lipid complexes: A review. Int. J. Biol. Macromol. 2025, 302, 140544. [Google Scholar] [CrossRef] [Scilit]
  36. Baller, M.A.; Pacheco, P.D.; Peres, F.M.; Monti, M.; Carciofi, A.C. The effects of in-barrel moisture on extrusion parameters, kibble macrostructure, starch gelatinization, and palatability of a cat food. Anim. Feed Sci. Technol. 2018, 246, 82–90. [Google Scholar] [CrossRef] [Scilit]
  37. Amft, J.; Bauer, J.L.; Rostek, J.; Spielvogel, S.; Schwarz, K. Effect of water addition on the microstructure, lipid incorporation, and lipid oxidation of corn extrudates. Eur. J. Lipid Sci. Technol. 2019, 121, 1800433. [Google Scholar] [CrossRef] [Scilit]
  38. Singh, S.; Gamlath, S.; Wakeling, L. Nutritional aspects of food extrusion: A review. Int. J. Food Sci. Technol. 2007, 42, 916–929. [Google Scholar] [CrossRef] [Scilit]
  39. Moisio, T.; Forssell, P.; Partanen, R.; Damerau, A.; Hill, S.E. Reorganisation of starch, proteins and lipids in extrusion of oats. J. Cereal Sci. 2015, 64, 48–55. [Google Scholar] [CrossRef] [Scilit]
  40. De Pilli, T.; Jouppila, K.; Ikonen, J.; Kansikas, J.; Derossi, A.; Severini, C. Study on formation of starch–lipid complexes during extrusion-cooking of almond flour. J. Food Eng. 2008, 87, 495–504. [Google Scholar] [CrossRef] [Scilit]
  41. Gibson, M.W.; Sajid, A. Pet food processing: Understanding transformations in starch during extrusion and baking. Cereal Foods World 2013, 58, 232–236. [Google Scholar] [CrossRef] [Scilit]
  42. Gregson, C.M.; Lee, T.-C. Quality modification of food by extrusion processing. In Quality of Fresh and Processed Foods; Springer: Boston, MA, USA, 2004; Volume 542, pp. 187–200. [Google Scholar] [CrossRef] [Scilit]
  43. Levine, L. Engineering: Heat and Mass Balances Around Extruder Preconditioners II. Cereal Foods World 2014, 59, 214. [Google Scholar] [CrossRef] [Scilit]
  44. Pacheco, P.D.; Putarov, T.C.; Baller, M.A.; Peres, F.M.; Loureiro, B.A.; Carciofi, A.C. Thermal energy application on extrusion and nutritional characteristics of dog foods. Anim. Feed Sci. Technol. 2018, 243, 52–63. [Google Scholar] [CrossRef] [Scilit]
  45. Baller, M.A.; Pacheco, P.D.G.; Vitta-Takahashi, A.; Putarov, T.C.; Vasconcellos, R.S.; Carciofi, A.C. Effects of thermal energy on extrusion characteristics, digestibility and palatability of a dry pet food for cats. J. Anim. Physiol. Anim. Nutr. 2021, 105, 76–90. [Google Scholar] [CrossRef] [Scilit]
  46. Harper, J.M.; Clark, J.P. Food extrusion. Crit. Rev. Food Sci. Nutr. 1979, 11, 155–215. [Google Scholar] [CrossRef] [Scilit]
  47. Moscicki, L. Extrusion-Cooking Techniques: Applications, Theory and Sustainability; John Wiley & Sons: Hoboken, NJ, USA, 2011. [Google Scholar]
  48. Luker, K.; Cedar Grove, N. Surge suppression-a new means to limit surging. In Technical Papers of the Annual Technical Conference-Society of Plastics Engineers Incorporated; Randcastle Extrusion Systems, Inc.: Cedar Grove, NJ, USA, 1996; pp. 445–453. [Google Scholar]
  49. Gropper, M.; Moraru, C.I.; Kokini, J.L. Effect of specific mechanical energy on properties of extruded protein-starch mixtures. Cereal Chem. 2002, 79, 429–433. [Google Scholar] [CrossRef] [Scilit]
  50. van Zuilichem, D.J.; Janssen, L.P.; Mościcki, L. Engineering aspects of extrusion. In Extrusion-Cooking Techniques: Applications, Theory and Sustainability; University of Groningen: Groningen, The Netherlands, 2011; pp. 25–44. [Google Scholar]
  51. Monti, M.; Gibson, M.; Loureiro, B.; Sá, F.; Putarov, T.; Villaverde, C.; Alavi, S.; Carciofi, A. Influence of dietary fiber on macrostructure and processing traits of extruded dog foods. Anim. Feed Sci. Technol. 2016, 220, 93–102. [Google Scholar] [CrossRef] [Scilit]
  52. Corsato Alvarenga, I.; Aldrich, C.G. Starch characterization of commercial extruded dry pet foods. Transl. Anim. Sci. 2020, 4, 1017–1022. [Google Scholar] [CrossRef] [Scilit]
  53. Unklesbay, N.; Unklesbay, K.; Hsieh, F.; Sandik, K. Thermophysical properties of extruded beef/corn flour blends. J. Food Sci. 1992, 57, 1282–1284. [Google Scholar] [CrossRef] [Scilit]
  54. Lewis, M. Physical Properties of Foods and Food Processing Systems; Ellis Horword: Chichester, UK; VCH: Weinheim, Germany, 1987. [Google Scholar]
  55. Bazolli, R.; Vasconcellos, R.; De-Oliveira, L.; Sá, F.; Pereira, G.; Carciofi, A. Effect of the particle size of maize, rice, and sorghum in extruded diets for dogs on starch gelatinization, digestibility, and the fecal concentration of fermentation products. J. Anim. Sci. 2015, 93, 2956–2966. [Google Scholar] [CrossRef] [Scilit]
  56. Talbot, C.; Hole, R. Fish diets and the control of eutrophication resulting from aquaculture. J. Appl. Ichthyol. 1994, 10, 258–270. [Google Scholar] [CrossRef] [Scilit]
  57. Zhang, S.; Zhao, X.; Feng, K.; Hu, Y.; Tillotson, M.R.; Yang, L. Do mariculture products offer better environment and nutritional choices compared to land-based protein products in China? J. Clean. Prod. 2022, 372, 133697. [Google Scholar] [CrossRef] [Scilit]
  58. Zhang, S.; Huang, J.; Ji, Y.; Zhang, J.; Pei, P.; Gao, J. Nitrogen and phosphorus cycling for aquaculture ponds with artificially-controlled drainage: Sources, sinks and treatment strategies. Ecol. Eng. 2024, 206, 107331. [Google Scholar] [CrossRef] [Scilit]
  59. Wang, L.; Ganjyal, G.M.; Jones, D.D.; Weller, C.L.; Hanna, M.A. Modeling of bubble growth dynamics and nonisothermal expansion in starch-based foams during extrusion. Adv. Polym. Technol. J. Polym. Process. Inst. 2005, 24, 29–45. [Google Scholar] [CrossRef] [Scilit]
  60. Yılmaz, G.; Jongboom, R.O.; Feil, H.; Hennink, W.E. Encapsulation of sunflower oil in starch matrices via extrusion: Effect of the interfacial properties and processing conditions on the formation of dispersed phase morphologies. Carbohydr. Polym. 2001, 45, 403–410. [Google Scholar] [CrossRef] [Scilit]
  61. Amirkolaie, A.K. Reduction in the environmental impact of waste discharged by fish farms through feed and feeding. Rev. Aquac. 2011, 3, 19–26. [Google Scholar] [CrossRef] [Scilit]
  62. Cho, C.; Bureau, D. A review of diet formulation strategies and feeding systems to reduce excretory and feed wastes in aquaculture. Aquac. Res. 2001, 32, 349–360. [Google Scholar] [CrossRef] [Scilit]
  63. Cho, C.Y.; Bureau, D.P. Reduction of waste output from salmonid aquaculture through feeds and feeding. Progress. Fish-Cult. 1997, 59, 155–160. [Google Scholar] [CrossRef] [Scilit]
  64. Glencross, B.; Hawkins, W.; Evans, D.; Rutherford, N.; McCafferty, P.; Dods, K.; Hauler, R. A comparison of the effect of diet extrusion or screw-press pelleting on the digestibility of grain protein products when fed to rainbow trout (Oncorhynchus mykiss). Aquaculture 2011, 312, 154–161. [Google Scholar] [CrossRef] [Scilit]
  65. Sørensen, M.; Ljøkjel, K.; Storebakken, T.; Shearer, K.; Skrede, A. Apparent digestibility of protein, amino acids and energy in rainbow trout (Oncorhynchus mykiss) fed a fish meal based diet extruded at different temperatures. Aquaculture 2002, 211, 215–225. [Google Scholar] [CrossRef] [Scilit]
  66. Alam, M.; Kaur, J.; Khaira, H.; Gupta, K. Extrusion and extruded products: Changes in quality attributes as affected by extrusion process parameters: A review. Crit. Rev. Food Sci. Nutr. 2016, 56, 445–473. [Google Scholar] [CrossRef] [Scilit]
Figure 1. Schematic of both extruder screw profiles used to apply medium or high shear. Inlet starting on the left to discharge ending on the right. MS—Medium shear configuration. HS—High shear configuration.
Processes 14 00310 g001
Figure 2. Floatability rate (%) of extruded fish feed kibbles over time under two screw configurations and three levels of internal fat inclusion from 5 to 20 min. All treatments presented 100% floatability rate at 0 min (initial evaluation). Symbols indicate treatments: (×) = High shear (0% fat); (◆) = Medium shear (0% fat); (■) = High shear (2% fat); (+) = Medium shear (2% fat); (●) = High shear (4% fat); (△) = Medium shear (4% fat).
Processes 14 00310 g002
Table 1. Ingredient composition of experimental diet (As-fed basis).
Diet Composition%
Soy isolate 136.3
Maize, grain 217.4
Salmon meal 315.0
Poultry by-product meal 415.0
Maize Gluten meal 60 510.0
Sugar cane yeast 63.0
Salmon oil 71.0
Mineral and vitamin supplement 80.5
Common Salt 90.5
Poultry fat 30.5
Choline Chloride 90.3
DL-Methionine 90.2
Mold inhibitor 100.1
Taurine 90.1
Antioxidant 110.1
1 Soy isolate ADM (PROFAM 646, 14100323 ADM—Archer Daniels Midland Company, Chicago, IL, USA). 2 Sao Paulo State University, Jaboticabal, Brazil. 3 Farol S.A, Concórdia, SC, Brazil. 4 Brazil Foods S.A., Concórdia, SC, Brazil. 5 Cargill Inc., Campinas, SP, Brazil. 6 SPF do Brazil, Descalvado, SP, Brazil. 7 Polinutri Alimentos S.A, Sao Paulo, SP, Brazil. 8 Added per kg of food: iron 100 mg, Copper 10 mg, Manganese 10 mg, Zinc 150 mg, Iodine 2 mg, Selenium 0.3 mg, Vitamin A 18,000 UI, Vit. D 1200 UI, Vit. E 200 UI, Thiamine 6 mg, Riboflavin 10 mg, Pantothenic acid10 mg, Niacin 50 mg, Piroxidin 6 mg, Folic acid 0.30 mg, Vitamin. B12 0.03 mg. 9 Agromix-industria e Comercio de Alimentos—LTDA, Jaboticabal, SP, Brazil. 10 Mold Zap Citrus: Ammonium dipropionate. acetic acid, sorbic acid and benzoic acid, Alltech do Brazil Agroindustrial Ltd., Maringá, PR, Brazil. 11 Banox, Alltech Brazil Agroindustrial Ltd.: Propyl gallate, calcium carbonate, BHA and BHT.
Table 2. Chemical composition of the diets after extrusion with inclusion of fat in the preconditioner during extrusion (DM-basis).
ItemDiets 1
MS0MS2MS4HS0HS2HS4
Chemical composition (%)
Dry Matter95.795.395.495.996.095.8
Crude Protein50.449.548.750.149.148.8
Acid-hydrolyzed fat8.19.912.08.09.911.9
Starch14.814.414.514.714.114.3
Total Dietary Fiber12.212.411.912.312.212.0
Ash10.110.09.610.29.99.4
Crude Energy (kcal/g)4.84.94.94.84.94.9
1 MS0 = Medium shear configuration with no inclusion of fat; MS2 = Medium shear configuration with 2% inclusion of fat; MS4 = Medium shear configuration with 4% inclusion of fat; HS0 = High shear configuration with no inclusion of fat; HS2 = High shear configuration with 2% inclusion of fat; HS4 = High shear configuration with 4% inclusion of fat.
Table 3. Lipid content and complexation of a fish feed formulation extruded with different screw configurations. (DM-basis).
ItemScrew
Configuration 3
Fat InclusionMeanSEM 1p-ValueContrast 2
0%2%4%Screw
Configuration
Fat
Inclusion
Screw Configuration × Fat InclusionLinearQuad
Analyzed lipid content
of extruded fish feed (%)
Acid-hydrolyzed fatMS8.19.912.010.00.20.293<0.0010.167
HS8.09.911.99.90.3
Mean8.19.912.0 <0.0010.215
Ether extract without prior hydrolysisMS3.75.47.65.60.10.814<0.0010.421
HS3.64.37.05.00.2
Mean3.64.87.3 <0.0010.644
Lipid complexationMS4.44.54.44.40.10.0170.0360.0430.1890.855
HS4.45.64.95.00.1 0.1930.030
Mean4.45.14.6
1 SEM = standard error of the mean (n = 24); 2 Linear or quadratic effect of fat inclusion; 3 MS = Medium shear configuration; HS = High shear configuration.
Table 4. Processing characteristics of fish feed extruded with different screw configurations and crescent inclusion of fat in the preconditioner during extrusion.
ItemScrew Configuration 3Fat InclusionMeanSEM 1p-ValueContrast 2
0%2%4%Screw ConfigurationFat InclusionScrew Configuration × Fat InclusionLinearQuad
Preconditioner
Temperature (°C)MS90.091.092.091.00.60.8360.6670.142--
HS90.091.090.090.30.2
Mean90.091.091.0
Discharge mass moisture (%)MS25.425.625.825.50.50.2280.6870.709--
HS25.726.326.626.20.5
Mean25.625.926.2
Extruder
Product flow rate (kg/h)MS155.0159.5161.8158.81.90.560<0.0010.148
HS153.3159.6165.3159.40.9
Mean154.1159.6163.5 0.0220.537
Motor amperage (A)MS40.039.337.338.90.60.093<0.0010.0400.0290.270
HS43.240.238.440.60.4 0.0170.825
Mean41.639.837.8
Mass Temperature before the die (°C)MS132.7129.8123.5128.71.3<0.001<0.0010.0180.0010.053
HS140.2137.2135.3137.60.8 0.0110.061
Mean136.5133.5129.4
In-barrel moisture (%)MS25.225.225.025.11.00.3250.5720.514--
HS25.126.024.825.30.5
Mean25.225.624.9
Bulk density (g/L)MS381.0456.0500.0445.714.90.039<0.0010.386
HS361.0447.0495.0424.316.5
Mean371.0451.5497.5 <0.0010.129
Mass pressure before the die (Bar)MS28.626.125.326.70.8<0.001<0.0010.162
HS45.141.138.941.80.5
Mean36.933.832.1 0.0200.477
1 SEM = standard error of the mean (n = 24); 2 Linear or quadratic effect of fat inclusion; 3 MS = Medium shear configuration; HS = High shear configuration.
Table 5. Energy balance of a fish feed formulation extruded with different screw configurations and crescent inclusion of poultry fat.
ItemScrew
Configuration 3
Fat InclusionMeanSEM 1p-ValueContrast 2
0%2%4%Screw
Configuration
Fat InclusionScrew Configuration
× Fat Inclusion
LinearQuad
SME, kW-h/tonMS19.815.912.516.11.20.029<0.0010.346
HS21.316.812.616.90.9
Mean20.516.412.5 <0.0010.502
STE, kW-h/tonMS50.251.353.551.73.70.0210.0190.123
HS51.452.253.252.12.4
Mean50.851.853.2 0.0060.805
TSE, kW-h/tonMS70.067.266.067.72.90.2290.0430.217
HS72.769.065.869.22.1
Mean71.368.165.9 <0.0010.655
STE:SME ratioMS2.53.24.33.30.40.427<0.0010.618
HS2.43.14.23.20.3
Mean2.43.14.2 <0.0010.302
1 SEM = standard error of the mean (n = 24); 2 Linear or quadratic effect of fat inclusion; 3 MS = Medium shear configuration; HS = High shear configuration.
Table 6. Fat inclusion and screw configuration on starch gelatinization, floatability, mushiness and kibbles macrostructure of fish feed.
ItemScrew
Configuration 3
Fat InclusionMeanSEM 1p-ValueContrast 2
0%2%4%Screw
Configuration
Fat InclusionScrew Configuration
× Fat Inclusion
LinearQuad
Starch gelatinization, %MS87.986.983.486.10.50.0010.0260.0280.0430.483
HS95.688.786.390.41.0 0.0380.293
Mean91.887.885.2
Floatability, %MS60.239.817.439.15.6<0.001<0.001<0.001<0.0010.124
HS72.642.127.447.45.2 <0.0010.317
Mean66.441.022.4
Static mushiness, gMS107.6105.871.795.05.1<0.001<0.0010.0010.0250.142
HS117.7111.495.8108.33.0 0.0330.617
Mean112.7108.683.8
Complementary mushinessMS12.314.017.814.70.30.6400.0020.759
HS12.014.517.014.50.3
Mean12.114.317.4 <0.0010.741
Kibble Macrostructure
Specific density, kg/m3MS0.50.60.70.60.10.366<0.0010.809
HS0.50.60.70.60.1
Mean0.50.60.7 <0.0010.736
Radial Expansion, mmMS10.99.17.99.30.40.858<0.0010.498
HS11.29.57.99.50.4
Mean11.09.37.9 <0.0010.238
Specific length, mm/gMS5.04.74.54.70.30.7420.0020.311
HS4.94.84.64.80.3
Mean4.94.94.5 0.0220.331
Bulk density, g/LMS329.0382.8412.8374.812.0<0.001<0.001<0.001<0.0010.362
HS312.0377.7397.5362.410.3 <0.0010.189
Mean320.5380.2405.1
1 SEM = standard error of the mean (n = 24); 2 Linear or quadratic effect of fat inclusion; 3 MS = Medium shear configuration; HS = High shear configuration.
Table 7. Pearson correlation coefficients and linear regression equations describing the relationships between internal fat inclusion, SME, and kibble quality parameters.
Dependent Variable (Y)Variable (X) 1Equation (Y = a + b·X)rp-Value
SMEFat (%)SME = 20.54 − 2.01·Fat−0.90.009
Starch gelatinizationFat (%)Gel = 91.93 − 1.65·Fat−0.80.037
FloatabilityFat (%)Float = 66.07 − 10.98·Fat−0.80.046
Radial expansionFat (%)Expansion = 10.99 − 0.76·Fat−0.90.035
Static mushiness (g)Fat (%)Static = 113.7 − 7.23·Fat−0.90.044
Complementary mushinessFat (%)Comp = 12.03 + 1.33·Fat+0.80.048
Bulk densityFat (%)Bulk = 319.7 + 21.1·Fat+0.90.038
Starch gelatinization (%)SMEGel =74.9 + 0.82·SME+0.80.048
FloatabilitySMEFloat = −7.97 + 3.64·SME+0.90.047
Radial expansionSMEExpansion = −4.53 + 0.76·SME+0.90.026
Static mushinessSMEStatic = 38.9 + 3.60·SME+0.80.048
Complementary mushinessSMEComp = 25.7 − 0.66·SME−0.90.041
Bulk densitySMEBulk = 698.1 − 15.9·SME−0.80.039
1 Fat (%)—Internal fat added in the preconditioner 0%, 2% or 4%; SME (Kwh/t)—Specific mechanical energy corresponding to each treatment.
Disclaimer/Publisher’s Note: The statements, opinions and data contained in all publications are solely those of the individual author(s) and contributor(s) and not of MDPI and/or the editor(s). MDPI and/or the editor(s) disclaim responsibility for any injury to people or property resulting from any ideas, methods, instructions or products referred to in the content.