Article

Oil- and Gas-Well Casing-Setting-Depth Estimation Methods: A New Practical Method

by
Musaed N. J. AlAwad
*,
Faisal S. Altawati
,
Mohammed A. Almobarky
,
Khaled A. Fattah
and
Khalid A. AlShemmari
Department of Petroleum and Natural Gas Engineering, College of Engineering, King Saud University, Riyadh P.O. Box 800, Saudi Arabia
*
Author to whom correspondence should be addressed.
Processes 2026, 14(2), 309; https://doi.org/10.3390/pr14020309
Submission received: 13 December 2025 / Revised: 8 January 2026 / Accepted: 13 January 2026 / Published: 15 January 2026
(This article belongs to the Special Issue Oil and Gas Drilling Processes: Control and Optimization, 2nd Edition)

Abstract

A well construction plan includes a drilling program, drilling fluids, casing-setting-depth selection, casing-grade-combination design, bit selection, cementing, and a wellhead design. Casing-setting-depth selection techniques are an integral part of the construction of oil and gas wells, where setting-depth selection methods rely on both safety and economics. In this study, a new casing-setting-depth selection method is developed. This new method is based on the estimation of the fracturing pressure using the Mohr–Coulomb failure criterion. To validate this new casing-setting-depth selection method, ten core samples, representing ten underground formations in the Saudi lithological column, were tested for uniaxial compressive and tensile strengths. The results were utilized to establish rock failure criteria and estimate casing setting depth using a newly proposed casing-setting-depth selection method based on the Mohr–Coulomb failure criterion and compared to other traditional casing-setting-depth estimation methods. The results demonstrated that the Hubbert & Willis method provided a very narrow safe mud window compared to the other methods, while the leak-off, Eaton, Mathews & Kelly, and other methods provided more economical results. On the other hand, the Mohr–Coulomb method provided the widest and most economical safe mud window compared to all other traditional methods. One of the main requirements of the Mohr–Coulomb casing-setting-depth selection method is that it either requires appreciable core samples from various depths to be tested in the laboratory for their mechanical properties and failure criteria, or that core-calibrated well logs be used. Additionally, relying on Mohr–Coulomb casing-setting-depth selection methods requires the use of filtration loss control materials to seal any microcracks that may form. Economical comparisons in terms of casing string number and length yielded that Eaton, leak-off, and Mathews and Kelly methods reduced casing cost by 31% compared to Hubbert and Willis methods. On the other hand, the new casing-setting-depth selection method based on the Mohr–Coulomb method reduced casing costs by 41% compared with the Hubbert and Willis methods and by 10% compared with the leak-off and Mathews and Kelly methods. Therefore, this study provides a new proof of concept for developing an efficient method for selecting the casing setting depth for oil and gas wells.

1. Introduction

Wells are drilled using a rotary drilling rig (see Figure 1) as the only way to commercially exploit oil and gas from underground reservoirs. The drilling process involves the following requirements [1]:
(1)
Drilling fluid design.
(2)
Drilling bit selection.
(3)
Casing design (casing-setting-depth selection and casing-grade-combination design).
(4)
Cementing job design.
(5)
Safety issues, knowledge, and mitigation plans.
(6)
Drilled cutting and drilling mud dumping plans.
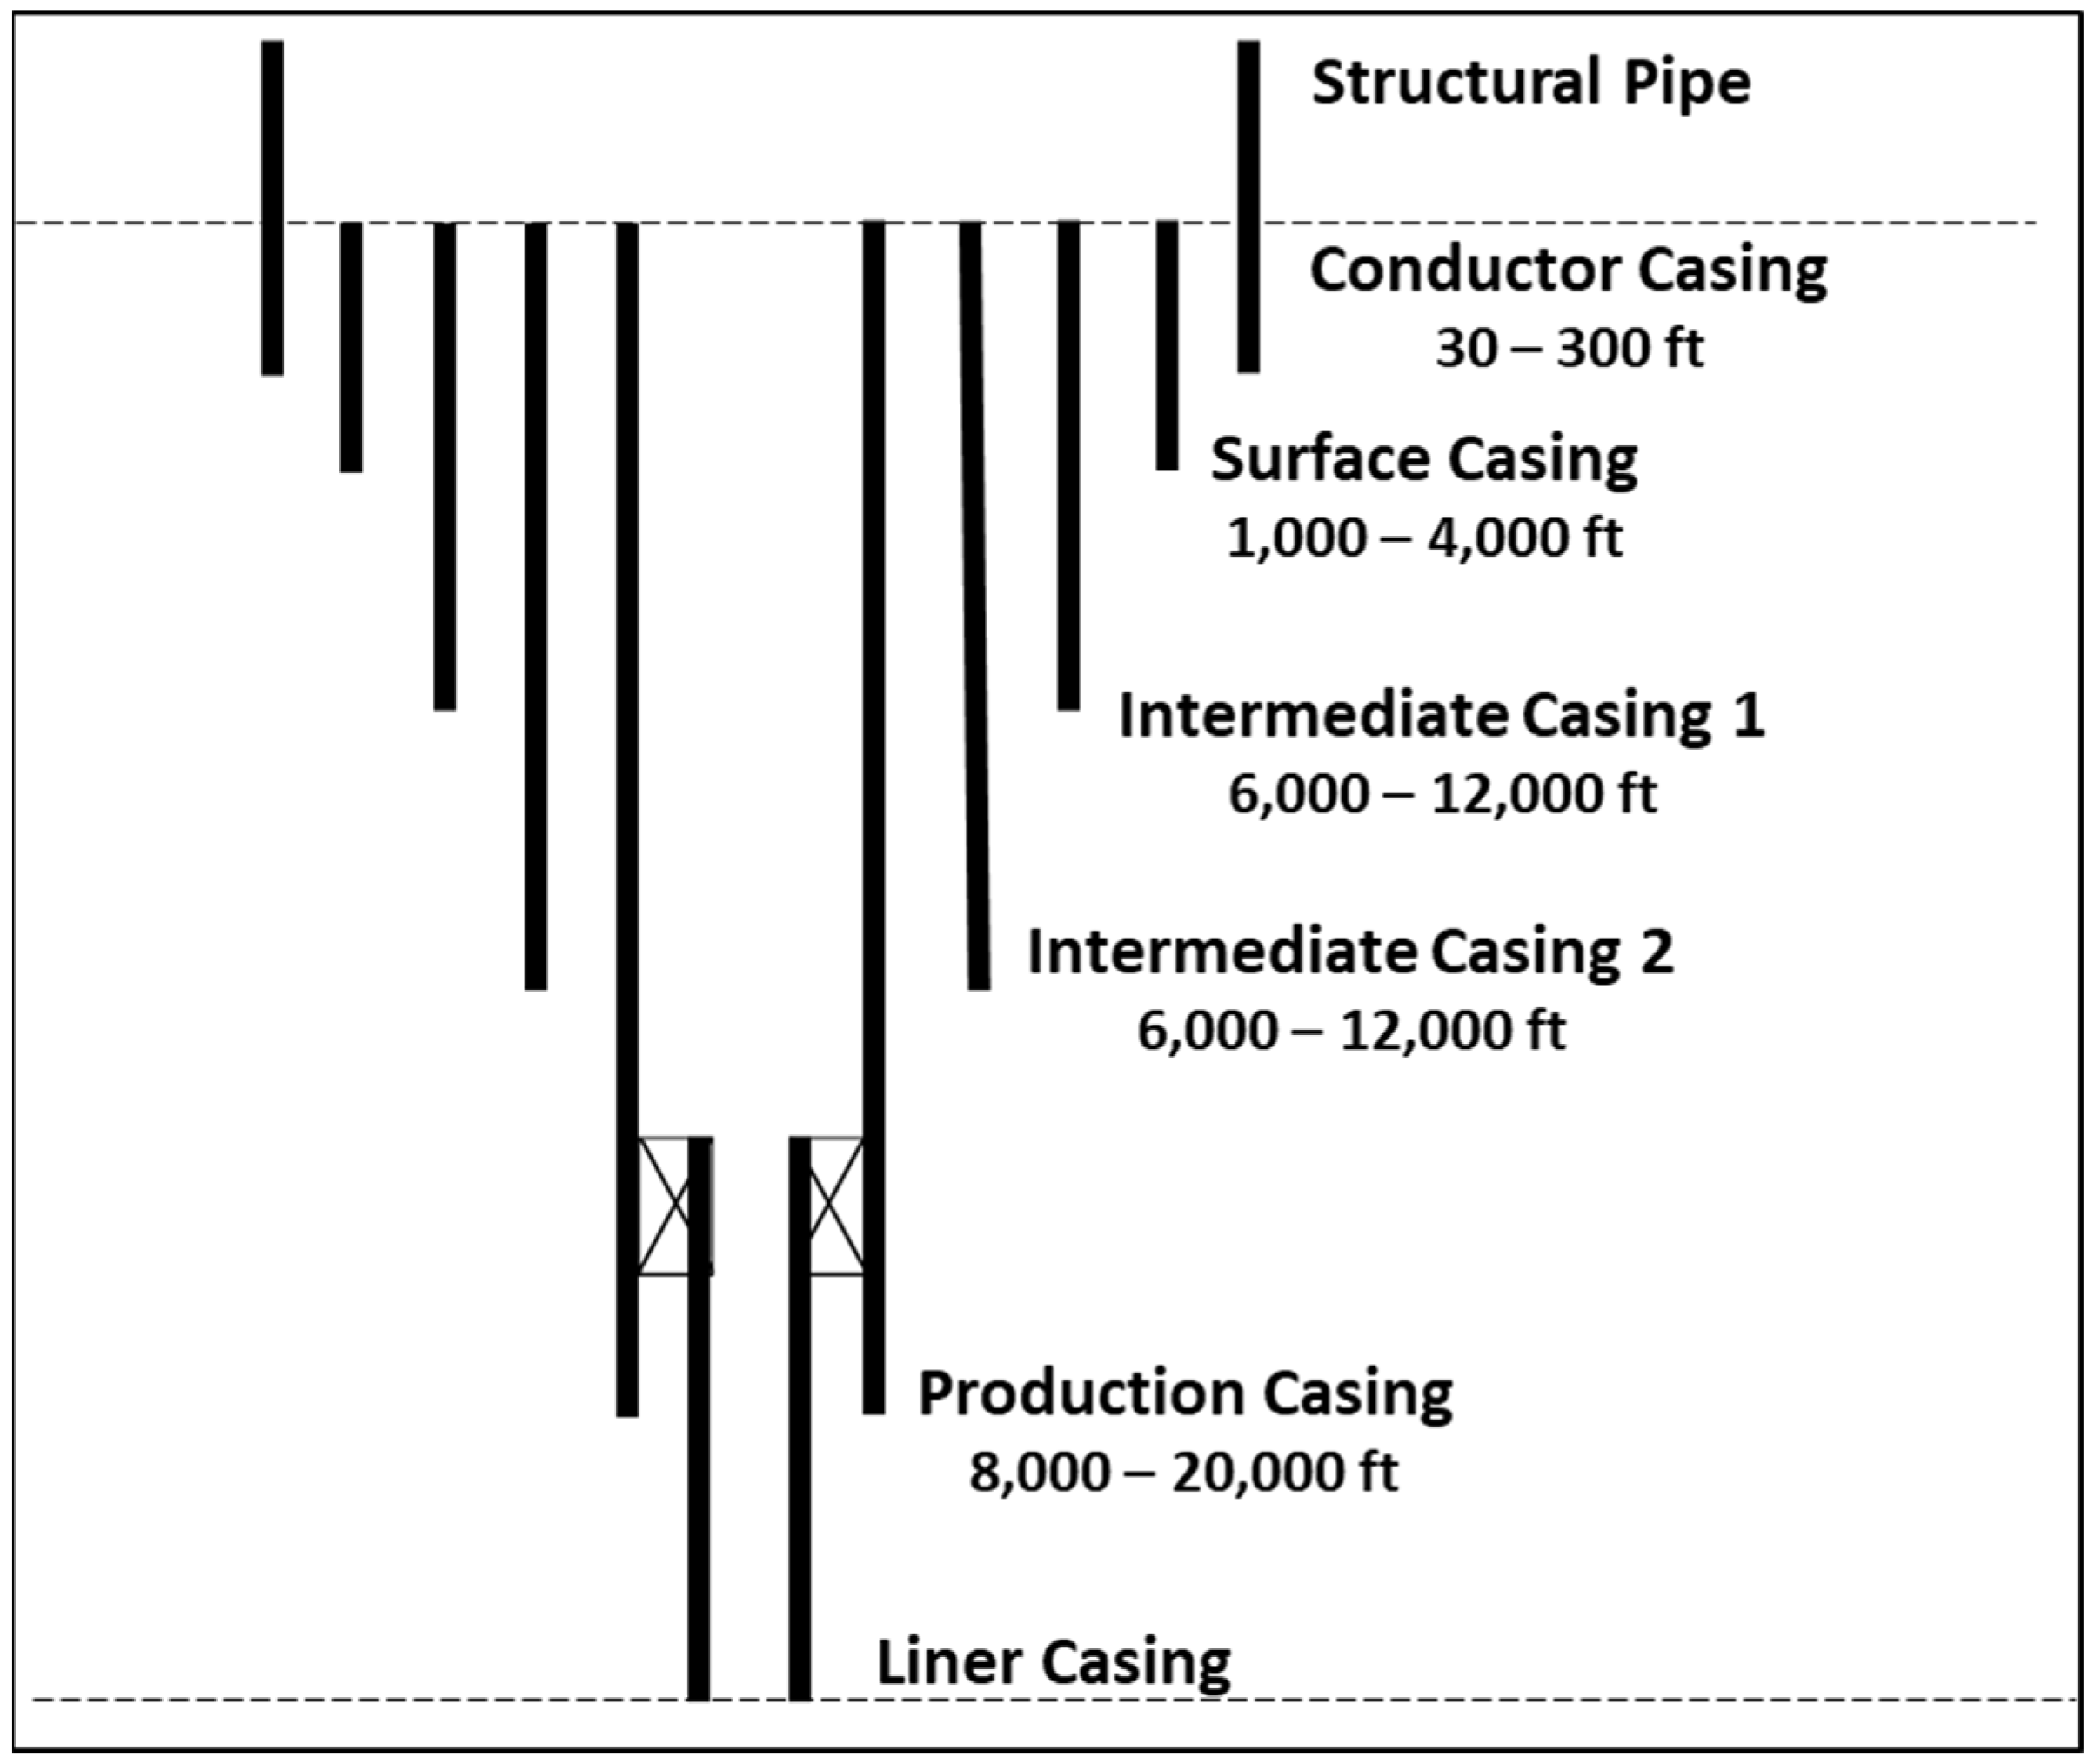
Casing design elements, including casing-grade-combination selection and casing-setting-depth selection, are a crucial part of the oil- and gas-well drilling process. Casing-setting-depth selection is mainly dependent on the knowledge of pore pressure and fracturing pressure profiles. The precise knowledge and utilization of pore pressure, fracture gradients, and other rock mechanical properties are essential for maintaining borehole stability while drilling by defining the mud window required for safe drilling. Oil-well casing, a fundamental component in the field of energy extraction, plays a pivotal role in ensuring the safety, efficiency, and environmental responsibility of oil and gas operations [2]. Casing strings are classified into the following (see Figure 1):
(1)
A conductor pipe is a relatively short string of large-diameter pipes usually set in a drilled hole in onshore operations; it is normally washed, driven, or forced into the ground in bottom-supported offshore operations, which is sometimes referred to as a structural pipe. A drive pipe provides structural support at the top of a well and prevents the collapse of loose surface formations. It is the first casing in a well and helps guide the drill bit. Common sizes are 18 inches to 30 inches, and the setting ranges from 30 ft to 300 ft (or more).
(2)
Regarding a drive (structural) pipe, this layer of casing is located between the conductor and the surface pipe. The purpose of this casing pipe is to prevent washing out under the rig and provide elevation for the flow line in the rotary drilling rig. The conductor needs to be set deep enough in a formation that allows returns to the flow line.
(3)
Surface casing purposes are to protect surface freshwater formation, seal unconsolidated or lost circulation areas, support subsequent casing strings, and provide primary pressure control. Surface casing is usually set in the first competent formation, which is strong enough to close in on a kick. Common sizes are 9⅝ inches or 13⅜ inches, and the setting depth ranges from 1000 ft to 4000 ft or more.
(4)
Intermediate casing (also called protection casing) purposes are to separate the hole into workable sections and control lost circulation formations, salt sections, overpressured zones, and heaving shales. Intermediate casing is often planned to be set in a pressure transition zone, where pore pressures and fracture gradients increase. Common sizes are 7 inches to 9⅝ inches, and the setting depth ranges from 6000 ft to 12,000 ft (or more).
(5)
Production casing purposes are to isolate the pay zone from other formations and the fluids in them, provide protective housing for production equipment such as subsurface artificial lift, have multiple-zone completion, screen for sand control, and cover worn or damaged intermediate string. Common sizes are 4½ inches, 5 inches, and 7 inches. The setting depth ranges from 8000 ft to 20,000 ft or more.
(6)
Liners are used to save money, cover corroded/damaged casing, and cover lost circulation, plastic shales, and salt zones. Liners are used in deep wells where the rig is unable to lift a long string of casing. Setting depth is anywhere within intermediate or production intervals.

1.1. Casing-Setting-Depth Selection Processes

The two primary methods for selecting casing setting depths (“top-down” and “bottom-up” casings refer to the different strings used in a well, such as surface, intermediate, and production casing) are the bottom-up method and the top-down method. Both methods rely fundamentally on a graphical representation of the pore pressure and fracture gradient plotted against true vertical depth [3,4,5].

1.1.1. Top-Down Method

This method starts the design from the surface and works its way down towards the planned total depth. This process is as follows:
(1)
Determine the necessary mud weight to drill the first section (e.g., to protect freshwater aquifers or penetrate a shallow hazard).
(2)
Plot the mud weight line.
(3)
Set the casing setting depth for this section at the point where the mud weight line intersects the design fracture gradient line (FG minus kick margin). This point defines the weakest formation that can safely withstand the maximum mud pressure to be used in the next hole section.
(4)
Repeat the process for subsequent casing strings, working deeper into the well.
This method is generally preferred for exploration wells, where subsurface pressure data may be less specific, by starting with a conservative approach based on known surface conditions. Normally, this method provides more casing strings compared to bottom-up techniques.

1.1.2. Bottom-Up Method

This method starts the design from the planned total depth and works its way up towards the surface.
This process is as follows:
(1)
Determine the final required mud weight needed to reach the total depth (i.e., the mud weight to control the deepest pore pressure, including a trip margin). This is the highest mud weight to be used.
(2)
Plot this maximum mud weight line.
(3)
Find the deepest point in the wellbore where the maximum mud weight line intersects the design fracture gradient line. This depth is the setting point for the final casing string (production/deepest intermediate).
(4)
From this casing shoe depth, determine the mud weight required to drill to this depth safely.
(5)
Find the point where this new mud weight intersects the design fracture gradient line above it. This is the setting point for the subsequent shallower casing strings (e.g., intermediate casing).
(6)
Repeat the process until the surface is reached.
This method is commonly used for development wells when more accurate pore pressure and fracture gradient data from nearby (offset) wells are available. This method often results in a more optimized (deeper) setting depth for each casing string.

1.1.3. Other Influencing Factors

While pore and fracture pressures are the primary technical drivers, other operational and regulatory factors also influence the final casing setting depth:
(a)
Regulatory Requirements:
  • Surface casing must be set deep enough to isolate freshwater aquifers and provide an adequate foundation for the blowout preventer system.
  • There should be a Kick Tolerance, which is the well’s ability to safely contain and circulate out a formation fluid influx (kick) of a defined size.
(b)
Geological/Formation Factors:
  • Problem Zones: Unstable shales, formations prone to lost circulation, high-pressure zones, or highly corrosive formations should be isolated.
  • Salt Formations: Casing must be set above salt sections that are likely to creep or flow.
  • Shallow Hazards: Specific shallow risks like shallow gas or shallow water flow require isolation with the conductor or surface casing.
  • Economic Factors: The number and depth of casing strings should be optimized to minimize costs (casing, cement, and drilling time) while maintaining safety.
  • Wellbore Stability: The length of the open hole exposed should be limited, especially in unstable or reactive formations.

1.2. Prediction of Pore Pressure Profile

Casing setting depth is typically evaluated using the relationship between depth, pore pressure, and fracture pressure or gradients. Therefore, it is essential to estimate pore pressure and fracturing pressure profiles with depth to conduct casing-setting-depth evaluation. Pore pressure evaluation is an integral part of well planning, formation evaluation, and safety [6]. To drill safely, it is necessary to detect pore pressure and fracture pressure so the mud density can be optimized to provide sufficient overbalance while remaining low enough to avoid compromising formation integrity. A quantitative pre-drill forecast of pore pressure is needed while drilling in overpressured formations, and this might be achieved through elastic velocities using a velocity-to-pore-pressure transformation model calibrated with measured pressure data [7,8,9]. Pore pressures in most deep sedimentary formations are not hydrostatic; instead, they are overpressured and elevated even to more than double the hydrostatic pressure. If the abnormal pressures are not accurately predicted prior to drilling, catastrophic incidents, such as well blowouts, may take place [10]. The fundamental theory for pore pressure prediction is based on the effective stress law. This theory indicates that pore pressure in the formation is a function of total stress (or overburden stress) and effective stress. The overburden stress, effective vertical stress, and pore pressure can be expressed in the following form [11]:
σ v e f f = σ v α P p
where P p is the pore pressure; σ v is the overburden stress; σ v e f f is the vertical effective stress; and α is Biot’s effective stress coefficient (equal to 1.0 for permeable and fractured rocks).
Pore pressure can be calculated from Equation (1) when overburden and effective stresses are known. Overburden stress can be easily obtained from bulk density logs, while effective stress can be correlated to well log data, such as resistivity, sonic travel time/velocity, bulk density, and drilling parameters [11]. Pore pressure analyses include three aspects: pre-drill pore pressure prediction, pore pressure prediction while drilling, and post-well pore pressure analysis.
(1)
The pre-drill pore pressure can be predicted by using the seismic interval velocity data in the planned well location, as well as using geological, well logging, and drilling data in the offset wells.
(2)
The pore pressure prediction while drilling mainly uses logging while drilling (LWD), measurement while drilling (MWD), drilling parameters, and mud logging data for analysis.
(3)
The post-well analysis analyzes pore pressures in the drilled wells using all available data to build a pore pressure model, which can be used for pre-drill pore pressure predictions in future wells [11].

1.3. Lithological Column Profile

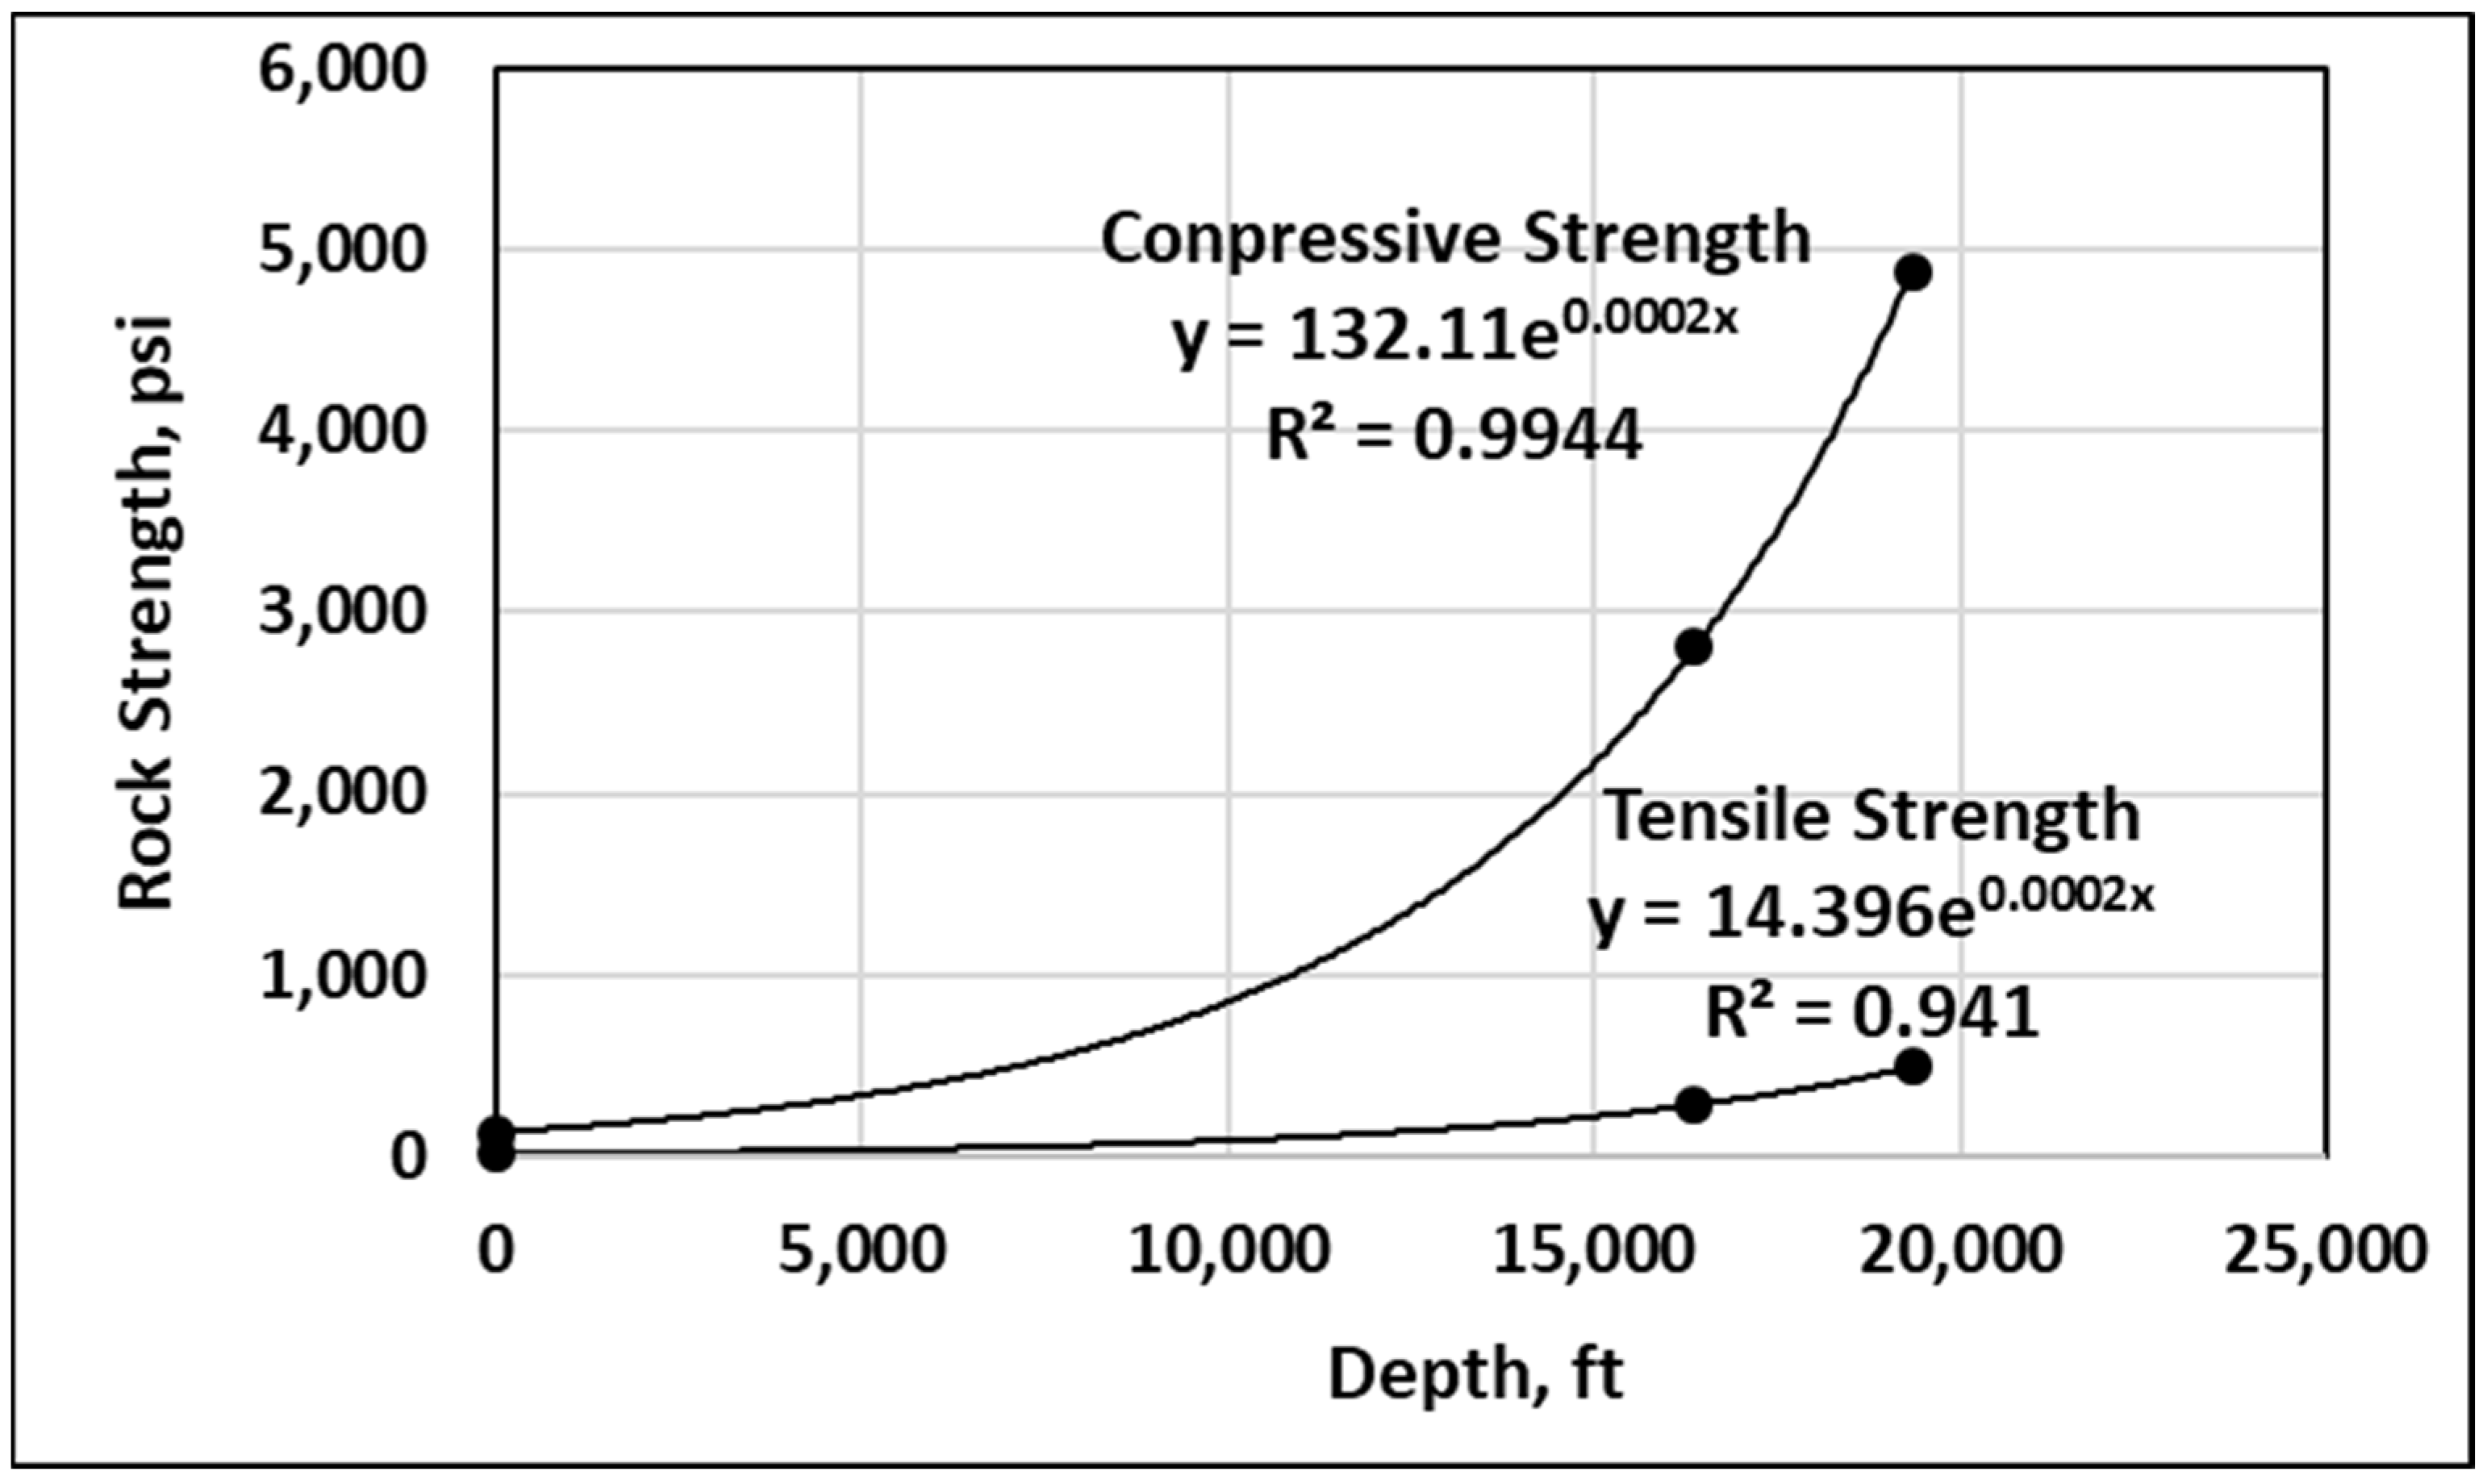
Another important piece of information required for drilling and casing setting depth and casing design is the lithological column of interest, as shown in Figure 2 for Saudi Arabia [12]. The lithological column is the description of the sequence of formations that are predicted to be present in the well to be drilled. Every formation should be described in terms of strength, drilling problems, reservoir potentials, etc. This information will assist in selecting the depth of the various casing shoes, as the type of formation and its depth will give a good indication of formation strength [13]. AlAwad et al. [12] studied three sandstone formations, namely, Um Assha’al (20 ft depth, 131 psi uniaxial compressive strength, and 13.1 psi Brazilian tensile strength), Sarah (16,350 ft depth, 2810.4 psi uniaxial compressive strength, and 281 psi Brazilian tensile strength) and Saq (19,350 ft depth, 4881.6 psi uniaxial compressive strength, and 488.2 psi Brazilian tensile strength) for potential use in petroleum engineering research applications.

1.4. Casing-Setting-Depth Estimation

Methods involved in casing-setting-depth selection are those of Hubbert and Willis, Mathews and Kelly, and Eaton, the theoretical leak-off method, the field leak-off test, measurement while drilling, well logging, and Mohr–Coulomb Criterion. The following methods are the most applicable for fracturing pressure estimation.

1.4.1. Hubbert and Willis Method

The Hubbert and Willis method, developed in 1957, is a fundamental approach for estimating the fracture pressure gradient required to fracture a rock formation during drilling. It suggests that fracturing occurs when the injected fluid pressure equals the minimum stress, which is a function of the overburden pressure, pore pressure, and rock properties like Poisson’s ratio. This method established the foundation for many subsequent techniques for predicting the pressure at which a wellbore will fracture. The Hubbert and Willis method is represented by the following equation [14]:
P f r a c t u r i n g = 1 3 σ v + 2 3 P p
where σ v is the in situ vertical (overburden) stress; P p is the formation pore fluid pressure; and P f r a c t u r i n g is the formation fracturing pressure.

1.4.2. Eaton Method

Eaton modified the Hubbert and Willis method by assuming that both overburden stress and Poisson’s ratio are assumed to be variable. Eaton also assumed elastic rock behavior and a lateral strain that could be related to the vertical stress ratio as a function of Poisson’s ratio. The horizontal and vertical stress ratios and the matrix stress coefficient are dependent on Poisson’s ratio of the formation. Mathematically, the model can be written as follows [14]:
P f r a c t u r i n g = υ 1 ν ( σ v P p ) + P p
where v is Poisson’s ratio; σ v is the in situ vertical (overburden) stress; P p is the formation pore fluid pressure; and P f r a c t u r i n g is the formation fracturing pressure.

1.4.3. Mathews and Kelly Method

Since the Hubbert and Willis method was found not to apply in soft rocks such as those in the Gulf of Mexico and the North Sea, Mathews and Kelly modified the Hubbert and Willis method by introducing the stress factor as follows [14]:
P f r a c t u r i n g = k   ( σ v P p ) + P p
where k is the stress ratio estimated using ( σ v P p ) 0.535   a n d   M a t h e w s   &   K e l l y   s t r e s s   c u r v e s ; σ v is the in situ vertical (overburden) stress; P p is the formation pore fluid pressure; and P f r a c t u r i n g is the formation fracturing pressure.

1.4.4. The Christman Method

Christman proposed a method to predict fracture gradients for offshore field applications [14].
P f r a c t u r i n g = F   ( σ v P p ) + P p
Here, F is the stress ratio factor =   ( σ H + σ h ) / 2 σ v ; σ v is the in situ vertical (overburden) stress; P p is the formation pore fluid pressure; and P f r a c t u r i n g is the formation fracturing pressure.

1.4.5. Field Leak-Off Test

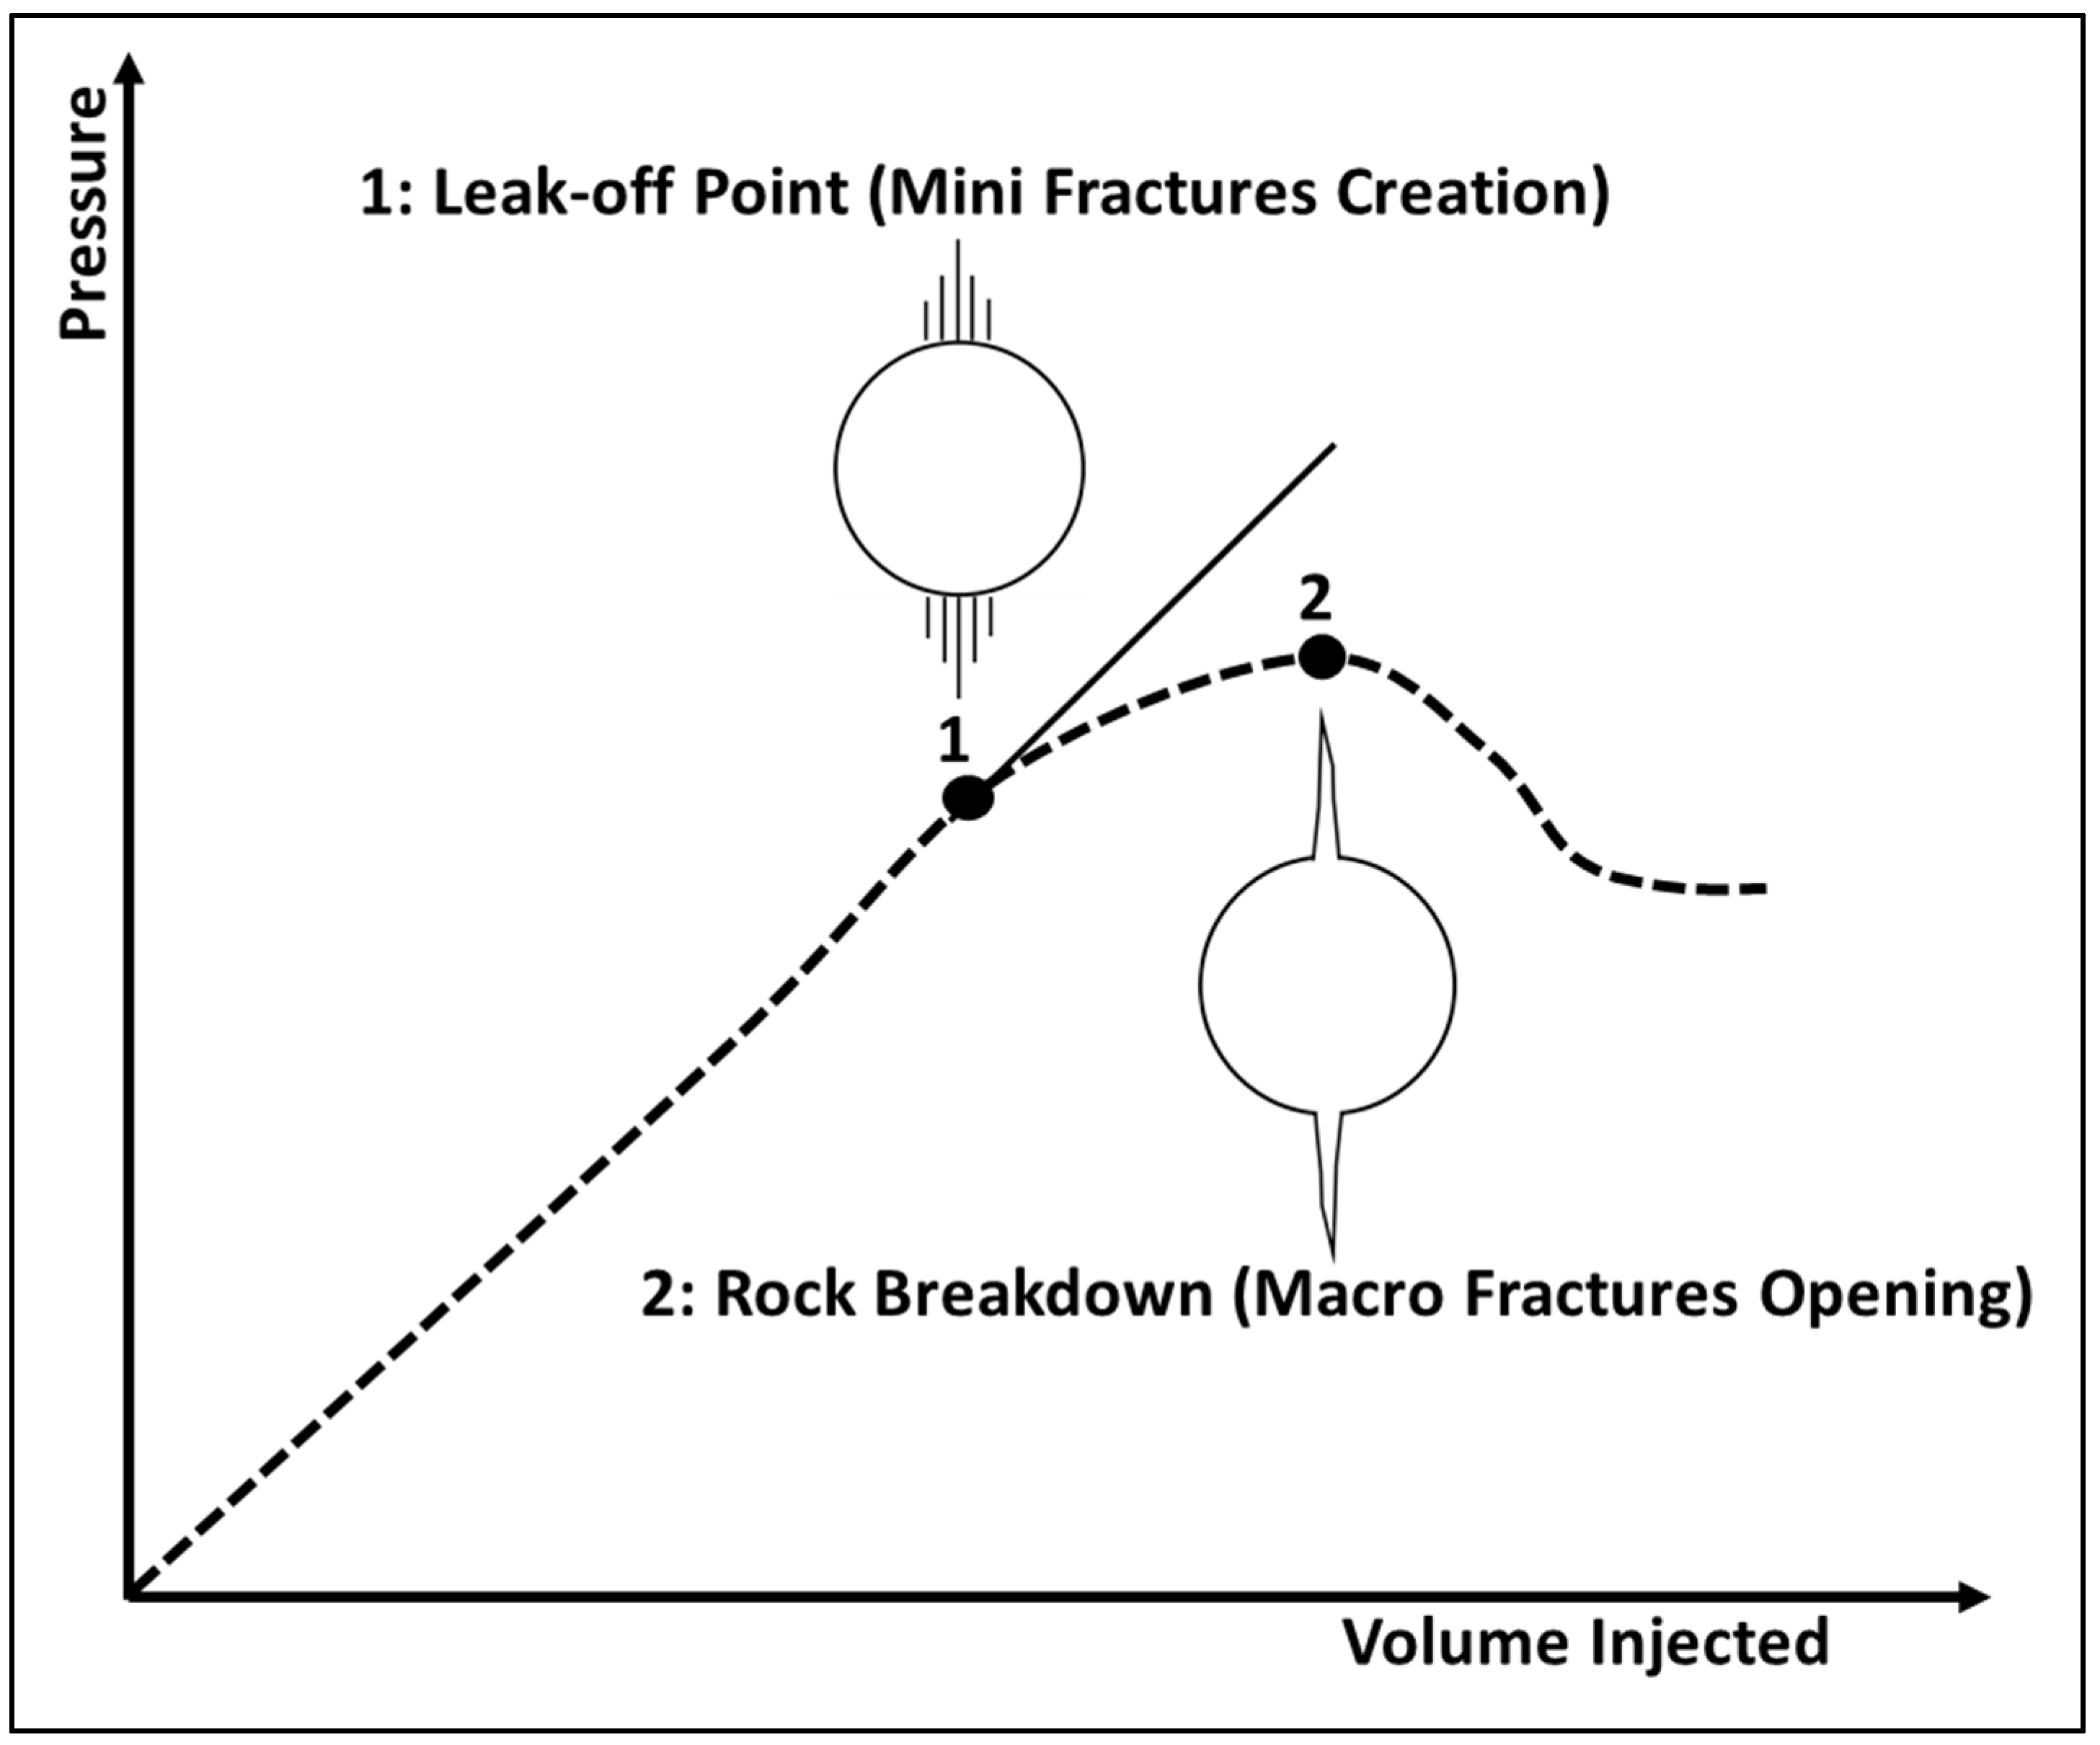
A leak-off test is a test to determine the strength or fracture pressure of the open formation, which is usually conducted immediately after drilling below a new casing shoe. During the test, the well is shut in, and fluid is pumped into the wellbore to gradually increase the pressure that the formation experiences. Under some pressure, fluid will enter the formation, or leak off, either moving through permeable paths in the rock or by creating a space by fracturing the rock, as shown in Figure 2. The results of the leak-off test dictate the maximum pressure or mud weight that may be applied to the well during drilling operations. To maintain a small safety factor to permit safe well control operations, the maximum operating pressure is usually slightly below the leak-off test result [15].
Theoretically, leak-off pressure is equivalent to the sum of the in situ minimum horizontal stress and the formation tensile strength, and it is given by the following equation:
P f r a c t u r i n g = σ h + σ t
where P f r a c t u r i n g is the fracturing pressure estimated using the leak-off method; σ h is the in situ minimum horizontal stress; σ t is the formation rock tensile strength; and P f r a c t u r i n g is the formation fracturing pressure.

1.4.6. Measurement While Drilling

Measurement while drilling (MWD) is a sophisticated technology that has transformed the way we approach oil and gas exploration and other drilling activities. MWD involves equipping the drill string with specialized sensors that gather critical downhole data. This information is then transmitted to the surface in real time, providing our engineers and geologists with an immediate snapshot of conditions deep within the Earth. Before MWD, we relied on taking the drill pipe out of the hole to acquire data, a time-consuming and expensive process. MWD eliminates this need, allowing for continuous data collection and significantly improving drilling efficiency and safety. Measurement while drilling can provide information such as rock strength and pore pressure magnitudes, which can be used to adjust the ongoing drilling program and future drilling operations in the same area. At the heart of the drill string, just above the drill bit, sits the MWD tool. This tool houses an array of sensors designed to measure various parameters. These sensors are incredibly robust and built to withstand extreme temperatures, pressures, and vibrations inherent in the drilling process [16].
(1)
Gamma Ray (GR): Measures natural radioactivity of formations, helping to identify lithology (rock type) and differentiate between shales and sandstones.
(2)
Resistivity (Res): Measures the electrical resistance of formations, which can indicate the presence of hydrocarbons or water.
(3)
Inclination and Azimuth: Essential for determining the wellbore’s deviation from vertical positioning and its directional orientation. These are crucial for accurate and good placement.
(4)
Annular Pressure: Monitors the pressure in the annulus (the space between the drill pipe and the wellbore wall), which is vital for good control and preventing kicks.
(5)
Vibration and Shock: Detects vibrations and shocks experienced by the drill bit and bottom hole assembly, helping us optimize drilling parameters and prevent equipment damage.
(6)
Temperature: Measures the downhole temperature, which is important for understanding fluid properties and tool limitations.
(7)
Pore Pressure: The stethoscope service provides formation pressure-while-drilling (FPWD) measurements that are used to predict pore pressure trends throughout the wellbore.

1.4.7. Well Logging

Pore pressure evaluation from well logs involves several methods and techniques, such as the following [17,18,19]:
(1)
Interval Velocity Volume: This method estimates pre-drill pore pressure using interval velocity and pressure data from nearby calibrated wells. It is crucial for well planning to have an estimate of the expected pressure regime to be encountered in the subsurface.
(2)
Hybrid Machine Learning Models: These models, such as the multilayer extreme learning machine model hybridized with particle swarm optimization, have been developed to predict pore pressure accurately from well logs. They have shown superior accuracy compared to commonly used empirical formulas.
(3)
Shale Sections: Shale sections are particularly useful for analyzing well logs for abnormal pore pressure due to their low permeabilities. By selecting only the purest shales, the effects of mineral variation, fluid composition, and fluid distribution are minimized, leaving only porosity as the major variable.
(4)
Pore Pressure Gradient Estimation: Techniques like Miller’s sonic equation have been used to determine pore pressure from wells. The variation of overburden gradient and pore pressure gradient with depth has been studied, providing depth intervals for estimation.
(5)
Drilling Exponent: The drilling exponent is a concept used in well logging to evaluate pore pressure and fracture pressure. It helps optimize mud density for sufficient overbalance while being low enough to avoid borehole instability.
(6)
These methods and techniques are essential for safe and efficient drilling operations, ensuring that the necessary information is available to make informed decisions about well planning and execution.

1.4.8. Mohr–Coulomb Failure Criterion

This study proposes a new method for casing-setting-depth selection based on the fracturing pressure estimated by the Mohr–Coulomb failure criterion. To utilize this new casing-setting-depth selection method, several input factors are required, including the following:
(1)
In-situ Earth principal stresses (vertical stress and maximum and minimum horizontal stresses).
(2)
Formation pore fluid pressure.
(3)
Formation rock uniaxial compressive strength and tensile strength.
(4)
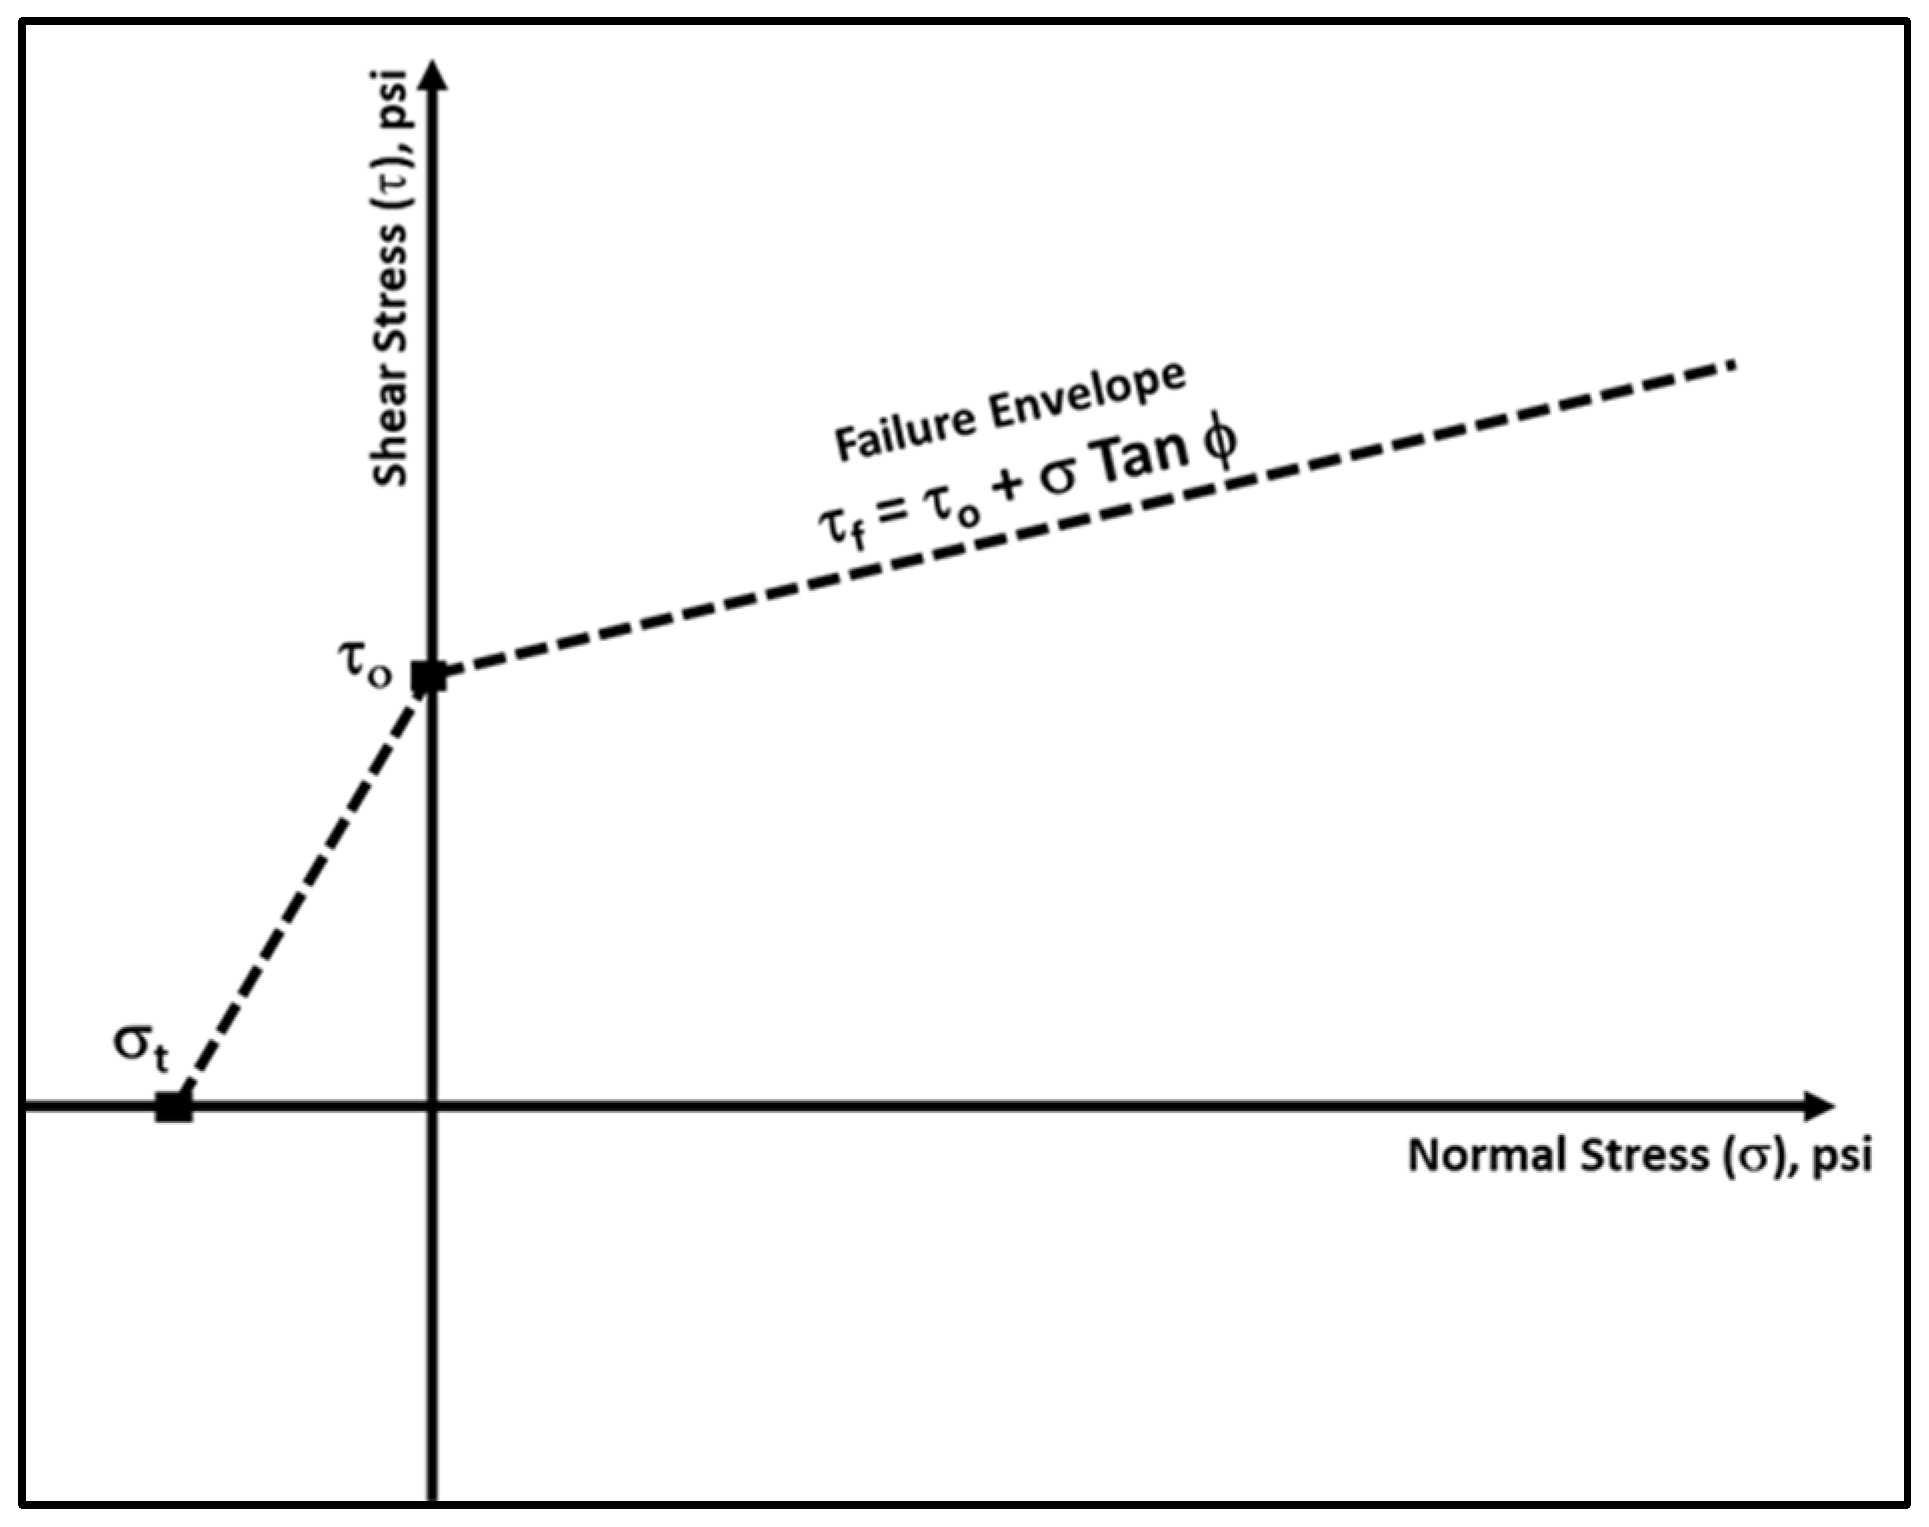
Formation rock failure criteria (Mohr–Coulomb failure criteria), which is given by the following equation [20]:
τ f = τ o + σ T a n   ϕ
where τ f is the shear stress; τ o is the apparent cohesion; σ is the normal stress; and ϕ is the angle of internal friction.
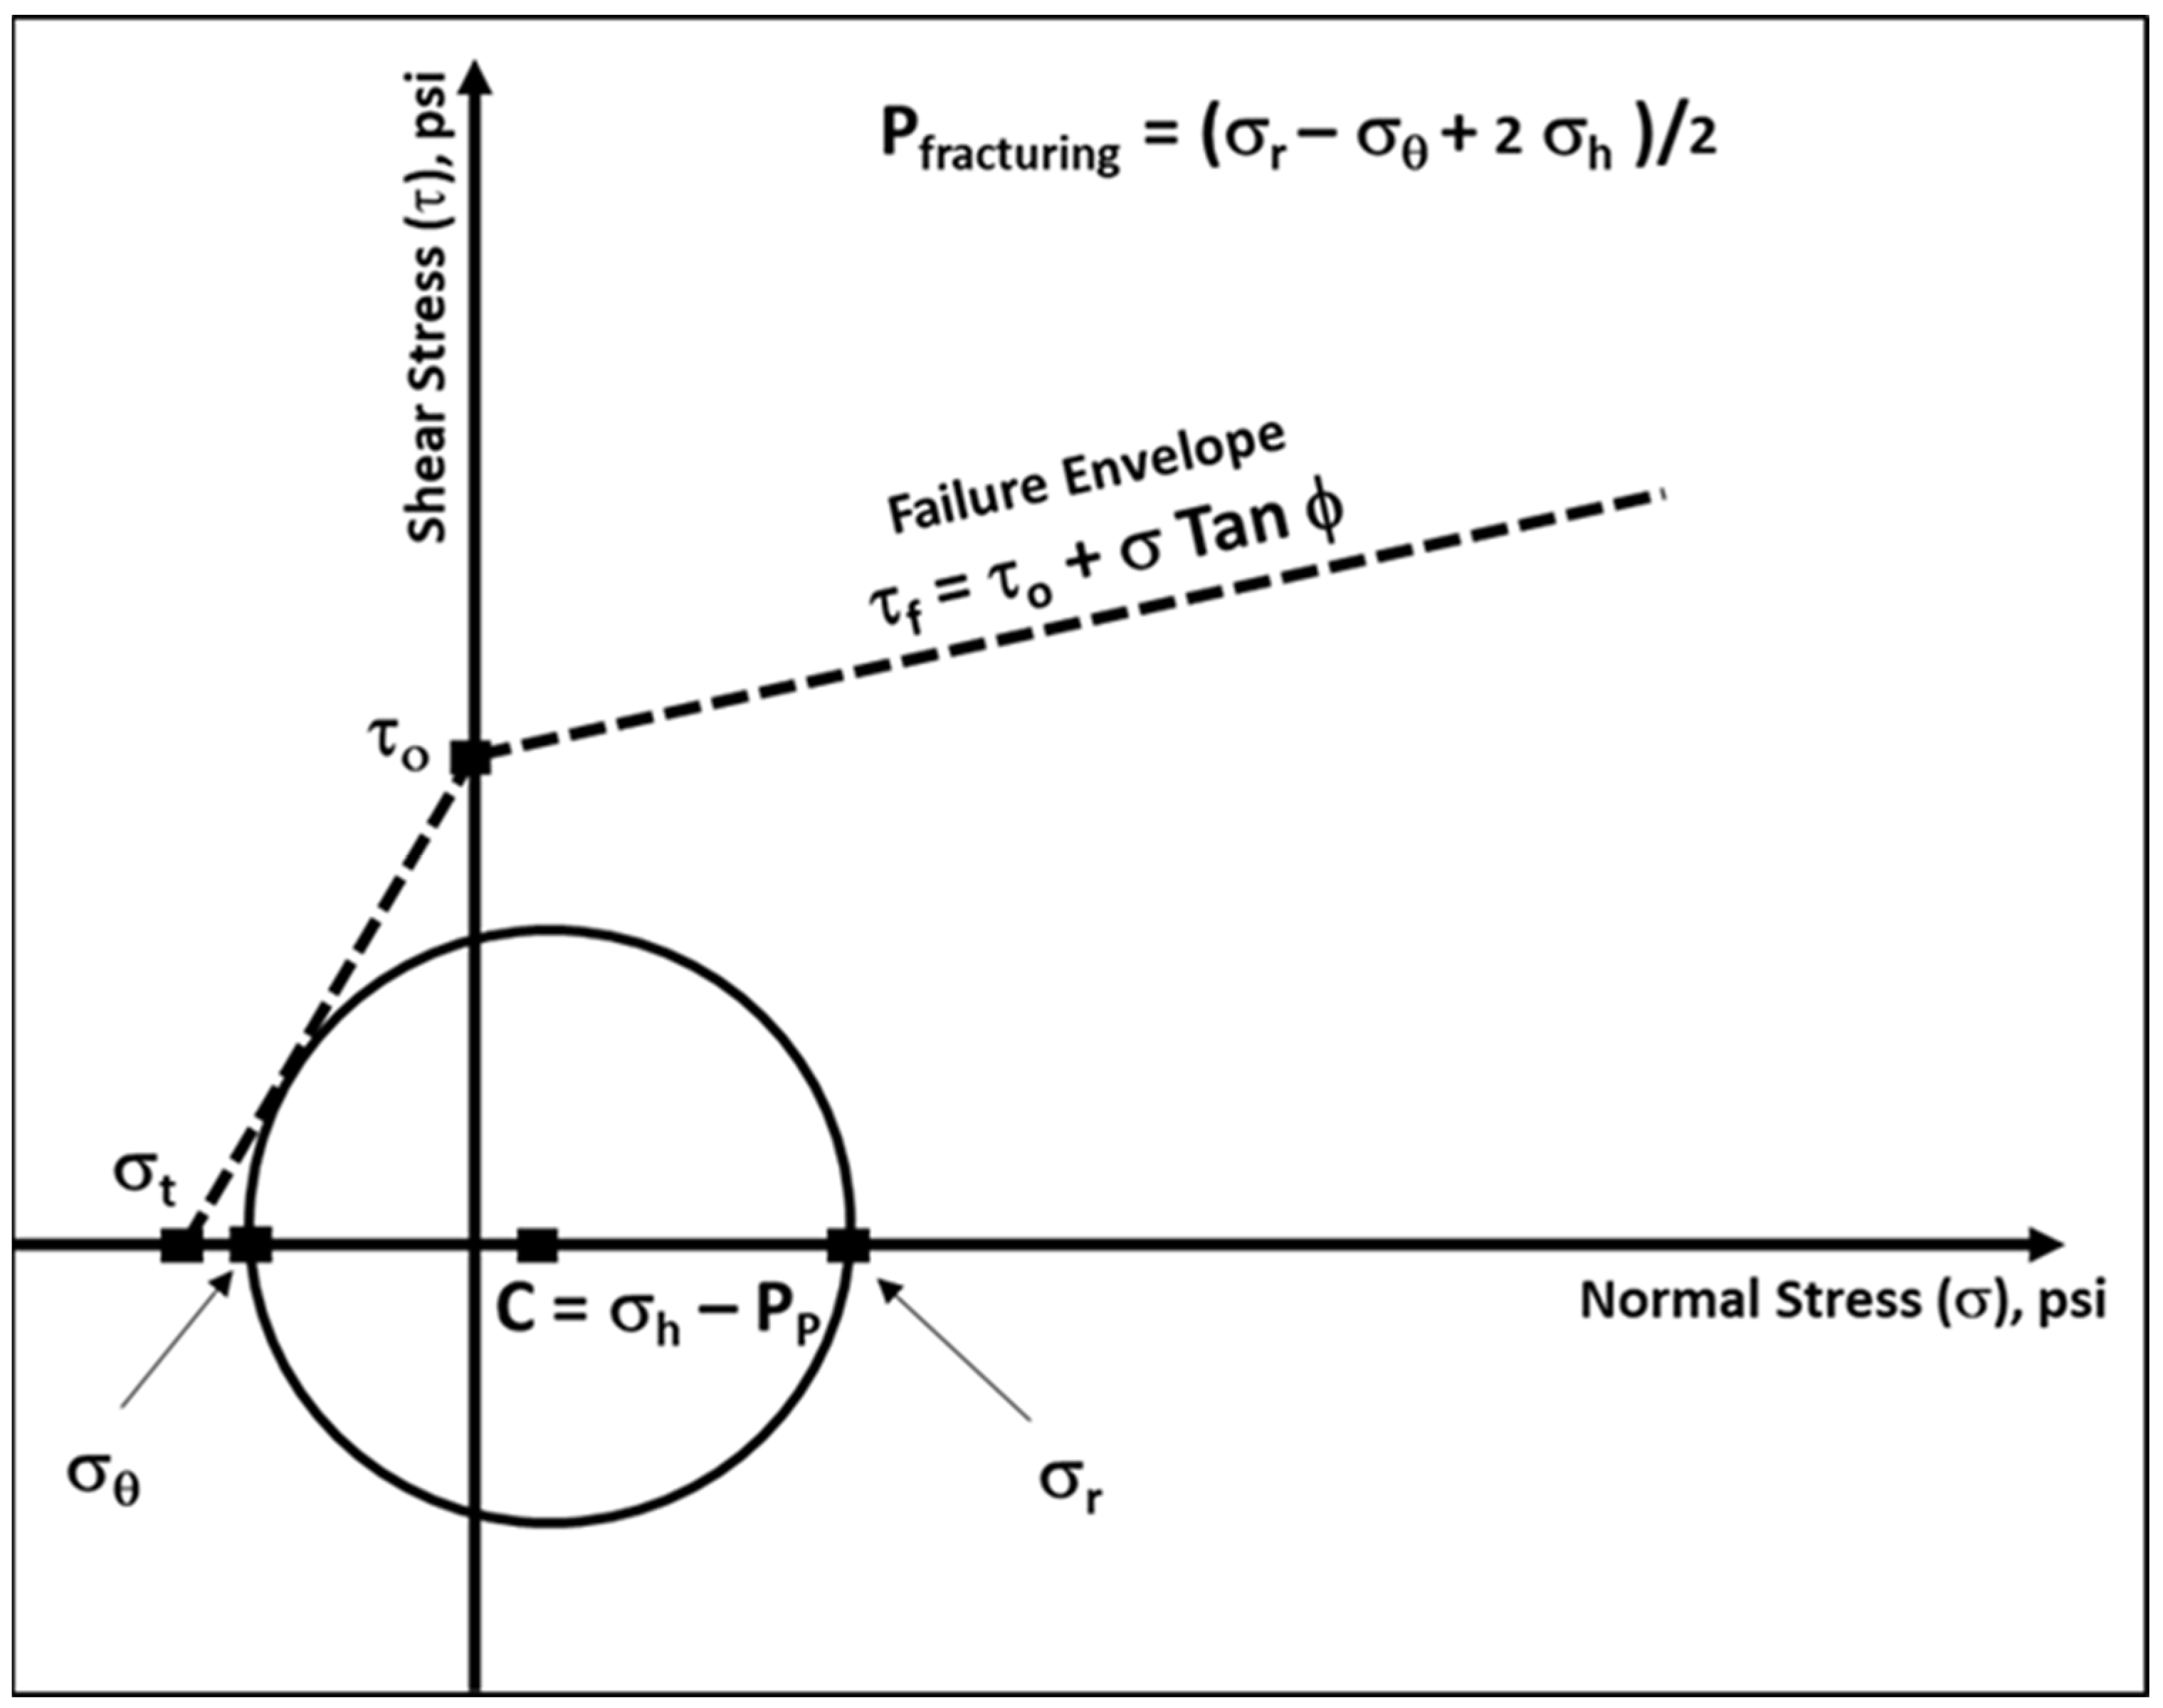
This method is newly used by this study to estimate casing setting depth by predicting the formation fracturing pressure. Formation fracturing pressure is estimated by constructing the maximum Mohr circle corresponding to the specified depth point (formation type), with a center given by the following equation:
C = σ h P P
where C is the center of the maximum allowable Mohr circle; σ h is the in situ minimum horizontal stress; and P P is the formation pore fluid pressure.
The maximum allowable Mohr circle for a given formation is found by applying the following procedure:
i.
For the specified formation (rock type), obtain the pore pressure value from the pore pressure versus depth profile. For the same depth, calculate the minimum in situ principal stress using the area in situ stress gradient (0.96 psi/ft for this study lithology).
ii.
Calculate the center of the circle representing the conditions of this formation (rock type) using Equation (8).
iii.
Locate the center of the circle on the x-axis of the failure criteria plot of the formation (rock) under investigation.
iv.
Fix the caliper to the center point specified in the previous step, then open the compass until it touches the failure envelope curve at one point, and then draw a full circle.
v.
For the drawn circle, find the values of the two intersection points between the drawn circle and the x-axis, which correspond to the formation (rock) maximum induced radial ( σ r ) and the maximum induced tangential stresses ( σ θ ) as shown in Figure 3.
vi.
Using the maximum induced radial and tangential stresses estimated in the previous step, the fracturing pressure for any objective depth is calculated as follows [21]:
P f r a c t u r i n g = σ r σ θ + 2 σ h 2
where P f r a c t u r i n g is the formation fracturing pressure; σ h is the in situ minimum horizontal stress; σ r is the induced radial stress; and σ θ is the induced tangential (hoop) stress.
This method requires laboratory testing of an appreciable number of core samples obtained from various depths along the depth of the area under consideration. The center of the circle shifts to the left or to the right sides according to the depth point where the horizontal principal in situ stress and the pore pressure magnitudes change. To estimate the maximum safe conditions, the radius of the circle is increased until it touches the failure envelope either in the negative tensile area on the left side of the y-axis or the positive shear area on the right side of the y-axis. After defining the maximum size of the circle, the radial and the tangential stresses are evaluated, and these values are plugged into Equation (9) to estimate the fracturing pressure value at this depth. This process is repeated at various depths until the complete fracturing pressure versus pore pressure and depth is defined.
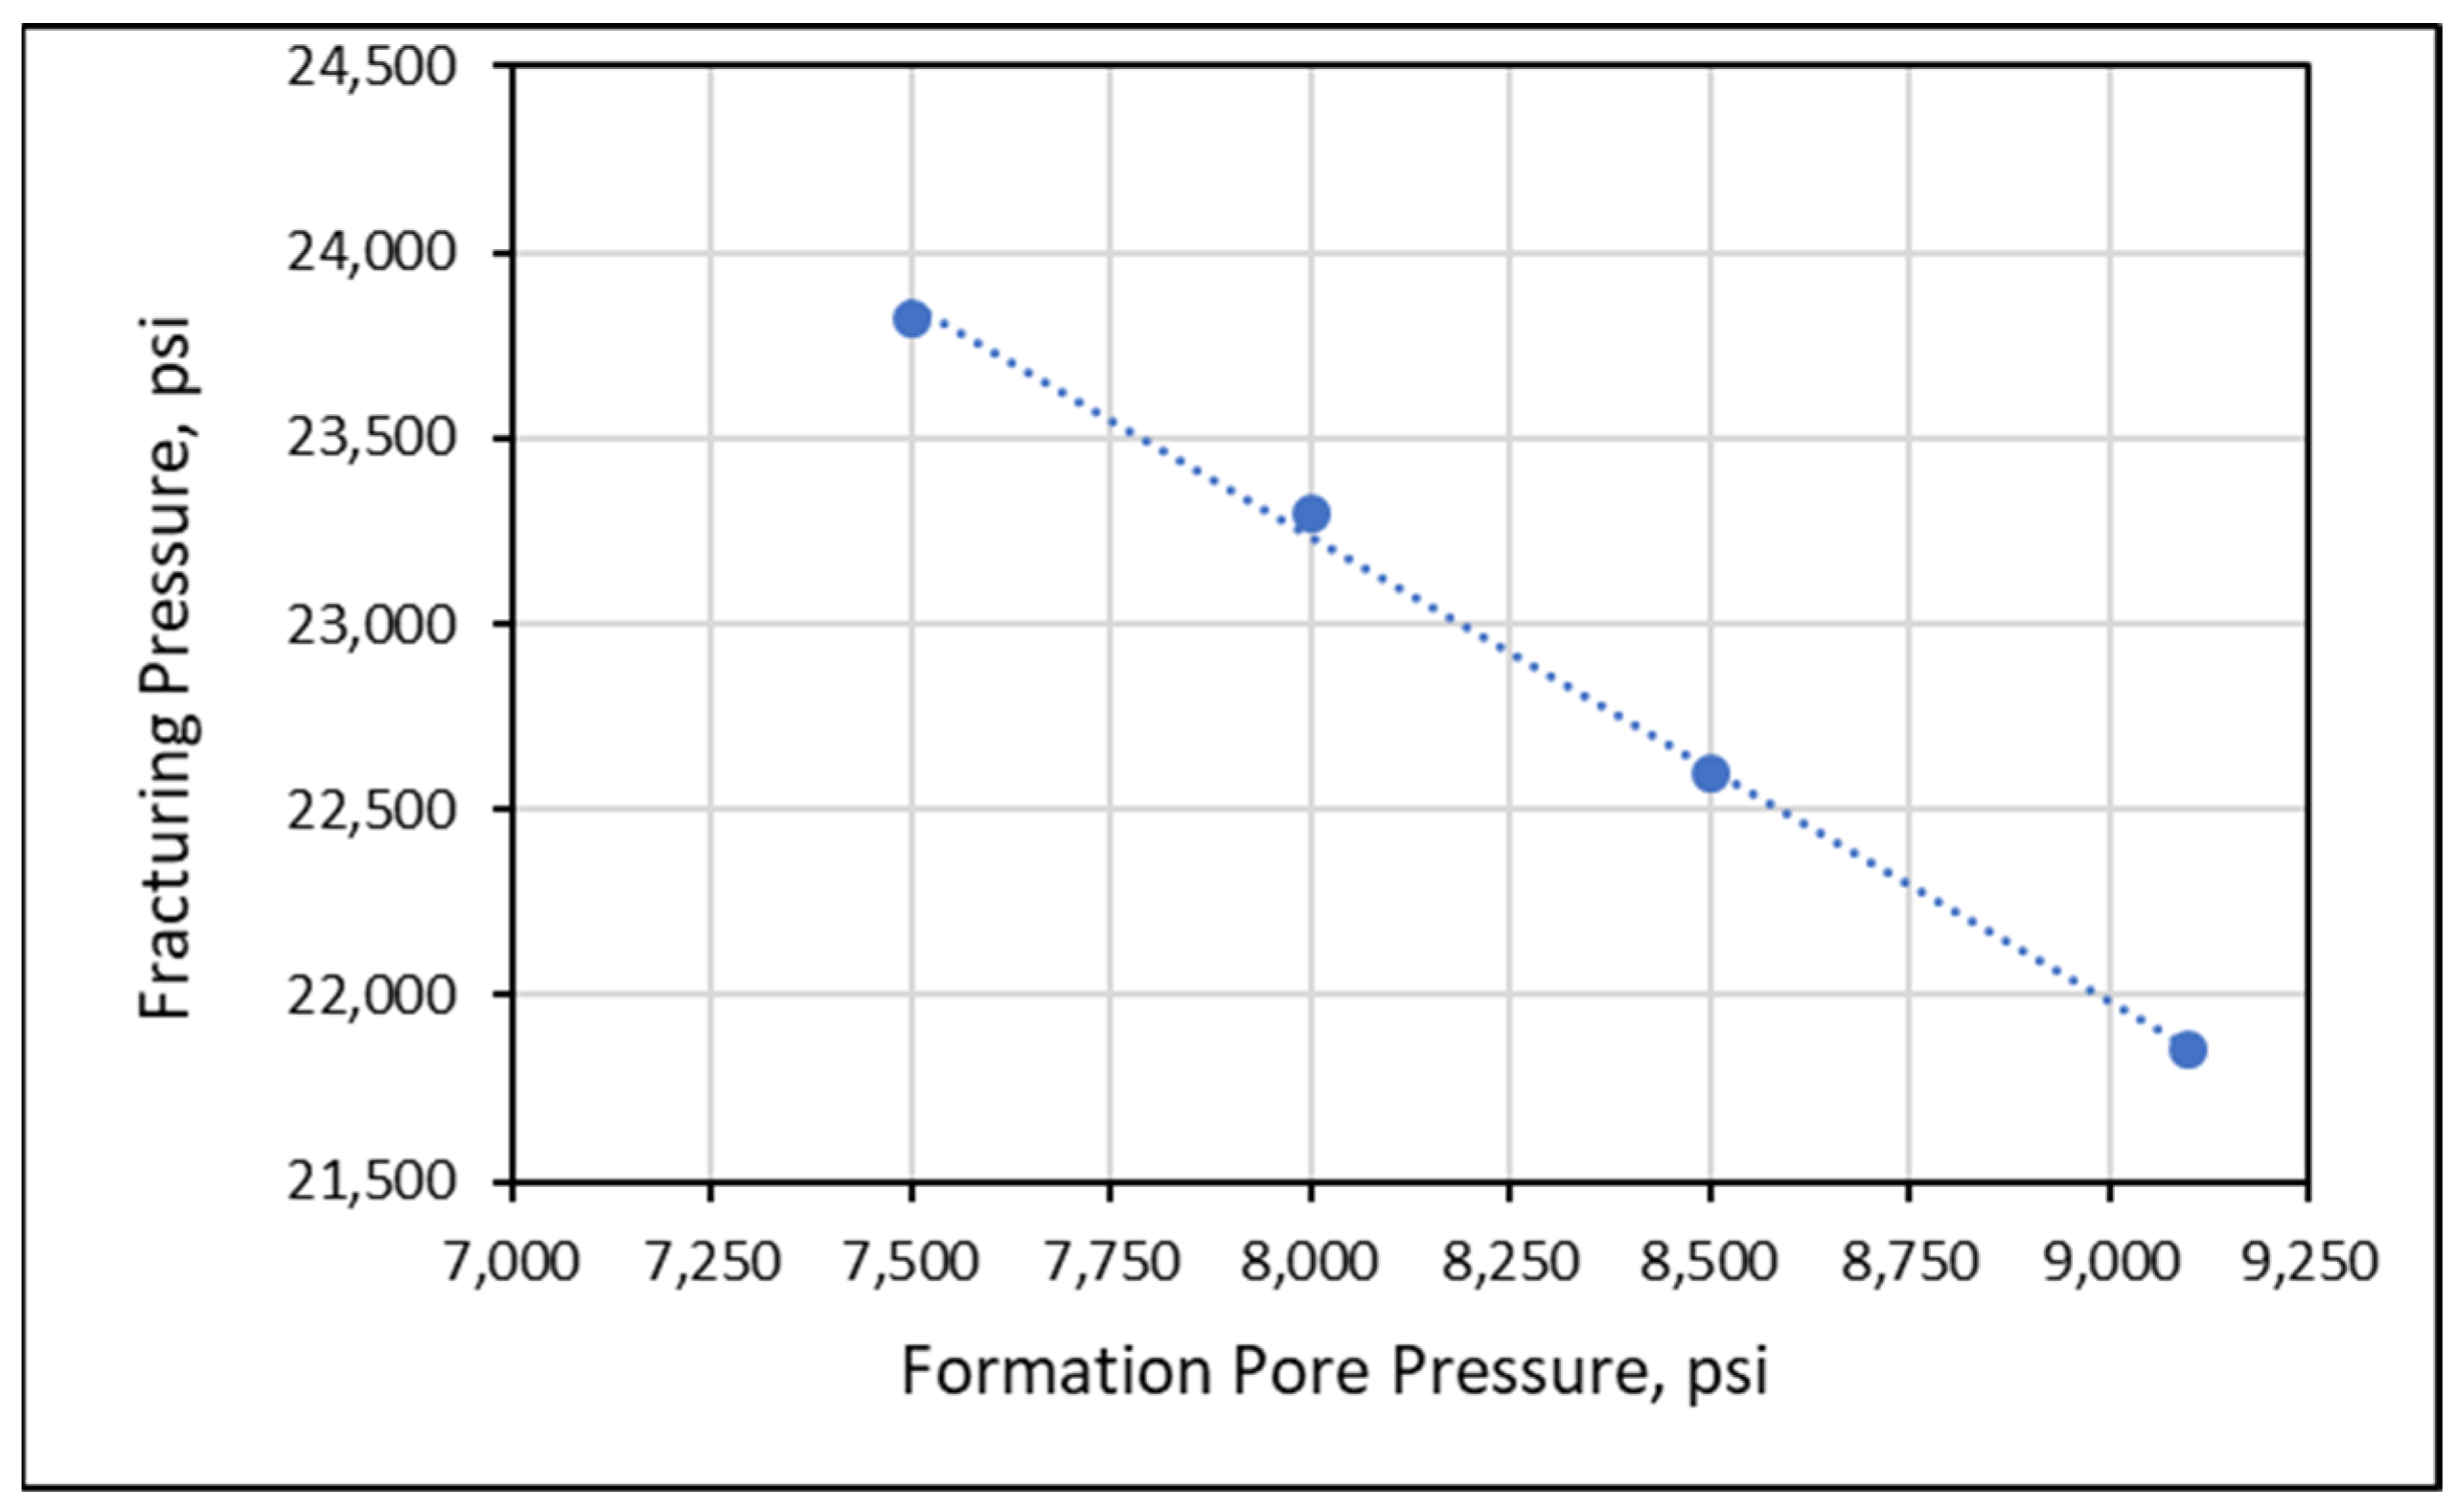
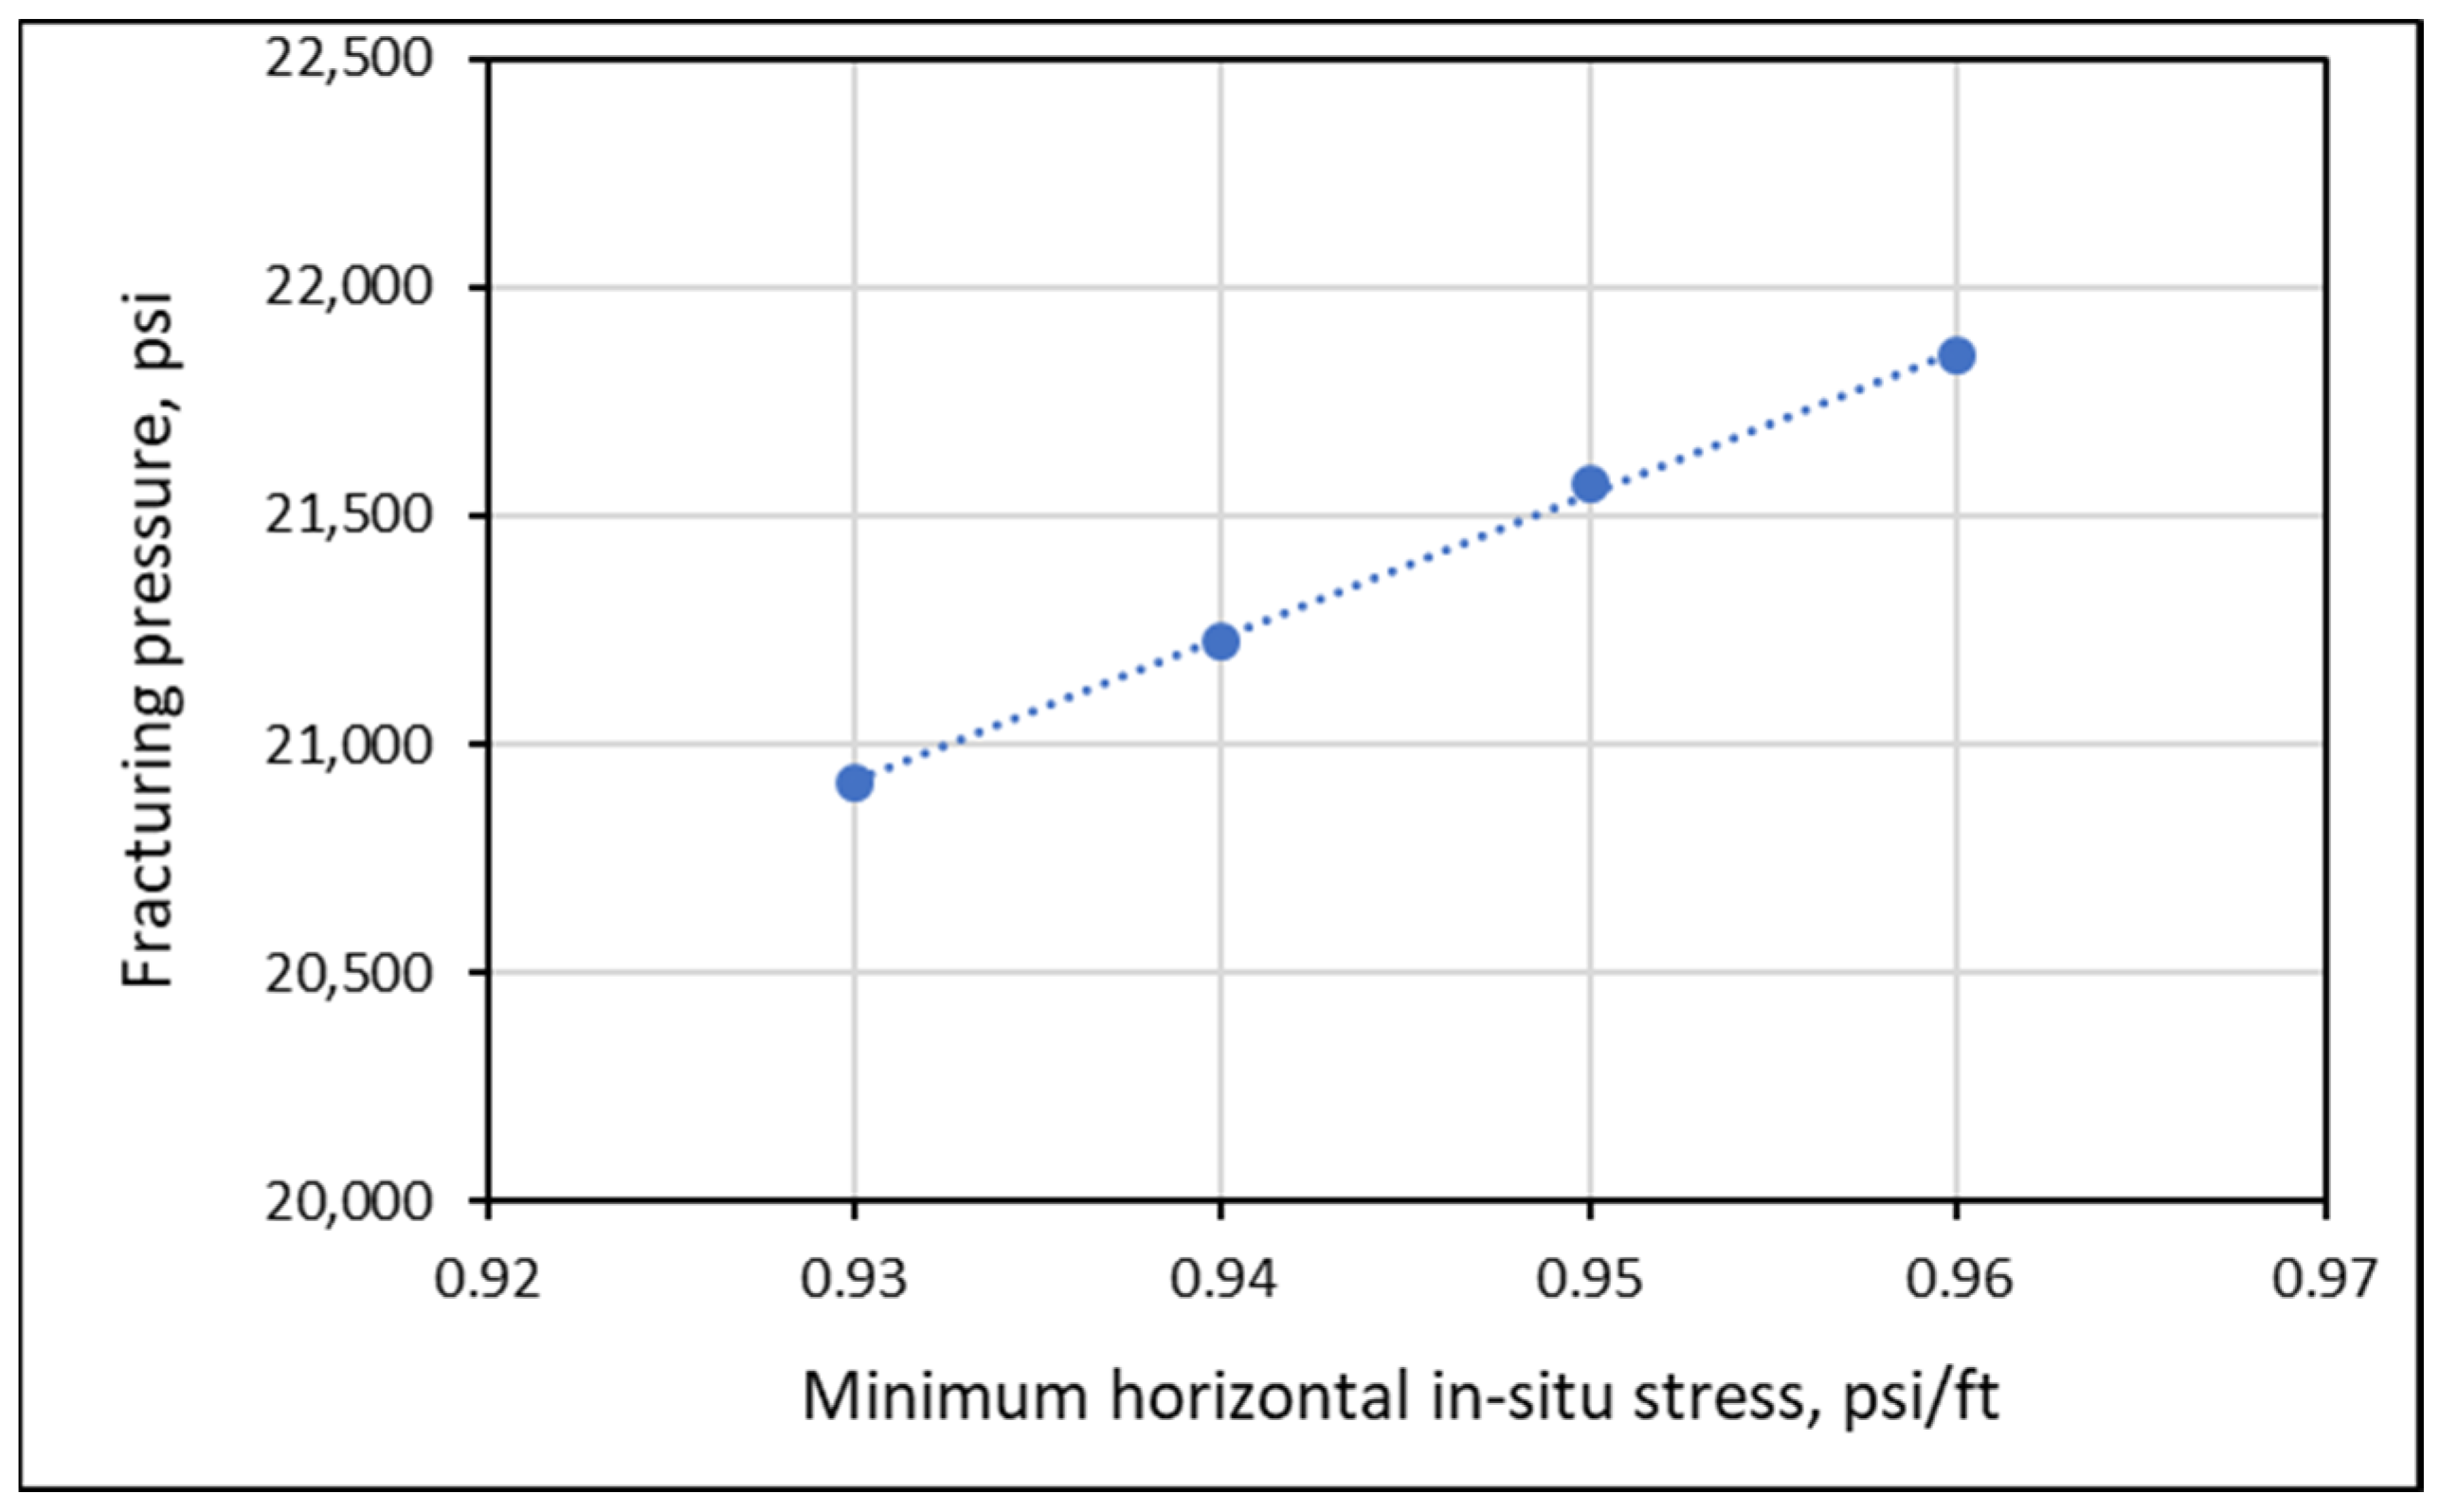
The new proposed casing-setting-depth estimation method is mainly dependent on formation strength (failure criterion), pore fluid pressure, and in situ minimum horizontal stress, as shown in Equations (8) and (9). Table 1 and Figure 4 and Figure 5 represent the sensitivity analysis of this new proposed method for the Sarah sandstone formation.
The objectives of this study are to measure the uniaxial compressive strength and the indirect (Brazilian) tensile strength for selected core samples representing the Saudi lithological column. The second objective is to estimate casing setting depth using Eaton, Hubbert and Willis, Mathews and Kelly, and leak-off methods. After this, a potential new casing-setting-depth selection method based on the Mohr–Coulomb failure criterion is introduced. Finally, economic comparisons between all casing-setting-depth methods are performed.

2. Materials and Testing Procedures

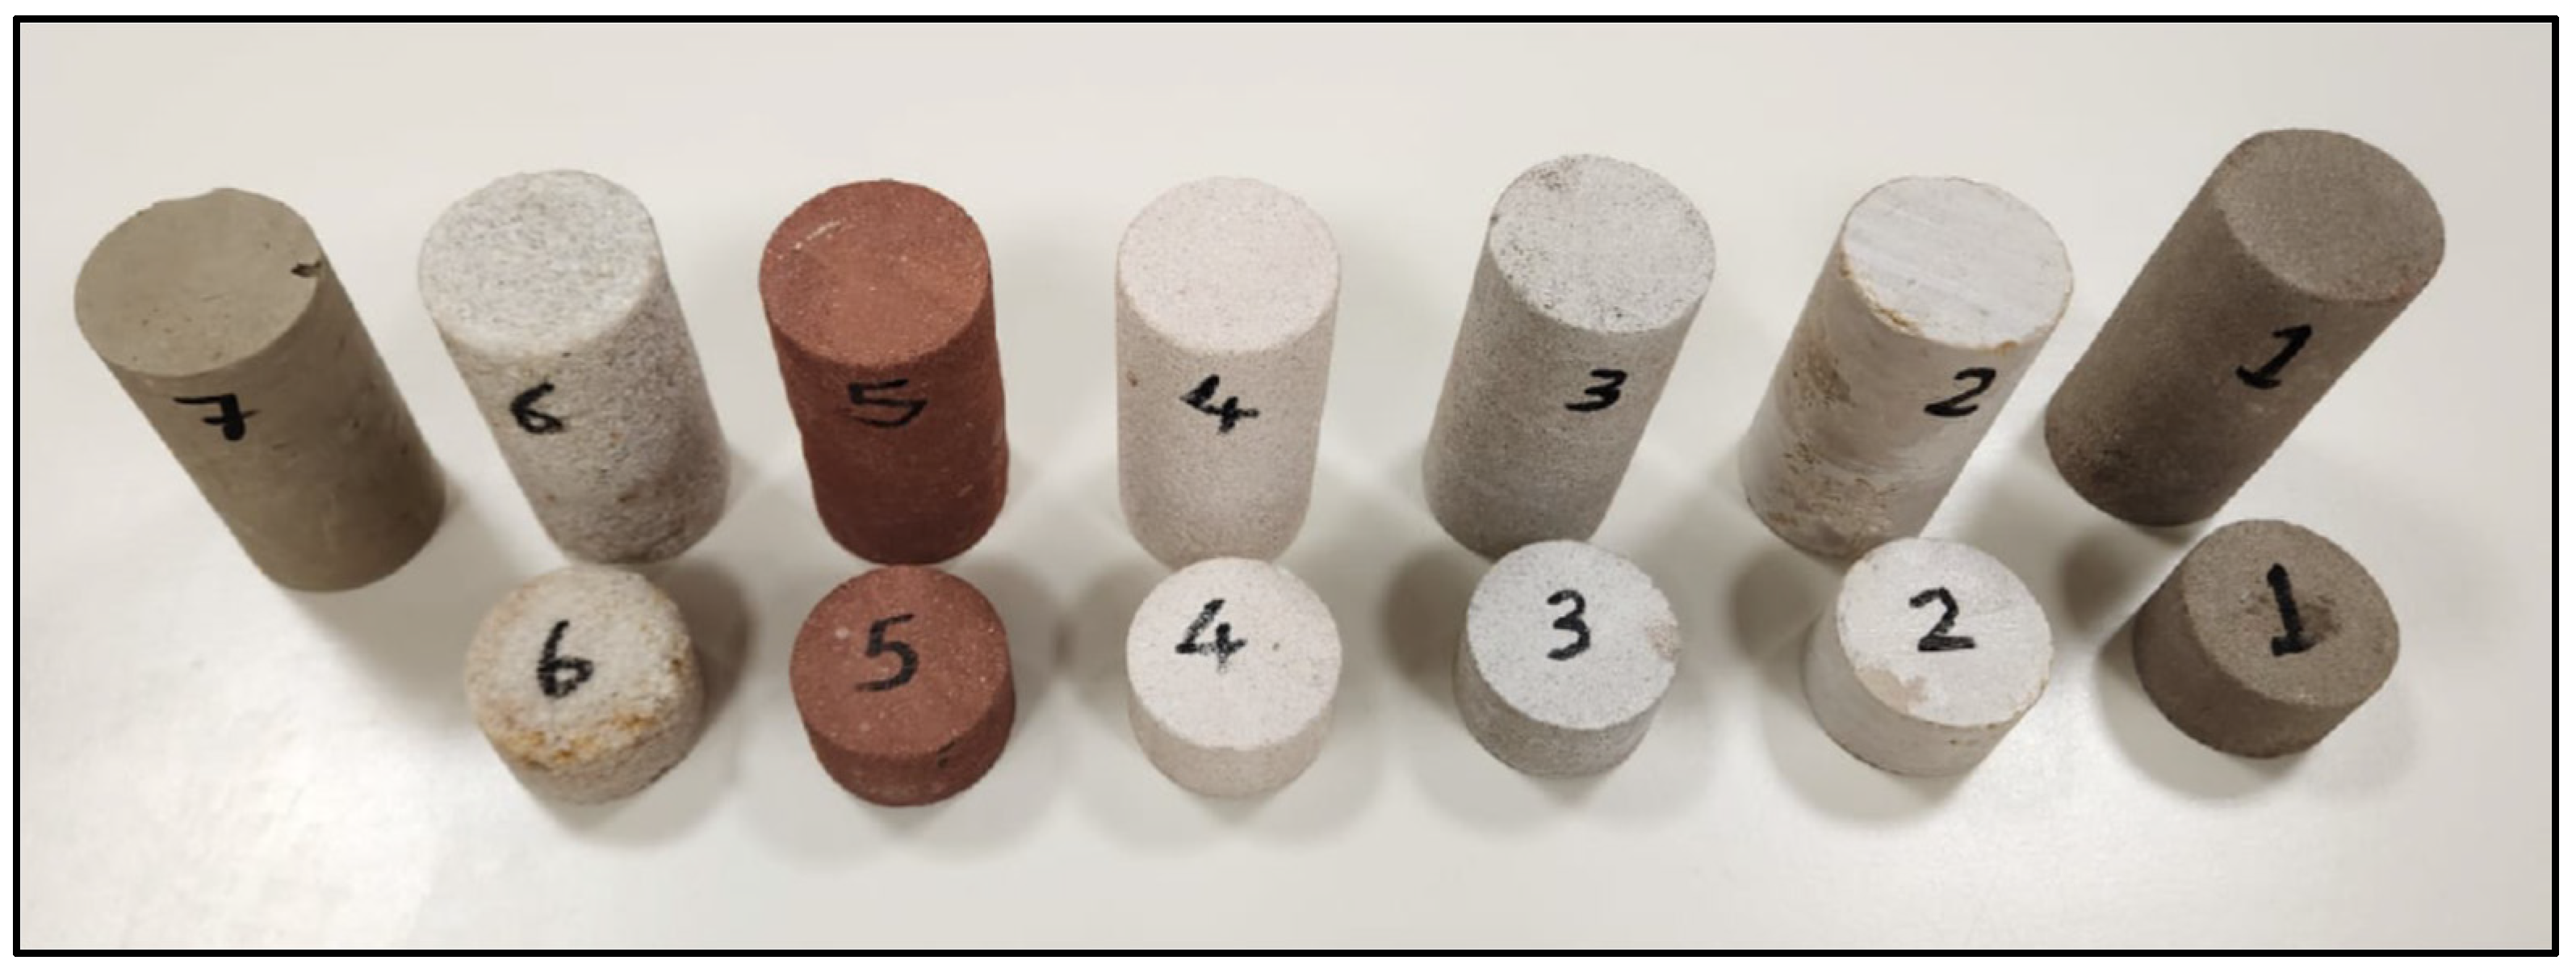
Ten core samples were obtained from the core storage in the Department of Petroleum and Natural Gas Engineering, College of Engineering, Riyadh, Saudi Arabia. These cores were collected from various locations in Saudi Arabia for teaching and research purposes (see Figure 6). All of the samples are sandstone, except for samples 2 and 7, which are limestone.
The available (tested) 10 samples cover the region stratigraphy from the surface to a depth of 21,851.6 ft. Sample 1 appears at the surface (from 0 to 20 ft). The other samples are located deeper, where potential oil and gas reservoirs in the region are located. The most important issue is that the tested samples are enough to guide the required trend line for pore pressure and fracture pressure values.
An ELE ADR 2000 stiff compression frame, manufactured by Engineering Laboratory Equipment International (ELE International), Milton Keynes, United Kingdom, was used to generate the required compression load. Sample preparation and testing procedures were performed according to the International Society for Rock Mechanics and Rock Engineering (ISRM)-suggested methods for rock characterization [22].

3. Results and Discussion

3.1. Formation Strength Profile

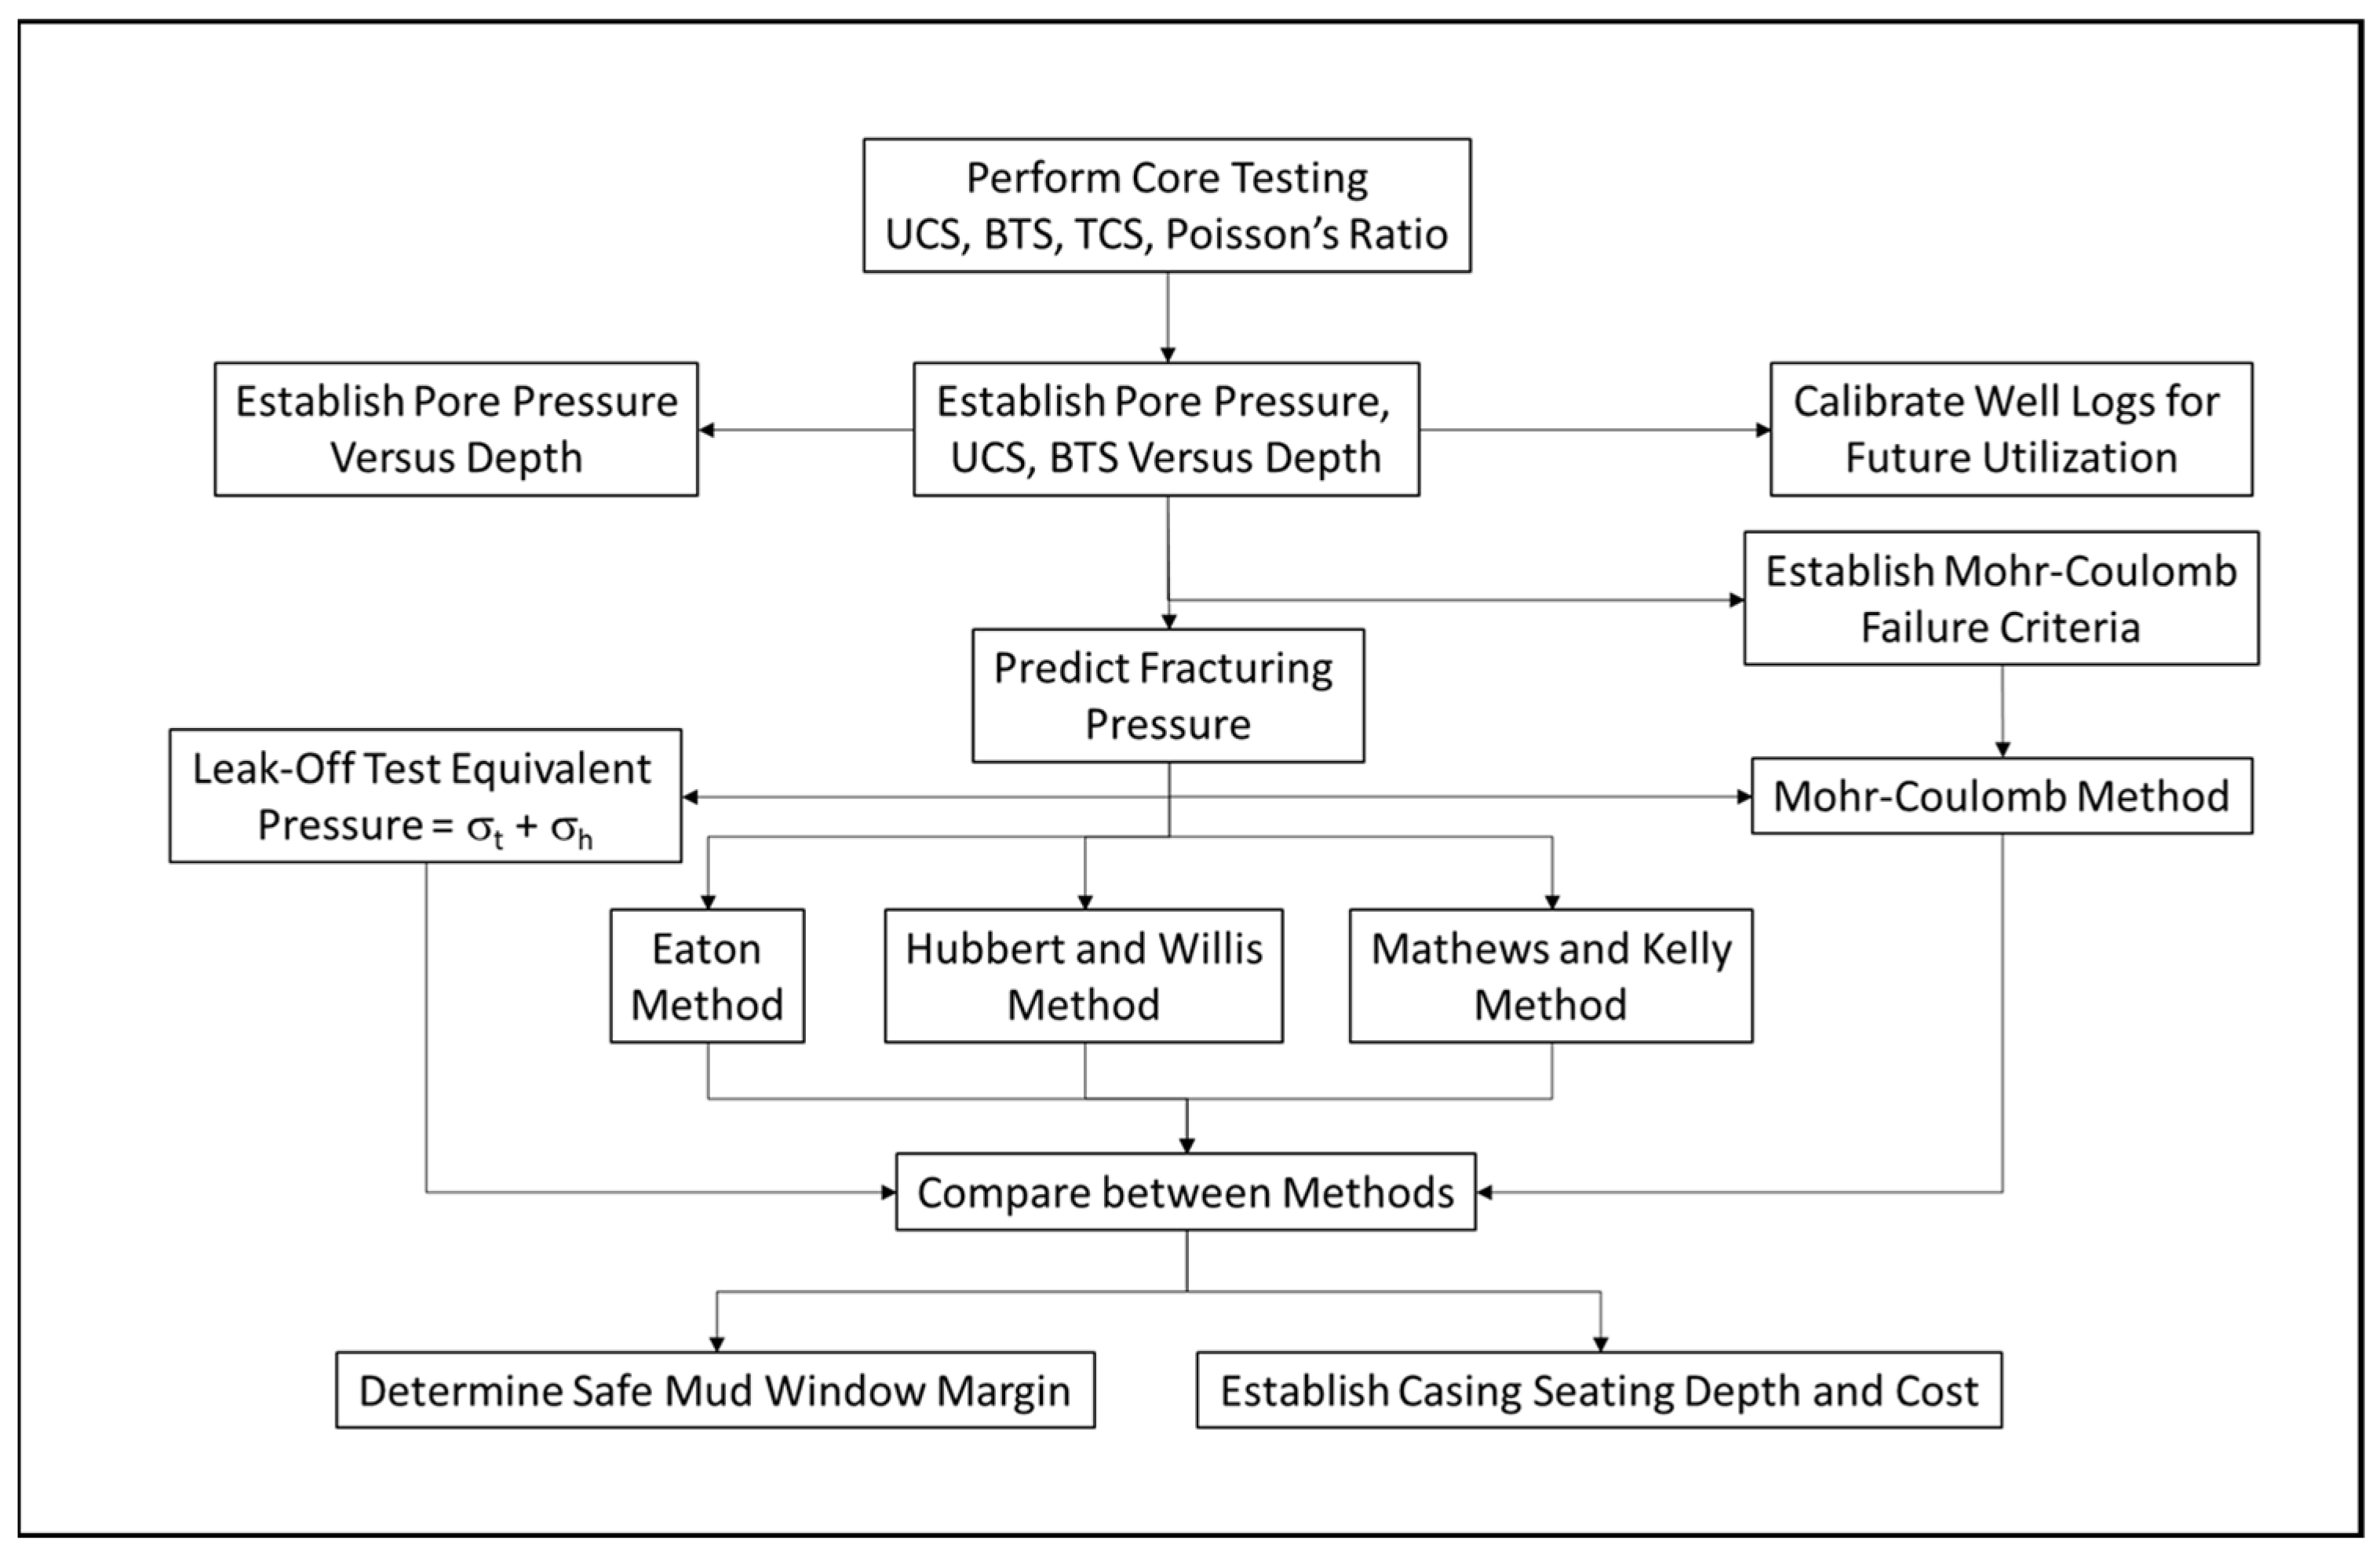
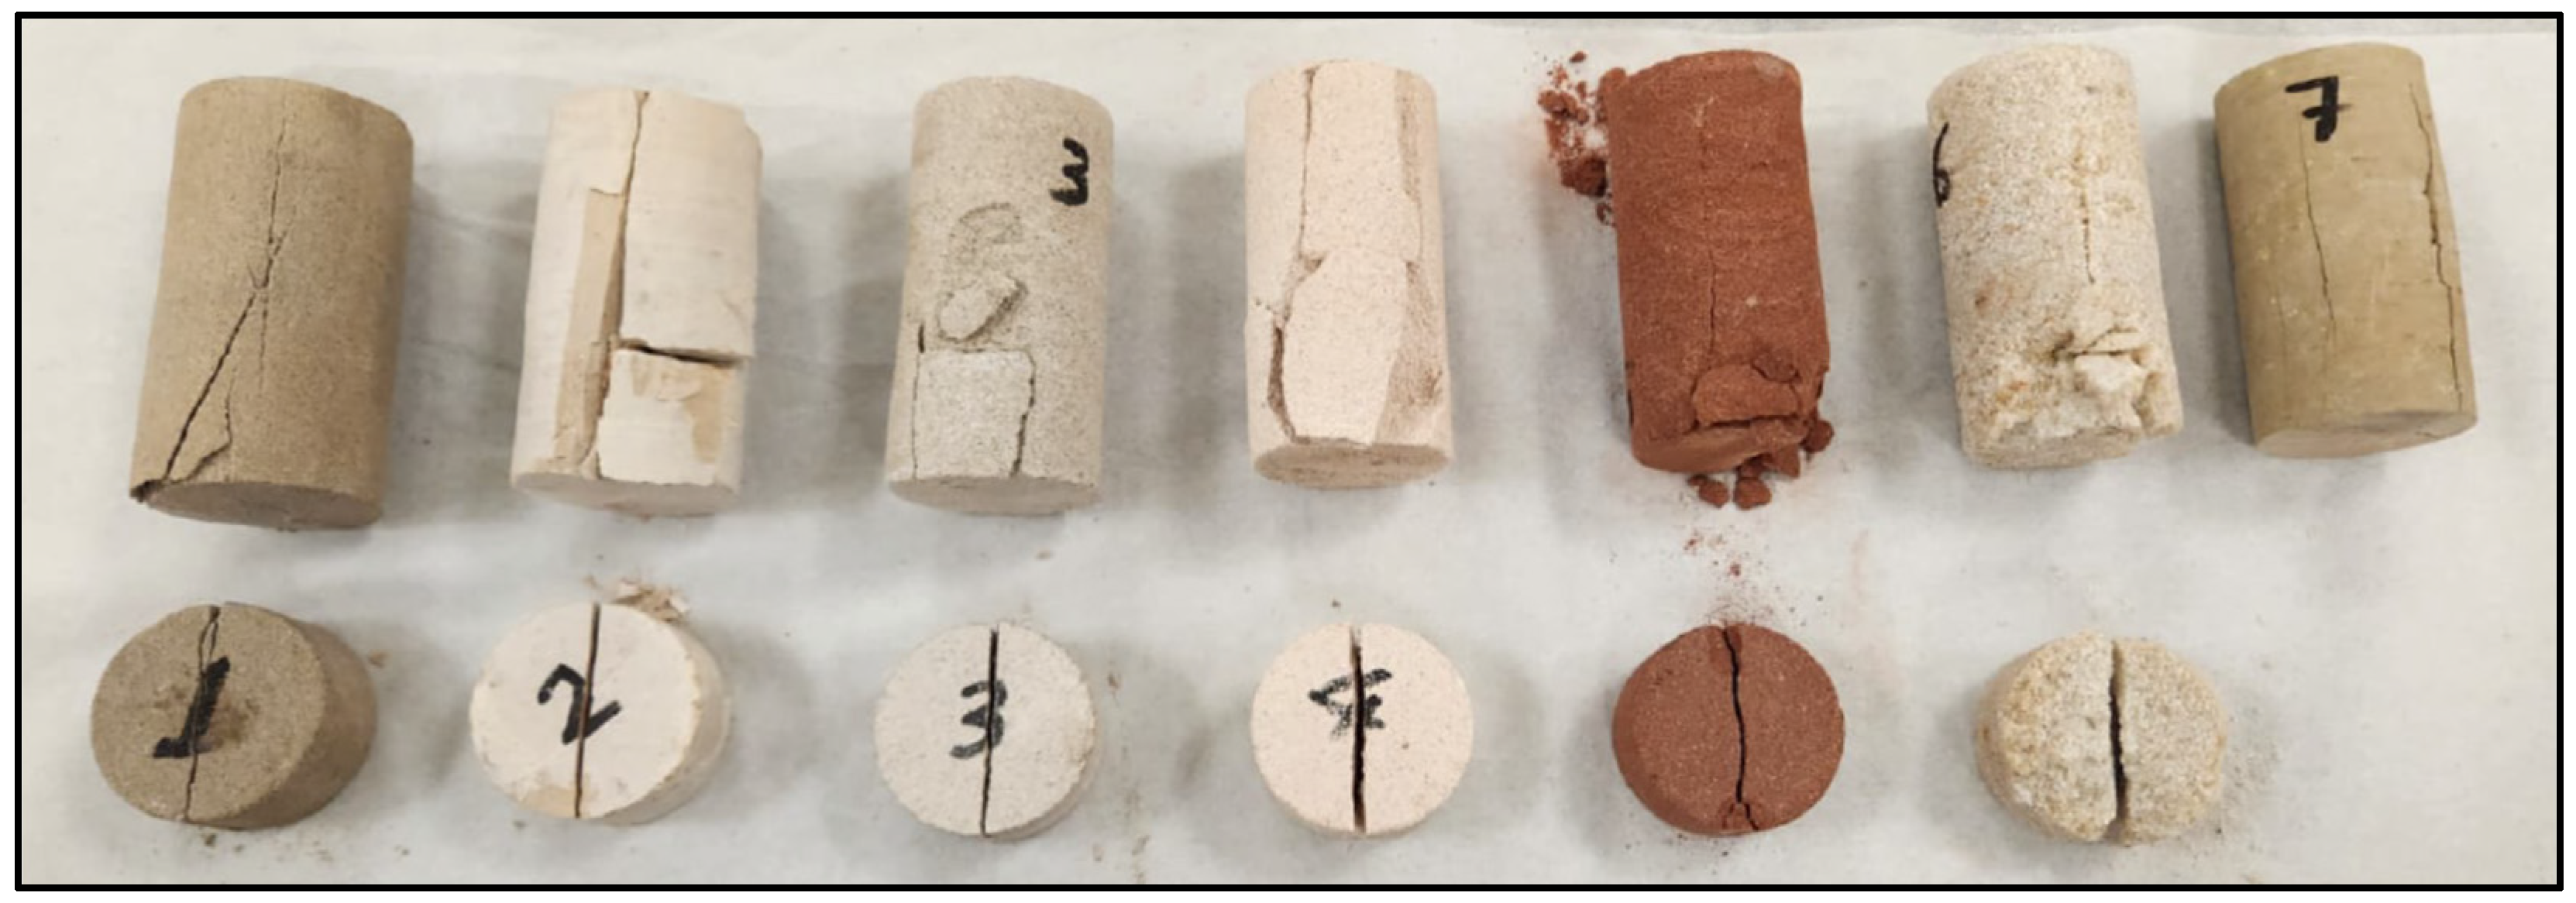
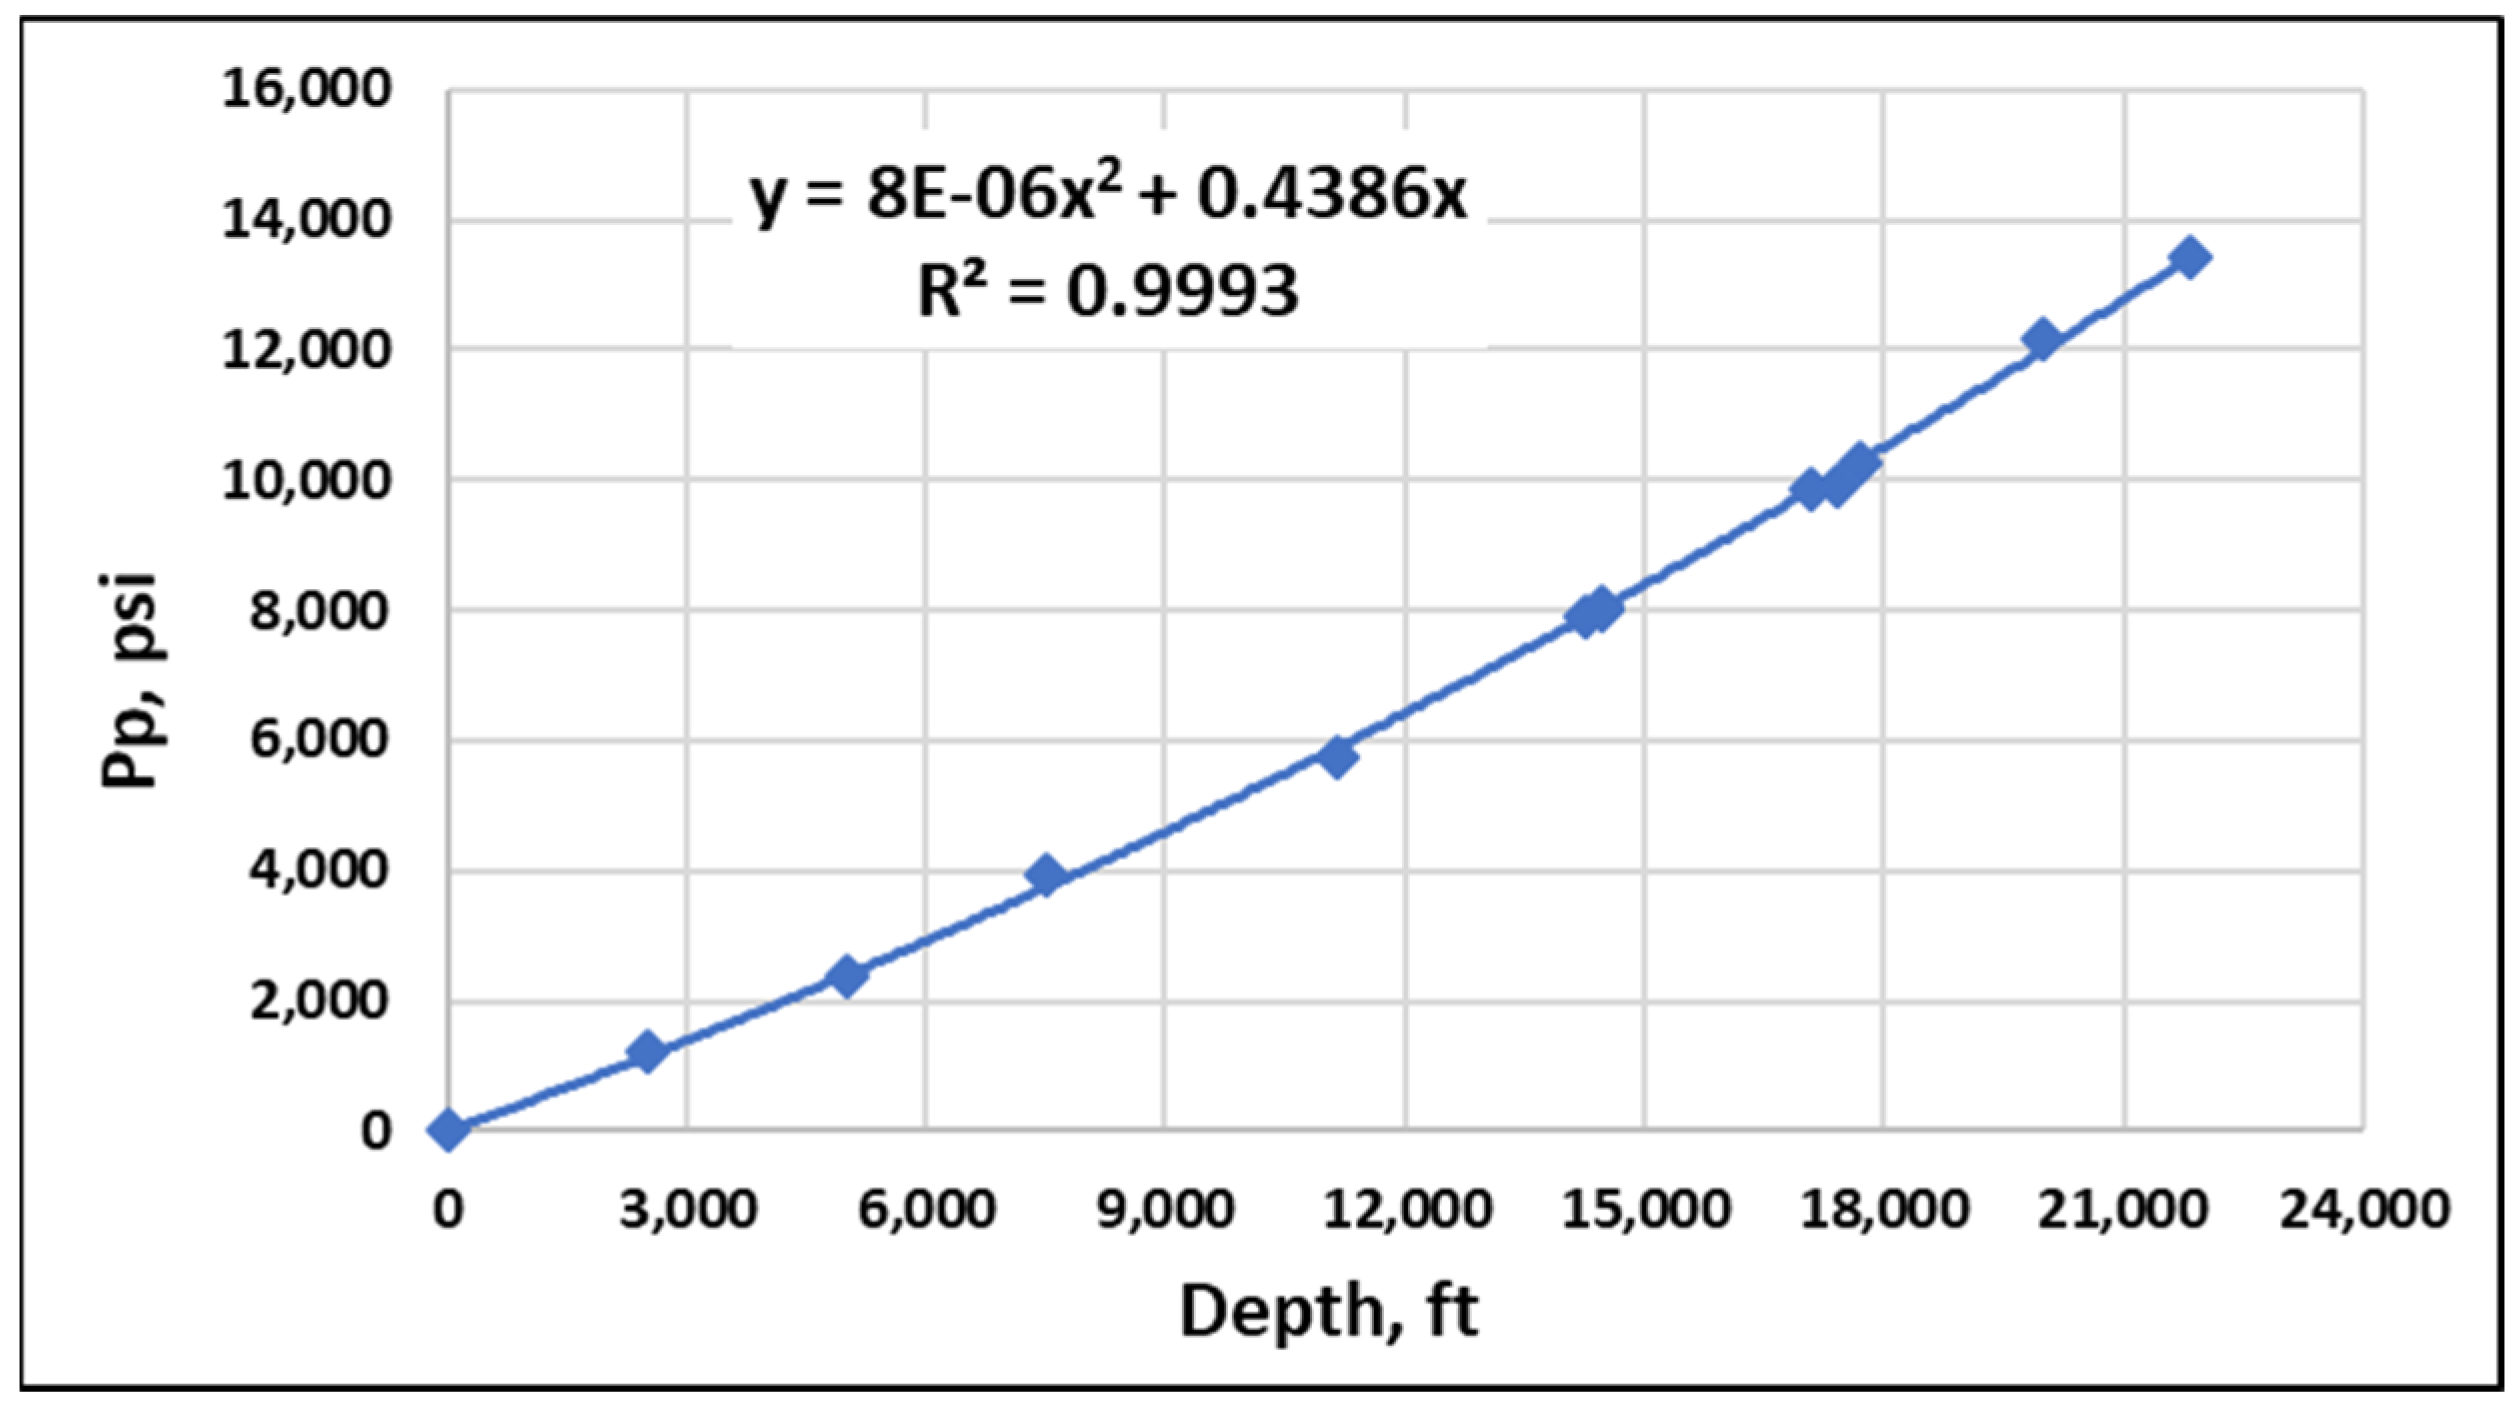
The full pore pressure–fracturing pressure–depth profile can be established by applying the methodology shown in Figure 7. This methodology is repeated for each formation (core) along the full well depth. The depth and mechanical properties of three core samples for formations located within the Saudi Arabian lithological column were obtained from a previous study [20]. These three samples are Um Assha’al, Sarah, and Saq, located at 20 ft, 16,350 ft, and 19,350 ft, respectively. These three formations have been taken as the basis for the full-depth pore pressure profile establishment (see Figure 8). To simulate a complete real profile, seven different core samples obtained from several formations were tested in the rock mechanics and cement laboratory of the department. Core samples before testing are shown in Figure 9. The computed mechanical properties of these samples (uniaxial compressive strength and tensile strength) are presented in Table 2.
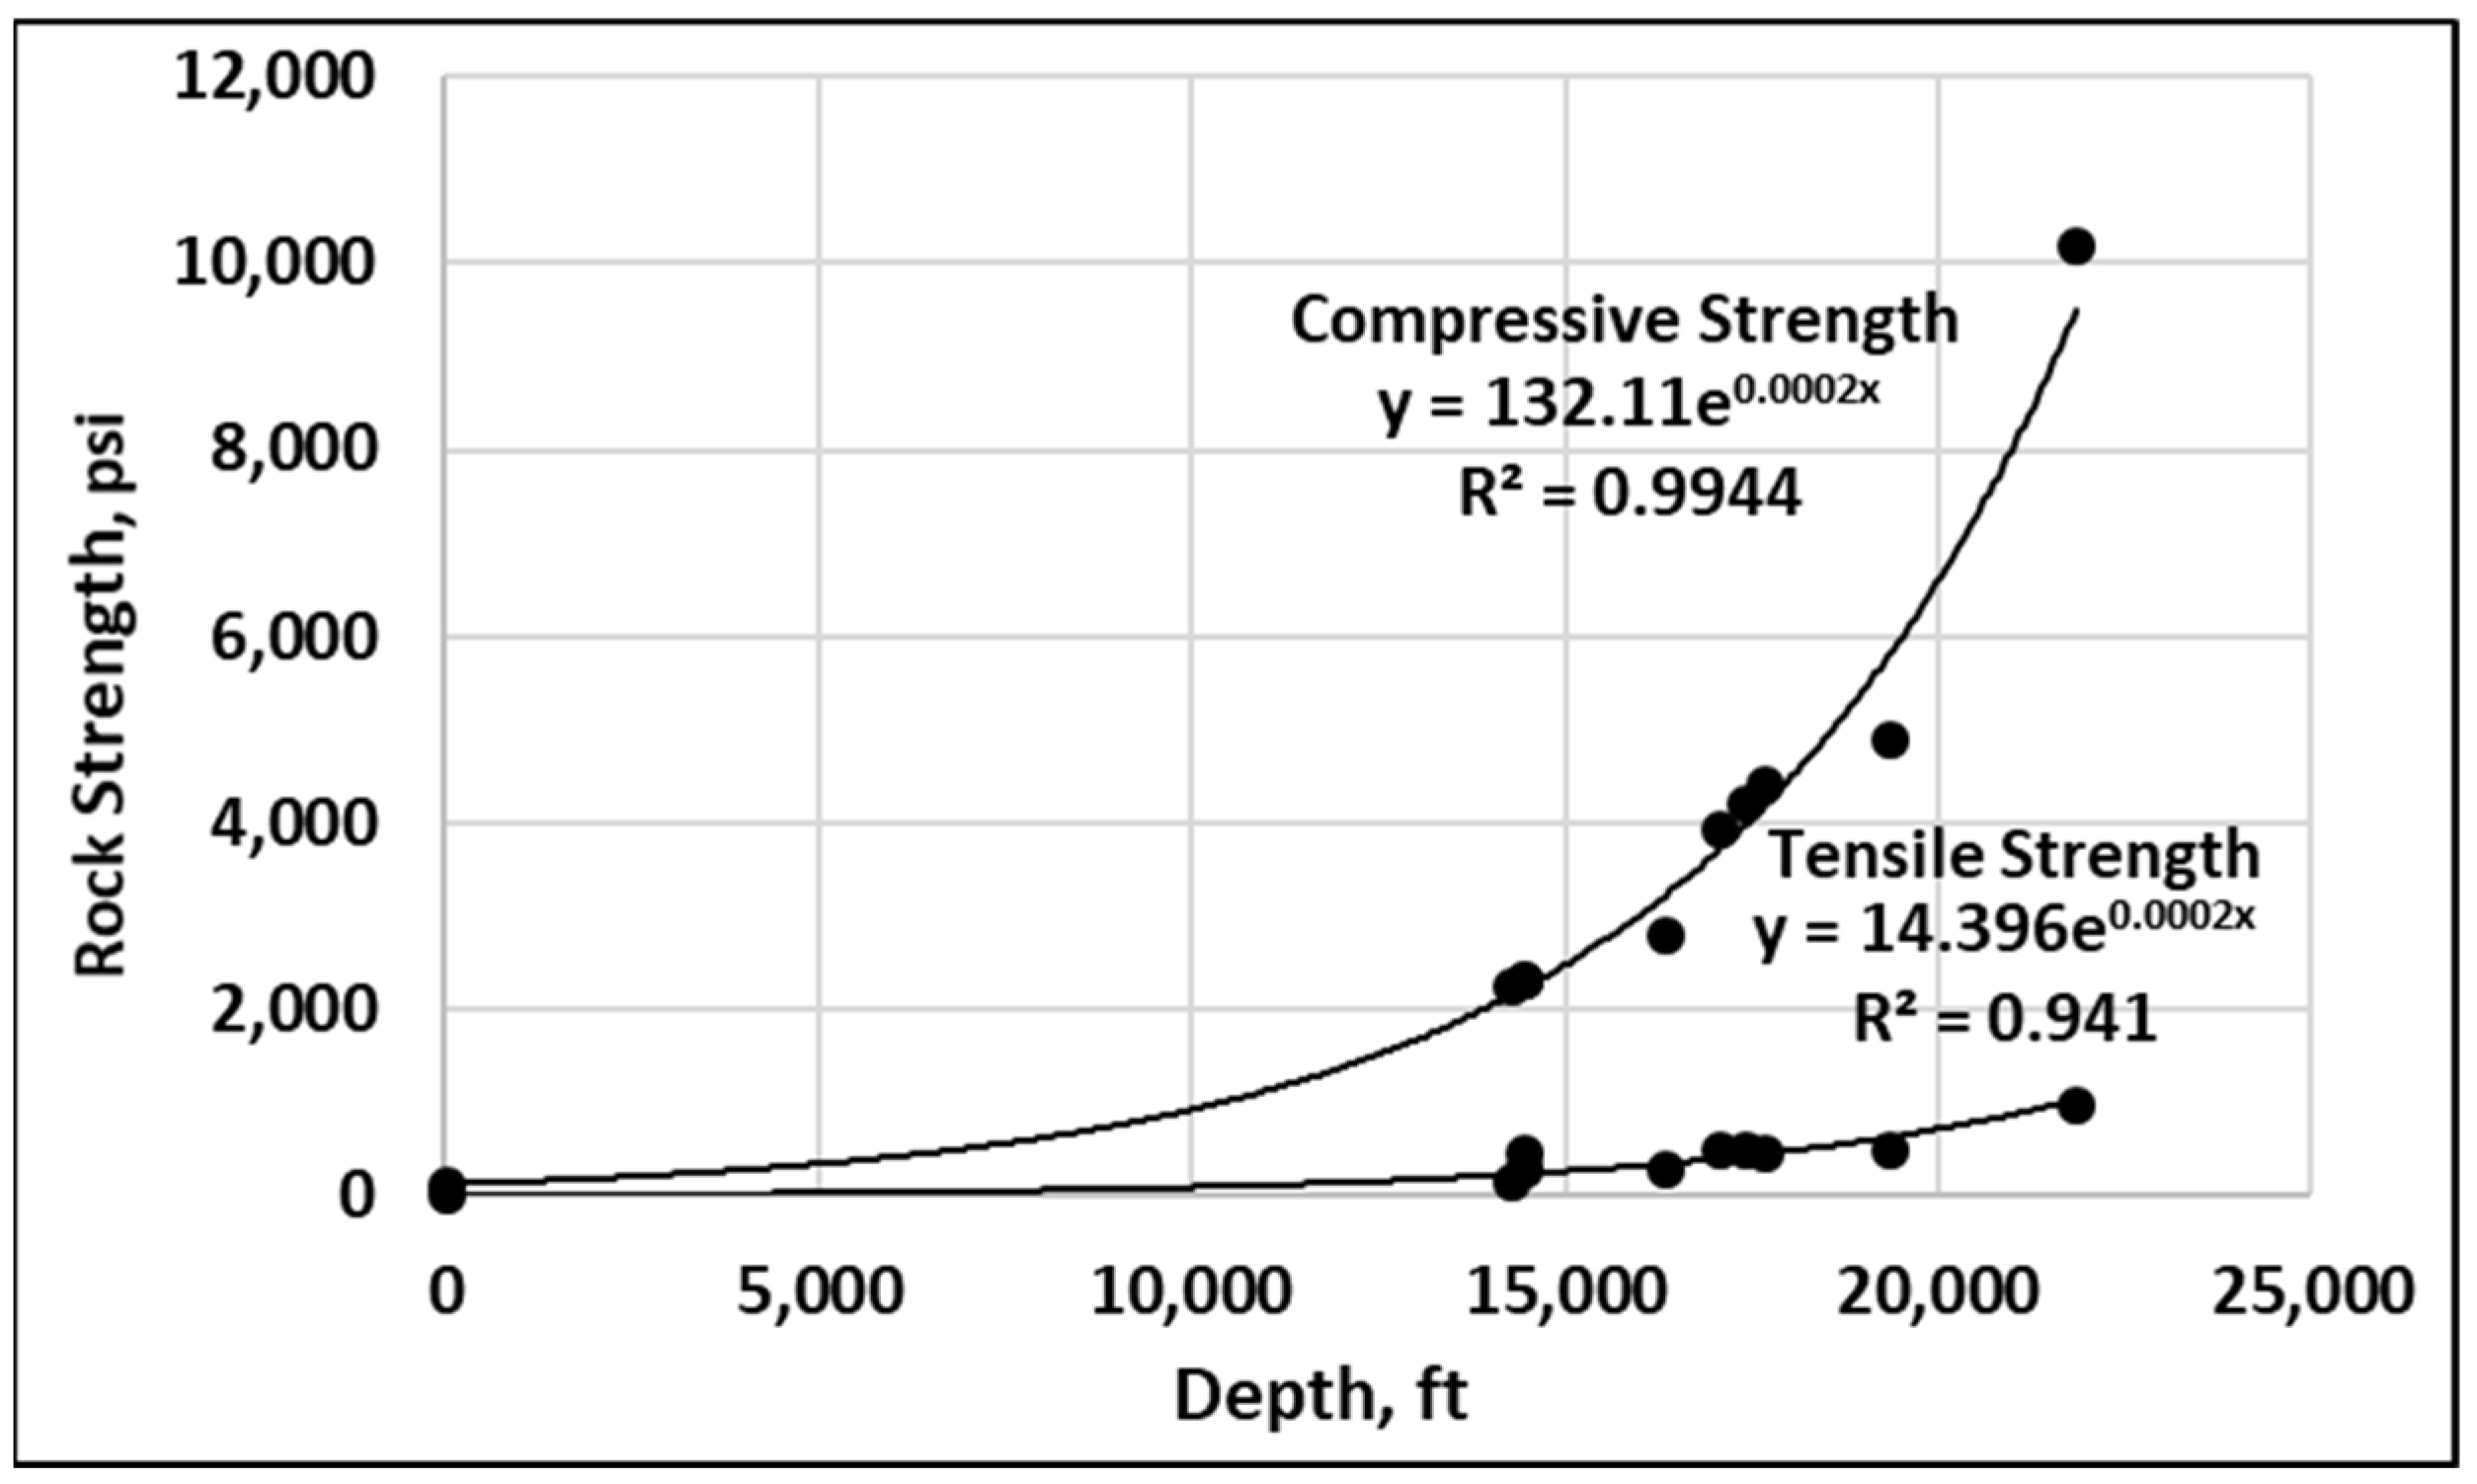
The uniaxial compressive strength and the tensile strength of the seven tested core samples are shown in Figure 8 according to their values, and the results are shown in Figure 10. This result is consistent with the fact that rock compaction increases with depth, and hence, there is an increase in strength with depth. The observation that rock strength increases with depth is a fundamental principle in rock mechanics.

3.2. Pore Pressure Profile

Typical pore pressure for the western part of the Arabian Gulf was estimated from the drilling of a gas well in the Khuff formation in the emirate of Abu Dhabi in the UAE [23], as shown in Figure 11. The lithological columns in the UAE and the eastern part of Saudi Arabia are almost identical. The UAE, Saudi Arabia, and some other Arab countries are located on one of the Earth’s tectonic plates (the Arabian Tectonic Plate). The lithology of Saudi Arabia and the United Arab Emirates (UAE) is dominated by vast sedimentary sequences, though it includes a diverse range of igneous and metamorphic rocks. Both countries share a common geological history as part of the stable Arabian Plate [24].
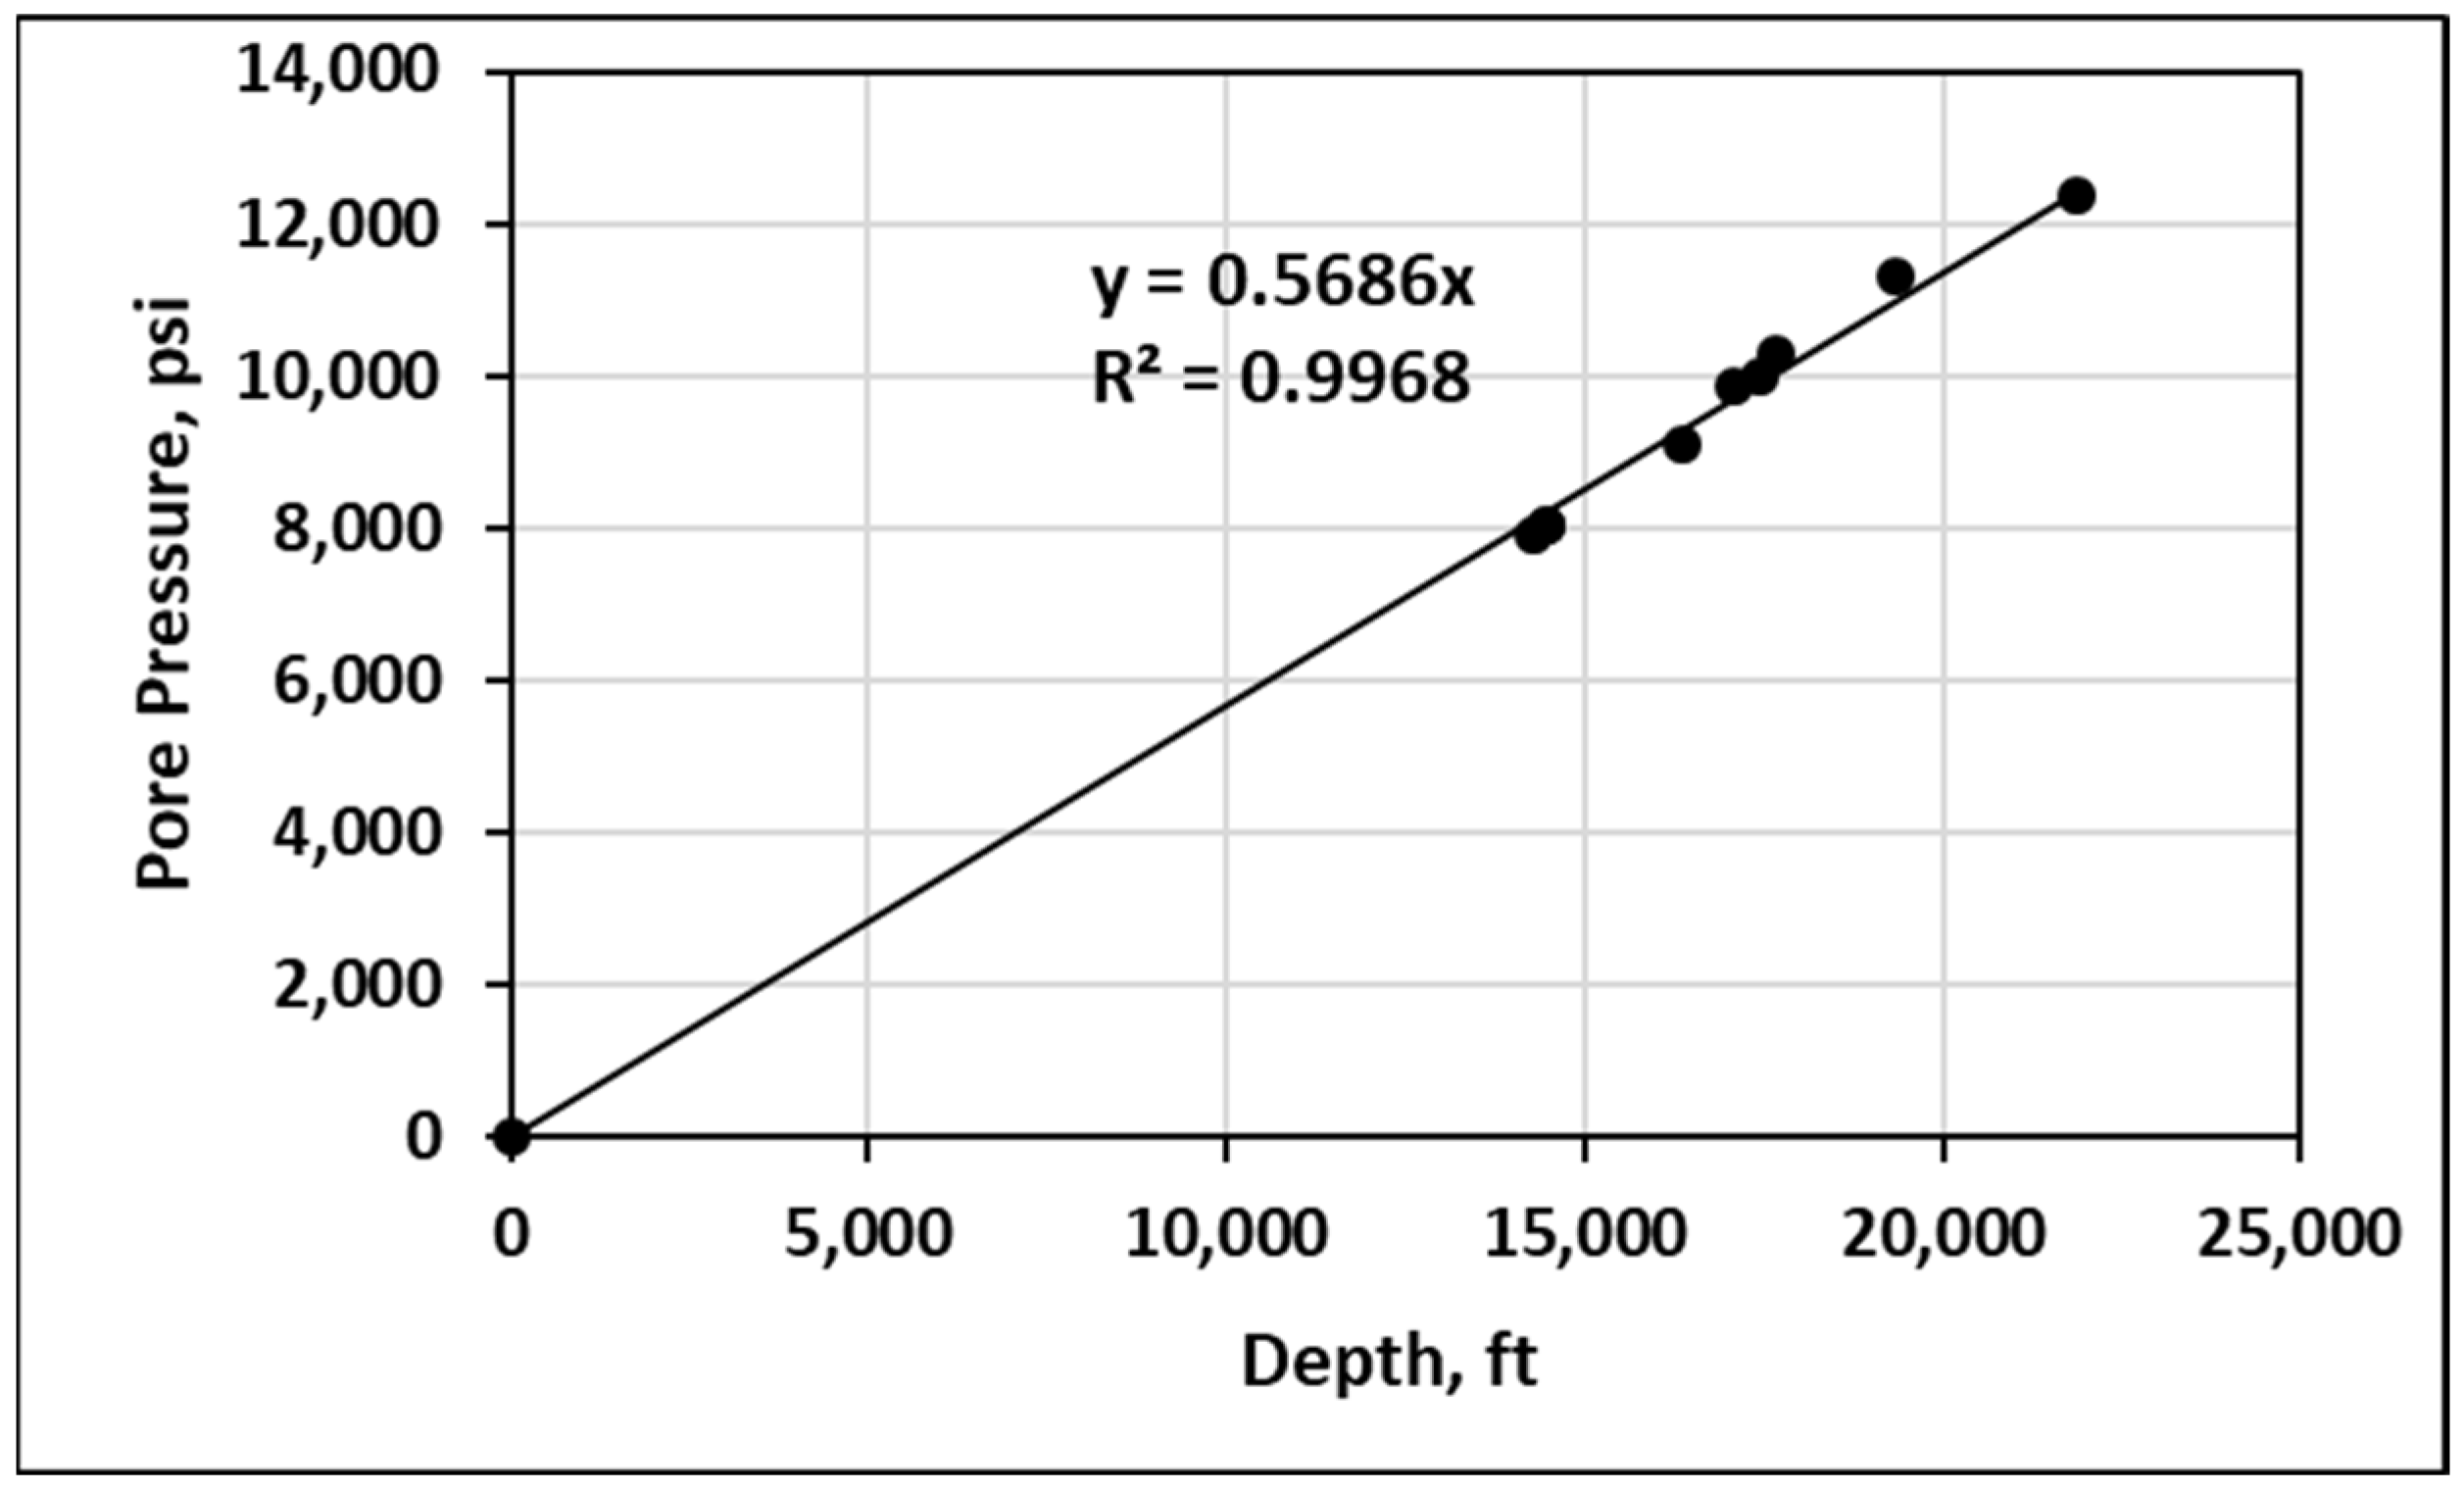
Combining data in Figure 10 and Figure 11 provides the full profile of pore pressure for the seven tested samples, as well as the three samples obtained from the literature, as shown in Figure 12 and Table 3.

3.3. Establishment of Formation Rock Failure Criteria

To establish Mohr–Coulomb failure envelopes for the 10 samples studied, a series of triaxial compression tests must be performed. Since there are not enough core samples, only the uniaxial compressive strength and the indirect (Brazilian) tensile tests were conducted.
Mohr–Coulomb failure criteria parameters, the apparent cohesion, and the angle of internal friction were evaluated using the AlAwad correlation [25] as follows:
τ 0 = 10 L o g σ c     0.61 0.98
σ c τ 0 = 1 + S i n ϕ 1 S i n ϕ
where σ c is the formation rock uniaxial compressive strength; ϕ is the angle of internal friction; and τ o is the apparent cohesion.
Using the laboratory-measured uniaxial compressive strength ( σ c ) and the tensile strength ( σ t ), a Mohr–Coulomb failure envelope can be constructed for all ten studied samples, as shown in Figure 13.

3.4. Estimation of Fracturing Pressure Profile

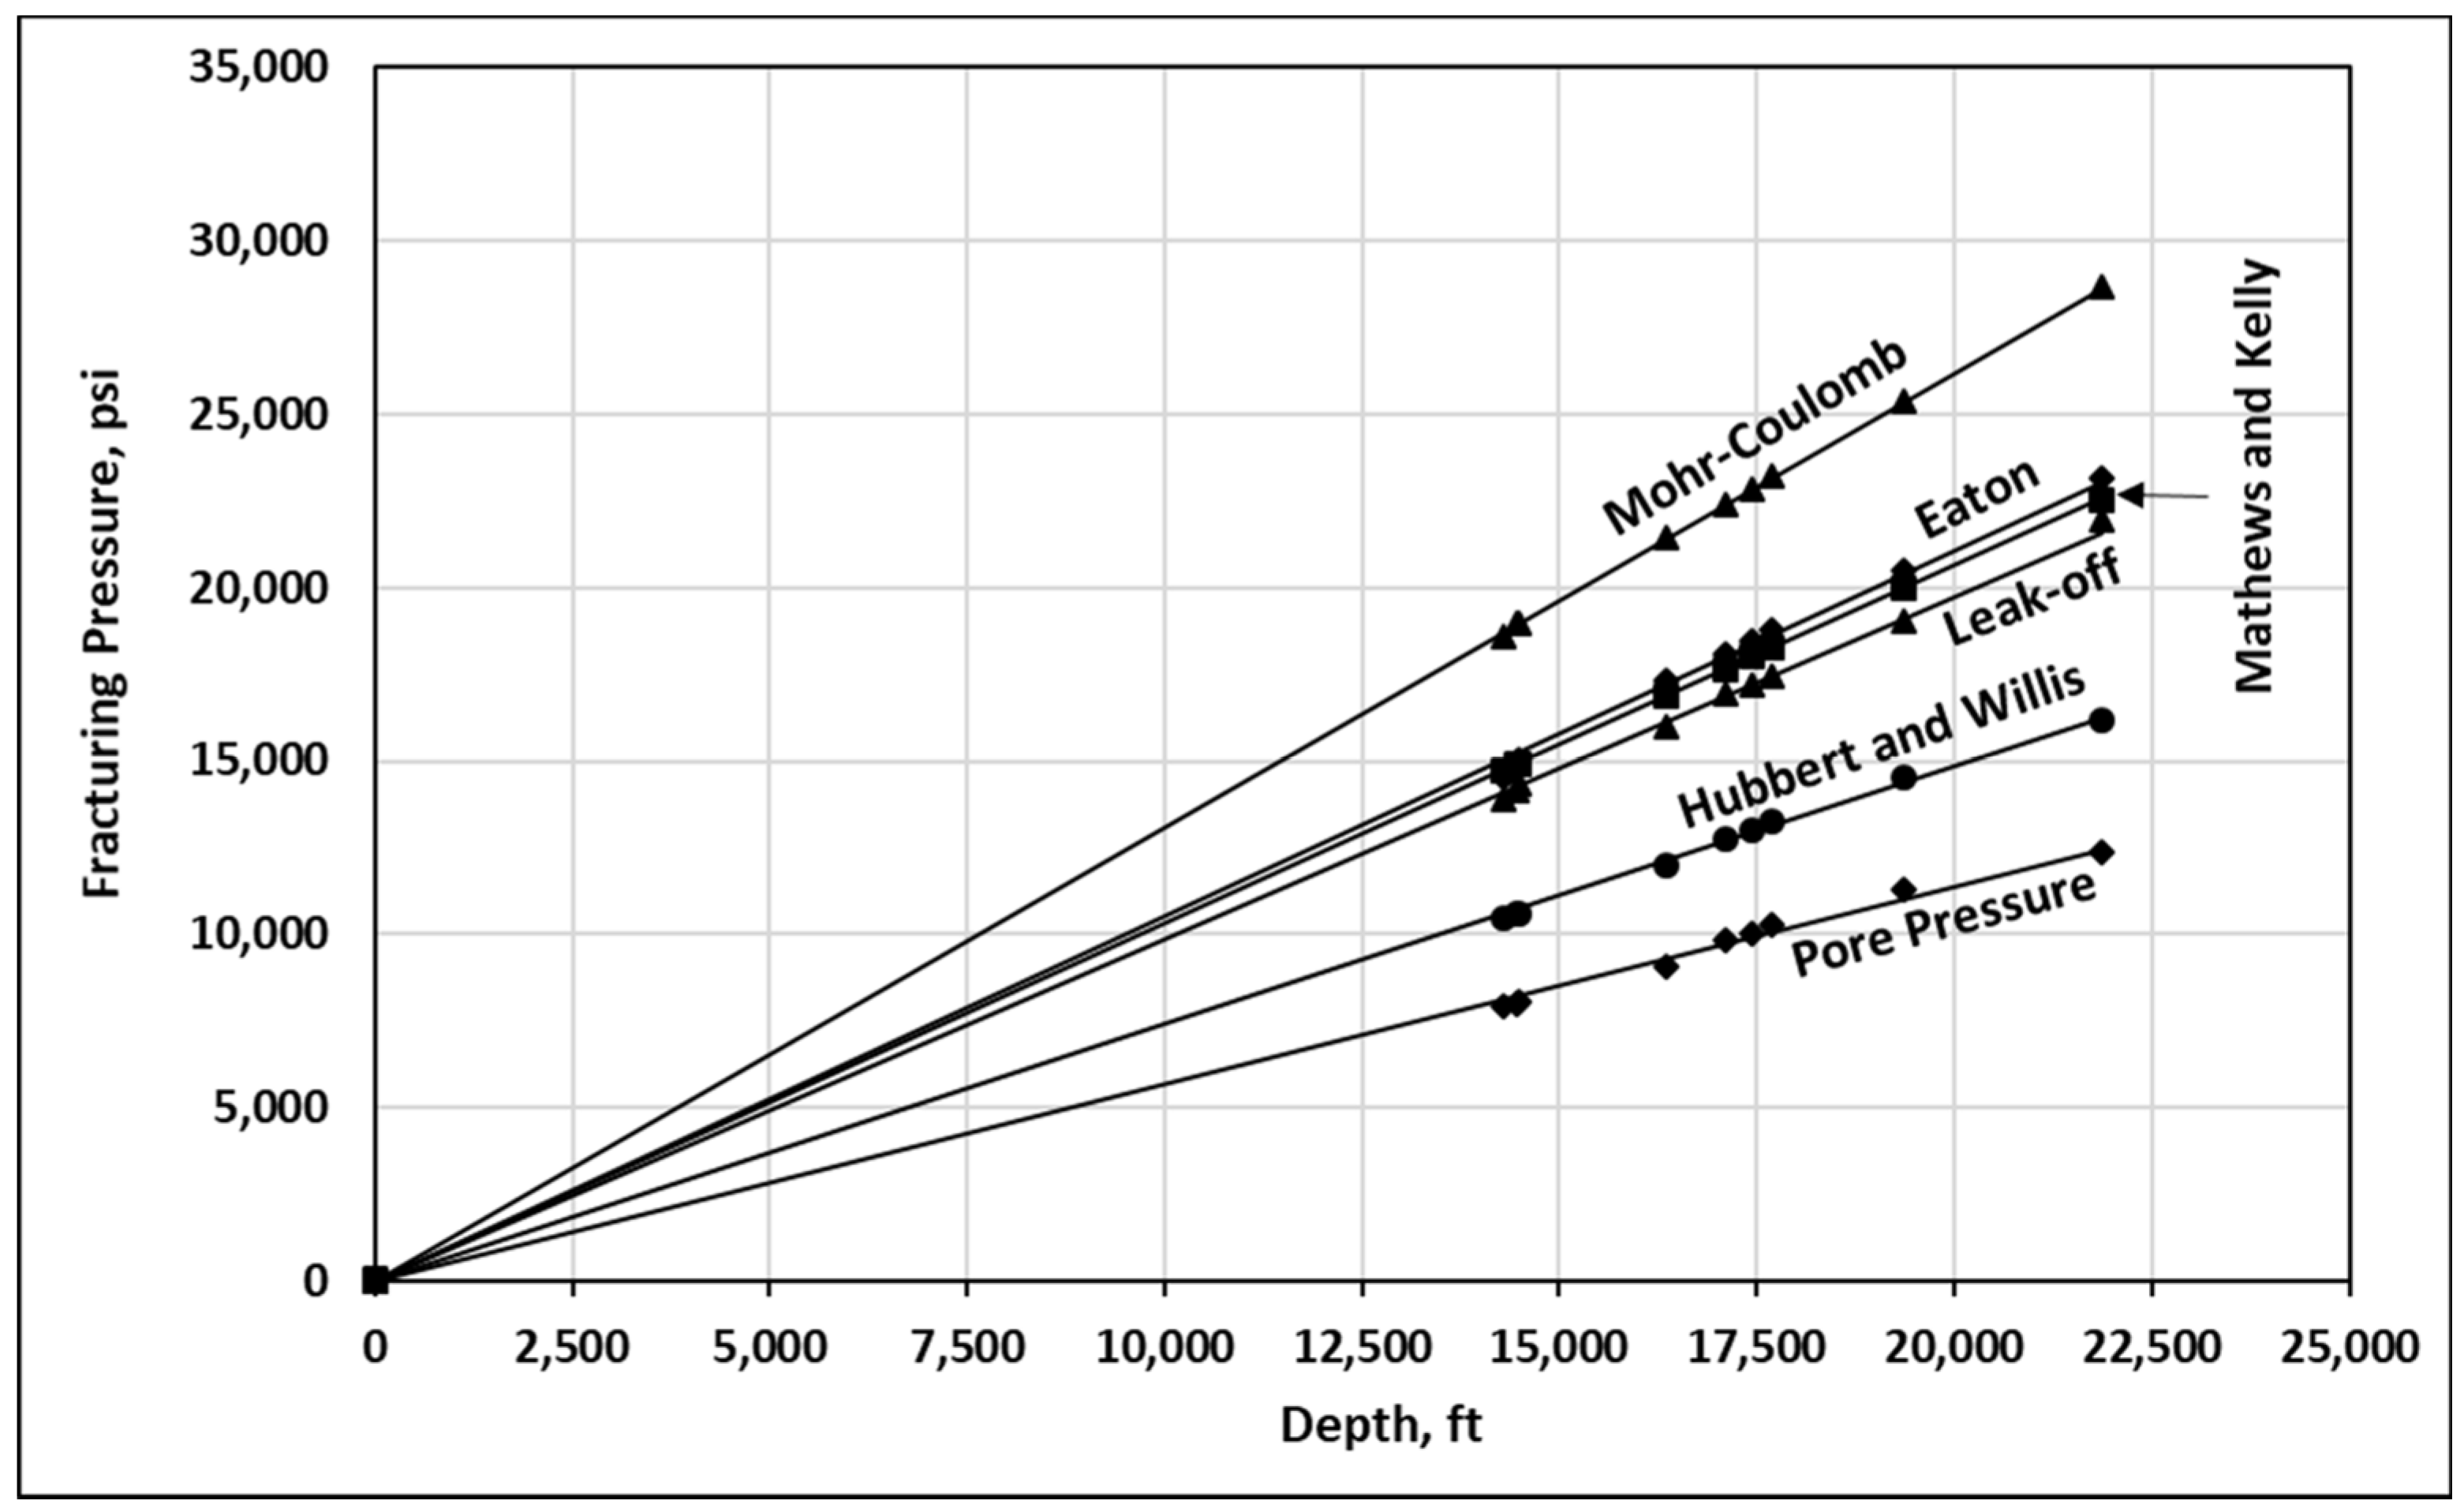
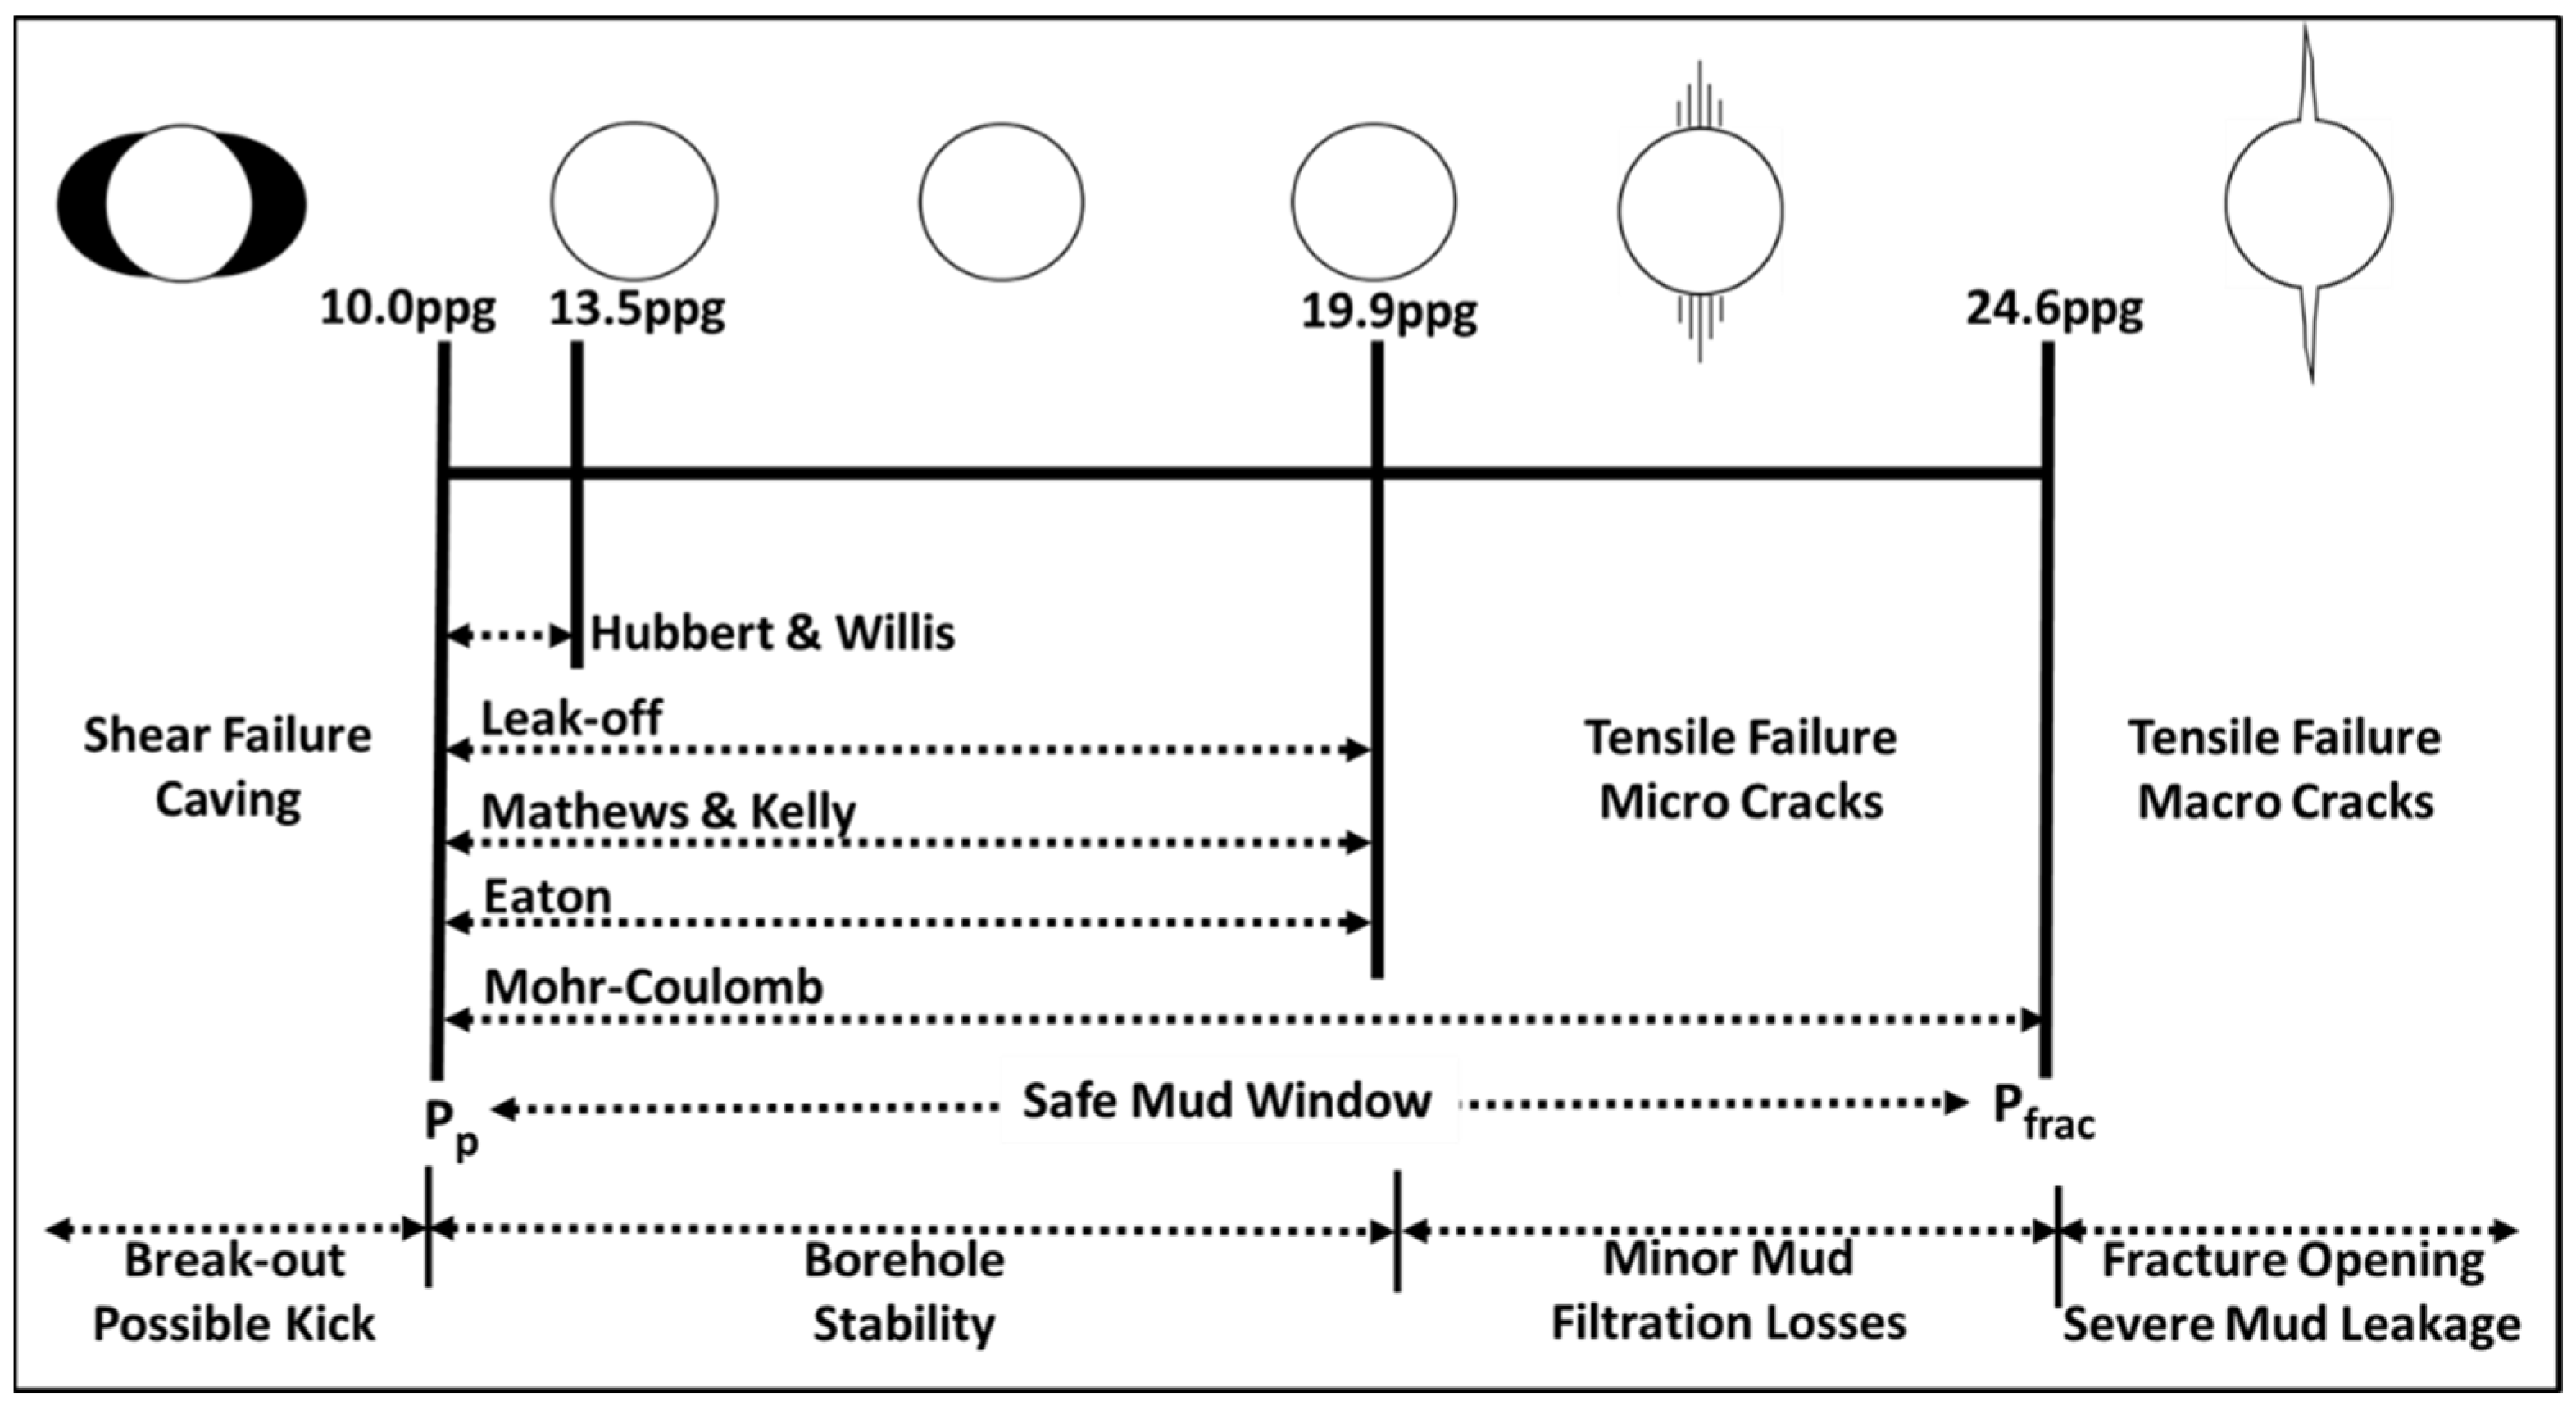
The Earth in situ principal stresses are assumed to be a strike-slip stress regime ( σ H = 1.2   p s i / f t > σ V = 1.1   p s i / f t > σ h = 0.96   p s i / f t ) due to the Zagros collision zone between the Arabian and the Eurasian tectonic plate boundaries. The direction of the maximum in situ principle stress is N5°E [26]. Based on the evaluated pore pressure, failure criteria, and in situ principal stresses versus depth for the ten studied samples, fracturing pressure values at various depths were calculated using Eaton, Hubbert and Willis, Mathews and Kelly, leak-off, and Mohr–Coulomb methods, as shown in Table 4 and Table 5 and Figure 14. From Figure 14, it can be seen that the leak-off method provides a minimal safe mud window margin. Hubbert and Willis’ estimations are very conservative. Eaton and Mathews & Kelly provided acceptable safe mud window margins. The Mohr–Coulomb method provided the widest safe mud window.
In a narrow safe mud window, formation kicks and well blowout are possible, especially when the drilling mud weight drops below the formation pore pressure due to barite sag (weighting material precipitation), thief zone encounters, etc. On the other hand, any increase in mud weight due to drilled cutting accumulation in the drilling fluid may lead to formation fracturing and severe mud losses. With a wide safe mud window, all of the previously mentioned wellbore instabilities can be avoided.
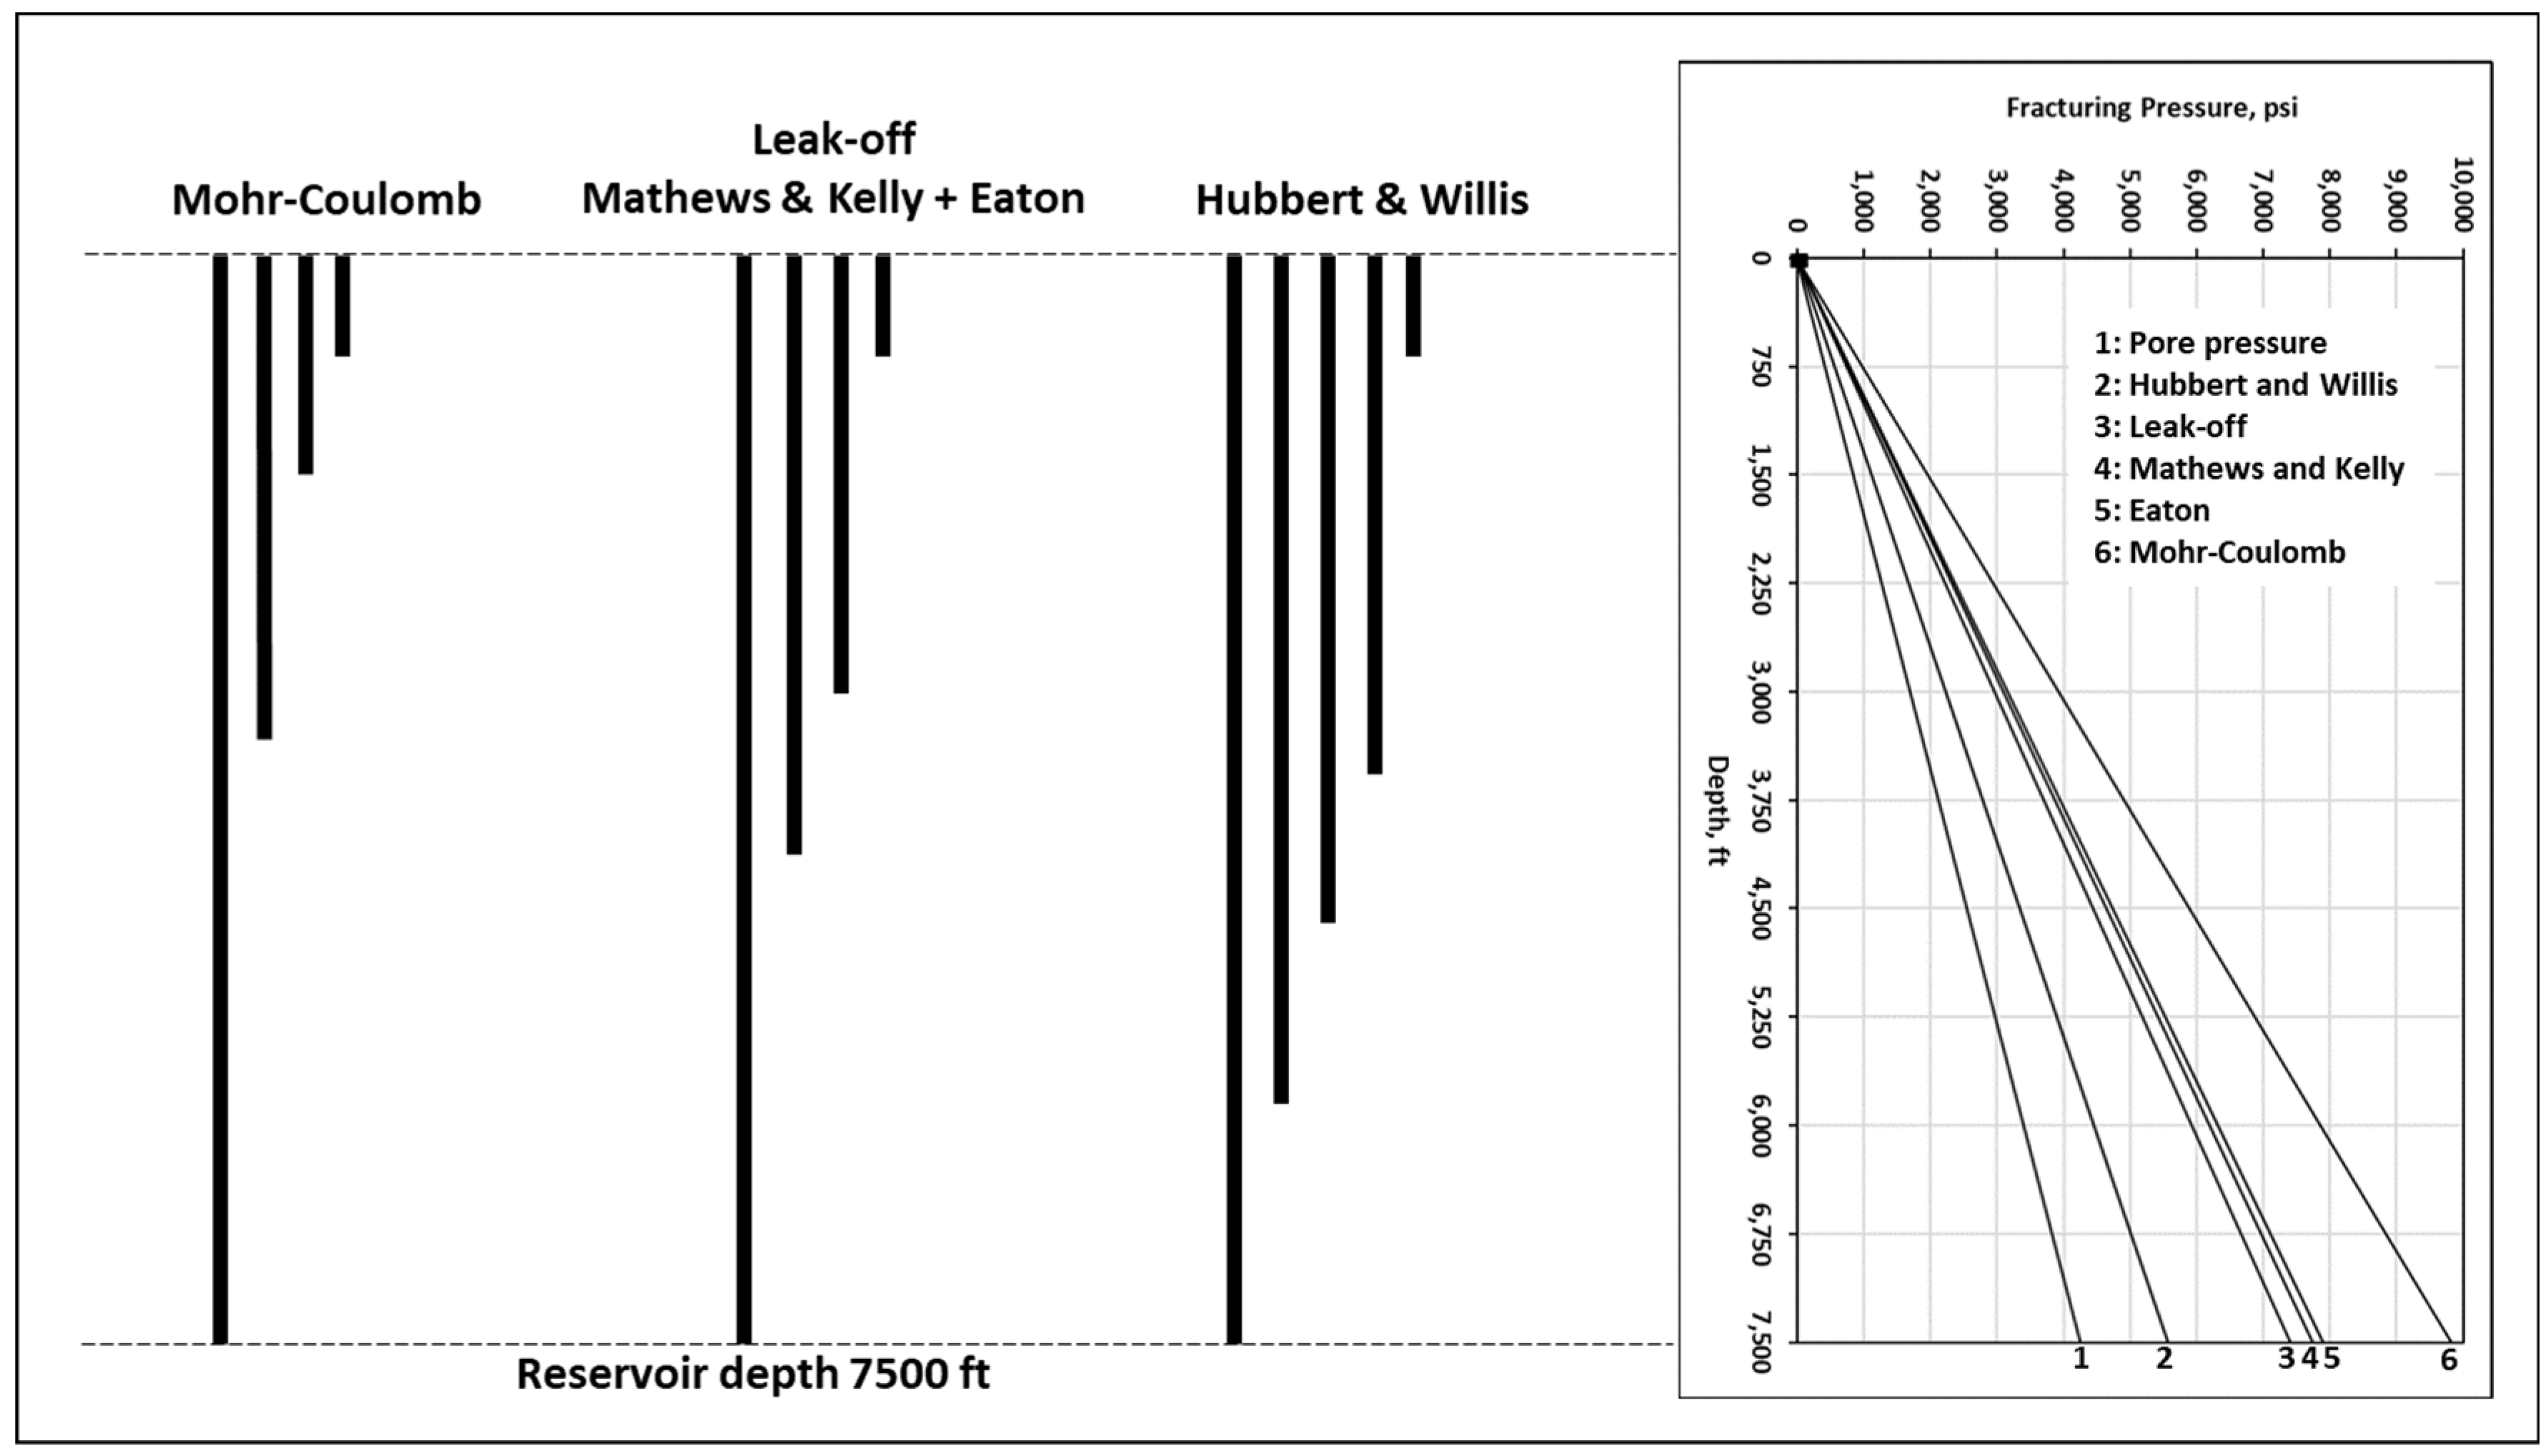
For a reservoir located at a 7500 ft depth, safe mud windows determined via all methods are presented in Figure 15.
It is important to understand that applying mud weight above that estimated by the Eaton method will generate tensile failure in the mode of microcracks. These microcracks may lead to minor mud filtration loss, which can be easily controlled using filtration loss control additives. If the maximum mud pressure predicted by the Mohr–Coulomb method is exceeded, then macro fractures will open, leading to severe mud losses. The closure of these macro fractures requires either reducing the mud weight and utilizing filtration loss control materials or using fracture seal materials if this mud weight is maintained.
Using Figure 15, casing setting depth can be estimated for a hypothetical hydrocarbon reservoir at a 7500 ft depth, with an example shown in Figure 16. It can be seen that each casing-setting-depth estimation method provided a different number and length of casing strings. From an economic point of view, the Mohr–Coulomb method provides the lowest cost, followed by the Eaton and Mathews & Kelly methods.
The above methodology can be repeated using a measured pore pressure profile, appreciable amounts of core testing, or core-calibrated well logging data. Economical comparisons in terms of casing string number and length, as shown in Table 6, yielded that Eaton, leak-off, and Mathews and Kelly methods reduced casing cost by 31% compared to Hubbert and Willis methods. On the other hand, the Mohr–Coulomb method reduced casing cost by 41% compared to the Hubbert and Willis method and by 10% compared to leak-off and Mathews and Kelly methods.
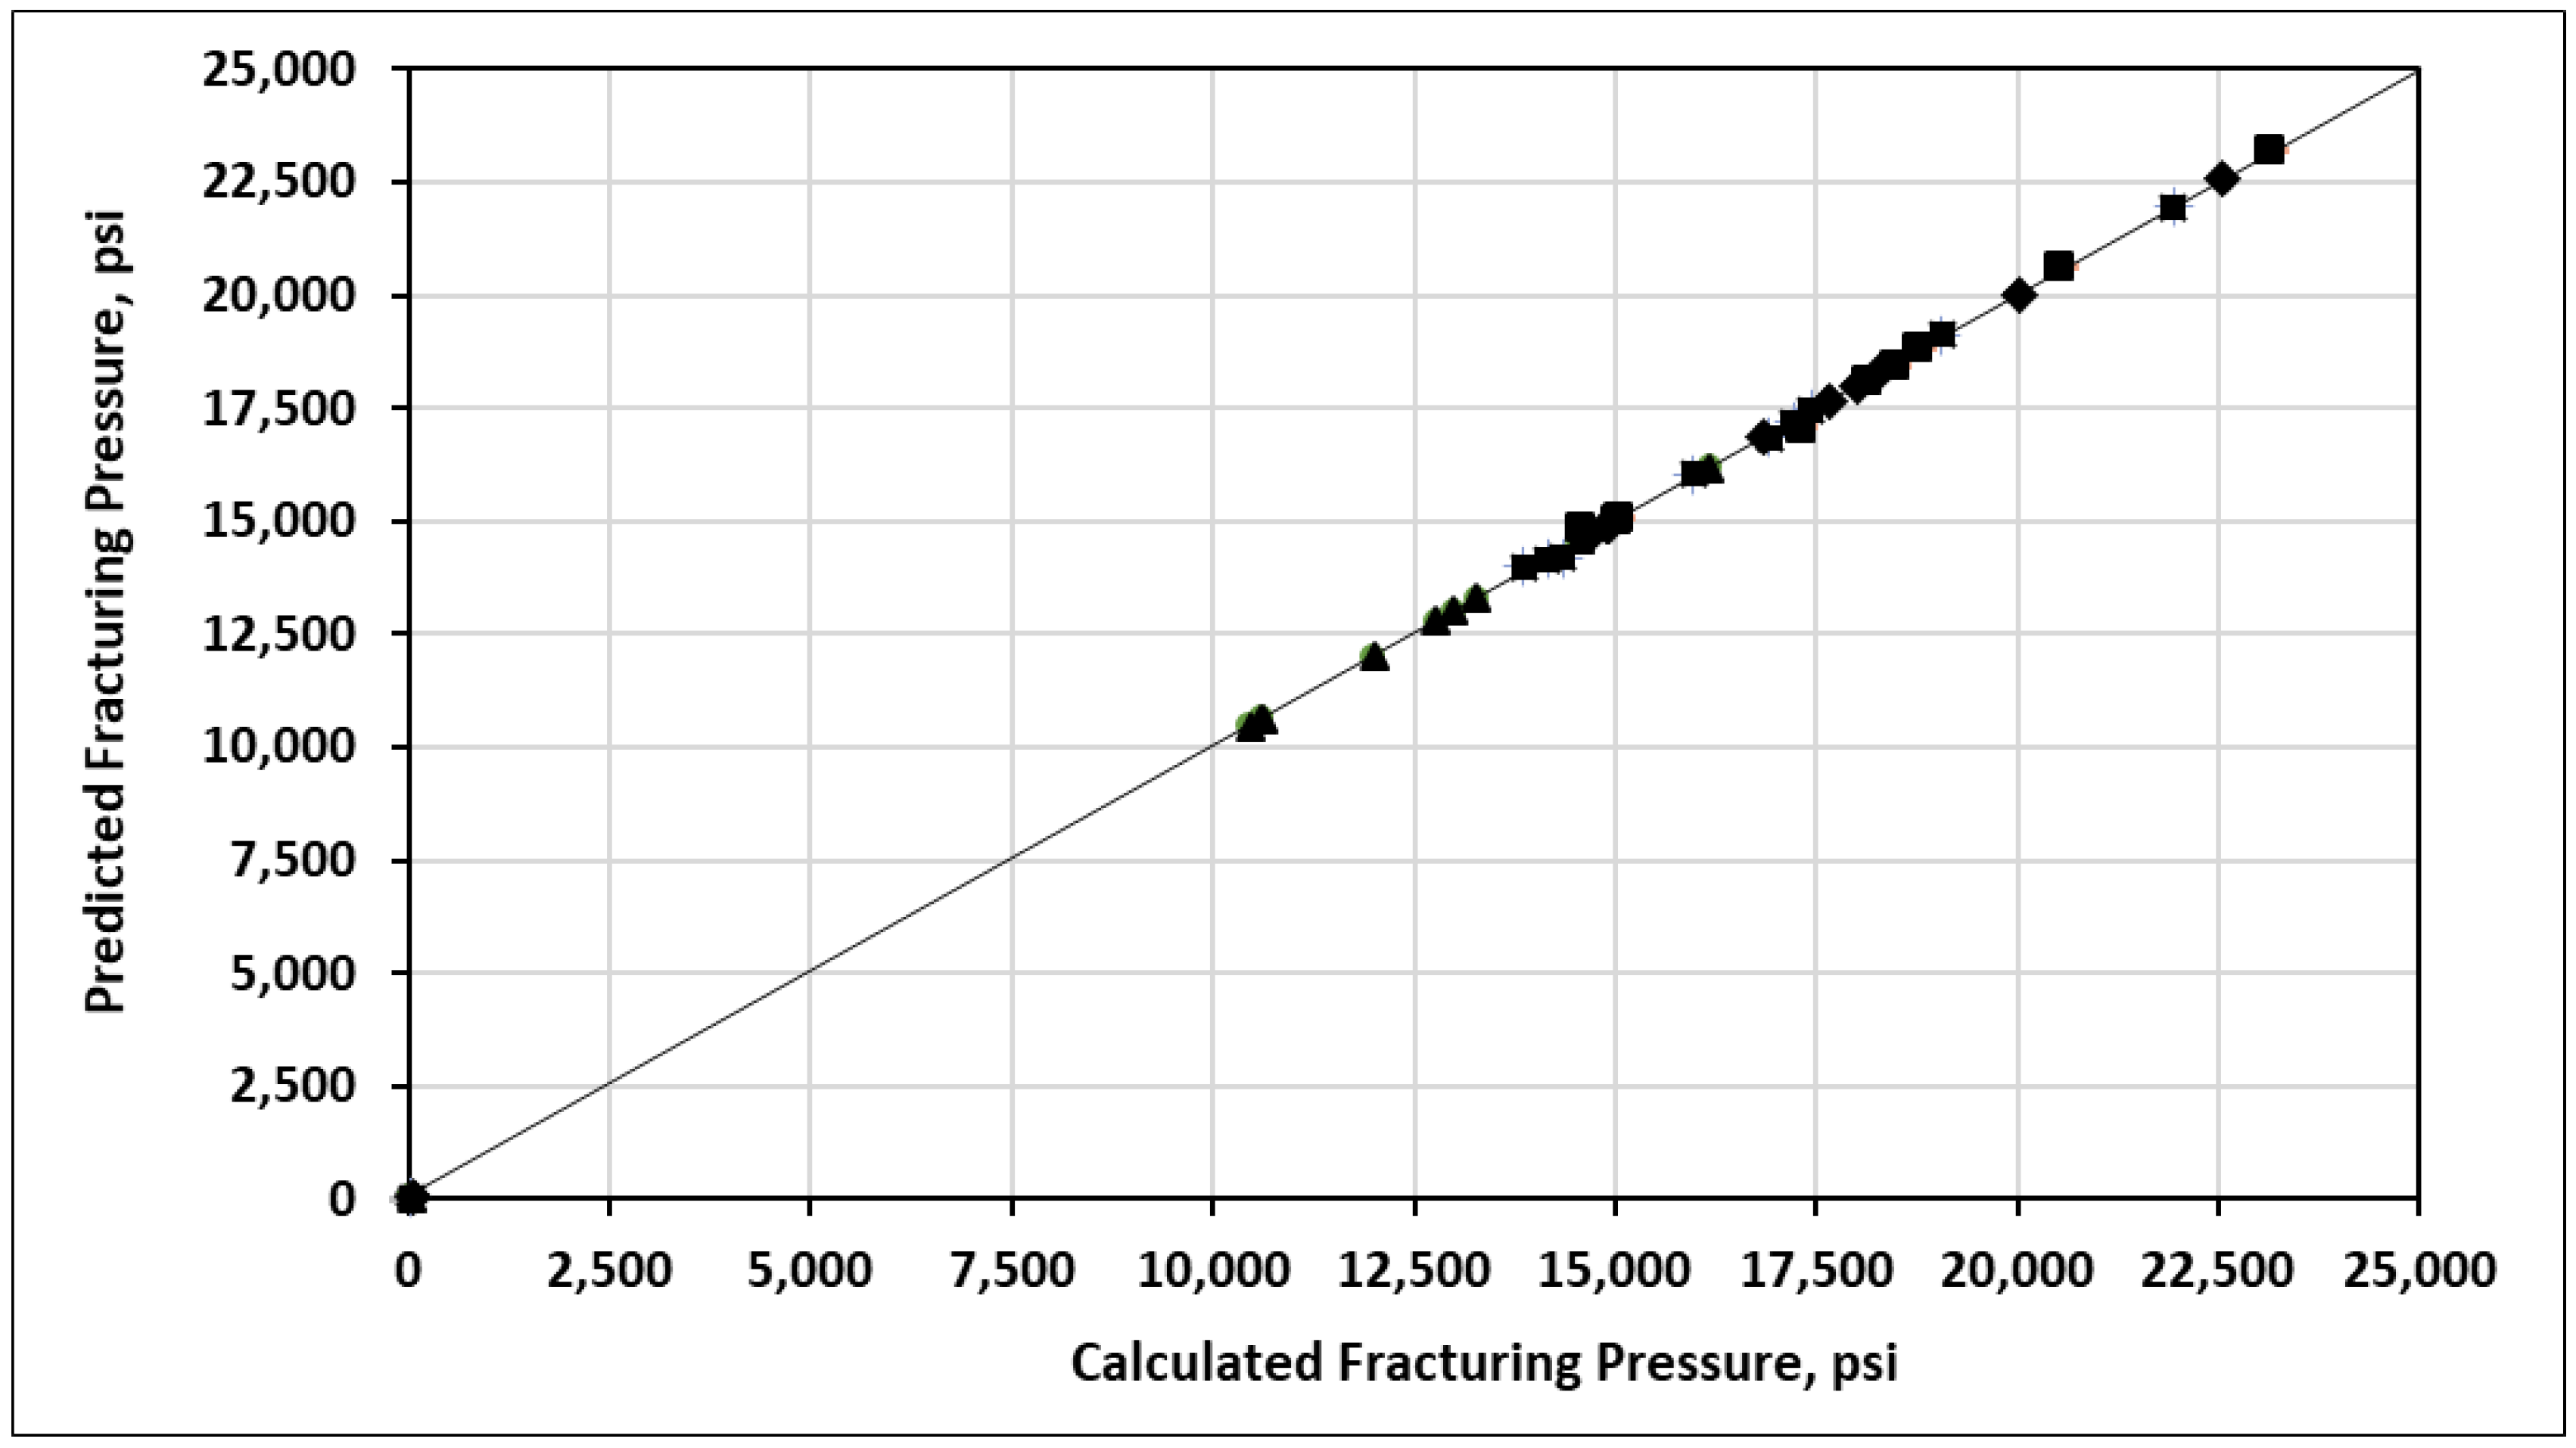
Using pore pressure, uniaxial compressive strength, minimum horizontal in situ stress, and the corresponding fracturing pressure data calculated using Mohr–Coulomb, Eaton, leak-off, Hubbert and Willis, and Mathews and Kelly methods shown in Table 4 and Table 5, the correlations below were obtained using regression analysis (see Table 7).
The calculated fracturing pressure values shown in Table 5 and the predicted fracturing pressure using correlations shown in Table 7 are plotted against the predicted fracturing pressure, as shown in Figure 17. Therefore, the correlations shown in Table 7 can be used to calculate fracturing pressure without the need for tedious, time-consuming, and expensive triaxial compression tests that consume a large number of core samples. It is recommended to repeat this work using more field data, as well as test enough cores obtained from all formations encountered during oil-well drilling in the area of study. Additionally, field verification of the newly proposed Mohr–Coulomb casing-setting-depth selection method is required.

4. Conclusions

In this study, uniaxial compressive strength and the indirect (Brazilian) tensile strength for selected core samples representing the Saudi lithological column were measured. Then, casing setting depth determined by Eaton, Hubbert and Willis, Mathews and Kelly, and leak-off methods was calculated. After this, a potential new method for selecting casing setting depth based on the Mohr–Coulomb failure criteria was introduced. Finally, an economic comparison of all casing-setting-depth methods was performed. Based on the analysis performed in this study, the following conclusions were reached:
  • The Hubbert & Willis method provided a very narrow safe mud window compared to the other methods, while the Eaton, leak-off, and Mathews & Kelly methods provided more economical results compared to the Hubbert & Willis method.
  • The Mohr–Coulomb method provided the widest and most economical safe mud window compared to all other methods.
  • A new method for casing-setting-depth selection based on the fracturing pressure estimated using the Mohr–Coulomb failure criterion was developed in this study. This new method requires either appreciable core samples from various depths to be tested in the rock mechanics laboratory or for core-calibrated well logs to be utilized to establish failure criteria necessary for fracturing pressure estimation and casing-setting-depth selection.
  • The new method for casing-setting-depth selection based on the fracturing pressure estimated using the Mohr–Coulomb failure criterion developed in this study is a new proof of concept. Therefore, it requires field verification.
  • If the Mohr–Coulomb method is used to choose the maximum mud weight, then filtration loss control materials must be utilized to seal any microfractures that may form.
  • Economic comparisons in terms of casing string number and length yielded that Eaton, leak-off, and Mathews and Kelly methods reduced casing cost by 31% compared to the Hubbert and Willis method. On the other hand, the Mohr–Coulomb method reduced casing cost by 41% compared to the Hubbert and Willis method and by 10% compared to the leak-off and Mathews and Kelly methods.

Author Contributions

M.N.J.A., experimental work, theory, data analysis, and writing; F.S.A., writing—review and editing; M.A.A., data analysis and writing—review; K.A.F., literature review; K.A.A., experimental work. All authors have read and agreed to the published version of the manuscript.

Funding

This research received no external funding.

Data Availability Statement

The original contributions presented in this study are included in the article. Further inquiries can be directed to the corresponding author.

Conflicts of Interest

The authors declare no conflicts of interest.

References

  1. Idir, K.; Samir, B.; Mohamed, Z.; Kong, F. Drill Bit Deformations in Rotary Drilling Systems under Large-Amplitude Stick-Slip Vibrations. Appl. Sci. 2020, 10, 6523. [Google Scholar] [CrossRef] [Scilit]
  2. Rabia, H. Fundamentals of Casing Design; Petroleum Engineering and Development Studies; Springer: Berlin/Heidelberg, Germany, 1987; ISBN 0860108635. [Google Scholar]
  3. Assi, A.H. Geological Considerations Related to Casing setting depth selection and design of Iraqi oil wells (case study). Iraqi J. Chem. Pet. Eng. 2022, 23, 35–42. [Google Scholar] [CrossRef] [Scilit]
  4. Azi, A.S. Casing Setting Depth using Bottom-Up Method for Development Well in the Offshore. Timor-Leste J. Eng. Sci. 2020, 1, 36–41. [Google Scholar]
  5. Marbuna, B.T.H.; Ridwanb, R.H.; Nugrahac, H.S.; Sinagaa, S.Z.; Purbantanua, B.A. Casing Setting Depth and Design of Production Well in Water-Dominated Geothermal System with 330 °C Reservoir Temperature. Energy Rep. 2020, 6, 582–593. [Google Scholar] [CrossRef] [Scilit]
  6. Mohammad, A.; Mohammad, R.F. Analysis of Stress Field and Determination of Safe Mud Window in Borehole drilling (Case Study: SW Iran). J. Pet. Explor. Prod. Technol. 2013, 3, 105–114. [Google Scholar] [CrossRef] [Scilit]
  7. Bashir, Y.; Moussavi Alashloo, S.Y.; Arshad, A.R.; Hamidi, R.; Latiff, A.H.A. Seismic Imaging Methods and Applications for Oil and Gas Exploration; Elsevier: Amsterdam, The Netherlands, 2022. [Google Scholar]
  8. Su, A.; Chen, H.; He, C.; Lei, M.; Liu, Y. Complex Accumulation and Leakage of YC21-1 Gas Bearing Structure in Yanan Sag, Qiongdongnan Basin, South China Sea. Mar. Pet. Geol. 2017, 88, 798–813. [Google Scholar] [CrossRef] [Scilit]
  9. Su, A.; Chen, H.; Feng, Y.X.; Zhao, J.X.; Lei, M.; Nguyen, A.D. Distal Accumulation of Leaked Gas from Deep Overpressured Zone: The Case of the Yanan Sag, Qiongdongnan Basin, South China Sea. Mar. Pet. Geol. 2023, 151, 106181. [Google Scholar] [CrossRef] [Scilit]
  10. Sallam, A.O.; Abu El-Hassan, M.M.; Noah, A.Z. Pore Pressure Evaluation Using Well Logging and Drilling Exponent For A/R “C” Member, A/R Formation, Bed-15 Field, Western Desert, Egypt. Annu. Geol. Surv. Egypt 2022, 39, 161–170. [Google Scholar] [CrossRef] [Scilit]
  11. Zhang, J. Pore pressure prediction from well logs: Methods, Modifications, and New Approaches. Earth Sci. Rev. 2011, 108, 50–63. [Google Scholar] [CrossRef] [Scilit]
  12. Al-Awad, M.N.J.; AlQuraishi, A.A.; Almisned, O.A.; Haroon, K.A. Potential Saudi Standard Sandstone for Applied Studies of Petroleum and Natural Gas Engineering. In Proceedings of the 2008 SPE Saudi Arabia Section Technical Symposium, Alkhobar, Saudi Arabia, 10–12 May 2008. SPE-KSA-08048. [Google Scholar]
  13. Casing Design Parameters. Available online: https://drillingforgas.com/ (accessed on 15 December 2025).
  14. Rabia, H. Oilwell Drilling Engineering: Principles and Practice; Graham and Trotman: London, UK; Springer: Dordrecht, The Netherlands, 1985. [Google Scholar]
  15. Schlumberger Energy Glossary. Leakoff Test. Available online: https://glossary.slb.com/ (accessed on 15 December 2025).
  16. Inglis, T.A. Measurement While Drilling (MWD). In Directional Drilling; Petroleum Engineering and Development Studies; Springer: Dordrecht, The Netherlands, 1987; Volume 2. [Google Scholar] [CrossRef] [Scilit]
  17. Bera, P. Estimation of Pore Pressure from Well logs: A Theoretical Analysis and Case Study from an Offshore Basin, North Sea. In Proceedings of the 8th Biennial International Conference & Exposition on Petroleum Geophysics, Hyderabad, India, 1–3 February 2010. [Google Scholar]
  18. Kumar, B.; Niwas, S.; Mangaraj, B.K. Pore Pressure Prediction from Well Logs and Seismic Data. In Proceedings of the 8th Biennial International Conference & Exposition on Petroleum Geophysics, Hyderabad, India, 1–3 February 2010. [Google Scholar]
  19. Farsi, M.; Mohamadian, N.; Ghorbani, H.; Wood, D.A.; Davoodi, S.; Moghadasi, J.; Al-Subhi, A. Predicting Formation Pore-Pressure from Well-Log Data with Hybrid Machine-Learning Optimization Algorithms. Nat. Resour. Res. 2021, 30, 3455–3481. [Google Scholar] [CrossRef] [Scilit]
  20. Fjær, E.; Holt, R.M.; Horsrud, P.; Raaen, A.M.; Risnes, R. Petroleum Related Rock Mechanics, 2nd ed.; Elsevier: Amsterdam, The Netherlands, 2008. [Google Scholar]
  21. Zhang, J.; Standifird, W.B.; Adesina, K. Wellbore Stability with Consideration of Pore Pressure and Drilling Fluid Interaction. In Proceedings of the U.S. Symposium on Rock Mechanics, Golden, CO, USA, 17–21 June 2006. [Google Scholar]
  22. Ulusay, R. (Ed.) The ISRM Suggested Methods for Rock Characterization, Testing and Monitoring: 2007–2014; Springer: Cham, Switzerland, 2014. [Google Scholar] [CrossRef] [Scilit]
  23. Shmhoouri, F.A.; AlChalabi, A.M. Deep Drilling into Khuff Formation. In Proceedings of the Middle East Oil Technical Conference, Manama, Bahrain, 14–17 March 1983. SPE-11469. [Google Scholar]
  24. Poulos, H.G. A review of geological and geotechnical features of some Middle Eastern countries. Innov. Infrastruct. Solut. 2018, 3, 51. [Google Scholar] [CrossRef] [Scilit]
  25. AlAwad, M.N.J. Simple Correlation to Evaluate Mohr Coulomb Failure Criterion Using Uniaxial Compressive Strength. J. King Saud Univ. Eng. Sci. 2001, 14, 137–145. [Google Scholar] [CrossRef] [Scilit]
  26. Clavijo, S.P.; Dash, A.; Baby, G.; Alafifi, A.M.; Finkbeiner, T. Modelling Principal Stress Orientations in the Arabian Plate Using Plate Velocities. Geol. Soc. Lond. Spec. Publ. 2024, 546, 193–214. [Google Scholar] [CrossRef] [Scilit]
Figure 1. Typical order for oil-well casing strings.
Processes 14 00309 g001
Figure 2. Typical profile of field leak-off test.
Processes 14 00309 g002
Figure 3. Fracturing pressure estimation by Mohr–Coulomb criterion.
Processes 14 00309 g003
Figure 4. Sensitivity analysis for the proposed new casing-setting-depth estimation method using Sarah sandstone properties (pore pressure effect).
Processes 14 00309 g004
Figure 5. Sensitivity analysis for the proposed new casing-setting-depth estimation method using Sarah sandstone properties (minimum horizontal in situ stress effect).
Processes 14 00309 g005
Figure 6. Core samples from various formations: before testing.
Processes 14 00309 g006
Figure 7. Pore pressure–fracturing pressure profile establishment process.
Processes 14 00309 g007
Figure 8. Strength of three core samples from Saudi Arabia.
Processes 14 00309 g008
Figure 9. Core samples from various formations: after testing.
Processes 14 00309 g009
Figure 10. Strength of ten core samples from Saudi Arabia.
Processes 14 00309 g010
Figure 11. Pore pressure profile in the western part of the Arabian Gulf.
Processes 14 00309 g011
Figure 12. Pore pressure profile for the studied 10 core samples.
Processes 14 00309 g012
Figure 13. Typical plot for Mohr–Coulomb failure criterion.
Processes 14 00309 g013
Figure 14. Fracturing pressure estimated by five different methods.
Processes 14 00309 g014
Figure 15. Safe mud window estimated by five different methods at a depth of 7500 ft.
Processes 14 00309 g015
Figure 16. Casing setting depth estimated by five different methods for a hypothetical reservoir at 7500 ft.
Processes 14 00309 g016
Figure 17. Calculated fracturing pressure versus predicted fracturing pressure using all methods.
Processes 14 00309 g017
Table 1. Sensitivity analysis of the proposed new casing-setting-depth selection method using Sarah sandstone properties.
ParametersGoverning EquationRock Strength
@ Constant P p   and   σ h
Minimum Horizontal Stress
@ Constant P p
Formation Pore Pressure
@ Constant σ h
IncreaseDecrease σ h  Increase σ h Decrease P p Increase P p Decrease
Circle Diameter
(Equation (8))
σ h P P IncreaseDecreaseIncreaseDecreaseDecreaseIncrease
Fracturing Pressure
(Equation (9))
σ r σ θ + 2 σ h 2 IncreaseDecreaseIncreaseDecreaseDecreaseIncrease
Table 2. Mechanical properties of the tested core samples.
#Rock TypeUniaxial Compressive Strength (σc), psiTensile Strength (σt),
psi
AUm Assha’al Sandstone [12]13113.1
5Sandstone2238.6159.5
4Sandstone2314.9290
3Sandstone2327.6449.5
BSarah Sandstone [12]2810.4281
6Sandstone3930.3507.5
1Sandstone4197.4484.6
7Limestone4426.3449.5
CSaq Sandstone [12]4881.6488.2
2Limestone10,175.4971.5
Table 3. Pore pressure evaluation of the tested core samples.
#Rock TypeDepth, ftUCS, psiσt, psiPp, psi
AUm Assha’al Sandstone2013113.114.7
5Sandstone14,2812238.6159.57908
4Sandstone14,448.52314.92908020
3Sandstone14,4762327.6449.58039
BSarah Sandstone16,3502810.42819100
6Sandstone17,095.33930.3507.59851
1Sandstone17,4244197.4484.610,000
7Limestone17,689.64426.3449.510,278
CSaq Sandstone19,3504881.6488.211,300
2Limestone21,851.610,175.4971.512,350
Table 4. Properties required for fracturing pressure estimation.
#Rock TypeDepth, ftσc, psiσt, psiσv, psiσH, psiσh, psiPp, psi
AUm Assha’al S.S.2013113.1662419.214.7
5Sandstone14,2812338.6159.515,709.117,137.213,709.87908
4Sandstone14,448.52314.929015,893.3517,338.213,870.68020
3Sandstone14,4762327.6449.515,923.617,371.213,8978039
BSarah Sandstone16,3502810.428117,98519,62015,6969100
6Sandstone17,095.33930.3507.518,804.8320,514.416,411.59851
1Sandstone17,4244197.4484.619,166.420,908.816,72710,000
7Limestone17,689.64426.3449.519,458.5621,227.516,98210,278
CSaq Sandstone19,3504881.6488.221,28523,22018,57611,300
2Limestone21,851.610,175.4971.524,036.7626,221.920,977.512,350
Table 5. Fracturing pressure estimation for the studied rocks.
#Rock TypeFracturing Pressure, psi
Hubbert & WillisMathews & KellyEatonLeak-Off Test
h + σt)
Mohr–Coulomb
AUm Assha’al S.S.31.5859.328.332.30
5Sandstone10,458.6414,716.214,553.413,869.318,585
4Sandstone10,594.1514,891.315,002.014,160.618,948.7
3Sandstone10,616.8014,920.115,031.014,346.518,984.1
BSarah Sandstone12,004.7516,854.217,301.515,977.021,441.7
6Sandstone12,776.2117,665.318,116.116,919.022,419.1
1Sandstone12,994.9117,999.818,461.317,211.622,850.2
7Limestone13,276.7518,290.118,752.417,431.523,198.5
CSaq Sandstone14,561.1520,014.220,516.919,064.225,376
2Limestone16,169.5822,549.423,137.821,949.028,656.6
Table 6. Comparison of casing setting calculated by various methods.
MethodNumber of Casing StringsTotal Length of Casing Strings, ftReduction in Total Casing String Length, %
Hubbert and Willis522,083---
Eaton, Leak Off, and Mathews and Kelly415,20831%
Mohr–Coulomb412,91741%
Table 7. Correlation for fracturing pressure prediction.
Predicted Fracturing Pressure = A + ( B P p ) + ( C σ c ) + ( D σ h )
MethodABCDCorrelation Coefficient (R2)
Mohr–Coulomb−31.10.0750.0031.3220.99
Eaton−26.10.6940.0390.680.99
Leak Off9.070.0050.0811.0040.99
Hubbert and Willis14.230.6710.00090.3750.99
Mathews and Kelly37.50.1380.00230.9910.99
Disclaimer/Publisher’s Note: The statements, opinions and data contained in all publications are solely those of the individual author(s) and contributor(s) and not of MDPI and/or the editor(s). MDPI and/or the editor(s) disclaim responsibility for any injury to people or property resulting from any ideas, methods, instructions or products referred to in the content.