1. Introduction
As conventional oil and gas resources continue to deplete, shale oil and gas have become an important supplement to the global energy supply. China possesses enormous shale oil and gas resources, but the overall development level remains relatively limited [
1,
2,
3,
4,
5]. The greatest difference between shale reservoirs and conventional oil reservoirs lies in their pore systems, with pore sizes predominantly at the nanoscale and very low permeability [
6,
7,
8,
9]. This unique pore structure results in fluid migration patterns and phase behaviors within the reservoir that differ significantly from classical theories, exhibiting phenomena such as slip flow effects, abnormal interfacial tension, and diffusion limitations. The resulting issues, such as low recovery rates and rapid decline in production, have become key challenges limiting the efficient development of shale oil and gas [
10,
11,
12,
13,
14]. Traditional experimental methods are inadequate for direct observation and quantitative analysis of fluid processes at the nanoscale [
15,
16,
17,
18]. In recent years, micro- and nanofluidic technologies have been increasingly applied in the oil and gas industry [
19,
20,
21,
22,
23]. This method allows for the precise construction of pore channels similar to those in rock cores on chips and, in combination with optical microscopy and temperature control systems, enables in situ visualization of fluid migration and phase changes at the nanoscale [
24,
25,
26,
27,
28]. Microfluidic research has now become an important tool for understanding multiphase flow mechanisms and optimizing enhanced oil recovery. Researchers have developed controllable and visualized microfluidic chips to simulate the pore structures and wettability characteristics of real rock cores, thereby elucidating the microscopic mechanisms of various oil recovery methods [
29,
30,
31,
32,
33].
In the foundational theory of microfluidic flow, Squires and Quake systematically elucidated how viscous forces, interfacial forces, and geometric confinement dominate fluid behavior at the microscale, while Whitesides highlighted how soft-lithography techniques provide a powerful visualization platform for investigating these microscale phenomena [
34,
35]. Santiago et al. first established the Micro Particle Image Velocimetry (μPIV) technique for high-resolution velocity-field measurement in microchannels; later, Meinhart, Wereley, and Santiago refined the method, enabling precise capture of Poiseuille velocity profiles in 50–200 μm channels [
36,
37]. Using the improved μPIV system, Jensen et al. investigated two-phase interfacial flows and showed that wettability and interfacial tension markedly alter local velocity gradients, whereas Cejas et al. applied μPIV to non-Newtonian polymer solutions and observed substantial deviations from classical Poiseuille flow. Meanwhile, the PDMS soft-lithography technique developed by Xia and Whitesides became the standard fabrication method for microchannel construction, enabling highly reproducible microfluidic experiments [
38,
39,
40]. Nguyen and Wereley further established a comprehensive framework for microfluidic flow measurement encompassing theoretical modeling, experimental methodology, and instrumentation design [
41].
In the field of shale oil development, Yang et al. demonstrated through experiments that externally injected fluids can significantly alter the pore–throat structure of carbonaceous shale, emphasizing that the evolution of pore architecture critically affects subsequent microscale flow and displacement behaviors [
42]. Porter et al. developed a microfluidic system capable of operating under reservoir-level pressure–temperature conditions and incorporating real geological materials, successfully reproducing two-phase and three-phase flow behaviors characteristic of unconventional reservoirs; their results highlighted that authentic pore structures and wettability conditions are key controls on microscale flow [
43]. In addition, a 2019 EOR microfluidics review systematically summarized the use of micro-models in CO
2 flooding, waterflooding, foam flooding, and chemical EOR, concluding that microfluidics enables pore-scale visualization of interfacial phenomena, wettability alteration, and the effectiveness of injected agents, thereby serving as a critical tool for elucidating recovery mechanisms in unconventional reservoirs [
44]. Nguyen et al. utilized a glass microfluidic chip to compare the huff-and-puff oil recovery processes of supercritical CO
2 and N
2 within shale pores under reservoir conditions [
45]. The results revealed that CO
2 exhibits a superior ability to dissolve and reduce viscosity, as well as higher diffusivity than N
2, leading to a significantly enhanced oil recovery performance. Lei et al. conducted CO
2 mobilization experiments using a microfluidic platform. The results demonstrated that the synergistic effects of dissolution, diffusion, and flow play a crucial role in enhancing shale oil mobilization [
46]. Wang et al. designed microfluidic chips with porous-media-like structures to investigate the regulation of nanofluids at oil/water/solid three-phase interfaces, as well as the kinetics and migration behavior of residual oil [
47]. Zhong et al. conducted gas-driven displacement experiments in nanofluidic chips and observed that increasing the injection pressure effectively suppressed gas fingering and enhanced oil displacement under nanoscale confinement [
48]. Dorhjie et al. integrated microfluidic experiments with numerical simulations to investigate the nonequilibrium phase transition and flow behavior of gas-condensate systems, providing new insights into multiphase flow mechanisms within shale reservoirs [
49].
In summary, microfluidic techniques provide an effective experimental approach for investigating pore-scale flow processes that are difficult to directly observe using conventional core-scale experiments. By accurately reproducing reservoir pore structures and fluid interactions at the microscale, microfluidic methods enable the elucidation of wettability alteration, interfacial dynamics, and residual oil migration mechanisms during multiphase flow. However, current microfluidic studies related to oil and gas development remain largely confined to the micrometer scale, whereas shale reservoirs are dominated by nanopores. At this scale, fluid transport behavior deviates significantly from classical Darcy flow, and the flow characteristics and underlying mechanisms of shale oil under nanoscale confinement remain insufficiently and unsystematically understood.
To address this issue, the present study employs a nanofluidic visualization platform to directly observe shale oil flow behavior within nanopores in real time. By introducing an equivalent resistance factor, the limitations of traditional continuum-based models at the nanoscale are overcome, enabling a more accurate representation of realistic flow conditions. Systematic experiments were conducted by varying channel size, temperature, and pressure to investigate the combined effects of nanoscale confinement and reservoir conditions on shale oil flow behavior. On this basis, the displacement process of shale oil in nanochannels was recorded and analyzed, and the relationship between displacement distance and time was established. A parallel-plate slit model was adopted as a baseline reference to enable direct comparison between ideal flow predictions and experimental observations. Through this integrated research framework, the controlling roles of nanoscale confinement and reservoir conditions on shale oil transport behavior are elucidated.
2. Materials and Methods
Utilizing a micro-visualized nanofluidic experimental platform, the flow behavior of shale oil within nanopores was observed in real time. The flow theoretical model in slit pores was employed to fit the experimental data, enabling quantitative analysis of shale oil flow under varying pore sizes and reservoir conditions (temperature and pressure). This approach revealed the seepage mechanisms governing shale oil migration under complex geological conditions. The study elucidates the flow patterns and behaviors of multiple shale oil samples, providing microscopic-scale theoretical guidance and scientific support for the design of enhanced oil recovery strategies in shale reservoirs.
2.1. Experimental
2.1.1. Materials
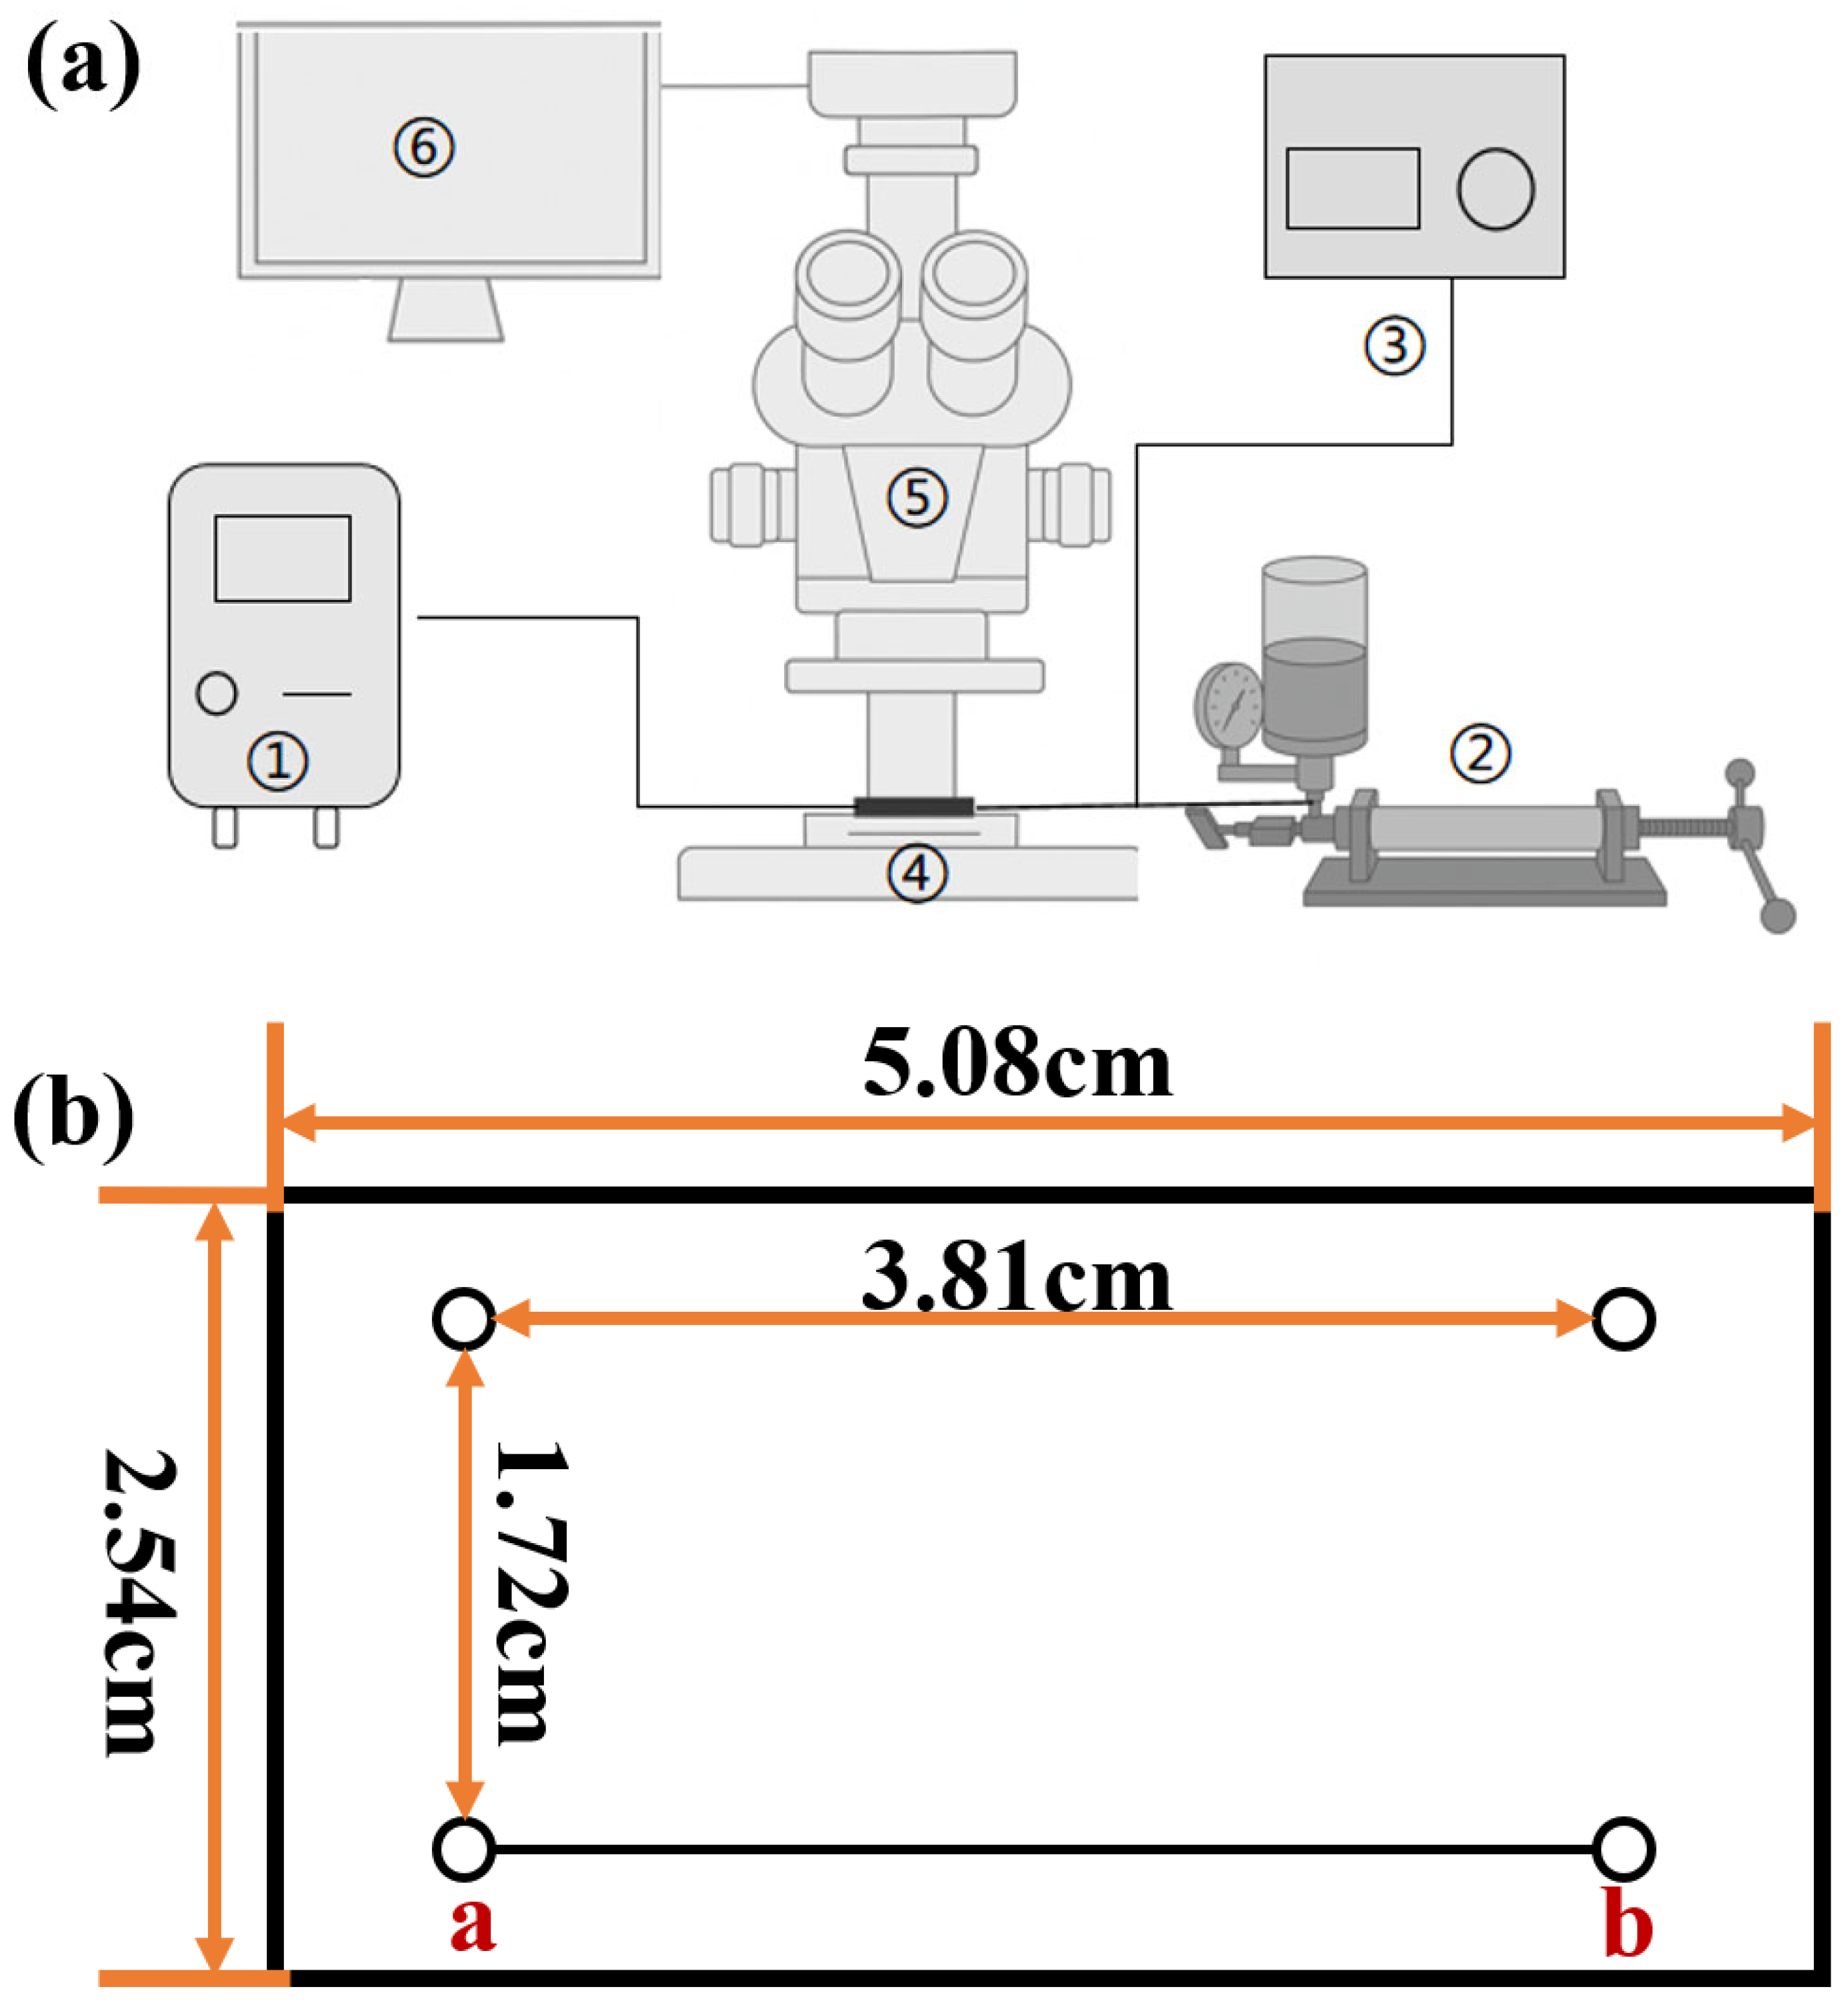
In this study, a micro-visualized nanofluidic platform was constructed (
Figure 1a), capable of operating at a maximum pressure of 20 MPa and a temperature of 100 °C. The system consists of (1) constant-flow injection pump (Harvard Apparatus, PHD ULTRA, Holliston, MA, USA), (2) confining pressure unit (Standard Microfluidic Chip Holder, Suzhou Wenhao Microfluidic Technology Co., Ltd., Suzhou, China), (3) heating system (Standard Microfluidic Chip Holder, Suzhou Wenhao Microfluidic Technology Co., Ltd., Suzhou, China), (4) chip holder (Standard Microfluidic Chip Holder, Suzhou Wenhao Microfluidic Technology Co., Ltd., Suzhou, China), (5) optical microscope (Leica, DMi8 C, Wetzlar, Germany), and (6) image acquisition device (Photron, SA-Z, Chiyoda, Japan). The constant-flow injection pump provides the injection pressure for shale oil, with a maximum output of up to 20 MPa. The chip holder secures the chip to ensure stability during injection, and its top is designed with a transparent glass window to facilitate microscopic observation. The confining pressure device applies external pressure to the chip, preventing a fracture that may occur under excessive injection pressure. The gas cylinder, filled with nitrogen, is used to purge and clean the flow channels within the chip. The heating chamber enables temperature control of the chip, reaching up to 100 °C. The microscope, combined with Image View software (Z-LIKE, Biology 3.6.1, China), allows real-time visualization of crude oil flow within the microchannels. By integrating the nanofluidic chip, micro-visualized nanofluidic experiments were conducted to analyze the flow patterns and dynamics of shale oil. The nanofluidic chip consists of three pore-size scales, with channel depths of 100 nm, 200 nm, and 300 nm, and a width of 2 μm. The main observation area lies between points A and B of the nanochannel, with detailed chip parameters shown in
Figure 1b.
The nanofluidic microchannel chips used in this study were fabricated from glass substrates, with glass serving as the channel wall material. To ensure consistency in surface conditions, all chips were subjected to a standardized cleaning procedure prior to the experiments to remove potential organic contaminants and residual impurities. All experiments were conducted immediately after cleaning in order to minimize the influence of surface aging on wettability behavior.
The crude oil used in the experiment is a simulated oil, prepared by mixing degassed crude oil and kerosene. The degassed crude oil was obtained from the Qin Tong Oilfield in China. At room temperature, the viscosity and density of this crude oil are 2.73 mPa·s.
2.1.2. Experimental Procedures
Before each set of experiments, several preliminary tests were conducted, including pressure leakage and fluid injection tests. All pipelines, valves, cylinders, and pumps were thoroughly cleaned to ensure system integrity. The pipelines were then connected, and the experimental platform was assembled. The specific experimental procedures are as follows:
- (1)
Connect all pipelines properly and assemble the micro-visualized nanofluidic platform.
- (2)
Wipe the surface of the nanofluidic chip and the interior of the chip holder to ensure optical clarity.
- (3)
Place the nanofluidic chip into the holder and tighten the primary and secondary nuts to prevent confining pressure leakage and fluid intrusion into the chip.
- (4)
Assemble the chip holder correctly and connect it to the confining pressure system. Flush the internal air using the confining liquid until fluid exits from the outlet, then tighten the outlet nut.
- (5)
Tighten the inlet valve, open the gas cylinder valve, connect the pressure monitoring device, and adjust the injection pressure to the desired level.
- (6)
An external confining pressure was applied to the chip using a mechanical clamping device. The confining pressure was maintained at 3 MPa higher than the injection pressure throughout the experiments to ensure mechanical stability of the chip.
- (7)
Launch the Image View software, adjust the focus, and locate the flow channel under the microscope.
- (8)
Open the nitrogen valve and inject nitrogen gas into the chip to purge and clean the flow channel until it becomes clear and visible under the microscope.
- (9)
Connect the inlet to the constant-flow pump and inject crude oil from the intermediate container into the nanochannel under a controlled pressure difference until the channel is fully saturated with oil.
- (10)
Observe the microscopic images in real time and record the experimental data.
This experiment primarily investigated the effects of pore size, temperature, and driving pressure on shale oil flow within nanopores. The detailed experimental design is summarized in
Table 1. To examine the influence of temperature, three levels were selected: 25 °C, 50 °C, and 80 °C. A relatively large temperature range was adopted to ensure a more pronounced and reliable experimental response, as minor temperature variations could lead to significant uncertainty in the results. For the injection pressure, three conditions were applied: 1 MPa, 3 MPa, and 6 MPa. Pressures below 1 MPa were insufficient to inject crude oil into the chip channels, while excessively high pressures could cause chip fracture. Based on repeated preliminary tests, injection pressures of 1 MPa, 3 MPa, and 6 MPa were determined to balance experimental feasibility and chip integrity. Regarding pore size, three characteristic depths, 100 nm, 200 nm, and 300 nm were selected. Extremely small pores would require unreasonably high injection pressures that risk damaging the chip, whereas overly large pores would diminish the significance of nanoscale flow effects.
2.2. Theoretical
In this section, we investigate the confined fluid dynamics within nanopores. a theoretical model in slit pores is used to predict crude oil transport, and the experimental data are fitted by adjusting an effective viscosity parameter. The following provides a detailed derivation of the governing equation. We begin by stating several necessary assumptions:
- (1)
The fluid is assumed to be an incompressible Newtonian fluid.
- (2)
The flow is considered to be quasi-steady.
- (3)
The flow is laminar, and inertial effects are negligible.
- (4)
The flow occurs within an infinitely long parallel-plate slit with a height h and width w, where w ≫ h.
- (5)
The total driving pressure difference of the fluid consists of two components: the externally applied pressure and the capillary pressure.
It should be noted that assumptions (1)–(5) are formulated based on the specific experimental geometry and operating conditions of this study, and their applicability should therefore be interpreted in the context of the actual nanochannel scale. In this work, the slit-flow model is adopted as an idealized Newtonian baseline solution, primarily to provide a reference framework for comparison with the experimental observations. Given the relatively large width-to-height ratio of the nanochannels considered, sidewall effects associated with the finite channel width are expected to be secondary and are thus neglected in the first-order analysis.
Within this baseline framework, shale oil is treated as a Newtonian fluid for the mobile bulk phase. Although shale oil contains polar components such as resins and asphaltenes, which may induce interfacial structuring or adsorption-layer formation under nanoscale confinement, the shear rates achieved in the present nanochannel experiments can reach the order of 104 s−1. Previous studies have shown that crude oils and asphaltene-containing systems tend to approach Newtonian behavior at sufficiently high shear rates, even if they exhibit non-Newtonian characteristics under low-shear conditions.
Based on these considerations, an equivalent resistance factor is introduced to quantify the deviation of the experimentally observed shale oil flow behavior from the ideal Newtonian slit-flow prediction. This treatment allows the additional flow resistance arising from nanoscale confinement and fluid–solid interfacial interactions to be effectively captured within a simplified and physically consistent modeling framework for shale oil transport in nanopores.
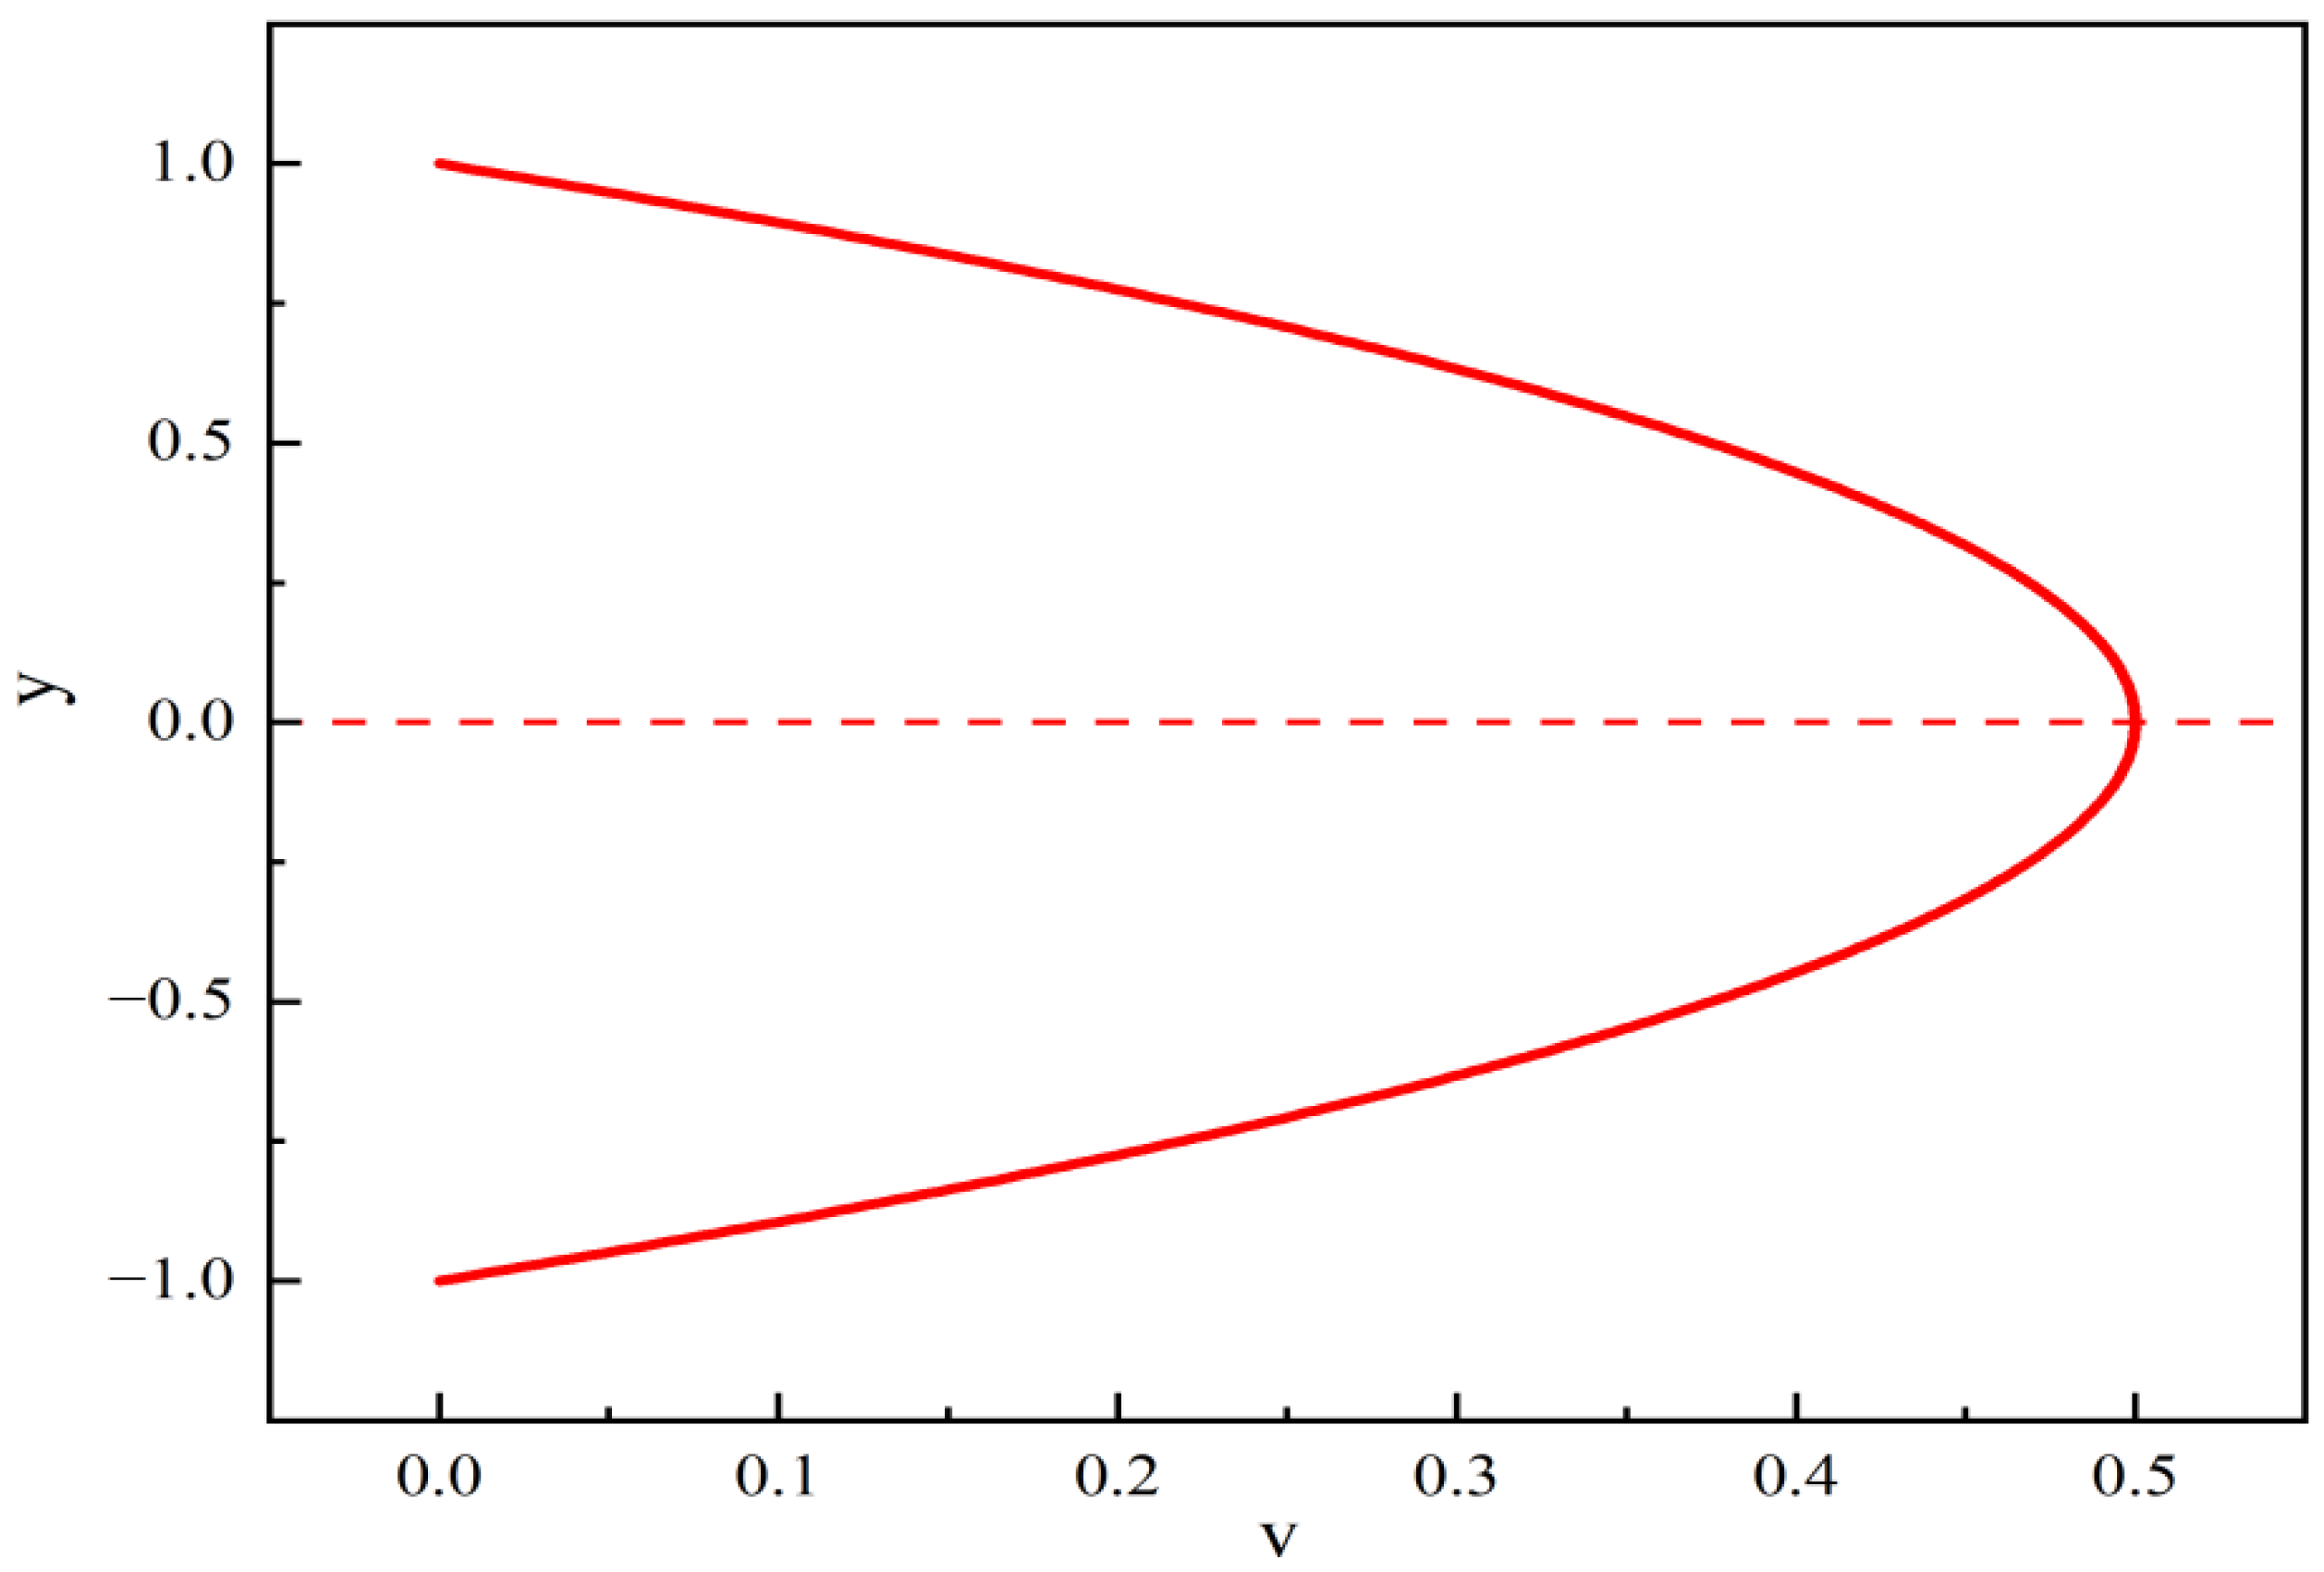
For pressure-driven flow between two infinitely large parallel plates, the velocity distribution (
Figure 2) can be expressed as follows:
where v(y) represents the flow velocity at a distance y from the center plane, μ denotes the fluid viscosity,
is the pressure gradient along the flow direction, y denotes the transverse coordinate across the channel thickness, and h is the height of the slit.
By integrating Equation (1), the volumetric flow rate Q through the slit cross-section can be obtained as follows:
The driving pressure difference consists of the externally applied pressure difference and the capillary pressure, expressed as:
For a parallel-plate slit, the capillary pressure can be expressed as:
where γ represents the interfacial tension, θ represents the contact angle.
Thus, the total pressure difference can be expressed as:
The volumetric flow rate Q is related to the propagation velocity of the flow front through the principle of mass conservation:
where X denotes the displacement distance, and t denotes the time.
By substituting Equation (2) into Equation (6) and simplifying, we obtain:
Rearranging yields an ordinary differential equation relating L and t:
Integrating both sides of the above equation with the initial condition X = 0 at t = 0 gives:
By substituting Equation (5) into Equation (9), we obtain:
Equation (10) is referred to as the Plate Channel equation.
In the theoretical model, the oil–solid interfacial parameters involved in the capillary pressure term were obtained from experimental measurements. The contact angle of shale oil on the glass surface was measured to be 5.1°, and the interfacial tension γ was taken as 25.7 mN m−1.
The theoretical model is used to predict shale oil flow, with an effective resistance coefficient introduced before the viscosity term to account for the additional resistance imposed by nanoscale confinement.
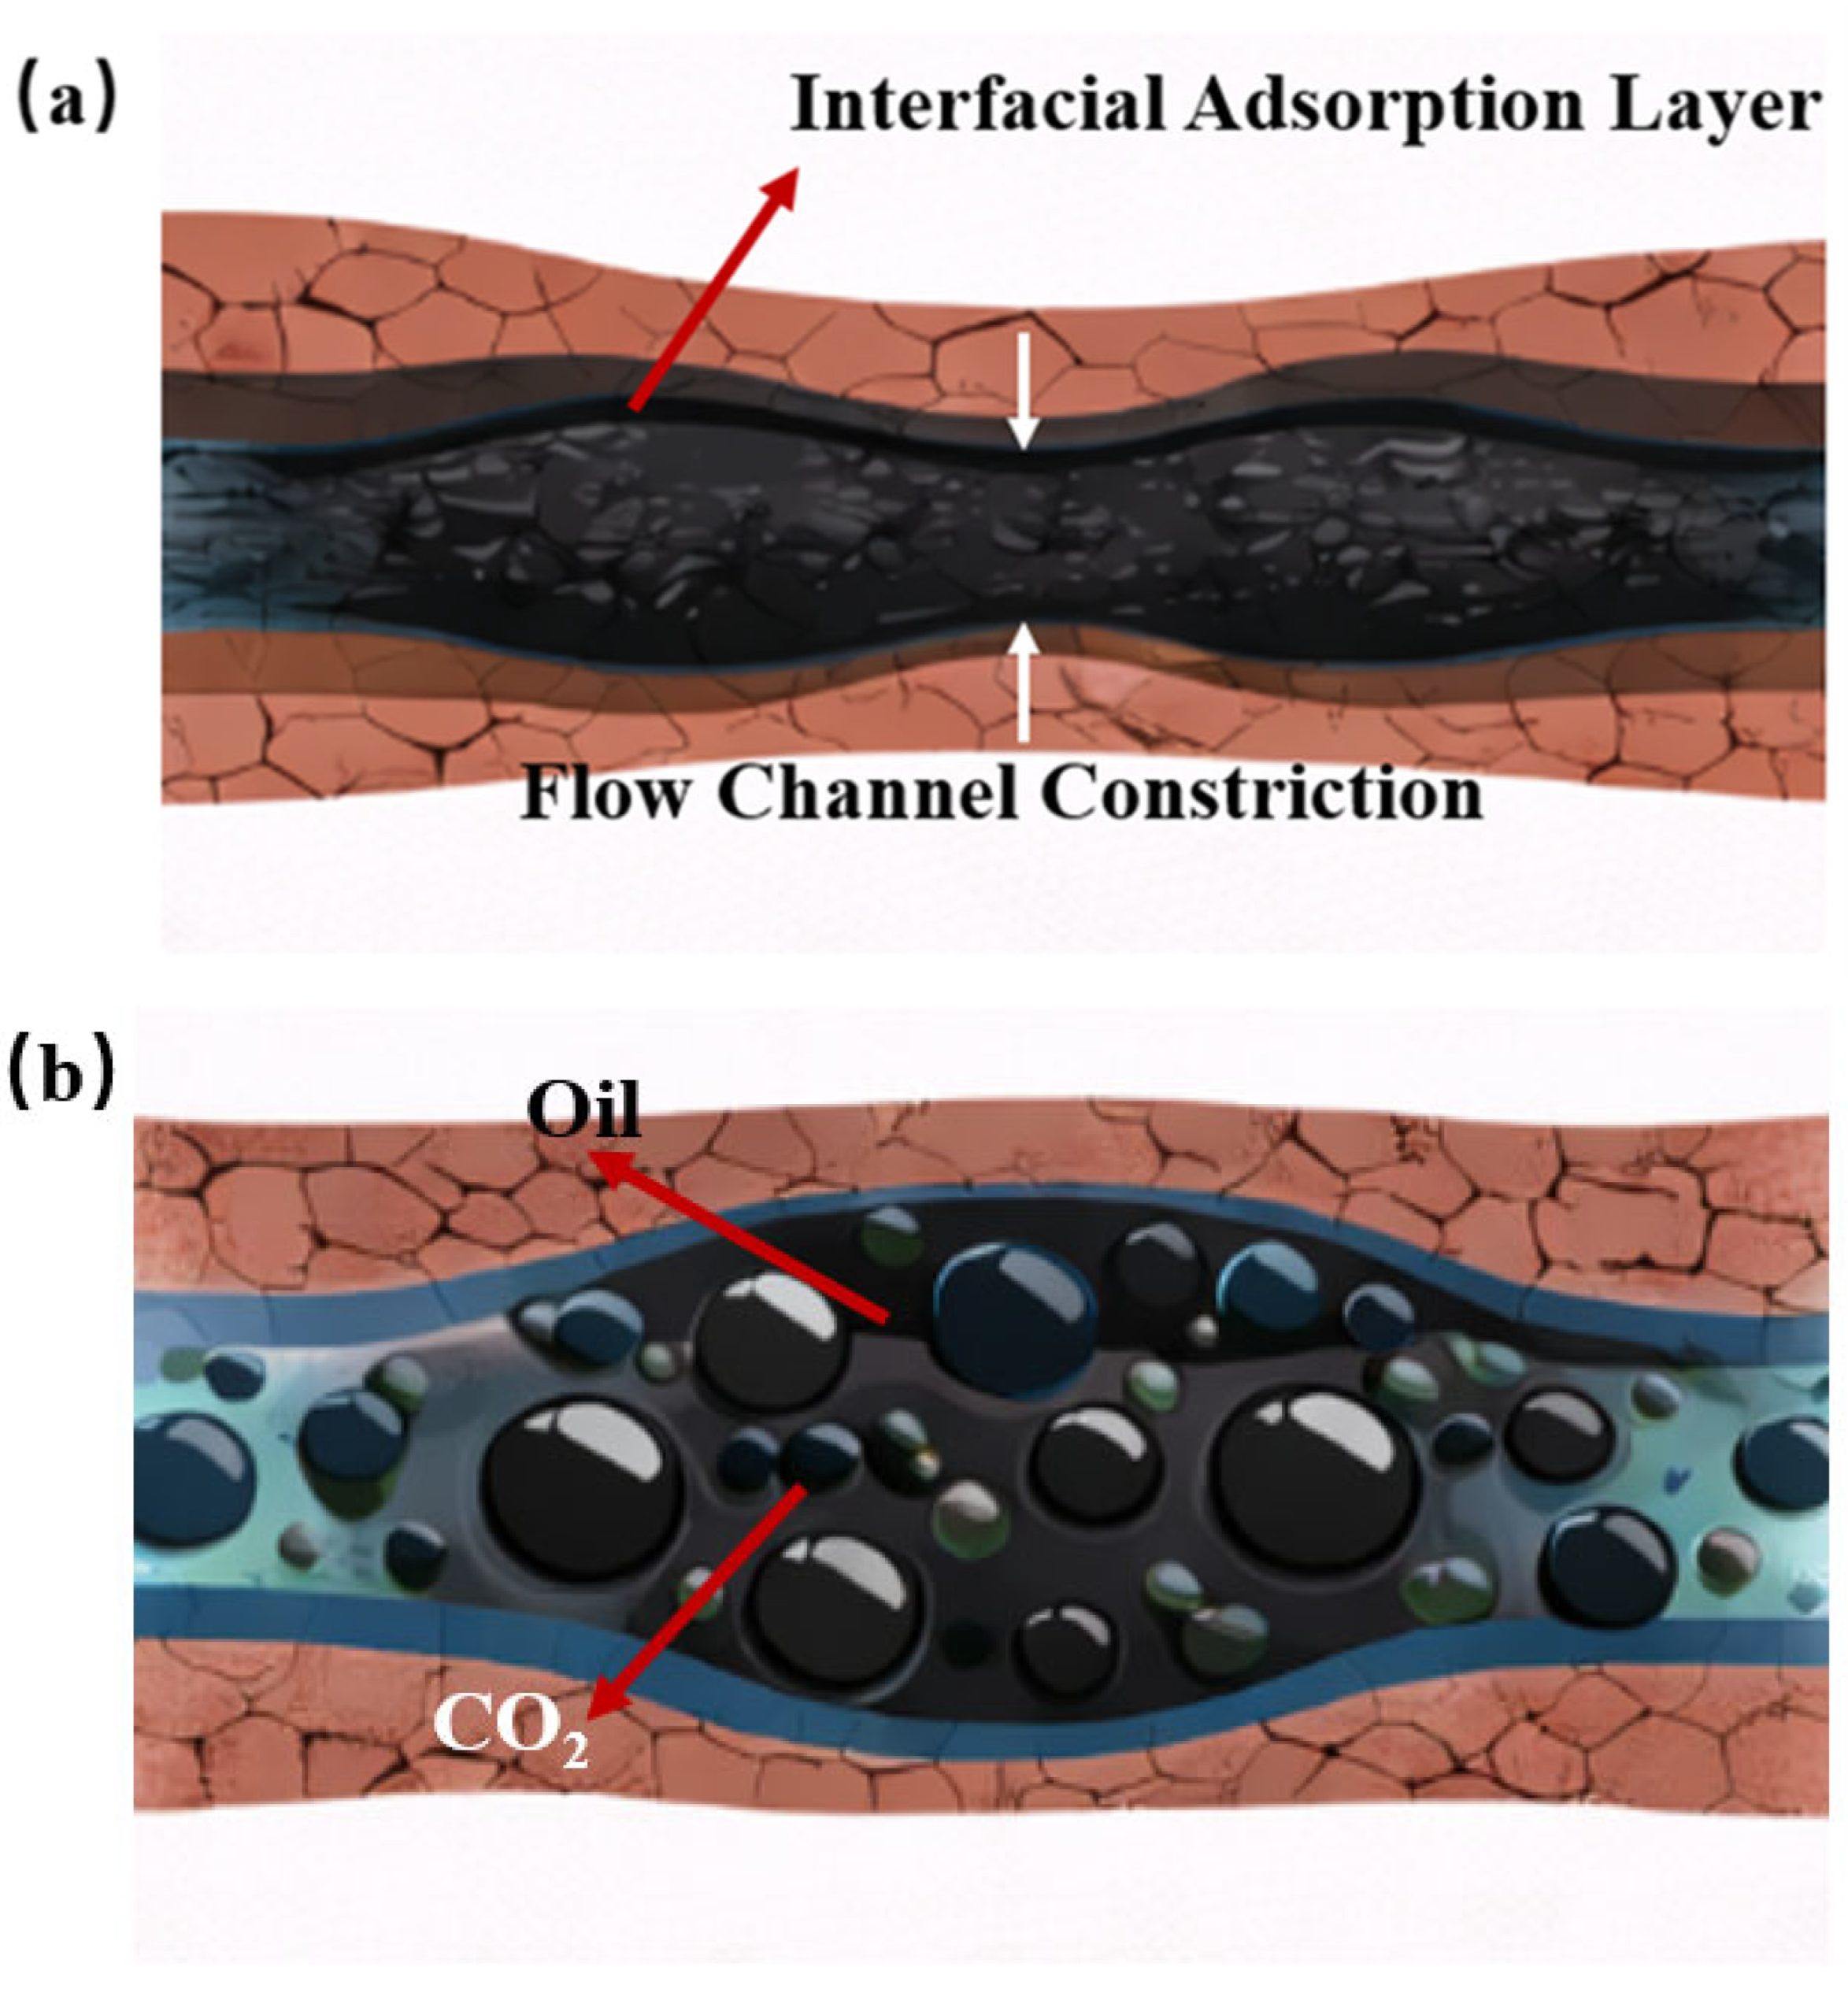
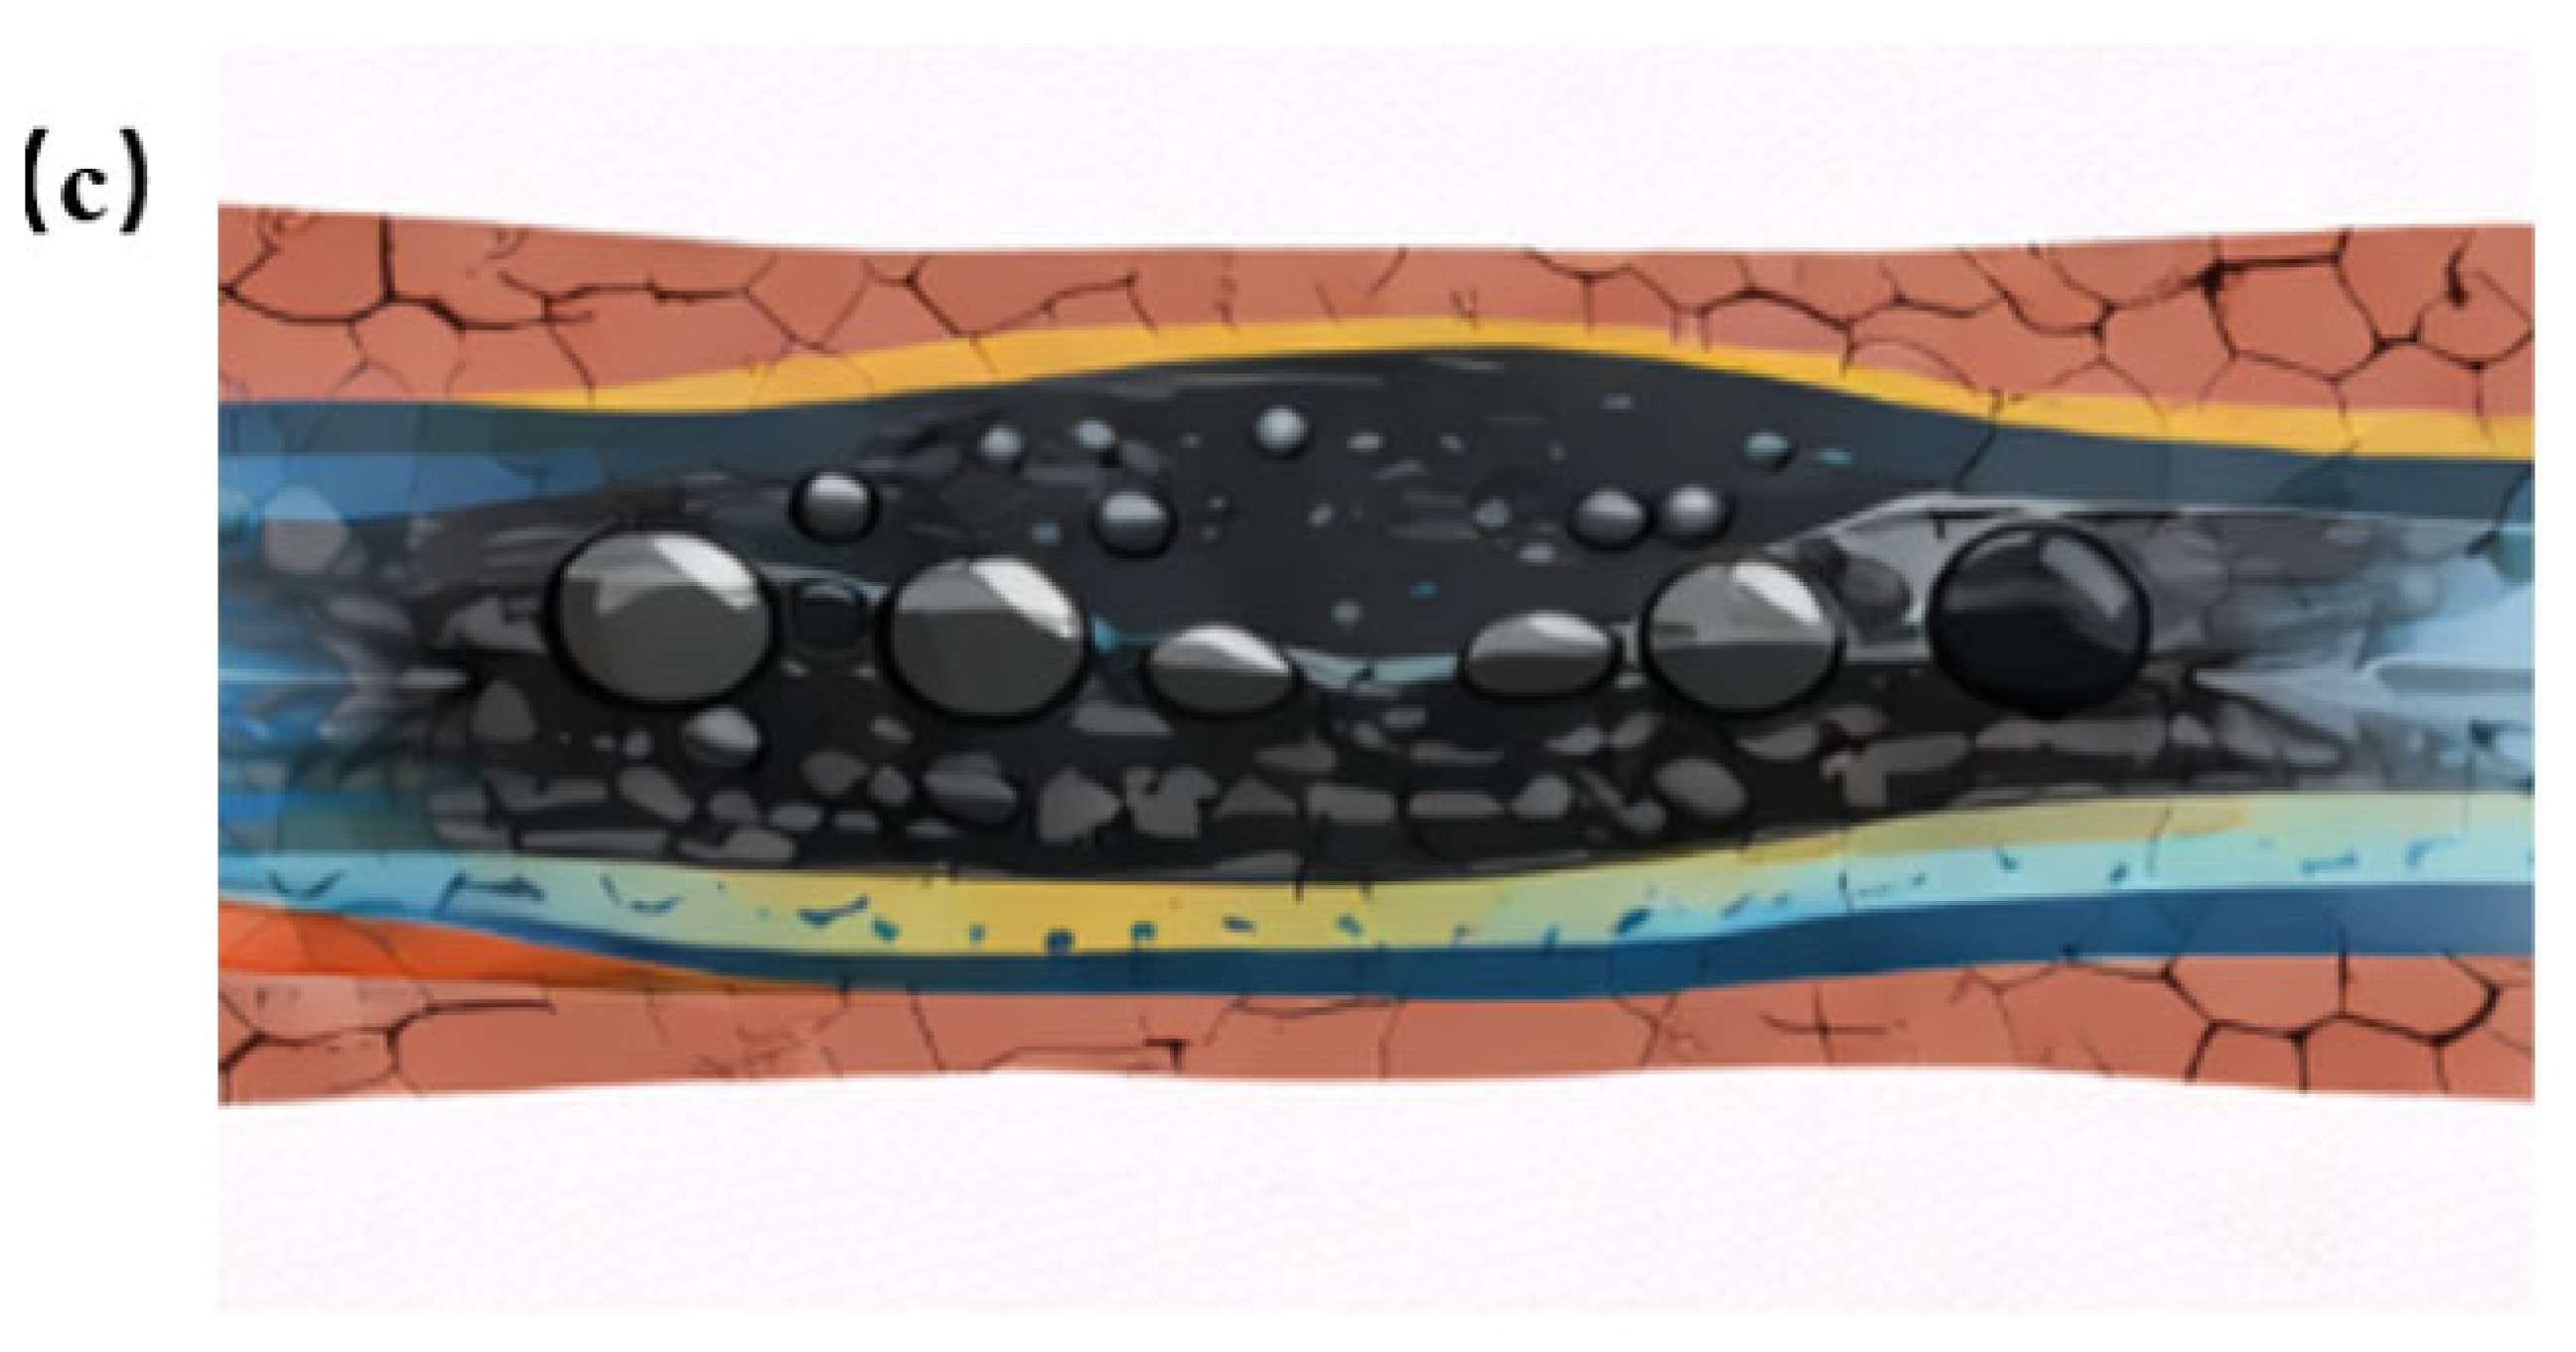
Figure 3a–c illustrates the primary mechanisms responsible for the additional flow resistance generated during CO
2 flooding in nanoscale shale pores. Strong fluid–solid interactions lead to the formation of a stable adsorption layer near the pore walls, resulting in a reduction in the effective flow channel. Under CO
2 displacement or water-bearing conditions, the oil phase exhibits droplet-like structures and pronounced phase heterogeneity within nanopores. Crude oil retention in the near-wall region and stratified oil–gas flow further enhances flow resistance. The combined effects of nanoscale confinement and interfacial interactions significantly increase flow resistance and cause deviations from classical Darcy flow behavior.
From Equation (10), it can be seen that x exhibits a linear relationship with t. In the following analysis, we denote the slopes obtained from the fitted model and the ideal model as k1 and k2, respectively. The difference between these two values provides a more intuitive indication of the deviation between ideal and actual flow behavior.
3. Results
The study of shale oil flow patterns and behavior is critical. However, due to the nanoscale confinement effect, shale oil flow deviates from Darcy’s law. Its transport behavior within nanopores remains unclear. This study conducted nine sets of experiments by varying channel depth, temperature, and pressure, aiming to analyze the flow patterns and behavior of shale oil in nanopores.
3.1. Effects of Pore Size
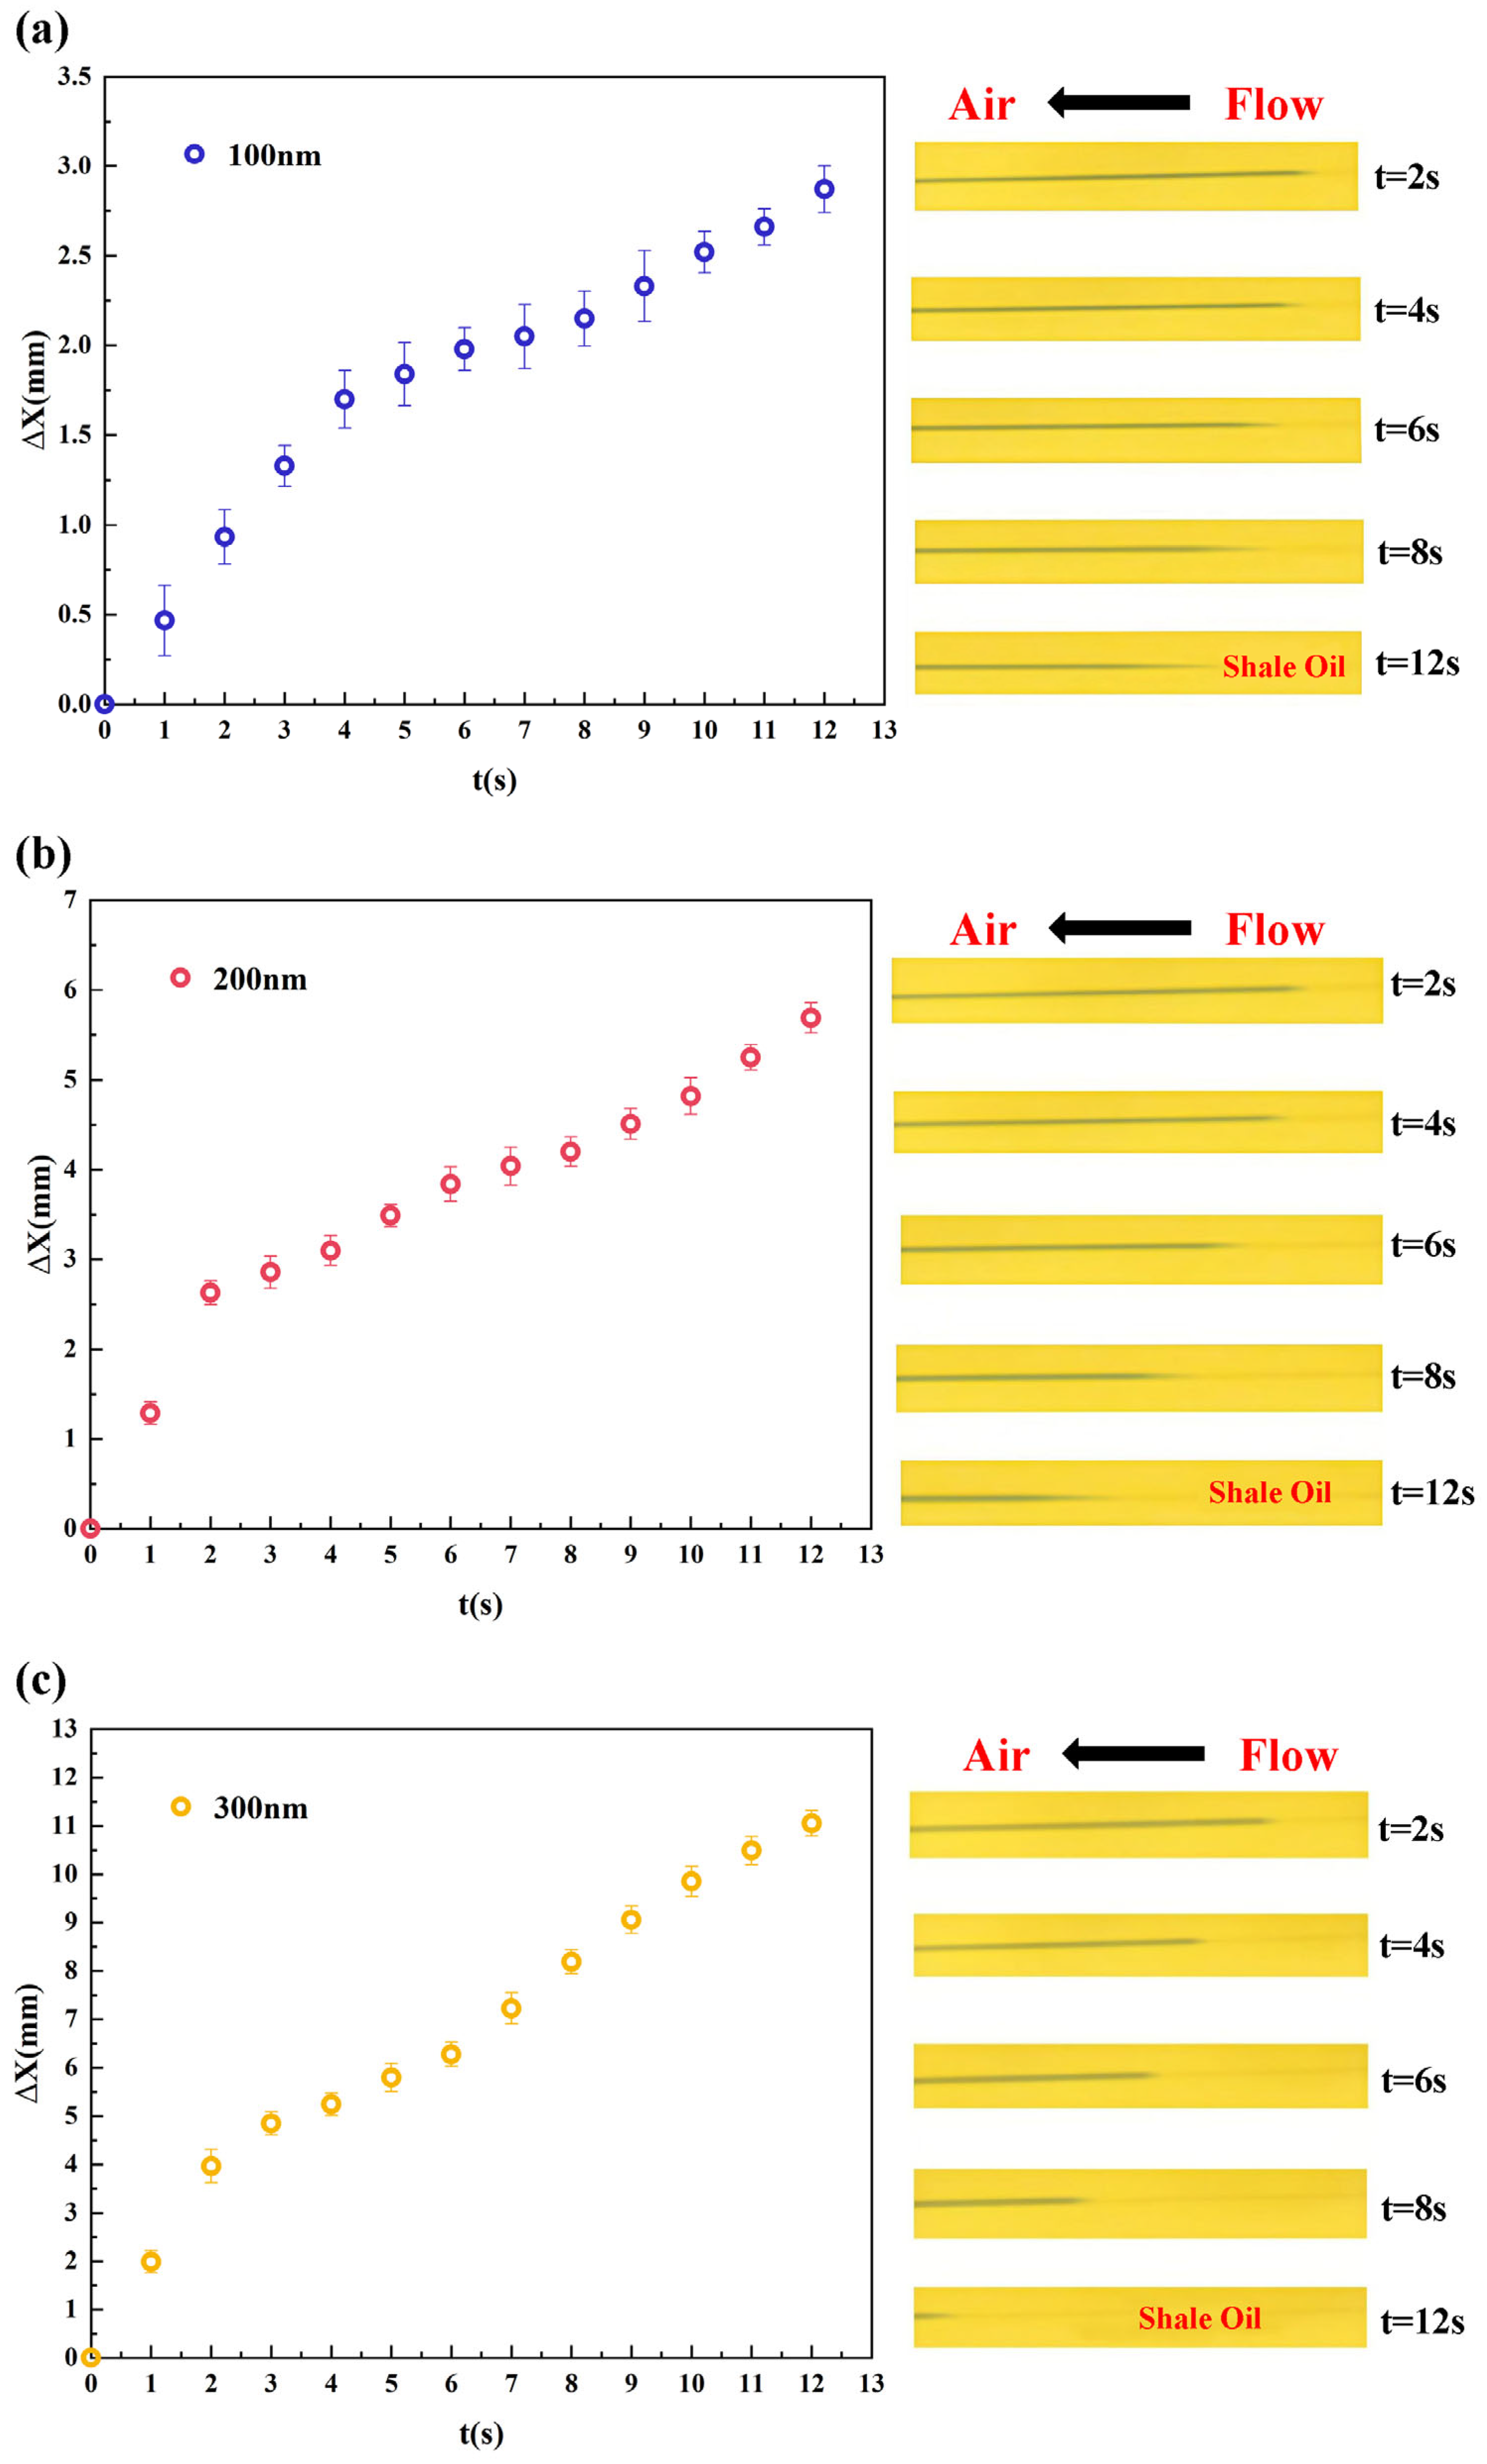
Under experimental conditions of 25 °C and an injection pressure of 1 MPa, crude oil was injected into nanopores with depths of 100, 200, and 300 nm. The flow process was recorded in real time using a microscope combined with the Image View software, allowing for the measurement of shale oil displacement over time. According to the experimental data and microscopic images (
Figure 4a–c), after 12 s the displacement distance of shale oil in 100, 200, and 300 nm pores was 2.88, 5.67, and 11.01 mm, respectively. These results clearly demonstrate that as the pore size decreases, the flow distance within a fixed time interval is significantly shortened, accompanied by a marked reduction in flow velocity.
In 300 nm channels, the relationship between time and displacement is nearly linear, reflecting a quasi-steady flow similar to conventional Darcy behavior. In contrast, in 100 nm channels, the displacement curve is clearly nonlinear, indicating significant deviations from Darcy flow. This behavior demonstrates that as pore size decreases, interactions between the fluid and solid surfaces increasingly dominate flow behavior. Confinement effects and interfacial adsorption resistances become more pronounced, raising the overall flow resistance and reducing fluid mobility. Consequently, the applicability of macroscopic Darcy’s law diminishes in smaller nanopores, while nanoscale effects exert greater control over flow dynamics.
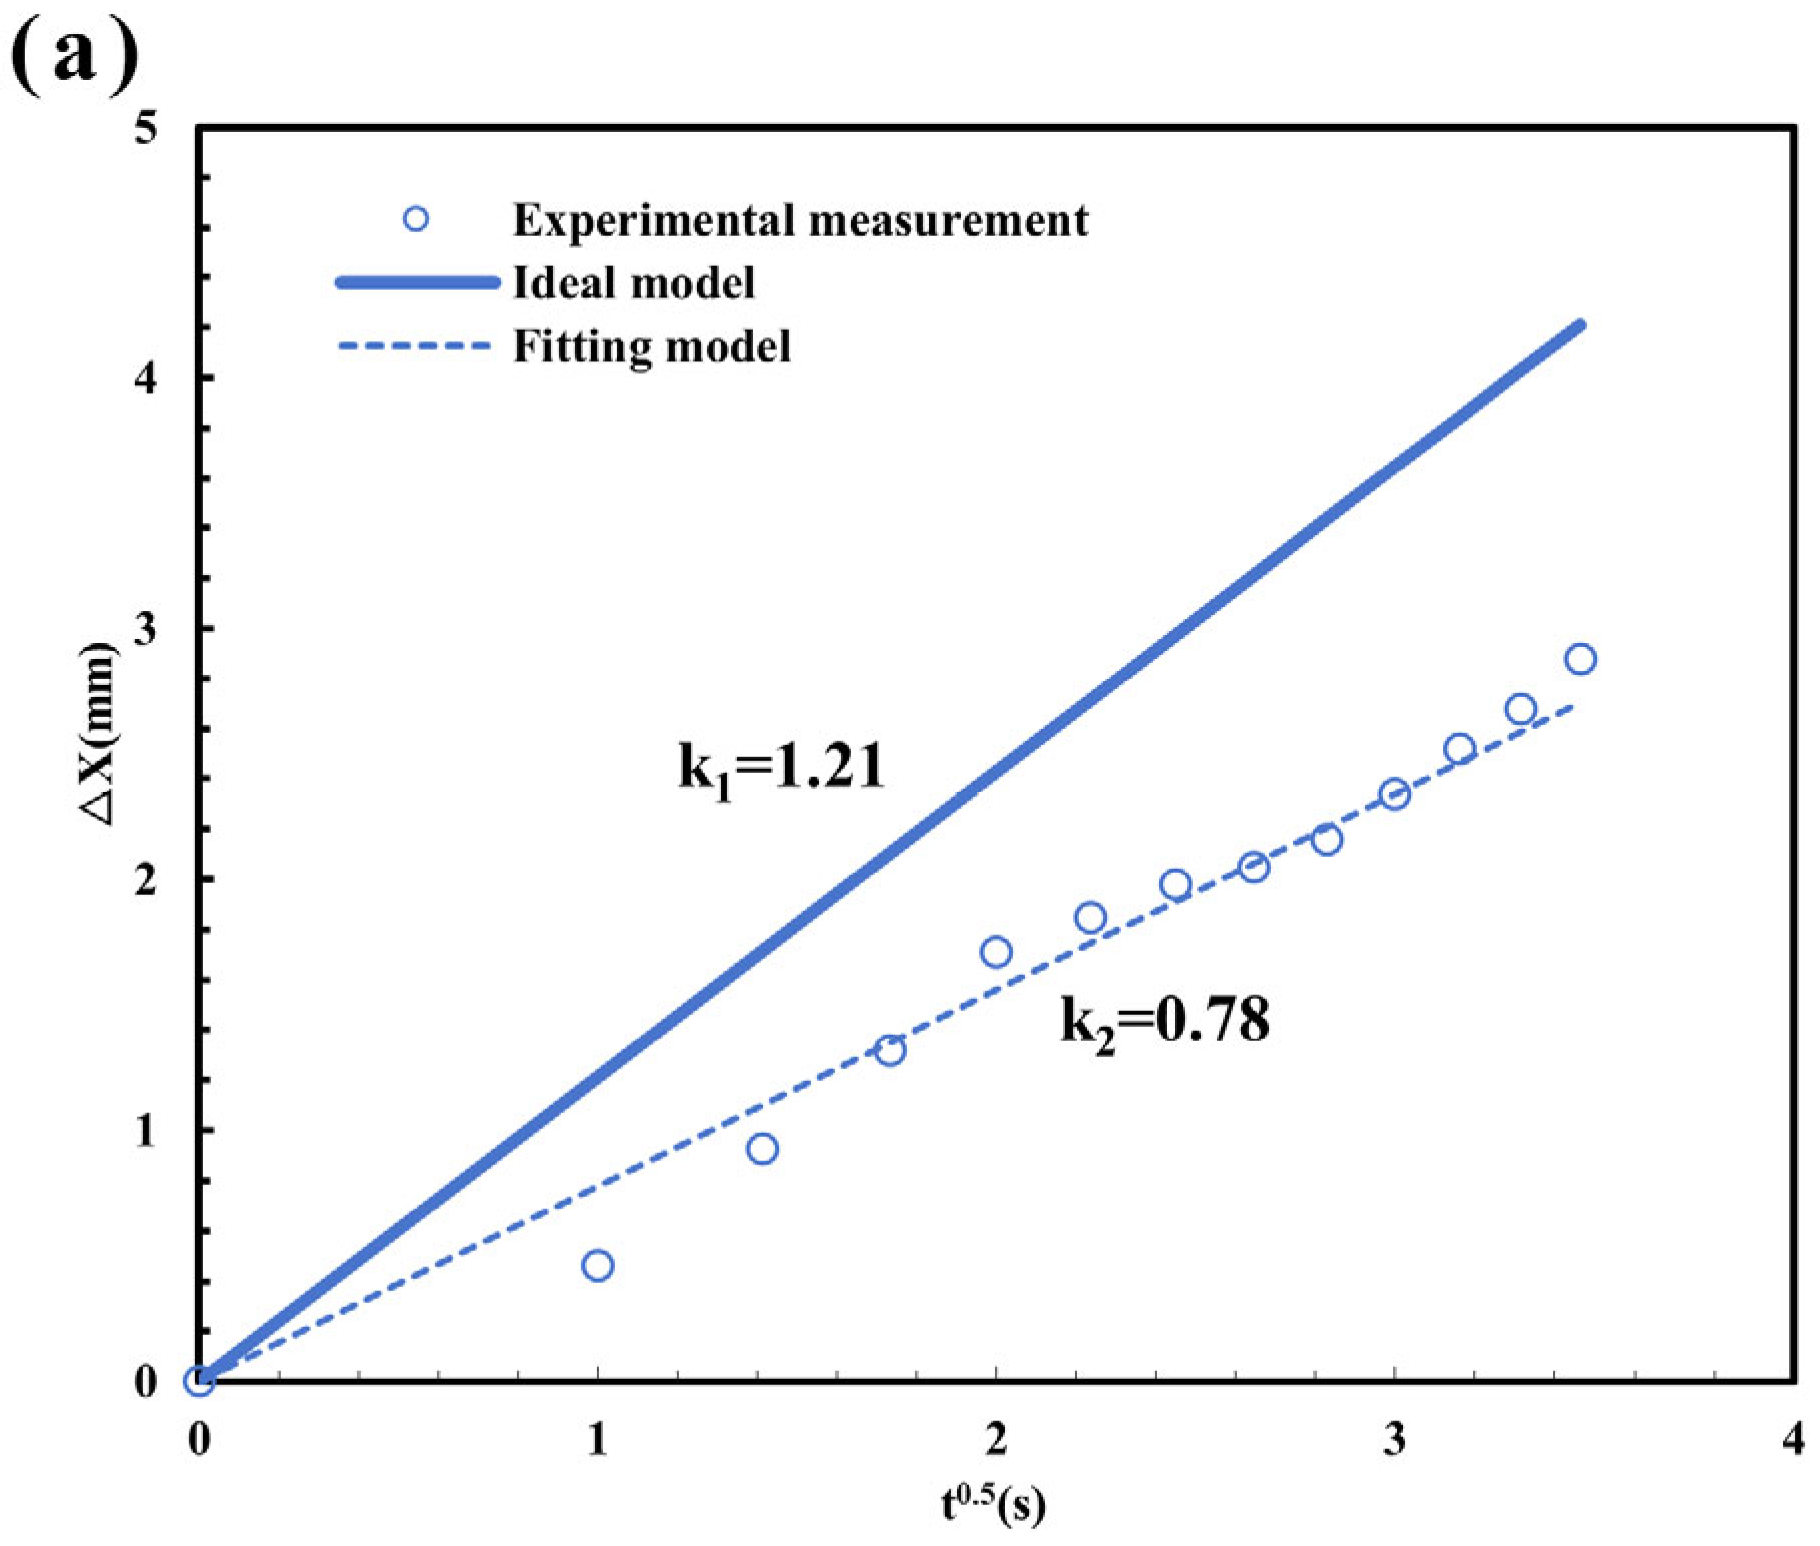
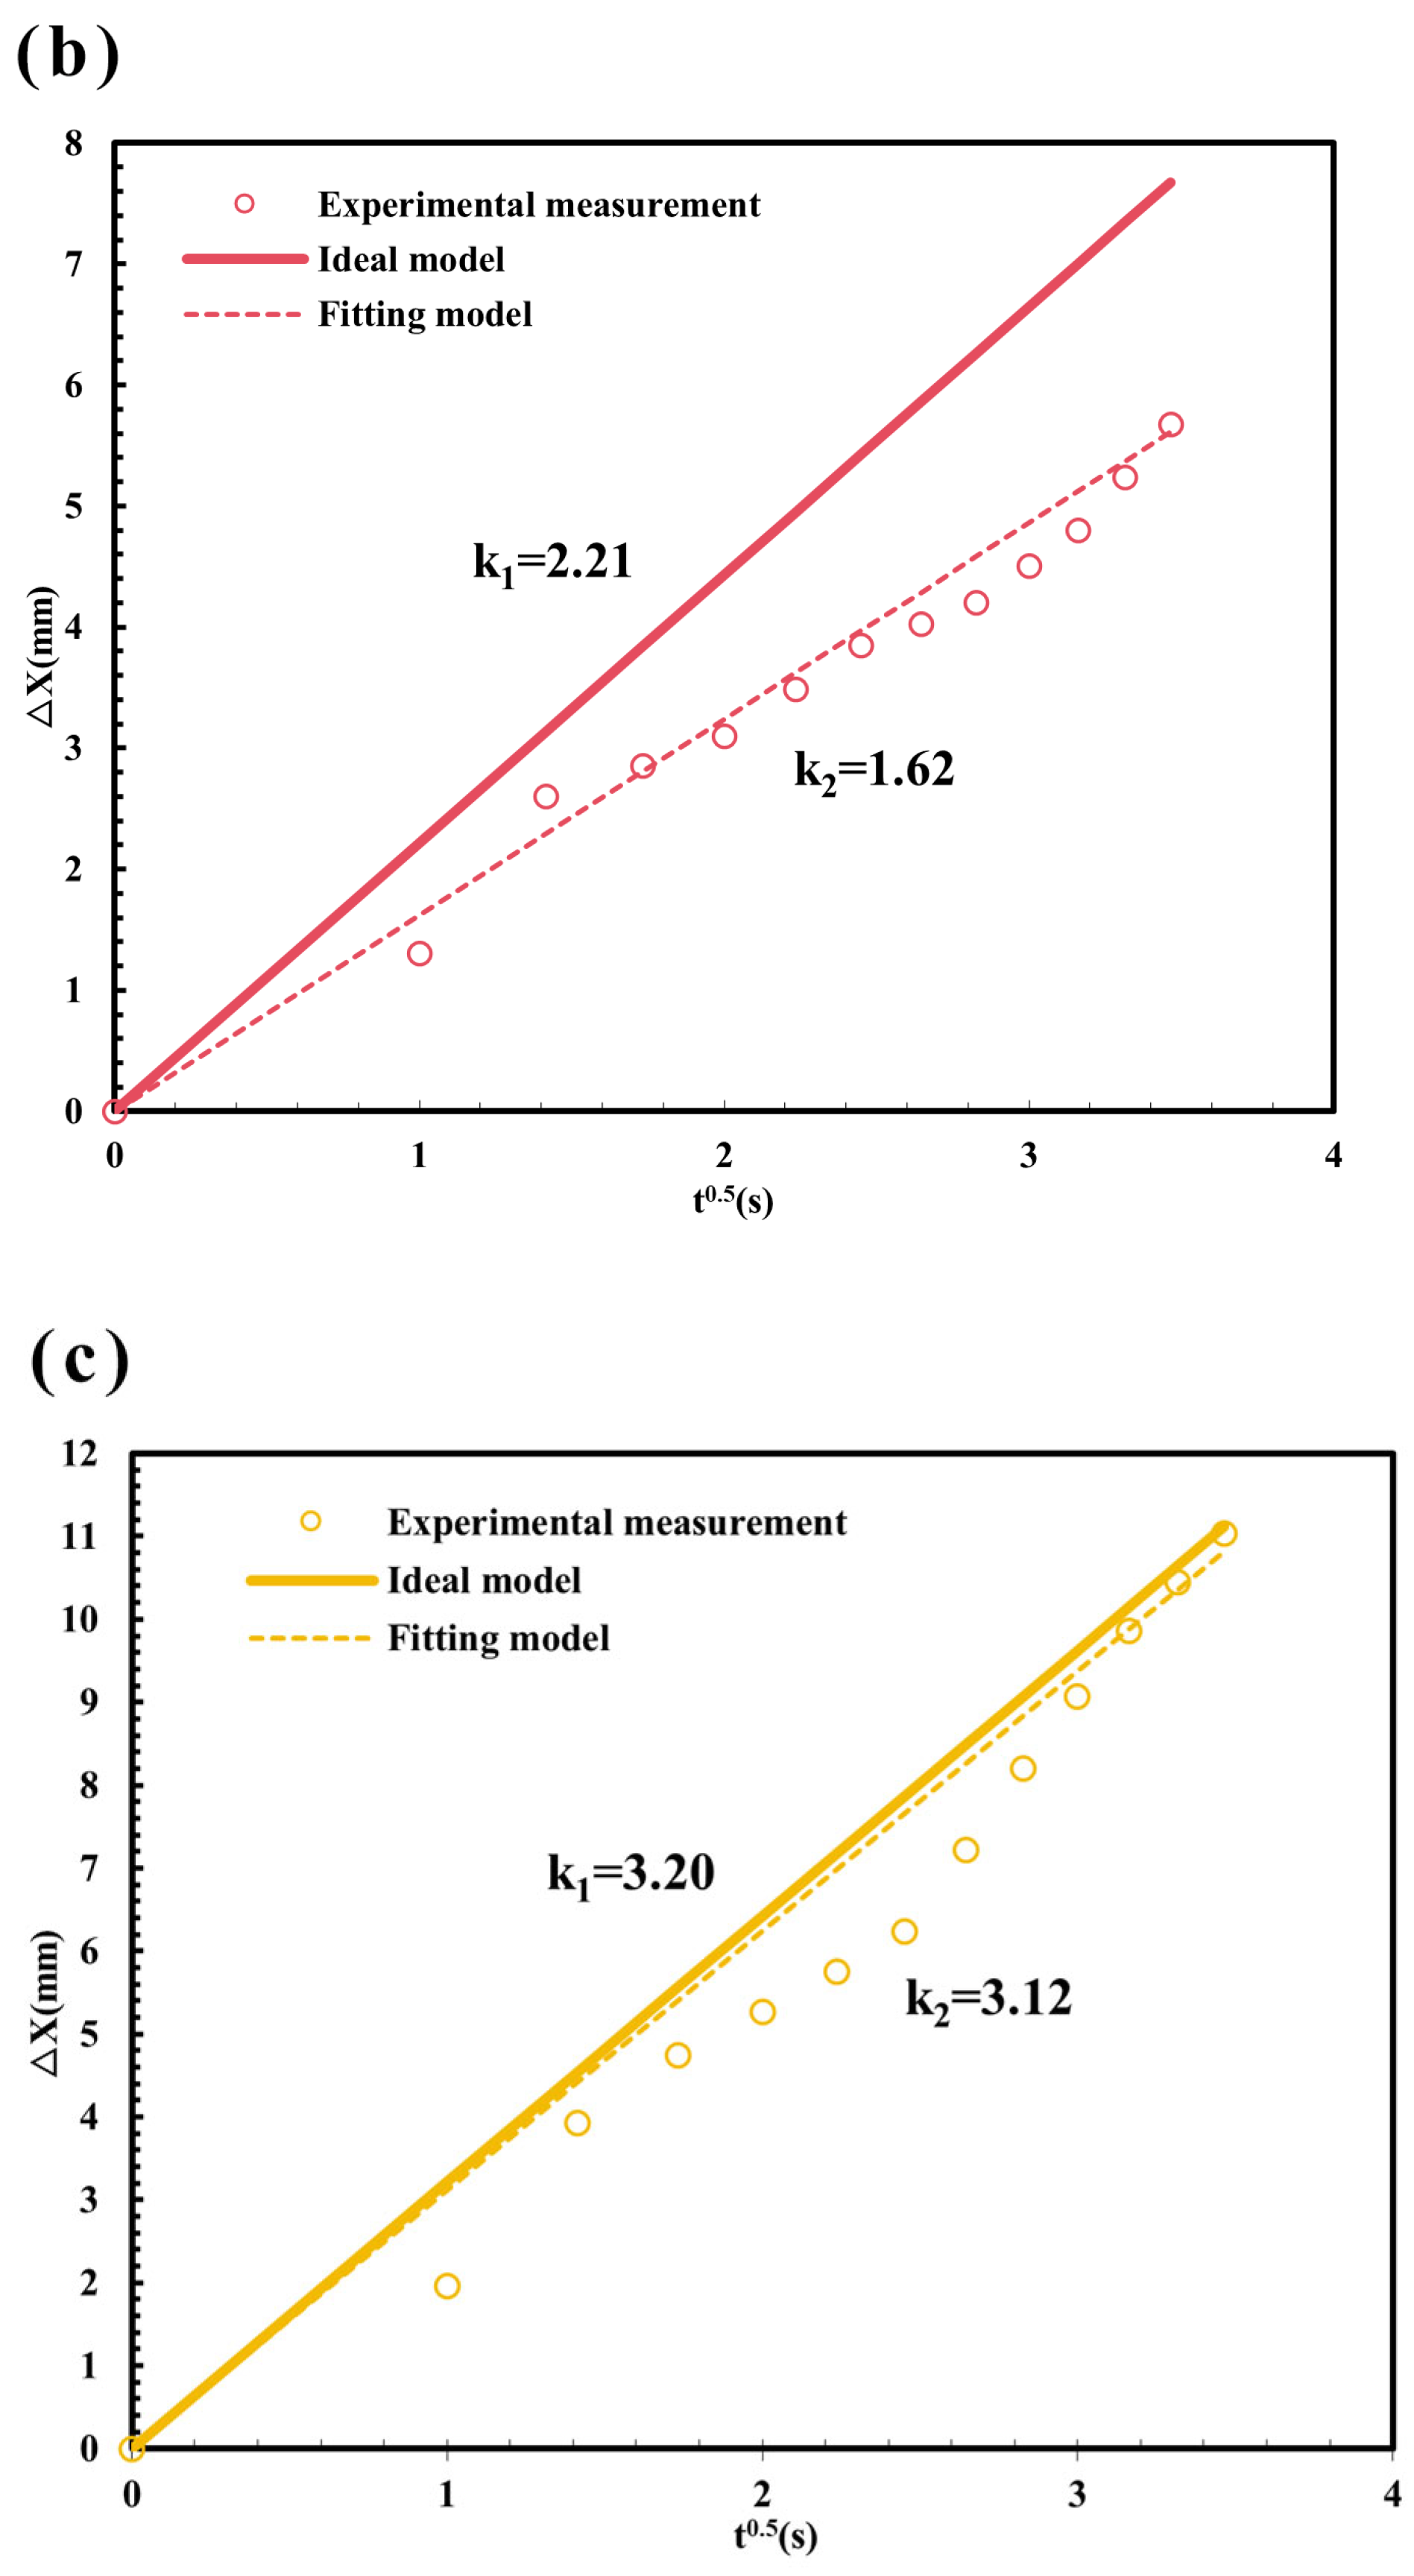
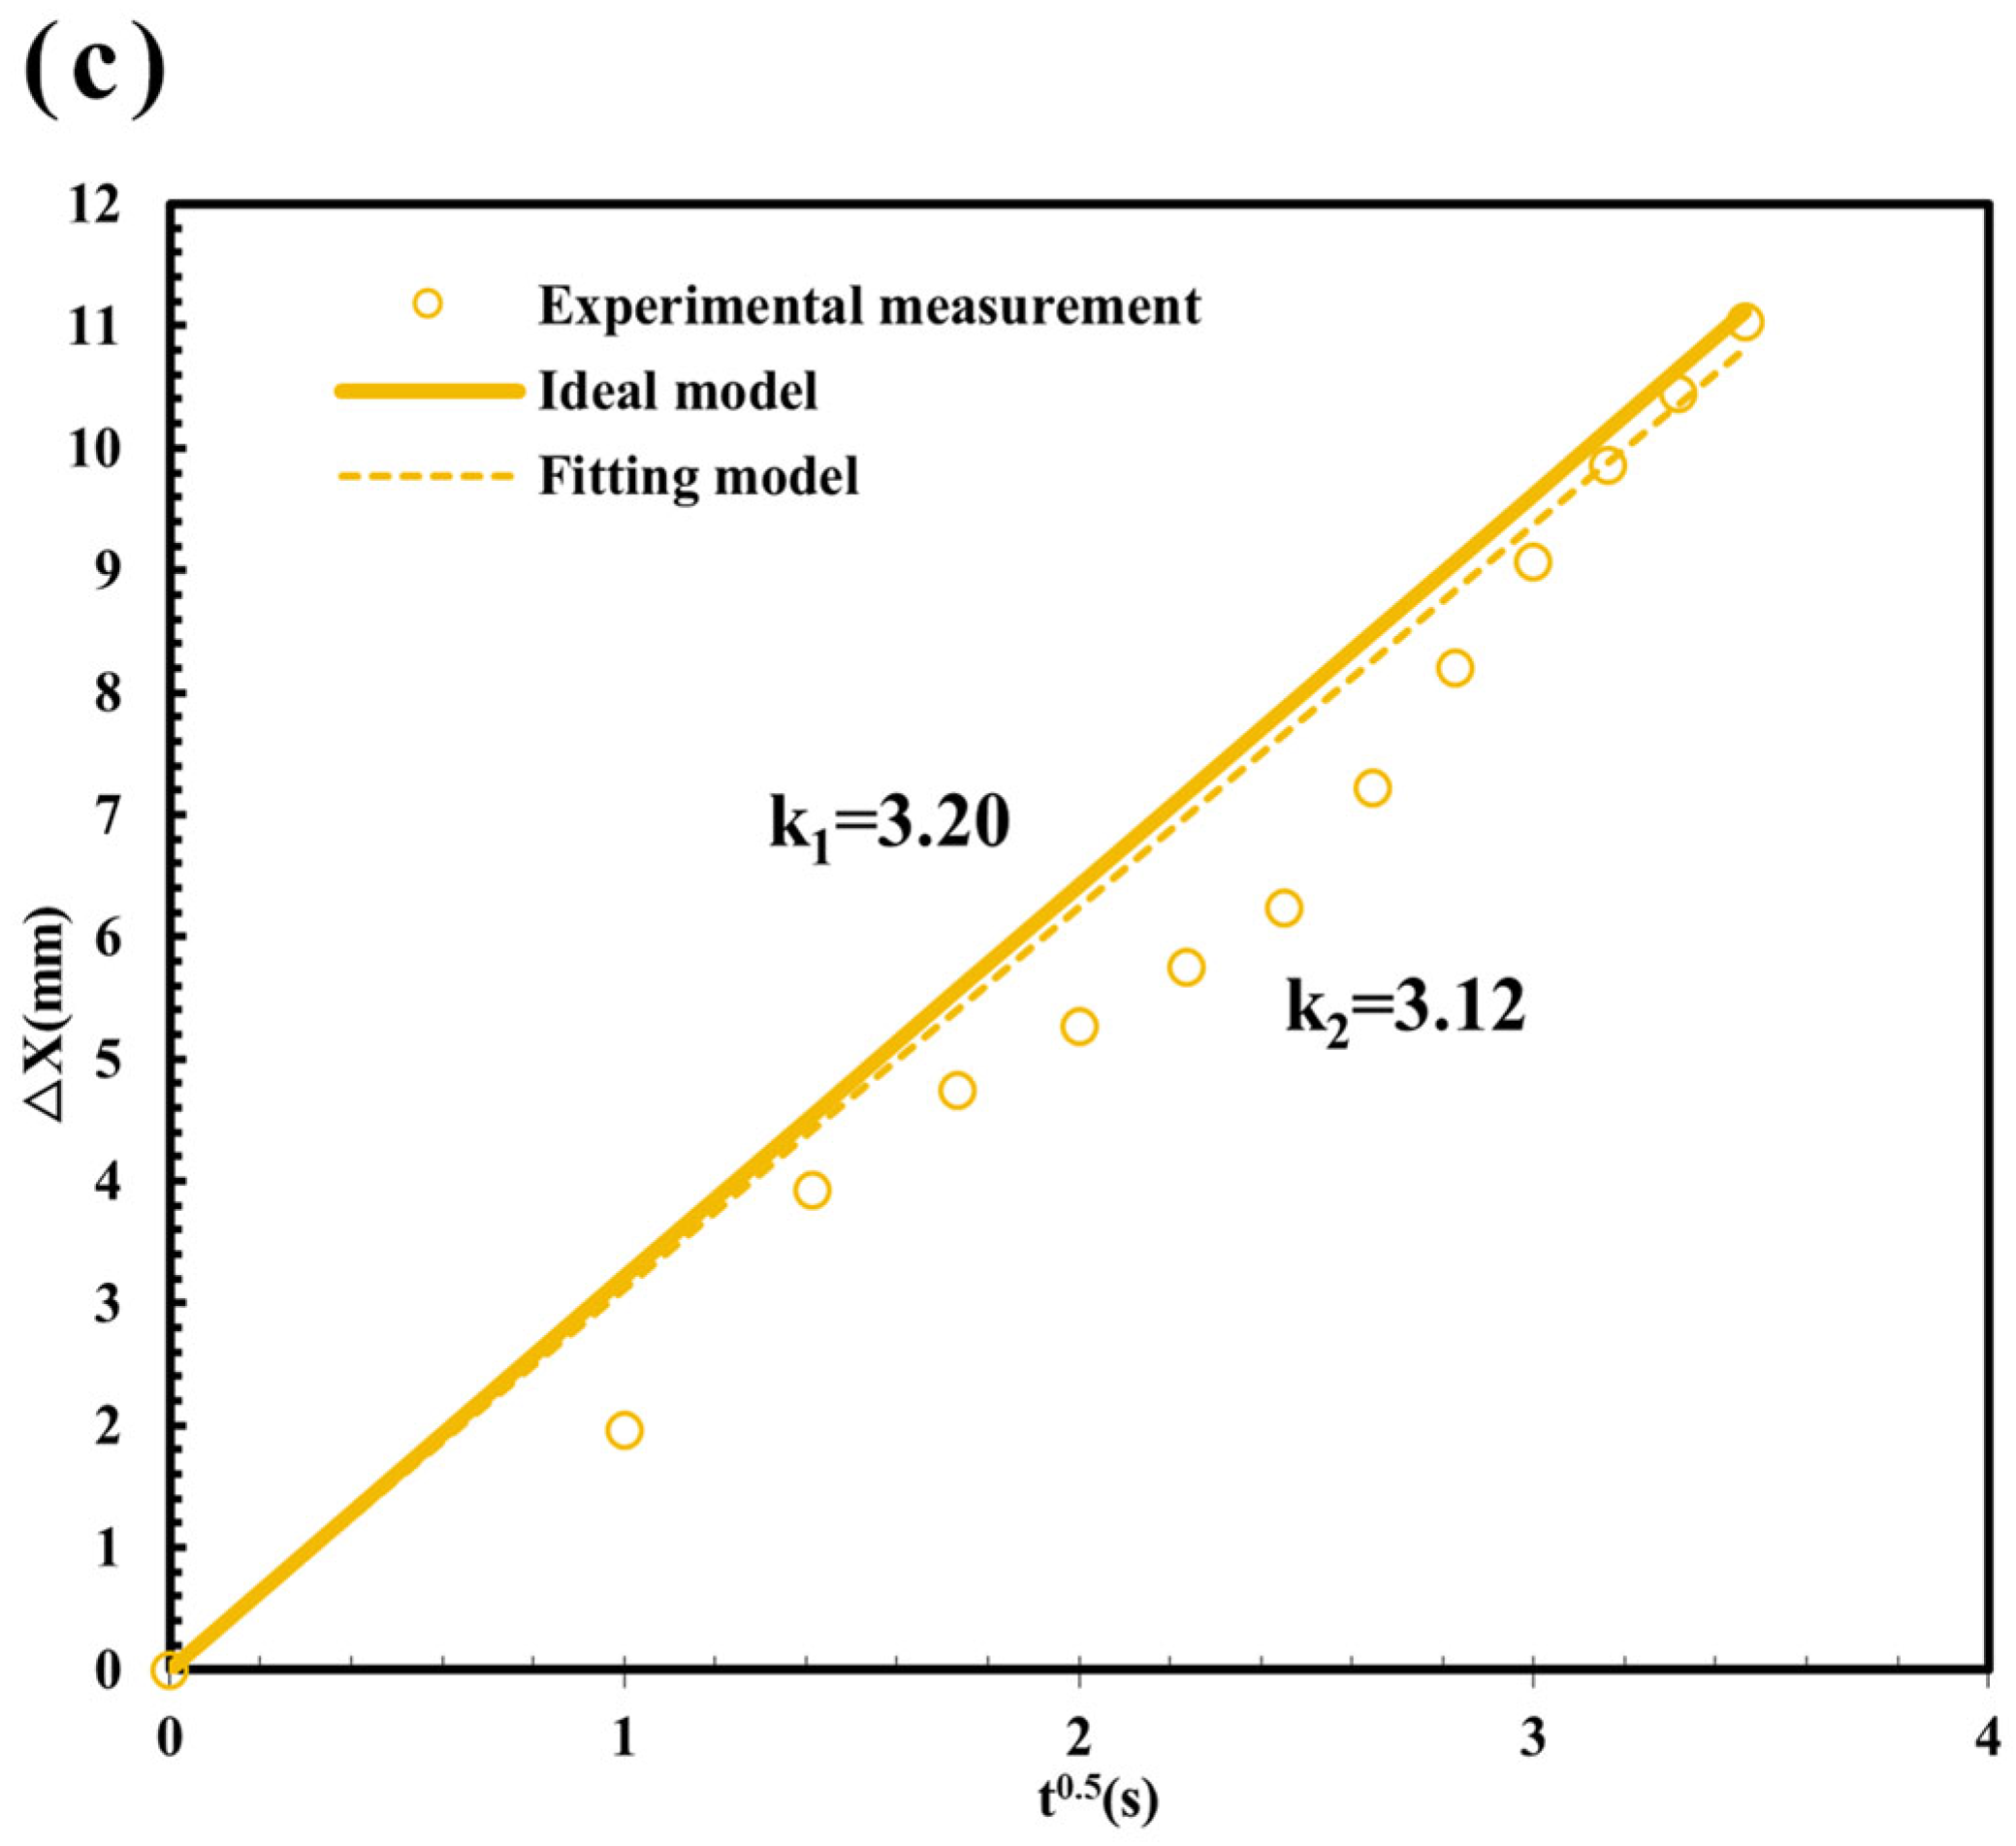
Using the plate-channel equation derived from the theoretical framework, the shale oil flow behavior under different pore sizes was predicted and fitted. A comparison between the theoretical prediction and experimental fitting curves for pore depths of 100 nm, 200 nm, and 300 nm is shown in
Figure 5a–c. As shown in
Figure 5a, under identical driving conditions, the experimentally measured displacement distance of shale oil is significantly lower than the value predicted by the ideal model. However, after introducing an equivalent resistance coefficient to account for nanoscale confinement, the fitted model shows excellent agreement with the experimental data. The fitting coefficient k1(ideal model) = 0.78 is much lower than the ideal model coefficient k2(experimental fitting) = 1.21, indicating that the flow resistance in the 100 nm channel is considerably higher and the mobility of shale oil is markedly reduced. As the pore size increases, the deviation between the fitted and predicted curves gradually decreases. For the 200 nm channel, k1 and k2 are 2.21 and 1.62, respectively, while for the 300 nm channel, they increase to 3.20 and 3.12, becoming nearly identical. This trend indicates that the influence of nanoconfinement weakens with increasing pore size, and the flow behavior gradually approaches classical Darcy flow. The observed difference between the two models primarily originates from the confinement effect that governs fluid transport in nanoporous systems. As the pore size decreases, the interactions between fluid molecules and the solid surface become increasingly significant. A stable adsorbed molecular layer forms adjacent to the channel walls, effectively narrowing the central flow region and enhancing the effective viscosity of the fluid. Consequently, the flow resistance rises sharply, leading to a lower flow rate and a more pronounced deviation from theoretical predictions.
Moreover, the chemical composition of shale oil further amplifies this phenomenon. The presence of polar components, such as asphaltenes and resins, enhances adsorption on solid surfaces, increasing adhesive forces and interfacial resistance. Together, these effects suppress fluid mobility and cause significant deviation from ideal flow conditions within nanoscale pores. Quantitatively, the equivalent resistance coefficients for 100 nm, 200 nm, and 300 nm channels are 2.43, 1.87, and 1.06, respectively. The notable decrease in resistance with increasing pore size underscores the high sensitivity of flow behavior to the confinement scale. When the pore depth reaches 300 nm, the equivalent viscosity nearly matches the ideal value, indicating that the effects of confinement and adsorption become negligible at this size. Experimental data, supported by the fitted model, confirm that nanoscale confinement plays a significant role in influencing the flow behavior of shale oil in small pores. As a result, as pore size decreases, the effective resistance coefficient rises sharply, causing the fluid to deviate notably from Darcy flow.
3.2. Effects of Temperature
The flow behavior of shale oil in 200 nm nanochannels was investigated at temperatures of 25 °C, 50 °C, and 80 °C under a constant injection pressure of 1 MPa.
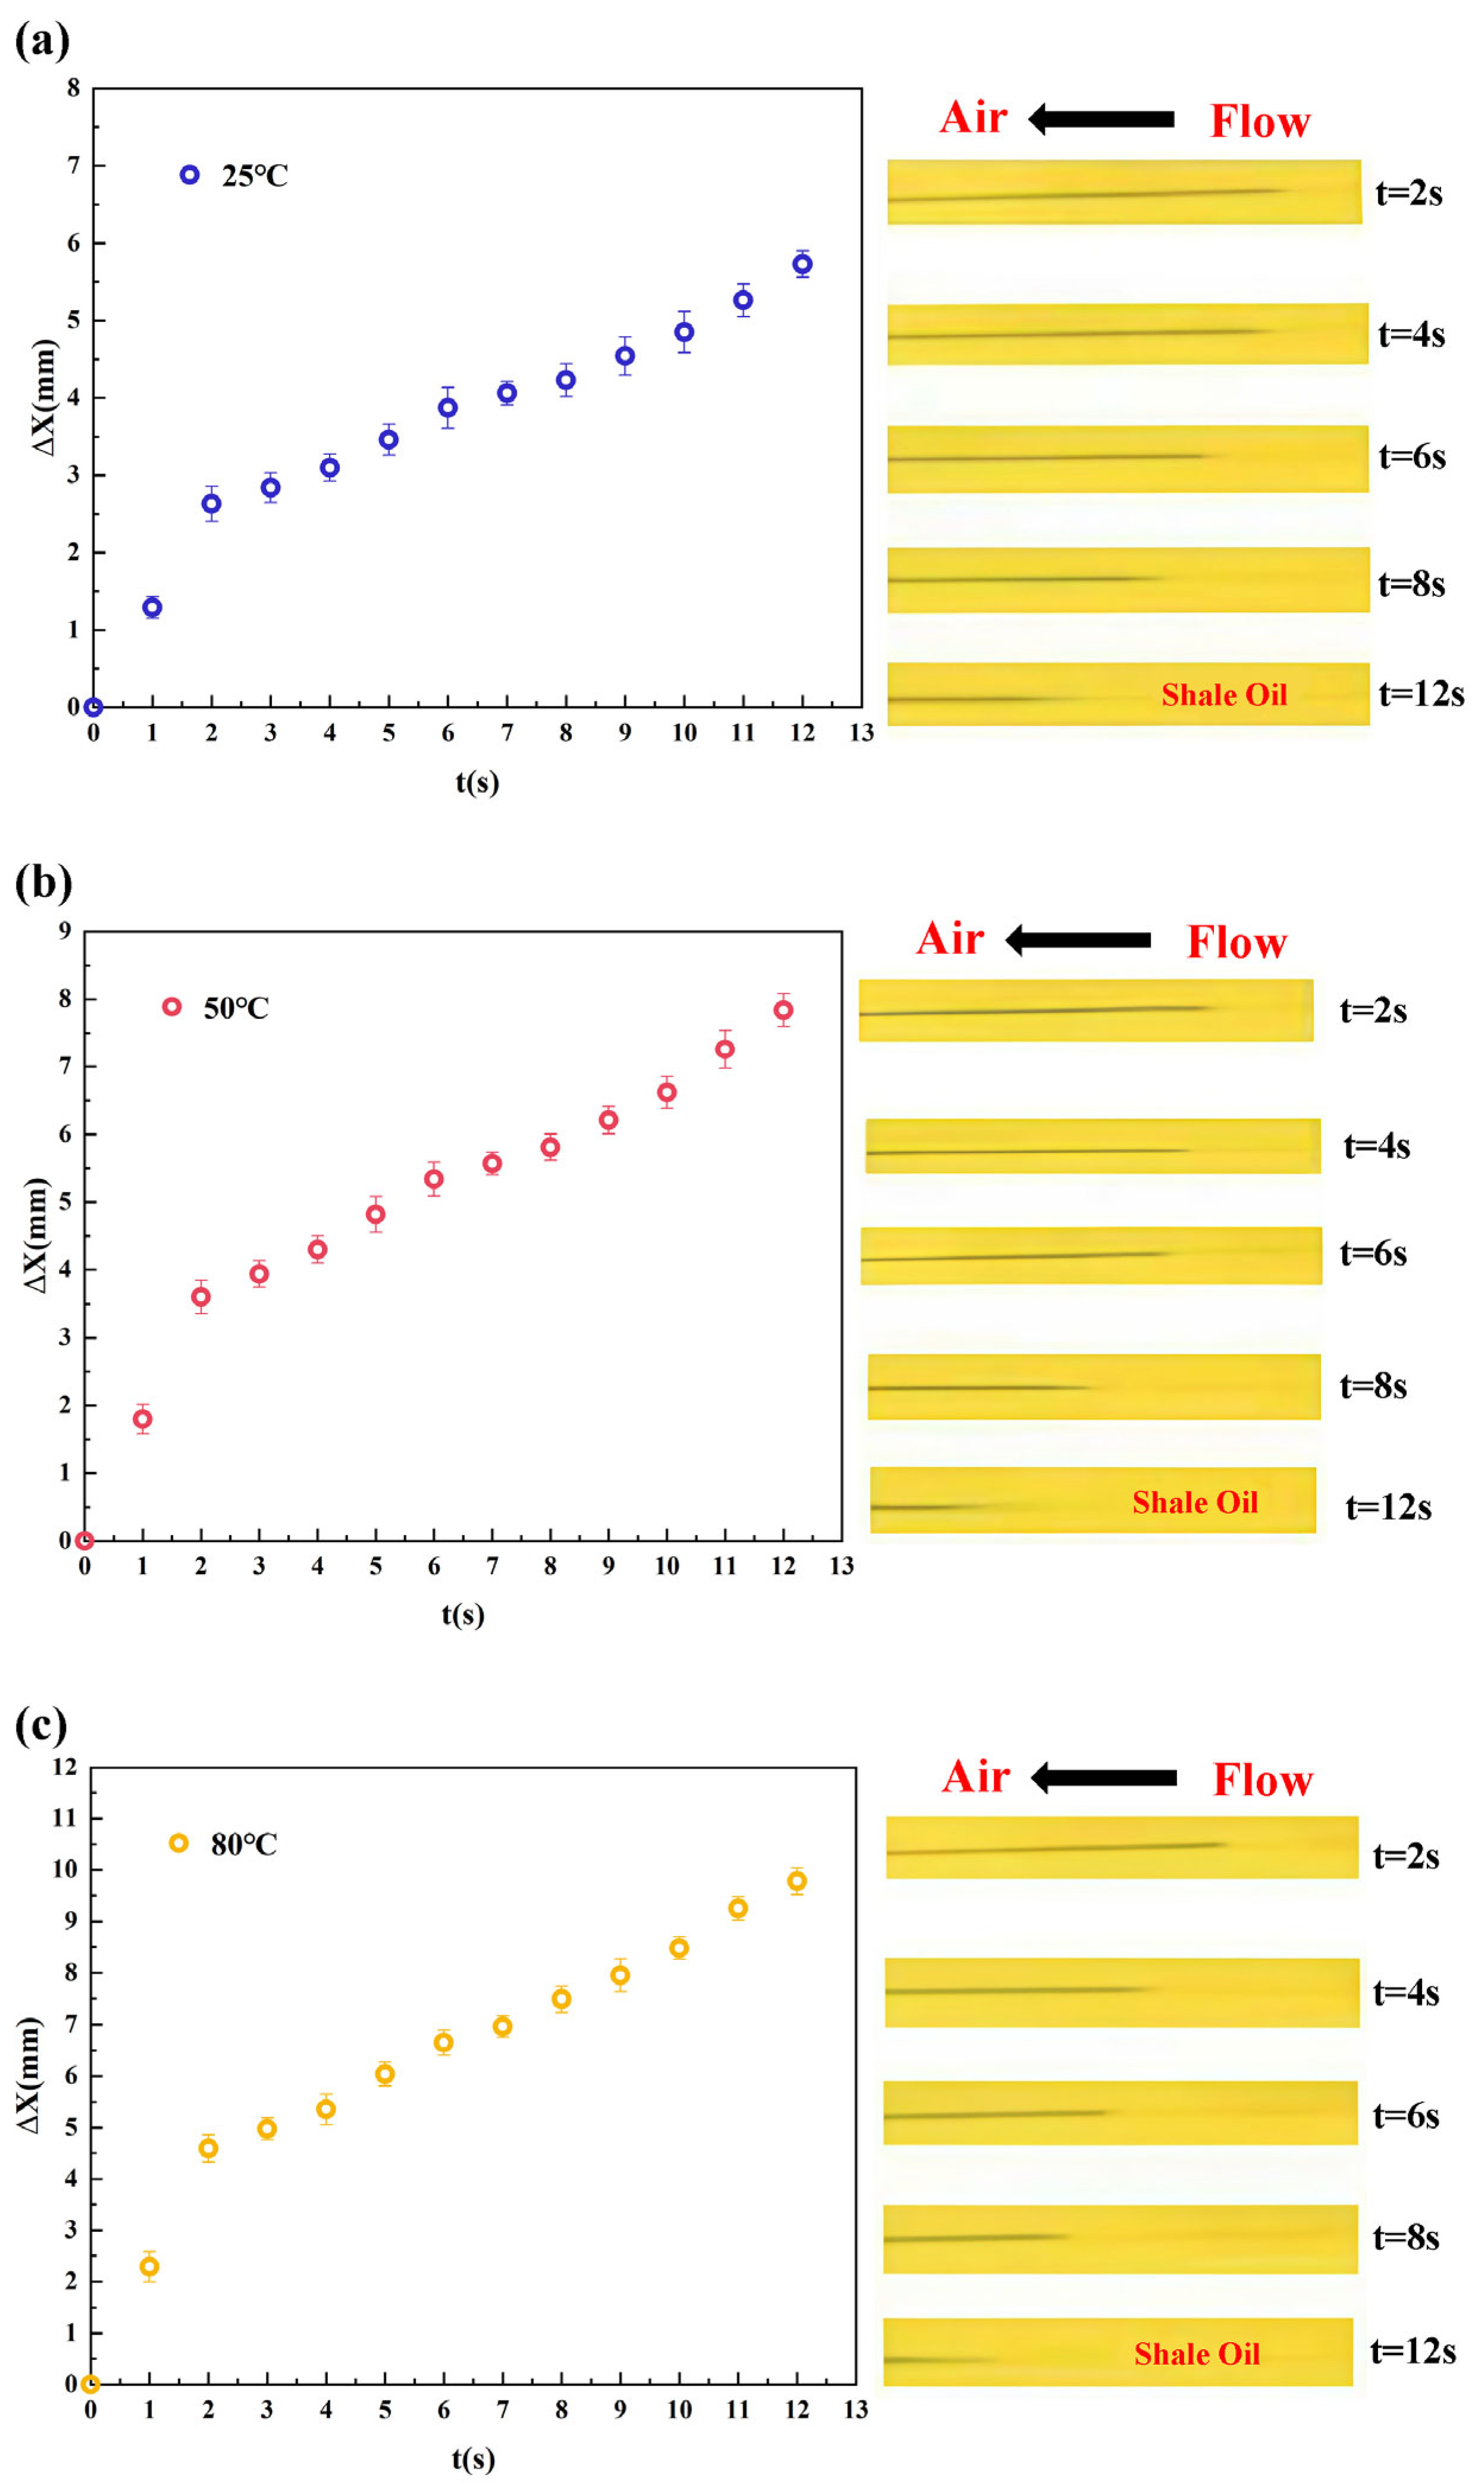
The flow process was monitored in real time using a microscope in combination with the Image View system to record displacement data over time. As shown in
Figure 6a–c, the displacement distances of shale oil after 12 s were 5.67 mm, 7.85 mm, and 9.77 mm at 25 °C, 50 °C, and 80 °C, respectively. All three displacement curves exhibit a similar nonlinear trend, indicating that shale oil flow in 200 nm nanochannels remains influenced by confinement effects and deviates from classical Darcy flow. As the temperature increases, the displacement within the same time interval rises significantly, demonstrating a clear enhancement in flow capacity.
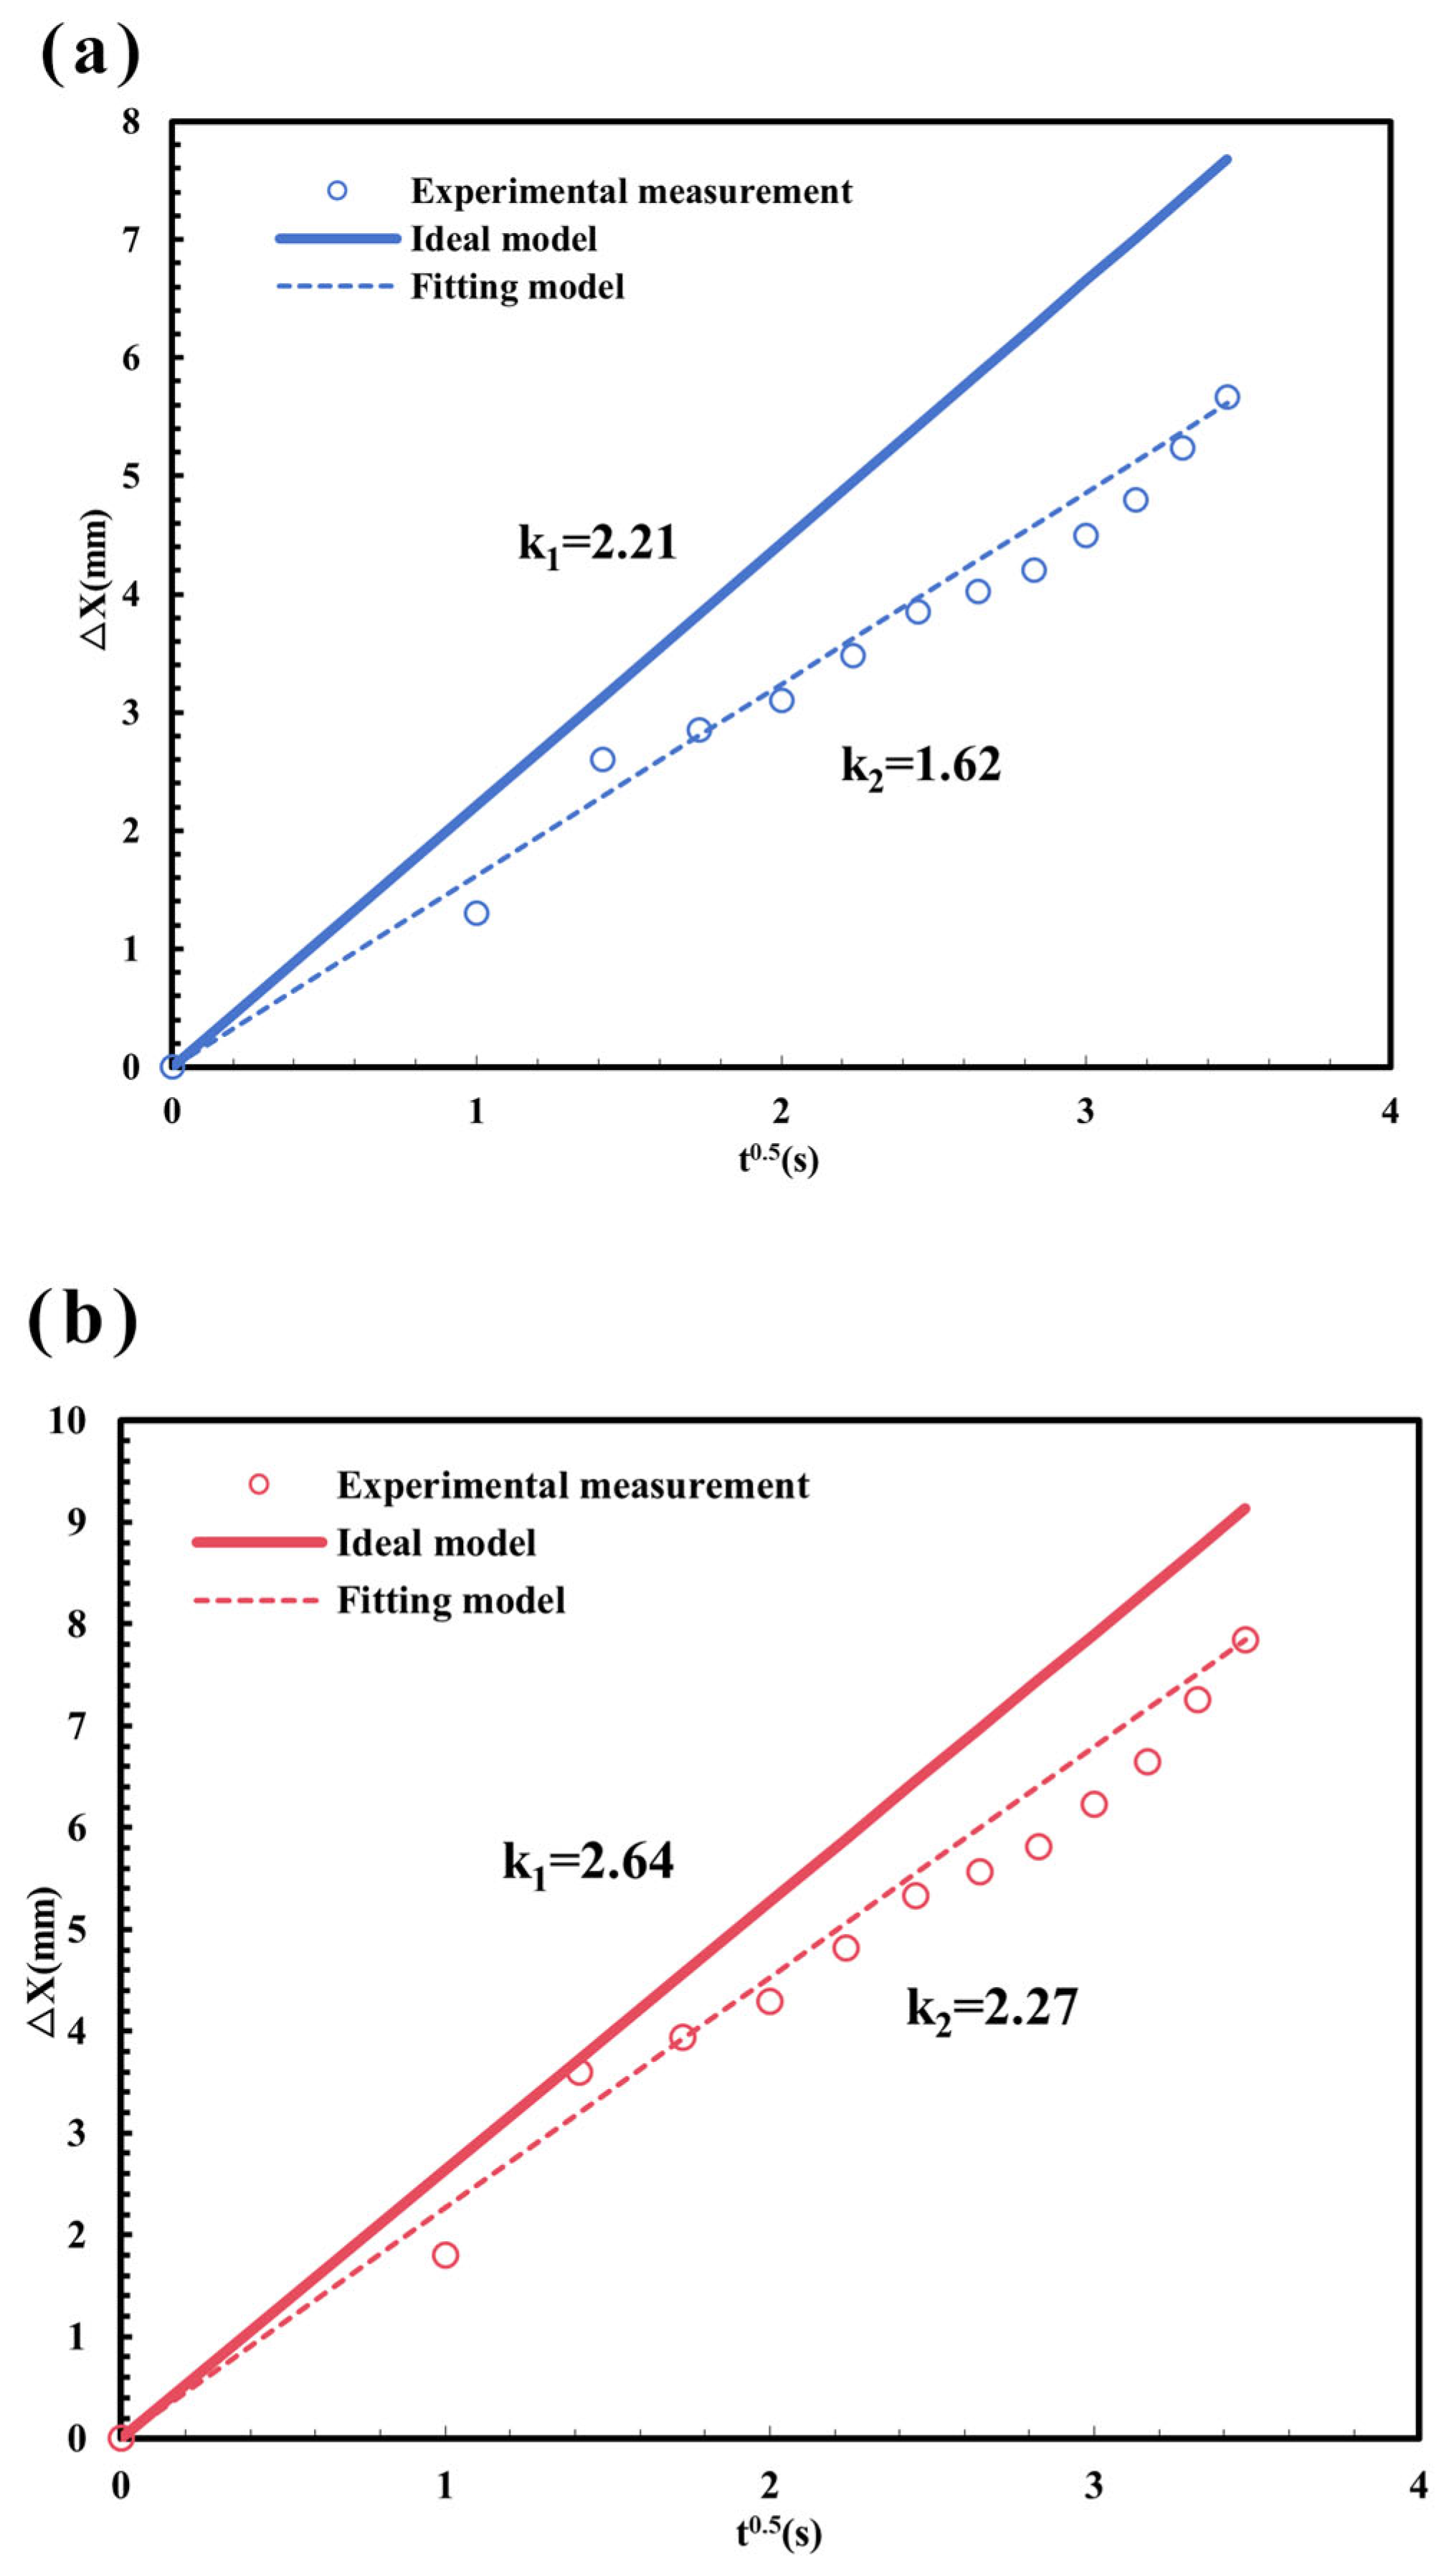
To quantitatively analyze this enhancement, the shale oil flow behavior was further predicted and fitted using the Plate Channel equation (
Figure 7).
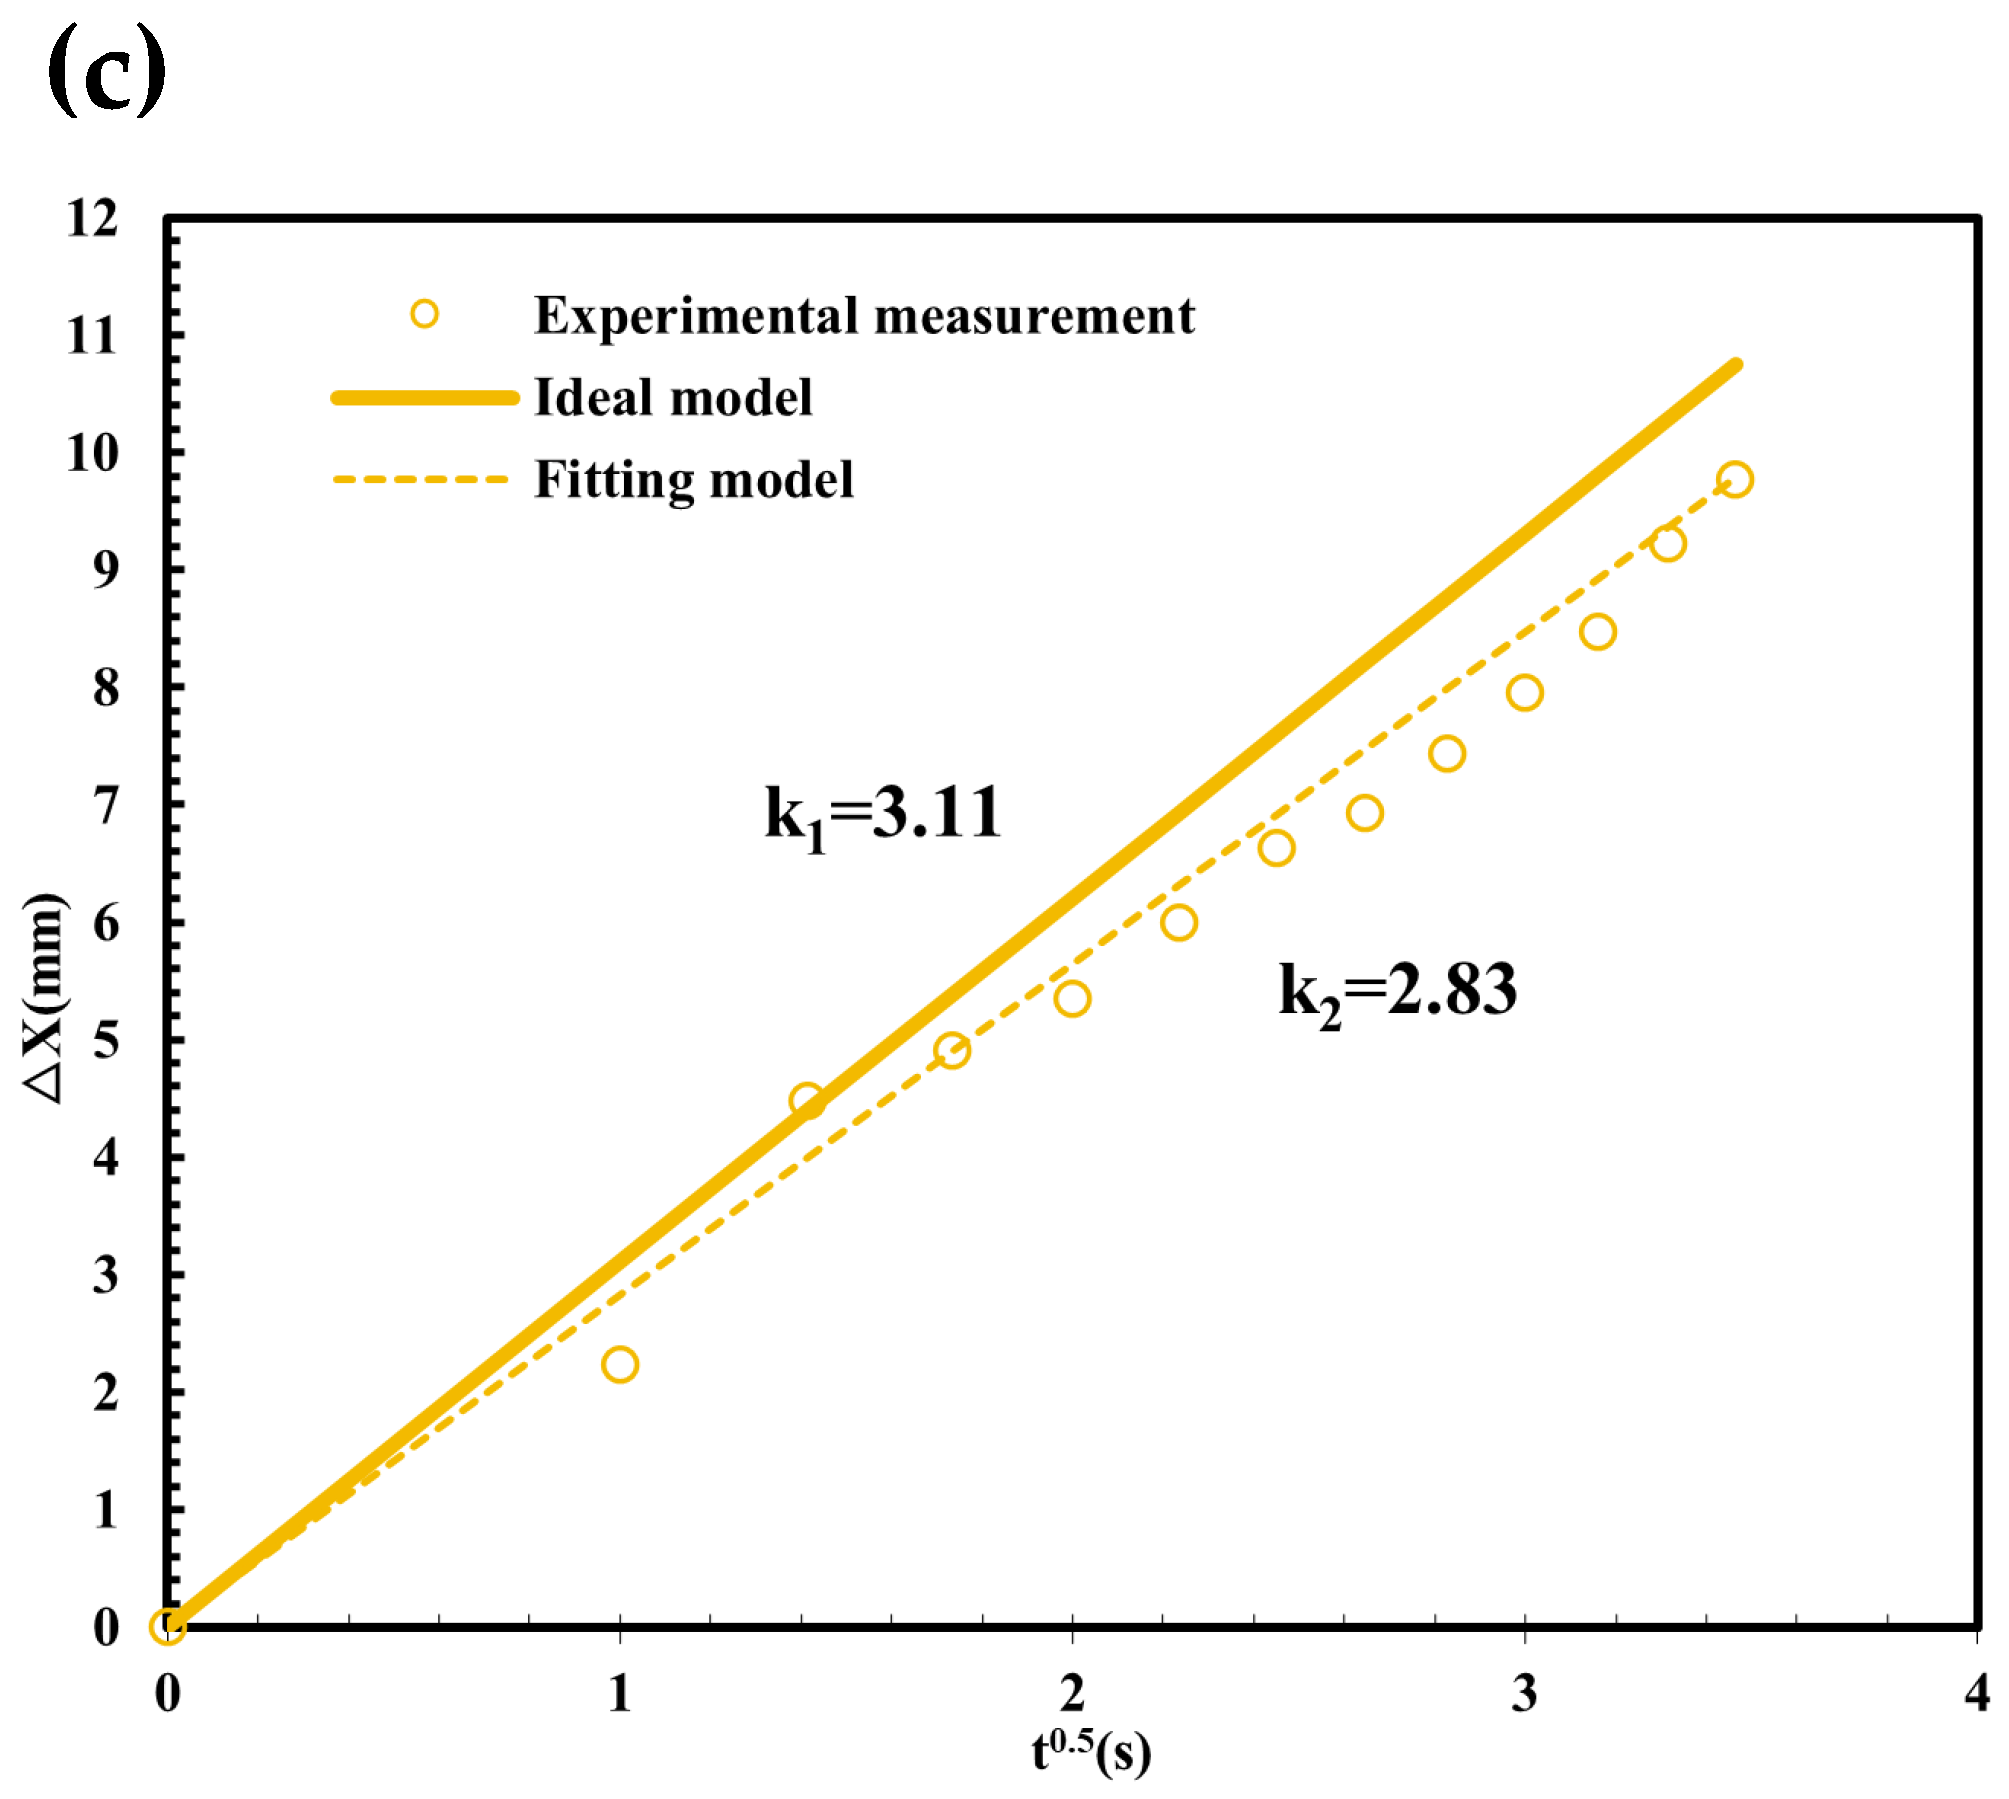
Figure 7a–c show the comparison between the ideal prediction model and the fitted model at 25 °C, 50 °C, and 80 °C, respectively. As shown, the ideal model coefficients (k
1) are 2.21, 2.64, and 3.11, while the fitted model coefficients (k
2) are 1.62, 2.27, and 2.83, respectively. Under the same injection conditions, all fitted curves lie below the ideal predictions, indicating that the actual flow encounters additional resistance due to nanoscale confinement. Moreover, the discrepancy between the ideal and fitted models gradually narrows with increasing temperature, suggesting that elevated temperatures effectively mitigate the confinement-induced resistance and improve shale oil mobility. This temperature-induced enhancement is further quantified by the equivalent resistance coefficient, which decreases from 1.87 at 25 °C, to 1.35 at 50 °C, and further to 1.20 at 80 °C. This declining trend indicates that the enhanced flow capacity is not only due to reduced oil viscosity but also due to the weakening of confinement effects at higher temperatures. Polar components in shale oil, such as asphaltenes and resins, may partially desorb or redistribute at higher temperatures, thinning the immobile adsorption layer and enlarging the effective flow channel, thus reducing the effective viscosity. This enhances the influence of temperature on the flow performance.
In conclusion, raising the temperature effectively reduces the impact of confinement on shale oil flow and significantly enhances its mobility within nanopores. However, even at 80 °C, the flow behavior still deviates from ideal Darcy flow, suggesting that temperature alone cannot completely eliminate the nanoscale confinement effect on shale oil transport.
3.3. Effects of Driving Pressure
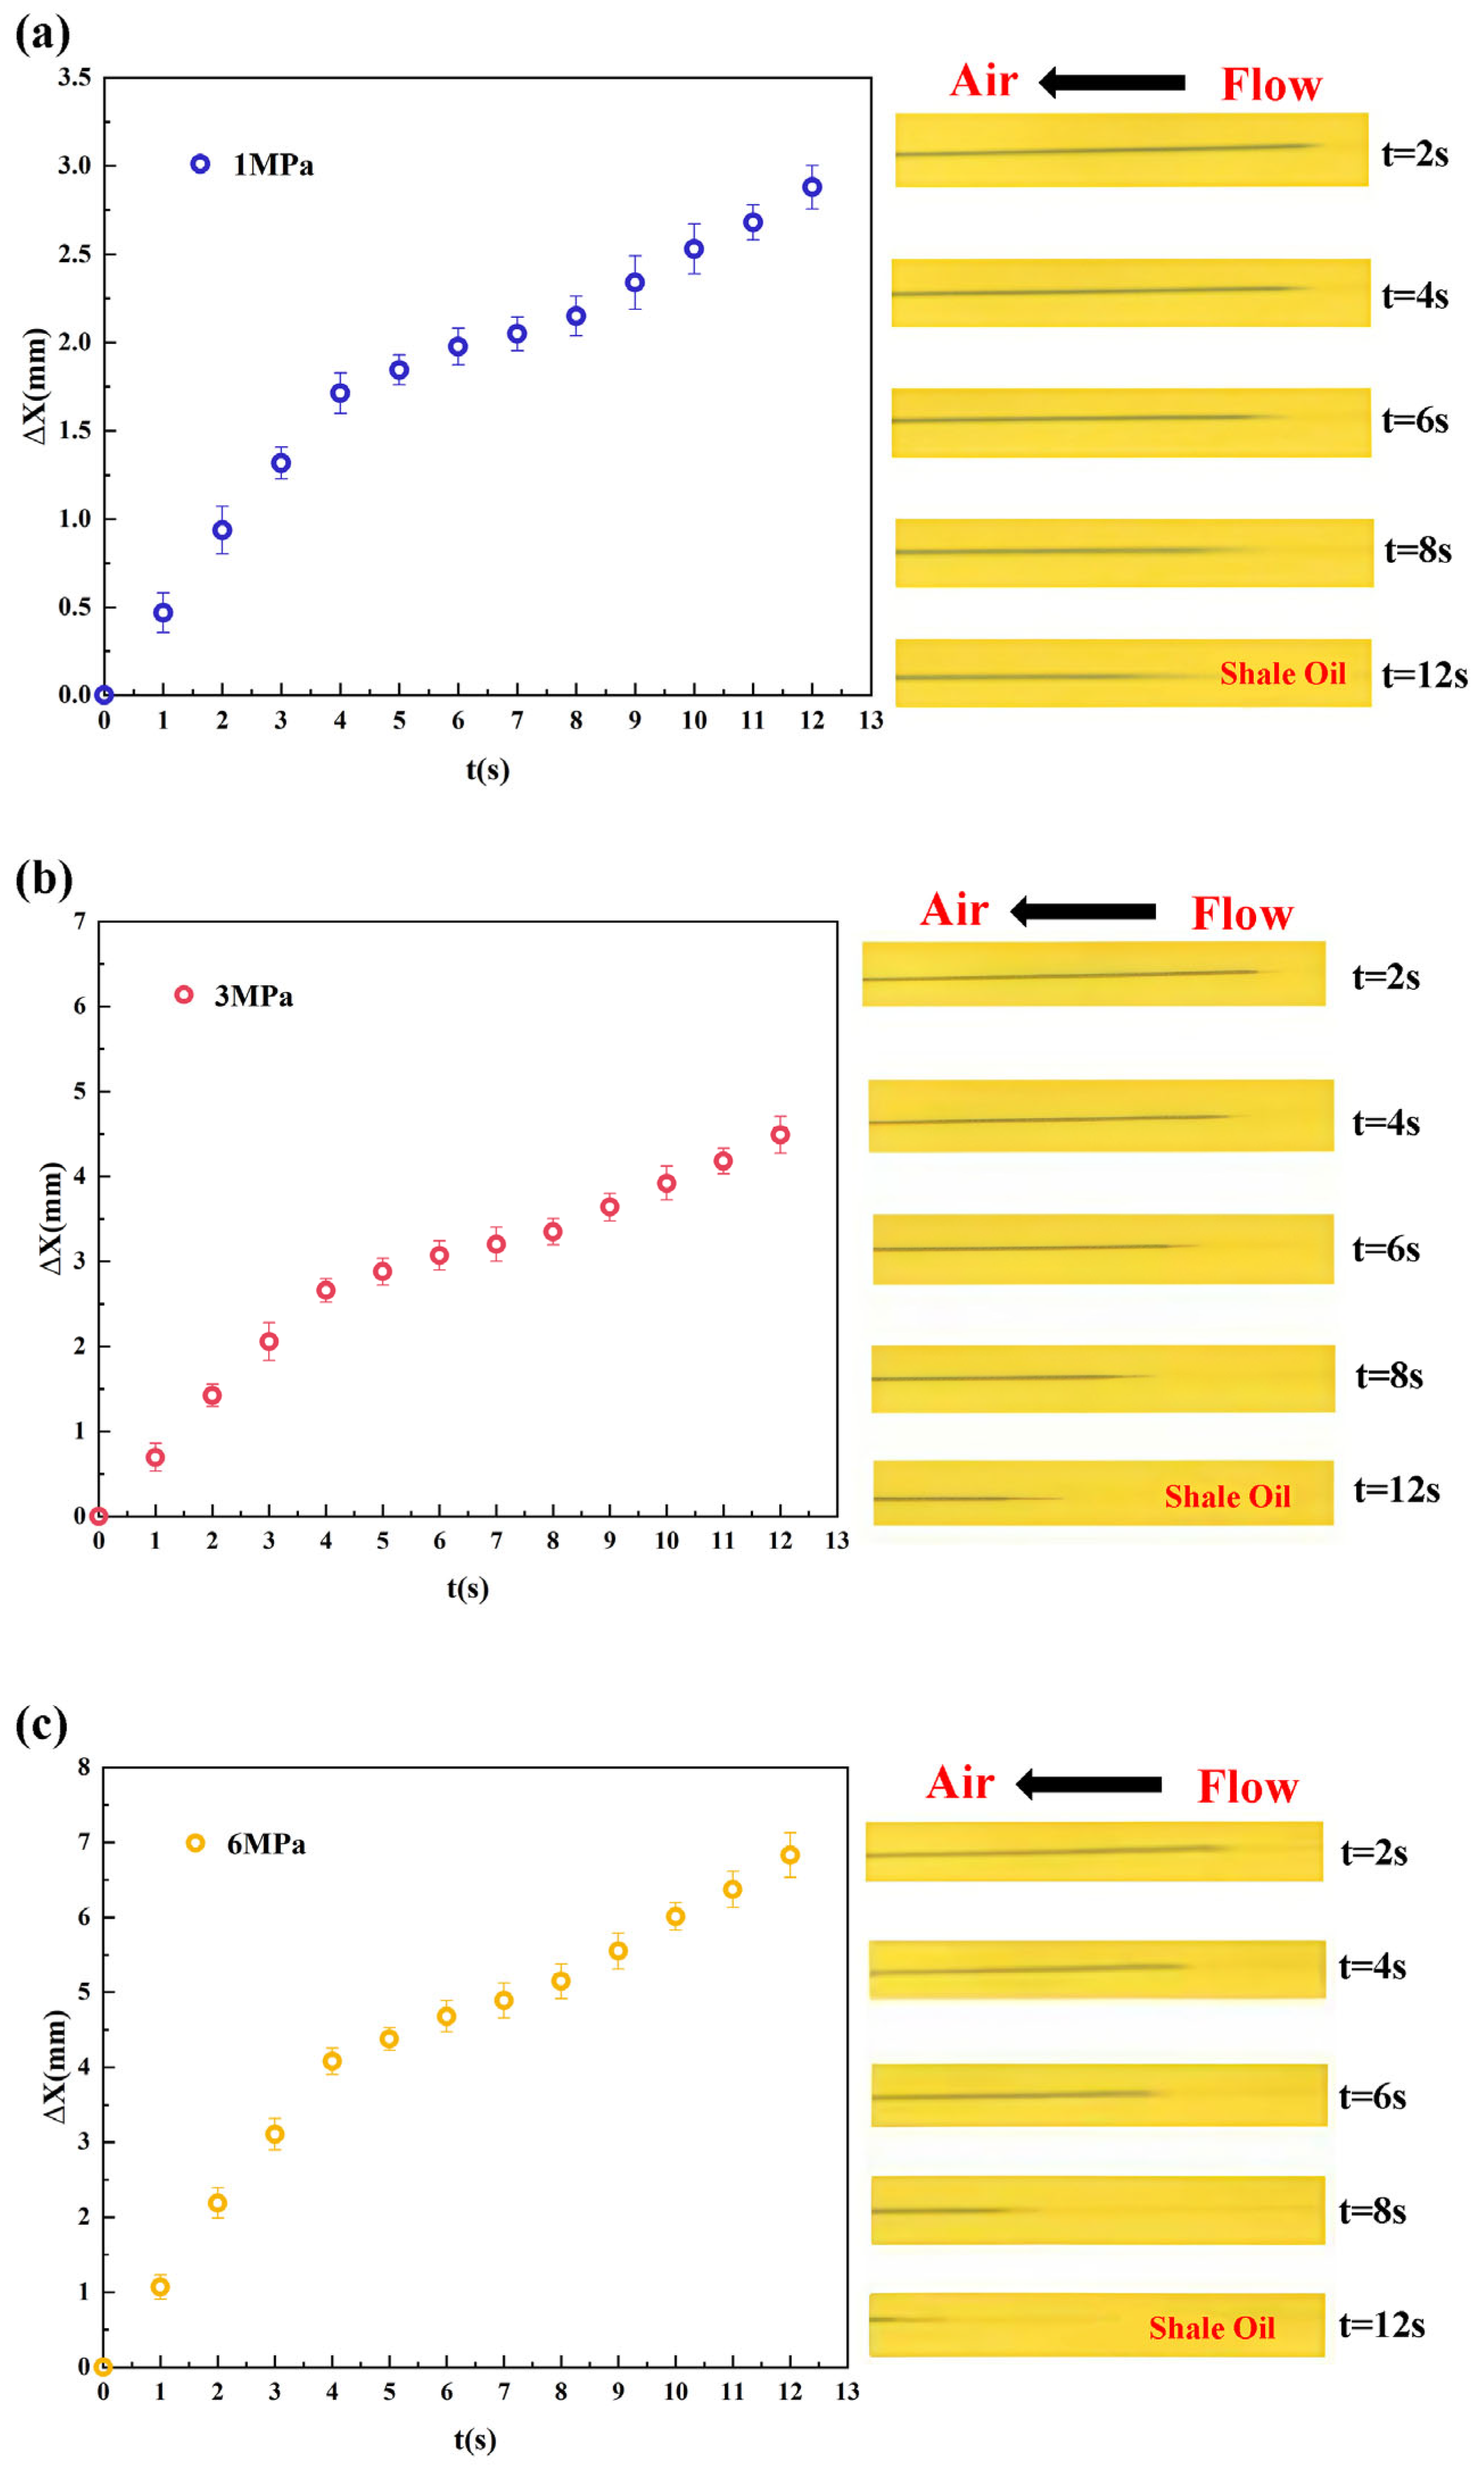
The flow of shale oil in 100 nm nanochannels was examined at injection pressures of 1, 3, and 6 MPa under a constant temperature of 25 °C. The microscopic flow process was captured using a microscope and the Image View software to record the flow distance of shale oil over time. As shown in
Figure 8, the displacement distances of shale oil at 12 s under 1, 3, and 6 MPa were approximately 2.88 mm, 4.48 mm, and 6.81 mm, respectively. These results clearly show that increased injection pressure leads to a longer flow distance within the same timeframe and a correspondingly higher displacement velocity. This confirms that increasing a higher pressures gradient provides a stronger driving force, effectively enhancing the flow capacity of shale oil in nanoconfined spaces.
By dividing displacement distance by time, the average flow velocity of shale oil under different pressures was roughly determined. At 1, 3, and 6 MPa, the velocities were approximately 0.29 mm/s (v1), 0.46 mm/s (v2), and 0.58 mm/s (v3), respectively. As pressure increased from 1 MPa to 3 MPa and then to 6 MPa, the flow velocity increased by about 1.6 times and 2 times, respectively. These results demonstrate that raising injection pressure can effectively enhance the flow capability of shale oil within nanopores. However, as the pressure continues to rise, the rate of improvement in flow ability gradually diminishes, implying a nonlinear relationship between pressure and flow enhancement due to the limited compressibility and increasing viscous resistance of confined fluids in nanoscale channels.
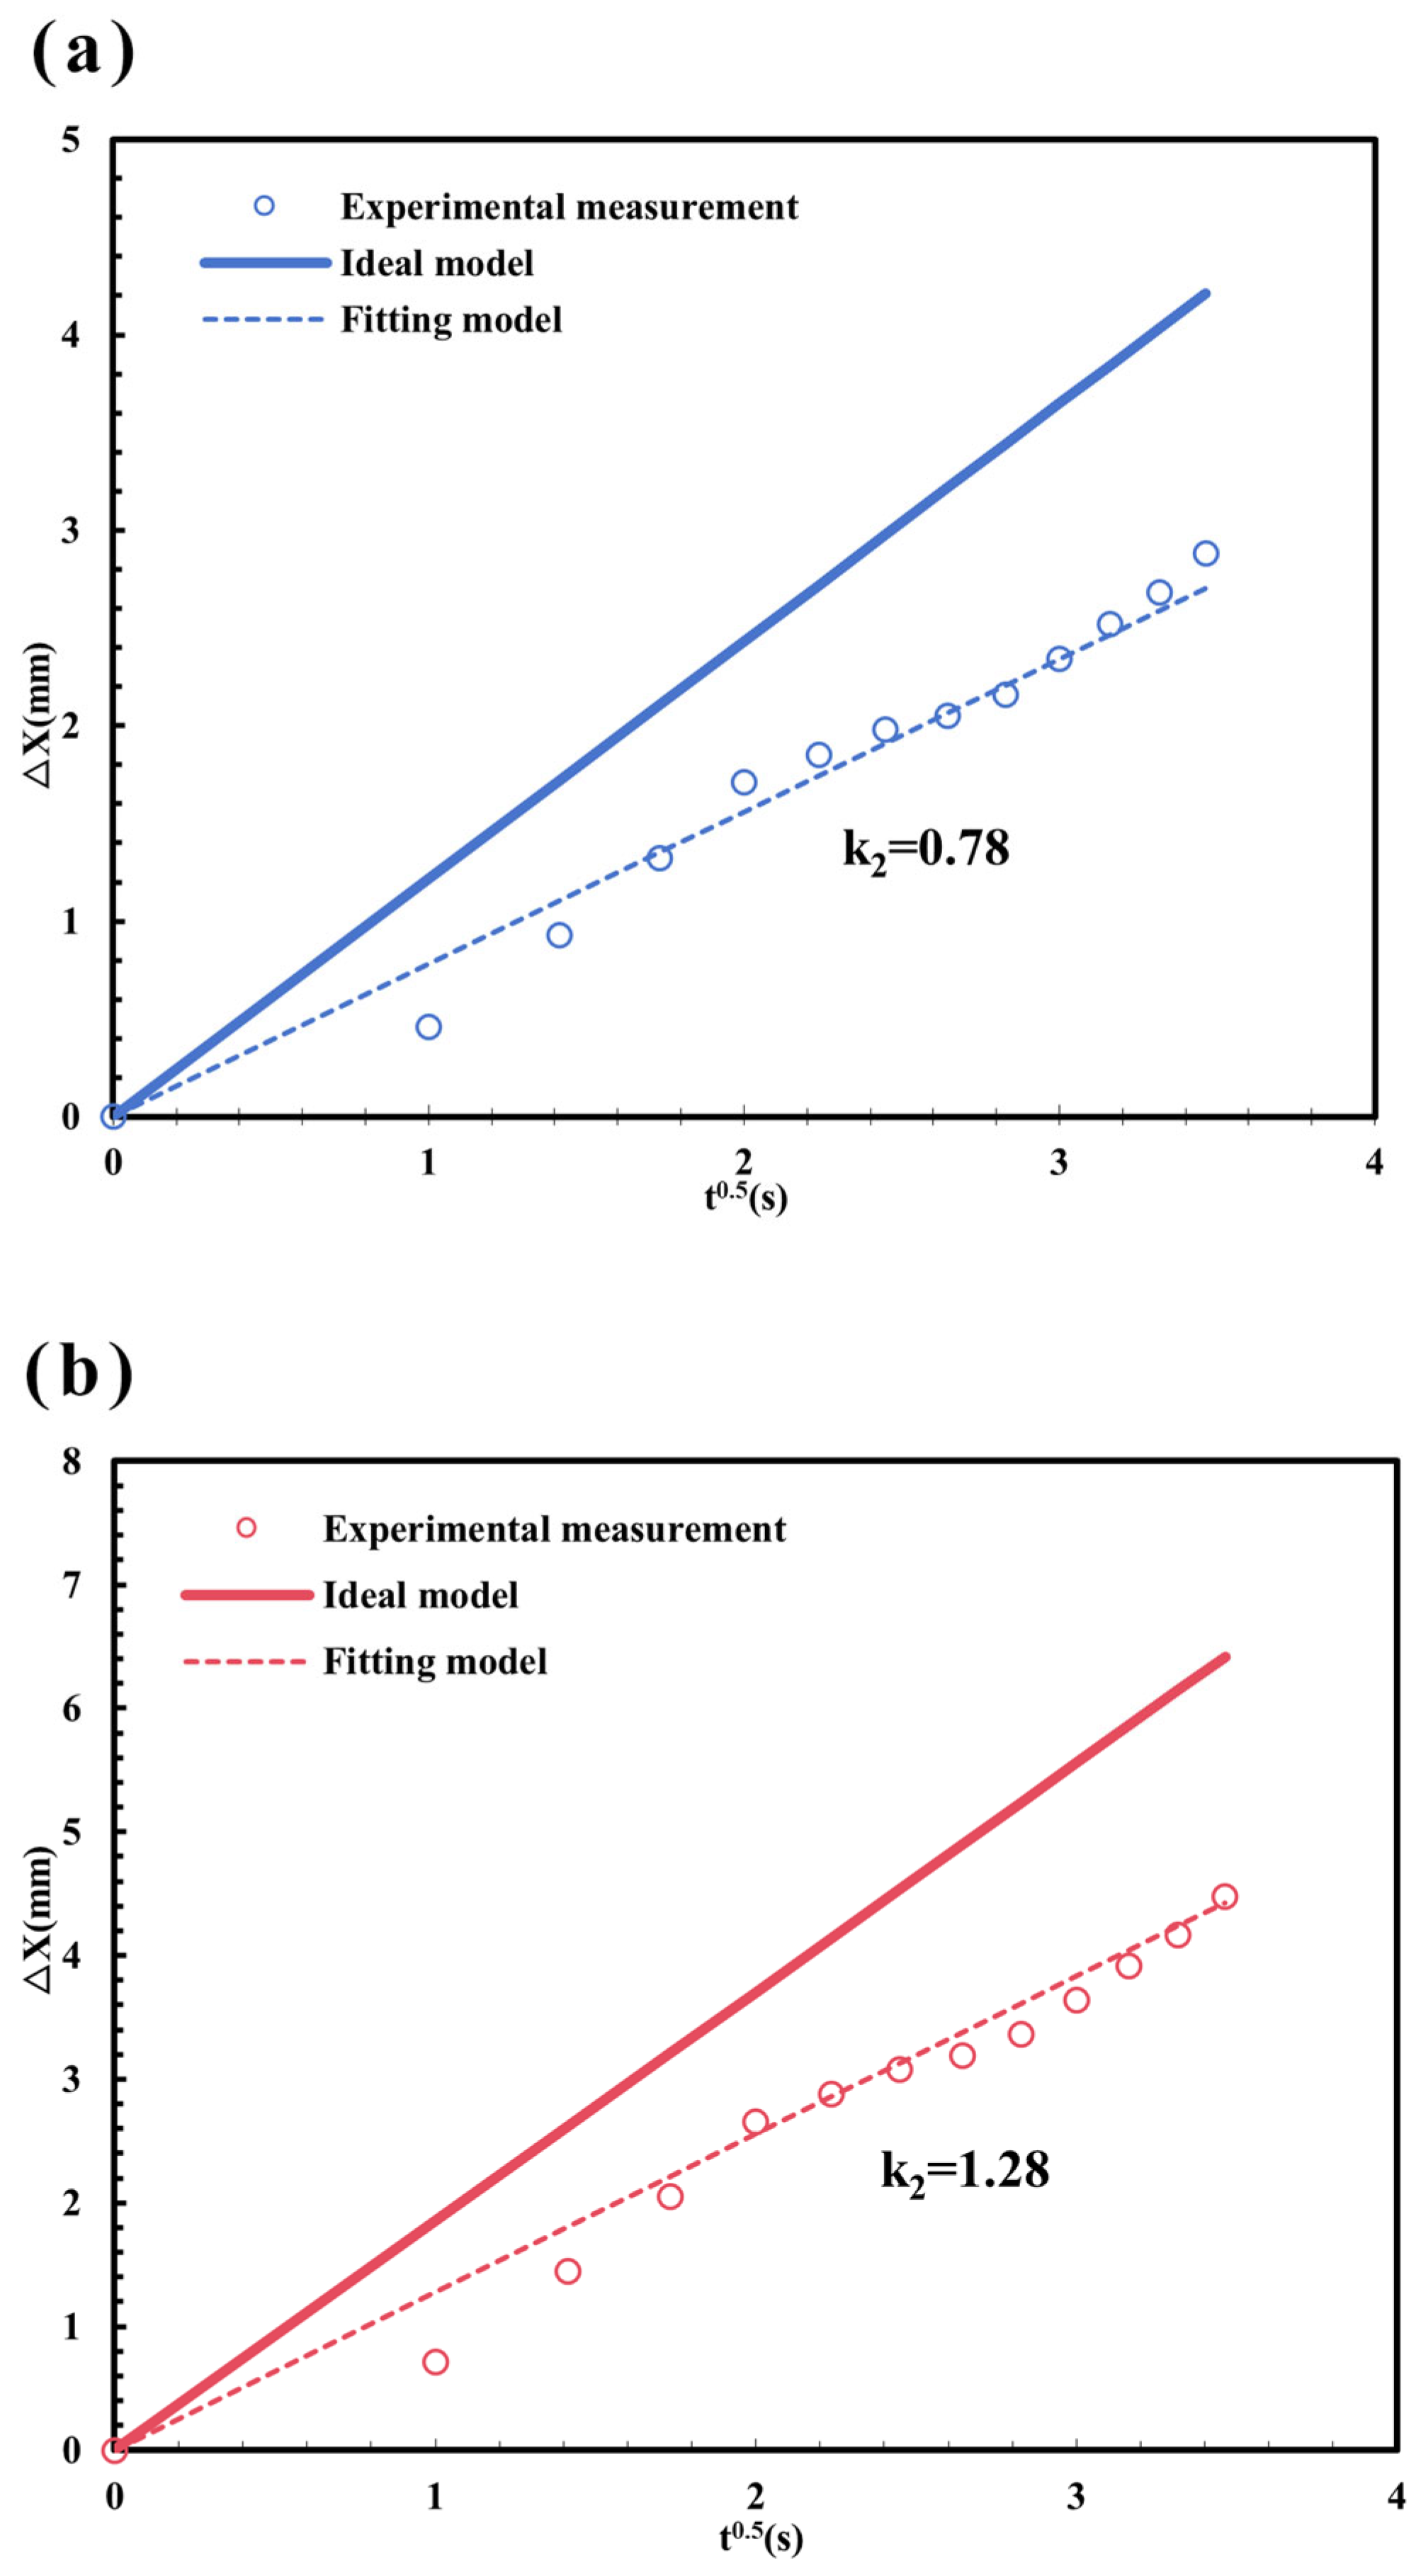
Predictions and fittings of the flow curves at injection pressures of 1, 3, and 6 MPa are presented in
Figure 9, where panels (a), (b), and (c) compare the ideal Plate Channel prediction with the fitted model for each pressure. The effective resistance coefficients obtained from fitting are 2.43, 2.10, and 1.65 for 1, 3, and 6 MPa, respectively. The slopes of the ideal prediction curves k1 are 1.21, 1.85, and 2.53, while the slopes of the fitted curves k2 are 0.78, 1.28, and 1.97, respectively. As injection pressure increases, the net driving force on the oil phase grows and shale-oil mobility improves, resulting in a progressive reduction in the discrepancy between the ideal and fitted curves.
The underlying mechanism involves multiple pressure-induced effects. The primary effect is an increased volumetric driving force that helps overcome interfacial and viscous resistances. Concurrently, elevated pressure modifies solid–liquid interfacial behavior: it can compress the adsorbed immobile layer, effectively enlarge the central mobile region and reduce the apparent viscosity experienced by the flowing core. Although shale oil compressibility is limited, a higher pressure also increases fluid density and decreases molecular spacing; because the adsorption energy with the wall does not proportionally increase, the stability of the adsorbed layer is reduced, molecular mobility rises, and confinement-induced hindrance is weakened. In many cases, injection-pressure rises are accompanied by small temperature increases, and the combined thermal and mechanical effects further facilitate flow.
In summary, increasing the injection pressure mitigates the influence of nanoscale confinement on shale oil mobility, as evidenced by the reduction in the equivalent resistance coefficient. However, at higher pressure ranges, the mobility enhancement exhibits a diminishing trend, meaning that the improvement in flow capacity gained per unit increase in pressure progressively decreases.
In summary, this study systematically investigates the effects of temperature, pressure, and pore-scale confinement on shale oil flow in nanochannels. The results indicate that all three factors influence the extent to which the flow deviates from classical Darcy behavior. Beyond these parameters, additional factors such as wettability and surface roughness are also expected to govern non-Darcy flow through specific underlying mechanisms. For example, Wu et al. conducted molecular dynamics simulations to systematically investigate water flow in nanopores with varying wettability. They found that the hydrophilicity or hydrophobicity of pore walls significantly alters the near-wall fluid structure and slip length [
50]. Their results showed that as wettability decreases (hydrophobicity increases), wall-slip effects become markedly enhanced, leading to a clear departure from the linear Darcy relationship between flow rate and pressure gradient. This work was the first to reveal, at the molecular scale, that wettability can regulate non-Darcy flow by controlling interfacial slip. Qin et al., through molecular dynamics analyses, further explored how different amplitudes of nanoscale surface roughness affect fluid slip and flow rate within nanochannels [
51]. Their findings demonstrated that increasing roughness reduces the average fluid velocity and substantially increases flow resistance, resulting in nonlinear variations in the flow rate–pressure gradient relationship. This study highlights that microscopic surface structures can induce non-Darcy behavior and represent a key geometric factor influencing nanoscale flow dynamics. In addition, the emulsions formed by asphaltenes and resins in shale oil significantly increase the apparent viscosity, enhance interfacial adsorption, and increase flow resistance, thereby causing a significant deviation from Darcy flow behavior [
52].
4. Discussion
Based on the foregoing experimental results, it is necessary to further discuss the potential implications of nanoscale flow resistance for the understanding of shale oil reservoir seepage behavior and its engineering applications. The experimental results demonstrate that as the channel size decreases to the sub-hundred-nanometer scale, shale oil flow behavior deviates markedly from the predictions of the ideal parallel-plate slit model. If shale oil transport in nanoporous reservoirs is described solely using classical Darcy-based permeability estimates, while neglecting the additional resistance induced by nanoscale confinement, the effective permeability may be significantly overestimated.
From the perspective of scale transition, the equivalent resistance factor proposed in this study serves as a nanoscale correction parameter that quantifies the deviation of actual flow behavior from ideal continuum-based models. This parameter provides a practical pathway for incorporating nanofluidic experimental observations into multiscale seepage models, allowing nanoscale flow characteristics to be introduced into macroscopic descriptions in a simplified and intuitive manner. Such a representation enables the influence of nanoscale confinement on flow behavior to be accounted for without substantially increasing model complexity.
The results of this study further suggest that nanoscale flow resistance may, to some extent, constrain the transport efficiency of injected fluids in shale oil reservoirs. Enhanced oil recovery (EOR) processes such as CO2 flooding and gas huff-and-puff operations rely heavily on fluid transport and diffusion within nanopore networks. Under nanoscale confinement, the enhanced flow resistance may affect the advancement rate of the displacement front and the sweep efficiency. Therefore, incorporating nanoscale resistance effects into the design and performance evaluation of shale oil EOR strategies is expected to enable a more realistic assessment of flow behavior during injection and to provide a sound physical basis for optimizing development parameters.