Article

Research on Foam Sand-Flushing Simulation of Coiled Tubing in Shale Gas Horizontal Wells

1
Chongqing Key Laboratory of Complex Oil and Gas Field Exploration and Development, School of Petroleum Engineering, Chongqing University of Science and Technology, Chongqing 401331, China
2
Liaohe Oilfield of CNPC, Panjin 401331, China
*
Author to whom correspondence should be addressed.
Processes 2026, 14(9), 1383; https://doi.org/10.3390/pr14091383
Submission received: 20 March 2026 / Revised: 16 April 2026 / Accepted: 22 April 2026 / Published: 25 April 2026

Abstract

To address the issues of easy leakage and low sand-flushing efficiency of coiled tubing working fluid in shale gas horizontal wells, this study investigates the flow behavior of foam fluid in both the coiled tubing and the annulus during foam sand-flushing operations, and optimizes operational parameters to enhance sand-flushing efficiency. Considering the dynamic variations in foam fluid properties with temperature and pressure, secondary flow effects in the spiral section, annular eccentricity, wellbore trajectory, and the solid phase in sand-carrying fluid, a one-dimensional steady-state hydraulic model incorporating flow and heat transfer is developed for the entire wellbore. This model covers the spiral, straight, jet, and annular sections of coiled tubing. Using field data from an example well, simulations yield the pressure distribution along the foam circulation path, the total circulation time, and key operational parameters. The feasibility of coiled tubing foam sand-flushing in shale gas horizontal wells is demonstrated, and the optimization of operational parameters to improve sand-flushing efficiency is analyzed. The findings provide important guidance for parameter design and equipment selection for safe and efficient sand-flushing operations in shale gas horizontal wells.

1. Introduction

The potential of shale gas resources in China is great. Technologies such as multi-stage fracturing of horizontal wells are mature and effective for the development of shale gas resources [1,2]. However, in the process of fracturing fluid backflow and later production of shale gas wells, proppant backflow and other formation sand production problems seriously affect the production of shale gas wells [3]. Conventional sand-flushing operations in shale gas horizontal wells have problems such as low sand-flushing efficiency, easy leakage, and reservoir contamination [4,5]. Foam fluids, with their low density, high viscosity and good sand-carrying properties [6], combined with coiled tubing operation technology, have become an effective solution to the problem of sand-flushing in shale gas horizontal wells [7,8].
Foam sand-flushing using coiled tubing in shale gas horizontal wells is a complex process involving complex wellbore conditions, gas–liquid–solid multiphase flow, and heat transfer. The density, viscosity and other physical parameters of foam fluid are greatly affected by wellbore temperature and pressure, showing dynamic change characteristics. The working path of positive circulation foam sand-flushing can be divided into the ground spiral section, downhole straight pipe section, jet tool section and annular flowback section. Secondary flow is generated in the spiral section due to centrifugal force and curvature, resulting in a large pressure drop in the spiral section. The jet section actively causes a pressure drop to exchange for a high-speed jet; there is a solid–liquid–gas three-phase flow in the annulus section, and the coiled tubing cannot be guaranteed to be centered due to gravity and other reasons, which seriously affects the flow field distribution and further increases the fluid friction. Many scholars at home and abroad have enhanced their understanding of foam sand-flushing technology by studying the rheology of foam fluid [9,10,11,12,13], multiphase flow models [14,15,16,17], hydraulic model for calculating the frictional pressure drop of foam fluid [18,19,20,21,22,23,24,25,26,27,28,29,30], numerical simulation of sand-flushing and well washing, and sand-flushing tools [31,32,33,34]. However, most of the existing studies have not fully considered the comprehensive influence of dynamic changes in foam physical properties, the flow of the spiral section’s large curvature structure, and the eccentricity effect in the annulus, resulting in limitations of the prediction models and making it difficult to gain a deeper understanding of the flow laws of foam sand-flushing operations.
In response to the above problems, this paper aims to establish a more accurate prediction model for the flow law of coiled tubing foam sand-flushing fluid in the pipe and annulus. By comprehensively considering the variation in foam properties with temperature and pressure, the large curvature structure of the spiral section, the eccentricity of the annulus, and the wellbore trajectory, a complete physical and mathematical model is constructed to achieve a deeper understanding of the distribution of pressure, velocity and the foam’s physical parameters in the wellbore. Ultimately, the model is used to determine the feasibility of the foam sand-flushing operation for a given well and to maximize the flushing rate by optimizing the construction parameters under the premise of feasibility, providing a theoretical basis and design support for efficient sand-flushing operations in shale gas horizontal wells.

2. Establishment of a Foam Sand-Flushing Model for Horizontal Wells Using Coiled Tubing

2.1. Physical Model

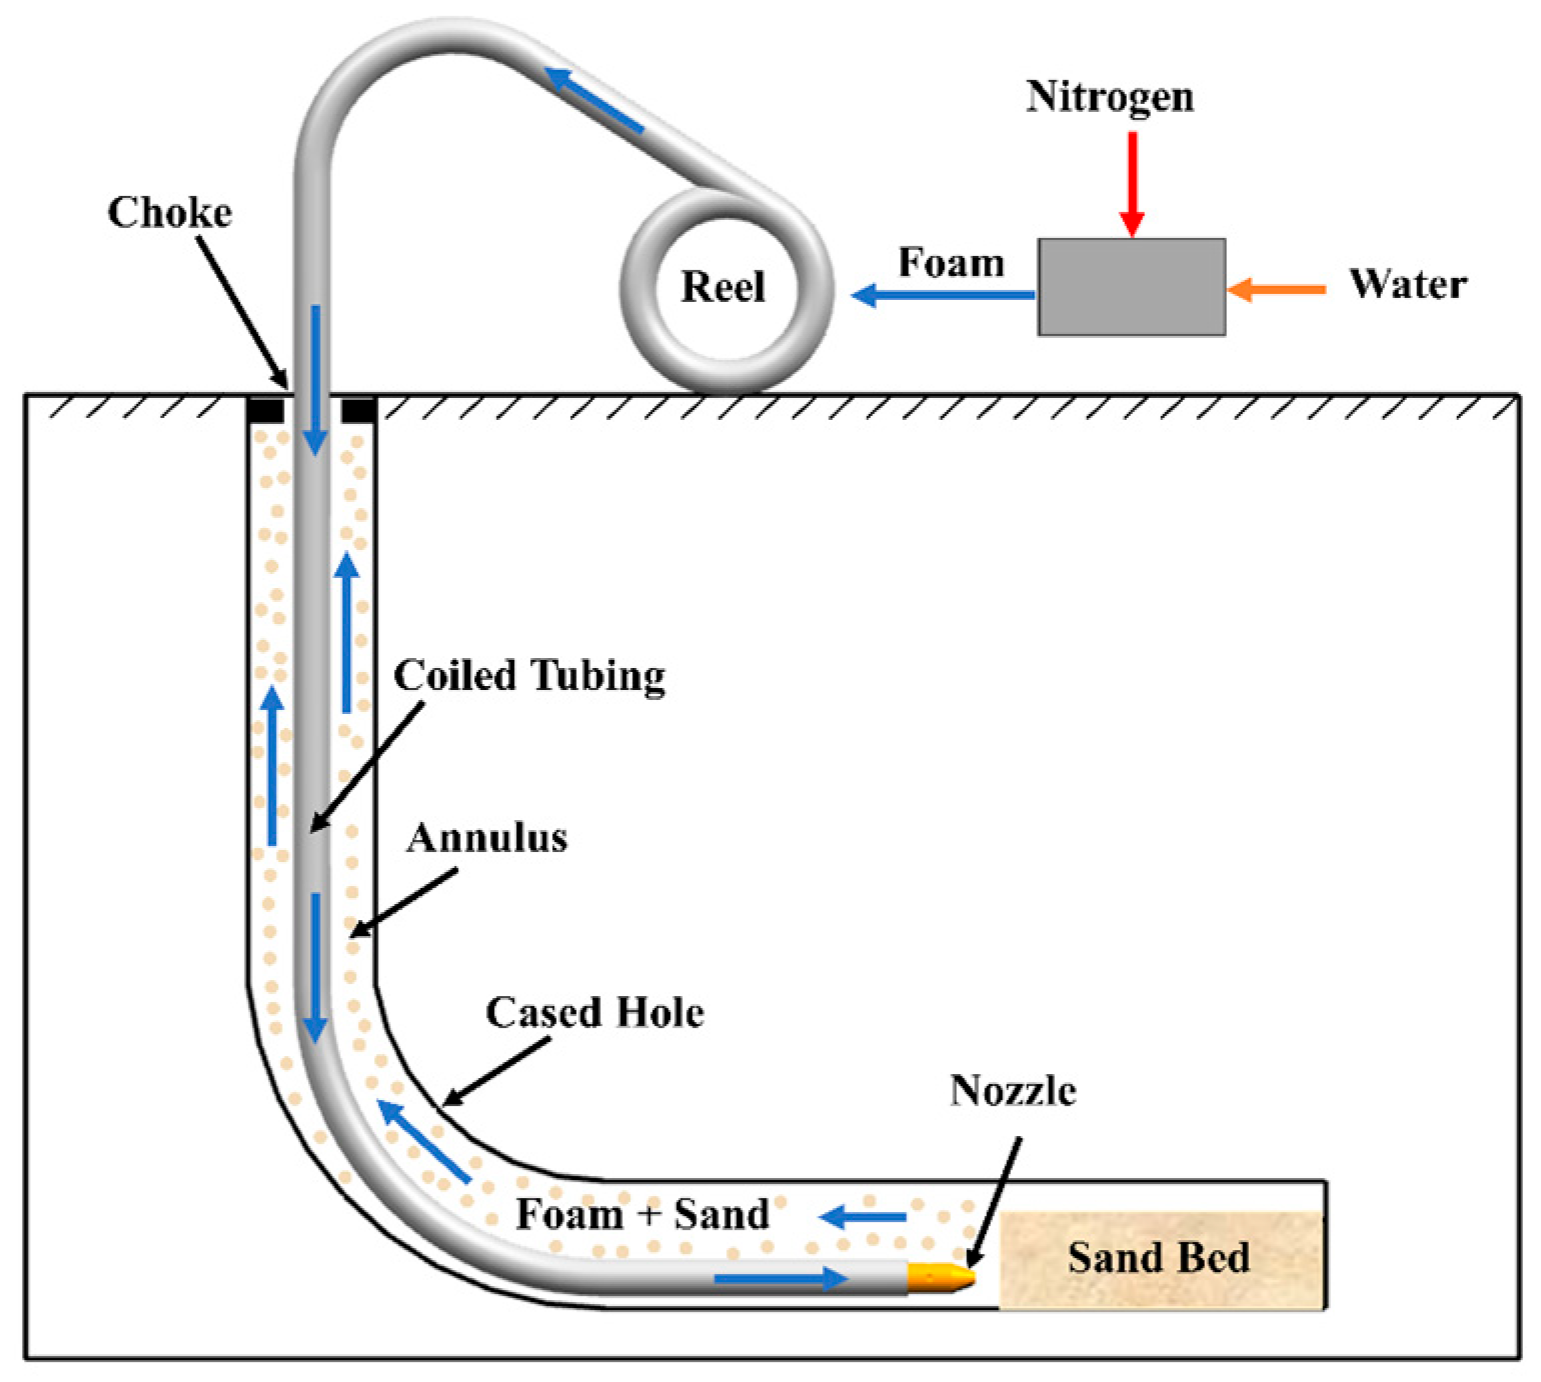
This paper mainly studies the positive circulation sand-flushing method; that is, the foam working fluid is injected from the spiral pipe section through the straight pipe, flows out from the jet section to carry sand particles, and is discharged through the annular section.
According to the working fluid circulation path, the entire coiled tubing sand-flushing process can be divided into the spiral section, straight pipe section (including the entire downhole coiled tubing section, divided into the vertical well section, the inclined section and the horizontal section), the jet section and the annular section. The specific segmentation diagram is shown in Figure 1.
Since the flow conditions in the coiled tubing and in the annulus are different, given there are only liquid and gas phases in the tubing and solid phases in the annulus, they are studied separately. A complete coiled tubing fluid dynamics control equation is established, and, in combination with the temperature and pressure distribution of the formation, the phase distribution of different types of working fluids within the coiled tubing system is determined, and the force of the fluid on each micro-element segment of the tubing and the annular space is studied using the principles of conservation of momentum and energy. The flow law of the foam fluid in the coiled tubing and the annulus is studied.
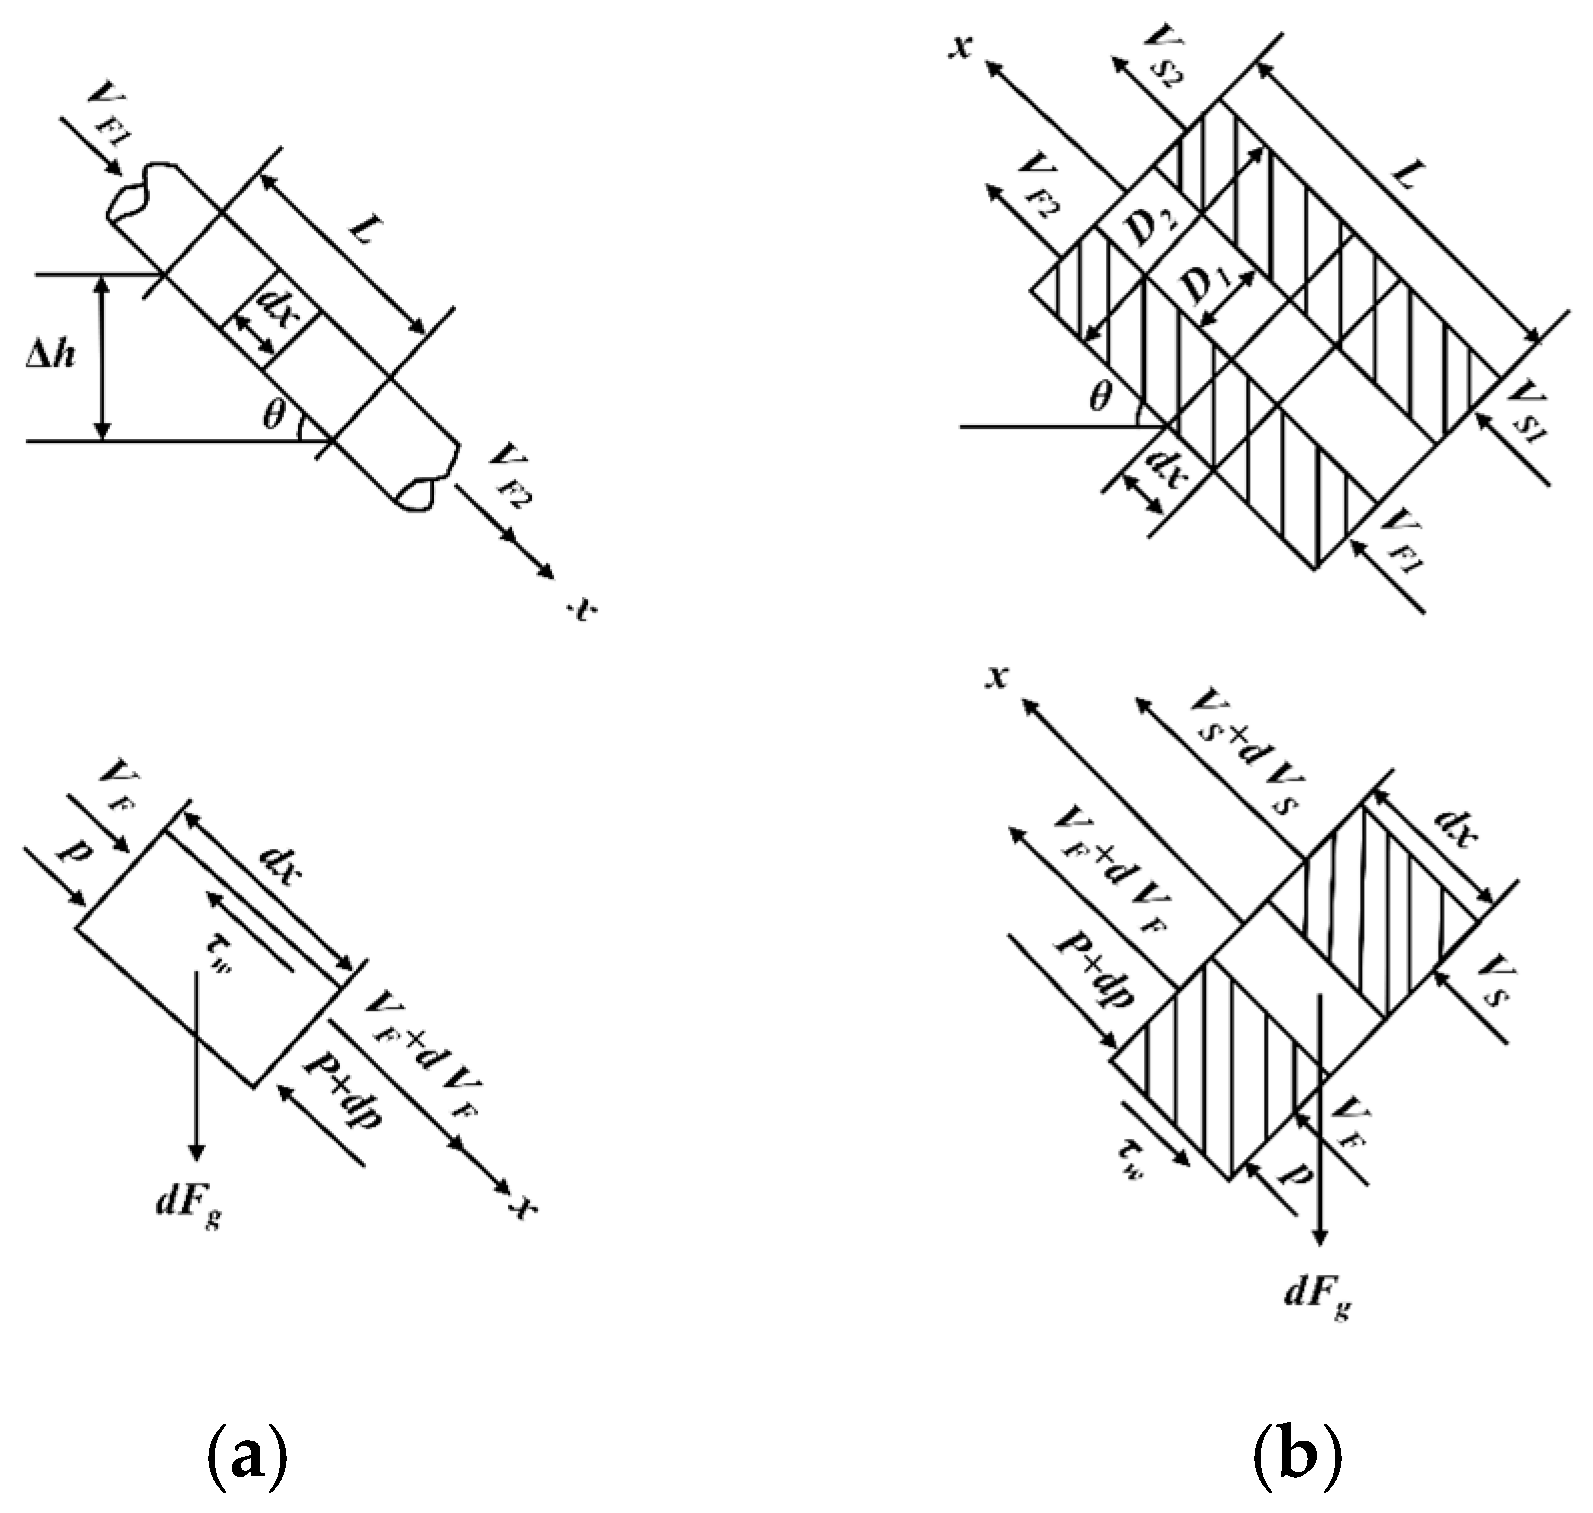
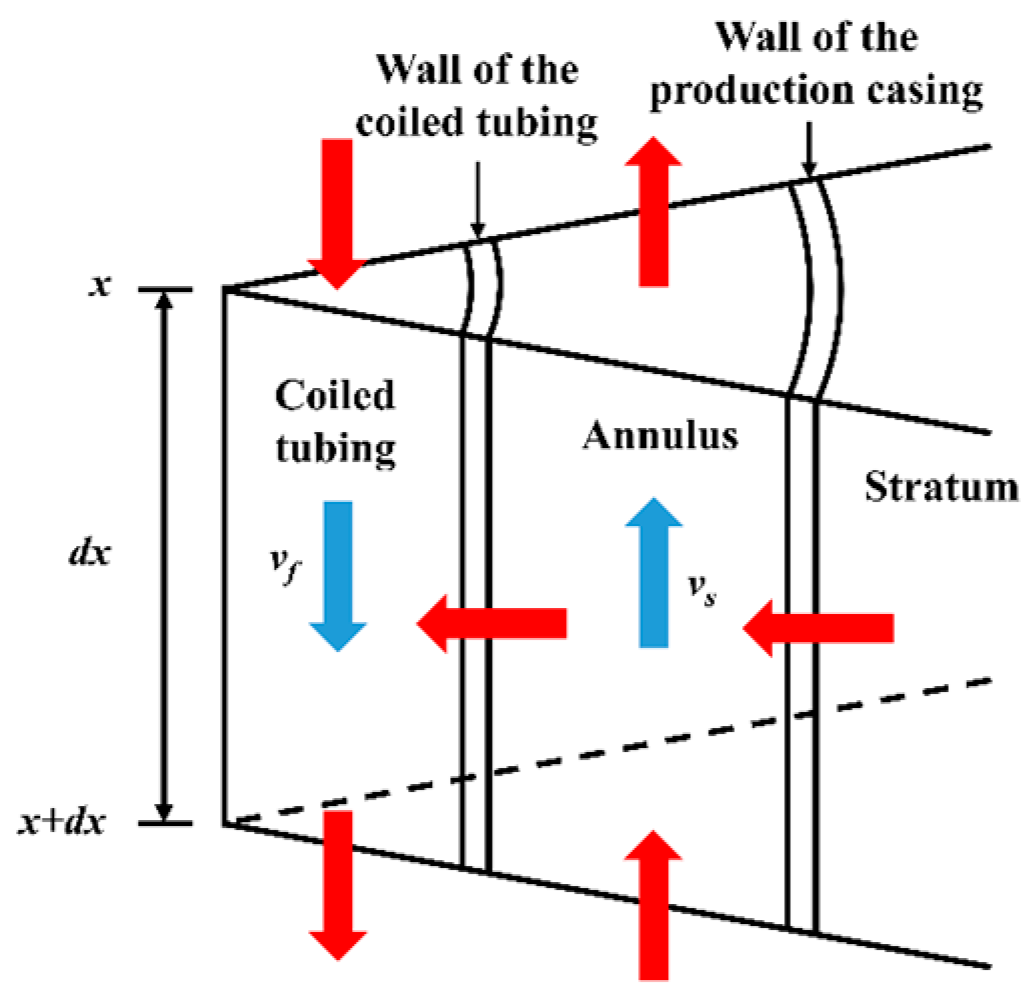
Based on the above analysis, it is assumed that the motion of the foam fluid in the coiled tubing and the annular space is regarded as a constant one-dimensional flow, and the fluid velocity is uniform across the cross-section. Physical models of the coiled tubing micro-element segments and the annular space micro-element segments are established respectively. The foam fluid in the coiled tubing flows downward, and the physical model of the micro-segment is shown in Figure 2a. The foam fluid contains only gas and liquid phases, and it is assumed that the flow is steady and the foam fluid is incompressible at each micro-segment. In the annulus, the foam fluid flows upward, and the physical model of the micro-segment is shown in Figure 2b. The foam fluid contains gas, liquid and solid phases, and the foam fluid is regarded as a uniform phase. The forces acting on the micro-segment are pressure dFp, gravity dFg and frictional force dFf, respectively, VF1 and VF2, m/s, are the upstream and downstream velocities of the segment, respectively.

2.2. Mathematical Model

Before the establishment of the control equation, the following basic assumptions are made about the coiled tubing and casing model:
  • The gas in the foam fluid is compressible while the liquid is incompressible, and the mass ratio of gas to liquid in the foam remains constant regardless of the expansion or compression of the foam.
  • The physical properties of the foam working fluid vary with temperature and pressure. At the same measured depth, these properties are assumed to be radially uniform.
  • During near-balanced sand-flushing (Pbh = Pf + 0~1 MPa), no formation gas enters the wellbore. However, fixed fluid loss is assumed to occur at specified fracture locations along the horizontal annulus section. A leakoff coefficient is introduced to determine the total fluid-loss volume, and each leakoff point is assumed to account for a prescribed proportion of the total loss.
  • The temperature distribution of the fluid in the coiled tubing and annulus is considered a one-dimensional distribution.
  • Axial heat conduction and rotational deformation within the foam working fluid are not considered.
  • Only heat conduction occurs in the formation; other modes of heat transfer are not considered, and the axial heat conduction of the casing wall is ignored.
The simplified model described above is applicable to near-balanced sand-flushing in shale gas wells (Pbh = Pf + 0~1 MPa), under conditions where formation gas inflow into the wellbore is prevented, annular working-fluid leakoff does not exceed 25%, the horizontal well section is no longer than 1800 m, and the formation temperature does not exceed 130 °C. These assumptions are adopted to satisfy field engineering accuracy requirements while substantially simplifying the two-phase flow and heat-transfer model, reducing computational complexity, and facilitating rapid field application. However, once these applicability limits are exceeded, the deviations in predicted pressure drop, temperature, and foam sand-carrying capacity may become significant. In such cases, more refined physical models, such as two-dimensional heat transfer, two-fluid models, dynamic leakoff models, and fracture convection models, should be employed for correction.
To ensure that the foam remains in a stable foam state throughout the sand-flushing operation, the maximum foam quality at the annular wellhead should be less than 98%, and the minimum foam quality at the bottom of the well should not be less than 55%, at which point the foam is a non-Newtonian fluid. In this paper, a power-law pseudoplastic model is used to calculate the rheological properties of the foam, and its constitutive equation is:
τ = K γ ˙ n
where the τ is the shear stress of the foam fluid, and γ ˙ is the shear rate, and K is the consistency coefficient, and n is the power-law index.

2.2.1. Continuity Equation

Based on the basic assumptions of the above model and according to Euler’s law of conservation of mass, substituting the coiled tubing and annulus velocities into the equation gives the continuity equations of the coiled tubing and annulus system:
ρ F V F A p z = 0
ρ m V m A a z = 0
where the Ap is the cross-sectional area of the coiled tubing, and the Aa is the cross-sectional area of the annulus.

2.2.2. Momentum Equation

Based on the Navier–Stokes equation (N–S equation), assuming the fluid velocity is uniform and considering only the axial velocity, and substituting the velocity and density of the coiled tubing and annulus system into the equation, the momentum equations of the coiled tubing and annulus are obtained:
ρ p v p t + ρ p v p 2 z = ρ p g p p z p f p
ρ a v a t ρ a v a 2 z = ρ a g + p a z p f a
Due to the significant variations in the flow within the tubing in each working section, this paper will elaborate on the momentum conservation equations for the straight pipe section, spiral section, jet section of the sand-flushing tool, and annular section.
  • Within the straight section of the coiled tubing
According to the principle of conservation of momentum, the pressure, gravity and frictional forces acting on the fluid within a micro-segment are equal to the change in momentum within that micro-segment; that is:
π D 2 4 d p + ρ F g π D 2 4 d x sin θ τ W π D d x = W F d V F
where the WF is the mass flow rate of the foam fluid.
Based on the above assumption that the fluid is stably flowing and incompressible, resulting in the almost negligible the momentum loss, then the pressure drop along the coiled tubing is:
Δ p = p 1 p 2 = 4 τ W L D ρ F g L sin θ
According to the Fanning friction coefficient, defined as follows:
f p = τ w 1 2 ρ F V 2 F
Substituting the above Fanning friction coefficient into Equation (7) gives:
Δ p = p 1 p 2 = 2 f F ρ F V F 2 L D ρ F g L sin θ
where the Δp is the pressure drop along the path, and the fF is the Fanning friction coefficient, and the L is the flow unit length, and the ρF is the foam density, and the VF is the foam flow rate, and the D is the inner diameter of the coiled tubing.
2.
Inside the coiled tubing spiral section
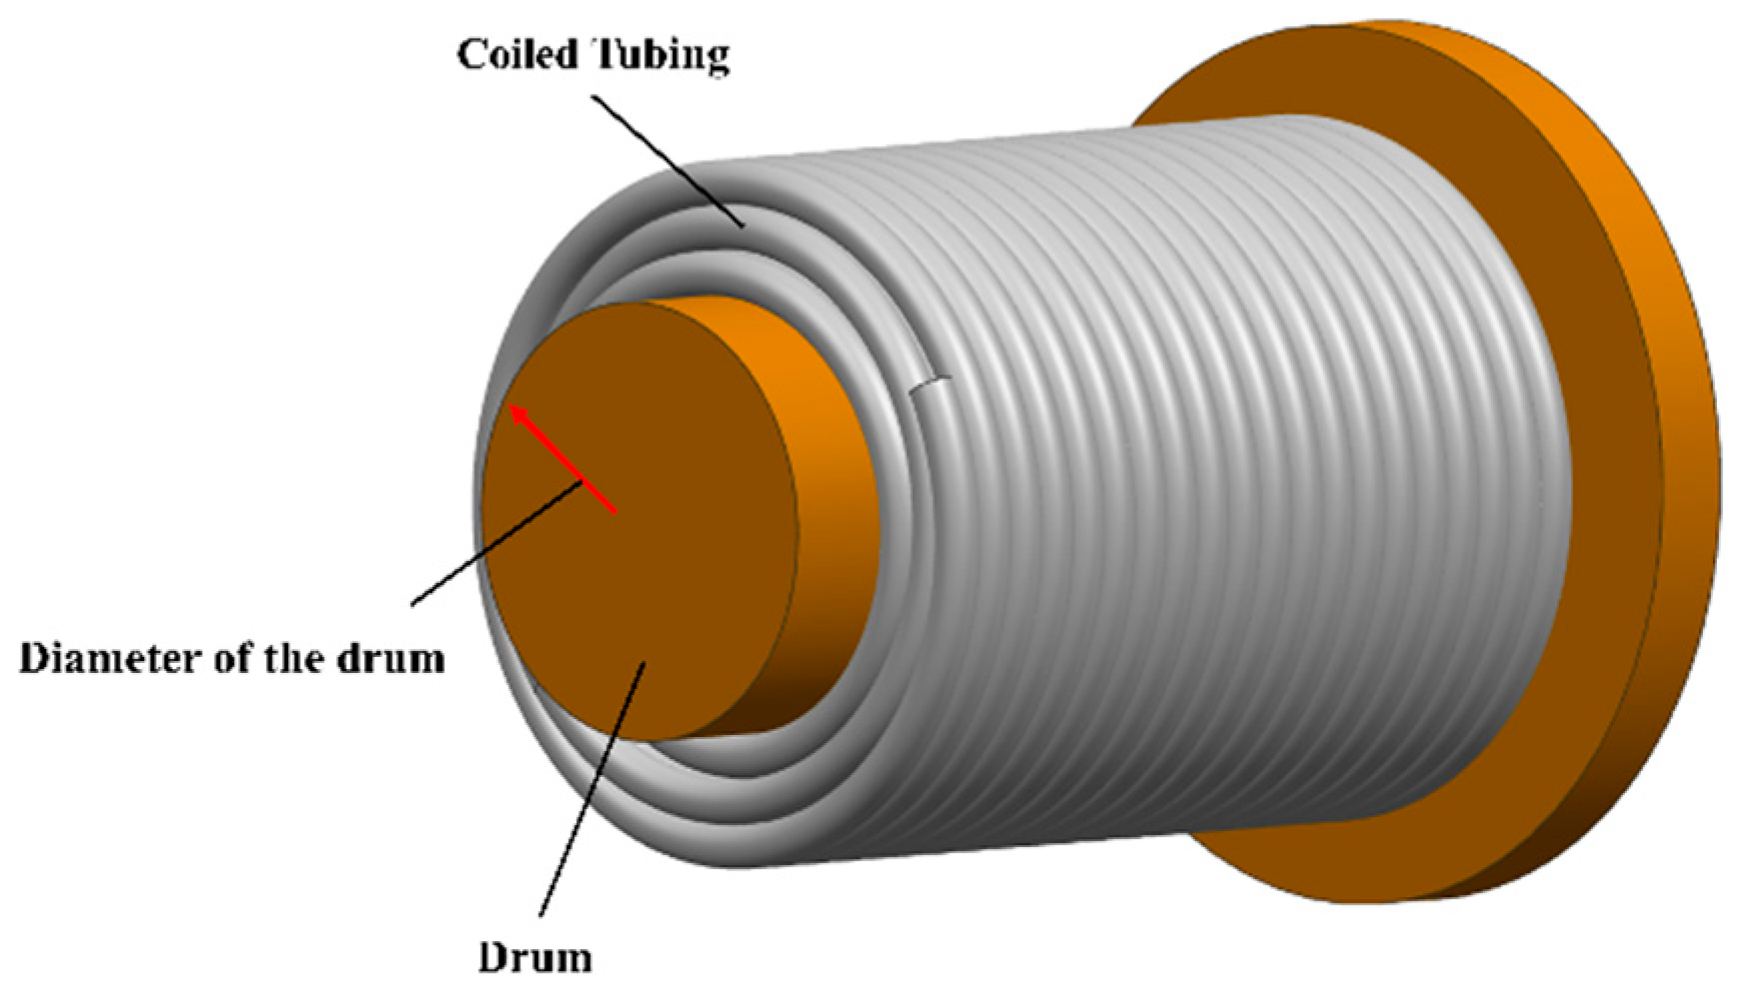
The spiral section of the coiled tubing differs from the straight section in that the coiled tubing in the spiral section is wound around the drum of the operating machine, and the gravitational pressure drop is very small and negligible. Only the frictional pressure drop needs to be considered, as shown in Figure 3. Foam fluid is prone to secondary flow in the spiral section, and the calculation methods for friction and the Reynolds number are different. And the curvature of each layer of the spiral tube is different, which affects the calculation of the Reynolds number and the flow regime identification.
The spiral section of the coiled tubing is wound around the drum of the machine, and the gravitational pressure drop is negligible. Only the frictional pressure drop needs to be considered. The formula for calculating the pressure drop is:
Δ p f c t s = 1 n Δ p f i = 1 n 2 f F i L i v i 2 d p i ρ f i
Firstly, it is necessary to distinguish the flow regime. For the spiral section, secondary flow is mainly considered due to the centrifugal force acting on the fluid in the curved tube and the viscosity of the foam fluid. The Dean number De is commonly used to identify the flow regime of the spiral section:
D e = Re M R d p i D 1 / 2 2 3 n 1 3 n + 1 4 n n ( non-Newtonian fluids )
The critical dean number Decr is:
D e c r = 2100 1 + 12 d p i D 1 / 2
where the dpi is the diameter of the coiled tubing, and the D is the curvature diameter of the spiral section.
Laminar flow (De ≤ Decr):
f = 5.22 Re M R 0.6 d p i D 0.3
Turbulent flow (De > Decr):
f = 1.069 a Re M R 0.8 b d p i D 0.1
Here,
a = lg n + 3.93 50 b = 1.75 lg n 7
3.
Jet section of the sand-flushing tool
Frictional pressure drop at the nozzle is calculated as [35]:
Δ p = 513.559 × 10 3 ρ Q 2 C 2 N 2 π d 2 4 2
where the Δp is the pressure drop of the jet sand-flushing tool, and the ρ is the foam density, and the Q is the volumetric flow rate of fluid, and the N is the number of nozzles; and the C is the nozzle flow coefficient, usually 0.90–0.98; and the d is nozzle diameter.
4.
Inside the annulus section
The sand-flushing fluid is discharged from the annulus, so there are three phases of gas, liquid and solid in the annulus. According to the law of conservation of momentum:
π D 2 2 D 1 2 4 d p ρ m g π D 2 2 D 1 2 4 d x sin θ τ w m π D 2 + D 1 d x = W F d V F + W S d V S
Ignoring the loss of momentum,
Δ p = p 1 p 2 = 4 τ w m L D 2 D 1 + ρ m g L sin θ
Substituting the Fanning friction coefficient:
Δ p = p 1 p 2 = 2 f m ρ m V m 2 L D 2 D 1 + ρ m g L sin θ
where the fm is the Fanning friction coefficient of the annular fluid, and the ρm is the density of the annular fluid, and the Vm is the velocity of the annular fluid, and the D1 is the coiled tubing outer diameter, and the D2 is the inner diameter of the casing.
Considering that the coiled tubing in the wellbore is affected by factors such as its own gravity, string spiral buckling and wellbore trajectory, the coiled tubing is not centered during operation. In order to reflect the flow law of the foam fluid in the annulus more closely under real operation conditions, an eccentricity correction factor is introduced, accounting for the influence of eccentricity on the frictional pressure drop. Then the above equation can be rewritten as:
Δ p = C e f 2 f m ρ m V m 2 L D 2 D 1 + ρ F g L sin θ
where the Cef is the eccentricity correction coefficient.
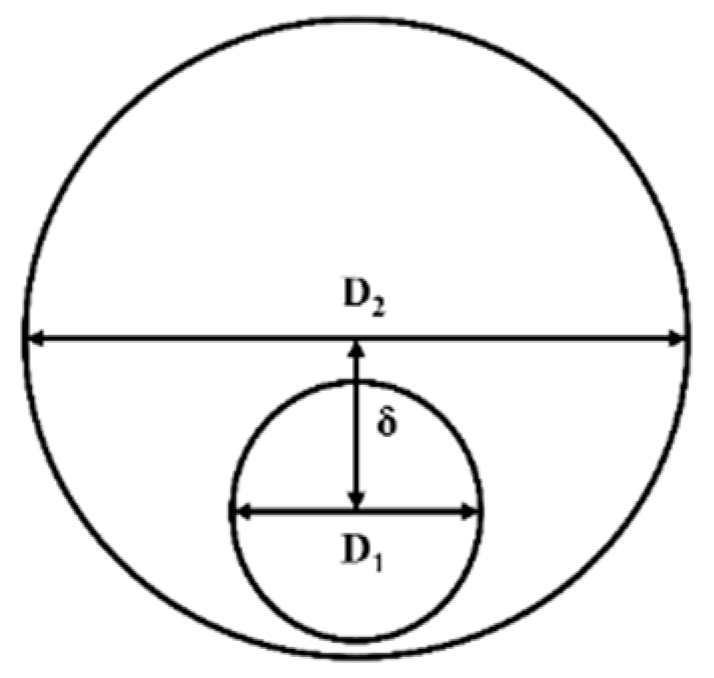
The eccentricity correction coefficient of the coiled tubing is a function of the eccentricity Ec. Eccentricity is a quantitative index of the coiled tubing’s deviation from its center position in the casing, as shown in Figure 4. If the coiled tubing is completely centered, that is, the coiled tubing coincides exactly with the central axis of the casing, then Ec = 0; 0 < Ec < 1 indicates that the coiled tubing is in an eccentric position but not fully attached to the casing wall; Ec is 1, if the coiled tubing is tightly attached to the casing wall.
The definition of eccentricity Ec is as follows:
E c = 2 δ D 2 D 1
where the δ is the distance between the axes of the coiled tubing and casing.

2.2.3. Energy Equation

During the sand-flushing operation, the foam flows downward from the coiled tubing and returns to the wellhead through the annulus with sand. During this process, heat conduction occurs between the formation and the annulus fluid, causing a change in the temperature of the annulus fluid. The heat from the annulus fluid then conducts to heat again with the fluid in the coiled tubing. To construct the energy conservation equation for the wellbore fluid, micro-elements of length dz were selected along the wellbore direction, and a schematic diagram of the heat exchange model of the wellbore fluid is shown in Figure 5.
  • Inside the coiled tubing
In the coiled tubing, the heat changes in the micro-segment mainly include the heat brought in by the axial flow of the foam fluid upstream, the heat conduction from the inner wall of the coiled tubing to the fluid inside the coiled tubing radially, and the internal energy generated by the friction of the flowing foam fluid.
ρ F ( T 1 ) c 1 ( T 1 ) T 1 t = ρ F ( T 1 ) c 1 ( T 1 ) V F T 1 z + 2 h 1 ( T 1 , T 2 ) T 2 T 1 r 1 + q 1 π r 1 2
2.
The wall of the coiled tubing
This consists mainly of convective heat exchange between the foam fluid in the coiled tubing and the sand-carrying fluid in the annulus.
ρ 2 c 2 ( T 2 ) T 2 t = 2 h 1 ( T 1 , T 2 ) T 2 T 1 r 1 r 2 2 r 1 2 + 2 h 2 ( T 2 , T 3 ) T 3 T 2 r 2 r 3 2 r 2 2
3.
In the annulus
In the annulus, the thermal behavior of the foam sand-carrying fluid is mainly governed by axial convective heat transport from the upstream flow, radial heat transfer between the annular fluid and the foam inside the coiled tubing, heat loss caused by fluid leakoff at prescribed locations along the horizontal annular section, heat conduction from the production casing wall to the annular sand-carrying fluid, and the internal energy generated during the flow of the foam sand-carrying fluid:
ρ m ( T 3 ) c 3 ( T 3 ) T 3 t = ρ m ( T 3 ) c 3 ( T 3 ) V m T 3 z + 2 h 3 ( T 3 , T 4 ) T 4 T 3 r 3 r 3 2 r 2 2 + 2 h 2 ( T 2 , T 3 ) T 2 T 3 r 2 r 3 2 r 2 2 + q 2 π r 3 2 r 2 2 m L c 3 ( T 3 ) T 3 A a n · δ ( z z f )
4.
Wall of the production casing
Convective heat transfer between the production casing wall and the sand-carrying fluid in the annulus, as well as heat conduction from the formation to the production casing:
ρ 4 c 4 ( T 4 ) T 4 t = 1 r r λ ( T 4 ) r T r + 2 h 3 ( T 3 , T 4 ) T 3 T 4 r 3 r 4 2 r 3 2
where c1(T1), c2(T2), c3(T3), and c4(T4) denote the temperature-dependent specific heat capacities of the foam fluid, coiled tubing wall, sand-carrying fluid, and production casing wall, respectively. And m L is the lumped-point leakoff mass flow rate. And δ(z − zf) is the Dirac delta function, indicating that leakoff occurs at location zf. And ρ2, ρ4 are the densities of the medium on the coiled tubing wall and the production casing wall, and T1, T2, T3, T4 are temperatures of the foam fluid, coiled tubing wall, sand-carrying fluid, and production casing wall. And h1(T1,T2), h2(T2,T3), h3(T3,T4) are the convective heat transfer coefficients at the inner wall of the coiled tubing, the outer wall of the coiled tubing, and the inner wall of the production casing, respectively, and r1, r2, r3, r4 are inner and outer diameters of the coiled tubing, and the inner and outer diameters of the production casing, and q 1, q 2 are the internal energy changes in the coiled tubing fluid and annulus fluid micro-segment.

2.2.4. Auxiliary Equations

Based on the law of real gases, the fluid state equations for the sand-flushing operation can be derived for the foam per unit mass as follows [36].
Inside the coiled tubing:
p v F = W G z R T M + p 1 W G v L
In the annulus:
p v F = p W L v L + W S v S + W G z R T M
In foam sand-flushing operations, the critical sand-carrying velocity in the annulus is a key parameter that directly determines the sand-transport efficiency and whether sand particle settling occurs. To calculate the minimum annular return velocity, the terminal settling velocity of the sand particles must first be determined. To simplify the calculation, the terminal settling velocities of sand particles under different sand-carrying flow regimes in a vertical wellbore are calculated according to the particle size range [37].
  • Settling in the laminar flow regime (Res ≤ 1)
    d p 1.225 μ 2 ρ l ( ρ s ρ l )
    v t = g ( ρ s ρ l ) d p 2 18 μ
  • Settling in the transitional flow regime (1 < Res ≤ 500)
    0.915 μ 2 ρ l ( ρ s ρ l ) 1 3 d p 20.4 μ 2 ρ l ( ρ s ρ l ) 1 3
    v t = 1.195 d p ( ρ s ρ l ) 2 / μ ρ l 1 3
  • Settling in the turbulent flow regime (500 < Res ≤ 2 × 10⁵)
    20.4 μ 2 ρ l ( ρ s ρ l ) 1 3 1105 μ 2 ρ l ( ρ s ρ l ) 1 3
    v t = 5.39 d p ρ s ρ l / ρ l
Considering a certain safety margin, three times the terminal settling velocity in a vertical wellbore is taken as the minimum suspension velocity in a fully horizontal wellbore. Since sand transport is most difficult at a well inclination of 60°, and the critical sand-carrying velocity at 60° is approximately twice that in a fully horizontal wellbore [37], the critical sand-carrying velocity in the horizontal well can be expressed as:
v min = 6 v t

3. Model Solving

3.1. Basic Data of Example Wells

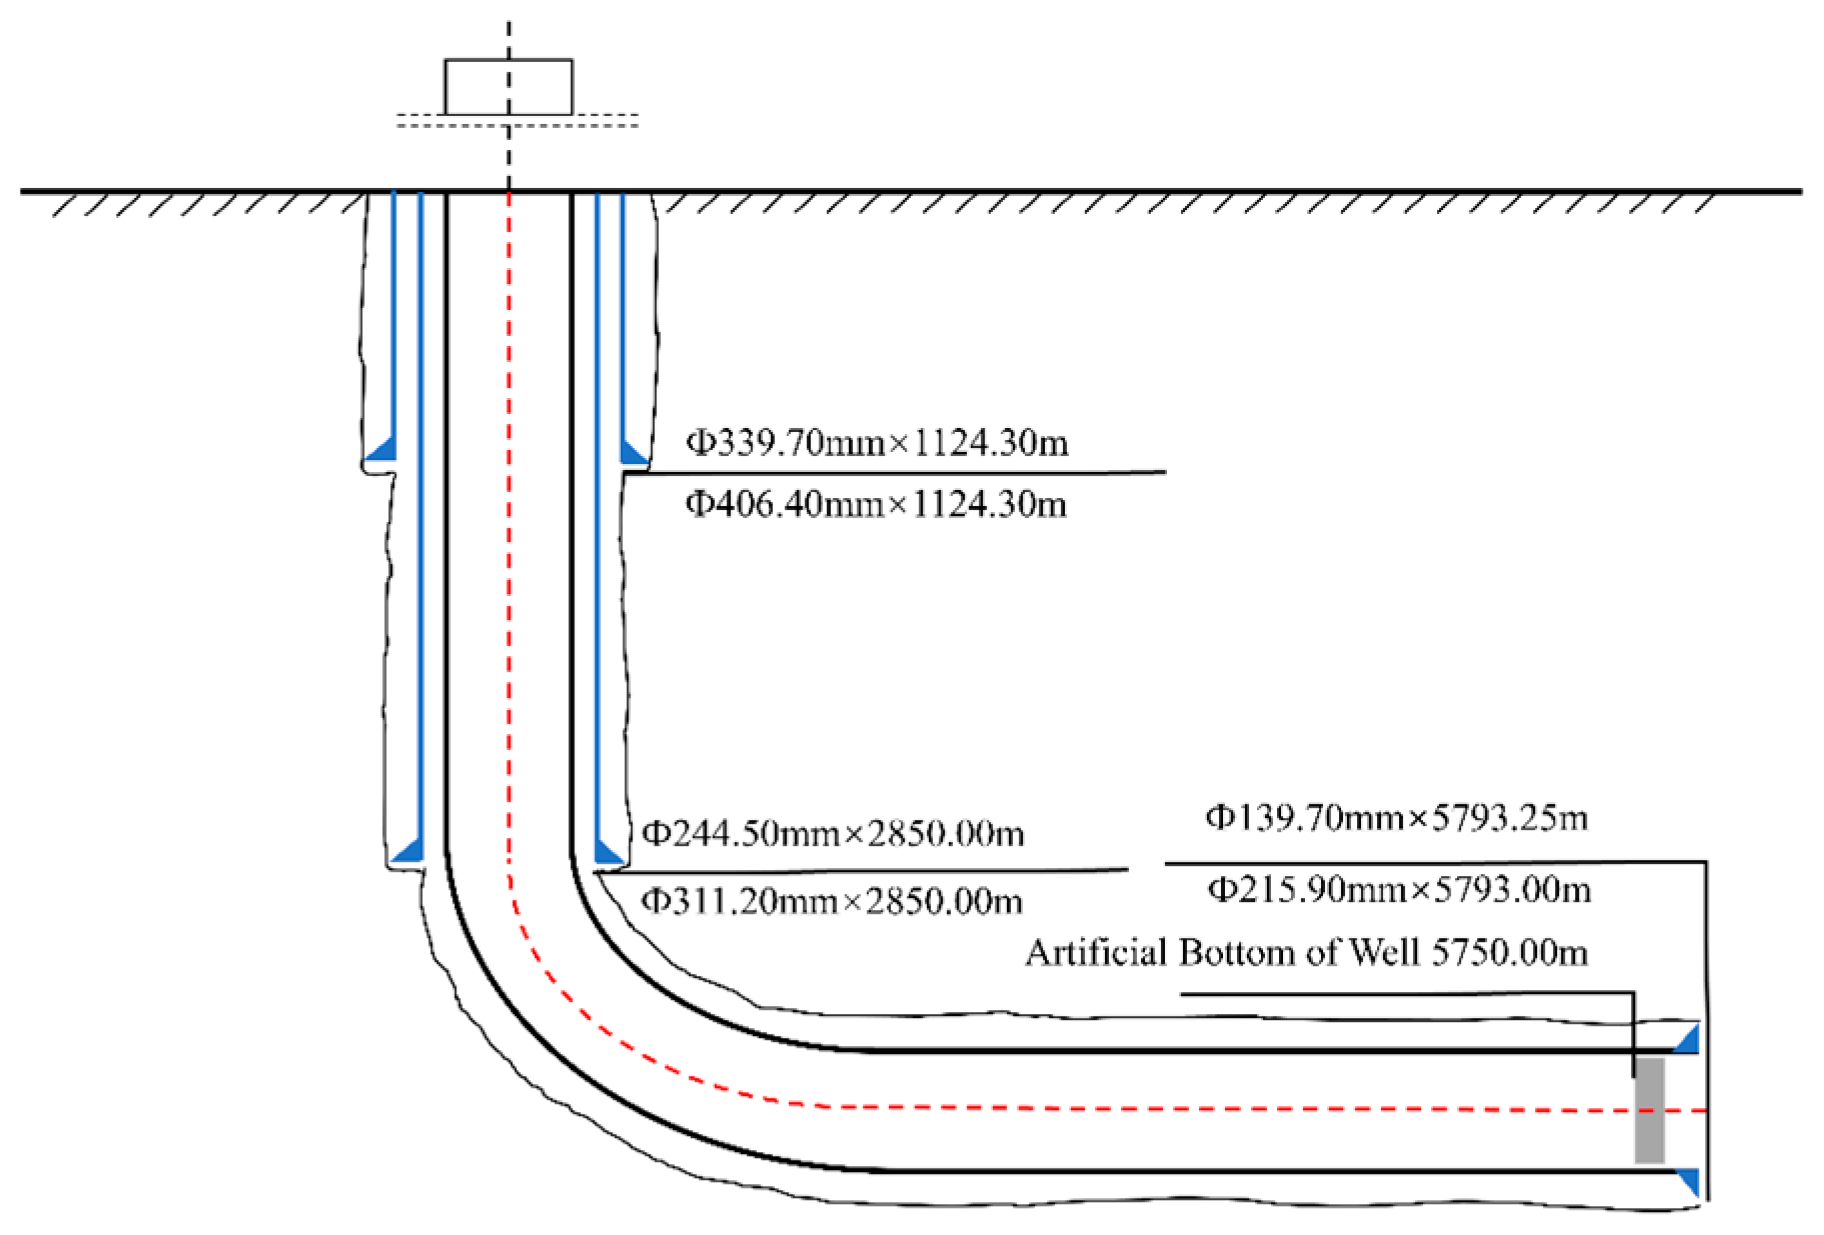
The example well is a shale gas horizontal well with an original formation pressure of 30 MPa. The wellbore structure parameters are shown in Figure 6, and the string and operational data are shown in Table 1.

3.2. The Variation Law of Fluid Parameters and Pressure Throughout the Whole Working Process

The above mathematical model was solved using the basic data from the example well (Table 1) to simulate and calculate the fluid parameters and pressure variations throughout the whole working process of the coiled tubing foam sand-flushing operation. Table 2 shows the simulated results of the construction pump pressure, foam flow rate, foam quality, and full circulation time.
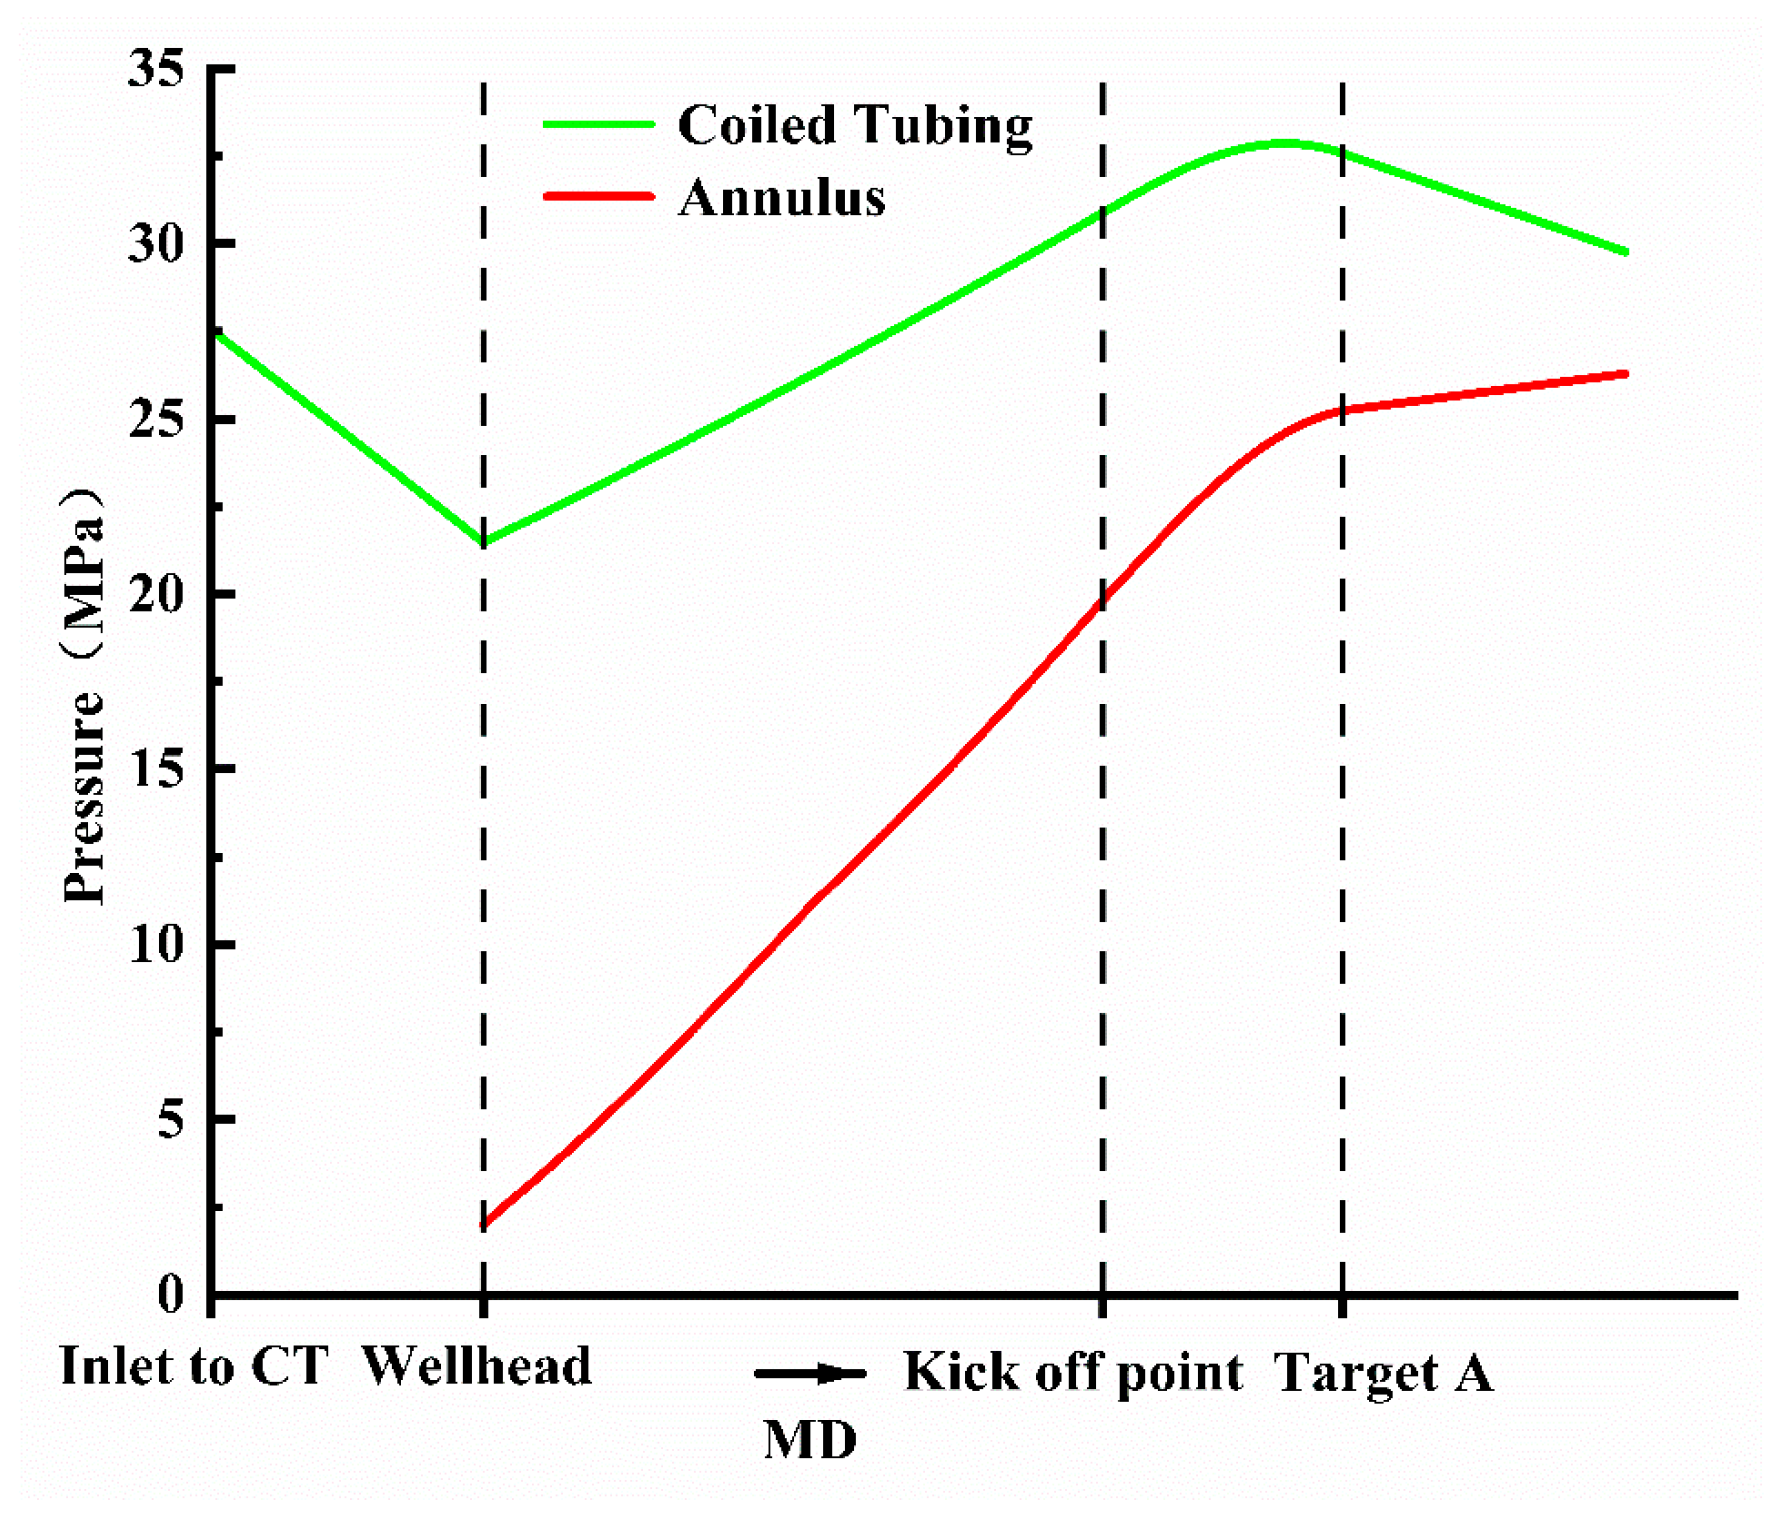
The pressure distribution profiles in the coiled tubing and the annulus during foam sand-flushing were calculated based on the above foam hydraulic model, as shown in Figure 7.
In Figure 7, the pressure variation laws within each section throughout the entire sand-flushing operation are all different. In the ground spiral section of the coiled tubing, the pressure gradually decreases. The pressure decreases with the increasing coiled tubing length. This is because the fluid in the spiral section is minimally affected by gravity, and the main pressure drop is caused by friction. After entering the vertical section, the pressure increases with increasing well depth. After the Kick-off Point, the pressure first increases and then decreases. After entering the horizontal section, the pressure continues to decrease because, after passing the Kick-off Point, the influence of gravity on the pressure gradually decreases, and friction dominates the pressure change.
The flow direction of the fluid in the annular section is from the bottomhole to the wellhead, and the annular pressure increases with the increasing well depth. After reaching the Kick-off Point, the growth rate gradually slows down. This is because after entering the Kick-off Point, the effect of gravity on the pressure gradually decreases, and friction dominates the change in pressure.
The Bottomhole Annular Pressure is different from the pressure inside the coiled tubing because the tail of the coiled tubing is connected to the sand-flushing tool, and the difference here is exactly the pressure drop of 3.48 MPa in the jet section of the sand-flushing tool.
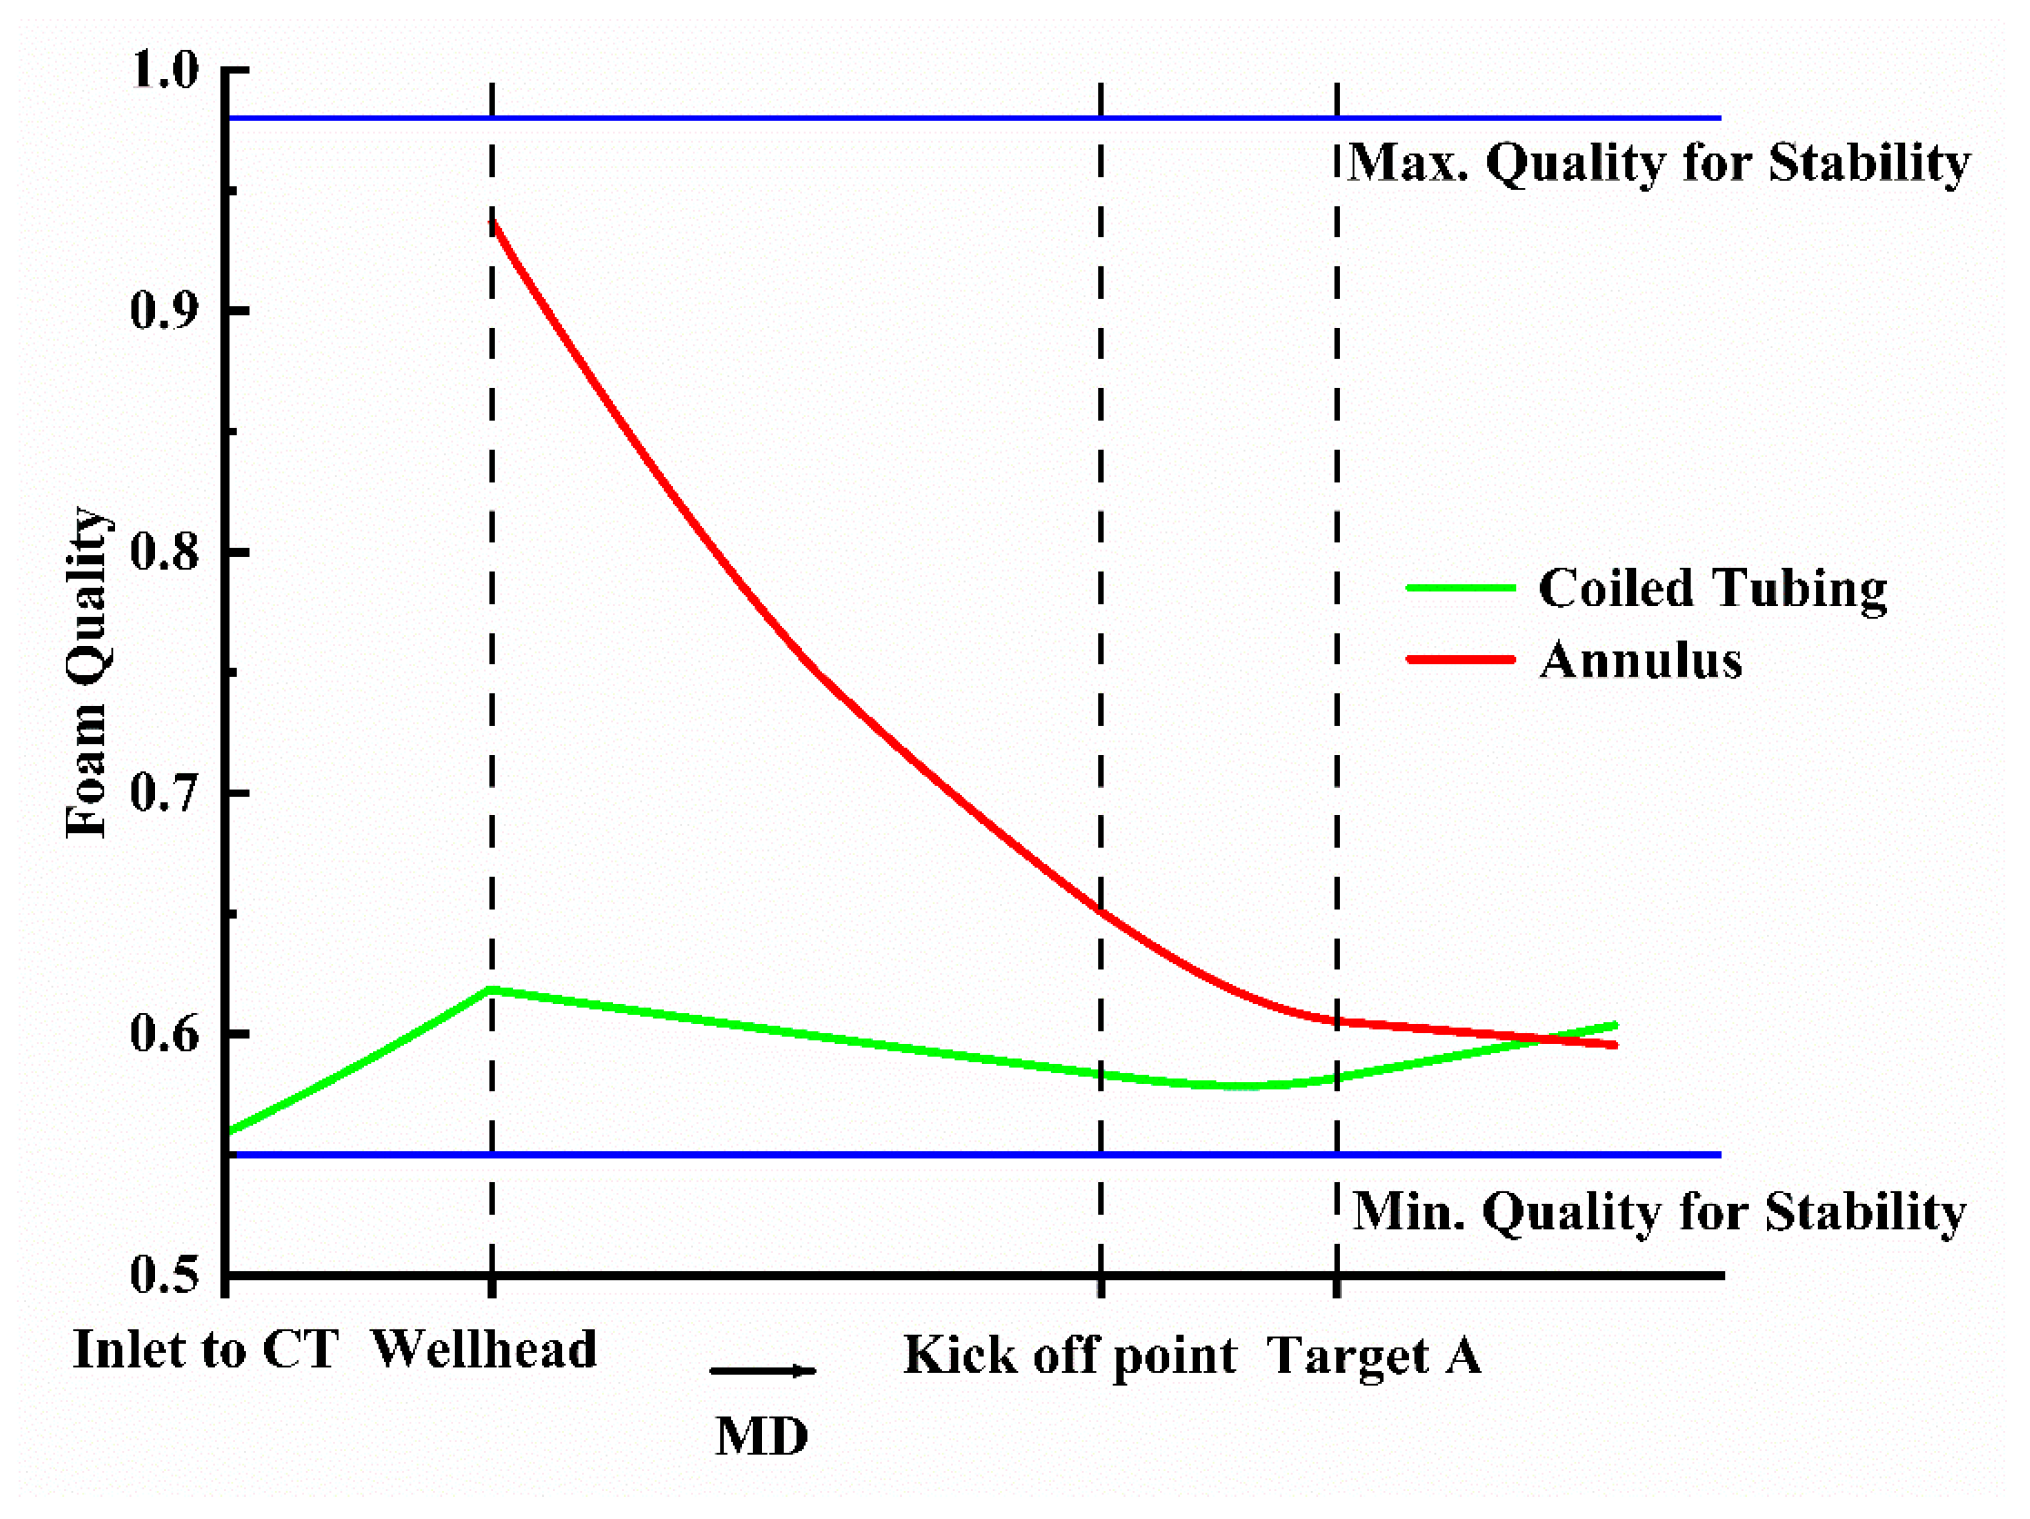
To ensure that the foam remains stable throughout the whole working process, the foam quality should be within the range of 0.55 to 0.98.
Figure 8 shows the foam quality distribution curve throughout the whole working process. At the same depth, the foam quality in the annulus is almost always higher than that inside the coiled tubing. The foam quality in the annulus decreases with the increasing well depth. Since the gas phase in the foam fluid is compressible, the foam quality is mainly determined by pressure, the deeper the wellbore, the higher the pressure. The compressed gas causes the foam quality to decrease, and the foam quality reaches its minimum at the bottomhole.
In the spiral section of the coiled tubing, the pressure decreases continuously, and the foam quality increases gradually. After entering the straight pipe section, although the foam quality also shows a downward trend, the decline in the straight section of the coiled tubing is relatively gentle compared to the decline in the annulus section; this is because the pressure change in the coiled tubing is relatively small. From the Kick-off Point, the foam quality begins to show a trend of first decreasing and then gradually increasing because, after entering the inclined section, the pressure first increases and then gradually decreases.
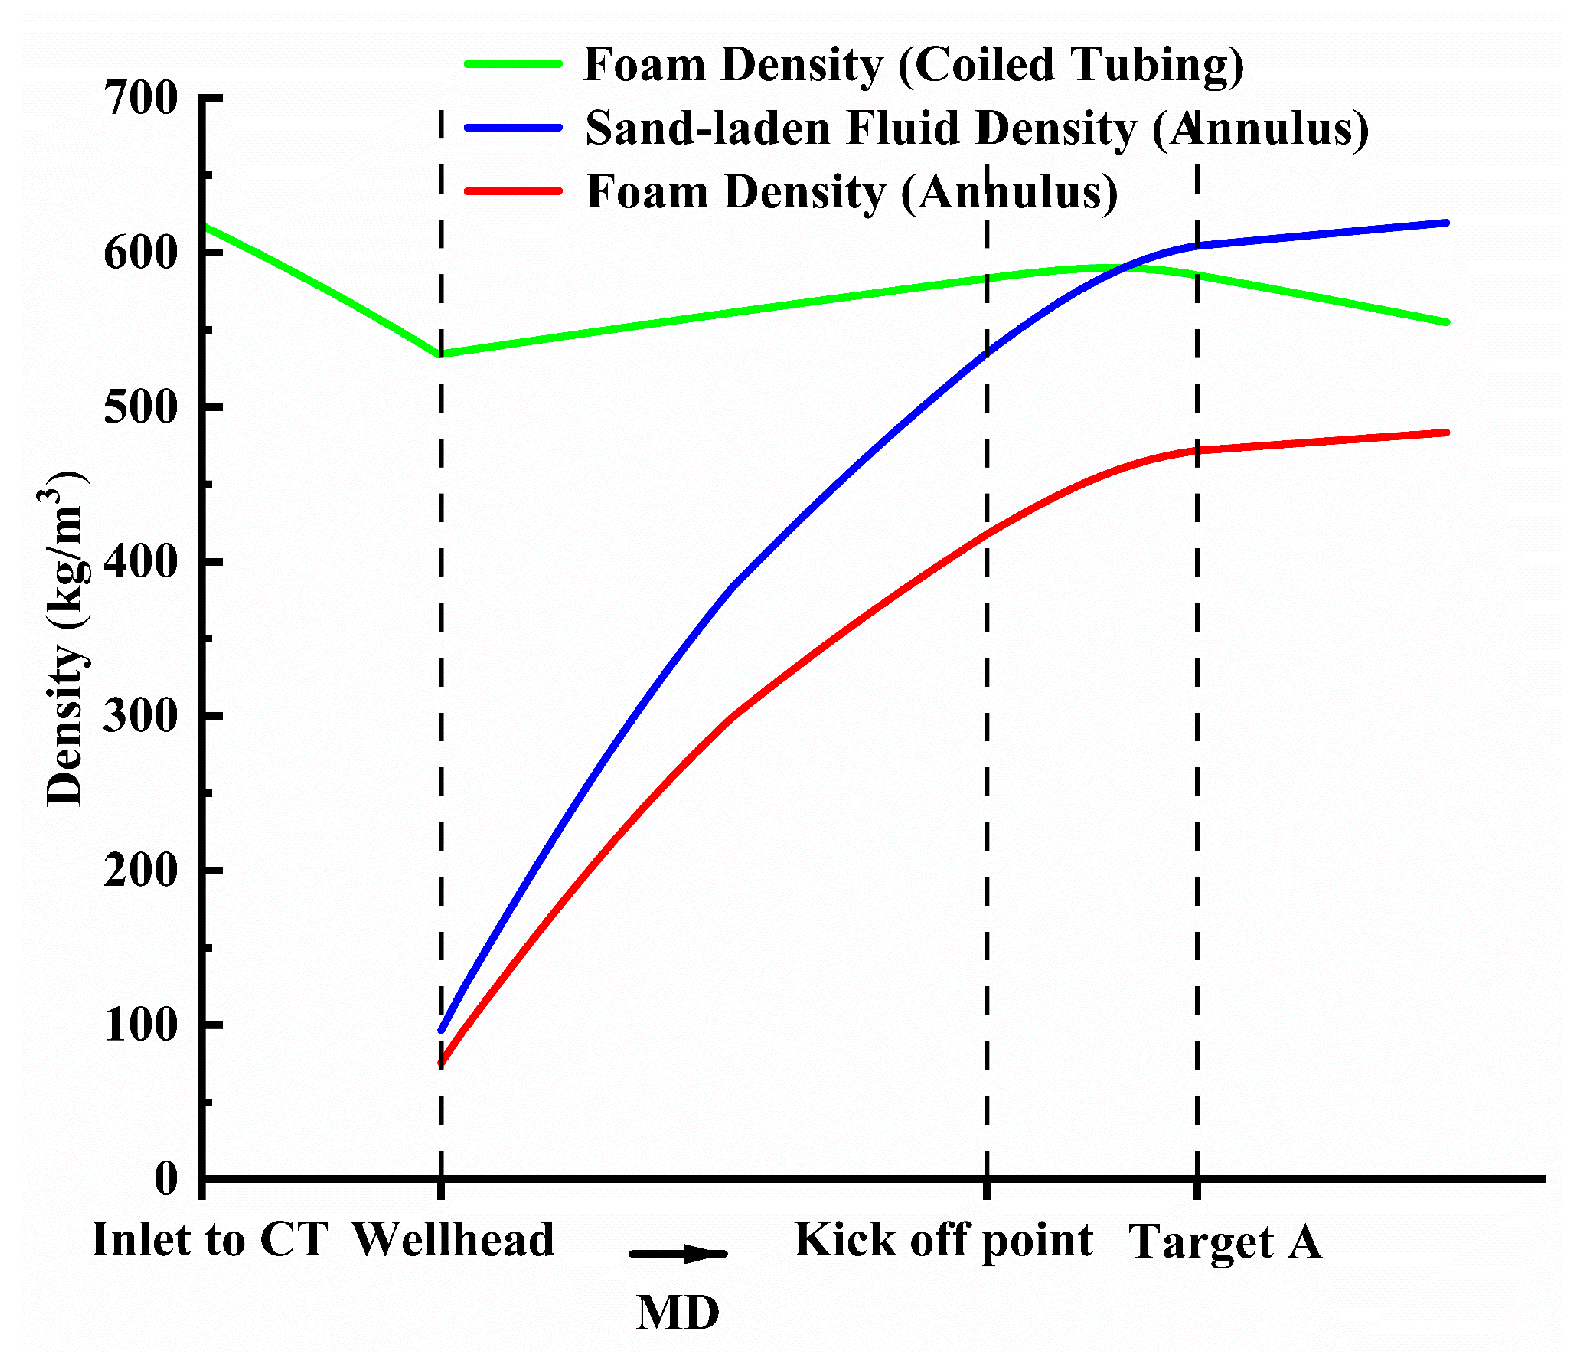
Figure 9 shows the variation in working-fluid density during the entire operation. At a given depth, the foam density in the tubing is always higher than that in the annulus and decreases with increasing foam quality. Moreover, the foam density remains significantly lower than that of water throughout the operation, highlighting the inherently low-density of foam fluids.
The vertical separation between the blue curve, representing the density of the sand-carrying fluid, and the red curve, representing the foam density, reflects the density increment caused by the presence of sand, specifically, the local sand concentration. The relatively large separation at the bottomhole suggests that, under high-pressure conditions, the foam is highly compressed and the sand particles are present at a high concentration, corresponding to a high solids loading. Near the wellhead, however, this separation becomes much smaller, indicating that as the fluid ascends and the gas phase expands, the annular velocity increases and the sand particles are effectively diluted, suspended, and carried to the surface.
This demonstrates the superior sand-suspension and sand-transport capability of foam fluids, which rely on the high annular velocity induced by gas expansion to carry sand out of the wellbore.
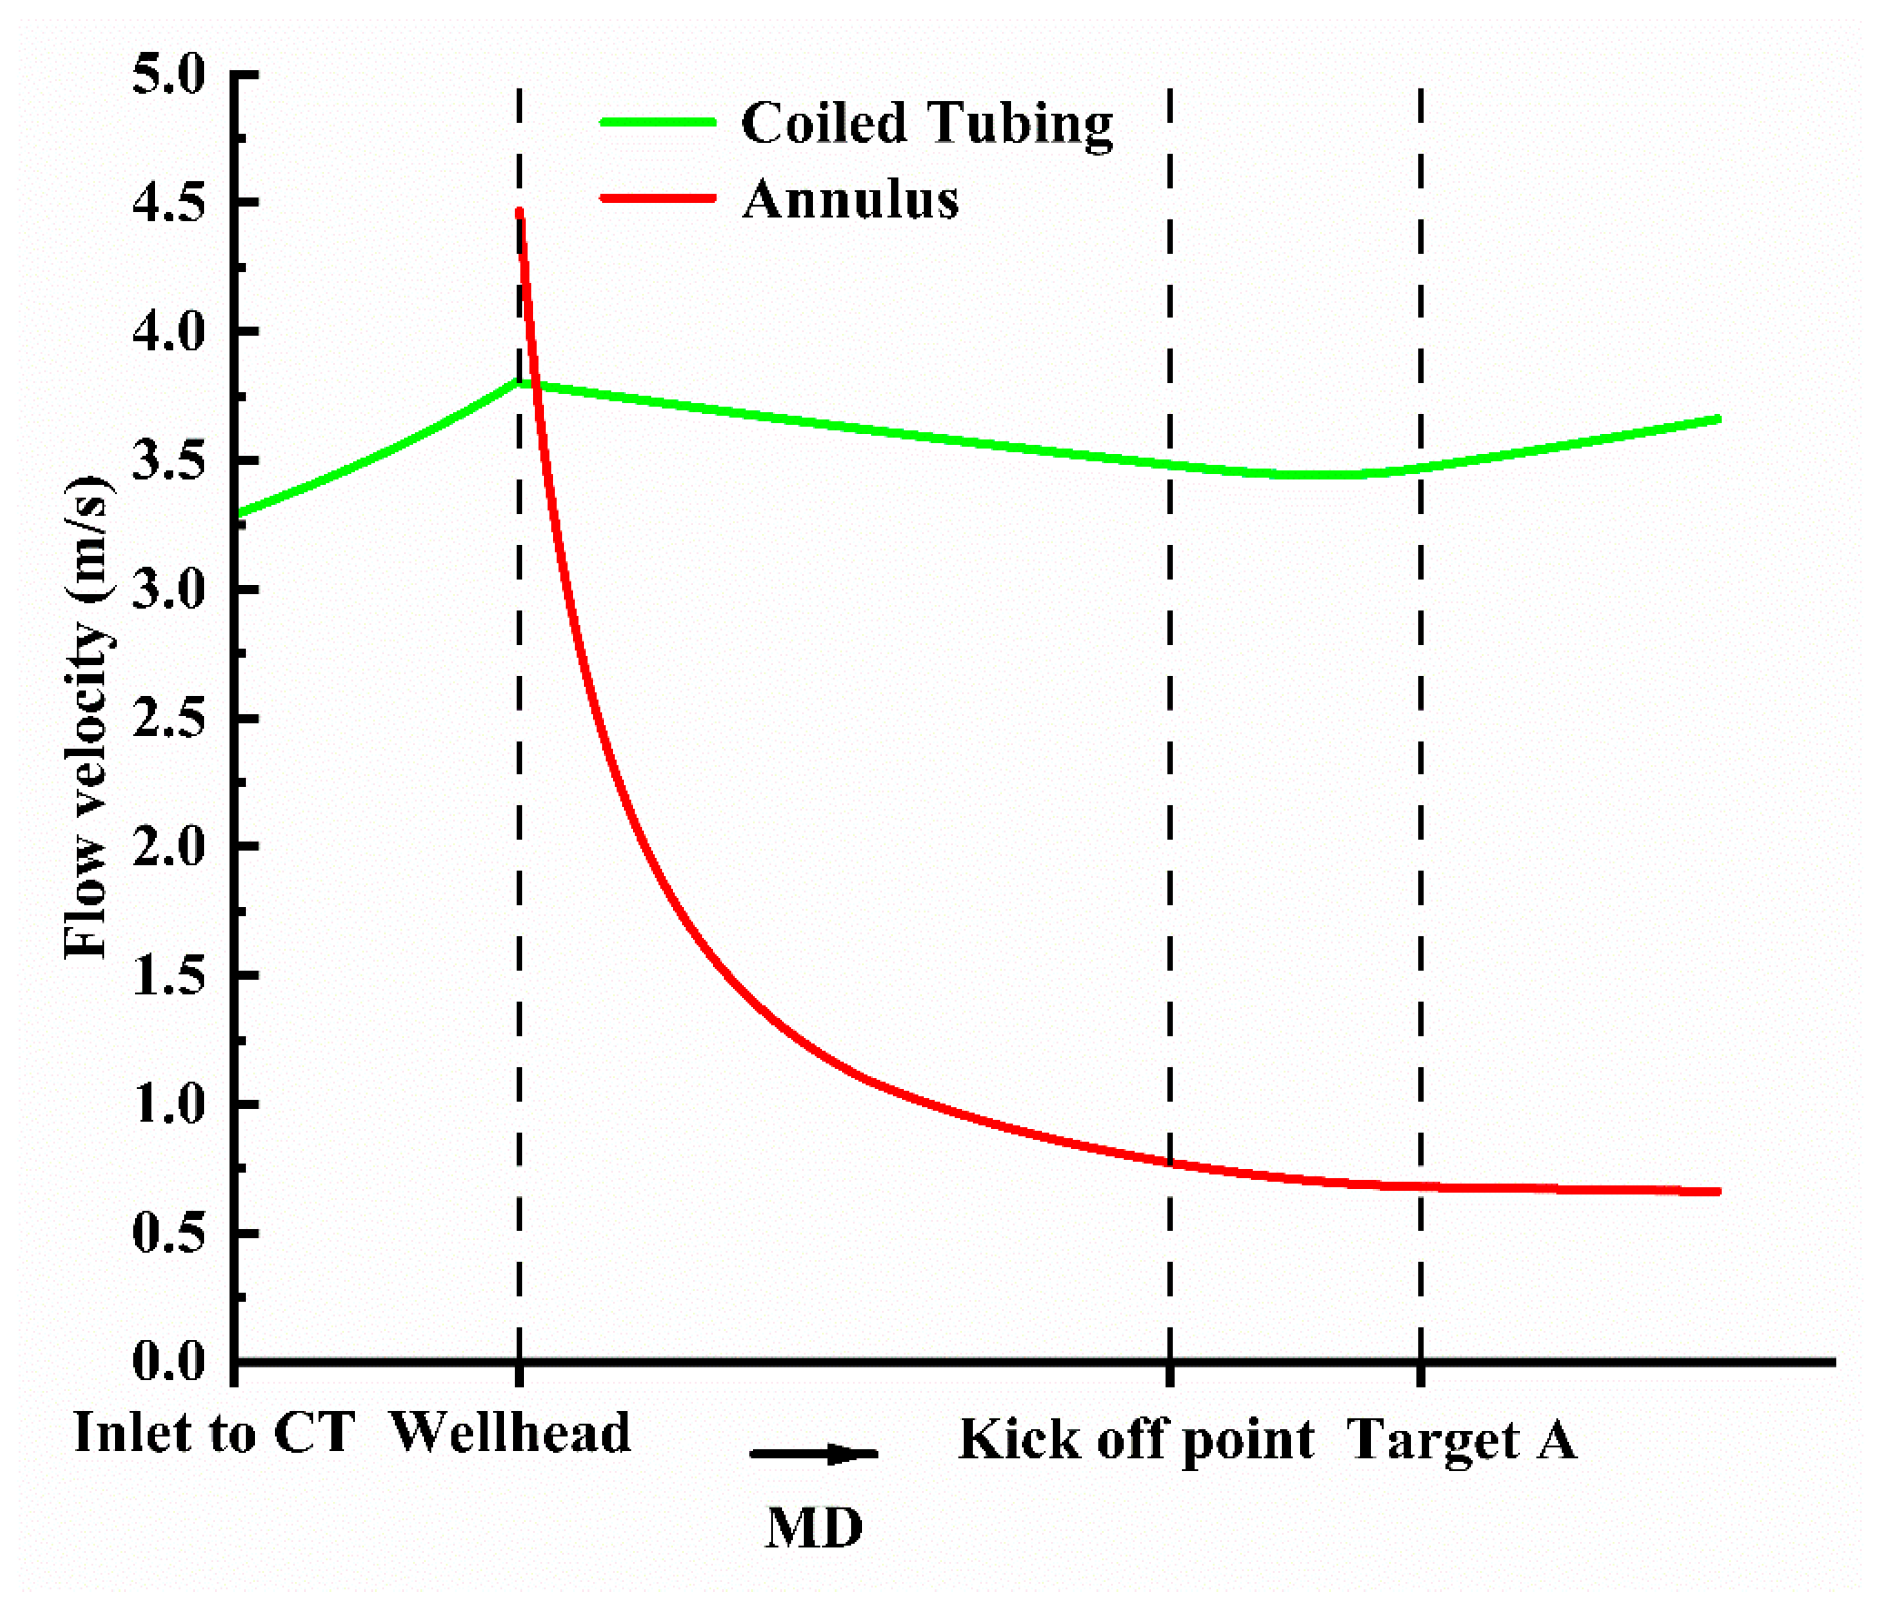
In Figure 10, the flow velocity variation law in the coiled tubing is opposite to the pressure variation. In the ground spiral section, it increases with the increase in coiled tubing length. Upon entering the wellbore, it decreases in the vertical section as the well depth increases. When entering the inclined section, the flow velocity first decreases and then increases and continues to increase within the horizontal section.
The annular velocity decreases as well depth increases. However, the reduction varies across different well sections. In the vertical section, the flow velocity first decreases rapidly and then gradually slows down, and in the inclined section, the flow velocity changes very little. The annular return velocity at the bottom hole is the smallest at 0.62 m/s, which is much higher than the critical sand-carrying velocity. Therefore, in order to ensure the efficiency of sand-carrying, it is appropriate to use the bottomhole annular return velocity to determine whether the sand can be effectively carried.

3.3. Validation of Model Results

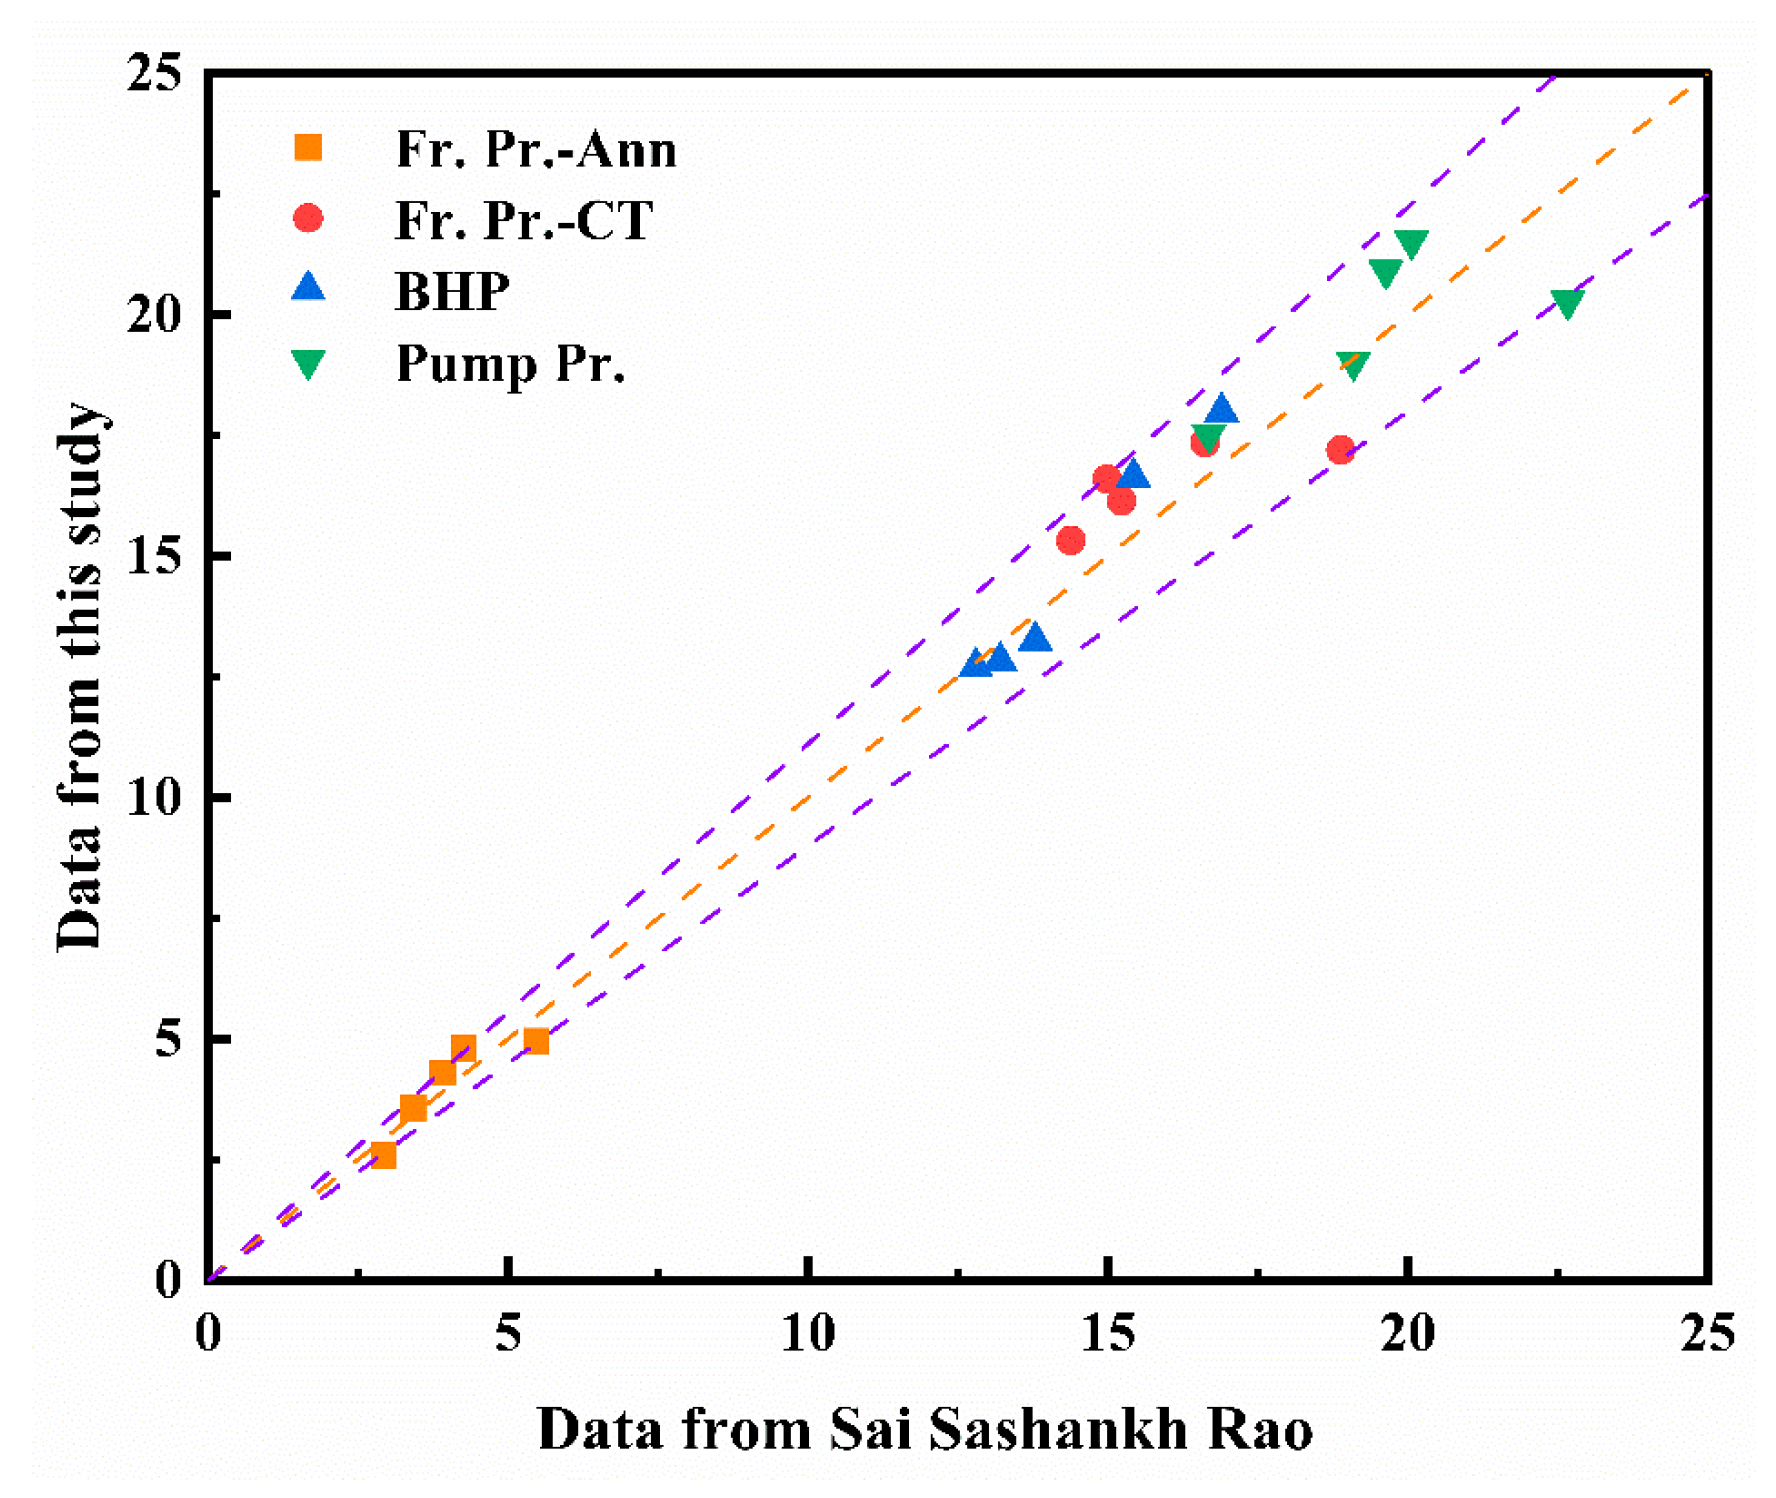
To verify the accuracy of the proposed model, the wellbore configuration and basic operating parameters reported in the literature [38] were adopted, and the calculated results obtained from the model developed in this study were compared with the corresponding predictions results reported in the literature. The deviations were all within 10%, which satisfies the requirements for engineering accuracy, as shown in Figure 11.

4. Model Application

The proposed model is applied below to a representative foam sand-flushing operation without leakoff. The model serves two main purposes:
  • Under known formation and wellbore conditions, it is used to determine whether stable foam sand-flushing can be achieved by ensuring foam stability throughout the wellbore, verifying that the bottomhole pressure satisfies the operational requirements, and ensuring that the total circulation time remains below the foam half-life, which is set to 130 min in this study.
  • Once the operation is confirmed to be feasible, the model is used to optimize the sand-flushing rate by adjusting the operating parameters to maximize the coiled-tubing running speed.

4.1. Feasibility Evaluation of Sand-Flushing Operation

For the given well conditions, the current formation pressure is assumed to have declined to 17 MPa. To evaluate whether leakoff-free sand-flushing can be achieved under this condition, the operating parameters are adjusted so that both the bottomhole pressure and the total circulation time meet the required criteria.
The results in Table 3 show that, under the first operating scheme, the foam quality and total circulation time both fall within the acceptable ranges, but the bottomhole pressure exceeds the allowable range for near-balanced sand-flushing, which would induce formation leakoff. In the second operating scheme, the annular backpressure is reduced; however, the foam quality reaches the upper stability limit, and the bottomhole pressure still does not meet the requirements In the third operating scheme, the injected gas and liquid rates are further reduced while the annular backpressure is lowered again. Under these conditions, the bottomhole pressure, foam quality, and total circulation time all satisfy the operational requirements. Therefore, when the formation pressure depletion is 17 MPa, stable near-balanced foam sand-flushing without leakoff can be achieved.
For low-pressure formations, stable leakoff-free foam sand-flushing requires a combination of high foam quality and a sufficient pump rate. This not only helps reduce the bottomhole pressure but also increases the fluid velocity to ensure that the total circulation time remains within the allowable range. In addition, the annular backpressure plays a decisive role because it directly controls the bottomhole pressure. As indicated by the fourth operating scheme, the lowest attainable bottomhole pressure for stable near-balanced foam sand-flushing without leakoff is obtained through the coordinated adjustment of the operating parameters. This further indicates that, for the given wellbore configuration, such an operation becomes infeasible once the formation pressure declines to approximately 16.5 MPa.

4.2. Optimize the Sand-Flushing Rate

The sand flow rate is mainly controlled by changing the coiled-tubing running speed and the degree of sand plugging in the horizontal section of the casing, which is studied here at a formation pressure of 24 MPa. As shown in Table 4, the first construction parameter can provide a stable foam sand-flushing operation for the well. Based on this situation, we optimize the construction parameters to achieve the maximum sand-flushing rate in the well.
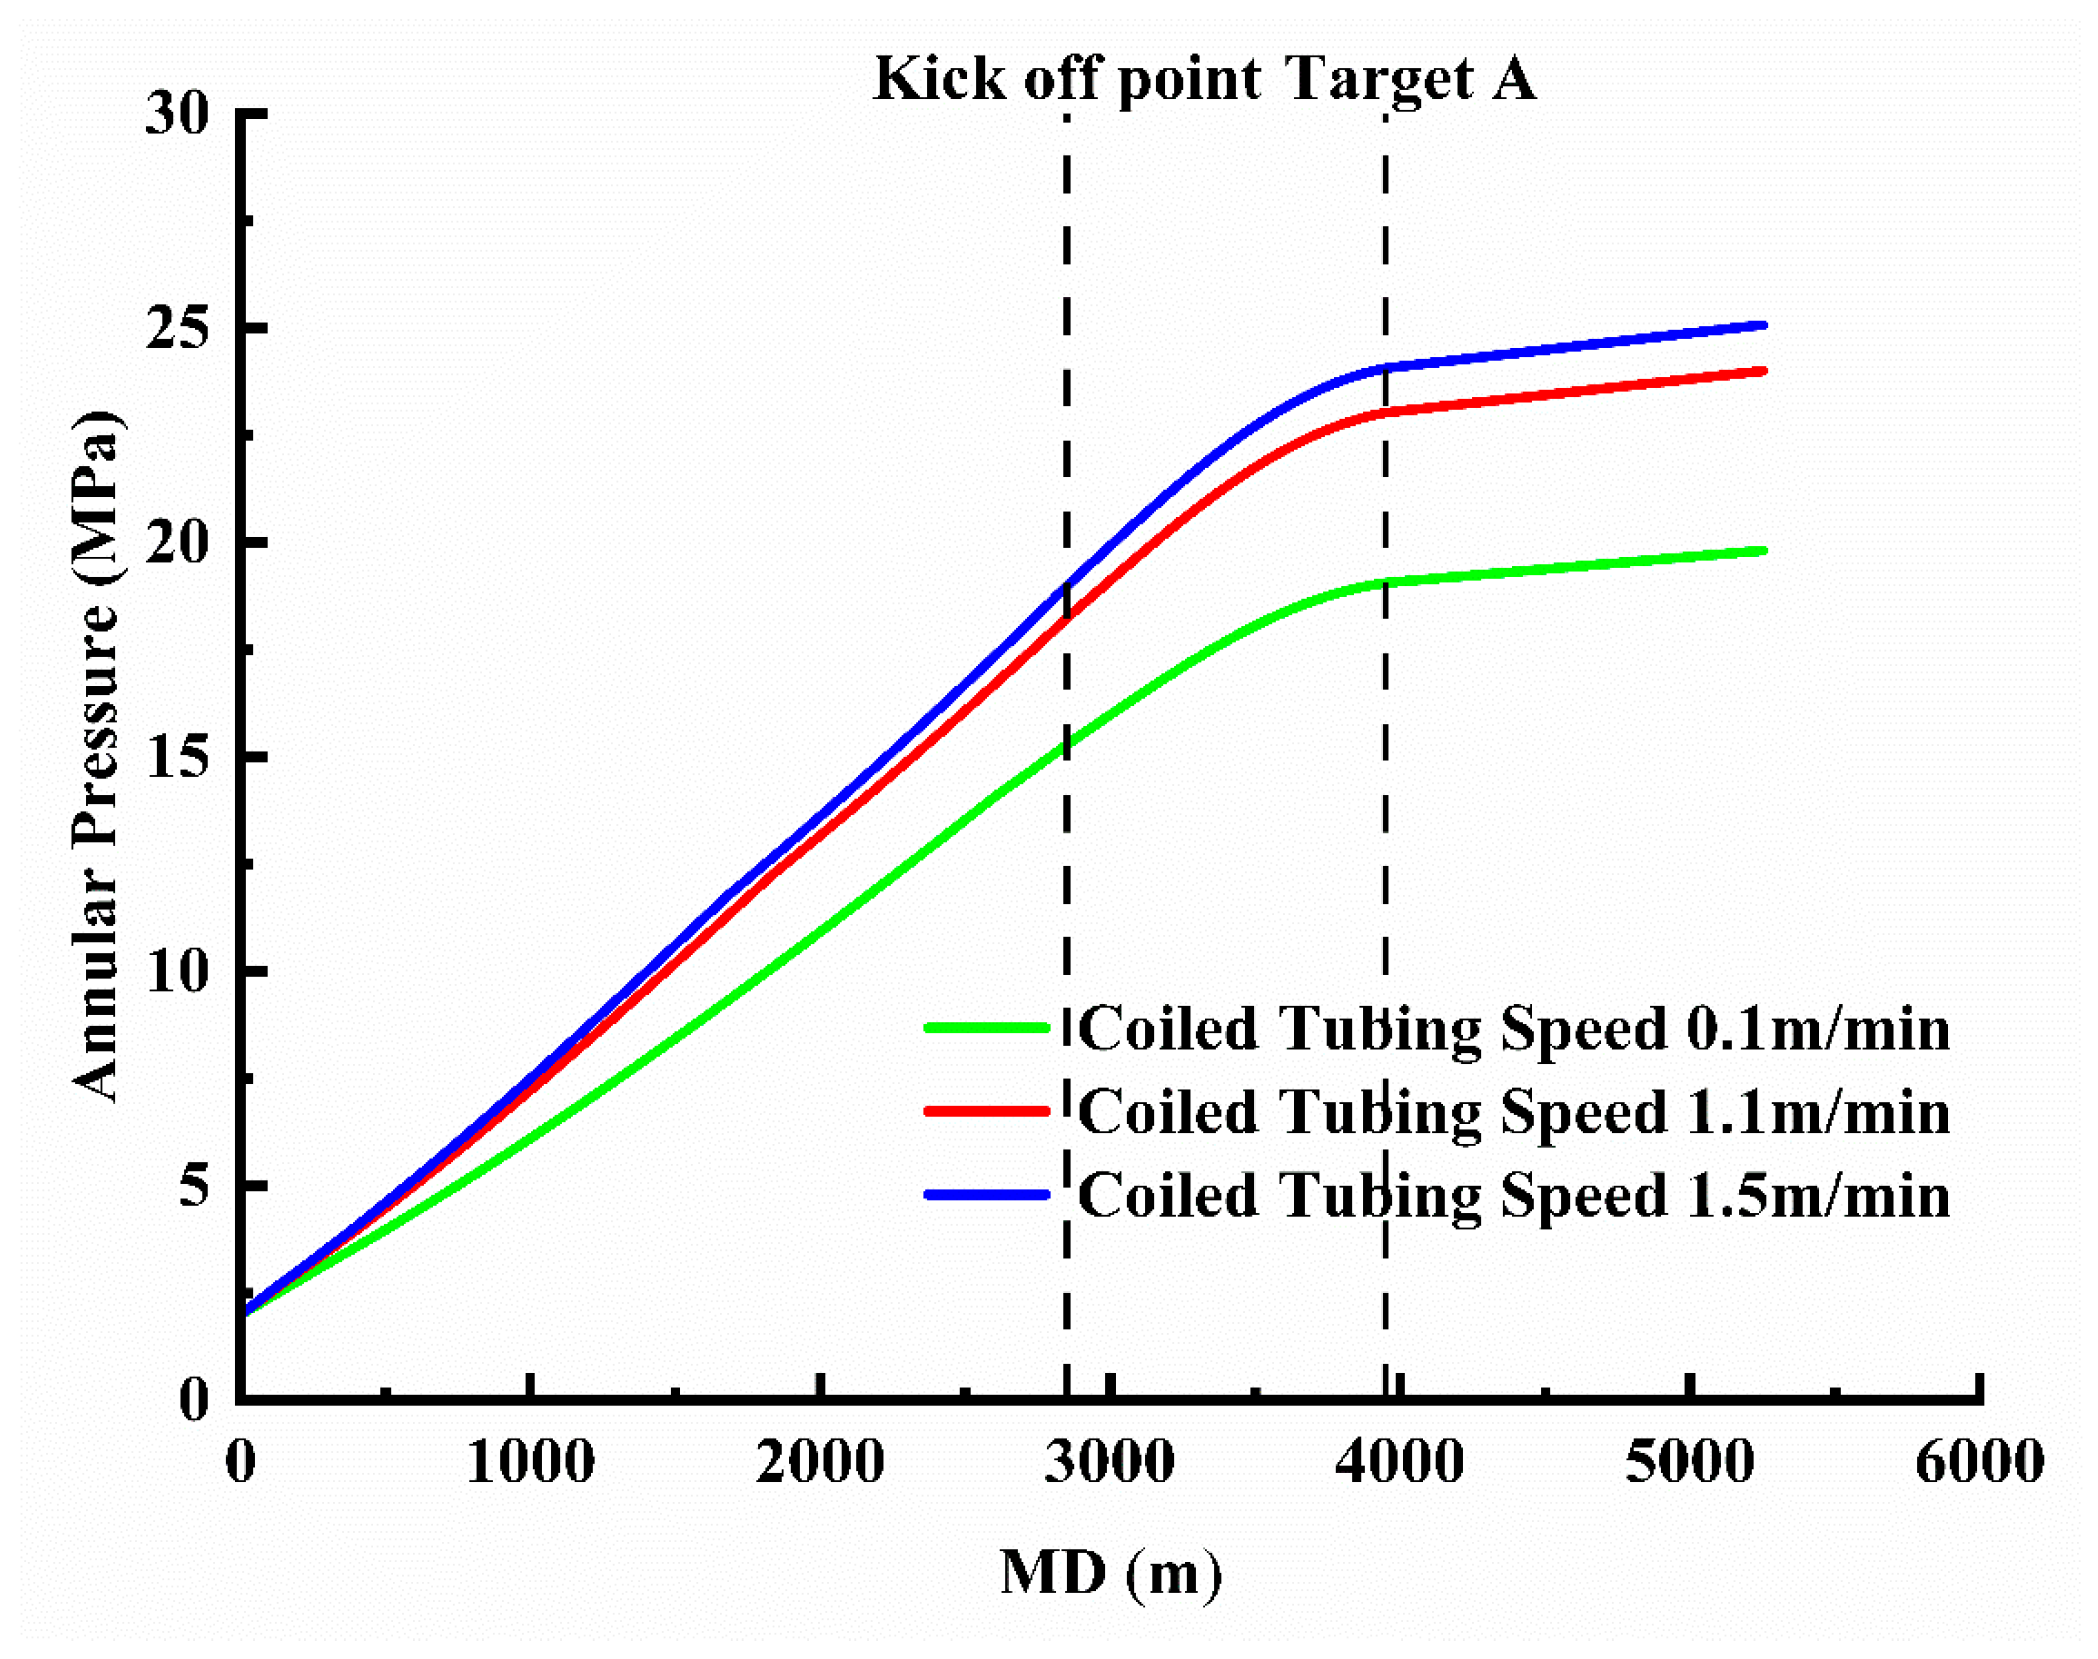
The bottom hole pressure is mainly affected by annular backpressure and the coiled-tubing running speed. Therefore, optimization was carried out on the basis of the first construction parameter. Firstly, the coiled tubing running speed was increased to 1.1 m/min, which led to an increase in both pump pressure and the bottomhole pressure as well, as shown in the second construction parameter in Table 4.
When the running speed is further increased to 1.5 m/min, the bottomhole pressure exceeds the formation pressure, but by less than 1 MPa, which still satisfies the criterion for near-balanced sand-flushing. Any further increase in running speed would result in significant formation leakoff. Therefore, under constant annular backpressure, the maximum allowable coiled-tubing running speed is 1.5 m/min.
A higher running speed can be achieved by reducing the annular backpressure, as shown in the fourth operating scheme, so that the foam quality approaches its upper stability limit. Under this condition, and without changing the injected gas and liquid rates, the maximum allowable running speed increases to 1.8 m/min. A further reduction in annular backpressure would cause the foam quality to exceed the stability limit. This demonstrates that proper annular backpressure is essential for maintaining foam stability throughout the system. Although reducing annular backpressure can lower bottomhole pressure, it also increases the foam quality in the annulus, particularly near the annular outlet, where the foam may become unstable and collapse, thereby reducing the sand-carrying efficiency.
Alternatively, a higher running speed may be obtained by increasing the injected gas and liquid flow rates; however, this also increases both the pump pressure and the bottomhole pressure, as shown in the fifth operating scheme. Overall, increasing the pump rate increases the working-fluid velocity and reduces the total circulation time, but also slightly raises the bottomhole pressure. The inlet foam quality directly influences the bottomhole pressure, whereas the foam quality within the wellbore is mainly controlled by the annular backpressure. As demonstrated by the sixth to eighth operating schemes, further improvement in coiled-tubing running speed requires coordinated increases in pump rate and inlet foam quality, together with optimized annular backpressure, so that both foam quality and bottomhole pressure remain within acceptable limits. Under the eighth operating scheme, the operation reaches its limit, with a maximum coiled-tubing running speed of 2.35 m/min.
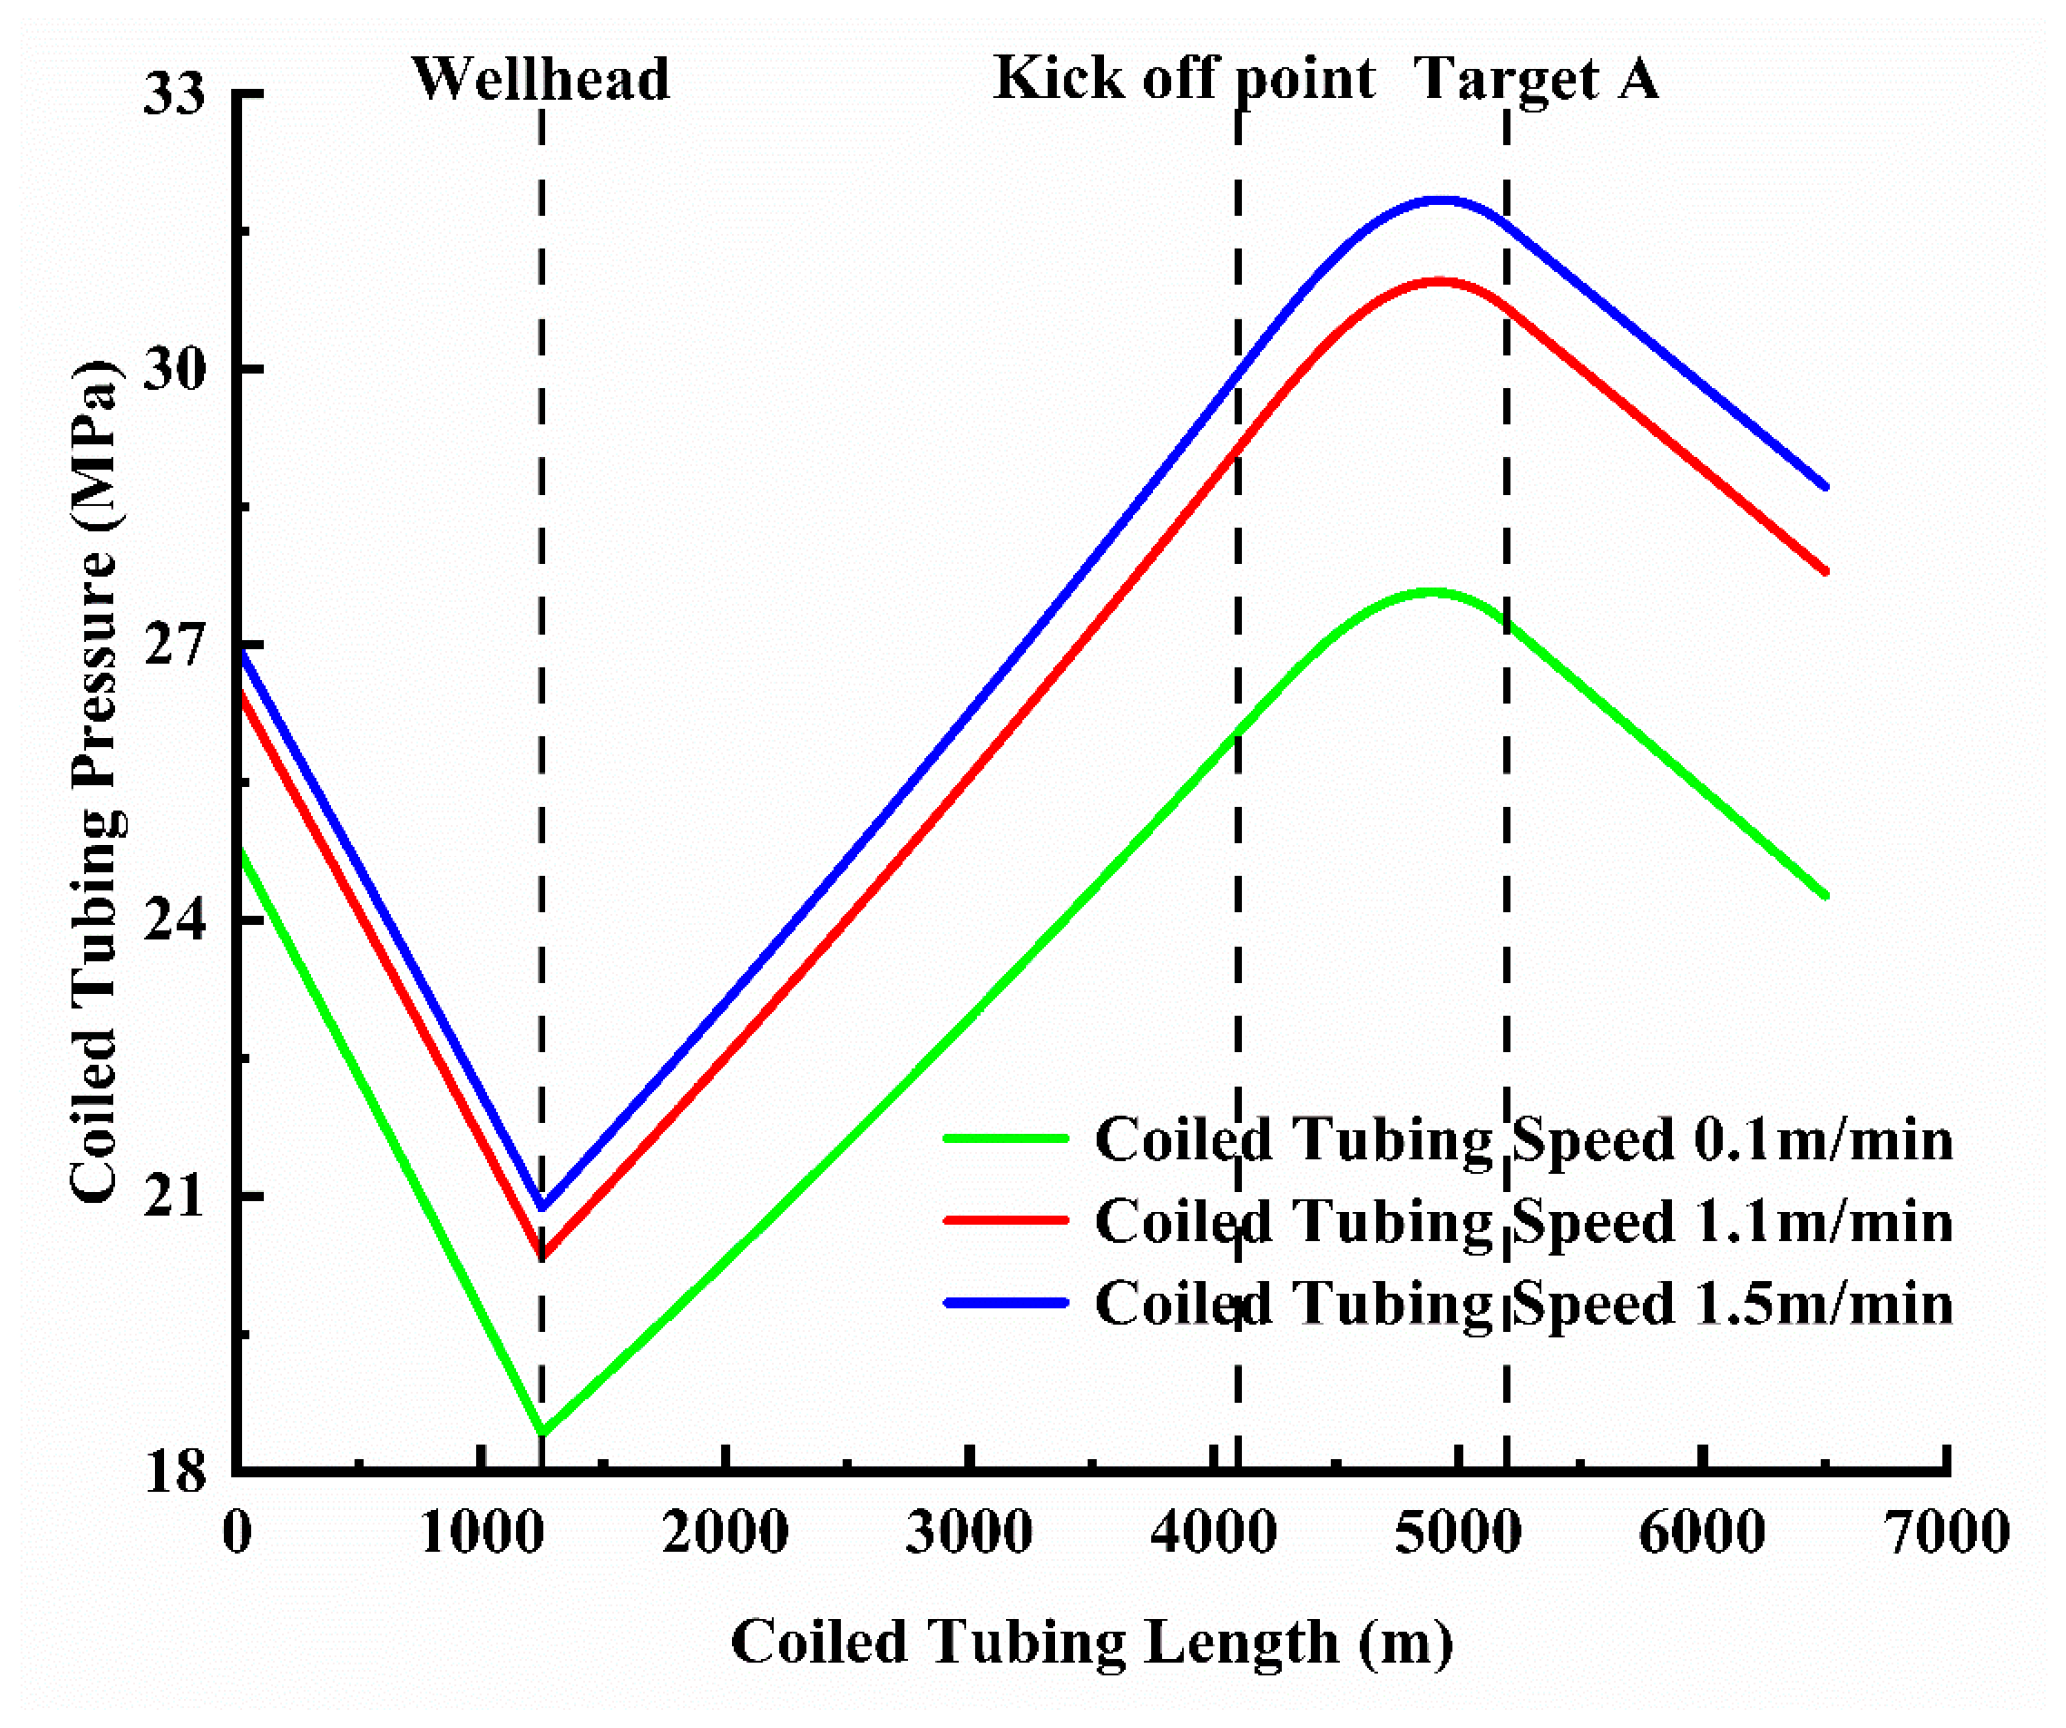
Based on the first three sets of construction data, wellbore pressure distribution diagrams are drawn, as shown in Figure 12 and Figure 13, which clearly illustrate the effects of different coiled-tubing running speed on wellbore pressure. As the coiled-tubing running speed continuously increases, the concentration of sand particles in the annulus increases, and a higher pump pressure is required to lift the sand-carrying fluid from the annulus, which consequently leads to an increase in bottom hole pressure.
The above calculations are based on the ideal case of no leakoff. However, leakoff is unavoidable during sand-flushing operations. Therefore, the following case study is used to illustrate how to determine the leakoff safety factor under given operating parameters, and how to optimize the operating parameters under a specified leakoff coefficient to achieve stable foam sand-flushing. As shown by the first to fourth operating schemes in Table 5, a small amount of leakoff mainly affects the annular fluid velocity, thereby influencing the total circulation time. As the leakoff rate increases, the total circulation time gradually approaches the foam half-life. Further leakoff would lead to foam breakdown, making it impossible to establish an effective circulation. Therefore, under this set of operating parameters, a leakoff rate of 16% is already the operational limit, and stable foam sand-flushing can no longer be achieved at higher leakoff rates. The fifth and sixth operating schemes show that, even at higher leakoff rates, stable foam sand-flushing can still be achieved by increasing the pump rate or reducing the coiled-tubing running speed, thereby increasing the annular working-fluid velocity and reducing the total circulation time.

5. Conclusions

Based on previously developed models, the present model simulates the full operational process of foam sand-flushing, including the coiled-tubing spiral section. The model accounts for the variation in foam properties with temperature and pressure along the wellbore, the effect of coiled-tubing eccentricity inside the casing, and localized fluid leakoff from fractures during sand-flushing by assuming fixed leakoff at multiple specified locations along the horizontal annulus section. On this basis, a one-dimensional steady-state flow model for foam sand-flushing fluid in both the coiled tubing and the annulus of shale gas horizontal wells is established.
According to the model calculations, the foam fluid remains in the laminar-flow regime throughout the entire sand-flushing operation. The annular return velocity of the foam sand-carrying fluid reaches its minimum at the bottomhole. Therefore, in order to ensure effective sand transport, it is more appropriate to use the bottomhole annular return velocity as the criterion for determining whether sand particles can be effectively carried.
The model results indicate that the pressure drop in the coiled-tubing spiral section is significantly greater than that in the straight section. Therefore, in field applications, the selected coiled-tubing unit should be matched to the required operating length, so as to avoid excessive energy loss due to friction in the coiled-tubing spiral section.
The model also clearly shows that the working-fluid density remains at a relatively low level throughout the entire foam sand-flushing operation. This indicates that foam fluids are well suited for near-balanced sand-flushing, as they can effectively reduce formation leakoff and minimize contamination of the near-wellbore formation. Therefore, foam working fluids are highly adaptable to sand-flushing operations in low-pressure formations.

Author Contributions

Writing—original draft, Writing—review and editing, Funding acquisition, J.X.; Conceptualization, Methodology, Software, Writing—original draft, Writing—review and editing, H.Z.; Writing—original draft, Software, Investigation, Formal analysis, Data curation, J.D.; Visualization, Investigation, Data curation, Y.S.; Supervision, Project administration, Conceptualization, Validation, Z.Z.; Writing—review and editing, Methodology, Data curation, Funding acquisition, H.L. All authors have read and agreed to the published version of the manuscript.

Funding

This research was funded by State Key Laboratory of Oil and Gas Reservoir Geology and Exploitation (Southwest Petroleum University) for a Mechanism Study on Oil Recovery by “Activation-Coalescence-Migration” in Complex Reservoirs, grant number PLN2024-20. And by the Foundation of Chongqing University of Science and Technology, grant number YKJCX2520144.

Data Availability Statement

The datasets in this paper are part of an ongoing study and are therefore not readily available. The raw data supporting the conclusions of this article will be made available by the authors on request.

Acknowledgments

The authors gratefully acknowledge the support of Chongqing University of Science and Technology and State Key Laboratory of Oil and Gas Reservoir Geology and Exploitation, for providing the experimental essential equipment and funds to this work. We are grateful to all staff members and colleagues of the institute for their support. We are also thankful to our colleagues and peers for their collaboration, helpful discussions, and moral support during the research. The funder had no role in the study design, data collection and analysis, interpretation of results, writing of the manuscript, or the decision to submit for publication.

Conflicts of Interest

Author Zhenjun Zhang was employed by the company Liaohe Oilfield of CNPC. The remaining authors declare that the research was conducted in the absence of any commercial or financial relationships that could be construed as a potential conflict of interest.

References

  1. Zou, C.; Zhao, Q.; Cong, L. Development progress, potential and prospect of shale gas in China. Nat. Gas Ind. 2021, 41, 1–14. [Google Scholar] [CrossRef]
  2. Zou, C.; Dong, D.; Wang, Y. Shale gas in China: Characteristics, challenges and prospects (II). Pet. Explor. Dev. 2016, 43, 166–178. [Google Scholar] [CrossRef] [Scilit]
  3. Zhang, H.; Li, G.; Huang, Z. Progress of Horizontal Hole Sand Flushing Technology. China Pet. Mach. 2014, 42, 92–96. [Google Scholar] [CrossRef]
  4. Fei, J.; Wang, J.; Yuan, J. Research and application of nitrogen foam sand washing and plugging removal technology for coiled tubing through tubing in low pressure horizontal wells. Xi ‘an Shiyou University, Shaanxi Petroleum Society. In Proceedings of the 2024 International Conference on Oil and Gas Field Exploration and Development I. Petro China Changqing Drilling Chanqing Downhole Technical Operations Company; National Engineering Laboratory for Exploration: Xi’an, China; Development of Low-Permeability Oil and Gas Fields: Xi’an, China, 2024; pp. 1101–1107. [Google Scholar] [CrossRef]
  5. Zhang, K.; Li, B.; Yuan, L. Nitrogen foam continuous sand flushing technique in low-pressure wells with lost circulations. Acta Pet. Sin. 2016, 37, 122–130. [Google Scholar] [CrossRef]
  6. Li, Z.; Tang, X.; Wang, Y. Study on rheological property and stability of DY-1 high-temperature foaming agent. Drill. Prod. Technol. 2005, 28, 91–92. [Google Scholar]
  7. Wan, L.; He, B.; Tang, H. Experimental Study of Sand Carrying Law of Sand Washing Foam Fluid. China Pet. Mach. 2013, 41, 90–93. [Google Scholar] [CrossRef]
  8. Falk, K.; Fraser, B. Concentric Coiled Tubing Application for Sand Cleanouts in Horizontal Wells. J. Can. Pet. Technol. 1998, 37, 46–50. [Google Scholar] [CrossRef] [Scilit] [PubMed]
  9. Sun, X.; Wang, S.; Bai, Y. Study on the rheology of dry foam fracturing fluid using power-law model and modified power-law model. J. Xi ‘Shiyou Univ. (Nat. Sci. Ed.) 2009, 24, 60–66. [Google Scholar]
  10. Li, C.; Zu, Y.; Ma, B. Research on rheological properties of foam. J. Chem. Ind. Eng. 1993, 44, 480–485. [Google Scholar]
  11. Weaire, D. The rheology of foam. Curr. Opin. Colloid Interface Sci. 2008, 13, 171–176. [Google Scholar] [CrossRef] [Scilit]
  12. Edrisi, A.R.; Kam, S.I. A New Foam Rheology Model for Shale-Gas Foam Fracturing Applications. In SPE Canada Unconventional Resources Conference; SPE: Houston, TX, USA, 2012; p. SPE-162709-MS. [Google Scholar] [CrossRef] [Scilit]
  13. Yu, Y.; Soukup, Z.A.; Saraji, S. An experimental study of in-situ foam rheology: Effect of stabilizing and destabilizing agents. Colloids Surf. A Physicochem. Eng. Asp. 2019, 578, 123548. [Google Scholar] [CrossRef] [Scilit]
  14. Wulff, W. Computational methods for multiphase flow. Multiph. Sci. Technol. 1990, 5, 85–238. [Google Scholar] [CrossRef] [Scilit]
  15. Brill, J.P. Multiphase flow in wells. J. Pet. Technol. 1987, 39, 15–21. [Google Scholar] [CrossRef] [Scilit]
  16. Singh, A.; Bharti, S.K.; Saxena, N.V. A Review on Multiphase Models and Multiphase Flow Problems at Different Flow Sections. Int. J. Sci. Res. Sci. Eng. Technol. 2017, 3, 643–646. [Google Scholar]
  17. Liu, T.; Ren, G.; Zhong, H. A Mechanism Model for Multiphase Flow in Gas Wells Using Foam Dewatering Technology. J. Southwest Pet. Univ. (Nat. Sci. Ed.) 2014, 36, 136–140. [Google Scholar] [CrossRef]
  18. Chen, X.; Yan, T.; Bi, X. Calculation model for internal frictional pressure drop in coiled tubing and analysis of sensitivity. Oil Drill. Prod. Technol. 2014, 36, 13–17. [Google Scholar] [CrossRef]
  19. Cai, Y.; Zhao, H.; Li, X. Modified SST k-ω-γ Model and Prediction of Laminar to Turbulent Flow Transition in Spiral Tube. Nucl. Power Eng. 2024, 45, 55–62. [Google Scholar] [CrossRef]
  20. Ren, Y.; Xu, K.; Zeng, H. Calculation of sand washing Hydraulic Friction for Pipe-In-Pipe Coiled Tubing. Oil Field Equip. 2016, 45, 13–19. [Google Scholar] [CrossRef]
  21. Zhang, J.; Li, G.; Huang, Z. Numerical simulation on friction pressure loss in Spiral coiled tubing. J. China Univ. Pet. 2012, 36, 115–119. [Google Scholar] [CrossRef]
  22. Kamel, A.H.A.; Shaqlaih, A.S. Friction Pressure Losses of Fluids Flowing in Circular Conduits. In Proceedings of the Offshore Technology Conference, Houston, TX, USA, 30 April–3 May 2012. [Google Scholar] [CrossRef] [Scilit]
  23. Livescu, S.; Craig, S.; Aitken, B. Coiled tubing friction in extended-reach wells. In SPE/ICoTA Well Intervention Conference and Exhibition; SPE: Houston, TX, USA, 2016. [Google Scholar] [CrossRef] [Scilit]
  24. Sas-Jaworsky, I.I.; Reed, T.D. Predicting friction pressure losses in coiled tubing operations. World Oil 1997, 218, 141–145. [Google Scholar]
  25. Yang, S.; Qiu, J.; He, J. Study on Friction Calculation for CO2—Foam Fracturing Fluids under High Temperature and High Pressure. Pet. Drill. Tech. 2007, 35, 1–4. [Google Scholar]
  26. Li, B.; Liu, Y. Study on the laws of laminar Spiral Flow of power-law fluid in eccentric annuli. Appl. Math. Mech. 1993, 14, 593–600. [Google Scholar] [CrossRef] [Scilit]
  27. Chu, Y.; Fan, H.; Liu, X. Theoretical analysis of pressure drop model for solid-liquid two-phase flow in drilling annulus. J. Univ. Pet. 1996, 20, 17–20. [Google Scholar]
  28. Haige, W.; Yinao, S. A practical solution method for eccentric ring air pressure drop. Pet. Drill. Prod. Technol. 1997, 19, 5–9. [Google Scholar]
  29. Jansen, J.D. A semianalytical model for calculating pressure drop along horizontal wells with stinger completions. SPE J. 2003, 8, 138–146. [Google Scholar] [CrossRef] [Scilit]
  30. Erge, O.; Vajargah, A.K.; Ozbayoglu, M.E.; Van Oort, E. Frictional pressure loss of drilling fluids in a fully eccentric annulus. J. Nat. Gas Sci. Eng. 2015, 26, 1119–1129. [Google Scholar] [CrossRef] [Scilit]
  31. Li, Y.; Li, Z. Numerical simulation for impact of velocity and annular space eccentricity on prop-carrying capability of foam fluid. Oil Drill. Prod. Technol. 2007, 29, 97–100. [Google Scholar]
  32. Wan, L.; He, B.; Tang, H. Numerical simulation on sand washing and flushing foam fluid. J. Southwest Pet. Univ. (Sci. Technol. Ed.) 2013, 35, 101–106. [Google Scholar] [CrossRef]
  33. Wu, Y.; Li, G.; Huang, Z. Numerical simulation of sand washing with high pressure waterjet in horizontal well. Oil Drill. Prod. Technol. 2009, 31, 104–109. [Google Scholar] [CrossRef]
  34. Yang, X.; Li, S.; Lin, R. Numerical simulation for prop-carrying capacity of foam fluid. J. China Univ. Pet. 2006, 30, 89–92. [Google Scholar] [CrossRef]
  35. Li, G.; Shen, Z. Theory and Applications of Self-Oscillating Cavitation Jets; China University of Petroleum Press: Beijing, China, 2008. [Google Scholar]
  36. Lord, D.L. Analysis of dynamic and static foam behavior. J. Pet. Technol. 1981, 33, 39–45. [Google Scholar] [CrossRef] [Scilit]
  37. Guan, F.; Liu, J.T.; Yi, X.Z. Hydraulic Calculation of CT Sand Washing Well Flushing in Horizontal Well. China Pet. Mach. 2012, 40, 73–78. [Google Scholar] [CrossRef]
  38. Rao, S.S.; Antunes Morgado, N.; Kulkarni, K.S.; Sun, H.; Arnold, A. Foam hydraulics modeling for sand cleanout in low bottom hole pressure wells. In SPE Annual Technical Conference and Exhibition; SPE: Houston, TX, USA, 2018; p. D021S013R003. [Google Scholar] [CrossRef] [Scilit]
Figure 1. Diagram of the coiled tubing sand-flushing operation.
Processes 14 01383 g001
Figure 2. Physical model: (a) physical model of coiled tubing micro-segment (b) physical model of annular micro-segment.
Processes 14 01383 g002
Figure 3. Schematic diagram of the coiled tubing spiral section.
Processes 14 01383 g003
Figure 4. Schematic diagram of eccentricity.
Processes 14 01383 g004
Figure 5. Schematic diagram of wellbore fluid heat exchange model.
Processes 14 01383 g005
Figure 6. Schematic diagram of the well structure.
Processes 14 01383 g006
Figure 7. Pressure distribution profiles.
Processes 14 01383 g007
Figure 8. Foam quality distribution profiles throughout the whole working process.
Processes 14 01383 g008
Figure 9. Density profiles of the working fluid.
Processes 14 01383 g009
Figure 10. Foam flow velocity distribution profiles.
Processes 14 01383 g010
Figure 11. Comparison of model prediction.
Processes 14 01383 g011
Figure 12. Pressure distribution profiles in coiled tubing at different coiled-tubing running speeds.
Processes 14 01383 g012
Figure 13. Annular pressure distribution profiles at different coiled-tubing running speeds.
Processes 14 01383 g013
Table 1. String and Operation Data.
ItemNumericalUnitItemNumericalUnit
Well depth5750mInner diameter of the casing0.1143m
Vertical depth3550mSand particle diameter0.3mm
Vertical-well section length2850mGrain density of sand2300kg/m3
Inclined-well section length1100mSand-bed height0.1143m
Horizontal-well section length1800mAmbient temperature20°C
Sand-flushing tool depth5250mCoiled tubing running speed2m/min
Coiled tubing outer diameter0.0508mGeothermal gradient2.5°C/100 m
Coiled tubing inner diameter0.0419mFoam liquid -phase mass flow rate2kg/s
Total length of coiled tubing 6500mFoam gas-phase mass flow rate0.8kg/s
Spiral-section length1250mWellhead annular back pressure2MPa
Table 2. Calculation results of construction pump pressure, foam flow rate, foam quality and full circulation time in the foam sand-flushing operation of coiled tubing.
ProjectNumericalUnits
Pump pressure27.54MPa
Foam base-liquid flow rate0.12m3/min
Injection-gas flow rate under pump pressure0.15m3/min
Minimum foam quality0.5589/
Maximum foam quality0.9369/
Full circulation time127.8min
Table 3. Feasibility analysis of construction at formation pressure of 17 MPa.
CaseLiquid Rate (kg/s)Gas Rate (kg/s)Choke Pr. (MPa)CT Speed (m/min)Pump Pr. (MPa)BHP (MPa)Min QualityMax QualityFull Circulation Time (min)
12.00.82.00.124.8019.810.58460.9452108.2
22.00.80.70.124.1518.100.59110.9898.9
31.80.660.650.121.9117.840.59360.9788114.5
41.50.580.670.120.5617.510.62140.98129.6
Table 4. Optimization of operating parameters under no-fluid-leakoff conditions at a formation pressure of 24 MPa.
CaseLiquid Rate (kg/s)Gas Rate (kg/s)Choke Pr. (MPa)CT Speed (m/min)Pump Pr. (MPa)BHP (MPa)Min QualityMax QualityFull Circulation Time (min)
12.00.82.00.124.8019.810.58460.9452108.2
22.00.82.01.126.5224.000.56820.9408121.4
32.00.82.01.527.0025.080.56390.9391124.5
42.00.80.621.826.4523.930.56890.9798117.6
52.10.890.652.027.8824.330.57020.9799109.4
62.150.90.632.127.6124.530.56530.98108.3
72.20.920.632.2528.5424.840.56280.98106.8
82.250.930.632.3528.6125.020.56380.98106.5
Table 5. Optimization of operating parameters under fluid-leakoff conditions at a formation pressure of 24 MPa.
CaseLeakage Rate
(%)
Liquid Rate (kg/s)Gas Rate (kg/s)Choke Pr. (MPa)CT Speed (m/min)Pump Pr. (MPa)BHP (MPa)Min QualityMax QualityMin
Annular Velocity
(m/s)
Full Circulation Time (min)
102.10.890.652.027.8824.330.57020.97990.7589109.4
2102.10.890.652.026.6124.350.58150.97960.6829120.9
3162.10.890.652.025.8724.370.58830.97940.6369129.2
4202.10.890.652.025.3824.390.58290.97920.6063135.4
5202.20.960.652.026.1324.320.59290.97990.6488126.9
6252.30.960.651.524.9523.170.59340.97980.6377129.2
Disclaimer/Publisher’s Note: The statements, opinions and data contained in all publications are solely those of the individual author(s) and contributor(s) and not of MDPI and/or the editor(s). MDPI and/or the editor(s) disclaim responsibility for any injury to people or property resulting from any ideas, methods, instructions or products referred to in the content.