


Abstract
The Qiangtang Basin in the Tibetan Plateau exhibits a paradoxically reversed source-rock maturity pattern (high margins, low center), which presents a challenge to classical basin models. Critically, the unclear genetic mechanism behind this anomaly has impeded hydrocarbon exploration. To address this, this study investigates a north–south-oriented 2D geological section across the central basin. By employing an integrated methodology, the genetic mechanism was elucidated through systematic calculations of paleo-burial depth, paleotemperature, and vitrinite reflectance (Ro) at ten control points (C1–C10). Specifically, tectonic burial history was reconstructed using the backstripping method, while mantle heat flow was corrected by integrating the McKenzie extensional and Royden compressional models. Maturity evolution was quantified using the Easy%Ro model. The results demonstrate that (1) since the Early Jurassic, the basin has undergone five tectono-thermal evolution stages, with the geothermal gradient reaching 30–36 °C/km during the end of the Early Cretaceous); (2) Ro values range from 1.2% to 1.68% at the northern basin margin (C1–C4), are approximately 1.15% in the Central Uplift Zone (C5–C7), and range from 1.45% to 1.6% at the southern basin margin (C8–C10); (3) importantly, the reversed distribution was jointly controlled by three factors: deep burial at the basin margins (5–6 km), early uplift in the central part (initiating from the Late Cretaceous), and local magmatic thermal disturbance. Their estimated contribution ratios are 40–50%, 30–40%, and 10–20%, respectively. Consequently, regions such as the Luxiongcuo Syncline, the Bandaohu–Qingshuihu area, and the Chibuzhangcuo area are identified as having favorable exploration potential.
1. Introduction
The Qiangtang Basin, situated in the hinterland of the Tibetan Plateau, is a large marine sedimentary basin with relatively limited exploration maturity in China, covering an area of approximately 22 × 104 km2. Its geotectonic setting is characterized by its position between the Longmuco–Jinshajiang and the Bangong Lake–Nujiang tectonic belts, placing it within the central segment of the Tethyan tectonic domain. This domain shares a similar geological background with prolific oil and gas regions in the Middle East and Central Asia [1]. The basin interior is divided into three first-order tectonic units: the North Qiangtang Basin, the Central Uplift Zone, and the Southern Qiangtang Basin. Multiple sets of source rocks have been identified, including the Upper Triassic Xiaochaka Formation and the Middle Jurassic Buqu Formation, which provide fundamental geological conditions for the formation of large hydrocarbon accumulations.
Since the 1990s, field geological surveys, drilling core analysis, and geophysical exploration have confirmed the continuous development of sedimentary strata in the basin, with Mesozoic thicknesses ranging from 4 to 13 km. The source rocks exhibit total organic carbon (TOC) contents of 1.15–16.89% and hydrocarbon generation potentials (S1 + S2) of 3.8–8.5 mg/g, although significant differences in preservation conditions are observed [2,3]. Oil seepages and hydrocarbon shows in drilling have been discovered in the Bandaohu area of the North Qiangtang Basin and the Biluocuo area of the Southern Qiangtang Basin. For example, multiple hydrocarbon shows were encountered in the Buqu and Xiali formations at a depth of 4696 m in Well Qiangke-1. The recent discovery of thick Middle Jurassic saline deposits, with anhydrite caprock exceeding 1000 m in thickness in the Shenglihe area, further confirms the basin’s resource potential [4].
Nevertheless, comprehensive exploration in the basin has not advanced significantly. A primary impediment is the ambiguous formation process and key controlling factors of the atypical distribution of source-rock maturity, which challenges the determination of suitable exploration targets. While source-rock maturity in most global petroliferous basins exhibits a “high in the center and low on the periphery” pattern, the Qiangtang Basin shows a reversed characteristic of “high maturity at the margins and low maturity in the center” [5,6,7]. This pattern is hereafter termed the “reversed maturity distribution”. For instance, vitrinite reflectance (Ro) of Mesozoic (Upper Triassic to Lower Jurassic) source rocks ranges from 1.4% to 1.6% (over-mature) at the northern margin, from 0.8% to 1.0% (mature) in the Central Uplift Zone, and from 1.1% to 1.3% (high-mature) at the southern margin [8,9]. As a key parameter for identifying hydrocarbon generation thresholds and assessing resource volumes, misinterpretation of its distribution pattern can directly lead to poor exploration decisions. Maturity evolution is primarily controlled by the “temperature–time” coupling, where the influence of temperature far exceeds that of time. Previous studies have qualitatively linked this anomaly to paleotemperature differences between the basin margins and center [5]. However, the quantitative contributions of controlling factors such as tectonic uplift, burial depth, and deep heat flow remain unclear.
The unresolved issues stem from three main limitations in existing research [5,10,11]: First, the tectono-thermal coupling relationship remains ambiguous. Most existing subsidence history studies are based on local inferences and focus on subsequent uplift processes, failing to integrate paleotemperature field evolution and related thermodynamic mechanisms [5]. Consequently, the coupling between subsidence–uplift dynamics and source-rock thermal maturity is inadequately addressed. Second, conventional technical methodologies are limited by data availability. The number of wells in the basin is modest, and most are shallow. A significant proportion penetrate only Jurassic and Cretaceous strata, with most formations being less than 2.5 km thick. Third, faulting, particularly thrusting, can cause severe overlap or absence of shallow sedimentary strata. This complicates accurate reconstruction of the evolutionary history using conventional one-dimensional burial thermal evolution analysis, which is susceptible to substantial interference [10,11].
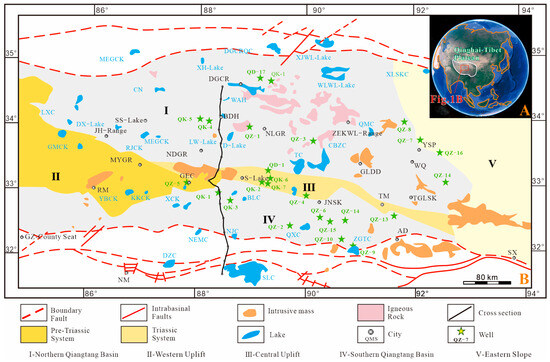
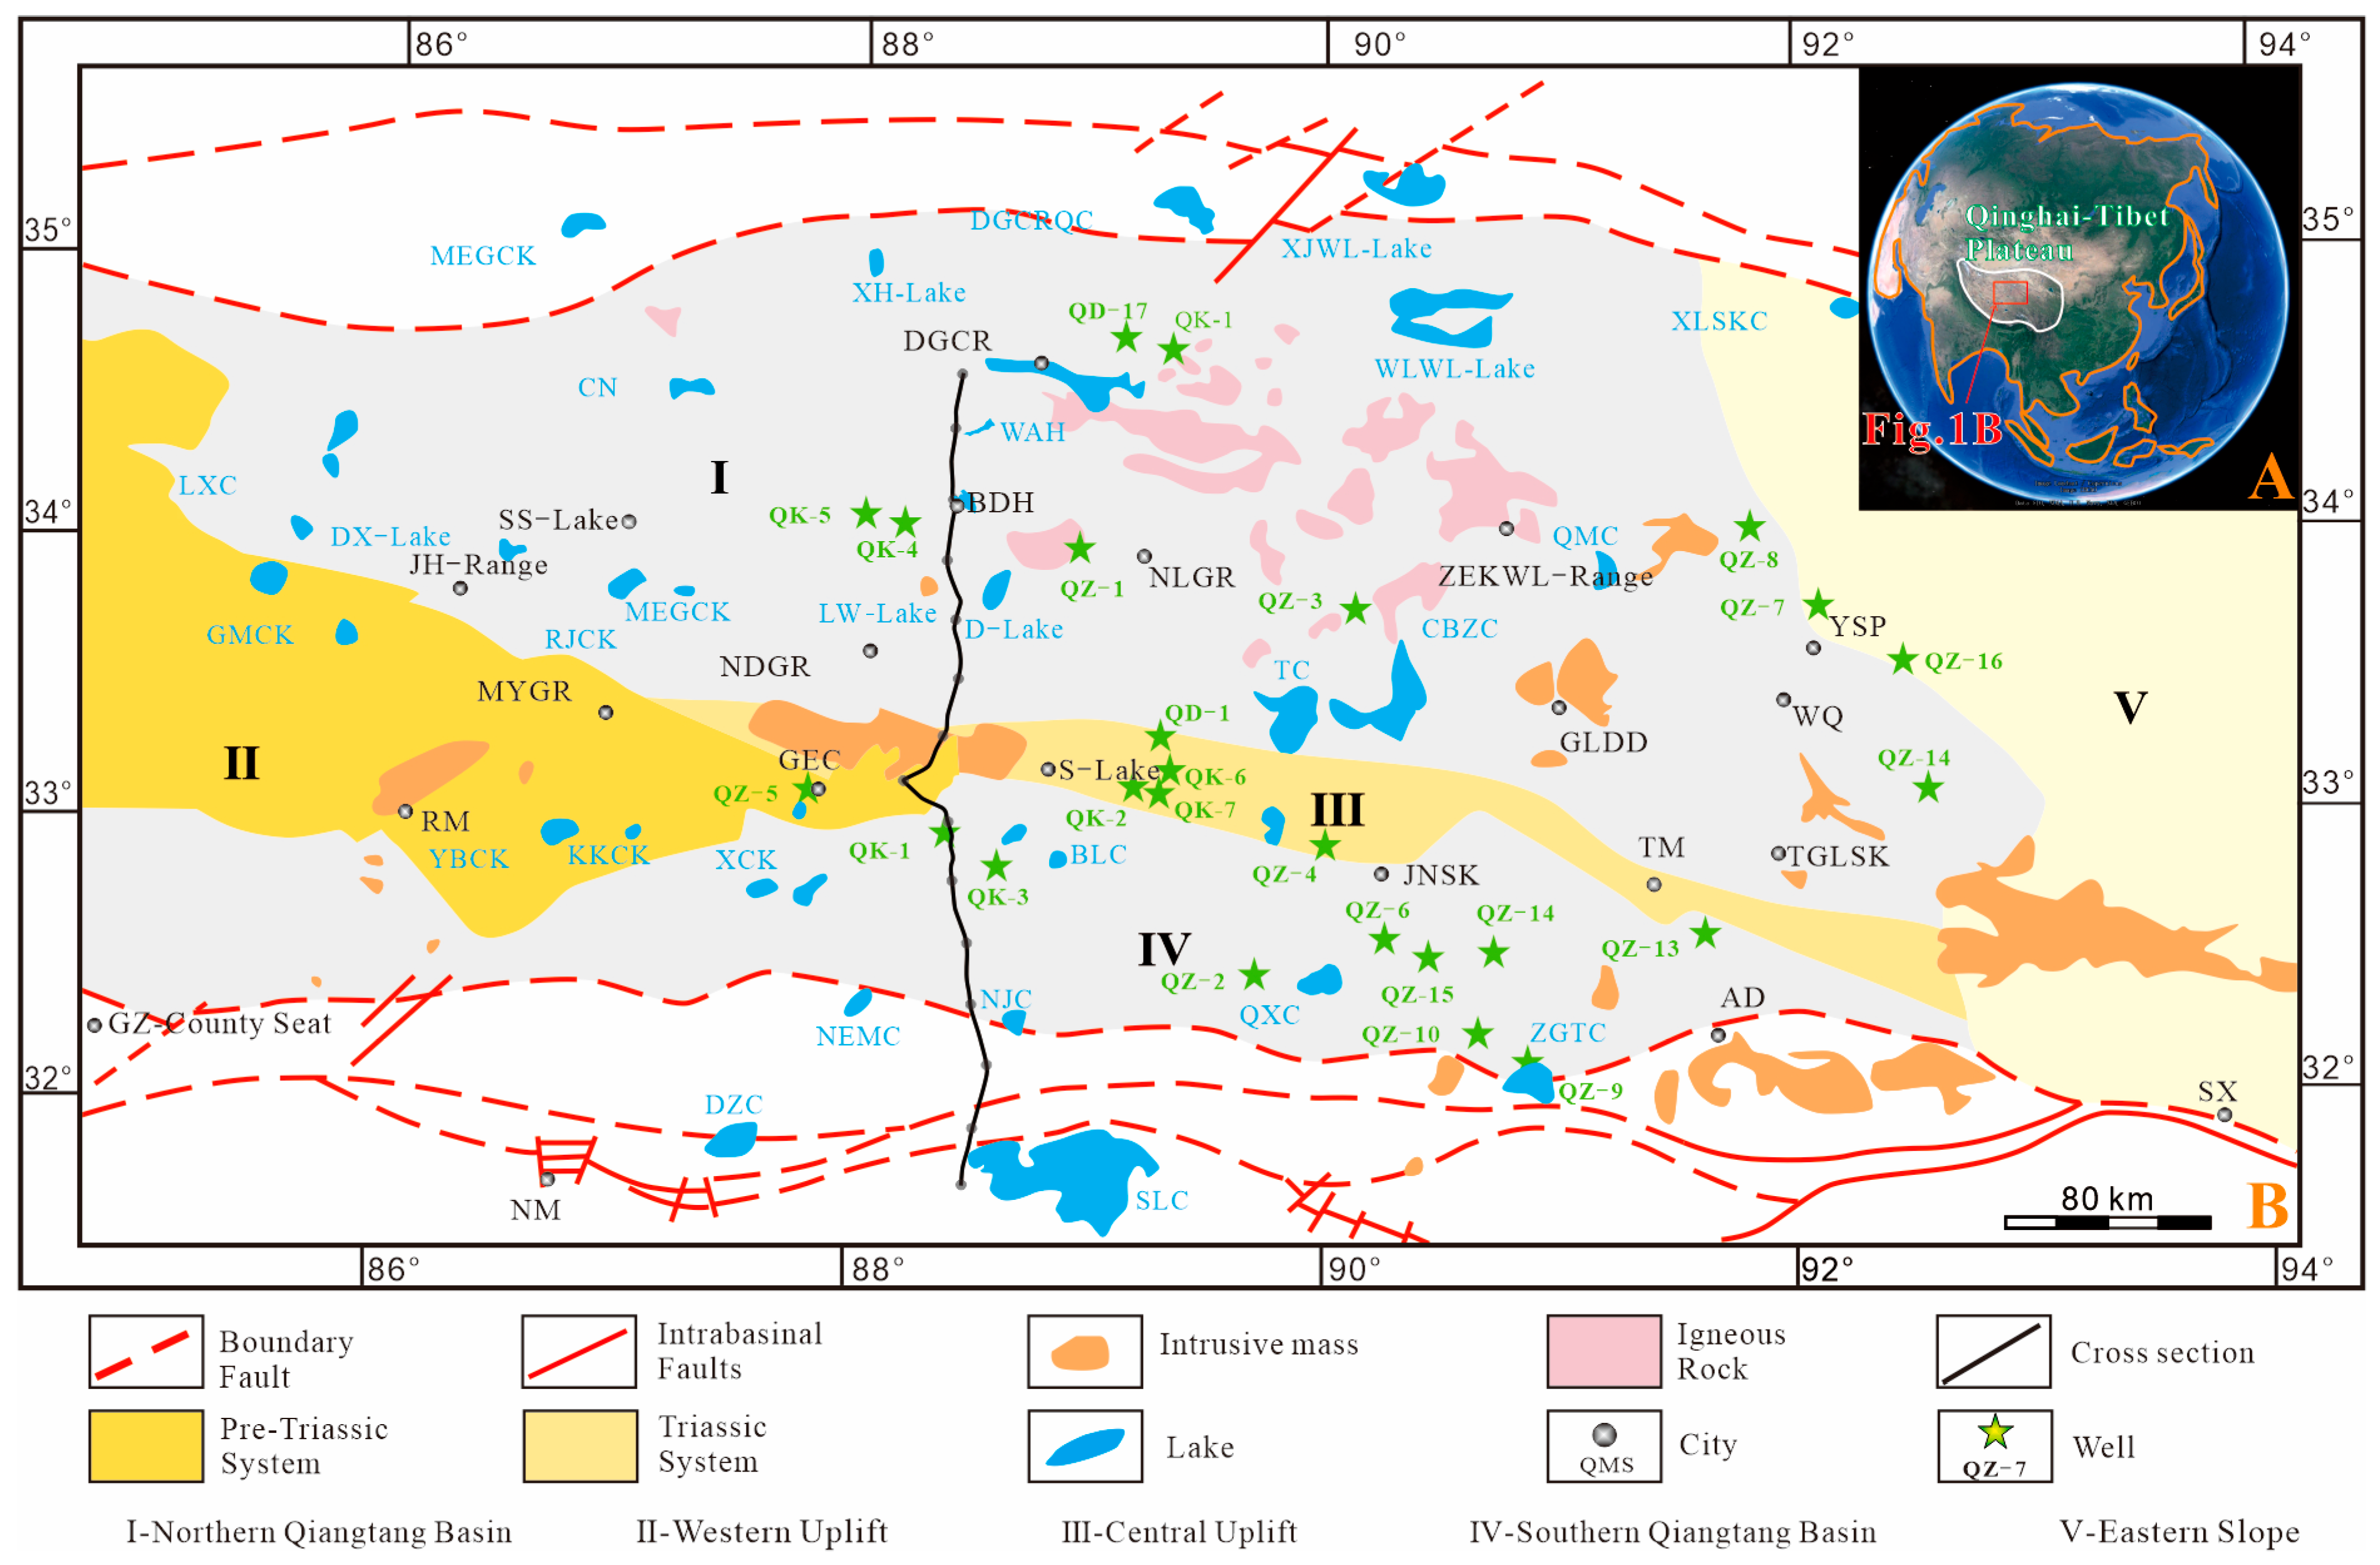
In this study, a south–north-oriented 2D geological section—the SINOPROB-2 deep reflection seismic profile (Figure 1) in the central Qiangtang Basin—was selected. This 260 km long section traverses the North Qiangtang Basin, Central Uplift Zone, and Southern Qiangtang Basin, covering the Shenglihe industrial oil flow area. This section offers three main advantages: (1) It is located in the core tectonic position of the basin, preserving traces of multi-phase tectonics (e.g., Paleo-Tethys Ocean evolution and continent–continent collision), making it representative of maturity differences across all tectonic units. (2) Source rocks of the Xiaochaka and Buqu formations are continuously distributed, with sufficient data on organic matter abundance and type [12]. (3) Data support includes one deep reflection seismic section and measured parameters from surrounding wells and outcrop cores, enabling precise construction of deep and shallow models [5,13].
Figure 1.
Geological map of the Qiangtang Basin and the south–north direction mega-section (modified from [5]). (A) Location of Qinghai-Tibet Plateau; (B) shows the division of tectonic units, present-day strata outcrops, basin boundary faults and internal faults, intrusive rock masses, lakes, igneous rock distribution, the south–north geological section targeted in this study, and the distribution of low-temperature thermochronology sample ages. Published thermochronology data from [5,14,15,16,17,18,19,20,21,22] and classification criteria from [23].
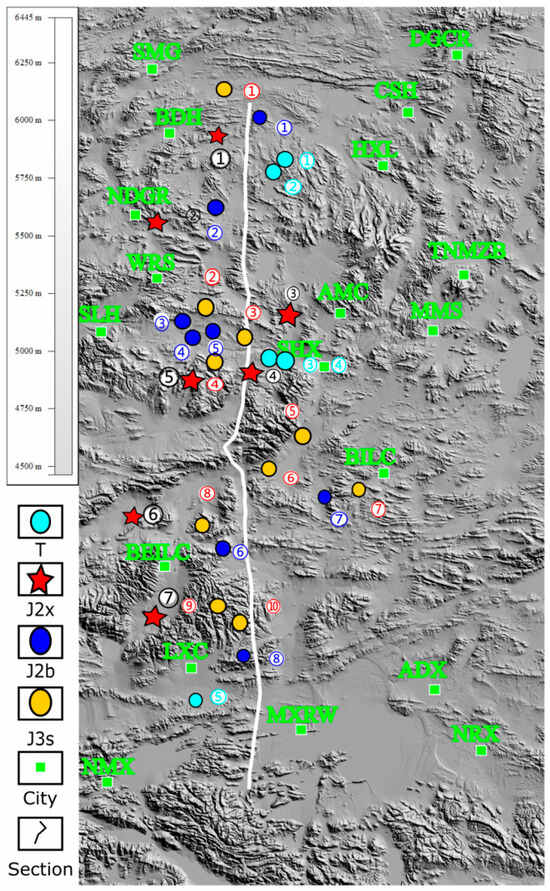
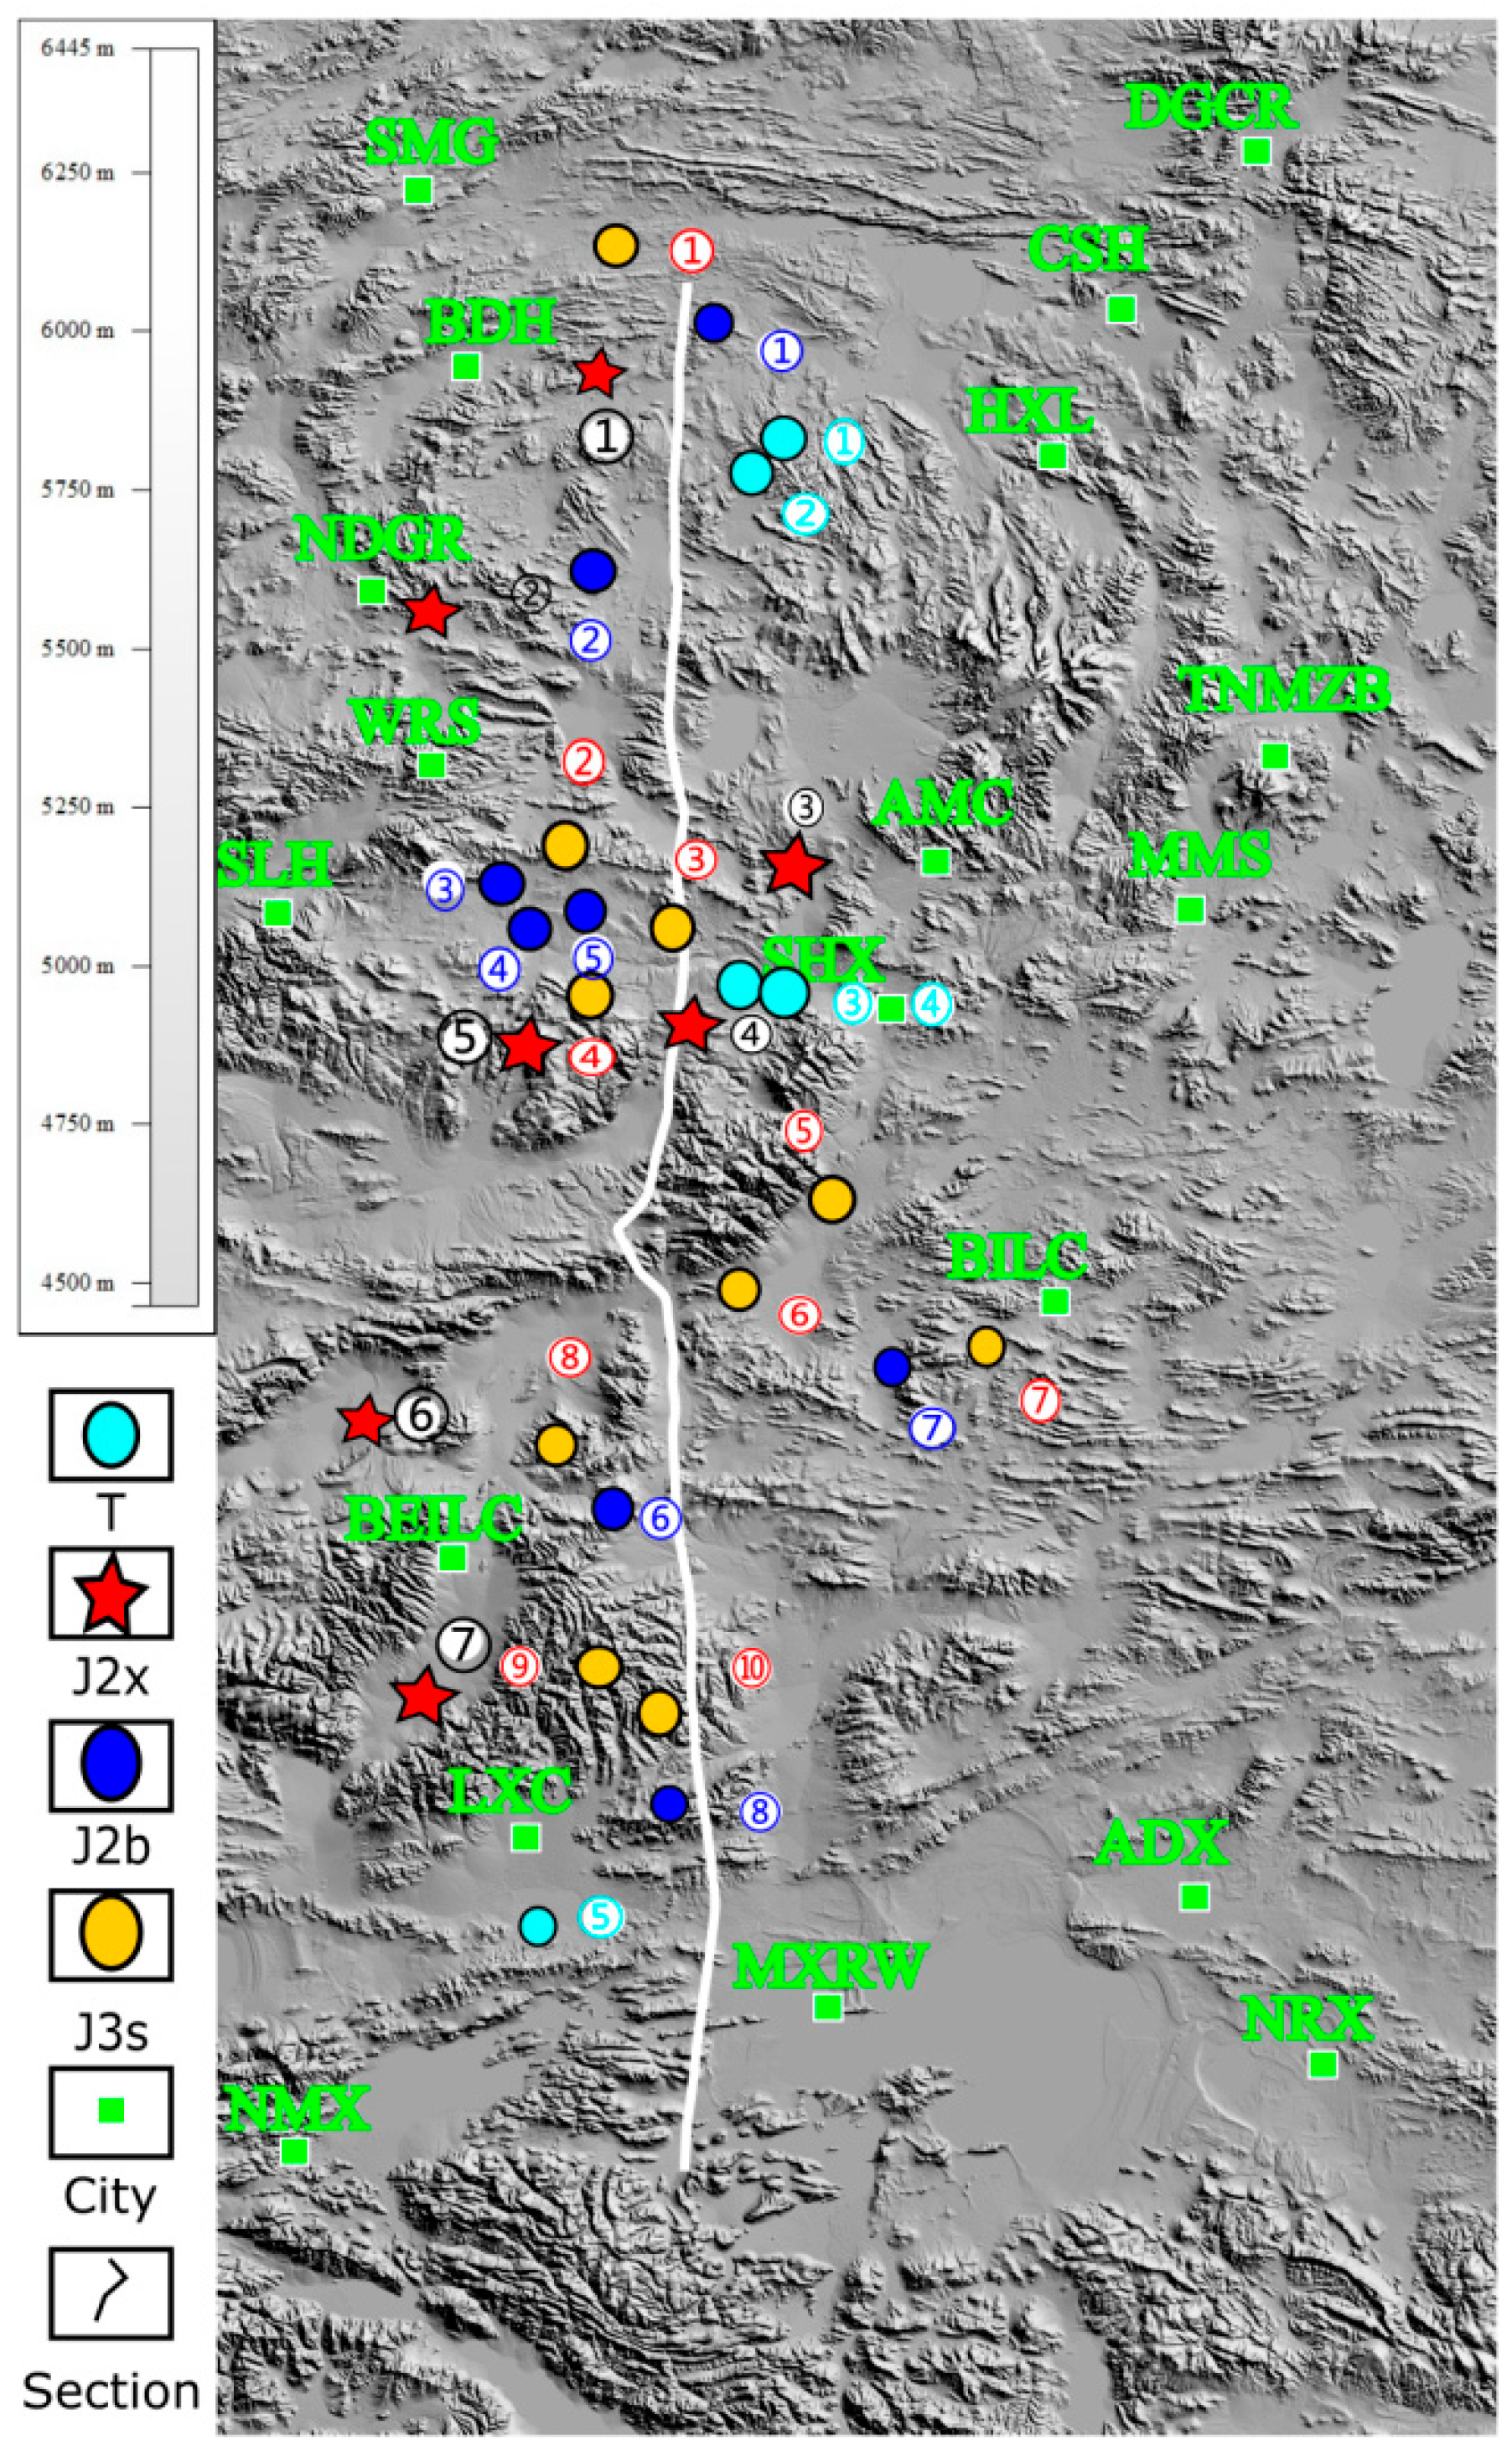
The technical approach adopted here forms a closed-loop system of “data-driven–model coupling–quantitative verification” [24]: Fundamental data were collected (Figure 2) and standardized through coordinate unification, outlier removal, and format integration. Two-dimensional geological modeling involved discretization of geological bodies and parameter assignment. Tectonic burial histories were reconstructed via backstripping, decompaction, and Airy isostatic correction. Paleo-present temperature fields were simulated, encompassing steady-state present fields and non-steady-state paleotemperature fields. Maturity and hydrocarbon generation were analyzed using the Easy%Ro model and hydrocarbon generation intensity calculations. Multi-dimensional verification encompassed temperature, maturity, and tectonic constraints. The discussion focuses on the genetic dynamic mechanism of the reversed maturity distribution, compares thermal evolution and hydrocarbon generation potential differences between the South and North Qiangtang terranes, and proposes a hydrocarbon exploration strategy for the Qiangtang Basin based on the results.
Figure 2.
Distribution map of data from previous research in the Qiangtang Basin. Thickness and source-rock data of the T System, the J2x Formation, the J2b Formation, and the J3b Formation were collected from [12,13,14,15,18,20,22], [13,14,15,16,17,18,20], [7,9,11,18,19], and [13,15,18,20], respectively.
The present work innovatively integrates multi-source data from seismic, drilling, and geophysical surveys to achieve a coupled simulation of “tectonic subsidence/uplift, deep–shallow thermal structure, paleotemperature field, and maturity”. This provides a new paradigm for tectono-thermal research in complex basins with reversed maturity distributions, examined from a “tectonics–heat–hydrocarbon generation” coupled perspective. A key contribution is the quantification of the contribution proportions of three controlling factors. The “uplift–burial–magmatism” conceptual model is proposed to address the knowledge gap in resource assessment during the basin’s early exploration stage.
2. Geological Setting
2.1. Tectonic–Sedimentary Characteristics and Evolution
The evolution of the Qiangtang Basin was governed by a series of opening and closing events of the Tethys Ocean and plate collisions. At the close of the Triassic (approximately 210 Ma), northward subduction of the Meso-Tethys Ocean led to profound subduction and orogenesis within the Longmucuo–Shuanghu zone. This resulted in blueschist formation (209 ± 4 Ma) and a period of intense magmatic activity, establishing the foundation for tectonic differentiation within the basin and initiating the deposition of source rocks (Xiaochaka Formation) [25]. During the Jurassic, following the weakening of subduction, the basin transitioned into an intracontinental rift-depression stage, with sedimentary fill reaching an estimated thickness of 3000–5000 m. By the Early Cretaceous, burial depth and paleotemperature peaked [26], and the Xiaochaka and Buqu formations entered the peak hydrocarbon generation stage [27]. In the Late Cretaceous, the remote tectonic effects of the Bangong Lake-Nujiang Suture Zone became prominent. The basin underwent north–south compression and uplift, with the Central Uplift Zone experiencing local uplift since the Late Cretaceous, subsequently expanding to encompass the entire central region [14]. During the Paleogene, lacustrine deposits of the Suonahu Formation developed, with paleo-elevation in the Shuanghu area reaching 3427–3510 m, marking the basin’s transition into a tectonically stable period [28].
Sedimentary environments changed in response to tectonic evolution. The Late Triassic transgression reached its maximum extent, forming open platform facies deposits and developing limestone/shale of the Xiaochaka Formation. During the Early–Middle Jurassic, shore-shallow marine deposits comprising sandy mudstone interbedded with limestone were deposited. From the Middle–Late Jurassic onwards, the region transitioned into a stable platform phase, during which significant reef limestone and evaporite formations developed, including anhydrite layers exceeding 1000 m in thickness in the Shenglihe area. The Early Cretaceous transitioned entirely to continental fluvial–lacustrine deposits, developing red coarse clastic rocks. The Paleogene was distinguished by lacustrine–fluvial heteropic deposits, characterized by marl interbedded with gypsum in the Suonahu Formation and clastic rocks in the Kangtuo Formation [29].
2.2. Lithological Characteristics and Source-Rock Distribution
The stratigraphic sequence of the Qiangtang Basin, from basement to sediments, is categorized as follows (Table 1): The Precambrian metamorphic basement is composed of schist and granulite. The Lower Paleozoic succession includes Ordovician–Silurian slate and phyllite, while the Upper Paleozoic comprises Devonian–Permian marine carbonate and clastic rocks. The Mesozoic succession consists of Triassic–Cretaceous transitional continental–marine deposits. The Mesozoic forms the majority of the basin fill, including Lower–Middle Triassic shallow marine clastic rocks and limestone (e.g., volcaniclastic rocks of the Nadigangri Formation in North Qiangtang); Upper Triassic Xiaochaka Formation (T3x), developing coal-bearing clastic rocks and micritic limestone; and the Tumengela Formation (T3t), consisting of sandstone and carbonaceous mudstone interbedded with coal seams [30]. The Lower Jurassic Quse Formation (J1q) in Southern Qiangtang comprises shallow marine mudstone and shale interbedded with siltstone; the widely distributed Middle Jurassic Buqu Formation (J2b) consists of platform limestone and reef dolomite; and the Xiali Formation (J2x) is dominated by mudstone and siltstone interbedded with thin limestone [8]. The Upper Jurassic Suowa Formation (J3s) consists of shore-shallow marine limestone and dolomite. The Cretaceous is primarily characterized by continental red conglomerate and sandstone formations, such as the Zawarong and Xueshan Formations, with only limited marine remnants preserved in the northwest, as evidenced by the Bailongbinghe Formation.
Table 1.
Stratigraphic division and lithology of the Qiangtang Basin. In the System column, from top to bottom, letters represent the Systems of Cretaceous, Jurassic, Triassic, Permian, Carboniferous, Devonian, Silurian, Ordovician, respectively. In the Series column, U, M, L, represent the Upper, the Middle, and the Lower parts of each System, respectively.
The principal source rocks pertinent to this study are concentrated in the Upper Triassic–Middle Jurassic and are controlled by depositional differences between the northern and southern depressions. The Upper Triassic Xiaochaka Formation is extensively developed in the North Qiangtang Basin, comprising gray-black carbonaceous shale, silty mudstone interbedded with thin coal seams, and sporadic marl, gradually transitioning southward to the clastic–carbonate interbeds of the Riganpeicuo Formation in Southern Qiangtang [31]. The Middle Jurassic Buqu Formation is characterized by thick-bedded micritic limestone interbedded with mudstone and shale in North Qiangtang. In contrast, the Southern Qiangtang area (e.g., Zaren area) is distinguished by grainstone and laminated dolomite, with algal laminated dolomite being particularly notable. The Middle Jurassic Xiali Formation in North Qiangtang is primarily composed of delta-front mudstone and siltstone, transitioning to clastic rocks interbedded with limestone in Southern Qiangtang. The Lower Jurassic Quse Formation is concentrated in the Biluocuo area of Southern Qiangtang, consisting of semi-deep marine mudstone and shale with localized silty bands.
Source-rock distribution exhibits discernible variations in thickness and grain size: thicker in the north, thinner in the south, finer-grained in the east, and coarser in the west. The North Qiangtang Basin is characterized by fine-grained transitional marine–continental facies deposits, while the Southern Qiangtang Basin features shallow marine carbonate–clastic interbeds, which constitute the primary body of marine source rocks in the Qiangtang Basin [32,33].
3. Methods
3.1. Geological Model Construction
Following the establishment of the coordinate system, the interpreted seismic section was vectorized using Move software (version 2008.1). The x-axis represents the north–south length of the section (origin at the northern end), and the z-axis represents the interpreted burial depth (accuracy ±5 m). Surface lines, stratigraphic boundaries, and faults were vectorized, with stratigraphic boundary accuracy set at a maximum of 50 m (matching seismic resolution). Geological units were delineated based on reflection interfaces observed within the seismic section, ensuring stratigraphic contact relationships conformed to established regional patterns.
Ten control points (C1–C10) were positioned from north to south along the section. Points C1–C4 are located in the North Qiangtang Basin, within the depositional center exhibiting substantial Jurassic–Cretaceous sedimentation. Points C5–C7 are linked to the Central Uplift Zone, a region characterized by prolonged uplift and significant erosion, resulting in thin sedimentation. Points C8–C10 correspond to the Southern Qiangtang Basin, a secondary depositional center containing magmatic rock interlayers.
Burial history reconstruction primarily involved backstripping and decompaction correction. Considering the paleo-structure, sedimentary facies, and strata determined in preceding studies, the sedimentary trend method was employed to synthesize the thickness of eroded strata in different areas.
3.2. Paleotemperature Field and Heat Flow Simulation
The method chain “present-day heat flow anchoring + layer stripping + tectonic correction” was adopted. The fundamental steps involved are as follows: (1) The contemporary distribution of surface total heat flow (Q0) is the sum of the crustal heat production contribution (Qc) and the mantle heat flow (Qm), where Qc = Σ(Aᵢ × Hᵢ), with Aᵢ representing the heat production rate and Hᵢ the formation thickness [34]. (2) Paleo-crustal heat flow correction was made using the backstripping method, where paleo-crustal heat flow (Qc,t) is the result of the difference between the present-day crustal heat flow and the heat production contribution of eroded strata. (3) Paleo-mantle heat flow correction: In extensional settings, Qm,t = Qm,now × β [35]; in compressional settings, Qm,t = Qm,now × γ [36]. (4) Paleo-total heat flow synthesis: Qt = Qc,t + Qm,t.
For extensional settings (e.g., Early Jurassic), the McKenzie model [35] was utilized: Qm,t = Qm,now × β (β = 1.1–1.5). Crustal heat flow was calculated using the backstripping method: Qc,t = Qc,now − Σ(Aeroded layer × heroded layer) [34]. For compressional settings (e.g., Late Cretaceous Central Uplift Zone), the formula Qm,t = Qm,now × γ (γ = 1.0–1.2) was employed [36].
3.3. Maturity Simulation
Ro was calculated using the simplified Easy%Ro model [37]: Ro= 0.6 × exp(0.007 × T). This model calibrates original complex kinetic parameters into universal constants, suitable for engineering applications in basin modeling and widely used in global studies (e.g., default in PetroMod software, version of 2016.2). The baseline reflectance constant (0.6%) represents the reflectance of immature Type III kerogen, applicable to the Qiangtang Basin [37]. The temperature sensitivity coefficient (0.007 °C−1) reflects the responsiveness of Ro to paleotemperature for heating rates < 1 °C/Ma. The formula quantitatively converts paleotemperature (T) to Ro, applicable within the oil window range of 0.5–2.0%.
4. Data
Data for this study are primarily derived from drilling records or authoritative literature. Bias was minimized through three steps: (1) Coordinates were unified using the Gauss–Krüger 6° zone projection (central meridian 90°E), converting seismic coordinates and drilling latitude/longitude to an “x (km, distance to the south end of the section)–z (m, actual elevation)” system with a point deviation threshold of 10 m. (2) Outliers were removed using the 3σ principle for rock thermal parameters (e.g., removing shale thermal conductivity > 4.0 or <1.5 W/(m·K)). (3) Missing values were addressed using the mean value for the same stratigraphic age, lithology, and 500 m segment (e.g., Jurassic mudstone in North Qiangtang was assigned 2.2 W/(m·K)).
4.1. Basic Data
Basic data (see Table 2) include the SINOPROB-2 deep reflection seismic section (260 km, resolution 1:100,000) and 2D seismic sections from areas such as Biluocuo and Longe’ni, containing stratigraphic boundary burial depths (Buqu Formation top depth: 2000–4500 m), fault distribution, and Moho depth (65–80 km). Data from [28,38] were utilized.
Table 2.
Basic parameters for modeling. Present-day (0 Ma), end of Cretaceous (66 Ma), end of Late Jurassic (145 Ma), end of Middle Jurassic (161 Ma), end of Early Jurassic (174 Ma), end of Triassic (201 Ma), and end of Permian (251.9 Ma). Present-day Moho depth ZM, present-day heat flow (Q_now), measured vitrinite reflectance Ro, KSys, J3Se, J2Se, J1Se, TSys, and PSys, representing the distribution of Systems and Series.
4.2. Rock Thermal Conductivity
He et al. [39] tested 13 core samples from different lithologic units in Well QK-1 of the Qiangtang Basin, with an overall range of 1.75–3.35 W/(m·K) (average 2.693 W/(m·K)). Clastic rocks (e.g., mudstone, argillaceous siltstone) exhibited lower conductivity (1.76–1.90 W/(m·K)), while carbonate rocks (e.g., dolomite, limestone, dolomitic limestone, micrite) showed higher values (2.27–3.35 W/(m·K)). Specific values for key lithologies are as follows: mudstone (1.76–1.82 W/(m·K)), argillaceous siltstone (1.90 W/(m·K)), micrite (2.27–3.09 W/(m·K)), dolomite (2.63–3.23 W/(m·K)), dolomitic limestone (3.11–3.35 W/(m·K)), limestone (2.72 W/(m·K)). Core samples were sealed from collection to analysis to minimize the impact of water saturation, and the vertical thermal conductivity of the DE section was calculated as 3.01 W/(m·K) using the harmonic average for present heat flow estimation [39]. Jin et al. [40] reported 54 samples (44 core samples and 10 field samples) from three gas hydrate boreholes in northern Tibet (Qiangtang Basin), with an overall range of 1.119–3.155 W/(m·K) (average 2.167 W/(m·K)). Clastic rocks (e.g., mudstone, siltstone) exhibited lower conductivity, while carbonate rocks (e.g., limestone, dolomite) showed higher values, with dolomite slightly higher than micritic limestone and dolomitic limestone higher than micritic limestone. Mean values for key horizons are as follows: Quaternary (1.47 W/(m·K), mudstone), Kangtuo Formation (1.69 W/(m·K), sandstone/breccia), Xiali Formation (1.82 W/(m·K), mudstone/siltstone), Buqu Formation (2.27 W/(m·K), limestone/dolomite), Tumengela Group (2.69 W/(m·K), siltstone/sandstone), Sewo Formation (2.0 W/(m·K), sandstone/mudstone), Quse Formation (1.87 W/(m·K), sandstone/mudstone/breccia). Water-saturation correction based on porosity increased values by ~1.017%, making the thermal conductivity closer to actual subsurface conditions for heat flow calculation [40].
4.3. Terrestrial Heat Flow Data
Recent statistics (unpublished) indicate heat flow values along the section: ~78 mW·m−2 at the northernmost end, decreasing southward, increasing to ~78 mW·m−2 in the Central Uplift Zone (e.g., Shuanghu area), and then gradually decreasing to 72 mW·m−2 in Southern Qiangtang.
Tectonic settings and correction parameters for the 10 control points at key periods are outlined in Table 3. For extension (rift), the correction parameter is the extension factor β (core formula: Qm,t = Qm,now × β). In the Qiangtang Basin, β = 1.3–1.5 for depression areas and 1.1–1.2 for uplift areas, applicable during the J1–J2 period [35]. For compression (uplift), the thickening factor γ is used (Qm,t = Qm,now × γ), with γ = 1.05–1.1 for depressions and 1.2–1.3 for uplift areas, applicable at the end of the Cretaceous [36]. For extension with magmatism, the parameters are β + ΔQ (Qm,t = Qm,now × β + ΔQ), with β = 1.4–1.5 and ΔQ = 5–8 mW/m2, applicable at the end of J2 in Southern Qiangtang [41].
Table 3.
Tectonic correction parameters table for the south–north section in the central Qiangtang Basin (10 control points × 7 periods). β (extension), γ (compression), and ΔQ (magmatic increment). No special parameters for stable periods (coefficient = 1.0).
Magmatic activity from 174 to 145 Ma is significant for analyzing deep dynamics. The 174 Ma event in Southern Qiangtang initiated the Mesozoic magmatic cycle (“punctate exposure”). By 161 Ma, activity peaked (“synchronous eruption”). By 145 Ma, activity declined, concluding the cycle [42]. Parameter values in Table 3 are based on stable periods (end-P, end-T, present-day) with coefficient = 1.0; extension periods (end-J1, J2, J3) with regionally differentiated β values; and a compression period (end-K) with differentiated γ values.
4.4. Source-Rock Maturity Data
Source-rock maturity exhibits significant zonation. Ro varies across tectonic units and source-rock intervals (see Table 4). Generally, maturity is higher in the North Qiangtang Basin than in the Southern Qiangtang Basin, with areas near volcanic rocks often reaching over-maturity. Among major source rocks, the Upper Triassic (Bagong, Xiaochaka formations) and Middle Jurassic (Xiali Formation) exhibit the highest maturity, while the Lower Jurassic (Quse Formation) and Upper Jurassic (Suowa Formation) are mostly mature to high-mature. The data distribution indicates that Upper Triassic–Middle Jurassic source rocks in North Qiangtang predominantly reach high-over-mature stages, while equivalent rocks in Southern Qiangtang are predominantly mature. Deep source rocks show significantly higher maturity than shallow ones, suggesting a strong burial depth impact on Ro.
Table 4.
Summary table of source-rock Ro data for different regions/wells in the Qiangtang Basin. Data from [8,9,31,32,33,43,44,45,46,47,48,49,50,51,52].
5. Results
5.1. Tectonic Evolution History
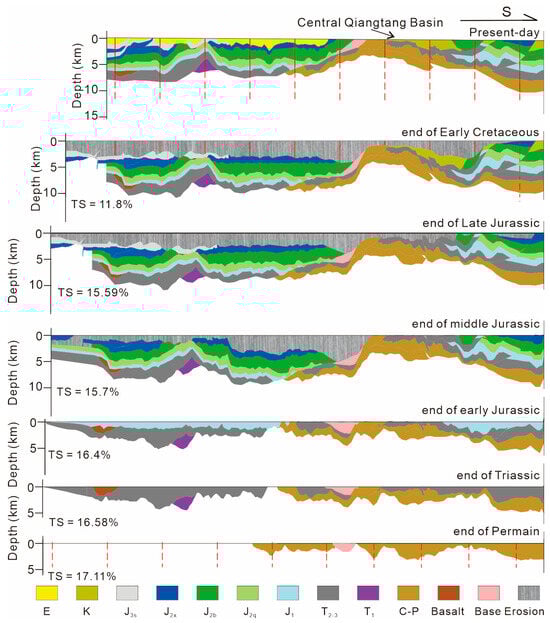
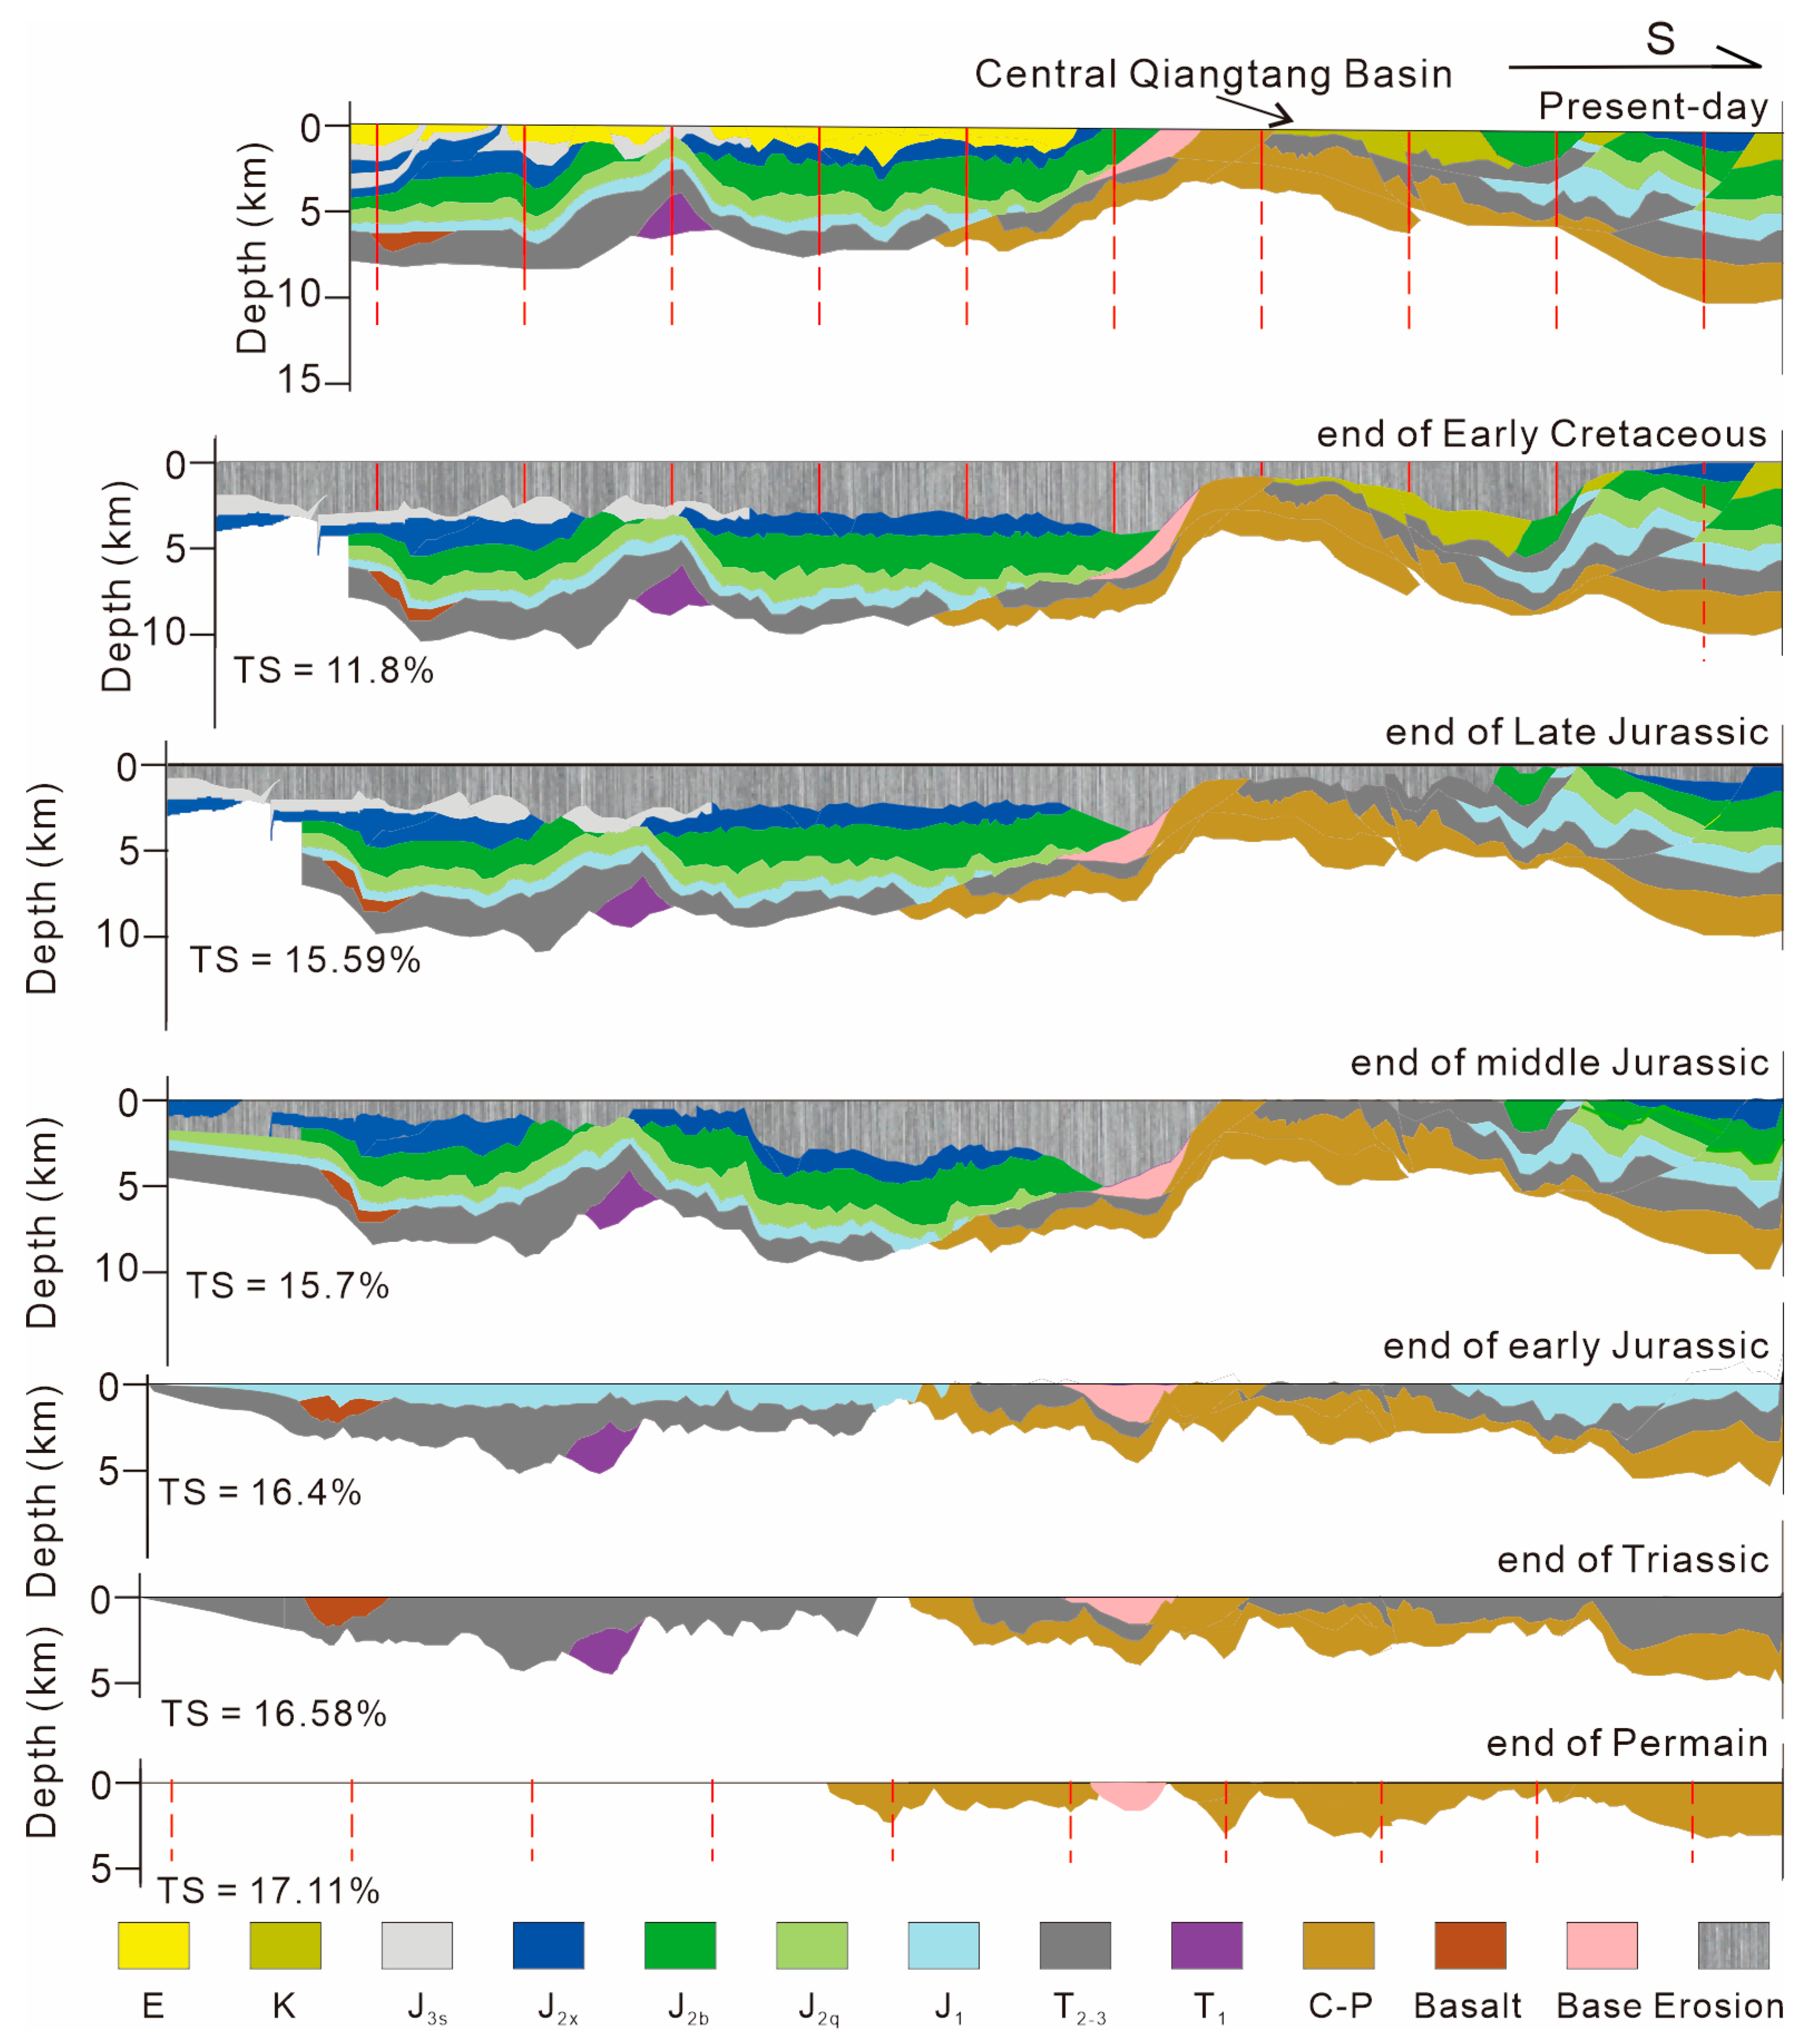
Considering tectonic events and heat flow changes [13], the Mesozoic to recent tectono-thermal evolution of the Qiangtang Basin section is divided into six stages (Figure 3). The differential evolution of the North Qiangtang, Central Uplift Zone, and Southern Qiangtang along the section (C1–C10) is analyzed as follows:
Figure 3.
Tectonic evolution of the south–north section in the Qiangtang Basin. Red dashed lines show ten control points (C1–C10) from north to south along the section as discussed in the method part.
End-Permian: Stratigraphic development was relatively simple, dominated by Carboniferous–Permian (C-P) strata. The compaction coefficient (TS) was 17.11%, indicating low compaction and good preservation of the original state. Tectonic activity was minimal.
End-Triassic: Permian and Triassic strata were further developed, enriching the sequence. Tectonic activity increased marginally, showing nascent differentiation trends. Uplift/erosion remains minimal.
End-Early Jurassic: Lower Jurassic (J1) strata were widely developed, forming a thicker sequence. Tectonic differentiation becomed more apparent, with slight uplift beginning in some areas.
End-Middle Jurassic: Middle Jurassic (J2) strata were deposited, expanding thickness and distribution. Tectonic activity intensifies, and disparities between southern/northern regions and the Central Uplift Zone becomed evident. Uplift and erosion began at low intensity.
End-Late Jurassic: Upper Jurassic (J3) strata were deposited, further enriching the sequence. Tectonic differentiation intensifies, and differences between the Central Uplift Zone and South/North Qiangtang became more pronounced. Uplift amplitude increased, and erosion intensifies.
Early-Cretaceous: The Low Cretaceous (K1) strata were deposited. Tectonic activity was intense, and the tectonic framework was essentially completed. Uplift and erosion since the Late Cretaceous were significant, with tectonic features significantly modified.
Present-day: Following prolonged tectonic movement and erosion, strata show complex distribution with uneven preservation. The tectonic framework is stable, but differences shaped by previous intense activity are preserved.
In summary, the central Qiangtang Basin section has evolved from weak to strong to stable tectonic activity, with strata becoming increasingly complex and differentiated from south to north, influenced by synchronous changes in uplift and erosion.
5.2. Paleo-Heat Flow and Evolution
As summarized in Table 5, mantle heat flow has been the primary contributor to surface heat flow in all periods in the central Qiangtang Basin. However, the crustal heat flow contribution gradually increased over time in North Qiangtang, reflecting regional differences in crustal thermal evolution. Spatially, the Central Uplift Zone and Southern Qiangtang exhibit higher mantle heat flow values than North Qiangtang. The increased crustal heat flow contribution in North Qiangtang indicates variations in thermodynamic processes across tectonic units, likely associated with regional tectonic activity and crustal evolution.
Table 5.
Paleo-heat flow values (mW/m2) for key periods. C1–C10 in the table have the same meanings as in the main text. Qc, Qm, and Q0 represent crustal heat flow, mantle heat flow, and surface heat flow, respectively. 251.9 Ma, 201 Ma, 174 Ma, 161 Ma, 145 Ma, 66 Ma, and 0 Ma represent the end of Permian, end of Triassic, end of Early Jurassic, end of Middle Jurassic, end of Late Jurassic, end of Cretaceous, and Present-day, respectively.
The depth variations (tied to subsidence/denudation and tectonic setting) directly control the spatial–temporal patterns of crustal heat flow (Qₙ), mantle heat flow (Qₘ), and surface heat flow (Qₜ) [53].
Crustal heat flow (Qₙ): tied to stratigraphic thickness (radioactive element abundance in mudstone/shale): peak burial (161 Ma, Middle Jurassic end): depressions (C1–C3, C7–C10) with 5–8 km J2b depth have higher Qₙ (10–15 mW/m2) than the central uplift (3–5 km depth, Qₙ = 9–12 mW/m2). Erosion-dominated periods (66 Ma, Cretaceous end): The central uplift (2–4 km depth) has reduced Qₙ (9–13 mW/m2) relative to depressions (4–6 km depth, Qₙ = 15–28 mW/m2).
Mantle heat flow (Qₘ): coupled with tectonic setting (which drives depth variations): rifting periods (174–161 Ma): deep depressions (4–8 km) correspond to intense lithospheric extension (β = 1.3–1.5 for depressions), so Qₘ is elevated (51–80 mW/m2 in depressions vs. 50–72 mW/m2 in the central uplift). Compression periods (66 Ma–Present): Shallow depths (2–6 km) coincide with lithospheric thickening (γ = 1.05–1.3 for the central uplift), so Qₘ is suppressed (15–52 mW/m2 in depressions vs. 9–56 mW/m2 in the central uplift).
Surface heat flow (Qₜ): integrates Qₙ and Qₘ: the “depression-deep/central uplift-shallow” depth pattern consistently corresponds to a “depression-high/central uplift-low” Qₜ pattern (e.g., Qₜ = 62–92 mW/m2 in depressions vs. 49–65 mW/m2 in the central uplift at 161 Ma).
The depth variations in stratigraphic units (driven by rifting/subsidence and compression/denudation) directly shape the spatial–temporal distribution of Qₙ and Qₘ, which in turn controls the inverse Rₒ gradient (margin-high, center-low) of the J2b source rock along the south–north transect.
5.3. Evolution History of Paleotemperatures
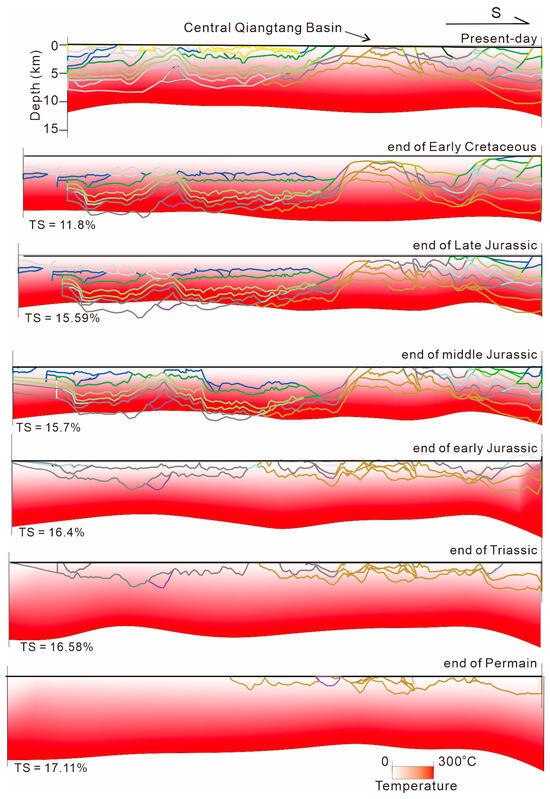
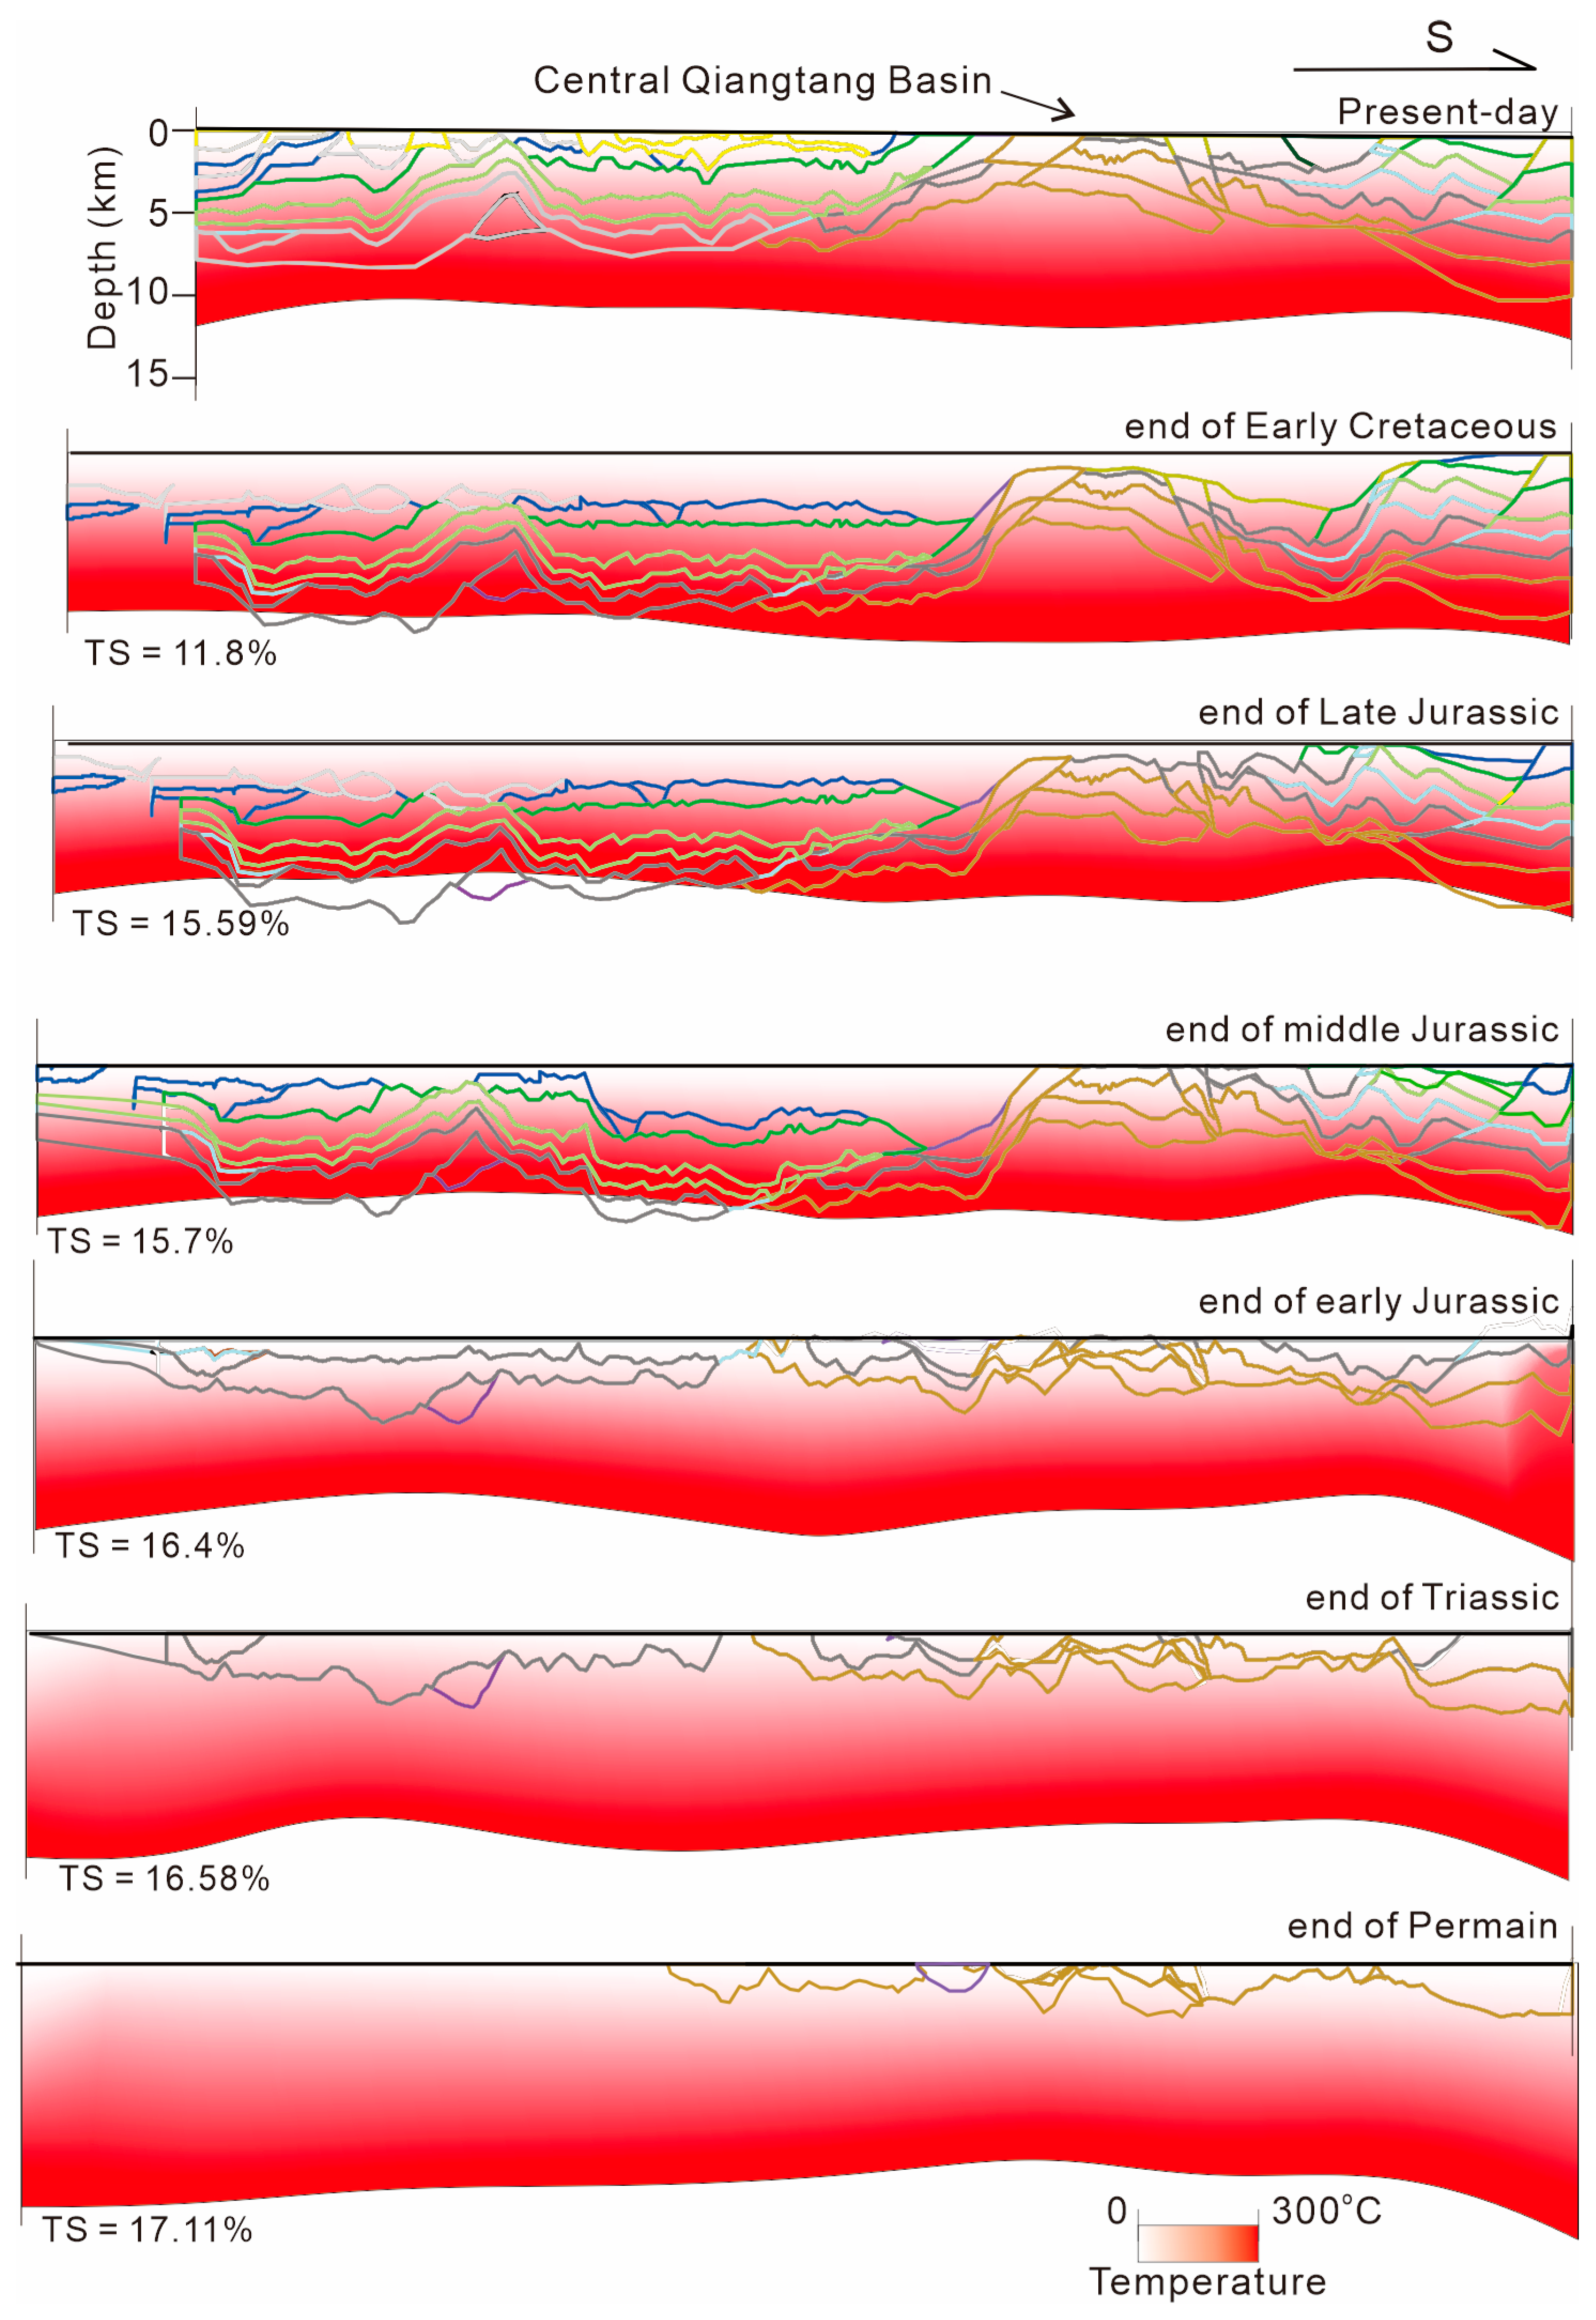
The paleotemperature field of the central Qiangtang Basin section evolved from homogeneous to significantly differentiated and then stabilized (Figure 4).
Figure 4.
Spatiotemporal evolution of the paleo-geothermal gradient along the south–north section of the Qiangtang Basin. The arrow points south, unit °C/km. Colored lines show the boundary of formations and the legend represents temperature ranging from 300 °C at the bottom to the surface average as 0 °C of each period.
End of Permian: The paleotemperature field is relatively gentle and homogeneous (TS = 17.11%), indicating an initial homogeneous tectono-thermal stage.
End of Triassic: Minor fluctuations appear in the paleotemperature field (TS = 16.58%). Stratigraphic superposition begins, and tectono-thermal differentiation trends become apparent.
End of Early Jurassic: Stratigraphic complexity increases, and spatial differences in the paleotemperature field become discernible (TS = 16.4%). Tectono-thermal differentiation develops further.
End of Middle Jurassic: Stratification is further developed, and gradients in the paleotemperature field become more prominent (TS = 15.7%). Compaction intensifies, reflecting increasing impacts of burial and tectonic activity.
End of Late Jurassic: Differentiation in stratigraphic morphology and temperature field becomes more apparent (TS = 15.59%). Compaction increases further. Paleotemperature variation is closely associated with tectonic undulations and depositional differences.
End of Early Cretaceous: Strata experience significant tectonic modification and compaction (TS = 11.8%). The paleotemperature field exhibits a complex spatial pattern, with a strong correlation to stratigraphic morphology in specific regions.
Present-day: Strata exhibit a complex residual pattern. The paleotemperature field distribution is relatively stable, with the highest degree of compaction, reflecting the long-term tectono-thermal-erosion history.
The thermal history of source rocks shows significant stage differences (e.g., Jurassic–Cretaceous active vs. stable periods) and spatial differentiation due to tectonic position.
5.4. Evolution History of Source-Rock Maturity
Section measurements and simulation data confirm the reversed maturity characteristic (Table 6). The Ro difference between basin margins and center ranges from 0.6% to 1.0%.
Table 6.
Evolution history of vitrinite reflectance (%) for source rocks. J2sr: J2 source rock; J1sr: J1 source rock; Tsr: T source rock; J2sr_td: measured J2 source rock.
Northern basin margin (C1–C4): Present-day Ro = 1.2–1.68% (1.3–1.5% at end-Paleogene). During the Early Cretaceous (K1), paleotemperature reached 140–150 °C over ~30 Ma. The Buqu Formation in Well QK-1 has Ro = 1.725% [8]. Central Uplift Zone (C5–C7): Present-day Ro = ~1.15% (0.7–0.9% at end-Paleogene). During K1, paleotemperature reached 110–120 °C over 15–20 Ma. The Upper Triassic in Well QK-2 has Ro = 0.9% [47]. Southern basin margin (C8–C10): Present-day Ro = 1.45–1.6% (1.0–1.2% at end-Paleogene). During K1, paleotemperature reached 120–130 °C over 25–30 Ma, consistent with the average Buqu Formation Ro of 0.86% in the Biluocuo area.
6. Discussion
6.1. Simulation Reliability Verification
Multi-dimensional verification ensures reliability:
(1) Parameter calculation consistency: All ten control points employed a unified workflow. The deviation of calculated thermal conductivity from regional measured data is ≤5%.
(2) Maturity simulation error: The discrepancy between simulated and measured Ro values (e.g., Well QK-1 Buqu: 1.725%; Well QK-2: 0.9%) is <0.2%, which meets industry standards (Table 7).
Table 7.
Verification of calculated Ro and tested Ro (%). “_td”: tested Ro data; “_Error”: error between tested data and calculated value.
(3) Tectonic evolution constraint: The Central Uplift Zone uplift initiated in the Late Cretaceous (~80 Ma), expanding regionally by ~45 Ma [14], spatiotemporally coupled with a sudden geothermal gradient drop (36 to 28 °C/km), consistent with apatite fission track dating.
(4) Quantitative erosion verification: The residual Mesozoic thickness in the Central Uplift Zone (2–3 km) is 50% less than at margins, corresponding to 800–1200 m erosion. This matches the paleo-burial depth difference (Δh = 780–1150 m) from backstripping (error ≤ 15%).
(5) Multi-source data comparison: Simulation results are congruent with regional studies: the North Qiangtang rifting paleo-geothermal gradient (35–40 °C/km) matches Tibetan Plateau basin ranges [54]. Southern Qiangtang Buqu Formation Ro (0.8–1.0%) matches the Shenglihe area average (0.94%). Central Uplift Zone Ro (0.8–1.0%) shows <0.1% deviation from Longweihu area data [9]. Calculated Ro in the Biluocuo area matches measured Quse/Buqu averages (0.99%/0.9%). The thermal effect correction for compression areas (ΔT_compression ≈ −30 to −40 °C) quantifies the second main controlling factor (30–40% contribution).
6.2. Genetic Dynamic Mechanism of the Reversed Maturity Distribution
The reversed distribution results from the coupling of “uplift–burial–magmatism”.
6.2.1. Tectonic Drive for Premature Uplift in the Central Region
The Late Cretaceous uplift of the Central Uplift Zone (C5–C7) was synchronous with the remote effect of the tectonic collision and compression of the Bangong Lake-Nujiang Suture Zone [55]. As a tectonic hinge area, it uplifted first (~120 Ma), expanding regionally by ~66 Ma, exposing Mesozoic source rocks or drastically reducing their burial depth. Erosion estimates (800–1200 m for Cretaceous, 300–500 m for Paleogene) are 500–800 m more than at margins, reducing heating time by ~40%. In contrast, the northern margin experienced continued burial until the Paleogene. For example, at the end-Cretaceous, erosion at C5 was 1200 m (700 m more than at C2), causing a ~0.18% Ro decrease, corresponding to the 30–40% uplift contribution.
6.2.2. Deep-Seated Origin of High Heat Flow at Basin Margins
Elevated paleotemperatures at margins during the rifting period (J2–K1) resulted from lithospheric thinning and mantle upwelling following Meso-Tethys closure. Lithospheric thinning (120 to 80–90 km) and mantle upwelling increased shallow heat flow (up to 172.09 mW/m2 in the north). The northern margin’s proximity to the Bangong–Nujiang suture zone concentrated mantle heat flow, superimposed on crustal radiogenic heat production (A = 2.0–3.0 μW/m3), creating a “deep burial + high paleotemperature” effect that accelerated maturation. The southern margin had slightly lower heat flow (69.65 mW/m2) due to the Central Uplift Zone barrier, but it was still higher than that at the center (46.69 mW/m2). Margins are long-term depressions with Mesozoic burial depths of 4.8–8 km. High mantle heat flow during rifting (60–70 mW/m2 north, 50–60 mW/m2 south) combined with deep burial resulted in K1 paleotemperatures of 140–150 °C (north) and 120–130 °C (south), increasing Ro significantly. The center had shallow burial (<3 km) and lower paleotemperature (110–120 °C). The burial depth difference caused a 0.4–0.5% Ro difference, contributing 40–50%.
6.2.3. Superimposed Effect of Magmatic Thermal Disturbance
Magmatic effects are generally confined to a restricted spatial extent [56]. Yanshanian–Paleogene intrusions in North Qiangtang (Donghu) and Southern Qiangtang (Chibuzhangcuo) increased temperatures by 30–50 °C within a 5 km radius, adding an extra Ro increase of 0.2–0.3% (10–20% contribution). For example, Well QZ-1 near the Donghu intrusion has Buqu Formation Ro = 1.725%, 0.8% higher than that at central wells. This magmatic activity is linked to lithospheric extension and thinning. The center lacks such intrusions, resulting in no additional thermal contribution and slower maturation.
6.3. Comparison of Thermal Evolution and Hydrocarbon Generation Potential Between South and North Qiangtang
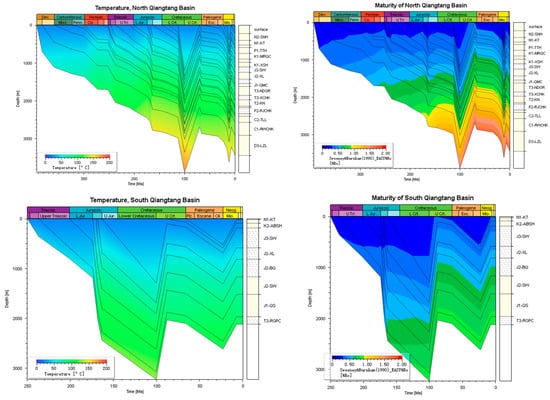
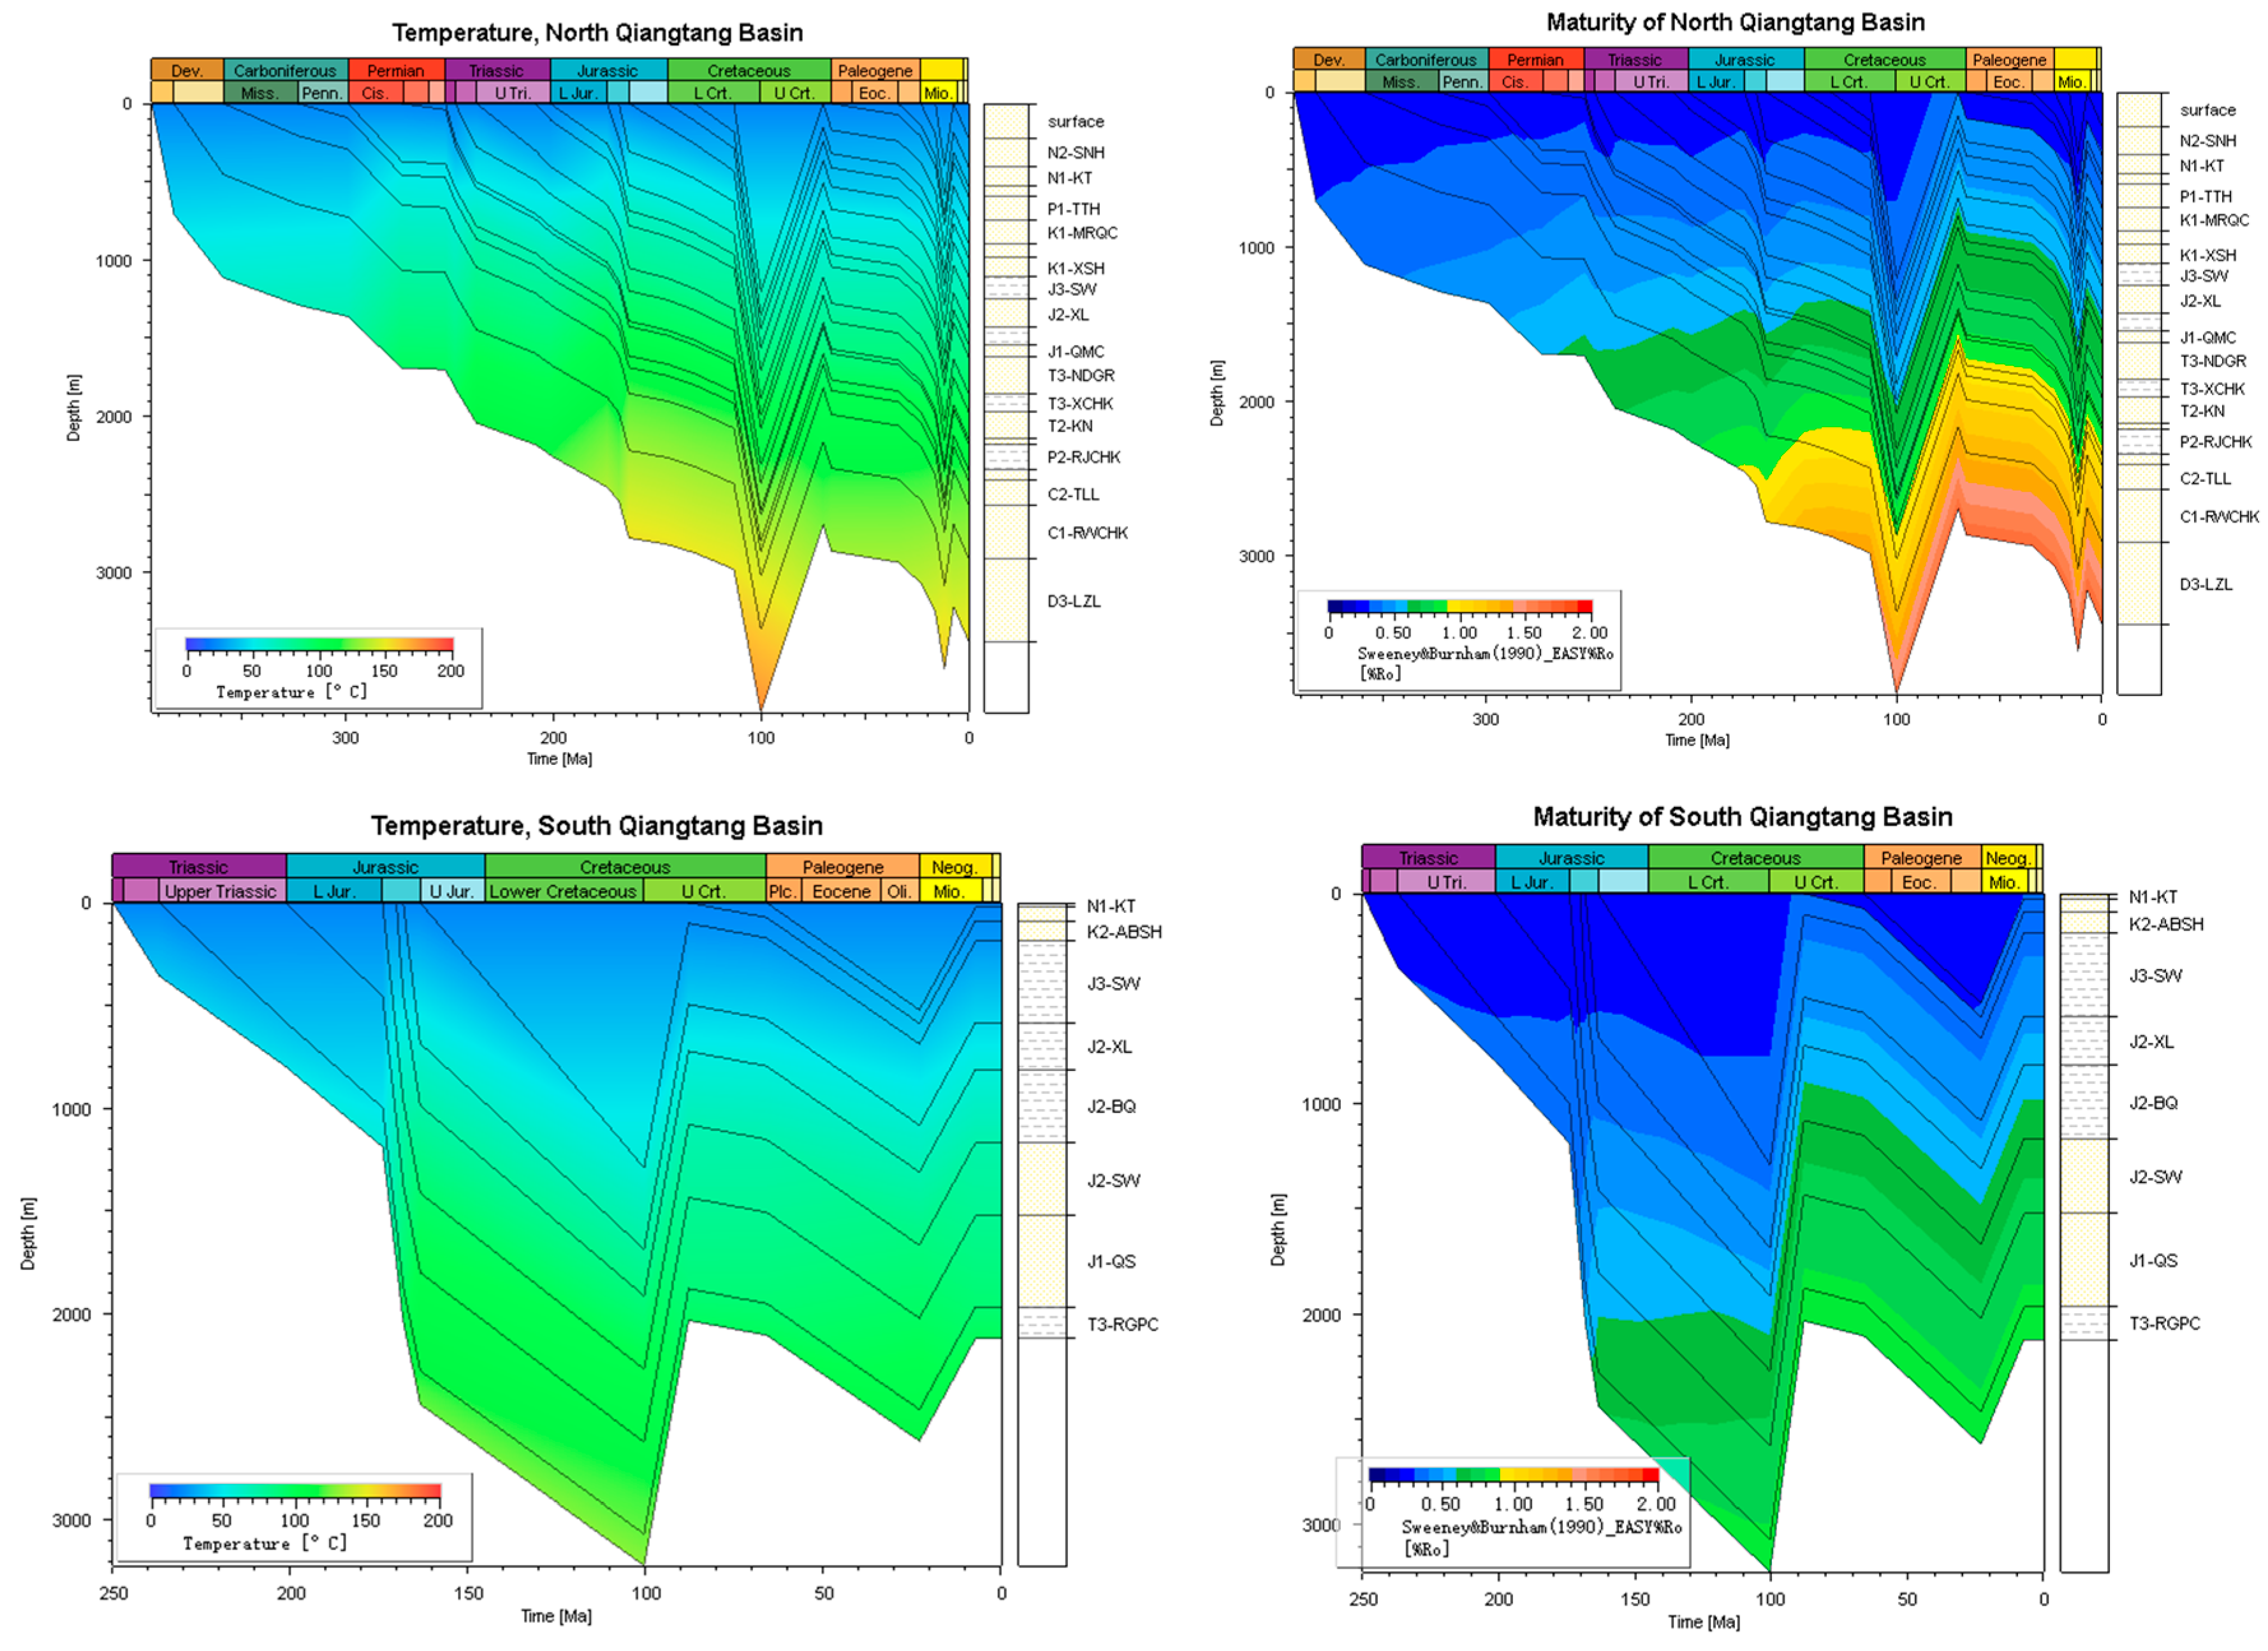
The results of simulations of representative areas (Figure 5) are described below.
Figure 5.
Paleotemperature and maturity evolution of source rocks in South and North Qiangtang. Stratigraphic layering data and erosion conditions are from this study’s section. Source-rock data are from geochemical data of source rocks in the study area (as shown in Figure 2).
The North Qiangtang Basin: Higher overall paleotemperature (max > 200 °C in deep layers), higher maturity (peak Ro > 2.0%, high/over-mature), and earlier hydrocarbon generation (end-Jurassic). Mantle heat flow during rifting: 60–70 mW/m2.
The Southern Qiangtang Basin: Lower overall paleotemperature (max 100–150 °C), lower maturity (peak Ro mostly <1.5%), and delayed and weaker thermal evolution. Mantle heat flow: 50–60 mW/m2.
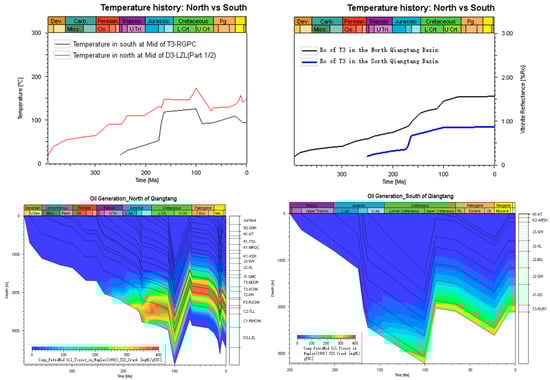
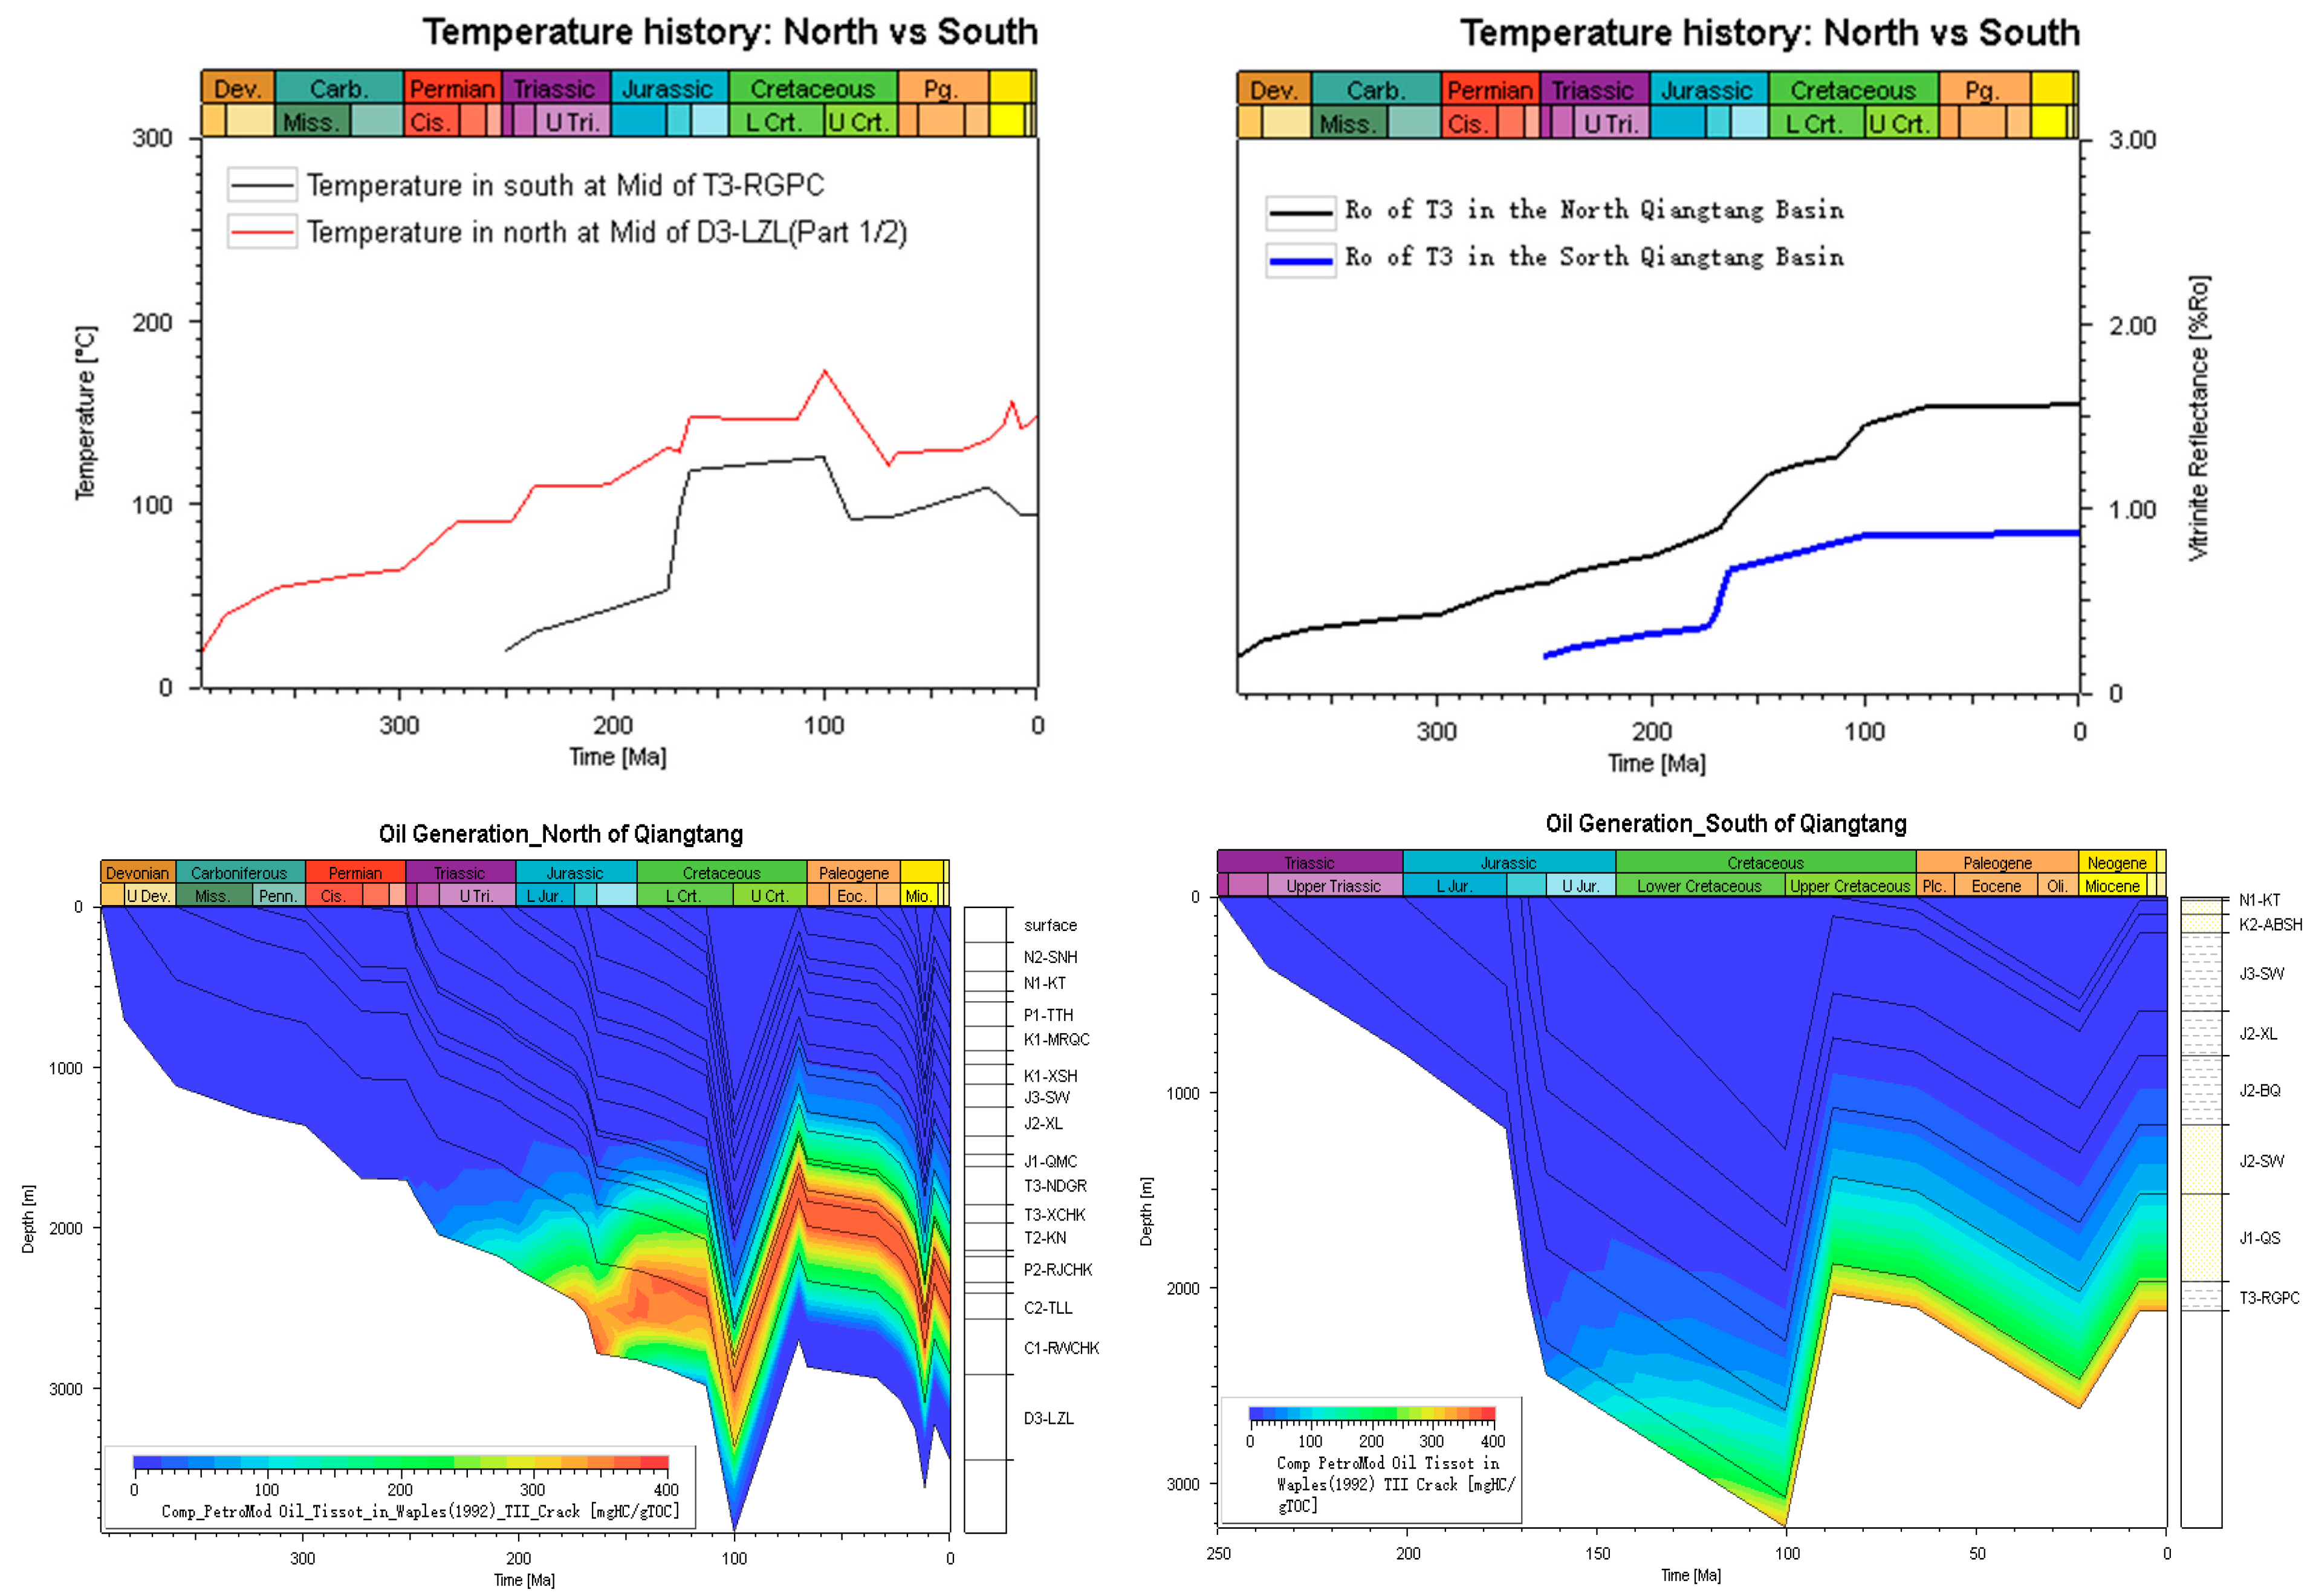
These disparities stem from differences in tectonic activity and deep heat supply. A comparison of temperature and maturity history (Figure 6) confirms North Qiangtang’s earlier and more intense thermal evolution.
Hydrocarbon potential is confirmed by well data in North Qiangtang (e.g., gas shows in Wells QK-1 and QD-17). Hydrocarbon generation intensity correlates with maturity: (1) North Qiangtang: Wide window (Ro 0.7–2.0%, depth 2000–5000 m), intensity 50–70 × 104 t/km2, but mostly over-mature (cracked gas). (2) Southern Qiangtang: Narrow window (Ro 0.7–1.5%, depth 2500–4000 m), intensity 30–50 × 104 t/km2, oil window potential. (3) Central Uplift Zone: Intensity 20–30 × 104 t/km2, Ro 0.8–1.0% (oil window).
The North Qiangtang Basin has thicker and more numerous source-rock intervals, with higher overall hydrocarbon generation intensity (max~380–390 mg HC/g TOC) and continuous high-intensity areas. The Southern Qiangtang Basin intensity is lower (max~310–320 mg HC/g TOC) with scattered high-intensity areas. This “strong north; weak south” trend validates the hydrocarbon generation potential difference. The estimated software error (15–20 mg HC/g TOC) does not affect the core conclusion.
6.4. Implications for Hydrocarbon Exploration and Strategy Adjustment
Conventional “no potential in the center” notions should be reconsidered.
(1) Luxiongcuo Syncline around the Central Uplift Zone (C5–C7): Source-rock Ro = ~1.15% (oil window). Neogene Suonahu Formation marl caprock is intact (536 m thick) with limited structural damage. This is a potential primary oil accumulation area for shallow drilling (2000–3000 m).
(2) Northern Basin Margin (C1–C4, the Bandaohu–Qingshui Lakes): Although the Xiaochaka Formation is over-mature Ro 1.2–1.68%), the Qingshui Lake thrust zone may have formed a late-stage accumulation system via “tectonic deep burial-fracture reservoir formation”. The Lower Jurassic sandstone (porosity 2–8%) could be a reservoir, with potential for residual gas (e.g., primary bitumen in Well QZ-16).
(3) Southern Basin Margin (C8–C10, Chibuzhangcuo area): Source-rock Ro = 1.45–1.6% (oil–gas window). Magmatic thermal disturbance may enhance fracture pathways. Two-dimensional seismic detailed surveys are recommended to delineate structural traps.
A new exploration strategy is proposed: “Designate the Northern Qiangtang Depression as the primary exploration focus, and prioritize the northern margin of the Southern Qiangtang Depression as its key target.”. North Qiangtang should focus on deep (3000–5000 m) residual gas and fractured oil reservoirs; Southern Qiangtang on medium-shallow (2500–4000 m) primary oil reservoirs; the central part on medium-shallow (2000–3000 m) primary oil reservoirs. “Uplift–Depression Transition Zones” (e.g., northern edge of Central Uplift), combining center preservation with margin thermal advantages, may be future “sweet spots”.
7. Conclusions
The limitations of our work primarily mirror the inherent challenges tied to early-stage deep exploration and subsurface sampling in the remote, tectonically complex Qiangtang Basin.
Sparse deep drilling operations (most existing wells penetrate < 3 km) restrict access to reliable in situ measurements (e.g., pressure data) and high-quality core samples from deep formations (e.g., >4 km intervals hosting key marine source rocks), which limits the high-precision calibration of deep-source-rock maturity parameters.
The scarcity of deep subsurface samples constrains the comprehensive validation of our tectono-thermal models, particularly for the most deeply buried intervals critical to deep hydrocarbon potential.
These constraints are not unique to our analysis but align with the current exploration stage of the Qiangtang Basin, where deep subsurface characterization remains underdeveloped. Critically, these limitations directly signal key priorities for future deep hydrocarbon exploration: expanding deep drilling programs to acquire in situ pressure/temperature data and deep core samples, as well as application of deep learning technology in exploration [57], will not only refine the accuracy of tectono-thermal and maturity simulations but also enhance the evaluation of deep hydrocarbon resource potential—ultimately supporting more targeted, efficient deep exploration deployment in the basin.
Fortunately, this research has achieved certain results in the characteristics of the middle and shallow geothermal field and the reverse sequence characteristics and formation mechanism of the maturity of source rocks, which can guide understanding of the oil and gas exploration strategy to a certain extent. This study makes three key contributions to resolving the reversed maturity paradox in the Qiangtang Basin: (1) it innovatively integrates 2D geological modeling, backstripping, and heat flow correction to reconstruct tectono-thermal evolution, overcoming limitations of 1D burial history analysis; (2) it quantifies the contribution of deep burial (40–50%), early uplift (30–40%), and magmatic disturbance (10–20%) to the reversed maturity pattern, filling the gap in genetic mechanism research; (3) it proposes a “tectonics–heat–hydrocarbon generation” coupled framework, providing a new paradigm for complex basin analysis. Based on these findings, the main conclusions are as follows:
1. The reversed maturity distribution is governed by the coupling of three factors: deep burial at basin margins (5–6 km, contributing 40–50%), premature uplift of the Central Uplift Zone from the Late Cretaceous (reducing heating time by ~40%, contributing 30–40%), and local magmatic thermal disturbance (increasing Ro by 0.2–0.3%, contributing 10–20%). Their combined effect results in a 0.6–1.0% maturity difference between margins and the center.
2. The Early Cretaceous is a critical phase for accelerated maturity evolution, with a geothermal gradient of 30–36 °C/km. Paleotemperatures were 140–150 °C at the northern margin (Ro increase: 0.7% to 1.4–1.6%) versus 110–120 °C in the center (Ro 0.8–1.0%), establishing the reversed distribution basis.
3. Suggested exploration direction for the Qiangtang Basin is “Designate the Northern Qiangtang Depression as the primary exploration focus, and prioritize the northern margin of the Southern Qiangtang Depression as its key target”: The Luxiongcuo Syncline (Central Uplift Zone) has primary oil potential. The Bandaohu–Qingshui Lake area (North Qiangtang) and the Chibuzhangcuo area (South Qiangtang) also show favorable Mesozoic hydrocarbon exploration potential.
Author Contributions
Conceptualization, Q.Y. and Z.R.; methodology, Q.Y.; software, R.Y. and T.W.; validation, R.Y. and T.W.; formal analysis, X.C.; investigation, Q.Y., R.Y. and T.W.; resources, A.A. and N.U.; data curation, R.Y., Q.F. and Y.L.; writing—original draft preparation, Q.Y. and Z.R.; writing—review and editing, Q.Y. and R.Y.; visualization, Q.Y. and R.Y.; supervision, Z.R.; project administration, Q.Y. and Z.R.; funding acquisition, Q.Y. and Z.R. All authors have read and agreed to the published version of the manuscript.
Funding
This research was funded by the National Natural Science Foundation of China (Grant No. 42241204) as “Spatial and temporal differences in the tectono-thermal regimes and hydrocarbon source rocks thermal evolution in the Qiangtang Basin”, and the Fundamental Research Funds for the Central Universities (Grant No. 202510710557) as “Paleotemperature evolution and hydrocarbon generation of the Qiangtang Basin”.
Data Availability Statement
The original contributions presented in this study are included in the article. Further inquiries can be directed to the corresponding authors.
Acknowledgments
We wish to thank the two anonymous reviewers for their constructive comments that were instrumental in revising the manuscript. We are also grateful for the guidance provided by the editors throughout the process. Many sincere thanks go to all of them.
Conflicts of Interest
The authors declare no conflicts of interest.
References
- Zhao, Z.Z.; Li, Y.T.; Ye, H.F.; Zhang, Y.W. Petroleum Geology of the Qiangtang Basin in Qinghai-Xizang Plateau; Science Press: Beijing, China, 2001; Available online: https://book.sciencereading.cn/shop/book/Booksimple/show.do?id=B21927A661DF64846BB18BB9639E16E07000 (accessed on 5 January 2026)(In Chinese with English Abstract).
- Wang, C.S.; Yin, H.S.; Li, Y.; Deng, B. Evaluation of Geological Evolution and Oil and Gas Prospects in the Qiangtang Basin, Tibet; Geological Publishing House: Beijing, China, 2001; Available online: https://pdfyl.ertongbook.com/28/31337950.pdf (accessed on 5 January 2026)(In Chinese with English Abstract).
- Li, Y.L.; Wang, C.S.; Huang, J.J. Deformation Characteristics and Finalizing Age of the Folds in the Qiangtang Basin and Their Relations to Oil and Gas Accumulation. Oil Gas Geol. 2008, 29, 283–289, 296. [Google Scholar] [CrossRef]
- Wu, Z.H.; Yao, J.M.; Ji, C.J.; Zhao, Z.; Yang, X.K.; Feng, W.P.; Wang, Q.; Zhao, R.T. Crude Oil and Formation History of Hydrocarbon in the Shenglihe Area, Northern Qiangtang Basin. Acta Geol. Sin. 2022, 96, 3698–3704, (In Chinese with English Abstract). [Google Scholar] [CrossRef]
- Ren, Z.L.; Yang, P.; Qi, K.; Cui, J.P.; Yu, Q.; Cheng, X.; Huang, L.; Chen, G.; Yao, J.W. Research status and progress of tectonic-thermal evolution history in Qiangtang Basin. Earth Sci. Front. 2025, 32, 12–27, (In Chinese with English Abstract). [Google Scholar] [CrossRef]
- Xu, H.X.; Qin, J.Z. Thermal Evolution History of the Mesozoic Marine Source Rock in the Qiangtang Basin, Tibet. Pet. Explor. Dev. 2004, 31, 59–63, (In Chinese with English Abstract). [Google Scholar]
- Qin, J.Z. Study on Organic Matter’s Maturation and Hydrocarbon-Generating History in the Qiangtang Basin. Pet. Exp. Geol. 2006, 28, 350–358, (In Chinese with English Abstract). [Google Scholar] [CrossRef]
- Xiao, R. The Study of Gas Hydrate’s Gas Sources in the Qiangtang Basin, Northern Tibet. Master’s Dissertation, Chinese Academy of Geological Sciences, Beijing, China, 2015. (In Chinese with English Abstract). [Google Scholar]
- Zhang, Q. The Source Rock’s Geochemistry and Its Hydrocarbon Potential, Qiangtang Basin. Master’s Dissertation, Yanshan University, Qinhuangdao, China, 2020. (In Chinese with English Abstract). [Google Scholar]
- Wang, J.; Ding, J.; Wang, C.S. Investigation and Evaluation of Strategic Prospecting Areas for Oil and Gas Resources on the Qinghai-Tibet Plateau; Geological Publishing House: Beijing, China, 2009; (In Chinese with English Abstract). [Google Scholar]
- Peng, J.N.; Ma, Z.L.; Liu, Z.R.; Fan, Z.W.; Zhuang, X.B.; Liu, X. Analysis of the Mesozoic-Cenozoic Uplift and Denudation and Restoration of Burial History of Upper Triassic-Jurassic Source Beds in the Qiangtang Basin. Acta Sedimentol. Sin. 2024, in press. [Google Scholar] [CrossRef]
- Wang, C.S.; Li, Y.L.; Li, Y.T. Discussion on Evaluation of Oil and Gas Resources in Qinghai-Tibet Plateau. Acta Pet. Sin. 2006, 27, 1–7, (In Chinese with English Abstract). [Google Scholar] [CrossRef] [Scilit]
- Wu, Z.H.; Gao, R.; Lu, Z.W.; Ye, P.S.; Lu, L.; Yin, C.Y. Structures of the Qiangtang Basin and Its Significance to Oil Gas Exploration. Acta Geol. Sin. 2014, 88, 1130–1144, (In Chinese with English Abstract). [Google Scholar]
- Rohrmann, A.; Kapp, P.; Carrapa, B.; Reiners, P.W.; Guynn, J.; Ding, L.; Heizler, M. Thermochronologic Evidence for Plateau Formation in Central Tibet by 45 Ma. Geology 2012, 40, 187–190. [Google Scholar] [CrossRef] [Scilit]
- Song, C.Y.; Wang, J.; Fu, X.G.; He, L. Mesozoic and Cenozoic Cooling History of the Qiangtang Block, Northern Tibet, China: New Constraints from Apatite and Zircon Fission Track Data. Terr. Atmos. Ocean. Sci. 2013, 24, 985–998. [Google Scholar] [CrossRef] [Scilit]
- Song, C.H.; Zeng, Y.Y.; Yan, M.D.; Fang, X.M.; Feng, Y.; Pan, J.Q.; Liu, X.F.; Meng, Q.Q.; Hu, C.H.; Zhong, S.R. Sedimentary Conditions of Evaporites in the Late Jurassic Xiali Formation, Qiangtang Basin: Evidence from Geochemistry Records. Acta Geol. Sin. (Engl. Ed.) 2017, 91, 156–174. [Google Scholar] [CrossRef] [Scilit]
- Wang, C.; Zhao, X.; Liu, Z.; Lippert, P.C.; Graham, S.A.; Coe, R.S.; Yi, H.; Zhu, L.; Liu, S.; Li, Y. Constraints on the Early Uplift History of the Tibetan Plateau. Proc. Natl. Acad. Sci. USA 2008, 105, 4987–4992. [Google Scholar] [CrossRef] [Scilit]
- Zhang, J.; Sinclair, H.D.; Li, Y.; Wang, C.; Persano, C.; Qian, X.; Han, Z.; Yao, X.; Duan, Y. Subsidence and Exhumation of the Mesozoic Qiangtang Basin: Implications for the Growth of the Tibetan Plateau. Basin Res. 2019, 31, 754–781. [Google Scholar] [CrossRef] [Scilit]
- Zhang, J.; Li, Y.; Xu, M.; Dai, J.; Qian, X.; Han, Z.; Zhang, H.; Pang, J. New Apatite Fission Track Evidence from the Northern Qiangtang Terrane Reveal Two-Phase Evolution of Central Tibet. Terra Nova 2021, 33, 95–108. [Google Scholar] [CrossRef] [Scilit]
- Zhao, Z.; Bons, P.D.; Stübner, K.; Wang, G.; Ehlers, T.A. Early Cretaceous Exhumation of the Qiangtang Terrane during Collision with the Lhasa Terrane, Central Tibet. Terra Nova 2017, 29, 382–391. [Google Scholar] [CrossRef] [Scilit]
- Zhao, Z.; Lu, L.; Wu, Z.H. Uplifting Evolution of the Central Uplift Belt, Qiangtang: Constraints from Tectonothermochronology. Earth Sci. Front. 2019, 26, 249–263, (In Chinese with English Abstract). [Google Scholar] [CrossRef]
- Bi, W.J.; Han, Z.P.; Li, Y.; Li, C.M.; Wang, C.S.; Zhang, J.W.; Lia, Y.L.; He, H.Y.; Qian, X.Y.; Xu, T.K.; et al. Deformation and Cooling History of the Central Qiangtang Terrane, Tibetan Plateau and Its Tectonic Implications. Int. Geol. Rev. 2020, 63, 1821–1837. [Google Scholar] [CrossRef] [Scilit]
- Bi, W.; Li, Y.; Kamp, P.J.J.; Xu, G.; Zhang, J.; Han, Z.; Du, L.; Wang, C.; He, H.; Xu, T.; et al. Cretaceous−Cenozoic Cooling History of the Qiangtang Terrane and Implications for Central Tibet Formation. GSA Bull. 2022, 135, 1587–1601. [Google Scholar] [CrossRef] [Scilit]
- Ren, Z.L.; Cui, J.P.; Qi, K.; Yang, P.; Liu, X.S.; Zhang, C.L.; Yang, G.L.; Gao, Y.F.; Zhang, Y.; Xing, G.Y. New progress in research on theories and methods for reconstruction of deep and ultra-deep thermal evolution history in superimposed basins. J. Northwest Univ. (Nat. Sci. Ed.) 2022, 52, 910–929, (In Chinese with English Abstract). [Google Scholar] [CrossRef]
- Gao, R.; Chen, C.; Lu, Z.; Brown, L.D.; Xiong, X.; Li, W.; Deng, G. New Constraints on Crustal Structure and Moho Topography in Central Tibet Revealed by SinoProbe Deep Seismic Reflection Profiling. Tectonophysics 2013, 606, 160–170. [Google Scholar] [CrossRef] [Scilit]
- Ren, Z.L.; Cui, J.P.; Liu, C.Y.; Li, T.J.; Chen, G.; Dou, S.; Tian, T.; Luo, Y.T. Apatite Fission Track Evidence of Uplift Cooling in the Qiangtang Basin and Constraints on the Tibetan Plateau Uplift. Acta Geol. Sin. (Engl. Ed.) 2015, 89, 467–484. [Google Scholar] [CrossRef] [Scilit]
- Wang, Y.W.; Stephen, F.F.; Stephan, B.; Jeremie, S.; Xu, Y.G. Origin of Potassic Postcollisional Volcanic Rocks in Young, Shallow, Blueschist-Rich Lithosphere. Sci. Adv. 2021, 7, Eabc0291. [Google Scholar] [CrossRef] [Scilit] [PubMed]
- Wu, Z.H.; Ye, P.S.; Hu, D.G.; Lu, L. Paleogene Thrust System in Southern Qiangtang Basin, Central Tibetan Plateau. Geol. Bull. China 2011, 30, 1009–1016, (In Chinese with English Abstract). [Google Scholar]
- Wang, J.; Fu, X.G. Sedimentary Evolution of the Qiangtang Basin. Geol. China 2018, 45, 237–259, (In Chinese with English Abstract). [Google Scholar] [CrossRef]
- Li, C.; Zhai, G.Y.; Wang, L.Q.; Yin, F.G.; Mao, X.C. An Important Window for Understanding the Qinghai-Tibet Plateau—A Review on Research Progress in Recent Years of Qiangtang Area, Tibet, China. Geol. Bull. China 2009, 28, 1169–1177, (In Chinese with English Abstract). [Google Scholar]
- Zhou, Z.K. Characteristics of the Upper Triassic Source Rocks in the Qiangtang Basin, Qinghai-Tibet Plateau. Master’s Dissertation, China University of Geosciences, Wuhan, China, 2018. (In Chinese with English Abstract). [Google Scholar]
- Wang, J.; Fu, X.G.; Shen, L.J. Prospect of the Potential of Oil and Gas Resources in Qiangtang Basin, Xizang (Tibet). Geol. Rev. 2020, 66, 1091–1113, (In Chinese with English Abstract). [Google Scholar] [CrossRef]
- Du, B.W.; Peng, Q.H.; Xie, S.K.; Zheng, B. The Quse Shale Gas Resource Potential of Lower Jurassic in Southern Qiangtang Basin, Tibet. Xinjiang Pet. Geol. 2014, 35, 144–148, (In Chinese with English Abstract). [Google Scholar]
- Blackwell, D.D. The thermal structure of the continental crust. Struct. Phys. Prop. Earth’s Crust 1971, 4, 169–184. [Google Scholar] [CrossRef] [Scilit]
- McKenzie, D. Some Remarks on the Development of Sedimentary Basins. Earth Planet. Sci. Lett. 1978, 40, 25–32. [Google Scholar] [CrossRef] [Scilit]
- Royden, L.H.; Horváth, F. The Pannonian BasinA Study in Basin Evolution; American Association of Petroleum Geologists: Tulsa, OK, USA, 1988. [Google Scholar] [CrossRef] [Scilit]
- Sweeney, J.J.; Burnham, A.K. Evaluation of a Simple Model of Vitrinite Reflectance Based on Chemical Kinetics. AAPG Bull. 1990, 74, 1559–1570. [Google Scholar] [CrossRef] [Scilit]
- Suo, K.; Zhang, G.B.; Jia, Z.Y. Density and Magnetic Susceptibility Distribution of the Middle-Upper Crust in Central Qiangtang Basin and Its Tectonic Implications. Chin. Geophys. 2022, 65, 2047–2062, (In Chinese with English Abstract). [Google Scholar] [CrossRef]
- He, J.L.; Wang, J.; Tan, F.W.; Chen, M.; Li, Z.X.; Sun, T.; Wang, P.K.; Du, B.W.; Chen, W.B. A Comparative Study Between Present and Palaeo-Heat Flow in the Qiangtang Basin, Northern Tibet, China. Mar. Pet. Geol. 2014, 57, 345–358. [Google Scholar] [CrossRef] [Scilit]
- Jin, C.S.; Fu, X.G.; Chen, W.B.; Qiao, D.W.; Ge, J.; Xu, Y.H.; Lu, Z.Q.; Wang, P.K. Measurements of Borehole Heat Flow in Northern Tibet. Chin. J. Geophys. 2019, 62, 3095–3105, (In Chinese with English Abstract). [Google Scholar] [CrossRef]
- Cagnioncle, A.; Burov, E.; Jaupart, C. Thermal Evolution of Extensional Basins with Magmatism. Earth Planet. Sci. Lett. 2007, 261, 553–566. [Google Scholar] [CrossRef] [Scilit]
- Peng, Z.M.; Geng, Q.R.; Pan, G.T. Zircon SHRIMP Geochronology and Nd-Pb Isotopic Characteristics of the Meta-Basalt in the Central Part of Tibetan Plateau’s Qiangtang Region. Sci. China Earth Sci. 2014, 57, 428–438, (In Chinese with English Abstract). [Google Scholar] [CrossRef] [Scilit]
- Wang, J.; Fan, Z.W.; Fu, X.G.; He, Z.Y.; Liu, Z.R.; Wang, Z.W.; Zeng, S.Q.; Yi, J.Q. Organic Geochemical Characteristics and Hydrocarbon Generation Potential of Upper Triassic Black Shales in the North Qiangtang Depression. Geol. China 2025, 52, 61–77, (In Chinese with English Abstract). [Google Scholar] [CrossRef]
- Shen, L.; Zhang, J.; Xiong, S.; Wang, J.; Fu, X.; Zheng, B.; Wang, Z. Evaluation of the Oil and Gas Preservation Conditions, Source Rocks, and Hydrocarbon-Generating Potential of the Qiangtang Basin: New Evidence from the Scientific Drilling Project. China Geol. 2023, 6, 187–207. [Google Scholar] [CrossRef] [Scilit]
- Tang, J. Sedimentology and Petroleum Geochemistry Study of the Source Rocks in Jurassic Quse Formation and Buqu Formation, Biluocuo Region, Qiangtang Basin. Ph.D. Thesis, Chengdu University of Technology, Chengdu, China, 2013. (In Chinese with English Abstract). [Google Scholar]
- Li, R.Y. Study on the Oil and Gas Display Characteristics and Oil Source Analysis in the Qiangtang Basin. Master’s Dissertation, Yangtze University, Jingzhou, China, 2024. (In Chinese with English Abstract). [Google Scholar]
- Tian, C. Organic Geochemical Characteristics of Upper Triassic and Lower Jurassic Strata in Qiangtang Basin and Source Rock Evaluation. Master’s Dissertation, China University of Geosciences (Beijing), Beijing, China, 2017. (In Chinese with English Abstract). [Google Scholar]
- Zhang, H.W.; Wang, J.; Wang, Z.W. Sedimentary Facies Evolution and Tectonic Significance of the Middle-Lower Jurassic Quemocuo Formation in the Northern Qiangtang Basin. In Proceedings of the 2020 Annual Joint Conference of the Chinese Geoscience Union (Part II); College of Geoscience and Technology, Southwest Petroleum University: Chengdu, China, 2020; p. 51, (In Chinese with English Abstract). [Google Scholar] [CrossRef]
- Chen, W.B.; Fu, X.G.; Tan, F.W.; Zeng, S.Q.; Feng, X.L. Organic Geochemistry of Carboniferous-Permian Source Rocks in Qiangtang Basin, Tibet. Geol. China 2017, 44, 499–510, (In Chinese with English Abstract). [Google Scholar] [CrossRef]
- Chen, W.B.; Fu, X.G.; Tan, F.W.; Zeng, S.Q.; Feng, X.L.; Song, C.Y.; Wang, D. Geochemical Characteristics and Significance of Permian Dolomite Oil Seepages in Qiangtang Basin. Acta Sedimentol. Sin. 2017, 35, 611–620, (In Chinese with English Abstract). [Google Scholar] [CrossRef]
- Cao, J.; Song, C.Y.; Fu, X.G.; Chen, M.; Zheng, B.; Sun, W. Basic Characteristics of Permian Zhanjin Source Rock in Well Qiangzi-5 in Qiangtang Basin. Mar. Orig. Pet. Geol. 2015, 20, 15–20, (In Chinese with English Abstract). [Google Scholar] [CrossRef]
- Song, C.Y.; Wang, D.; Zhou, J.W.; Li, X.R. Geochemical Characteristics and Significance of Source Rocks of Upper Permian Nayixiong Formation in QD18 Well, Qiangtang Basin. Sediment. Geol. Tethyan Geol. 2023, 43, 515–529, (In Chinese with English Abstract). [Google Scholar] [CrossRef]
- Qi, K.; Ren, Z.L.; Cui, J.P.; Yu, Q.; Bai, F.F.; Liu, X.S.; Chen, Z.P.; Xing, G.Y. Present-day deep geothermal field and lithospheric thermal structure in the Ordos Basin. Geothermics 2025, 125, 103198. [Google Scholar] [CrossRef] [Scilit]
- Chen, H.H.; Wu, Y.; Xiao, Q.G. Thermal Regime and Paleogeothermal Gradient Evolution of Mesozoic-Cenozoic Sedimentary Basins in the Tibetan Plateau, China. Earth Sci. J. China Univ. Geosci. 2013, 38, 541–552, (In Chinese with English Abstract). [Google Scholar] [CrossRef] [Scilit]
- Ren, Z.L.; Cui, J.P.; Liu, C.Y.; Li, T.J.; Chen, G.; Chen, Z.J.; Qi, K.; Dou, S. Uplift and cooling history of Qiangtang Basin and its significance. Petroleum Geology & Experiment 2016, 38, 15–22, (In Chinese with English Abstract). [Google Scholar] [CrossRef]
- Yu, Q.; Li, R.X.; Ren, Z.L.; Lei, X.H.; Sun, X.Y.; Yang, Q.K.; Wang, B.J. Paleo-temperature evolution history of the Jixian System and the influence of magma thermal event of the southwestern Ordos basin. Acta Geol. Sin. 2023, 97, 922–937. [Google Scholar] [CrossRef]
- Yu, Q.; Wang, B.J.; Zhang, L.M.; Tian, T.; Gao, Z.L.; Ren, Z.L.; Chang, W. Research progress and application challenges of deep learning technology in oil and gas exploration. Nat. Gas Ind. 2025, 45, 43–56, (In Chinese with English Abstract). [Google Scholar] [CrossRef]

Disclaimer/Publisher’s Note: The statements, opinions and data contained in all publications are solely those of the individual author(s) and contributor(s) and not of MDPI and/or the editor(s). MDPI and/or the editor(s) disclaim responsibility for any injury to people or property resulting from any ideas, methods, instructions or products referred to in the content. |
© 2026 by the authors. Licensee MDPI, Basel, Switzerland. This article is an open access article distributed under the terms and conditions of the Creative Commons Attribution (CC BY) license.