Article

In Situ Analysis of Surface Properties, Supersaturation, and Solution Density Effects on Aqueous KNO3 Incrustation in a Cooling Crystallization Process


by
Mohsen H. Al-Rashed
*,
Adel F. Alenzi
,
Abubaker Mohammad
and
Khaled H. A. E. Alkhaldi
Department of Chemical Engineering, College of Technological Studies, The Public Authority for Applied Education and Training, Shuwaikh 70654, Kuwait
*
Author to whom correspondence should be addressed.
Processes 2026, 14(2), 201; https://doi.org/10.3390/pr14020201
Submission received: 5 December 2025 / Revised: 27 December 2025 / Accepted: 29 December 2025 / Published: 7 January 2026
(This article belongs to the Special Issue Process Control and Intensification in Chemical Engineering)

Abstract

The incrustation process represents a significant industrial challenge that affects various aspects of crystallization systems. It proceeds through successive stages, beginning with the induction period. This is followed by a transport phase, in which additional crystals are generated and sustained by overall supersaturation and the presence of seed crystals, leading to further attachment to surfaces. Ultimately, the process progresses to crystal removal and aging stages. In this study, a 1.2 dm3 thermostated crystallizer was utilized to investigate the incrustation phenomenon of potassium nitrate (KNO3). Deposits formed on three smooth and artificially roughened wall-surfaces, i.e., stainless steel (Type 316), copper, and acrylic, were examined. Contact angle measurements were conducted for all surfaces. The experiments covered a saturation temperature range of 303.15–333.15 K (±0.01 K) for various KNO3 solution concentrations between 5.0 and 60.0% w/w. The results show that deposit adhesion is stronger on rough surfaces than on smooth ones, and that the induction period for incrustation is shorter on rougher surfaces. Moreover, the influence of surface wettability and contact angle on incrustation becomes more pronounced at higher degrees of surface roughness. This highlights the coupled role of surface properties and thermal control in governing incrustation behavior.

Graphical Abstract

1. Introduction

The incrustation phenomenon is described as the accumulation of undesired crystalline deposits on the internals of liquid–solid systems. It may be detected on impellers, baffles, shafts, sensors, and heat transfer surfaces. This phenomenon represents a substantial industrial challenge which affects various aspects of crystallization systems such as efficiency, material loss, reduced product quality, increased energy consumption, mechanical failure, and safety issues [1]. Several factors may influence the nature of the incrustation process, viz. system geometry and materials involved, degree of supersaturation, type of surface material and its roughness, temperature and its rates of variation, and the hydrodynamic conditions. The interaction of these factors has prevented a comprehensive understanding of incrustation [1,2].
The efficiency decline of system performance in the presence of incrustation is a major cause for higher energy consumption in numerous processes such as refineries, fine chemical production, power plants, and the food and dairy industries. The lack of understanding of the various parameters as well as the interactions between them is the reason behind the ambiguity and complexity of incrustation. The mechanism of this phenomenon is significantly influenced by the surface roughness, morphology, and stickability of the deposited material [3,4,5,6,7,8,9].
The process of incrustation passes through distinctive stages. The first is the induction period, which represents the duration of nucleation and growth of the first crystals on system surfaces. Then, a transport process takes place in which more crystals are formed and sustained by bulk supersaturation and the presence of seeds, i.e., the initial stage crystals. Consequently, more crystals attach to the surface [10]. Finally, the removal and aging stages are to follow. The extent of each step is influenced by a mix of the previously mentioned factors. This reflects the complexity of quantitative analysis of the incrustation process [11].
Bansal et al. [12] studied crystallization fouling in plate and double-pipe heat exchangers. Plate-type heat exchangers were found to be noticeably better. For similar shear forces, the double-pipe heat exchanger was still worse. The plate design influenced the fouling results considerably. The same research group [13] investigated the role of micron-sized, non-crystallizing particles on crystallization fouling in commercially available small-plate heat exchangers. It was found that presence of 1 mm alumina particles suspended in solution decreased incrustation considerably.
Benzinger et al. [14] conducted research using a uniquely designed micro heat exchanger that was electrically heated and equipped with interchangeable foils made of various surface materials, such as stainless steel, FEP (fluorinated ethylene propylene), and DLC (diamond-like carbon). The temperature of these foils was maintained at a constant 100 °C. The microstructured section of the device was subjected to a laminar flow of a calcium nitrate/sodium hydrogen carbonate solution. Observations across all materials, encompassing uncoated stainless steel as well as surfaces coated with DLC and FEP, revealed a typical pattern of fouling behavior that began with an initial induction phase. Under laminar flow conditions, the type of surface material did not affect the duration of the induction period or the rate of change during the fouling period.
Mayer et al. [15] examined the early stage of incrustation, noting that the crust was composed of a non-uniform layer made up of individual crystals. To measure adhesion, they employed an innovative technique involving a micromanipulator to detach single crystals from the substrate. This substrate was secured to a spring table within a Scanning Electron Microscope (SEM) for precise observation and measurement.
Typically, the formation of deposits involves the unsteady transfer of heat, mass, and momentum, frequently accompanied by chemical reactions and/or phase transitions [11]. Although there have been many studies on the fouling phenomenon, including both scaling and incrustation, the issue of unwanted crystalline deposition on heat transfer surfaces remains unresolved. Nucleation is viewed as a phenomenon dictated by statistical laws [16]. The specific moment at which nucleation begins and crystal growth ensues cannot be accurately determined. The emergence of a nucleus on a cooled surface ought to be seen as a random event, not influenced by other nuclei appearing on foreign surfaces or by concurrent experiments [17].
Despite the possibility of achieving some measure of process consistency, completely removing variations is infeasible due to the stochastic nature of this phenomenon. The intricacy of the fouling process is shaped by the random nature of nucleation and the influence of various elements such as the hydrodynamic characteristics of the solution undergoing crystallization, the temperature of the heat transfer surface, the type of construction materials used, the nature of the solute, and the surface roughness and wettability of the external surfaces. As such, these effects cannot be universally applied to all situations and must be investigated on a case-by-case basis. Understanding these effects is vital for both mitigating fouling and for the detailed simulation of this process [18,19].
During the progress of the crystallization process, there will be more new crystal nuclei formed on the surface, and the previously formed crystals will continue to grow. As these processes proceed simultaneously, the surface coverage may reach a critical value affecting the overall heat transfer coefficient. A higher surface coverage results in reduced influence of the surface characteristics. When the surface is fully covered, incrustation is only influenced by secondary effects such as crystal habits and/or adhesion forces [20,21,22].
Certain foreign surface characteristics such as shape, size, charge, surface free energy, and polarity are significant in incrustation study. However, the actual measurements are only occasionally considered. The contact angle (θ) between the material surface and the crystalline deposits is a measure of the attraction between these different surfaces [23,24]. The value of θ varies from 180° for no attraction at all to 0° for a complete attraction between them.
In the literature, there are several attempts to define the relationship between wettability and roughness [25,26,27,28]. Wenzel suggested that the wettability results from surface chemistry and is boosted by the surface roughness. If a given surface is characterized as hydrophobic, it will exhibit even more hydrophobicity when the roughness is increased. This can be described as follows:
c o s θ m = r   c o s θ γ
where θ m and θ γ are the measured and Young contact angles, respectively. The ratio roughness r represents the ratio of the actual solid surface area to its corresponding projected area. For a smooth surface, r = 1, and r > 1 for a rough surface.
However, Equation (1) is based on the hypothesis that the liquid permeates through the roughness pores or interstices. Therefore, it has been indicated that it is applicable only if the size of the droplet is 2–3 orders of magnitude larger than the roughness scale. On the other hand, when the liquid does not permeate through the roughness pores or interstices, the Cassie equation is adopted instead which is stated as follows:
c o s θ m = x 1   c o s θ γ 1 + x 2   c o s θ γ 2
In this context, x1 and x2 denote the fraction of the area characterized by the specified chemistry, with subscripts 1 and 2 indicating two distinct surface chemistries. Another equation was proposed by Cassie and Baxter:
c o s θ m = x 1 c o s θ γ 1 + 1 1
where the second area is air. It has been demonstrated that in order to attain the real Cassie–Baxter stage, the roughness geometry has to be precisely prepared.
Al-Rashed et al. [29] conducted a systematic investigation into the growth and removal behavior of MgSO4·7H2O deposits formed on stainless steel (X5CrNi18-10) substrates with various surface finishes under controlled hydrodynamic conditions. Their study demonstrated that shear stress has a significant impact on the incrustation process, enhancing both deposition and removal rates, with the mirror-polished surfaces exhibiting the highest values. The authors highlighted that shear-induced transport phenomena, together with advanced surface texture parameters, play a crucial role in understanding and controlling the mechanisms governing MgSO4·7H2O scaling on metallic surfaces.
Potassium nitrate (KNO3) is a widely used compound in the agricultural industry, particularly in fertilizer production, where it is commonly processed and handled in aqueous form at elevated temperatures and concentrations [30,31,32]. Large-scale manufacturing and formulation of KNO3 involve crystallization, dissolution, and thermal processing steps, all of which can promote incrustation and fouling on equipment surfaces. In agricultural applications, KNO3 is valued for its ability to enhance plant growth and alleviate the effects of salinity and drought stress. However, these same applications require the use of highly concentrated aqueous solutions, which increases the likelihood of crystallization-related deposition during industrial processing. Despite this practical relevance, systematic investigations of surface-controlled incrustation behavior in KNO3 crystallization systems are still relatively limited.
In industrial practice, incrustation is commonly mitigated through chemical additives, surface coatings, or frequent cleaning operations; however, these approaches may increase operating costs or introduce additional process complexity. A deeper understanding of how surface properties, wettability, and process conditions influence incrustation behavior can therefore provide valuable guidance for equipment design and operational strategies in potassium nitrate production. Despite its industrial relevance, systematic studies addressing surface-controlled incrustation behavior in KNO3 crystallization systems remain limited.
The deposits of KNO3 on three smooth and artificially roughened surfaces, i.e., stainless steel (Type 316), copper, and acrylic, were investigated. The focus of this work was to study the solution density as a function of temperature and its correlation with the under- to supersaturation of concentration range of 5.0–60.0% w/w within a temperature range of 303.15–333.15 K (±0.01 K). The effects of surface type and roughness were then examined. Finally, some practical guidelines of industrial interest were derived from this work for limiting incrustation.

2. Materials and Methods

2.1. Experimental Set-Up

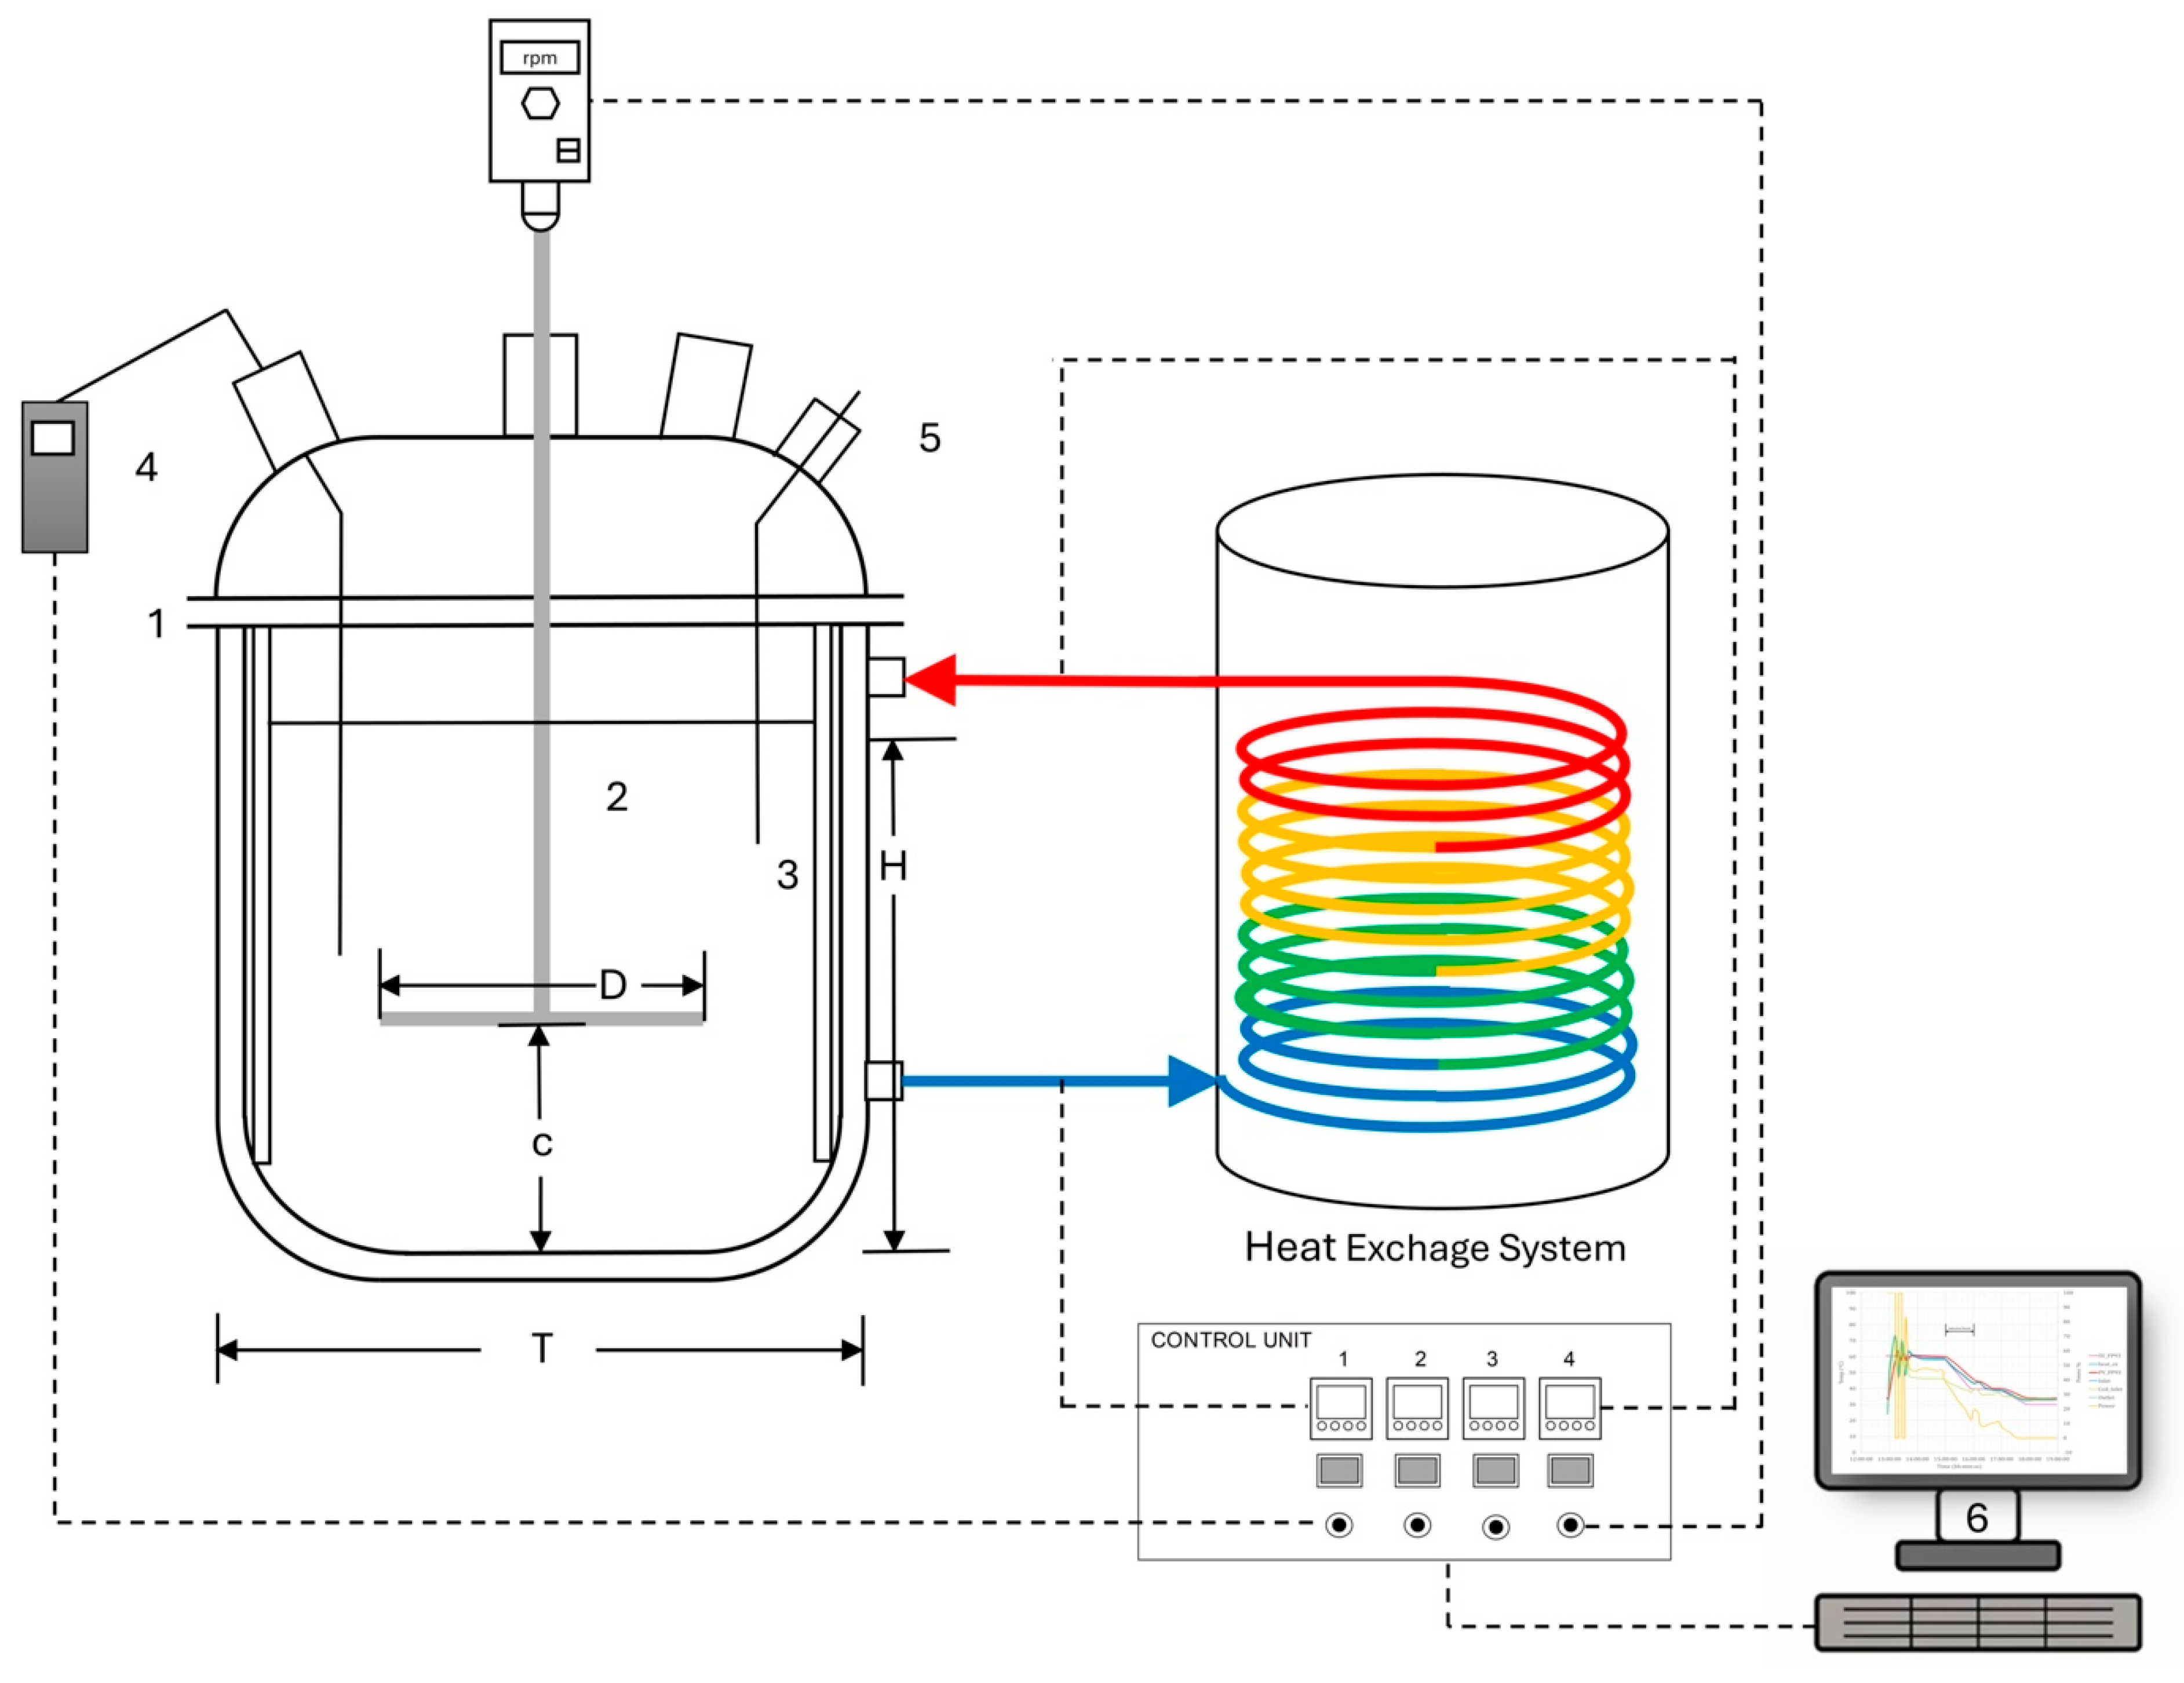
A 1.2 dm3 thermostated crystallizer was utilized to carry out incrustation experiments, as shown in Figure 1. There were four baffles and a mechanical stirrer. The investigation covered a saturation temperature range of 303.15–333.15 K (±0.01 K) for various potassium nitrate concentrations between 5.0 and 60.0% w/w.
An excess amount of KNO3 (LOBA, CAS No.: 7757-79-1) was dissolved in water to prepare saturated solutions. Reverse osmosis-purified water with a conductivity of 0.06 μS·cm−1 was used. The solution was mixed for 2 h to obtain equilibrium between suspended crystals and solution. Then, density readings were taken from a densimeter (Anton Paar DMA 4500) with a precision and resolution of ±5 × 10⁻⁵ and ±1 × 10⁻⁵ g·cm−3, respectively.
A syringe with a filter of 0.45 μm was used to take the samples. To avoid any crystallization during the sampling and densimeter injection procedures, the syringe was preheated to 5 K above the temperature of the sample. Also, the temperature of the measuring cell was set at the same temperature as that of the bulk solution. The average of three independent density measurements was taken for each recorded density data point with a maximum standard deviation of 1.97 × 10⁻⁵ g·cm−3.
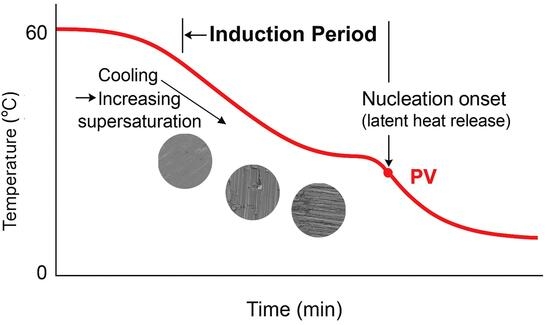
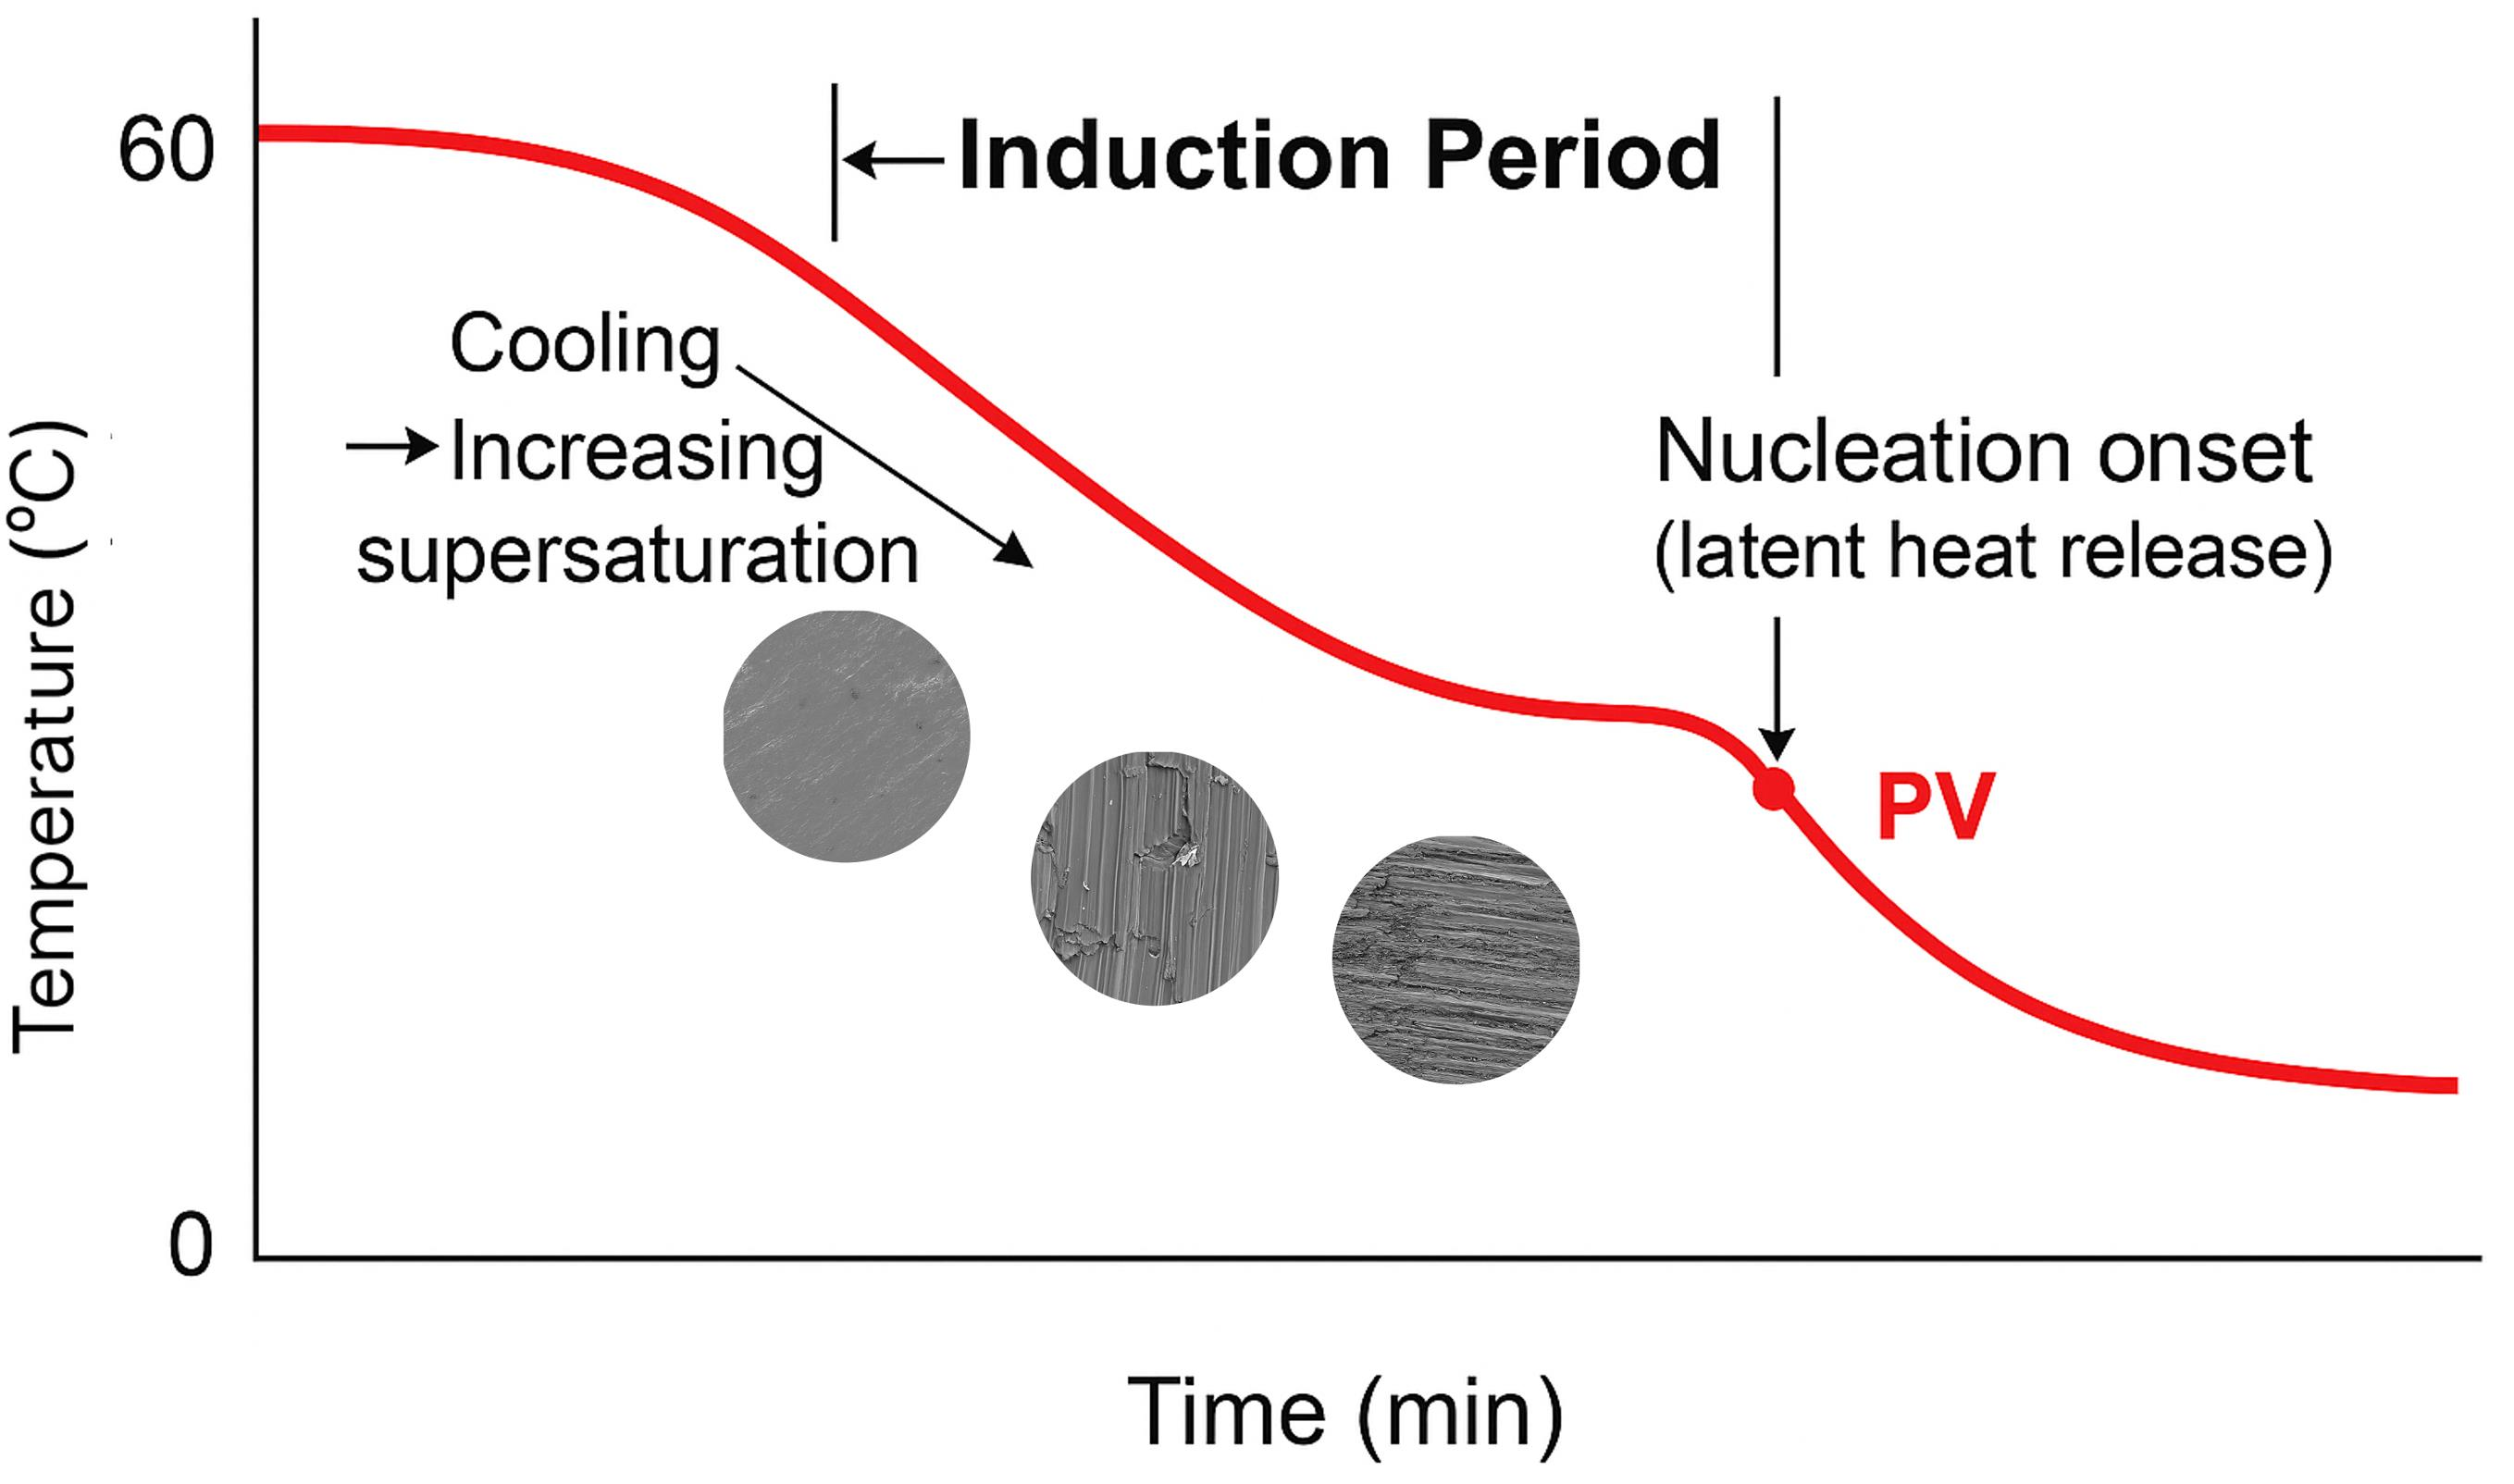
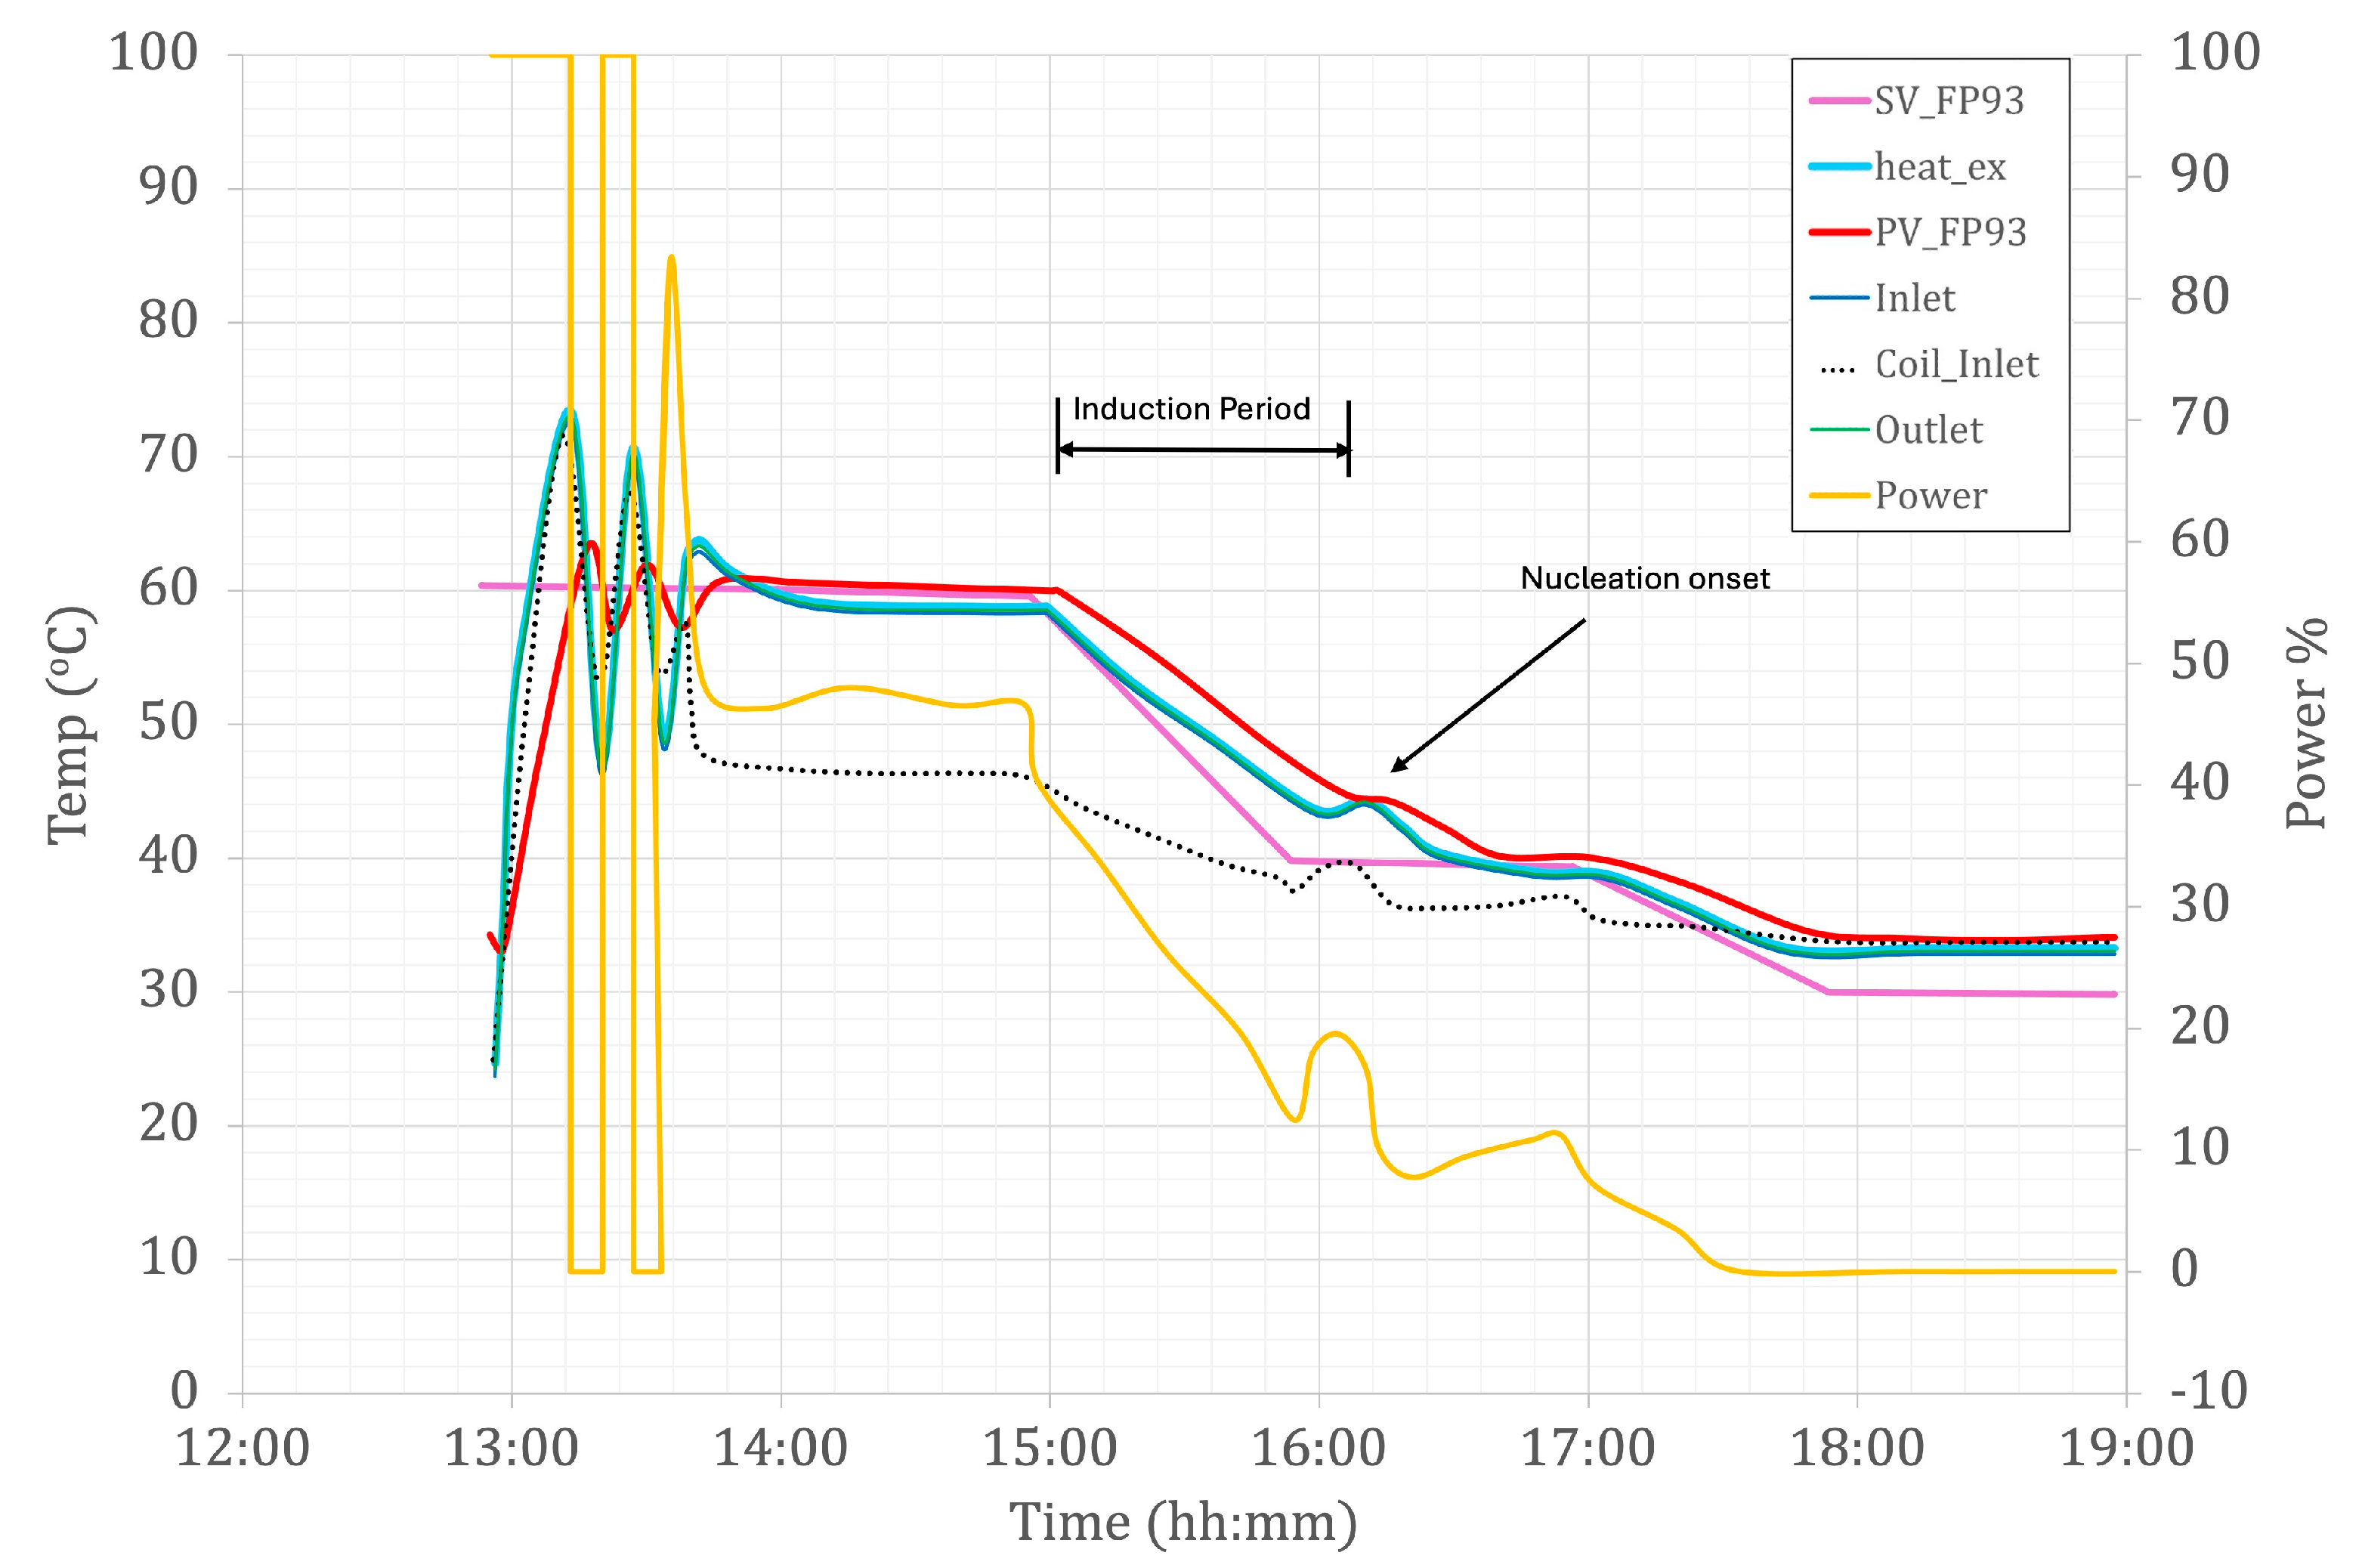
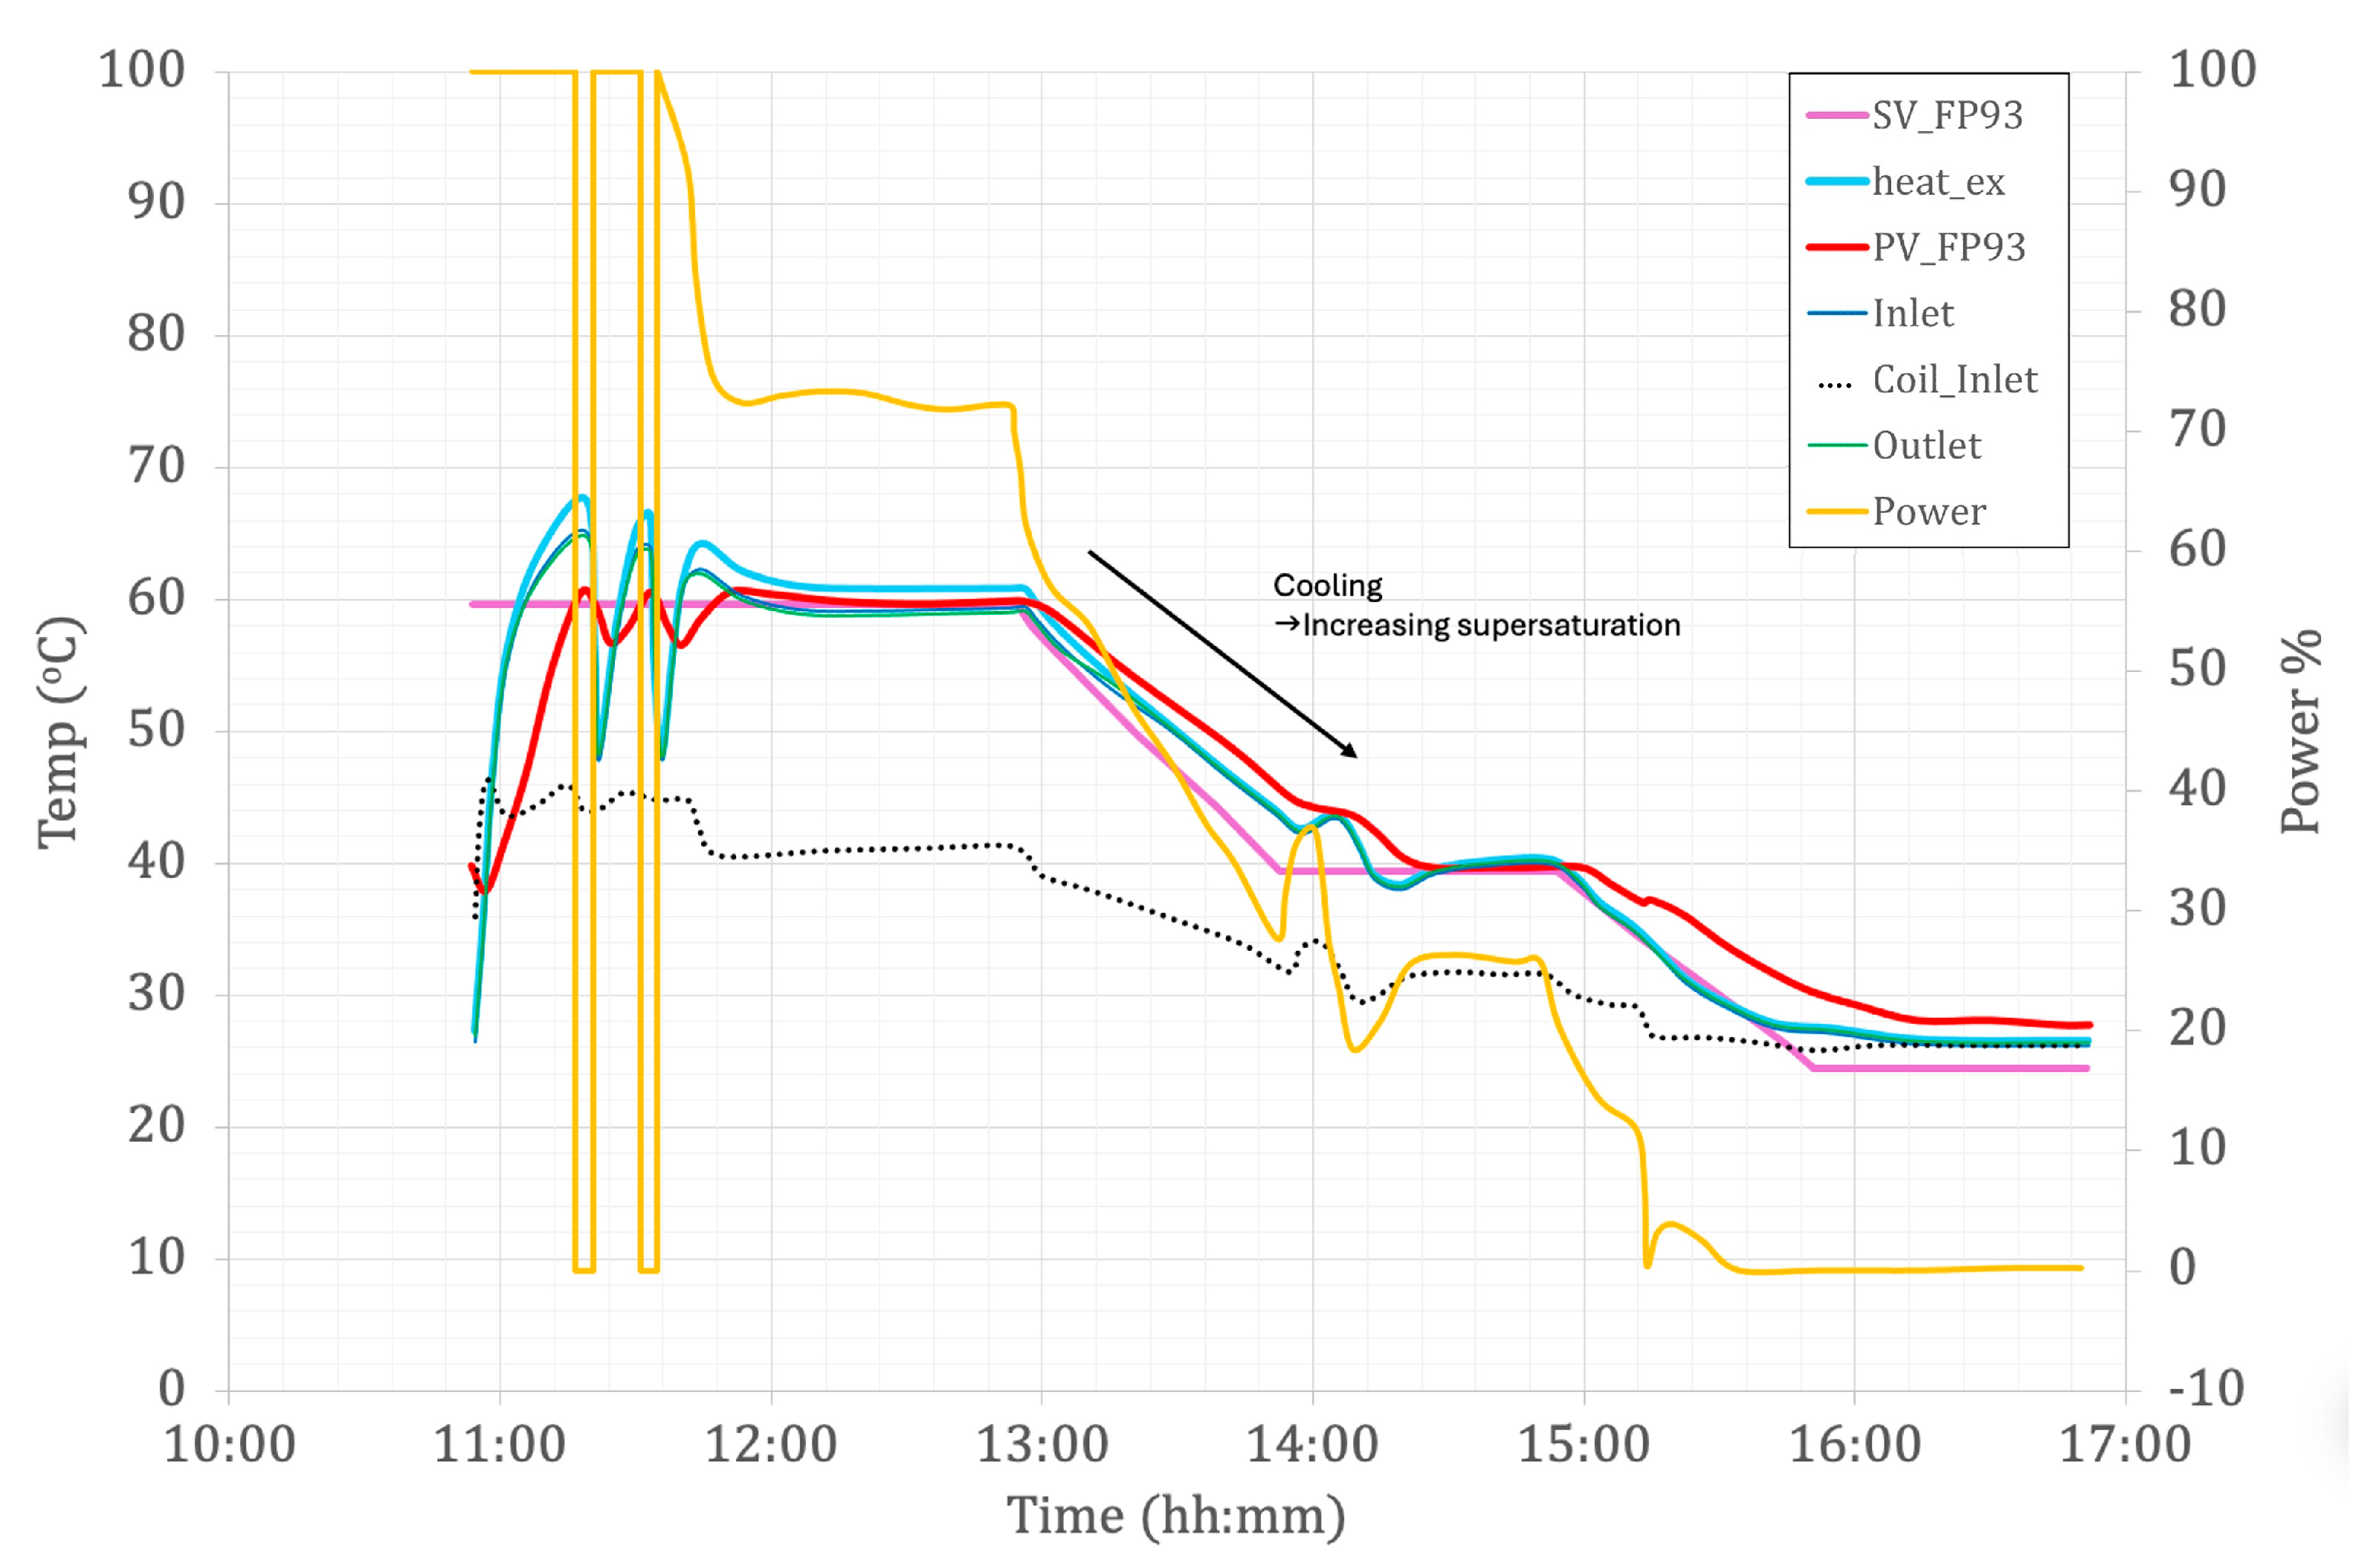
Each experiment lasted approximately 6 h, during which the PV_FP93 sensor provided the primary temperature record. Its smooth decline and subsequent inflection were used to identify the induction period and nucleation onset, while additional temperature signals (inlet, outlet, coil-inlet, and heat-exchanger) captured the cooling load and thermal gradients driving supersaturation. The SV_FP93 setpoint and heater-power traces were recorded continuously throughout the 6 h run to document controller behavior and to distinguish intentional cooling adjustments from thermal responses associated with nucleation and latent-heat release.

2.2. Materials

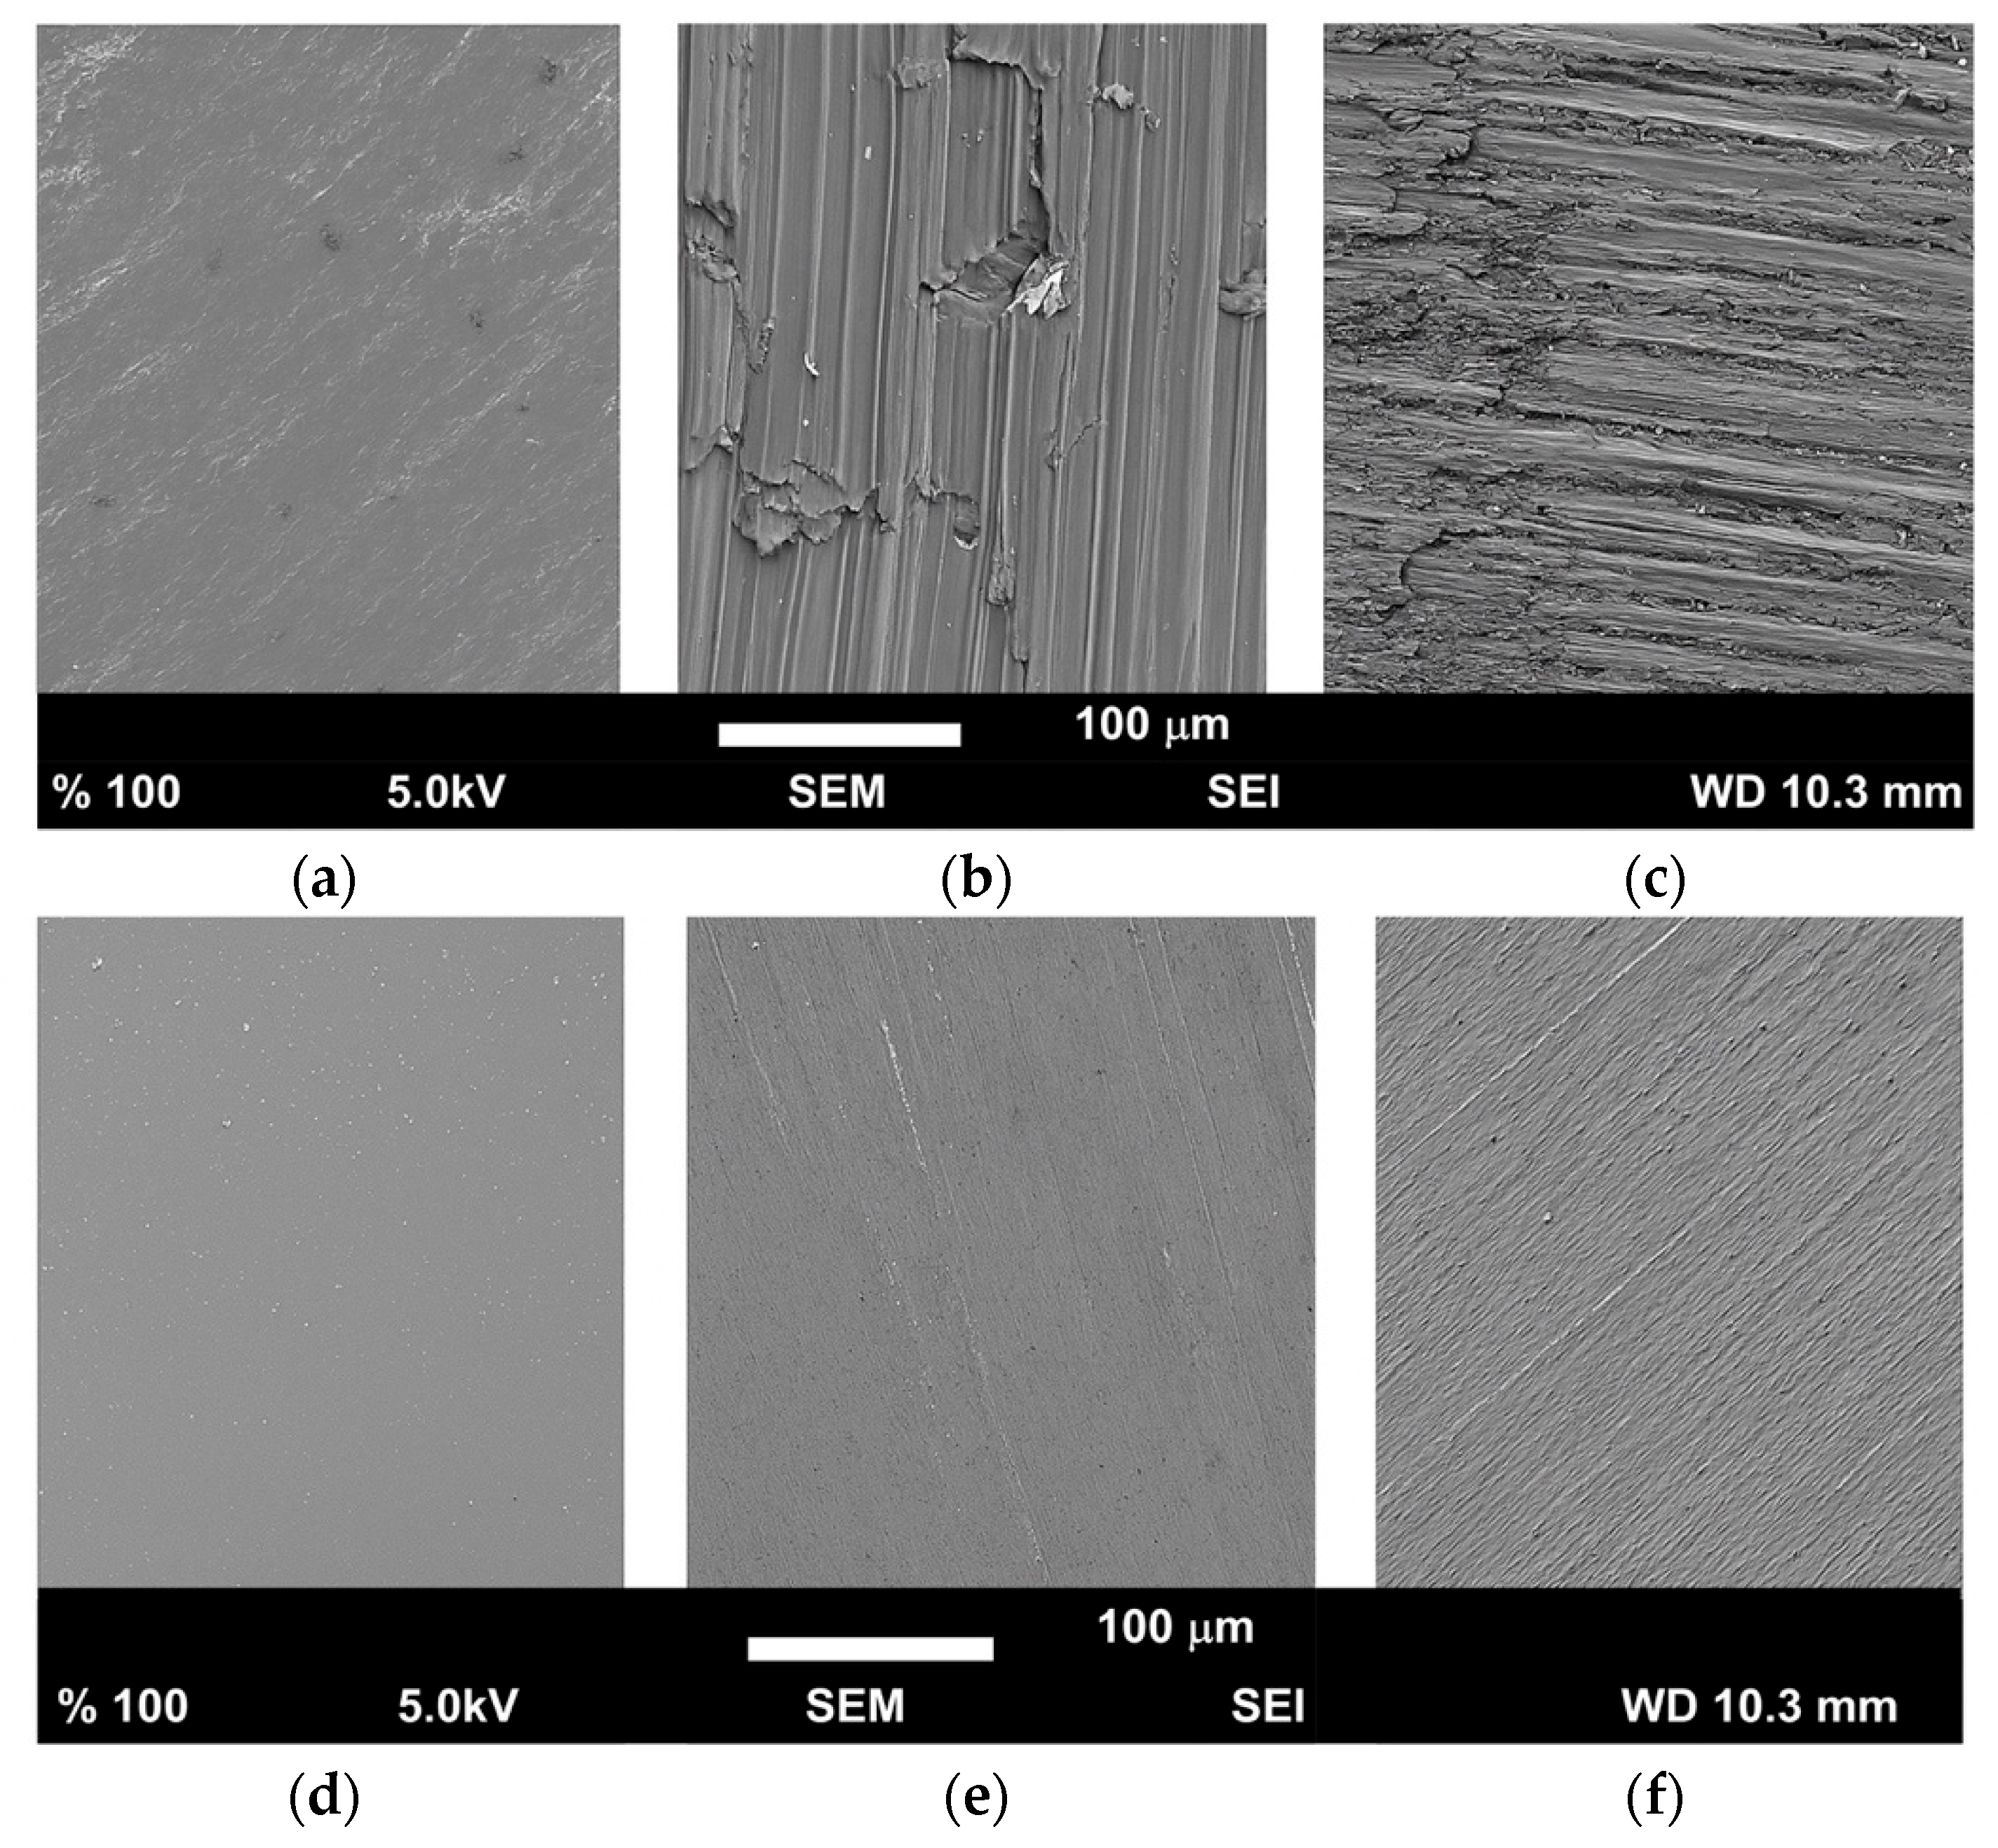
In the study, various plates constructed from acrylic, copper, and Type 316 stainless steel, each exhibiting distinct roughness and wettability properties, were examined. Initially, six plates, each measuring 150 mm in length, 15 mm in width, and 3 mm in thickness, underwent a mechanical polishing process. This process involved the sequential use of abrasive papers with a gradation spectrum ranging from 60 to 2000. For each material, two plates were prepared differently. One plate was carefully polished with a polishing paste to achieve a mirror-like finish. The grinding of these hard materials required the use of corundum sands with grain sizes of 50 μm, 100 μm, and 250 μm. Consequently, the other plate was subjected to sandblasting using aged sands of 120 µm and 150 µm sizes, which contained tiny fragments of ceramics and metals from earlier grinding processes. The plate that underwent sandblasting showed a markedly increased hydrophobicity in comparison to the other sample. Consequently, this resulted in plates with differing levels of surface roughness and wettability. The Scanning Electron Microscopy (SEM, JSM-F100) images of each plate can be found in Figure 2. The surface topography is directly influenced by the grain size of the sands used in the sandblasting. When examining the impact of grain size on the surface roughness, it is evident that larger grain sizes produce a more varied and random pattern on the surface.

3. Results and Discussion

3.1. Surface Analysis

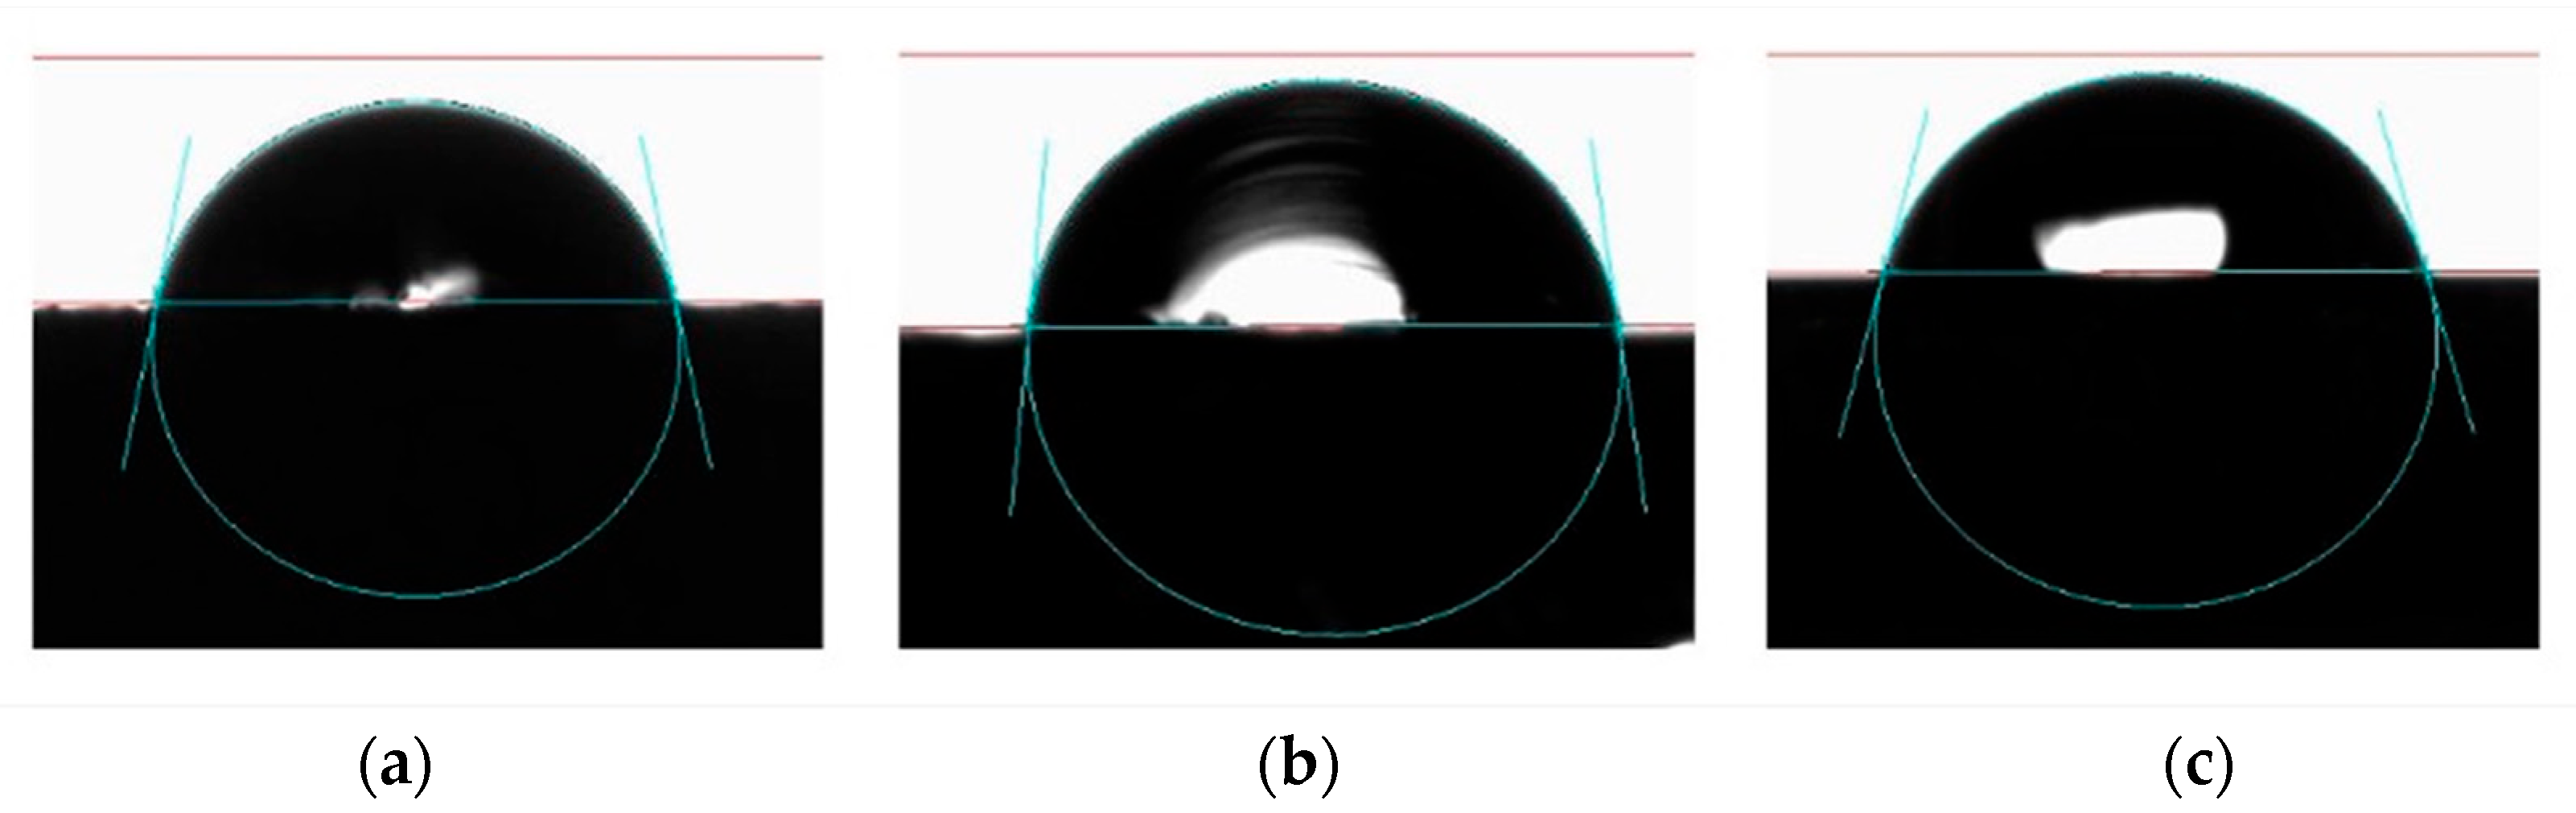
Beforehand, mirror-like and rough flat surfaces, i.e., stainless steel, copper, and acrylic, were prepared and inserted into the crystallizer. The SEM images presented in Figure 2 illuminate the quality of surface finishing, highlighting both their smoothest and roughest aspects. This aids in understanding and analyzing the different types of surfaces being studied. The evidence for this is found in the data on contact angles and wettability properties. Table 1 summarizes the contact angle (θ) measurements for the three investigated surfaces, which were obtained using a customized optical goniometer with 0.5 μL droplets. Each indicated reading (the mean value of right and left angles) is the average of three different locations on each surface. The table illustrates higher θ for rough surfaces than smooth ones for each type individually. For smooth surfaces, acrylic gives the highest θ values, then stainless steel and copper, respectively. Figure 3 demonstrates sample measurements of θ.
It has been observed that deposition layers adhere more strongly to rough surfaces (high contact angles) compared to smooth surfaces (low contact angles). Furthermore, as the surfaces of the plates become more hydrophobic, the impact of incrustation diminishes. The interaction between molecules or atoms at the surface being deposited on and those in the solution varies according to the chemical properties of both the surface and the fouling liquid, determining the types of forces or interactions involved [33]. Typically, a lower surface free energy (reflected by the contact angle) of the depositing surface results in diminished adhesion strength of the deposits. This principle significantly affects the efficiency of deposit removal [34]. Surfaces possessing low energy levels tend to be more resilient to fouling accumulation and facilitate easier cleaning, as a result of weaker adhesive forces at the substrate–liquid boundary. Herz et al. [35] showed that fouling rates become especially sensitive at low contact angle values. Under these conditions, even small changes in surface wettability can strongly affect deposition behavior, emphasizing the importance of wettability trends rather than the absolute contact angle values.

3.2. KNO3 Solution Density

Taking into account the shape and behavior of the solubility curve and the metastable zone of KNO3 [20,36,37,38], the experiments were initially carried out at a temperature of 338.15 K, higher than the temperature range under investigation. Once the saturated KNO3 solution reached a hydrodynamic steady state, a gradual cooling of the solution started and the temperature change was measured by a precise thermometer. The induction period could be detected, as well as the point of nucleation, where a sudden temperature change is observed.
The thermal behavior of the crystallizer during cooling was monitored through several temperature and control signals, as shown in Figure 4 and Figure 5. The red PV_FP93 trace represents the actual solution temperature and, after initial stabilization fluctuations, stabilizes slightly above 60 °C before decreasing smoothly as cooling proceeds. A distinct inflection observed immediately after the induction period marks the onset of nucleation and the associated latent-heat release, making PV_FP93 the most direct and reliable indicator of supersaturation development and crystallization initiation. The inlet-temperature signal (blue), corresponding to the cooling fluid entering the heat-exchanger coil, initially exhibits oscillations as the controller stabilizes. As the system settles, it follows the imposed cooling trajectory, reflecting the intensity of heat extraction applied to drive the solution into the supersaturated region. In contrast, the outlet-temperature profile (green), which records the temperature of the fluid leaving the crystallizer loop, remains slightly lower than the inlet temperature and declines steadily as heat is removed. The difference between these two signals provides a useful measure of the instantaneous cooling load and the efficiency of heat removal during supersaturation generation.
Additional thermal measurements further characterize the cooling dynamics and their influence on nucleation behavior. The heat-exchanger temperature (cyan) follows the general trend of the solution temperature but with a slight lag due to thermal resistance across the exchange surface. Its gradual decline highlights the sustained thermal gradient driving mass transfer and the rate at which supersaturation develops. The coil-inlet temperature (dotted line) displays the most dynamic behavior early in the experiment, showing rapid drops as the controller delivers strong cooling input. It later stabilizes at a lower limit as the system reaches a steady cooling regime. The programmed SV_FP93 setpoint (purple) decreases stepwise according to the cooling schedule, providing a reference for the controller’s heating and cooling adjustments. This set trajectory enables a clear distinction between intentional cooling and spontaneous thermal disturbances such as nucleation. Finally, the heater-power trace (orange) initially fluctuates as the controller stabilizes, then drops sharply once intensive cooling begins. Small rises in this signal coincide with nucleation or crystallization events, where compensatory heating responds to localized latent-heat release. Together, these thermal and control curves offer a comprehensive operational overview of the induction period, nucleation onset, and subsequent crystal growth behavior.
From a previous investigation [39] for KNO3 aqueous solution,
ρ s o l = ( 980.23 + 844.95   c 0.9531   T + 0.006285   T 2 ) / 1000
where ρ s o l represents the density of the solution g·cm−3, T is the temperature, and c denotes the solution concentration kg/kg solution The concentration of a saturated solution, c*, can be calculated using the following equation:
c = 0.06131 + 0.009531   T 3.035 × 10 5   T 2
Density of saturated solution ρ s a t could be calculated from Equation (4) substituting c instead of c* from Equation (5), thus:
ρ s a t = ( 1032.03 + 7.1001   T 0.019255   T 2 ) / 1000
Table 2 and Table 3 present the KNO3 density readings from the experiments and the empirical formula. The percentage error is recorded for each density reading. The formula gives adequate density predictions for low concentrations. However, for higher concentrations 50% w/w and above, the difference between the experiments and the formula increases. This deviation may be related to the high level of saturation and the amount of crystals that have a higher probability of appearing in the solution. Also, the complex nature of the crystallization mechanisms, such as agglomeration and attrition, may contribute to this deviation.

4. Conclusions

Higher contact angles (θ) were obtained for rough surfaces compared with smooth ones for all investigated materials, i.e., stainless steel, copper, and acrylic. For smooth surfaces, acrylic exhibited the highest θ values, followed by stainless steel and copper, respectively. Rough surfaces showed stronger adhesion of the deposited layer than smooth surfaces, which is attributed to enhanced surface heterogeneity and mechanical interlocking. In addition, the induction period was shorter for the roughened surfaces. The influence of surface wettability and contact angle on incrustation became increasingly significant at higher degrees of surface roughness. The SEM images provided insights into the differences in surface topography and supported the interpretation of the contact angle and wettability results. Moreover, in Figure 4 and Figure 5, the temperature and control signals recorded during cooling revealed a clear thermal profile of the crystallization process. The PV_FP93 trace showed a smooth decline until a distinct inflection marking nucleation and latent-heat release, while the inlet, outlet, heat-exchanger, and coil-inlet temperatures reflected the effectiveness of heat removal and the evolving thermal gradients that drive supersaturation. Small increases in heater power further highlighted nucleation events through controller compensation. Collectively, these measurements tracked the shift from controlled cooling to the induction period and the initiation of crystallization. The empirical correlation used for KNO3 solution density provided satisfactory predictions at low concentrations. However, deviations increased at concentrations of 50 wt% and above, likely due to high saturation levels and the increased likelihood of crystal formation, as well as the complex nature of the crystallization mechanisms.

Author Contributions

Conceptualization, M.H.A.-R., A.F.A., A.M. and K.H.A.E.A.; methodology, M.H.A.-R., A.F.A., A.M. and K.H.A.E.A.; software, M.H.A.-R. and K.H.A.E.A.; validation, M.H.A.-R., A.F.A., A.M. and K.H.A.E.A.; formal analysis, M.H.A.-R., A.F.A., A.M. and K.H.A.E.A.; investigation, M.H.A.-R., A.F.A., A.M. and K.H.A.E.A.; data curation, M.H.A.-R., A.F.A., A.M. and K.H.A.E.A.; writing—original draft preparation, M.H.A.-R.; writing—review and editing, M.H.A.-R., A.F.A., A.M. and K.H.A.E.A.; visualization, M.H.A.-R. and K.H.A.E.A.; supervision, M.H.A.-R.; project administration, M.H.A.-R., A.F.A., A.M. and K.H.A.E.A. All authors have read and agreed to the published version of the manuscript.

Funding

This research received no external funding.

Data Availability Statement

The data presented in this study are contained within the article, and additional raw data are available from the corresponding author upon request.

Acknowledgments

This paper is dedicated to the memory of Janusz Wójcik, who sadly passed away before its publication. We remain deeply grateful for his vision, encouragement, and inspiration.

Conflicts of Interest

The authors declare no conflicts of interest.

References

  1. Wijk, L.A.v. Incrustation Reduction in Industrial Crystallizers. In Proceedings of the 12th Symposium on Industrial Crystallization, Warsaw, Poland, 21–23 September 1993; Rojkowski, Y.H., Ed.; Cambridge University Press: Cambridge, UK, 1993; Volume 2, pp. 5–61. [Google Scholar]
  2. Liu, Y.; Wang, X.; Lu, J.; Ching, C. Influence of the Roughness, Topography, and Physicochemical Properties of Chemically Modified Surfaces on the Heterogeneous Nucleation of Protein Crystals. J. Phys. Chem. B 2007, 111, 13971–13978. [Google Scholar] [CrossRef] [Scilit] [PubMed]
  3. Jancic, S.J.; Grootscolten, P.A.M. Industrial Crystallization; Springer: Berlin/Heidelberg, Germany, 1984. [Google Scholar]
  4. Al-Gailani, A.; Charpentier, T.V.J.; Sanni, O.; Neville, A. Crystallization Fouling in Domestic Appliances and Systems. Heat Transf. Eng. 2022, 43, 1301–1310. [Google Scholar] [CrossRef] [Scilit]
  5. Lv, Y.; Lu, K.; Ren, Y. Composite Crystallization Fouling Characteristics of Normal Solubility Salt in Double-Pipe Heat Exchanger. Int. J. Heat Mass Transf. 2020, 156, 119883. [Google Scholar] [CrossRef] [Scilit]
  6. Zaman, M.Z.; Wang, S. Experimental Investigation of Surface Roughness/Wettability Pattern Effect on Crystallization Fouling Over Falling-Film Flow. Desalination 2024, 575, 117324. [Google Scholar] [CrossRef] [Scilit]
  7. Rahimi, S.; Peyghambarzadeh, S.M.; Esfeh, H.K.; Azizi, S.; Malayeri, M.R. Experimental Investigation of Temperature and Hydrodynamics on CaCO3 Fouling During Convective Heat Transfer and Subcooled Flow Boiling. Appl. Therm. Eng. 2023, 220, 119698. [Google Scholar] [CrossRef] [Scilit]
  8. Mao, S.; Zhou, T.; Xue, C.; Xu, P.; Liu, C. Investigation on Fine Particle Deposition Characteristics in Narrow Rectangular Channel Based on Eulerian-Lagrangian Method. Powder Technol. 2023, 420, 118381. [Google Scholar] [CrossRef] [Scilit]
  9. Han, Z.; Zhang, H.; Wang, C.; Zhou, X. Local Deposition Characteristics of Calcium Carbonate Fouling in Different Enhanced Tubes. Case Stud. Therm. Eng. 2024, 54, 104048. [Google Scholar] [CrossRef] [Scilit]
  10. Zhang, Y.; Wang, M.; Lin, X.; Huang, W. Effect of Substrate Surface Microstructure on Heterogeneous Nucleation Behavior. J. Mater. Sci. Technol. 2012, 28, 67–72. [Google Scholar] [CrossRef] [Scilit]
  11. Vendel, M.; Rasmuson, A.C. Mechanisms of initiation of incrustation. AIChE J. 1997, 43, 1300–1308. [Google Scholar] [CrossRef] [Scilit]
  12. Bansal, B.; Müller-Steinhagen, H.; Chen, X.D. Comparison of Crystallization Fouling in Plate and Double-Pipe Heat Exchangers. Heat Transf. Eng. 2001, 22, 13–25. [Google Scholar] [CrossRef] [Scilit]
  13. Bansal, B.; Chen, X.D.; Müller-Steinhagen, H. Use of Non Crystallizing Particles to Mitigate Crystallization Fouling. Int. Commun. Heat Mass Transf. 2003, 30, 695–706. [Google Scholar] [CrossRef] [Scilit]
  14. Benzinger, W.; Brandner, J.J.; Schygulla, U.; Schubert, K. Influence of Different Surface Materials on the Fouling Process in a Microstructured Heat Exchanger Under Laminar Regime. In ECI Symposium Series, Volume RP5, Proceedings of the 7th International Conference on Heat Exchanger Fouling and Cleaning—Challenges and Opportunities, Tomar, Portugal, 1–6 July 2007; Müller-Steinhagen, H., Malayeri, M.R., Watkinson, A.P., Eds.; Engineering Conferences International: Tomar, Portugal, 2007; Volume 50, pp. 394–402. [Google Scholar]
  15. Mayer, M.; Augustin, W.; Scholl, S. Adhesion of Single Crystals on Modified Surfaces in Crystallization Fouling. J. Cryst. Growth 2012, 361, 152–158. [Google Scholar] [CrossRef] [Scilit]
  16. Kim, K.-J.; Mersmann, A. Estimation of Metastable Zone Width in Different Nucleation Processes. Chem. Eng. Sci. 2001, 56, 2315–2324. [Google Scholar] [CrossRef] [Scilit]
  17. Kadm, S.S.; Kulkarni, S.A.; Ribera, R.C.; Stankiewicz, A.I.; Ter-Horst, J.H.; Kramer, H.J.M. A New View on the Metastable Zone Width During Cooling Crystallization. Chem. Eng. Sci. 2012, 72, 10–19. [Google Scholar] [CrossRef] [Scilit]
  18. Helalizadeh, A.; Müller-Steinhagen, H.; Jamialahmadi, M. Mixed Salt Crystallisation Fouling. Chem. Eng. Process. 2000, 39, 29–43. [Google Scholar] [CrossRef] [Scilit]
  19. Pääkkönen, T.; Riihimäki, M.; Simonson, C.; Muurinen, E.; Keiski, R. Crystallization Fouling of CaCO3—Analysis of Experimental Thermal Resistance and its Uncertainty. Int. J. Heat Mass Trans. 2012, 55, 6927–6937. [Google Scholar] [CrossRef] [Scilit]
  20. Mullin, J.W. Crystallization, 4th ed.; Elsevier: Amsterdam, The Netherlands, 2001. [Google Scholar]
  21. Haasner, T.; Kuszlik, A.K.; Stadler, R.; Ulrich, J. Surface properties—A key for nucleation in melt crystallization processes. Chem. Eng. Technol. 2001, 24, 873–878. [Google Scholar] [CrossRef] [Scilit]
  22. Li, K.; Xu, S.; Shi, W.; He, M.; Li, H.; Li, S.; Zhou, X.; Wang, J.; Song, Y. Investigating the Effects of Solid Surfaces on Ice Nucleation. Langmuir 2012, 28, 10749–10754. [Google Scholar] [CrossRef] [Scilit]
  23. Bogacz, W.; Al-Rashed, M.H.; Lemanowicz, M.; Wójcik, J. A Simple Densimetric Method to Determine Saturation Temperature of Aqueous Potassium Chloride Solution. J. Solut. Chem. 2016, 45, 1071–1076. [Google Scholar] [CrossRef] [Scilit]
  24. Bogacz, W.; Lemanowicz, M.; Al-Rashed, M.H.; Nakonieczny, D.; Piotrowski, T.; Wójcik, J. Impact of Roughness, Wettability and Hydrodynamic Conditions on the Incrustation on Stainless Steel Surfaces. Appl. Therm. Eng. 2017, 112, 352–361. [Google Scholar] [CrossRef] [Scilit]
  25. Moutinho, I.; Figueiredo, M.; Ferreira, P. Evaluating Surface Energy of Laboratory-Made Paper Sheets by Contact Angle Measurements. Tappi J. 2007, 6, 26–32. [Google Scholar] [CrossRef] [Scilit]
  26. Rosales-Leal, J.I.; Rodríguez-Valverde, M.A.; Mazzaglia, G.; Ramón-Torregrosa, P.J.; Díaz-Rodríguez, L.; García-Martínez, O.; Vallecillo-Capilla, M.; Ruiz, C.; Cabrerizo-Vílchez, M.A. Effect of Roughness, Wettability and Morphology of Engineered Titanium Surfaces on Osteoblast-Like Cell Adhesion. Colloids Surf. A Physicochem. Eng. Asp. 2010, 365, 222–229. [Google Scholar]
  27. Tuteja, A.; Choi, W.; Ma, M.; Mabry, J.M.; Mazzella, S.A.; Rutledge, G.C.; McKinley, G.H.; Cohen, R.E. Designing Superoleophobic Surfaces. Science 2007, 318, 1618–1622. [Google Scholar] [CrossRef] [Scilit]
  28. Antonov, D.V.; Islamova, A.G.; Nigay, A.; Slyusarskiy, K.V.; Strizhak, P.A. The Effect of Metal Surface Roughness on the Characteristics of Sessile Droplet Evaporation: Experimental Data and Numerical Simulation. Phys. Fluids 2025, 37, 062106. [Google Scholar] [CrossRef] [Scilit]
  29. Al-Rashed, M.H.; Dzido, G.; Wójcik, J. Minimum Solution Shear Stress Preventing MgSO4·7H2O Incrustation on Stainless Steel Plates. Cryst. Growth Des. 2024, 24, 3691–3698. [Google Scholar] [CrossRef] [Scilit]
  30. Bhuiyan, S.A.; Boyd, M.C.; Dougall, A.J.; Martin, C.; Hearnden, M. Effects of Foliar Application of Potassium Nitrate on Suppression of Alternaria Leaf Blight of Cotton (Gossypium hirsutum) in Northern Australia. Australas. Plant Pathol. 2007, 36, 462–465. [Google Scholar] [CrossRef] [Scilit]
  31. Kaya, C.; Tuna, A.L.; Ashraf, M.; Altunlu, H. Improved Salt Tolerance of Melon (Cucumis melo L.) by the Addition of Proline and Potassium Nitrate. Environ. Exp. Bot. 2007, 60, 397–403. [Google Scholar] [CrossRef] [Scilit]
  32. Sajko, M.; Kovalíková-Dučaiová, Z.; Paľove-Balang, P.; Repčák, M. Physiological Responses of Matricaria Chamomilla to Potassium Nitrate Supply and Foliar Application of Ethephon. J. Plant Growth Regul. 2018, 37, 360–369. [Google Scholar] [CrossRef] [Scilit]
  33. Kazi, S.; Duffy, G.; Chen, X. Fouling and Fouling Mitigation on Heated Metal Surfaces. Desalination 2012, 288, 126–134. [Google Scholar] [CrossRef] [Scilit]
  34. Förster, M.; Augustin, W.; Bohnet, M. Influence of the Adhesion Force Crystal/Heat Exchanger Surface on Fouling Mitigation. Chem. Eng. Proc. 1999, 38, 449–461. [Google Scholar] [CrossRef] [Scilit]
  35. Herz, A.; Malayeri, M.R.; Müller-Steinhagen, H. Fouling of Roughened Stainless Steel Surfaces During Convective Heat Transfer to Aqueous Solutions. Energy Convers. Manag. 2008, 49, 3381–3386. [Google Scholar] [CrossRef] [Scilit]
  36. Brown, C.J.; Ni, X.W. Determination of Metastable Zone Width, Mean Particle Size and Detectable Number Density Using Video Imaging in an Oscillatory Baffled Crystallizer. Cryst. Eng. Commun. 2012, 14, 2944–2949. [Google Scholar] [CrossRef] [Scilit]
  37. Kobari, M.; Kubota, N.; Hirasawa, I. Computer Simulation of Metastable Zone Width for Unseeded Potassium Sulfate Aqueous Solution. J. Cryst. Growth 2011, 317, 64–69. [Google Scholar] [CrossRef] [Scilit]
  38. Rousseau, R.W. Crystallization Processes. In Reference Module in Chemistry, Molecular Sciences and Chemical Engineering; Elsevier: Amsterdam, The Netherlands, 2014. [Google Scholar] [CrossRef] [Scilit]
  39. Machej, K.; Wójcik, J. Opracowania danych fizykochemicznych I kinetycznych dla potrzeb ptojectowania krystalizatorów przy pomocy EMC. Inz. I Apar. Chem. 1987, 4, 13–15. [Google Scholar]
Figure 1. Experimental set-up, T = 120 mm, D/T = 0.5, c/T = 0.5, H/T = 1.0. 1. Crystallizer, 2. stirrer, 3. baffles, 4. digital thermometer + control unit, 5. sampling needle, 6. computer.
Processes 14 00201 g001
Figure 2. SEM images, rough surfaces: (a) acrylic, (b) copper, (c) stainless steel; smooth surfaces: (d) acrylic, (e) copper, (f) stainless steel.
Processes 14 00201 g002
Figure 3. Sample measurements of the contact angle; (a) acrylic CA left 79° and CA right 78°, (b) copper CA left 84° and CA right 82°, (c) stainless steel CA left 75° and CA right 74°.
Processes 14 00201 g003
Figure 4. Control unit graphical result showing temperature control (red line) of the KNO3 solution (40% w/w) and the heating/cooling water (jacket).
Processes 14 00201 g004
Figure 5. Control unit graphical result showing temperature control (red line) of the KNO3 solution (60% w/w) and the heating/cooling water (jacket).
Processes 14 00201 g005
Table 1. Experimental data of contact angle measurements for smooth and artificially roughened surfaces of acrylic, copper, and stainless steel using water drop (size: 5 μL) at 293.65 K and 101 kPa (SD: ±2–4°).
Solid PhaseSurface StatusContact Angle CA(M) a [°]Height [mm]S b [mm2]BD c [mm]
AcrylicRough92517211
Smooth77518712
CopperRough86520412
Smooth64418913
Stainless steelRough79520012
Smooth75519112
a: Mean values of right and left contact angle, b: Surface area, c: Bed diameter of the drop.
Table 2. Experimental data of density readings *, g·cm−3, for various KNO3 concentration levels at various temperatures (SD: ±0.001–0.002 g·cm−3).
Conc. %w/w5101520253035405060
Temp. K
303.151.0261.0531.0801.1041.1281.1511.1741.1921.2061.220
304.151.0251.0531.0791.1041.1271.1501.1741.1921.2081.223
305.151.0251.0521.0791.1031.1271.1501.1731.1911.2101.227
306.151.0241.0511.0791.1031.1261.1491.1731.1911.2121.231
307.151.0241.0501.0781.1021.1251.1481.1721.1901.2141.234
308.151.0241.0501.0781.1021.1251.1481.1721.1901.2161.238
309.151.0231.0491.0771.1011.1241.1471.1711.1891.2181.242
310.151.0231.0481.0771.1011.1241.1471.1701.1891.2191.246
311.151.0221.0481.0761.1001.1231.1461.1701.1881.2211.249
312.151.0221.0471.0761.1001.1231.1461.1691.1881.2231.253
313.151.0221.0461.0751.0991.1221.1451.1691.1871.2251.257
314.151.0211.0461.0751.0991.1221.1451.1681.1861.2241.257
315.151.0211.0461.0741.0981.1211.1441.1671.1851.2241.256
316.151.0201.0451.0741.0971.1201.1431.1671.1831.2231.256
317.151.0201.0451.0731.0971.1201.1431.1661.1821.2221.256
318.151.0191.0451.0731.0961.1191.1421.1651.1811.2221.255
319.151.0191.0441.0721.0961.1191.1421.1651.1791.2211.255
320.151.0181.0441.0711.0951.1181.1411.1641.1781.2201.255
321.151.0181.0431.0711.0941.1171.1401.1631.1771.2201.254
322.151.0171.0431.0701.0941.1171.1401.1631.1751.2191.254
323.151.0171.0431.0701.0931.1161.1391.1621.1741.2181.254
324.151.0161.0421.0691.0931.1161.1391.1611.1731.2171.253
325.151.0161.0421.0691.0921.1151.1381.1611.1711.2171.253
326.151.0151.0411.0681.0921.1141.1371.1601.1701.2161.253
327.151.0151.0411.0671.0911.1141.1371.1591.1691.2151.252
328.151.0141.0411.0671.0901.1131.1361.1591.1671.2151.252
329.151.0141.0401.0661.0901.1131.1351.1581.1661.2141.252
330.151.0131.0401.0661.0891.1121.1351.1571.1651.2131.251
331.151.0131.0401.0651.0891.1111.1341.1571.1631.2131.251
332.151.0121.0391.0651.0881.1111.1341.1561.1621.2121.251
333.151.0121.0391.0641.0881.1101.1331.1551.1611.2111.251
* For each recorded density data, the average of three independent density measurement was taken.
Table 3. Experimental data of density readings *, g·cm−3, for various KNO3 concentration levels compared with calculated density values from Equation (4) with the percentage error between them at 301.15, 313.15 and 333.15 K (SD: ±0.001–0.002 g·cm−3).
Conc. % w/w5101520253035405060
301.15 K
(0.320) **
Exp.1.0261.0531.0801.1041.1281.1511.1741.1921.2061.220
Formula1.0001.0421.0841.1261.1691.2111.2531.2951.3801.464
err%2.541.08−0.38−2.00−3.63−5.23−6.71−8.64−14.38−20.07
313.15 K
(0.394) **
Exp1.0221.0461.0751.0991.1221.1451.1691.1871.2251.257
Formula0.9941.0371.0791.1211.1631.2061.2481.2901.3751.459
err%2.670.93−0.34−2.01−3.67−5.27−6.78−8.67−12.21−16.09
333.15 K
(0.524) **
Exp.1.0121.0391.0641.0881.1101.1331.1551.1611.2111.251
Formula0.9881.0301.0721.1151.1571.1991.2411.2841.3681.453
err%2.370.83−0.78−2.50−4.22−5.84−7.46−10.59−12.96−16.17
* For each recorded density data, the average of three independent density measurements was taken. ** Supersaturation level kg/kg solution calculated from Equation (5).
Disclaimer/Publisher’s Note: The statements, opinions and data contained in all publications are solely those of the individual author(s) and contributor(s) and not of MDPI and/or the editor(s). MDPI and/or the editor(s) disclaim responsibility for any injury to people or property resulting from any ideas, methods, instructions or products referred to in the content.