Article

DIET-Intensified Dark Fermentation: Magnetite and Nickel–Iron-Doped Activated Carbon for Biohydrogen Production from Food Waste

by
Gabriela Simões Pereira
1,
Regina Mambeli Barros
2,*,
Rubenildo Vieira Andrade
3,
José Carlos Escobar Palacio
3,
Electo Eduardo Silva Lora
3,
Aylla Joani Mendonça Oliveira Pontes
4,
Adriele Maria de Cássia Crispim
4 and
João Victor Rocha de Freitas
5
1
Graduate Program in Energy Engineering, Federal University of Itajubá (UNIFEI), Itajubá 37500-903, MG, Brazil
2
Institute of Natural Resources (IRN), Federal University of Itajubá (UNIFEI), Av. BPS 1303, Itajubá 37500-903, MG, Brazil
3
Center of Excellence in Thermoelectric and Distributed Generation (NEST), Institute of Mechanical Engineering, Federal University of Itajubá (UNIFEI), Itajubá 37500-903, MG, Brazil
4
Graduate Program in Environment and Water Resources (POSMARH), Institute of Natural Resources (IRN), Federal University of Itajubá (UNIFEI), Itajubá 37500-903, MG, Brazil
5
Natural Resources Institute, Federal University of Itajubá (UNIFEI), Av. BPS, 1303, Itajubá 37500-903, MG, Brazil
*
Author to whom correspondence should be addressed.
Processes 2026, 14(18), 2972; https://doi.org/10.3390/pr14182972 (registering DOI)
Submission received: 13 August 2026 / Revised: 8 September 2026 / Accepted: 14 September 2026 / Published: 18 September 2026
(This article belongs to the Special Issue Green Bio-Hydrogen Energy and Biogas Production Technology)

Abstract

Background: Dark fermentation (DF) of organic solid waste (OSW) is a promising route for sustainable biohydrogen (bioH2) production, but it is often limited by slow interspecies electron transfer and by acidification of the medium. Promoting direct interspecies electron transfer (DIET) with conductive additives is a candidate strategy to intensify the process. Objective and methods: This study compares the effect of magnetite (Fe3O4), granular activated carbon (AC), and laboratory-synthesized nickel–iron-doped activated carbon (DC) on the DF of genuine post-consumer food waste. Batch assays were conducted in 2.1 L anaerobic reactors under mesophilic conditions (35 °C), in triplicate, using food waste as the substrate and raw UASB sewage sludge as a mixed inoculum, without pH control. Biohydrogen was quantified with a portable biogas analyzer and expressed as mL H2/g COD removed; the additives were characterized by SEM–EDS, and yields were compared by one-way ANOVA with Tukey post hoc test (α = 0.05). Main findings: Additive type had a highly significant effect on biohydrogen yield (F(6,14) = 48.7; p < 0.001; η2 = 0.954). DC at 4 g achieved the best performance, reaching 0.271 mL H2/g COD removed (≈4.5-fold higher than the additive-free control) and COD removals of 65.8–72.4%, whereas magnetite produced only sporadic, non-reproducible gains and undoped AC gave a modest, consistent improvement. Excessive acidification (final pH 2.5–3.1), attributed to the accumulation of volatile fatty acids under the deliberately unbuffered conditions, was the main operational limitation and is interpreted as a conservative ceiling on the yields reported here. Prospects: Metal-doped carbonaceous materials emerged as the most robust and reproducible strategy for intensifying DF of food waste; future work should couple this route with pH buffering and with electrochemical and microbial-community analyses to confirm the DIET contribution and to support scale-up in integrated biorefineries.

1. Introduction

The global climate crisis and the growing scarcity of energy resources have reinforced the urgency of more sustainable, low-carbon energy systems. The historical dependence on fossil fuels for energy generation results in greenhouse gas (GHG) emissions that exacerbate global warming [1], making the energy transition to renewable sources fundamental for climate change mitigation and global energy security [2].
Hydrogen has emerged as one of the most promising alternatives for decarbonizing hard-to-abate sectors. Hwang et al. [1] reviewed its utilization across power generation and transportation, highlighting its role as a flexible energy carrier, while Bhandari & Shah [3] showed, through a techno-economic assessment, that decentralized renewable hydrogen can already be competitive in specific national contexts. Its high energy density and water-only combustion make hydrogen strategic for carbon-neutrality targets [4]. However, global production remains predominantly fossil-based: gray hydrogen still accounts for roughly 95% of current output and is associated with high CO2 emissions, as documented in recent sector overviews [5].
Brazil’s hydrogen regulatory framework has advanced rapidly. The National Hydrogen Program (PNH2), whose triennial work plan was issued by the Ministry of Mines and Energy [6], was created in 2022, and Law No. 14,948/2024 subsequently established the National Low-Carbon Hydrogen Policy [7]. The country presents significant competitive advantages for a low-carbon hydrogen economy, owing to its predominantly renewable electricity matrix (approximately 83% in 2023) and abundance of residual biomass [8].
Among renewable hydrogen routes, biohydrogen produced by the biological conversion of biomass is particularly attractive. Residual biomasses, such as municipal solid waste (MSW), agro-industrial residues, OSW, and sewage sludge, offer a dual benefit; Viana [9] emphasized their potential as feedstocks for energy recovery in the Brazilian context, whereas Silva et al. [10] specifically reviewed dark fermentation of waste biomass as a pathway toward biorefinery development. Food waste is a particularly abundant and energy-dense fraction of this biomass pool: a recent review by Pant et al. [11] estimates that roughly one third of all food produced worldwide is lost or wasted each year, and identifies its biochemical conversion to biohydrogen among the most promising valorization routes within a circular bioeconomy. Food waste is particularly well suited to acidogenic bioconversion because of its high moisture content, high biodegradable organic fraction, and carbohydrate-rich, mildly acidic composition; as Sahota et al. [12] emphasize in their comparative review of biogas, biohydrogen, and biohythane from food waste, these same attributes also make the feedstock highly variable in composition, so that the choice of valorization pathway and the achievable yield depend strongly on substrate characterization and operating conditions.
Among the biochemical routes for biohydrogen production, dark fermentation has been receiving increasing attention. This light- and oxygen-independent process converts simple sugars into biohydrogen and by-products with high volumetric rates and low energy demand, as detailed mechanistically by Rittmann and Herwig [13], and was shown by Soares et al. [14] to valorize real agro-industrial streams such as brewer’s spent grain hydrolysate. Its flexibility toward diverse substrates is a recurrent advantage highlighted in process reviews [15].
Mechanistically, dark fermentation proceeds through hydrolysis of complex organics into soluble monomers, followed by acidogenesis and acetogenesis, during which fermentative bacteria oxidize substrates and dispose of the resulting electrons as molecular hydrogen; the chain is deliberately stopped before methanogenesis so that hydrogen is not consumed. Because hydrogen formation is ultimately an electron-disposal step, the rate at which electrons are exchanged between syntrophic partners is a key control on performance: when interspecies electron transfer is slow, reducing equivalents accumulate, the reactions become thermodynamically unfavorable, and both conversion and hydrogen yield fall. This limitation is clearer when dark fermentation is examined in terms of carbon and electron flow rather than hydrogen yield alone: as Yadav and Jung [16] show in their critical review of integrated biohydrogen systems, standalone dark fermentation of real organic wastes channels only about 25–33% of the input organic carbon through the hydrogen-yielding pathway, while 40–60% is retained in the effluent as volatile fatty acids and unhydrolyzed solids. This residual, acid-rich fraction is simultaneously the main driver of medium acidification and the principal reservoir of unrecovered energy and electrons, which is precisely why accelerating interspecies electron transfer is attractive. Despite its great potential, dark fermentation therefore still faces operational challenges, including low conversion rates and difficulty degrading complex substrates [17]; reported yields from untreated, unbuffered food waste are commonly modest and highly variable (on the order of a few tens of mL H2/g COD or below), whereas optimized or additive-enhanced systems on simpler feedstocks reach substantially higher values, up to the range of tens to a few hundred mL H2/g COD [18,19]. Promoting direct interspecies electron transfer (DIET) with conductive materials is a promising strategy to close this gap: conductive additives can provide a solid-state electrical conduit between cells, bypassing slower diffusion-based electron carriers and accelerating syntrophic electron exchange. Chen et al. [20] systematized the mechanisms by which conductive additives accelerate interspecies electron exchange, while Liu et al. [21] demonstrated, in a novel rotational drum reactor fed with real food waste, that milli-magnetite tangibly raised biohydrogen output, evidencing the practical relevance of DIET-based intensification under realistic conditions.
Although conductive additives have been widely studied, most evidence derives from synthetic or simple substrates (glucose, sucrose, molasses, defined hydrolysates) and from pure or pre-enriched cultures. Within Renewable Energy specifically, prior dark fermentation contributions have centered on substrate type and decentralized techno-economic feasibility rather than on materials-based DIET intensification of real food waste [3]; broader additive screening has appeared mainly in adjacent journals using model substrates [22]. Magnetite, activated carbon, and metal-doped carbon have each been studied before for dark fermentation, and real food waste with mixed inocula has also been used previously; we therefore do not claim these elements as novel in isolation. Rather, the specific contribution of the present work is to bring them together under a single, deliberately realistic protocol: (i) a side-by-side comparison of magnetite, granular activated carbon (AC), and laboratory-synthesized nickel–iron-doped activated carbon (DC) under identical, uncontrolled, and unbuffered batch conditions; (ii) the use of genuine post-consumer university-canteen food waste with raw UASB sewage sludge as a mixed inoculum, rather than idealized feedstocks; and (iii) the coupling of SEM–EDS materials characterization with statistically resolved performance data (one-way ANOVA, Tukey) to rank the three additives and to relate their morphology and composition to measured performance. The central hypothesis is that magnetite, AC, and, above all, DC intensify DF by promoting DIET, thereby increasing biohydrogen yield and organic-matter conversion relative to additive-free operation; consistent with this, we note explicitly that DIET is invoked here as a mechanistic hypothesis supported by the literature and by our performance and characterization data, and is not directly demonstrated by the electrochemical or molecular assays that would be required to prove it. This work thus advances knowledge on DF of food waste in line with Sustainable Development Goals 7, 11, 12, and 13 [23].

2. Dark Fermentation and Additives

2.1. The Dark Fermentation Process

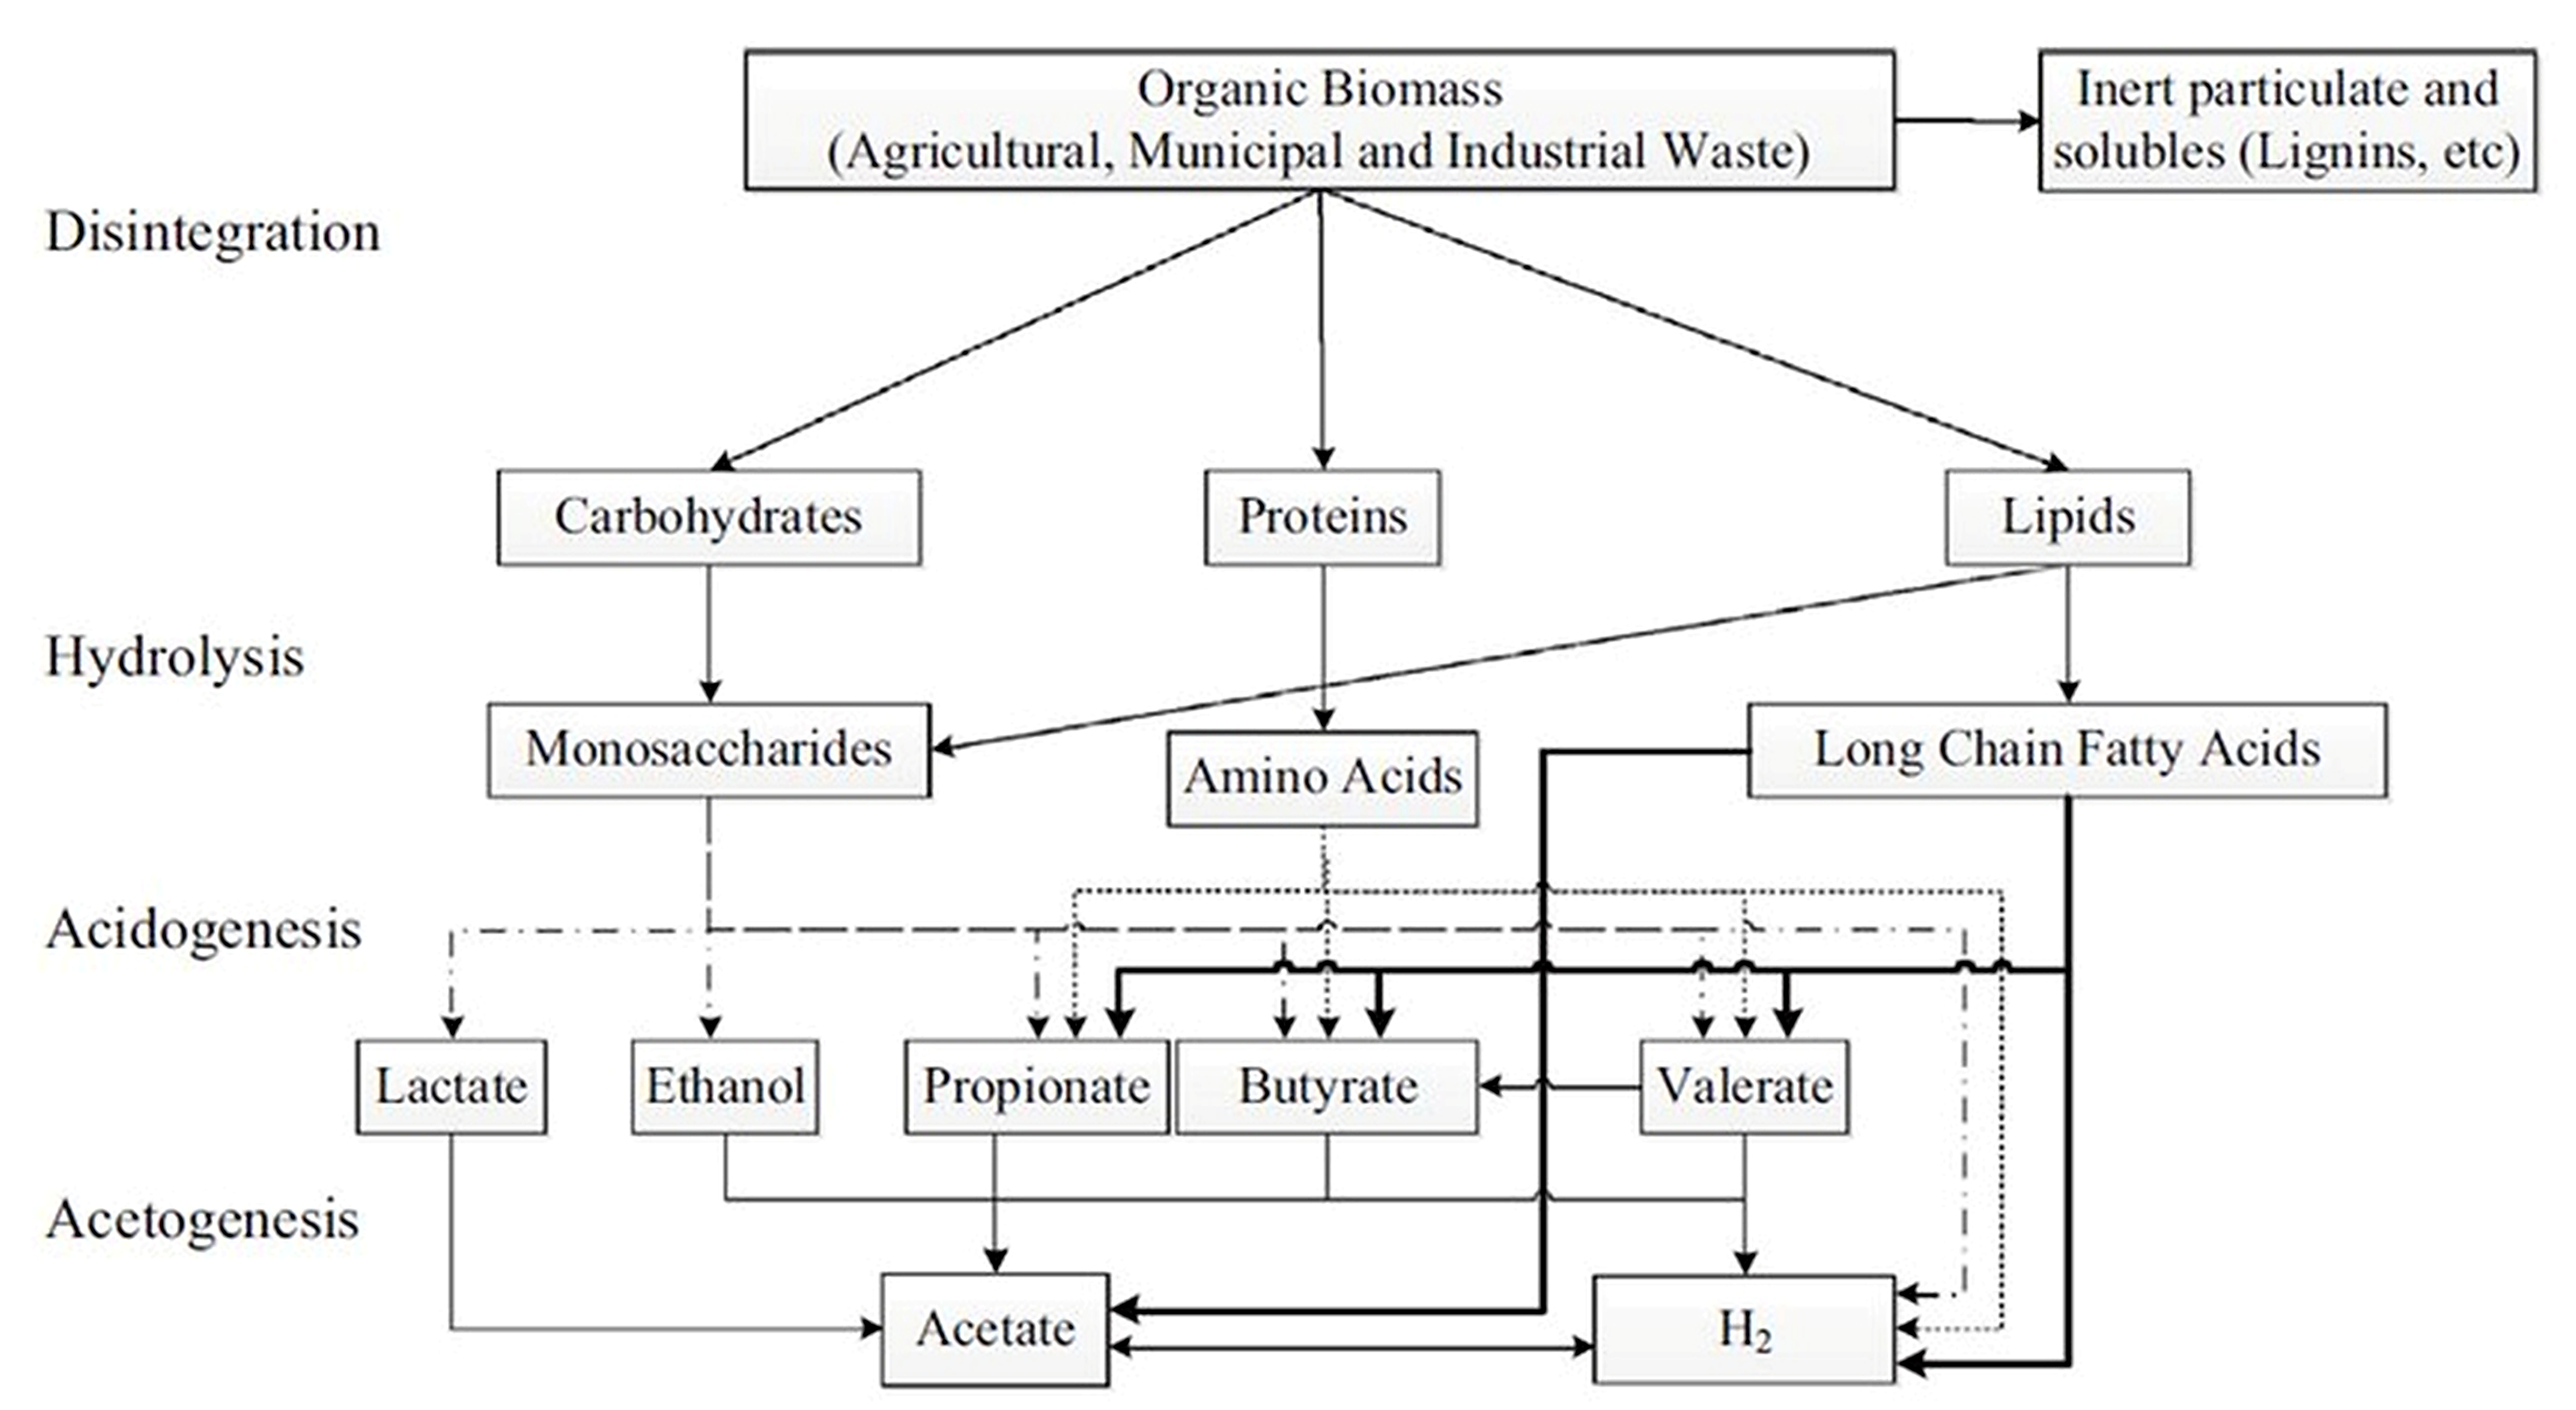
Dark fermentation is the conversion of simple sugars present in organic residues into hydrogen, carbon dioxide, and organic acids by microorganisms in the absence of oxygen (Figure 1). The anaerobic bacteria used in bioH2 production can be pure cultures (such as Clostridium and Enterobacter) or mixed cultures derived from anaerobic sludge or soil, as described respectively by Roman [4] for rice-husk fermentation and by Ghimire et al. [15] in their review of dark fermentative routes.
Fermentation comprises the first three stages of anaerobic digestion. Ghimire et al. [15] described how hydrolysis breaks macromolecules into smaller units; acidogenesis converts these intermediates into organic acids, CO2, and H2; and acetogenesis transforms longer-chain acids into acetate, CO2, and H2. Hallenbeck & Benemann [25] noted that halting the chain before methanogenesis is what maximizes net hydrogen recovery.
Metabolically, the Embden–Meyerhof–Parnas pathway converts carbohydrates to pyruvate, generating NADH, after which pyruvate is routed to acetyl-CoA either by pyruvate:formate lyase (PFL) in facultative organisms such as Bacillus and Enterobacter or by pyruvate:ferredoxin oxidoreductase (PFOR) in strict anaerobes such as Clostridium, as detailed by Rittmann and Herwig [13] and Hallenbeck & Benemann [25]. The theoretical maximum is 12 mol H2/mol glucose, but practical yields are capped at 4 mol H2/mol when acetate predominates and 2 mol H2/mol when butyrate predominates. The corresponding stoichiometric equations (Equations (A1)–(A4)) are provided in Appendix A.
Figure 2 maps the biodegradation stages and microbial pathways of dark fermentation: organic biomass is hydrolyzed into monomers that volatile acidogenic organisms (VAOs) ferment into short-chain acids and alcohols together with H2 and CO2, with the process deliberately stopped before methanogenesis to preserve hydrogen yield.

2.2. Additives and DIET Promotion in Dark Fermentation

Various strategies have been investigated to intensify dark fermentation. Metallic additives, pure metals, metal ions, and metal oxides have drawn growing attention: De Souza et al. [26], from our own group, combined magnetite with substrate pre-treatment in sequential dark/photo-fermentation of the organic fraction of municipal solid waste, identifying an effective magnetite dose (120 mg/L) and reporting that the levelized cost of hydrogen fell as more organic waste was processed; Gadhe et al. [27] enhanced complex-wastewater fermentation through sonolysis-assisted metal effects; and Chen et al. [20] framed these gains within a unifying DIET mechanism. Reviewing nanoparticle–microbe interactions across fermentative biofuel systems, Mishra et al. [28] rationalize these effects through several converging mechanisms: conductive Fe- and Ni-bearing nanomaterials can augment the ferredoxin oxidoreductase and hydrogenase enzymes that catalyze proton reduction, act as electron conduits that promote interspecies electron transfer, and serve as immobilization matrices for hydrogen-producing consortia. Importantly, that review distinguishes mechanisms that are directly observed (physical attachment and cell aggregation) from those that remain hypothesized or inferred (enzyme stimulation and direct electron donation), reinforcing that the DIET contribution of a given additive is best treated as a supported hypothesis rather than a demonstrated fact unless electrochemical or molecular evidence is provided.
Iron ions (Fe2+ and Fe3+) act as essential cofactors of hydrogenases and ferredoxins, a role that is mechanistically emphasized by Chen et al. [20] and in integrated fermentative routes by Mishra et al. [29]. Yogeswari et al. [30] reported that 150 mg/L of Fe2+ raised cumulative H2 production from about 1685 mL to 2475 mL in confectionery-effluent fermentation. Ni2+ is likewise a relevant cofactor: Gou et al. [31] doubled the sucrose-derived H2 yield to 2.05 mol H2/mol with only 0.6 mg/L Ni2+. Mishra et al. [32] subsequently mapped the optimal Ni2+ window (roughly 0.1–25 mg/L) for nanocatalytic fermentation, beyond which inhibition prevails.
Magnetite (Fe3O4) stands out for its surface conductivity, which lets it act as a solid DIET mediator; Wang et al. [33] showed it scavenges electron-transfer bottlenecks in high-solids sludge digestion, while Zhong et al. [34] demonstrated that particle size governs this effect. Sun et al. [35] obtained 198.3 mL H2/g glucose with 100 mg/L Fe3O4 nanoparticles (+43.0%), rising to 225.6 mL H2/g glucose (+62.7%) with Fe3O4-rGO nanocomposites. Lakroun et al. [36] further showed that cobalt-doping the magnetite (Co-Fe3O4, 300 mg/L) raised yield by 41.78% and productivity by 46.13% while shortening the lag phase; data-driven optimization of such systems was recently formalized by Krishnamoorthy et al. [37].
Carbonaceous materials, such as AC and biochar, have been widely explored to intensify biohydrogen production. Their high surface area and porosity favor metabolite adsorption and electron conduction, as reviewed by Yang & Wang [22] for additive screening and by Wang et al. [38] for nanomaterial-assisted fermentation specifically; Chen et al. [20] linked these properties to enhanced interspecies electron transfer. Acting as conductive biofilm supports, such materials promote microbial adhesion, an effect Cheng et al. [39] tied directly to improved syntrophic electron exchange. Park et al. [40] reported up to 1.7-fold higher peak production rate and 1.9-fold larger final H2 volume with 1 g/L granular AC in fermentation by Clostridium butyricum, with positive regulation of genes linked to H2 production (pfor and oxct) and negative regulation of genes related to its consumption.
Metal-doped activated carbon merges the porous carbon backbone with catalytic and electrochemical functionality. Wu et al. [41] showed that magnetic nitrogen-doped AC measurably improved biohydrogen production, and Ramprakash & Incharoensakdi [42] reached 2.8 mol H2/mol glucose (+56%) with NiFeAC at 300 mg/L in DF by Enterobacter aerogenes. Jamaludin et al. [43] verified, using NiFe-doped granular AC (GACNiFe), a yield of 1.64 mol H2/mol of consumed sugar, with an about 57% increase in continuous mode. This combination of high surface area, electronic conductivity, and Ni/Fe catalysis gives DC a more robust, multifunctional mode of action than magnetite alone. This view is reinforced by the recent review of Devika et al. [44], which compiles the still scarce controlled comparisons between hybrid material systems and their individual constituents in dark fermentation. That analysis reports that iron-based additives alone deliver the most consistent single-component gains (of the order of 29–73%), whereas hybrid architectures that combine metal nanoparticles with porous carbon supports address enzymatic, thermodynamic, and inhibition-related bottlenecks simultaneously and yield larger enhancements (about 30–118%) over unsupplemented controls. Crucially, that same review cautions that hybrids do not always outperform their parts through genuine mechanistic synergy: the advantage may instead be additive or complementary, and distinguishing the two requires controlled side-by-side comparisons that remain rare, a gap that the present side-by-side design of magnetite, AC, and DC is intended to help address.

3. Materials and Methods

The experiments were conducted in two independent blocks, using food waste from the University Dining Hall of UNIFEI (Itajubá Campus) as substrate and sewage sludge from the COPASA wastewater treatment plant (Upflow Anaerobic Sludge Blanket, UASB reactors), Itajubá-MG, as inoculum. The dark fermentation process was evaluated in batch anaerobic reactors built from 2.1 L PET bottles, operated under mesophilic conditions (35 °C) in triplicate. Experiment 1 investigated the effect of magnetite at two dosages, while Experiment 2 evaluated pure granular activated carbon (AC) and nickel–iron-doped activated carbon (DC) at different concentrations. Biogas production was monitored using a Geotech® Biogas® 5000 portable analyzer (QED Environmental Systems Inc.), and biohydrogen yield was expressed as mL H2/g COD removed. Physical–chemical analyses followed Standard Methods, and statistical analyses were performed using one-way ANOVA with Tukey’s post hoc test (α = 0.05).

3.1. Reagents and Equipment

Granular activated carbon was used both as an additive and as the support for doping. The doping reagents were iron(III) chloride hexahydrate (FeCl3·6H2O), nickel(II) chloride hexahydrate (NiCl2·6H2O), and sodium hydroxide (NaOH), all of analytical grade and used as received; magnetite (Fe3O4) was used as supplied. Chemical oxygen demand (COD) was determined with potassium dichromate reagent in acid medium (Standard Methods 5220B [45]). The main equipment comprised a magnetic/electromagnetic stirrer and a laboratory oven for the doping procedure; a calibrated digital pH meter (buffers pH 4.0 and 7.0) for pH; a Geotech Biogas 5000 portable analyzer (Geotech, Warwickshire, UK; H2 detection limit 1000 ppm) [46] for biogas composition; a ZEISS EVO MA15 scanning electron microscope fitted with backscattered electron detectors and a Bruker XFlash 6110 energy-dispersive X-ray spectroscopy (EDS) system for SEM–EDS; and an inductively coupled plasma optical emission spectrometer (Optima 8000, PerkinElmer) for inoculum elemental analysis, performed after microwave-assisted acid digestion (HNO3, H2SO4, and HCl; Titan Microwave, PerkinElmer) at the Lorena School of Engineering of the University of São Paulo (EEL/USP). The full operating details of each procedure are given in the corresponding sub-sections below.

3.2. Substrates, Media, and Microorganisms

Food-waste samples were collected at the University Dining Hall of UNIFEI (Itajubá Campus). For Experiment 1 (magnetite), about 5 kg of food scraps were collected on 4 April 2025; for Experiment 2 (AC/DC), on 25 November 2025, with a menu including rice, beans, chicken, beet, cucumber, zucchini, and orange. The sewage sludge used as inoculum was collected at the COPASA wastewater treatment plant (UASB reactors), Itajubá-MG, on 12 July 2024 (Exp. 1) and on 23 October 2025 (Exp. 2); all dates follow the day–month–year format. The two experimental blocks were run consecutively as additives became available rather than as a designed seasonal comparison, so the collection dates differ; because the food waste and the raw sludge are intrinsically variable feedstocks, each block therefore includes its own additive-free control, collected and processed on the same dates as the corresponding treatments, and all statistical comparisons are made within, not across, blocks (Section 3.7). The substrate was prepared by adding about 250 mL of water to every 800 g of sample, followed by blending in a food processor.
Inoculum characterization by ICP-OES identified macro- and micronutrients, with Si, S, K, and Ca as major elements and trace metals such as Fe, Mn, Mg, Zn, Cu, Co, Ni, and Mo. Akhlaghi & Najafpour-Darzi [47] cataloged these as cofactors of hydrogenases, nitrogenases, and dehydrogenases central to hydrogenogenic routes, while Chen et al. [48] specifically linked the Ni2+ fraction to fermentative H2 enhancement in sludge substrates. Arsenic and cadmium remained below the quantification limit, a positive aspect for process stability.

3.3. Activated Carbon Doping

Based on Ramprakash & Incharoensakdi [42], granular AC was doped with Ni and Fe at a laboratory scale (for 24 g of product): 10.82 g of FeCl3·6H2O and 4.76 g of NiCl2·6H2O were dissolved in 200 mL of distilled water, forming a solution of Fe3+ and Ni2+. This solution was added to granular AC and stirred under an electromagnetic stirrer for 1 h at room temperature. The suspension was heated to about 110 °C, held at the boiling point, and then finalized with the rapid addition of 300 mL of alkaline solution (6.80 g of NaOH), and maintained for another 2 h. The carbon was then filtered, washed with deionized water to neutral pH, and dried at 70 °C for 24 h.

3.4. Morphological and Elemental Characterization of Functional Materials

Magnetite, granular activated carbon (AC), and nickel–iron-doped activated carbon (DC) were characterized by scanning electron microscopy coupled with energy-dispersive X-ray spectroscopy (SEM–EDS) to assess their surface morphology and elemental composition. Micrographs were obtained using a ZEISS EVO MA15 microscope equipped with backscattered electron detectors and an XFlash 6110 EDS system, operating under conventional high-resolution imaging conditions.

3.5. Construction and Operation of Biodigesters

The biodigesters were built according to Cañote et al. [49] and Cruz et al. [50], using 2.1 L PET bottles, wrapped in black stretch plastic and capped with silicone and epoxy. The useful volume was 0.35 L substrate + 0.15 L inoculum + 1.6 L headspace for biogas storage.
In Experiment 1, 10 biodigesters in 3 groups were divided into (a) control (4 reactors); (b) 0.03 g of magnetite (60 mg/L); (c) 0.05 g of magnetite (100 mg/L), following the methodology of Sun et al. [35]. In Experiment 2, 12 biodigesters in 4 triplicate groups were divided into (a) control (3 reactors); (b) 4 g of AC; (c) 2 g of DC; (d) 4 g of DC. In both cases, the reactors were kept at 35 °C (mesophilic conditions) using a thermostat and manually stirred once or twice daily. Each batch was monitored until biogas production had ceased and the readings had stabilized, which defined the end of the assay; because Experiment 2 used larger, slower-acting carbonaceous additives and a fresh substrate/inoculum batch, gas evolution continued for longer, so monitoring was extended to 45 days against the 27 days that were sufficient for the magnetite block. As the yields are normalized per gram of COD removed rather than per unit time, the different monitoring windows do not bias the between-treatment comparison. The raw UASB sludge was used as received, without thermal, acid, or chemical pre-treatment, in order to test the hydrogen-producing capacity of the indigenous, unenriched community under realistic, low-intervention operating conditions. Pre-treatment of the inoculum or substrate (thermal, acid, alkaline, or mechanical) is a well-established route to enrich hydrogen-producing bacteria and suppress hydrogen consumers, and to raise yields, but it adds energy and chemical costs whose trade-offs must be weighed for any scale-up, as reviewed by Sharmila et al. [51]; the potential consequence of omitting it for hydrogen-consuming methanogenesis is examined in Section 4.2.

3.6. Biogas Quantification and Biohydrogen Calculation

Biogas readings were performed with the Geotech® Biogas® 5000 [46] (detection limit: 1000 ppm for H2). The volume of gas extracted at each collection (Vgas) was estimated by Equation (1), with Q = 550 mL/min:
Vgas = Q × t
The biohydrogen volume (mL) was calculated by Equation (2). The headspace volume (1.5 L) was included in the total calculations, as per Song et al. [52]:
V(H2) = (ppm H2/106) × Vgas
All volumes were normalized to Standard Conditions of Temperature and Pressure (SCTP: 20 °C, 1013.25 hPa) by Equation (3):
VSCTP = Vmeasured × (PSCTP/Pmeasured) × (Tmeasured/TSCTP)
Biohydrogen productivity was expressed as mL bioH2/g COD removed (Equation (4)):
Productivity = V(H2) [mL]/ΔCOD [g]

3.7. Physical–Chemical Analyses

Analyses of Total Solids (TS), Total Volatile Solids (TVS), pH, and chemical oxygen demand (COD) were performed on the initial mixture and on the digestate, following Standard Methods [45]. COD was determined using Method 5220B (potassium dichromate in an acid medium). pH was measured with a calibrated digital pH meter using pH 4.0 and 7.0 buffers. Inoculum characterization by inductively coupled plasma optical emission spectrometry (ICP-OES) was performed at the Lorena School of Engineering of the University of São Paulo (EEL/USP). For trace-element analysis, 5 mL of each sample was digested together with 5 mL of HNO3, 3 mL of H2SO4, and 3 mL of HCl and made up to 100.0 mL in a volumetric flask. Digestion was carried out in a Titan Microwave system (PerkinElmer) using a three-step program (target temperature/pressure/ramp time/hold time/percentage of total instrument power): step 1–100 °C, 30 bar, 5 min ramp, 10 min hold, 50% power; step 2–175 °C, 30 bar, 5 min ramp, 10 min hold, 90% power; and step 3–50 °C, 30 bar, 1 min ramp, 10 min hold, 0% power. Elemental quantification was then performed on an Optima 8000 ICP-OES (PerkinElmer). Element-specific limits of detection were not reported by the analytical laboratory and are therefore not stated here.

3.8. Statistical Analysis

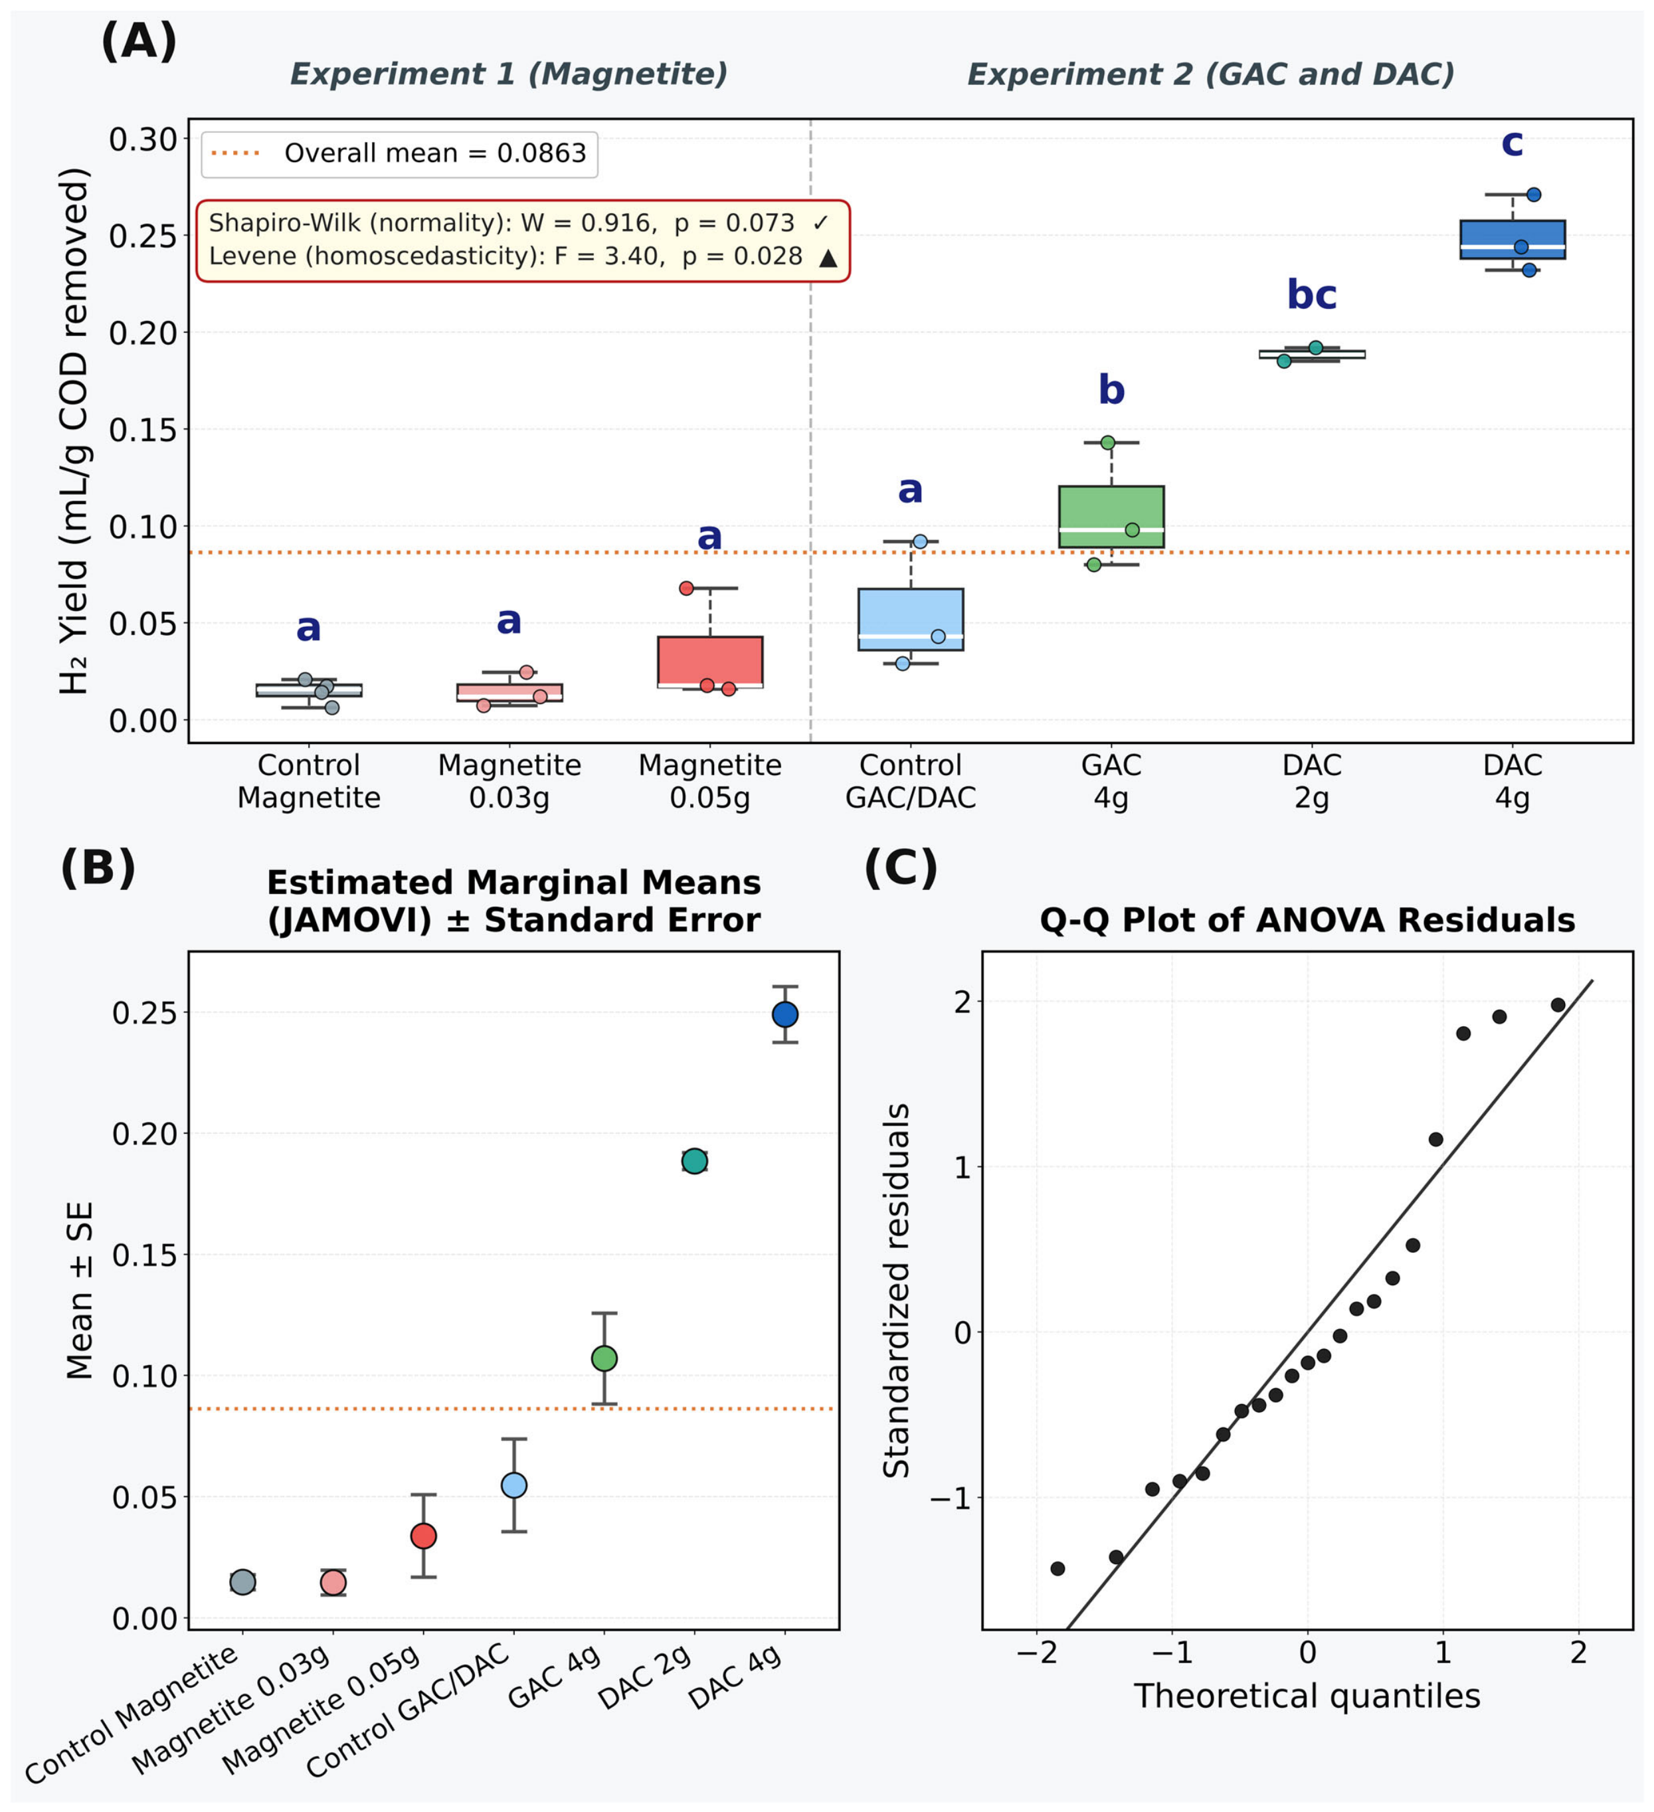
Statistical analysis of biohydrogen yield (mL H2/g COD removed) was performed by one-way ANOVA, preceded by Shapiro–Wilk (normality: W = 0.916; p = 0.073) and Levene (homoscedasticity: F = 3.40; df1 = 6; df2 = 14; p = 0.028) tests. Given the moderate nature of the violation and the similarity in sample sizes, ANOVA was performed, followed by a Tukey post hoc test (α = 0.05), using JAMOVI® v. 2.5 software [53]. Boxplot, marginal means, and Q-Q plot graphs were built in Python® v. 3.11 (Google Colab®, NumPy, Matplotlib, and SciPy libraries).

3.9. Preliminary Energy and Additive-Cost Screening

For an illustrative economic comparison, the avoided or gross hydrogen-value benchmark was calculated at R$30 kg−1 H2 (approximately USD 5.4 kg−1 at R$5.6 USD−1, consistent with the currency conversion used by de Souza et al. [26]). This benchmark does not represent actual revenue because it excludes purification, compression, storage, certification, distribution, and market-access costs. Single-use additives were assumed; hence, the results identify the importance of future material reuse rather than establishing commercial viability.
Electricity consumption was estimated from nominal equipment ratings and operating times. The analyses assume an average 100 W thermostatic heating load for 45 d, 15 W of manual stirring for 10 min d−1, a 300 W hotplate/stirrer for 3 h, and a 500 W laboratory oven for 24 h during DC preparation. A laboratory electricity tariff of R$0.90 kWh−1 was used, consistent with the order of magnitude of current low-voltage electricity tariffs in Minas Gerais [54]. Because no meter readings were recorded and the actual thermostat duty cycle is unknown, this is a conservative engineering estimate. We allocate the full 45 d heating burden to the experimental reactor only to demonstrate the non-representativeness of single-reactor bench-scale energy accounting; a scale-representative result would require shared thermal control, continuous operation, and measured energy demand. Equation (5) shows material cost per reactor.
C a d d i t i v e = m a d d i t i v e   × P a d d i t i v e
where Cadditive is the material cost per reactor (R$), madditive is the applied additive mass (kg), and Padditive is the estimated unit price (R$ kg−1). For DC, the material cost was calculated from the laboratory synthesis recipe used to obtain 24 g of DC: 24 g AC, 10.82 g FeCl3·6H2O, 4.76 g NiCl2·6H2O, and 6.80 g NaOH. Since purchase invoices were not available, the analysis uses indicative bulk-price assumptions: R$10 kg−1 for magnetite, R$25 kg−1 for granular AC, R$3 kg−1 for FeCl3·6H2O, R$300 kg−1 for NiCl2·6H2O, and R$10 kg−1 for NaOH. These values are explicitly treated as scenario assumptions, not as measured procurement costs.
Hydrogen energy was calculated from the mean yield and the mean COD removed per reactor. For Experiment 2, the midpoint initial COD concentration (59.93 g L−1); mean COD removal fractions reported for the control (53.2%), AC (50.0%), DC 2 g (63.9%), and DC 4 g (63.9%); and the 0.50 L working volume were used. The corresponding hydrogen volume was converted to chemical energy using the lower heating value (LHV) of hydrogen, 10.8 MJ Nm−3, as shown in Equation (5):
E H 2 = V H 2 ,   S T P × 10.8
where EH2 is the chemical energy recovered as hydrogen (MJ) and VH2,STP is the cumulative standardized hydrogen volume (Nm3). The calculated value is an energy-content estimate and is not an electricity-equivalent output, because no fuel-cell or combustion conversion efficiency was assumed.

4. Results and Discussion

The results obtained in the two experiments show significant differences in biohydrogen yield according to the type and dosage of additive used. In general, reactors with nickel–iron-doped activated carbon (DC) consistently outperformed the other treatments, while magnetite showed heterogeneous behavior across replicates, and pure activated carbon (AC) showed moderate improvement. One-way ANOVA confirmed that the additive type exerts a highly significant effect on biohydrogen yield [F(6,14) = 48.7; p < 0.001; η2 = 0.954], with the Tukey post hoc test discriminating the DC groups from all other treatments. Simultaneously, the progressive acidification of the medium, with a final pH between 2.5 and 3.1 in all reactors, constituted the main operational limitation, possibly underestimating the real potential of the evaluated systems. The results are discussed below from three complementary perspectives: biohydrogen yield; an integrated analysis of COD, TVS, and pH; and a statistical comparison of additives.

4.1. Biohydrogen Yield: mL H2/g COD Removed

4.1.1. With Magnetite Addition

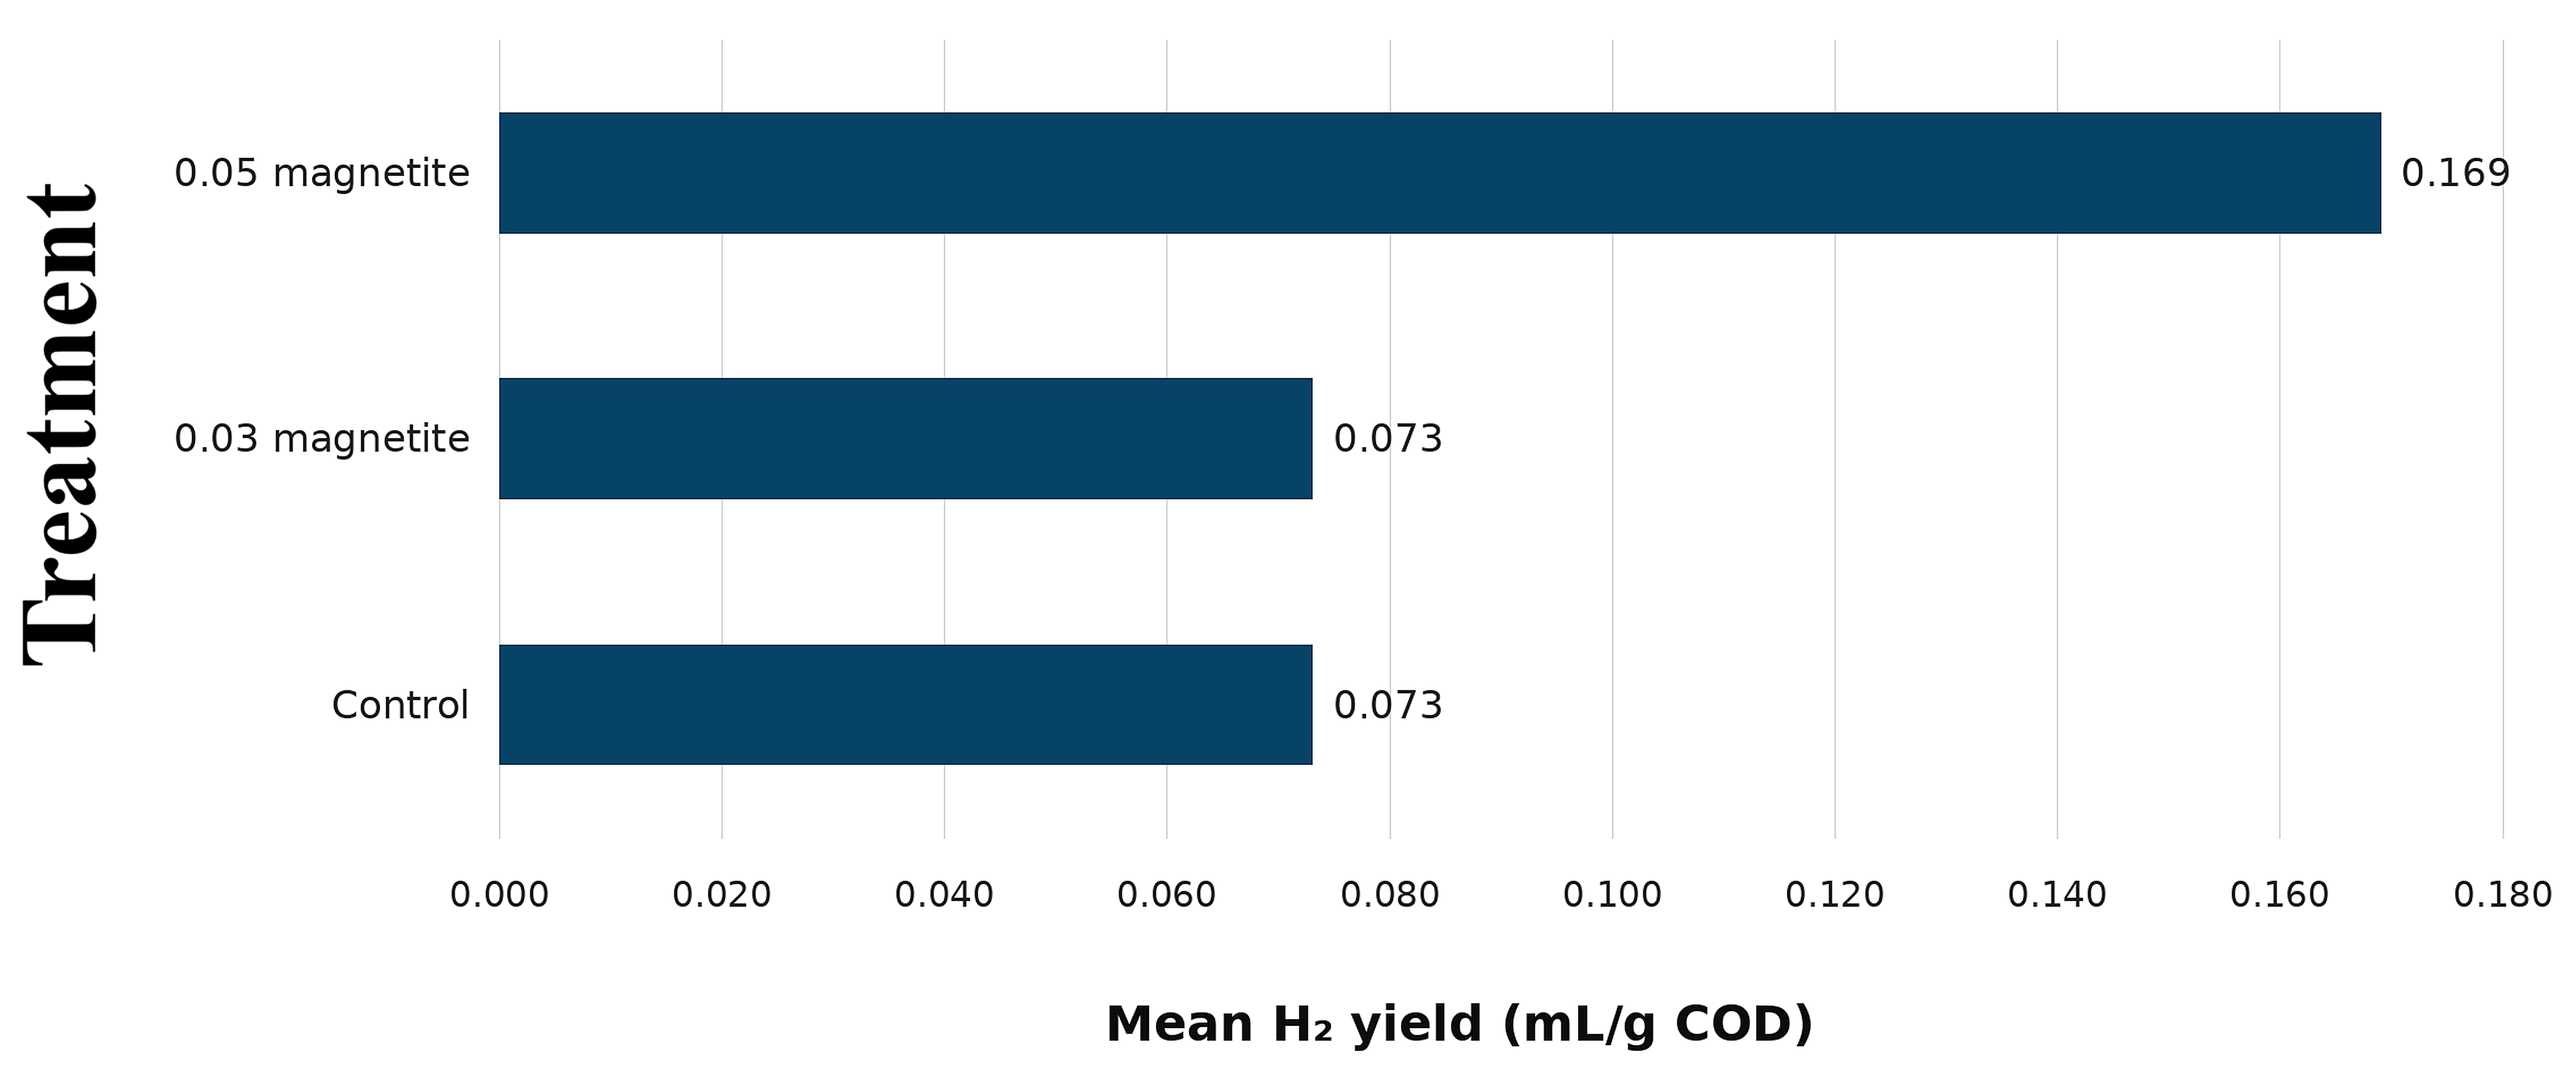
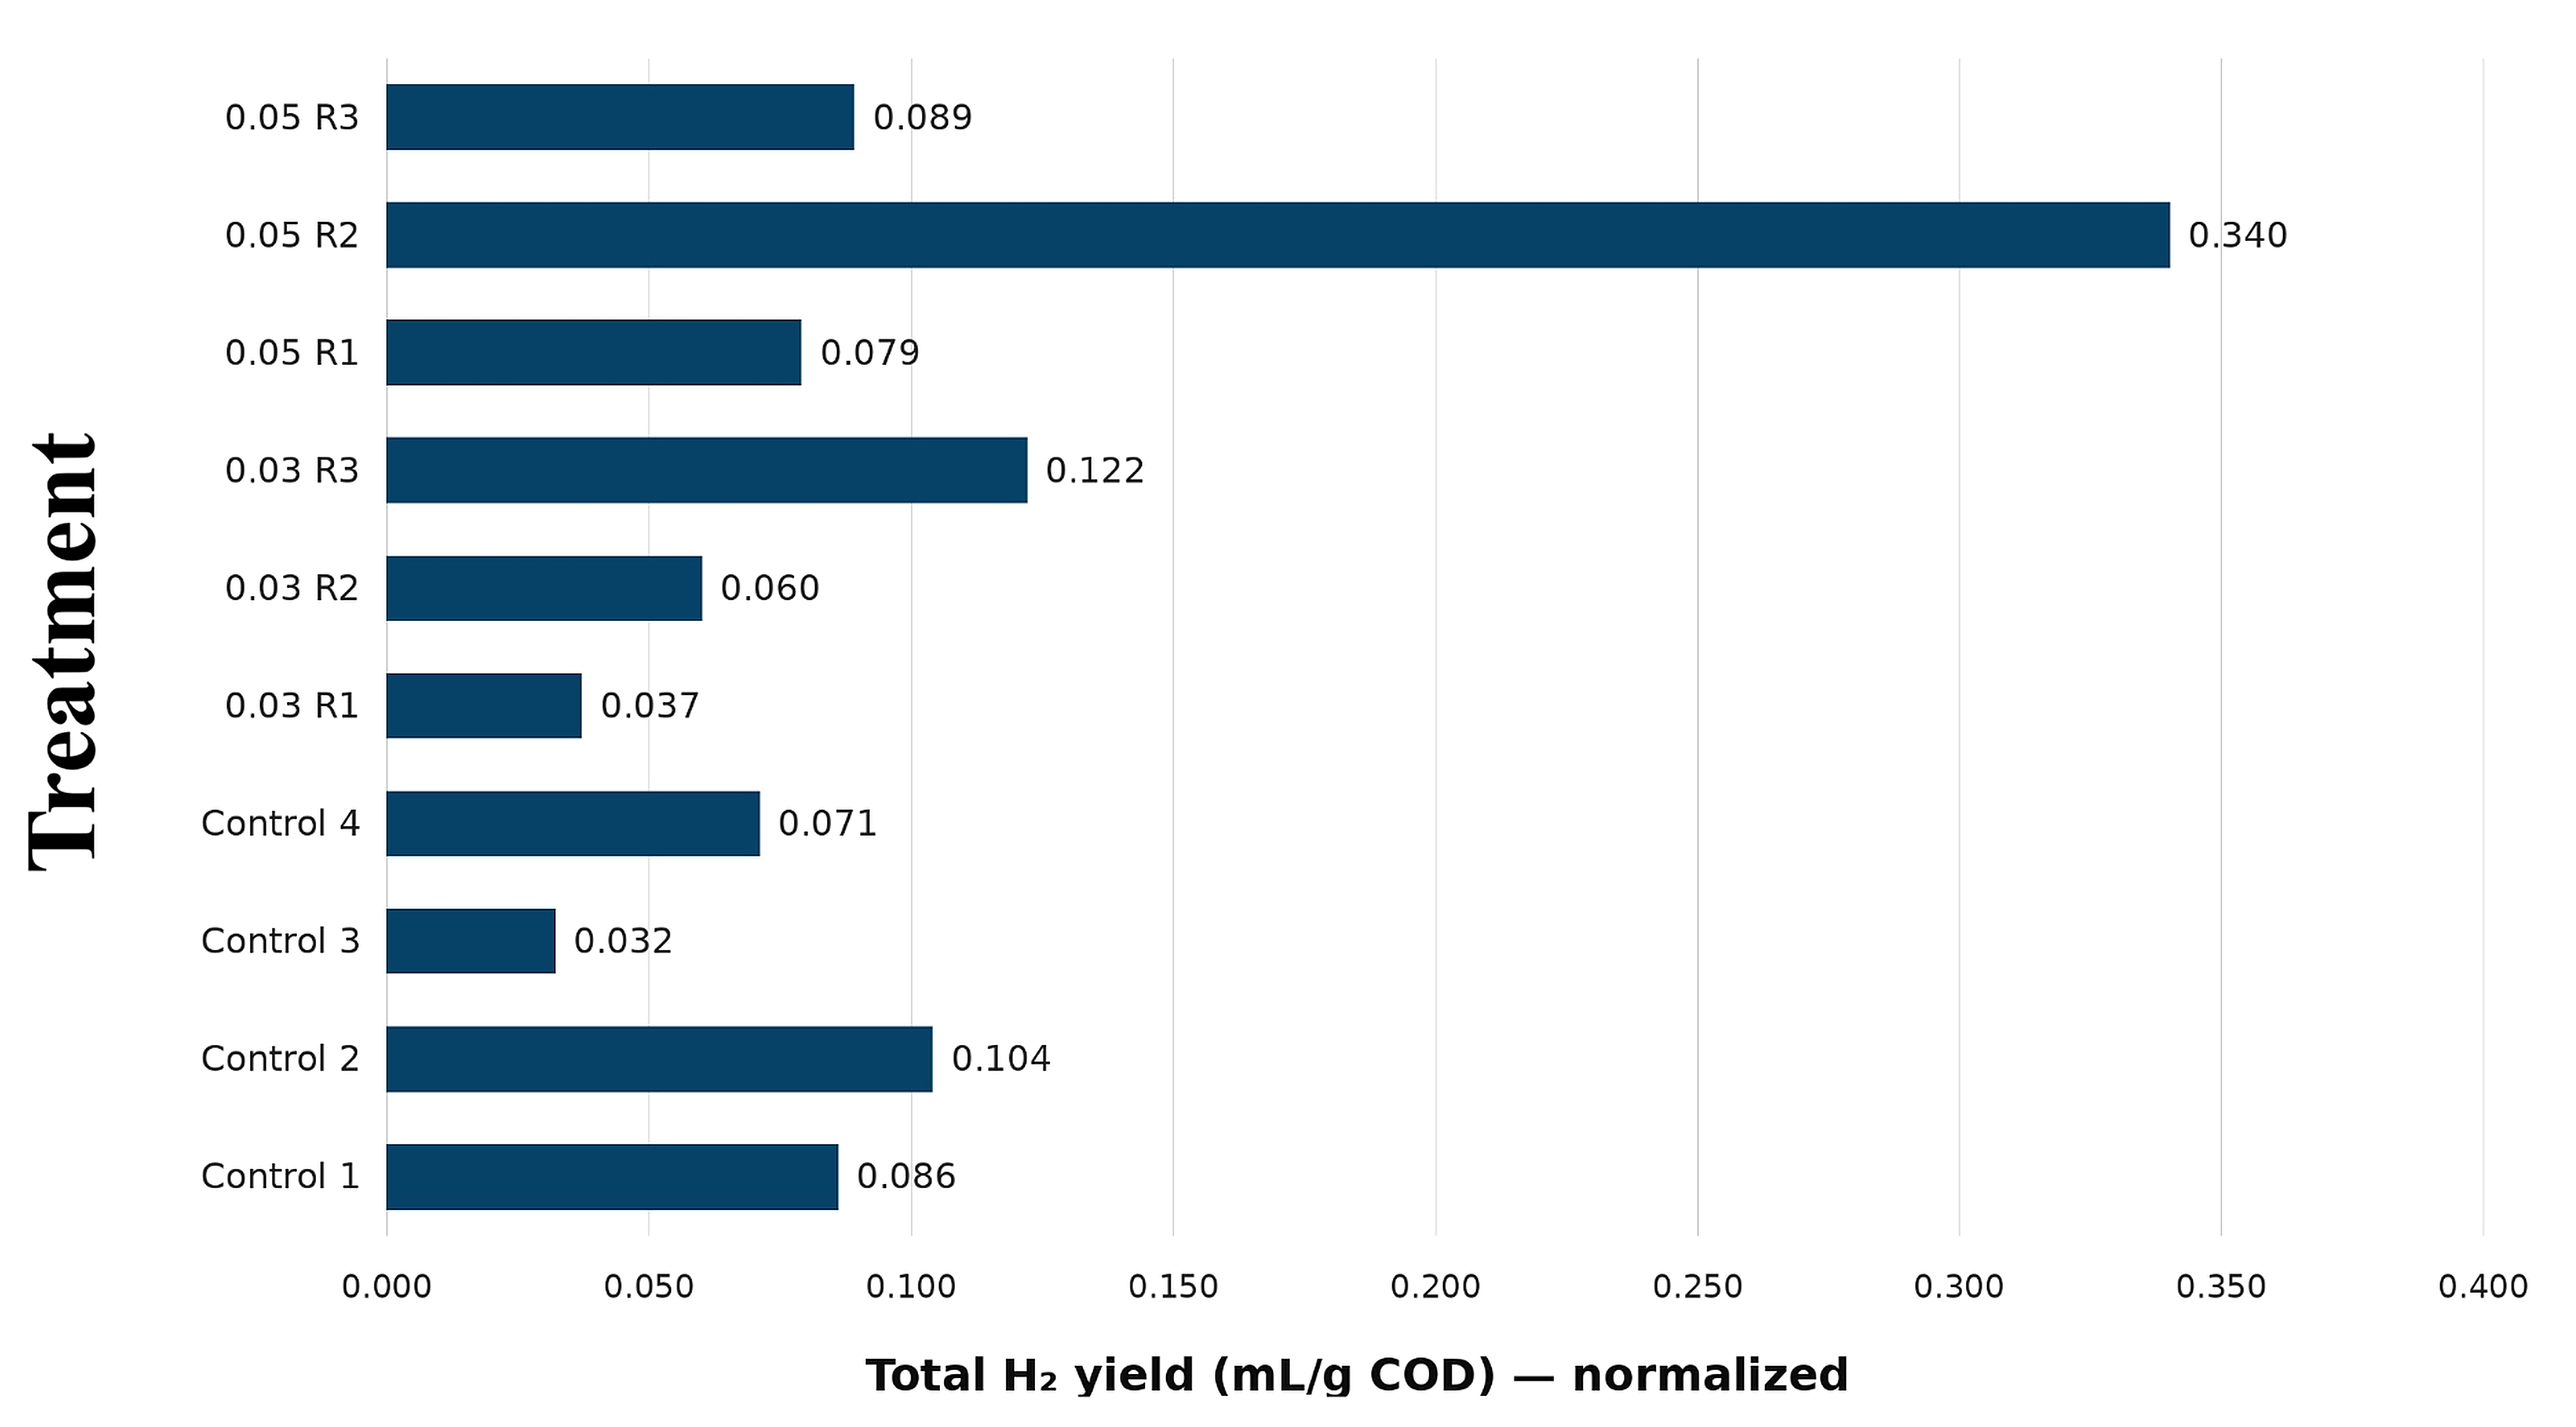
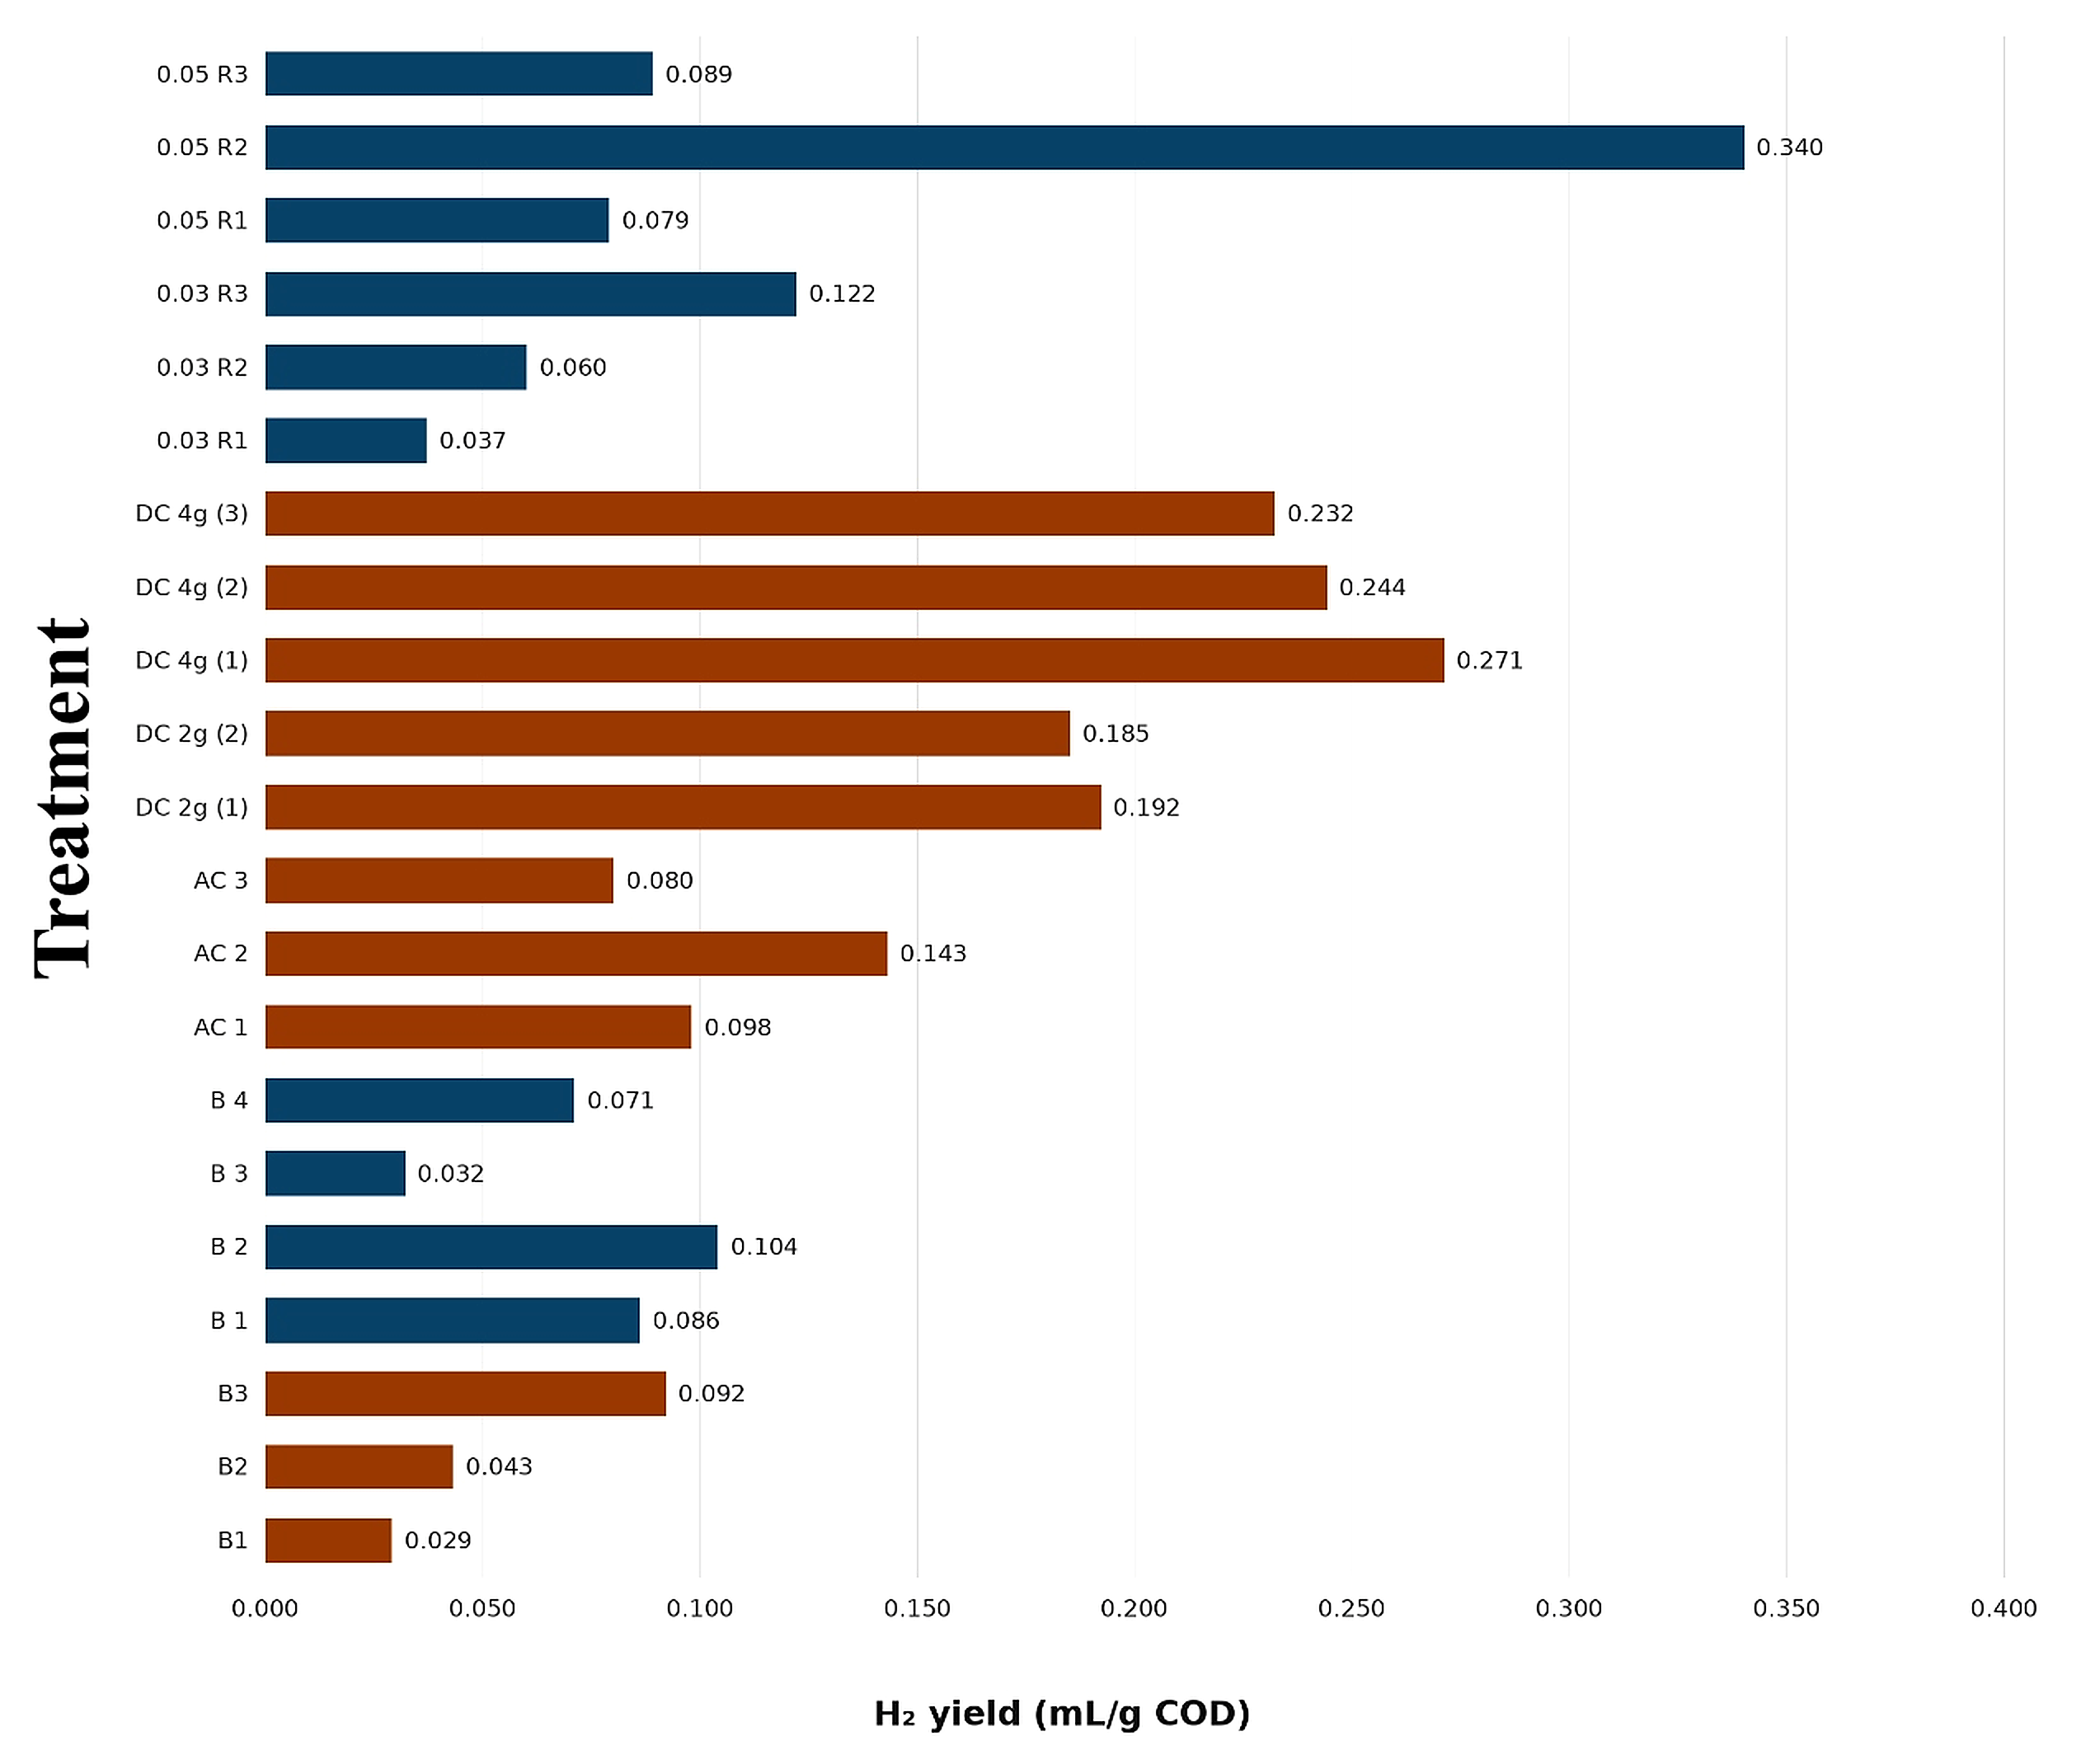
Figure 3 presents the biohydrogen yield (mL H2/g COD removed) for each reactor, and Figure 4 shows the mean yields for each group.
In the control reactors of Experiment 1 (magnetite, Figure 3 and Figure 4), yields ranged from 0.032 to 0.104 mL H2/g COD (mean 0.073), and in Experiment 2 controls (AC/DC) between 0.029 and 0.092 mL H2/g COD removed. These values fall below the range Litti et al. [18] reported for compositionally simpler substrates under optimized thermophilic conditions (9.3–46.5 mL H2/g COD at pH 5.5, 55 °C), a gap consistent with our deliberately uncontrolled, mesophilic, real-waste setup. The comparative synthesis of Sahota et al. [12] similarly reports that biohydrogen yields and bioenergy recovery from food-waste dark fermentation are markedly lower and more variable than the corresponding methane yields, and attributes much of this spread to feedstock heterogeneity and to the sensitivity of the acidogenic community to operating conditions such as pH; both factors are amplified in the present unbuffered, real-waste assays. The decisive limiting factor was excessive medium acidification (final pH 2.5–3.1), which inhibited hydrogenogenic bacteria before substrate exhaustion; Slezak et al. [19] likewise showed that uncontrolled pH drift driven by high initial organic load suppresses H2 in kitchen-waste fermentation, confirming that our low absolute yields reflect an operational ceiling rather than an intrinsic limitation of the additives.
The magnetite reactors showed markedly heterogeneous behavior. The 0.05 g group achieved a mean of 0.169 mL H2/g COD (about 2.3 times more than the control), with reactor R2 reaching 0.340 mL H2/g COD, expressively superior to the other reactors in the same group (R1 = 0.079; R3 = 0.089 mL H2/g COD), while R1 and R3 remained within the control range. The 0.03 g group also showed heterogeneous behavior, with R3 reaching 0.122 mL H2/g COD, while R1 (0.037) and R2 (0.060) remained close to the controls, resulting in a mean of 0.073 mL H2/g COD, equivalent to the control. This internal variability indicates that magnetite efficacy depends strongly on particle spatial distribution and on effective contact with DIET-capable consortia. Cheng et al. [39] similarly found that magnetite benefits hinge on stable syntrophic microenvironments, and Liu et al. [21] only achieved consistent food-waste gains by mechanically homogenizing magnetite contact in a rotational drum, conditions our static batch reactors cannot reproduce. By contrast, the markedly higher increments reported by Sun et al. [35] and Reddy et al. [55] were obtained with simpler substrates (glucose, bagasse hydrolysate) and pre-treated inocula, which reduce precisely the heterogeneity that limited our magnetite assays.

4.1.2. With AC/DC Addition

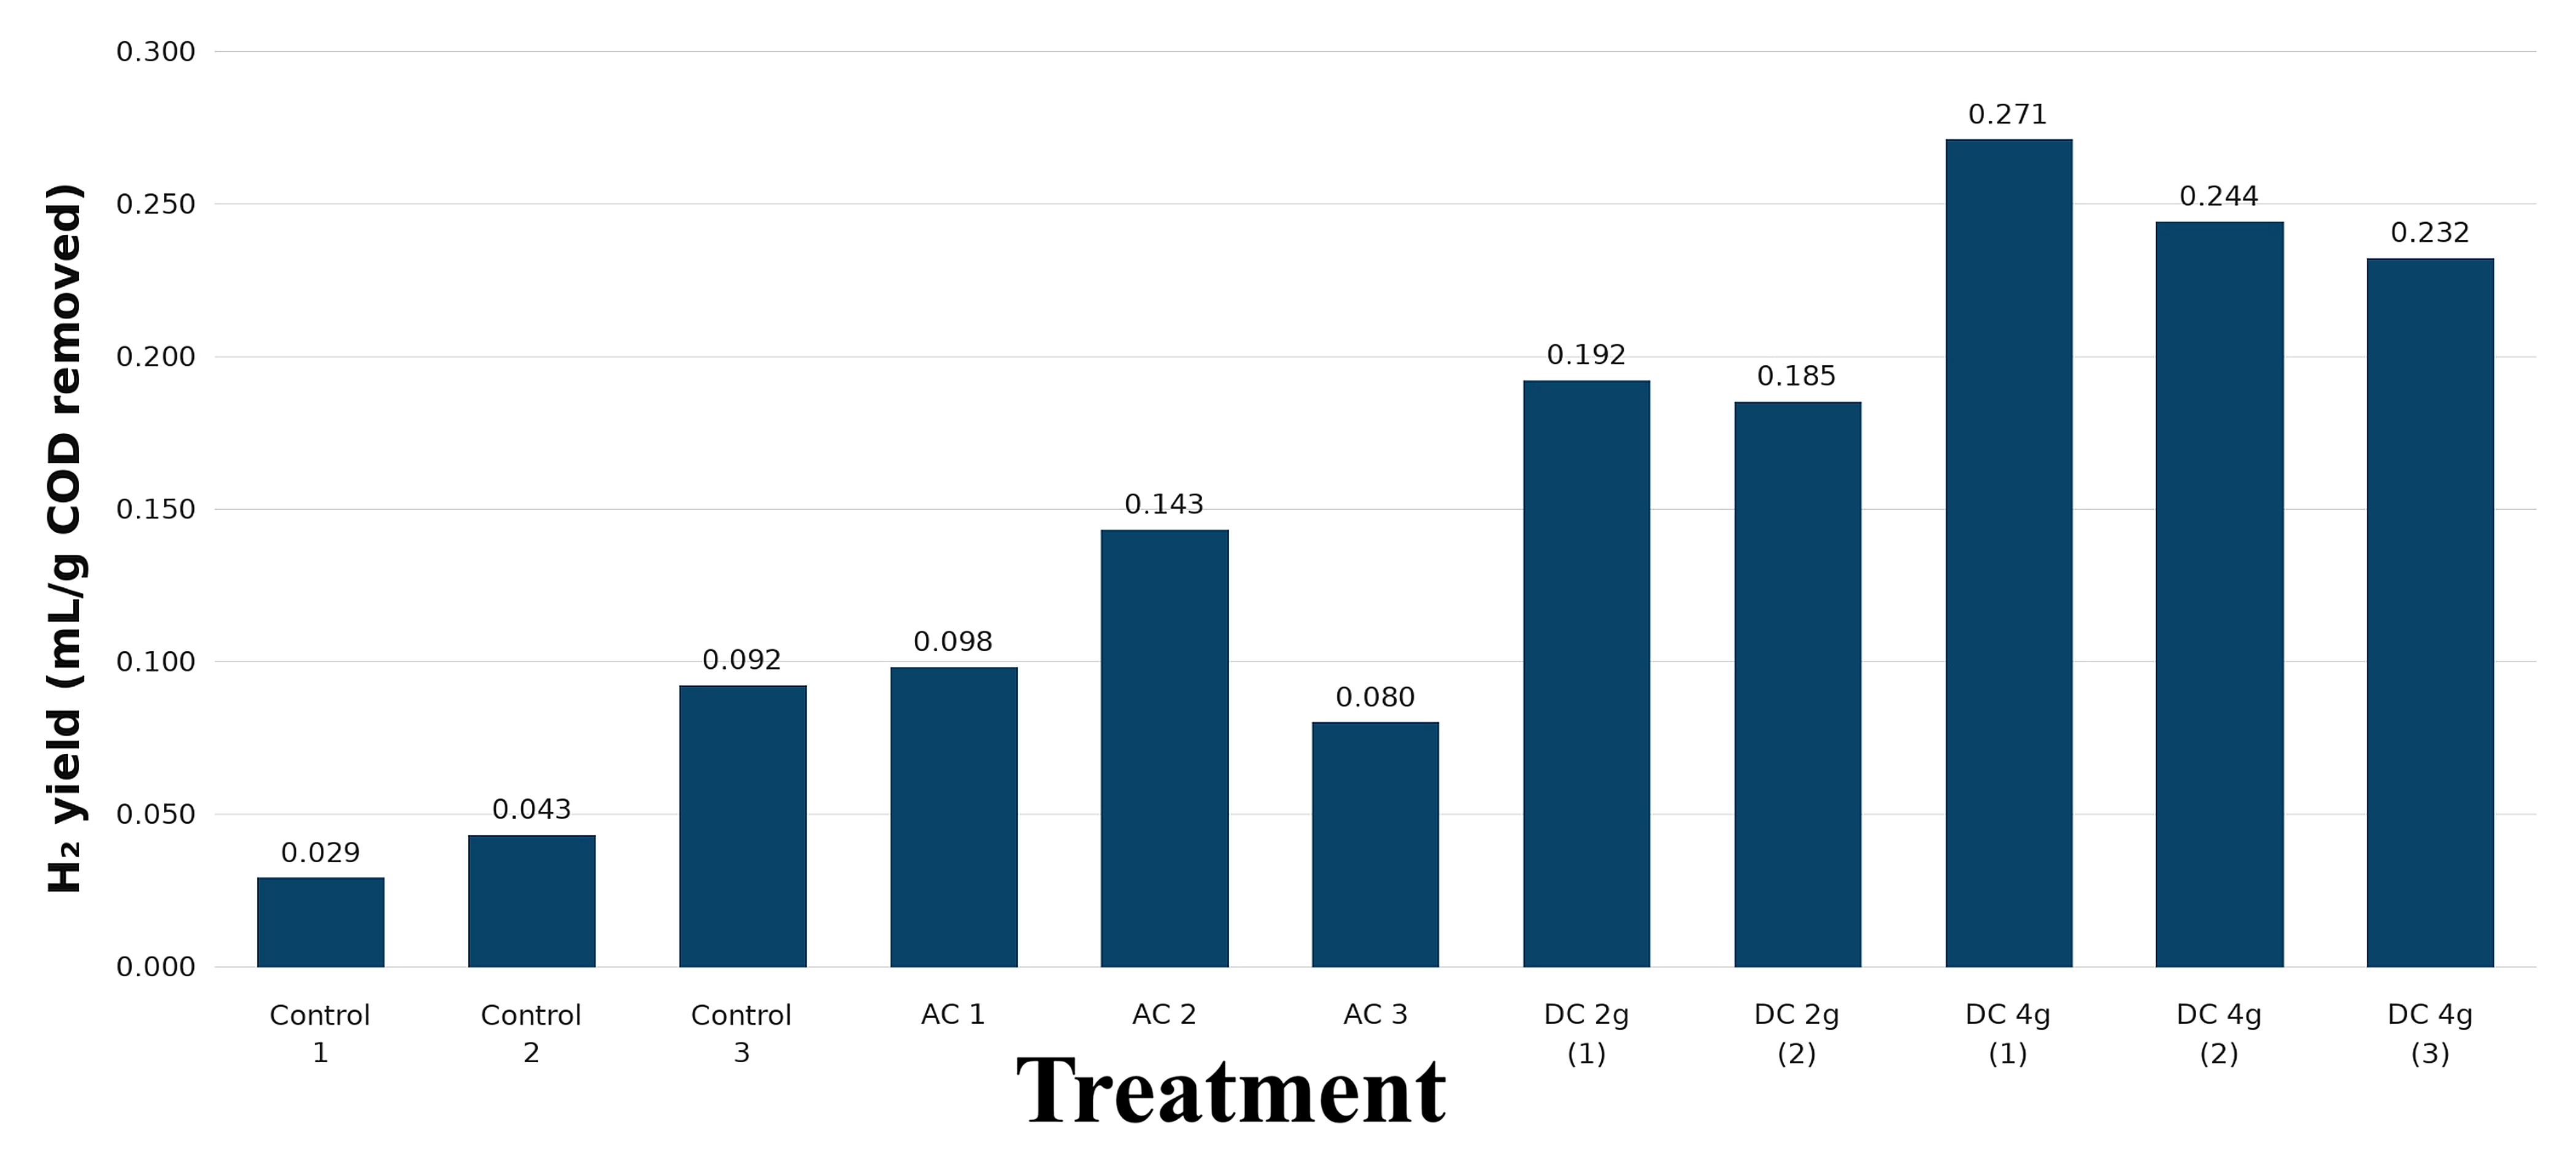
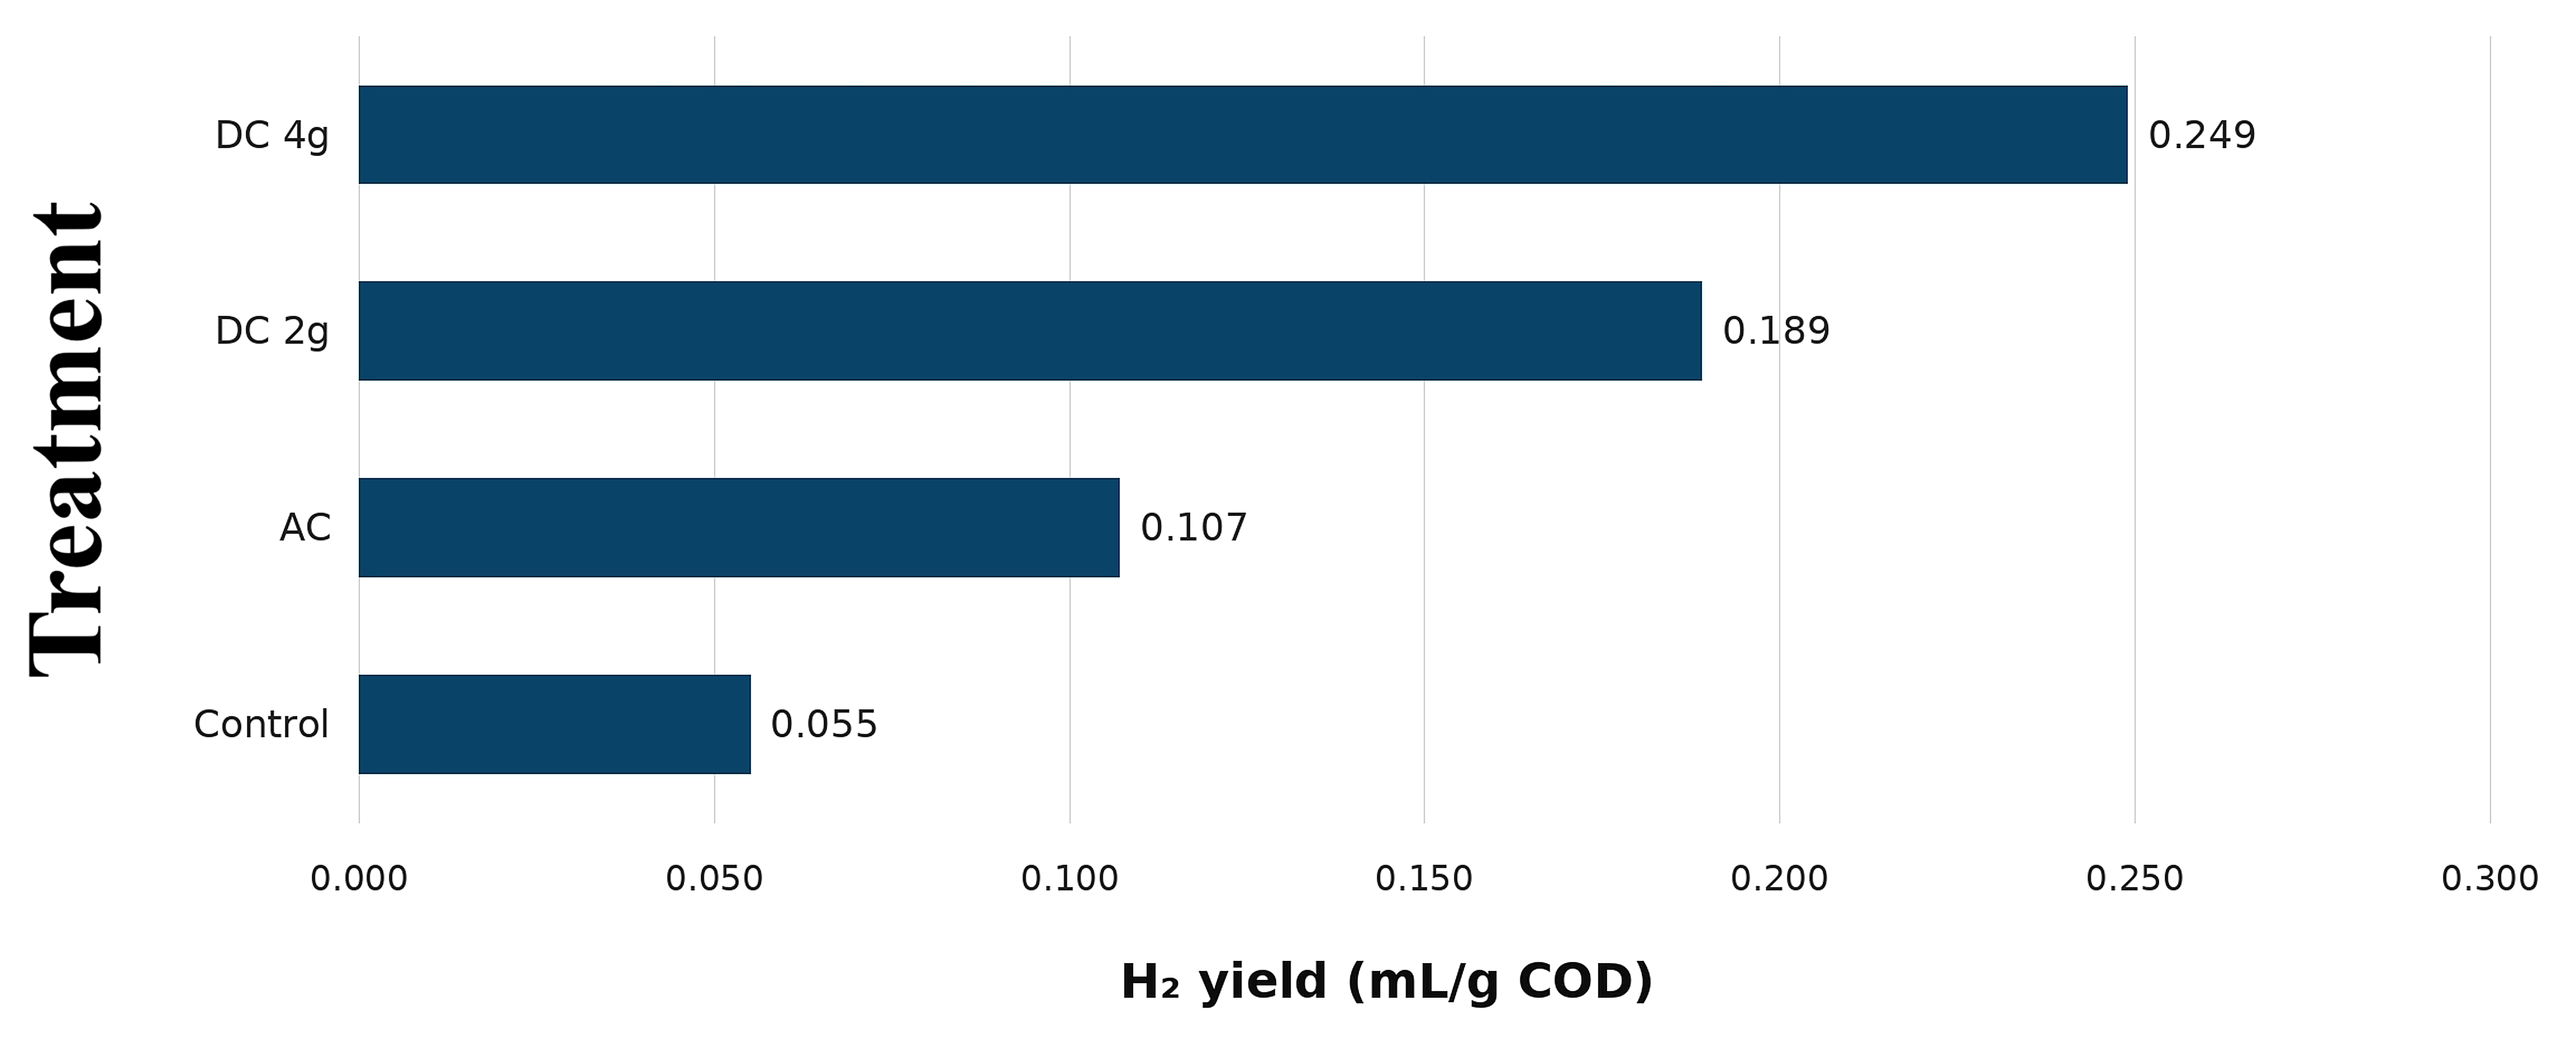
Figure 5 presents the biohydrogen yield (mL H2/g COD removed) per reactor, and Figure 6 shows the mean yields per group.
Reactors with 4 g of pure AC presented a mean yield of 0.107 ± 0.032 mL H2/g COD (CA1 = 0.098; CA2 = 0.143; CA3 = 0.080 mL H2/g COD), a consistent improvement over the control at a similar COD removal rate (about 50%). This points to AC acting mainly as an immobilization scaffold rather than an electron conduit, in line with Park et al. [40], who attributed AC-driven gains to altered metabolic flux and biofilm retention rather than to strong DIET mediation.
The most significant results were obtained with DC. Reactors with 4 g of DC presented a mean yield of 0.249 ± 0.020 mL H2/g COD removed (DC4(1) = 0.271; DC4(2) = 0.244; DC4(3) = 0.232 mL H2/g COD), approximately 4.5 times the control, with accumulated H2 volumes about three times superior and COD removals between 65.8% and 72.4%. Reactors with 2 g of DC averaged 0.189 ± 0.005 mL H2/g COD (DC2(1) = 0.192; DC2(2) = 0.185 mL H2/g COD), about 3.4 times the control, evidencing a clear dose–response relationship. The relative enhancement we observe is consistent with, and at the upper end of, prior doped-carbon studies, even though those used idealized feedstocks: Ramprakash & Incharoensakdi [42] gained +56% with peanut-shell NiFeAC on glucose, Jamaludin et al. [43] gained +57% in continuous mode with NiFe-doped granular AC on defined sugars, and Rambabu et al. [56] reported a 65.7% advantage of a date-seed Fe-oxide/AC composite over isolated nanoparticles. That our food-waste, mixed-culture system matches these magnitudes despite severe acidification underscores the robustness of the doped-carbon route. It is also consistent with the enhancement window (approximately 30–118% over unsupplemented controls) that Devika et al. [44] report for hybrid metal–carbon systems, and with their central observation that such hybrids consistently outperform their individual components; the clear dose–response relationship and the superiority of DC over both undoped AC and magnetite in our data are exactly the kind of controlled comparison their review identifies as still lacking in the field. The integration of high surface area, electronic conductivity, and Ni/Fe catalysis is what gives DC a more robust mode of action, combining physical support, DIET mediation, and hydrogenase activation, as also argued by Jamaludin et al. [43].

4.2. Integrated Analysis: COD, TVS, and pH

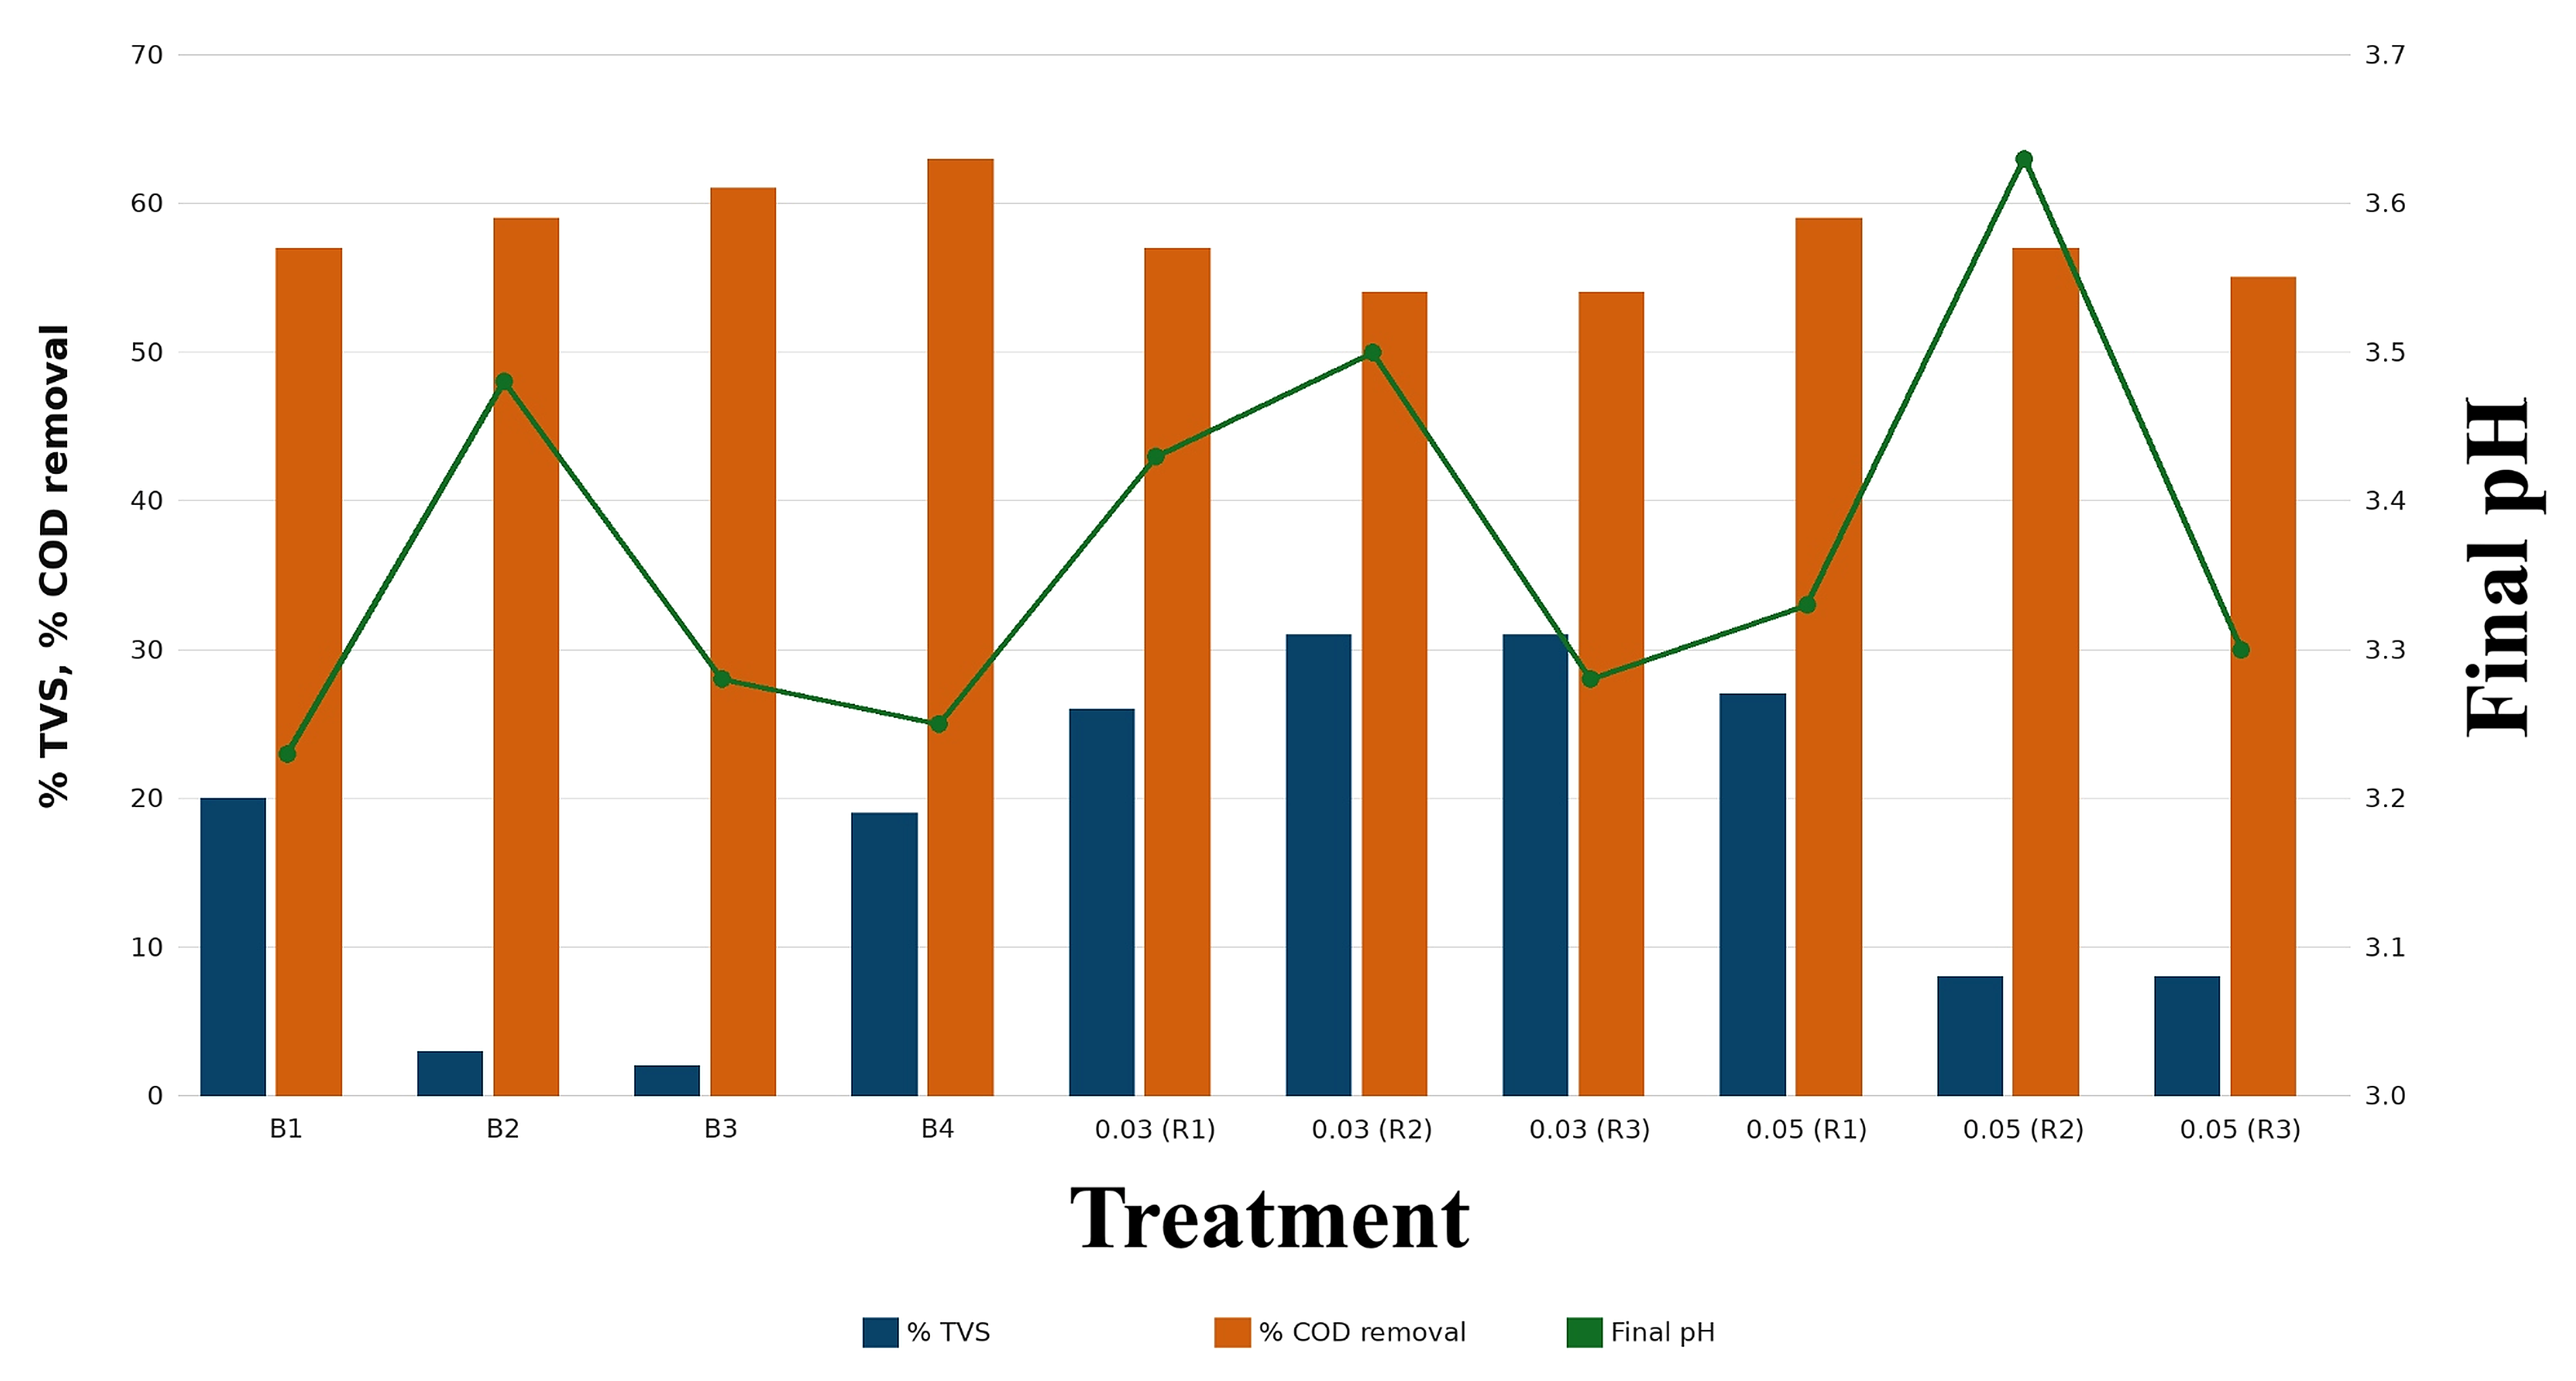
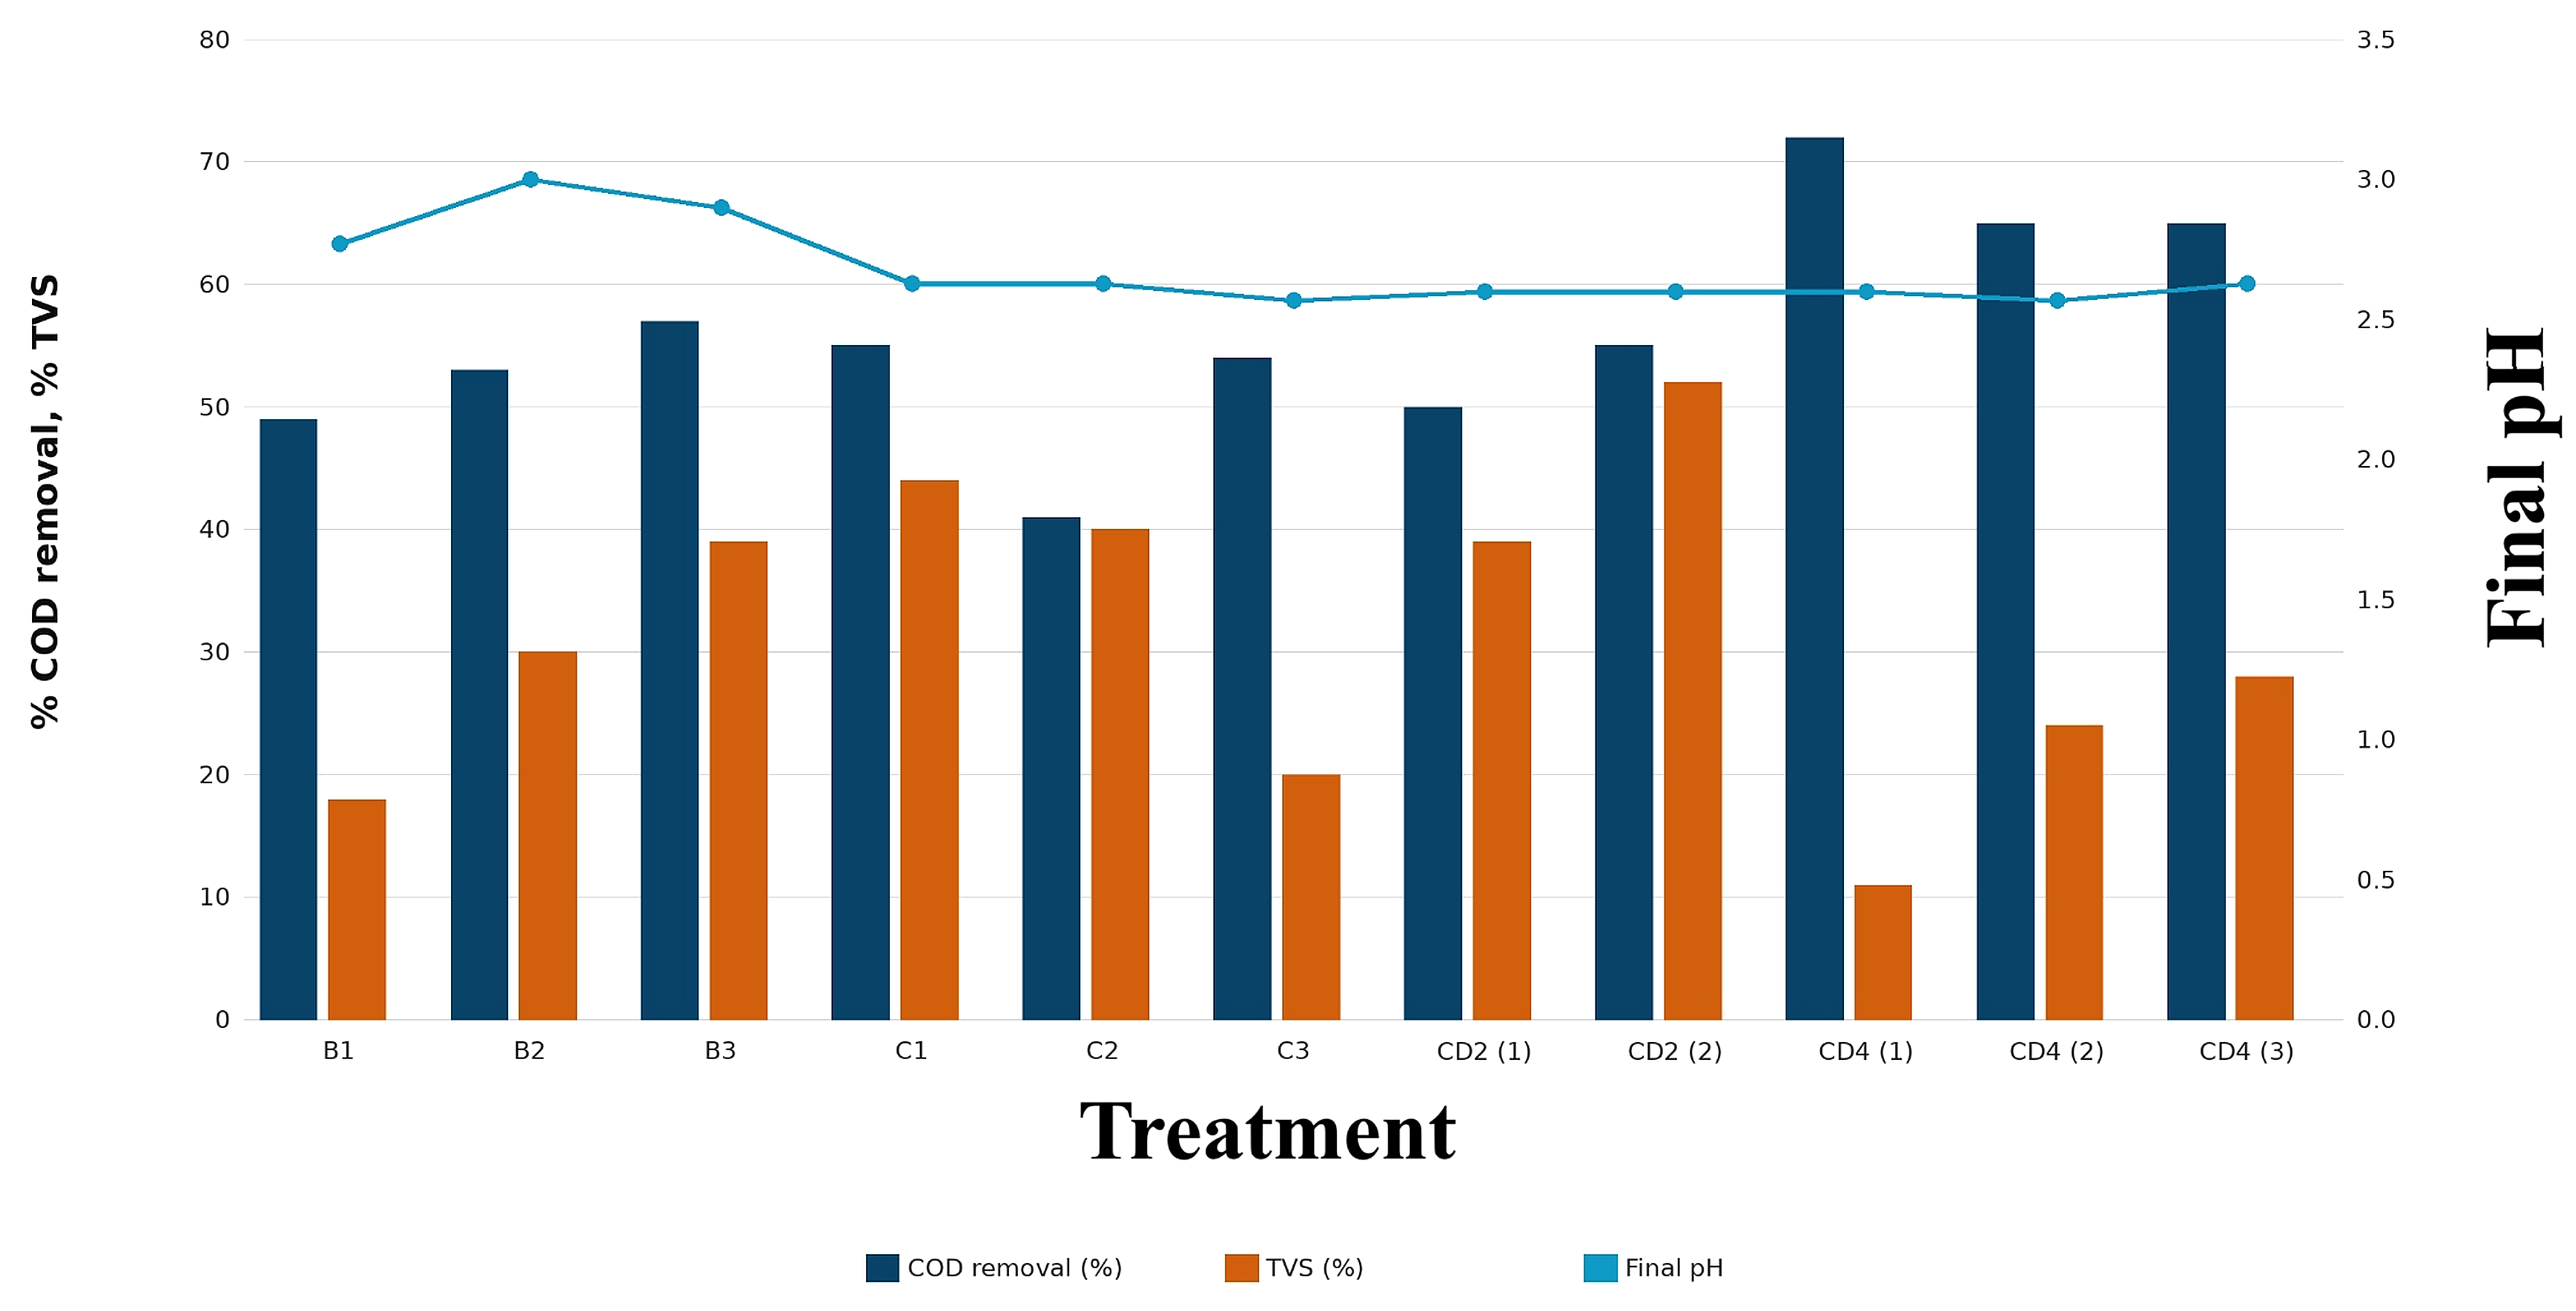
Figure 7 and Figure 8 present the integrated analysis of COD, TVS, and pH for the reactors of Experiments 1 and 2, respectively.
The integrated analysis of COD, pH, and TVS from Experiment 1 (Figure 7) confirms that the process occurred predominantly in the acidogenic phase. COD removal varied from 54.0% to 63.0% in the controls (B1–B4) and from 54.5% to 59.5% in the magnetite reactors, indicating consistent organic-matter consumption in all groups. Final pH ranged from 3.2 to 3.6 across all reactors, reflecting the accumulation of organic acids typical of acidogenesis. Relative TVS reductions were more expressive in reactors with 0.03 g of magnetite, especially R2 (31.0%) and R3 (31.0%), suggesting greater conversion of the particulate fraction in this group, while the controls showed more heterogeneous reductions (2.0–21.0%) and the 0.05 g magnetite reactors recorded the smallest TVS reductions (8.0–27.0%). In summary, the system primarily promoted the solubilization and transformation of organic matter, without complete degradation into gaseous products, with generated metabolites remaining accounted for in the volatile fraction of the digestate.
Initial COD (Experiment 2, Figure 8) ranged between about 48,933 and 70,933 mg/L. In the controls, removal varied from 49.1% to 57.2%. In reactors with pure AC, variability was observed (41.2–54.7%), with a mean similar to the control (about 50.0%), confirming that undoped AC does not promote significant gains in organic-matter degradation; its weak electroactive character precludes DIET intensification, consistent with the mechanistic picture of Chen et al. [20] and with the iron/biochar synergy that Zhang et al. [57] showed is needed before carbon supports enhance conversion. In contrast, DC reactors showed substantially higher removals (50.1–72.4%), with a mean of about 63.9%, reflecting the intensification of microbial activity by the electroactive properties of the doped material.
Initial TVS ranged between 75 and 182 g/L, reflecting the intrinsic heterogeneity of the substrate [19]. After fermentation, TVS increased in most reactors, attributable to microbial biomass growth and the formation of VFAs and alcohols that remain in the volatile fraction of the digestate. Notably, DC_4g reactors presented TVS reduction (from approximately 172 g/L to about 142 g/L) concomitant with higher H2 production, suggesting more effective conversion of organic matter into biogas in these systems.
Initial pH (about 5.5) is considered adequate for DF (optimal range 5.0–6.5), favoring fermentative bacteria and inhibiting methanogenic microorganisms [15]. However, at the end of the process, pH dropped to 2.5–3.1 in all reactors, well below the inhibitory threshold for hydrogenogenic bacteria (4.0–4.5) [15]. Volatile fatty acids (VFAs) were not quantified in this study, so the following interpretation is offered as the most probable explanation rather than as a directly demonstrated mechanism: the pronounced acidification is consistent with the progressive accumulation of VFAs (typically acetic, butyric, and propionic acids) under unbuffered conditions, which would inhibit hydrogenase activity and is expected to shift metabolism toward alternative pathways such as ethanol and lactate production. The decline of pH below 5.0 within the first days of operation would also progressively suppress the methanogenic archaea present in the raw UASB sludge; nevertheless, some hydrogen consumption by methanogens cannot be ruled out during the earliest stage, before the medium acidified, and this may have contributed to the low absolute yields. Direct VFA speciation and community analysis are therefore recommended in future work to confirm these pathways. Excessive acidification, in any case, constitutes the main operational limitation of this study.

4.3. Materials-Engineering Perspective on Magnetite, AC, and DC

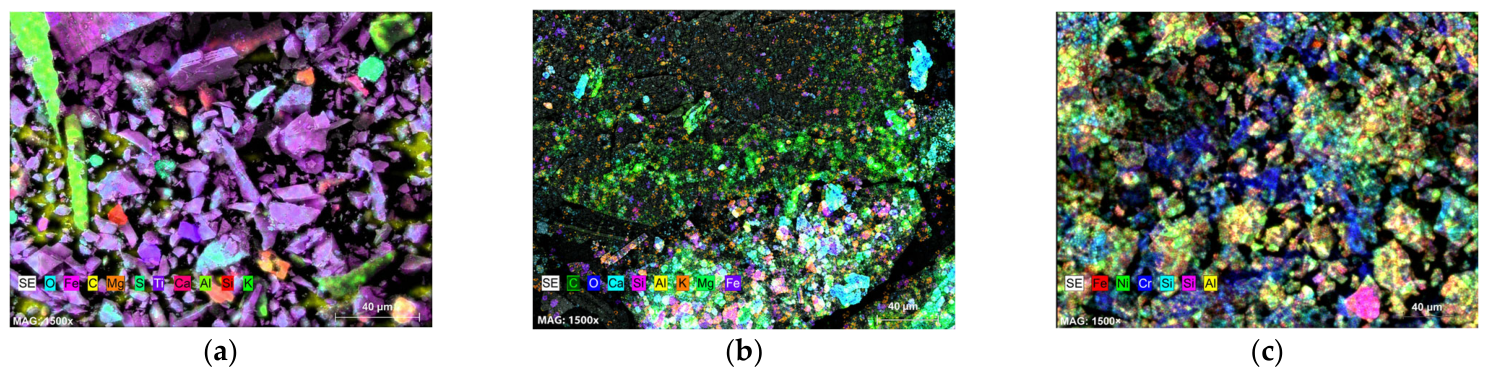
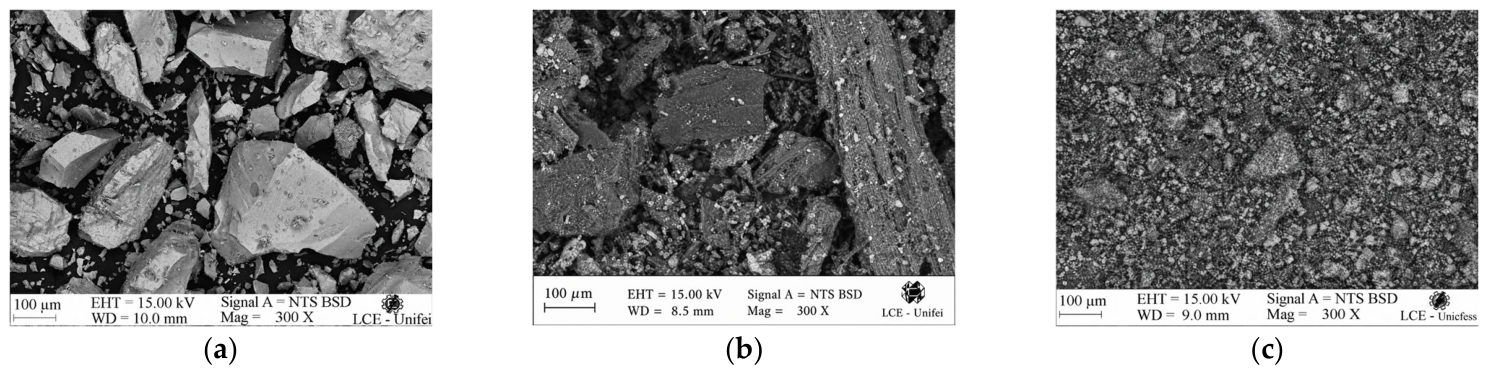
For magnetite (Figure 9a), SEM images revealed aggregates of irregular particles and a relatively compact surface, while EDS mapping confirmed the predominance of iron (Fe) and oxygen (O), consistent with a Fe3O4 structure. Granular AC (Figure 9b) exhibited a highly porous texture with interconnected cavities and channels, typical of commercial activated carbons, and EDS spectra (Figure 10b) showed carbon (C) as the major element, along with minor inorganic constituents such as Ca, Si, Al, K, and Mg originating from the mineral fraction.
In contrast, DC samples (Figure 9c) displayed more heterogeneous surface features and brighter regions associated with the presence of metallic phases. EDS mapping of the DC (Figure 10c) confirmed the successful incorporation of Fe and Ni into the carbon matrix, with these elements appearing finely dispersed throughout the porous structure, indicating that the laboratory-scale doping procedure effectively generated a hybrid, electroactive carbonaceous material. This characterization underpins the subsequent discussion on the distinct roles of magnetite, AC, and DC as functional additives for DIET promotion in dark fermentation.
In particular, the high Fe and Ni contents of DC (Table A1), together with its still carbon-rich matrix, indicate a hybrid material that combines abundant electroactive sites with a porous carbon backbone, whereas magnetite provides a metal-rich, highly conductive Fe3O4 phase but with a comparatively simple, non-porous structure, and AC offers a carbon-rich porous support that is essentially metal-poor.
Taken together, the SEM–EDS morphology maps directly onto reactor behavior: the purely particulate, non-porous magnetite delivered only punctual, non-reproducible gains; the porous but metal-poor AC gave moderate, consistent improvements as an immobilization scaffold; and only DC, which preserves the porous carbon architecture while dispersing Ni and Fe over its surface, combined structural support, conductivity, and catalysis into a single material that reproducibly raised yield (≈×4.5) and COD removal (65.8–72.4%) even under severe acidification.
More broadly, the fact that DC, and not the more conductive but purely particulate magnetite, gave the most reproducible enhancement reinforces a recurring lesson from studies of reactive-species and electron-transfer systems: performance is governed less by the absolute amount of active material than by which transfer pathway is made to dominate and how selectively it is engaged. In plasma-activated water, for example, Wang et al. [58] showed that disinfection efficacy was controlled by specific high-valence nitrogen species and the short-lived aqueous species they induce, rather than by the total oxidant load. Analogously, Sun et al. [59] demonstrated that a self-powered galvanic system could steer peroxymonosulfate activation toward a selective, non-radical singlet-oxygen pathway driven by a synergistic dual-site (anode/cathode) mechanism, again showing that directing the dominant pathway, not merely supplying more reactant, determines efficiency. By the same logic, the multifunctional DC surface, which couples a porous carbon backbone with finely dispersed, redox-active Ni and Fe sites, is expected to favor a more efficient, DIET-type electron-transfer route than magnetite’s conductive-but-featureless particles or AC’s metal-poor pores; direct electrochemical and speciation measurements would be needed to confirm which pathway dominates in the present system.
It should be stressed that the materials were characterized here only by SEM–EDS, which resolves surface morphology and near-surface elemental composition but not crystalline phase, specific surface area, or oxidation state. Consequently, the EDS detection of Fe and Ni in DC confirms that the doping procedure incorporated these metals into the carbon matrix, but it does not by itself identify the Fe3O4 phase in magnetite or the speciation of the Ni and Fe phases in DC. Complementary techniques, including X-ray diffraction (XRD) for crystalline phase, N2 physisorption (BET) for surface area and porosity, and X-ray photoelectron spectroscopy (XPS) for surface oxidation states, would be required to fully link material structure to function and are planned for subsequent work; the mechanistic attributions in this section should be read with that limitation in mind.

4.4. Comparison Between Additives and Statistical Analysis

Figure 11 presents the cumulative and mean yields from both experiments, and Figure 12 presents the complete statistical analysis.
The comparison between magnetite and AC/DC additives reveals distinct behaviors in dark fermentation intensification. In the magnetite assays, behavior was markedly heterogeneous between replicates of the same condition (Figure 11). At 0.05 g dosage, reactor R2 reached an accumulated productivity of 0.340 mL H2/g COD, expressively superior to the control, while R1 (0.079 mL H2/g COD) and R3 (0.089 mL H2/g COD), under nominally identical conditions, remained within the control reactor range (0.032–0.104 mL H2/g COD). At a dosage of 0.03 g, productivities ranged from 0.037 mL H2/g COD (R1) to 0.122 mL H2/g COD (R3), with no clear systematic gain over the control.
One-way ANOVA (Figure 12) demonstrated highly significant differences between treatments (F(6, 14) = 48.7; p < 0.001; η2 = 0.954; ω2 = 0.932), indicating that about 95% of the total variance is attributable to treatment type. The Tukey post hoc test confirmed that DC_4g differed significantly from every other treatment except DC_2g (p ≤ 0.001 against the controls and the magnetite and AC groups; p = 0.115 versus DC_2g, the only pair it did not separate from). DC_2g likewise differed from both controls, the magnetite groups and AC_4g, with p ranging from < 0.001 to 0.019. AC_4g differed from DC_2g (p = 0.019) and DC_4g (p < 0.001) but not from its control (p = 0.135), and neither the two control groups nor the magnetite groups differed from one another (p > 0.05), confirming the absence of a systematic, reproducible gain from magnetite under the evaluated conditions.
The performance hierarchy, DC_4g > DC_2g > AC_4g > control ≈ magnetite, is consistent with the proposed mechanisms: magnetite acts via DIET whose efficacy depends on hard-to-standardize local conditions, as Cheng et al. [39] also observed; pure AC offers physical support without significant electroactive function, in agreement with Park et al. [40]; and DC integrates physical support, electronic conductivity, and Ni/Fe catalysis, mirroring the multifunctional behavior described by Jamaludin et al. [43]. The heterogeneity of variances (Levene p = 0.028) is itself a relevant finding: DC_4g, with the highest yield, exhibited the smallest standard deviation (±0.020), whereas Magnetite_005 recorded the largest (±0.029), reinforcing that reproducibility and efficiency are equally relevant for technological viability.
The screening does not negate the technological relevance of DC. DC 4 g was the only condition combining statistically superior and reproducible hydrogen yield with higher COD removal. Rather, it identifies the requirements for a credible process-scale assessment: reduced and optimized DC dosage, low-cost or waste-derived precursors, reuse across multiple cycles, quantification of metal leaching and regeneration, pH-controlled high-rate operation, and valorization of the VFA-rich residual stream. The group’s previous LCOH analysis showed that unit hydrogen cost decreases as annual organic-waste throughput increases [26]; however, LCOH, NPV, IRR, and payback cannot be defensibly calculated for the present tests without process-scale design and operating data.
The estimated electricity used for heating and manual stirring of one 0.50 L reactor over 45 d was 108.1 kWh (R$97.27). The DC synthesis protocol added an estimated 12.9 kWh (R$11.61) for a 24 g batch, equivalent to 2.15 kWh (R$1.94) per 4 g DC dose. These are conservative laboratory allocations rather than measured process-energy values, since the actual heating duty cycle was not metered and the same thermal control could serve multiple reactors. Nonetheless, the measured H2 energy output remained orders of magnitude lower than this laboratory allocation, demonstrating why the present bench-scale balance cannot be directly projected to industrial operation.
Under the stated single-use price assumptions, direct additive costs were R$0.10 per AC 4 g dose, R$0.32 per DC 2 g dose, and R$0.64 per DC 4 g dose. NiCl2·6H2O accounted for approximately 74% of the estimated DC reagent cost. For DC 4 g, the theoretical gross-value increment associated with the additional H2 was approximately R$0.00011 per reactor, far below the estimated R$0.64 material cost. Thus, direct single-use additive costs were not offset by the value benchmark of incremental H2 in any tested scenario.
DC 4 g therefore increased recovered hydrogen energy by approximately 0.042 kJ per reactor relative to its corresponding control, while DC 2 g increased it by approximately 0.030 kJ per reactor. These gains confirm the experimental performance ranking, but the absolute hydrogen-energy recovery remained very small because the assays were unbuffered, long-duration batch tests with a 0.50 L working volume. The figures should consequently be interpreted as a material-performance screen, not as a net-energy claim.
The preliminary screening was restricted to the AC/DC experimental block because it contains the reproducible DC dose response and the clearest candidate for further development. Using the reported mean yields and reconstructed mean COD removed, the estimated mean hydrogen outputs per 0.50 L reactor were 0.86 mL for the control, 1.60 mL for AC 4 g, 3.61 mL for DC 2 g, and 4.75 mL for DC 4 g. The corresponding hydrogen chemical-energy recoveries were 0.009, 0.017, 0.039, and 0.051 kJ per reactor, respectively.

4.5. Preliminary Energy and Additive-Cost Screening

Table 1 compares the measured hydrogen output and associated energy with the direct material cost of the tested additives. Under the conservative single-use assumption adopted here, the direct cost of the 4 g DC dose exceeded the theoretical gross value of the additional hydrogen generated. This outcome is expected for a laboratory-prepared hybrid material applied in a low-yield, unbuffered batch system, and it should not be interpreted as evidence against the material’s potential process. Rather, it identifies the conditions needed before practical deployment can be considered: substantially higher hydrogen productivity, lower DC dosage, recovery and repeated reuse of the material, inexpensive large-scale synthesis, and process integration with pH control and downstream recovery of the VFA-rich effluent.
The preliminary analysis does not negate the technological relevance of DC. DC 4 g was the only treatment that combined a statistically superior and reproducible hydrogen yield with higher COD removal. Instead, it establishes the conditions required for an economically credible next step: reduced and optimized DC dosage, lower-cost or waste-derived precursor materials, verified reuse across multiple cycles, quantification of metal leaching and regeneration, pH-controlled high-rate operation, and valorization of the VFA-rich residual stream. The group’s previous LCOH analysis showed that unit hydrogen cost declines as annual organic-waste throughput rises [26]; however, a defensible LCOH, NPV, IRR, or payback period for the present route would require process-scale design and operating data that were not produced in these batch tests. The estimated electricity used by heating and daily manual stirring of one 0.50 L reactor over 45 d is 108.1 kWh (R$97.27). The DC synthesis protocol adds an estimated 12.9 kWh (R$11.61) for the 24 g batch, equivalent to 2.15 kWh (R$1.94) per 4 g DC dose. These figures are intentionally conservative because the actual heating duty cycle was not metered and the laboratory incubator/thermostat could support several reactors simultaneously. Nevertheless, even if the thermal-energy estimate were reduced substantially through shared heating and scale-up, the measured H2 energy output would remain orders of magnitude lower than the laboratory energy input. This finding is expected for a small, unbuffered, long-duration batch assay and demonstrates why laboratory energy balances must not be directly projected to process scale. Under the stated single-use material-price assumptions, the direct material cost is estimated at R$0.10 per AC 4 g dose, R$0.32 per DC 2 g dose, and R$0.64 per DC 4 g dose. The DC cost is dominated by NiCl2·6H2O, which accounts for approximately 74% of the reagent cost under the adopted scenario. The theoretical gross-value increment associated with the additional H2 in DC 4 g is only approximately R$0.00011 per reactor, whereas the direct single-use DC cost is approximately R$0.64 per reactor. Therefore, the bench-scale material cost is not offset by the value of incremental H2 under any of the tested single-use scenarios. Thus, DC 4 g increased hydrogen energy by approximately 0.042 kJ per reactor relative to its corresponding control, while DC 2 g increased it by approximately 0.030 kJ per reactor. These gains confirm the experimental ranking but remain intrinsically small because the batch assays were deliberately unbuffered and operated with a 0.50 L working volume. The result should therefore be interpreted as a direct material-performance comparison, not as a net-energy claim.

5. Conclusions

Comparing magnetite, granular activated carbon (AC), and nickel–iron-doped activated carbon (DC) under identical, unbuffered dark fermentation conditions established a clear and statistically robust performance hierarchy (DC > AC ≈ control > magnetite). The metal-doped carbon was the only additive that improved biohydrogen production consistently across replicates, whereas magnetite gave only sporadic, non-reproducible gains and undoped AC acted mainly as an immobilization scaffold. The central finding is therefore that multifunctionality, rather than conductivity alone, distinguishes an effective DIET-oriented additive: only DC combined a porous carbon backbone with dispersed redox-active Ni and Fe sites, and only DC delivered reproducible intensification.
The significance of these results lies in their realism. Because the assays used genuine post-consumer food waste and raw UASB sludge without pH control or inoculum pre-treatment, severe acidification was the dominant operational limitation, and the absolute yields reported here are best read as a conservative lower bound rather than as the intrinsic ceiling of the additives. That DC still produced a reproducible, several-fold enhancement under these adverse conditions is precisely what makes the doped-carbon route attractive for practical, low-intervention deployment.
The preliminary scenario-based screening provides an essential boundary to these results. Under the single-use bench-scale assumptions, the increase in hydrogen output with DC did not offset direct material cost or estimated laboratory electricity demand; therefore, no claim of net-positive energy performance or economic feasibility is made. This conclusion reflects the small, unbuffered batch reactors and low absolute H2 output, not a plant-scale estimate. DC remains the most promising additive because it was the only material that improved hydrogen yield reproducibly and increased COD removal. Its practical viability will depend on material reuse, lower-cost synthesis, optimized dose, pH-controlled high-rate operation, and integrated recovery of the residual VFA-rich stream.
Future work should focus on two fronts. First, coupling the doped-carbon additive with pH management, through buffering or controlled dosing of alkaline agents, to release the yield currently suppressed by acidification. Second, obtaining the direct evidence that the present study did not provide: electrochemical measurements and microbial-community or gene-expression analyses to confirm the DIET contribution, volatile-fatty-acid speciation to close the metabolic balance, and XRD/BET/XPS characterization to link material structure to function. Addressing these points, together with an energy and cost assessment, would clarify the potential of metal-doped carbonaceous materials for scaling dark fermentation of food waste within integrated biorefinery configurations; techno-economic and supply-chain optimization frameworks such as the biowaste-to-green-hydrogen model of Goh et al. [60], which jointly weighs profitability, carbon footprint, and safety, provide a natural basis for that assessment. Such an assessment should be resolved by plant scale, since the techno-economic analysis of Han et al. [61] for continuous dark fermentative hydrogen production showed that the return on investment turned positive only above a threshold reactor scale, with payback period and internal rate of return improving steadily as capacity increased; the economic case for additive-intensified dark fermentation is therefore inseparable from scale-up. Finally, because dark fermentation alone leaves a large share of feedstock carbon and electrons in the residual, acid-rich effluent, the doped-carbon route is best positioned within integrated configurations that recover that residual stream, for example by coupling to photo-fermentation, microbial electrolysis, or anaerobic digestion, as argued in the carbon- and electron-recovery framework of Yadav and Jung [16].

Author Contributions

Conceptualization, R.M.B. and G.S.P.; methodology, G.S.P., R.M.B. and R.V.A.; validation, J.C.E.P. and E.E.S.L.; formal analysis, G.S.P. and A.J.M.O.P.; investigation, G.S.P., A.M.d.C.C. and J.V.R.d.F.; resources, R.M.B. and E.E.S.L.; writing—original draft preparation, G.S.P.; writing—review and editing, R.M.B., R.V.A. and J.C.E.P.; visualization, G.S.P. and A.J.M.O.P.; supervision, R.M.B.; project administration, R.M.B.; funding acquisition, R.M.B., J.C.E.P. and E.E.S.L. All authors have read and agreed to the published version of the manuscript.

Funding

This research was funded by the Minas Gerais State Research Foundation (FAPEMIG), Project FAPEMIG RED-00090-21 (Hydrogen Research Network in Minas Gerais, REPHIMIGE, FAPEMIG Call 07/2021).

Data Availability Statement

The data that support the findings of this study are available from the corresponding author upon reasonable request.

Acknowledgments

This research was supported by the Minas Gerais State Research Foundation (Fundação de Amparo à Pesquisa do Estado de Minas Gerais, FAPEMIG), Project FAPEMIG RED-00090-21—“Theoretical-experimental evaluation of the production and use of green hydrogen in Minas Gerais”, Hydrogen Research Network in Minas Gerais (REPHIMIGE), FAPEMIG Call 07/2021, as well as by a master’s scholarship (Finance Code 001) granted to Gabriela Simões Pereira. We are thankful to the National Agency of Petroleum, Natural Gas and Biofuels (Agência Nacional do Petróleo, Gás Natural e Biocombustíveis, ANP; in Portuguese), and the PRH program for granting the Doctorate scholarship (finance code I) to Aylla Joani Mendonça Oliveira Pontes. The authors would like to thank the Brazilian National Council for Scientific and Technological Development (Conselho Nacional de Desenvolvimento Científico e Tecnológico, CNPq; in Portuguese) for the Research Productivity Grant to Regina Mambeli Barros (PQB, Process No. 318668/2025-4), José Carlos Escobar Palacio, and Electo Eduardo Silva Lora. During the preparation of this work, the authors used Claude® (Opus 4.8) (Anthropic, claude.ai, Claude Sonnet, 2025) to assist with English-language revision of the manuscript, drafting figure captions, and preparing the list of abbreviations. After using this tool, the authors reviewed and edited the content as necessary and take full responsibility for the content of the published article.

Conflicts of Interest

The authors declare no conflicts of interest.

Abbreviations

The following abbreviations are used in this manuscript:
ACGranular activated carbon
ANOVAAnalysis of variance
BioH2Biological hydrogen
CODChemical oxygen demand
Co-Fe3O4Cobalt-doped magnetite
COPASACompanhia de Saneamento de Minas Gerais (Minas Gerais Sanitation Company)
DCNickel–iron-doped activated carbon
DFDark fermentation
DIETDirect interspecies electron transfer
EDSEnergy-dispersive X-ray spectroscopy
EEL/USPLorena School of Engineering of the University of São Paulo
EMPEmbden–Meyerhof–Parnas (pathway)
FAPEMIGFundação de Amparo à Pesquisa do Estado de Minas Gerais (Minas Gerais State Research Foundation)
Fe3O4Magnetite
Fe3O4-rGOMagnetite-reduced graphene oxide nanocomposite
GACNiFeNickel–iron-doped granular activated carbon
GHGGreenhouse gas
H2Molecular hydrogen
ICP-OESInductively coupled plasma optical emission spectrometry
IRENAInternational Renewable Energy Agency
MSWMunicipal solid waste
NAD+Nicotinamide adenine dinucleotide (oxidized form)
NADHNicotinamide adenine dinucleotide (reduced form)
NiFeNickel–iron
NiFeACNickel–iron-doped activated carbon (peanut-shell-based)
OSWOrganic solid waste
PETPolyethylene terephthalate
PFLPyruvate:formate lyase (pathway)
PFORPyruvate:ferredoxin oxidoreductase (pathway)
PNH2Programa Nacional do Hidrogênio (National Hydrogen Program)
REPHIMIGERede de Pesquisa em Hidrogênio de Minas Gerais (Hydrogen Research Network in Minas Gerais)
SCTPStandard conditions of temperature and pressure
SDGsSustainable Development Goals
SEMScanning electron microscopy
TSTotal Solids
TVSTotal Volatile Solids
UASBUpflow anaerobic sludge blanket
UNIFEIUniversidade Federal de Itajubá (Federal University of Itajubá)
VAOsVolatile acidogenic organisms
VFAsVolatile fatty acids

Appendix A

Appendix A.1. Metabolic Stoichiometry of Dark Fermentation

During glycolysis through the Embden–Meyerhof–Parnas (EMP) pathway, glucose is oxidized using NAD+ as the electron acceptor, yielding pyruvate, protons, and NADH (Equation (A1)):
C6H12O6 + 2NAD+ → 2CH3COCOO + 4H+ + 2NADH
The theoretical maximum hydrogen yield is 12 mol H2 per mol of glucose (Equation (A2)). In practice, when acetic acid is the dominant end-product, the yield is limited to 4 mol H2 per mol of hexose (Equation (A3)), and when butyric acid predominates, it falls to 2 mol H2 per mol of glucose (Equation (A4)):
C6H12O6 + 6H2O → 6CO2 + 12H2
C6H12O6 + 2H2O → 2CO2 + 2CH3COOH + 4H2
C6H12O6 + 2H2O → 2CO2 + CH3CH2CH2COOH + 2H2

Appendix A.2. Elemental Composition of the Functional Materials (SEM–EDS)

Table A1. The elemental composition (wt%) of magnetite, activated carbon (AC), and doped activated carbon (DC), obtained by energy-dispersive X-ray spectroscopy (EDS); the dashes (—) indicate elements below the detection limit.
ElementMagnetite (wt%)Activated Carbon, AC (wt%)Doped Activated Carbon, DC (wt%)
Carbon15.2751.8854.30
Oxygen26.5829.83
Iron49.283.3227.11
Nickel14.33
Calcium1.7311.352.58
Silicon1.730.871.02
Aluminum1.330.920.66
Potassium1.351.72
Magnesium1.070.11
Sulfur1.63
Titanium1.04
Total100100100
The high combined Fe (27.11 wt%) and Ni (14.33 wt%) content of DC, retained over a still carbon-rich matrix (54.30 wt% C), confirms the successful incorporation of catalytic metal phases without loss of the porous carbon backbone. Magnetite is dominated by Fe (49.28 wt%) and O (26.58 wt%), consistent with an Fe3O4 phase, whereas undoped AC is essentially carbonaceous (51.88 wt% C) and metal-poor (3.32 wt% Fe).

Appendix A.3. Post Hoc Comparisons of Biohydrogen Yield (Tukey)

Table A2. Tukey HSD post hoc comparisons of mean biohydrogen yield (mL H2/g COD removed) between treatments, based on the estimated marginal means of the one-way ANOVA (df = 14). p_tukey values below 0.05 indicate a statistically significant difference.
ComparisonMean DifferenceSEtp_Tukey
Ctrl (Mag)—Mag 0.03 g0.000050.01720.0031.000
Ctrl (Mag)—Mag 0.05 g−0.01920.0172−1.1130.914
Ctrl (Mag)—Ctrl (AC/DC)−0.04000.0172−2.3210.299
Ctrl (Mag)—AC 4 g−0.09240.0172−5.3570.002
Ctrl (Mag)—DC 2 g−0.17390.0195−8.894<0.001
Ctrl (Mag)—DC 4 g−0.23440.0172−13.595<0.001
Mag 0.03 g—Mag 0.05 g−0.01920.0184−1.0440.934
Mag 0.03 g—Ctrl (AC/DC)−0.04010.0184−2.1740.366
Mag 0.03 g—AC 4 g−0.09240.0184−5.0140.003
Mag 0.03 g—DC 2 g−0.17390.0206−8.440<0.001
Mag 0.03 g—DC 4 g−0.23440.0184−12.720<0.001
Mag 0.05 g—Ctrl (AC/DC)−0.02080.0184−1.1310.908
Mag 0.05 g—AC 4 g−0.07320.0184−3.9700.018
Mag 0.05 g—DC 2 g−0.15470.0206−7.507<0.001
Mag 0.05 g—DC 4 g−0.21520.0184−11.676<0.001
Ctrl (AC/DC)—AC 4 g−0.05230.0184−2.8400.135
Ctrl (AC/DC)—DC 2 g−0.13380.0206−6.496<0.001
Ctrl (AC/DC)—DC 4 g−0.19430.0184−10.545<0.001
AC 4 g—DC 2 g−0.08150.0206−3.9560.019
AC 4 g—DC 4 g−0.14200.0184−7.706<0.001
DC 2 g—DC 4 g−0.06050.0206−2.9360.115
Ctrl (Mag): additive-free control of the magnetite block; Mag 0.03 g/Mag 0.05 g: magnetite dosages; Ctrl (AC/DC): additive-free control of the AC/DC block; AC 4 g: granular activated carbon; DC 2 g/DC 4 g: nickel–iron-doped activated carbon dosages. SE: standard error. The full ANOVA summary (F(6,14) = 48.7; p < 0.001; η2 = 0.954; ω2 = 0.932), Levene (p = 0.028) and Shapiro–Wilk (W = 0.916; p = 0.073) tests, and the Q–Q plot are reported in the main text (Section 4.5 and Figure 12).

References

  1. Hwang, J.; Maharjan, K.; Cho, H. A review of hydrogen utilization in power generation and transportation sectors: Achievements and future challenges. Int. J. Hydrogen Energy 2023, 48, 28629–28648. [Google Scholar] [CrossRef] [Scilit]
  2. IRENA—International Renewable Energy Agency. Global Hydrogen Trade to Meet the 1.5 °C Climate Goal: Part I; IRENA: Abu Dhabi, United Arab Emirates, 2022. [Google Scholar]
  3. Bhandari, R.; Shah, R.R. Hydrogen as energy carrier: Techno-economic assessment of decentralized hydrogen production in Germany. Renew. Energy 2021, 177, 915–931. [Google Scholar] [CrossRef] [Scilit]
  4. Roman, L.M.G. Produção de Bio-Hidrogênio a Partir da Casca de Arroz via Fermentação Escura. Master’s Thesis, Universidade Federal de Santa Maria, Santa Maria, Brazil, 2021. Available online: https://repositorio.ufsm.br/bitstream/handle/1/24905/DIS_PPGEA_2021_ROMAN_LIZET.pdf?sequence=1&isAllowed=y (accessed on 12 September 2026).
  5. REN21. Renewables 2023 Global Status Report: Hydrogen Module—Market Developments; REN21: Paris, France, 2023; Available online: https://www.ren21.net/wp-content/uploads/2019/05/GSR2023_GlobalOverview_Full_Report_with_endnotes_web.pdf (accessed on 12 September 2026).
  6. Ministério de Minas e Energia (MME). Plano de Trabalho Trienal 2023–2025 do Programa Nacional do Hidrogênio—PNH2; MME: Brasília, Brazil, 2023.
  7. Brasil. Lei nº 14.948, de 2 de Agosto de 2024. Institui a Política Nacional do Hidrogênio de Baixa Emissão de Carbono. Diário Oficial da União. 2024. Available online: https://www.presidencia.gov.br/ccivil_03/_ato2023-2026/2024/lei/l14948.htm (accessed on 12 September 2026).
  8. EPE—Empresa de Pesquisa Energética. Balanço Energético Nacional 2024: Relatório Síntese—Ano Base 2023; EPE: Rio de Janeiro, Brazil, 2024.
  9. Viana, N.A. Aproveitamento Energético de Biomassas Residuais Florestais do Cerrado Para Produção de Gás de Síntese por Meio do Processo de Gaseificação. Master’s Thesis, Universidade de Brasília, Brasília, Brazil, 2015. Available online: https://www.repositorio.unb.br/bitstream/10482/19498/1/2015_N%c3%a1diaAlvesViana.pdf (accessed on 12 September 2026).
  10. Silva, T.C.D.; Khan, S.A.; Kumar, S.; Kumar, D.; Isha, A.; Deb, S.; Yadav, S.; Illathukandy, B.; Chandra, R.; Vijay, V.K.; et al. Biohydrogen production through dark fermentation from waste biomass: Current status and future perspectives on biorefinery development. Fuel 2023, 350, 128842. [Google Scholar] [CrossRef] [Scilit]
  11. Pant, M.; Bisen, D.; Kewlani, P.; Srivastav, A.L.; Bhatt, I.D.; Chakma, S. Review of food waste valorization technologies: A sustainable approach to resource recovery and utilization. Biomass Futures 2026, 1, 100001. [Google Scholar] [CrossRef] [Scilit]
  12. Sahota, S.; Kumar, S.; Lombardi, L. Biohythane, biogas, and biohydrogen production from food waste: Recent advancements, technical bottlenecks, and prospects. Energies 2024, 17, 666. [Google Scholar] [CrossRef] [Scilit]
  13. Rittmann, S.; Herwig, C. A comprehensive and quantitative review of dark fermentative biohydrogen production. Microb. Cell Fact. 2012, 11, 115. [Google Scholar] [CrossRef] [Scilit] [PubMed]
  14. Soares, J.F.; Mayer, F.D.; Mazutti, M.A. Hydrogen production from Brewer’s spent grain hydrolysate by dark fermentation. Int. J. Hydrogen Energy 2024, 52, 352–363. [Google Scholar] [CrossRef] [Scilit]
  15. Ghimire, A.; Frunzo, L.; Pirozzi, F.; Trably, E.; Escudie, R.; Lens, P.N.L.; Esposito, G. A review on dark fermentative biohydrogen production from organic biomass: Process parameters and use of by-products. Appl. Energy 2015, 144, 73–95. [Google Scholar] [CrossRef] [Scilit]
  16. Yadav, R.S.; Jung, J.H. Carbon and electron recovery in integrated biohydrogen systems: A critical review of dark fermentation, photo-fermentation, and microbial electrolysis cells. Energies 2026, 19, 3152. [Google Scholar] [CrossRef] [Scilit]
  17. Sun, X.; Ma, H.; Zhang, B.; Zhao, Y.; Qi, H.; Wang, K. Dark fermentation of biomass for enhanced hydrogen production: A review of pretreatment strategies, microbial enhancement, and process regulation. Int. J. Hydrogen Energy 2025, 175, 151546. [Google Scholar] [CrossRef] [Scilit]
  18. Litti, Y.V.; Zhuravleva, E.A.; Mukhachev, S.G.; Vishnyakova, A.V.; Nikitina, A.A.; Katraeva, I.V. Characteristics of the process of biohydrogen production from simple and complex substrates with different biopolymer composition. Int. J. Hydrogen Energy 2021, 46, 26289–26297. [Google Scholar] [CrossRef] [Scilit]
  19. Slezak, R.; Grzelak, J.; Krzystek, L.; Ledakowicz, S. The effect of initial organic load of the kitchen waste on the production of VFA and H2 in dark fermentation. Waste Manag. 2017, 68, 610–617. [Google Scholar] [CrossRef] [Scilit] [PubMed]
  20. Chen, L.; Fang, W.; Chang, J.; Liang, J.; Zhang, P.; Zhang, G. Improvement of direct interspecies electron transfer via conductive materials: Mechanisms and perspectives. Front. Microbiol. 2022, 13, e860749. [Google Scholar] [CrossRef] [Scilit] [PubMed]
  21. Liu, Z.; Tang, S.; Ren, Y.; Chen, P.; Ma, D.; Si, B.; Jiang, W.; Lu, H.; Zhang, Y. Biohydrogen production from food waste using a novel rotational drum reactor integrated with milli-magnetite. Bioresour. Technol. 2025, 434, 132822. [Google Scholar] [CrossRef] [Scilit] [PubMed]
  22. Yang, G.; Wang, J. Various additives for improving dark fermentative hydrogen production: A review. Renew. Sustain. Energy Rev. 2018, 95, 130–146. [Google Scholar] [CrossRef] [Scilit]
  23. UN. Transforming Our World: The 2030 Agenda for Sustainable Development; United Nations: New York, NY, USA, 2015. [Google Scholar]
  24. Ahmad, A.; Rambabu, K.; Hasan, S.W.; Show, P.L.; Banat, F. Biohydrogen production through dark fermentation: Recent trends and advances in transition to a circular bioeconomy. Int. J. Hydrogen Energy 2024, 52, 335–357. [Google Scholar] [CrossRef] [Scilit]
  25. Hallenbeck, P.C.; Benemann, J.R. Biological hydrogen production; fundamentals and limiting processes. Int. J. Hydrogen Energy 2002, 27, 1185–1193. [Google Scholar] [CrossRef] [Scilit]
  26. De Souza, G.C.; Souza, J.S.; Silva, I.F.; Barros, R.M.; Filho, G.L.T.; Santos, I.F.S.D.; Maya, D.M.Y.; Lora, E.E.S.; Capaz, R.d.S.; de Freitas, J.V.R.; et al. Assessment of the sequential dark fermentation and photofermentation of organic solid waste with magnetite and substrate pre-treatment. Fermentation 2025, 11, 516. [Google Scholar] [CrossRef] [Scilit]
  27. Gadhe, A.; Sonawane, S.S.; Varma, M.N. Enhanced biohydrogen production from dark fermentation of complex dairy wastewater by sonolysis. Int. J. Hydrogen Energy 2015, 40, 9942–9951. [Google Scholar] [CrossRef] [Scilit]
  28. Mishra, P.; Zhang, R.; Luo, L.; Tsang, C.H.M.; Li, D.; Xu, Q.; Wong, J.W.C.; Zhao, J. Nanoparticle-microbe interactions in biofuel fermentation: Current understanding and prospective applications. Nanoscale Adv. 2026, 8, 2830–2843. [Google Scholar] [CrossRef] [Scilit] [PubMed]
  29. Mishra, P.; Krishnakumar, B.; Kiran, B.V.; Jegan, J. Outlook of fermentative hydrogen production techniques: An overview of dark, photo and integrated dark-photo fermentative approach to biomass. Energy Strategy Rev. 2019, 24, 27–37. [Google Scholar] [CrossRef] [Scilit]
  30. Yogeswari, M.K.; Dharmalingam, K.; Ronald Ross, P.; Mullai, P. Role of iron concentration on hydrogen production using confectionery wastewater. J. Environ. Eng. 2016, 142, 04016031. [Google Scholar] [CrossRef] [Scilit]
  31. Gou, C.; Yang, Z.; Huang, J.; Wang, H.; Xu, H.; Wang, L. Characteristics and kinetics of biohydrogen production with Ni2+ using hydrogen-producing bacteria. Int. J. Hydrogen Energy 2015, 40, 161–167. [Google Scholar] [CrossRef] [Scilit]
  32. Mishra, P.; Johnravindar, D.; Wong, J.W.C.; Zhao, J. Metals and metallic composites as emerging nanocatalysts for fermentative hydrogen production. Sustain. Energy Fuels 2022, 6, 6193–6213. [Google Scholar] [CrossRef] [Scilit]
  33. Wang, T.; Zhang, D.; Dai, L.; Dong, B.; Dai, X. Magnetite triggering enhanced direct interspecies electron transfer: A scavenger for the blockage of electron transfer in anaerobic digestion of high-solids sewage sludge. Environ. Sci. Technol. 2018, 52, 7160–7169. [Google Scholar] [CrossRef] [Scilit] [PubMed]
  34. Zhong, Y.; He, J.; Wu, F.; Zhang, P.; Zou, X.; Pan, X.; Zhang, J. Metagenomic analysis reveals the size effect of magnetite on anaerobic digestion of waste activated sludge after thermal hydrolysis pretreatment. Sci. Total Environ. 2022, 851, 158133. [Google Scholar] [CrossRef] [Scilit] [PubMed]
  35. Sun, Y.; Zhao, J.; Li, C.; Qiu, T. Comparison of magnetite-reduced graphene oxide nanocomposites and magnetite nanoparticles on enhancing hydrogen production in dark fermentation. Int. J. Hydrogen Energy 2022, 47, 22359–22370. [Google Scholar] [CrossRef] [Scilit]
  36. Lakroun, S.E.; Boutemak, K.; Banat, F. Elevating hydrogen production efficiency in dark fermentation: The role of cobalt-doped magnetite nanoparticles with sugarcane molasses. Int. J. Hydrogen Energy 2025, 124, 8–17. [Google Scholar] [CrossRef] [Scilit]
  37. Krishnamoorthy, R.; Mettu, S.; Cheng, C.K. Data-driven optimization and sustainability assessment of dark fermentative biohydrogen production from waste streams. Energy Convers. Manag. X 2026, 30, 101729. [Google Scholar] [CrossRef] [Scilit]
  38. Wang, Y.; Xiao, G.; Wang, S.; Su, H. Application of nanomaterials in dark or light-assisted fermentation for enhanced biohydrogen production: A mini-review. Bioresour. Technol. Rep. 2023, 21, 101295. [Google Scholar] [CrossRef] [Scilit]
  39. Cheng, J.; Li, H.; Ding, L.; Zhou, J.; Song, W.; Li, Y.-Y.; Lin, R. Improving hydrogen and methane cogeneration in cascading dark fermentation and anaerobic digestion: The effect of magnetite nanoparticles on microbial electron transfer and syntrophism. Chem. Eng. J. 2020, 397, 125394. [Google Scholar] [CrossRef] [Scilit]
  40. Park, J.H.; Lee, S.H.; Yoon, J.J.; Kim, S.H.; Park, H.D. Granular activated carbon supplementation alters the metabolic flux of Clostridium butyricum for enhanced biohydrogen production. Bioresour. Technol. 2019, 281, 318–325. [Google Scholar] [CrossRef] [Scilit] [PubMed]
  41. Tian, K.; Zhang, J.; Zhou, C.; Yang, M.; Zhang, X.; Yan, X.; Zang, L. Magnetic nitrogen-doped activated carbon improved biohydrogen production. Environ. Sci. Pollut. Res. 2023, 30, 87215–87227. [Google Scholar] [CrossRef] [Scilit] [PubMed]
  42. Ramprakash, B.; Incharoensakdi, A. Peanut shell activated carbon doped with nickel-iron nanoparticles as material for improving dark fermentative hydrogen production by Enterobacter aerogenes. Int. J. Hydrogen Energy 2025, 99, 579–588. [Google Scholar] [CrossRef] [Scilit]
  43. Jamaludin, N.F.M.; Tajarudin, H.A.; Aziz, N.I.A.; Jami, M.S.; Hanafiah, M.M. Nickel-iron doped on granular activated carbon for efficient immobilization in biohydrogen production. Bioresour. Technol. 2024, 391, 129933. [Google Scholar] [CrossRef] [Scilit] [PubMed]
  44. Devika, C.N.; Mechery, J.; Sylas, V.P. Hybrid material systems for enhanced biohydrogen production via dark fermentation. Int. J. Hydrogen Energy 2026, 273, 157293. [Google Scholar] [CrossRef] [Scilit]
  45. APHA; AWWA; WEF. Standard Methods for the Examination of Water and Wastewater, 24th ed.; APHA Press: Washington, DC, USA, 2023; Available online: https://www.standardmethods.org/doi/book/10.2105/smww.2882 (accessed on 12 September 2026).
  46. GEOTECH. Biogas 5000—Portable Gas Analyser: Anaerobic Digestion; Geotech: Warwickshire, UK, 2016; Available online: https://www.qedenv.com/products/portable-gas-monitor-biogas5000/ (accessed on 12 September 2026).
  47. Akhlaghi, N.; Najafpour-Darzi, G. A comprehensive review on biological hydrogen production. Int. J. Hydrogen Energy 2020, 45, 22492–22512. [Google Scholar] [CrossRef] [Scilit]
  48. Chen, Y.; Yin, Y.; Wang, J. Effect of Ni2+ concentration on fermentative hydrogen production using waste activated sludge as substrate. Int. J. Hydrogen Energy 2021, 46, 21844–21852. [Google Scholar] [CrossRef] [Scilit]
  49. Cañote, S.J.B.; Barros, R.M.; Lora, E.E.S.; Del Olmo, O.A.; Santos, I.F.S.; Piñas, J.A.V.; Ribeiro, E.M.; de Freitas, J.V.R.; de Castro e Silva, H.L. Energy and economic evaluation of the production of biogas from anaerobic and aerobic sludge in Brazil. Waste Biomass Valoriz. 2021, 12, 947–969. [Google Scholar] [CrossRef] [Scilit]
  50. Cruz, H.M.; Barros, R.M.; Santos, I.F.S.; Tiago Filho, G.L. Study of the potential of generation of electric energy from the biogas of anaerobic digestion of food residues. Res. Soc. Dev. 2019, 8, e3785811. [Google Scholar] [CrossRef] [Scilit]
  51. Godvin Sharmila, V.; Rajesh Banu, J.; Kim, S.H.; Kumar, G. A review on evaluation of applied pretreatment methods of wastewater towards sustainable H2 generation: Energy efficiency analysis. Int. J. Hydrogen Energy 2020, 45, 8329–8345. [Google Scholar] [CrossRef] [Scilit]
  52. Song, S.; Cheng, K.Y.; Luo, G.; Treu, L.; Leahy, J.J. Dynamics of gas distribution in batch-scale fermentation experiments: The unpredictive distribution of biogas between headspace and gas collection device. J. Clean. Prod. 2023, 400, 136641. [Google Scholar] [CrossRef] [Scilit]
  53. The Jamovi Project. Jamovi: Version 2.5. 2024. Available online: https://www.jamovi.org (accessed on 13 September 2026).
  54. CEMIG DISTRIBUIÇÃO S.A. Tarifas Vigentes; CEMIG: Belo Horizonte, Brazil, 2026; Available online: https://www.cemig.com.br/valores-e-tarifas/tarifas-vigentes/ (accessed on 13 September 2026).
  55. Reddy, K.; Nasr, M.; Kumari, S.; Kumar, S.; Gupta, S.K.; Enitan, A.M.; Bux, F. Biohydrogen production from sugarcane bagasse hydrolysate: Effects of pH, S/X, Fe2+, and magnetite nanoparticles. Environ. Sci. Pollut. Res. 2017, 24, 8790–8804. [Google Scholar] [CrossRef] [Scilit] [PubMed]
  56. Rambabu, K.; Bharath, G.; Banat, F.; Hai, A.; Show, P.L.; Nguyen, T.H.P. Ferric oxide/date seed activated carbon nanocomposites mediated dark fermentation of date fruit wastes for enriched biohydrogen production. Int. J. Hydrogen Energy 2021, 46, 16631–16643. [Google Scholar] [CrossRef] [Scilit]
  57. Zhang, J.; Fan, C.; Zang, L. Improvement of hydrogen production from glucose by ferrous iron and biochar. Bioresour. Technol. 2017, 245, 98–105. [Google Scholar] [CrossRef] [Scilit] [PubMed]
  58. Wang, Z.; Wang, X.; Xu, S.; Zhou, R.; Zhang, M.; Li, W.; Zhang, Z.; Wang, L.; Chen, J.; Zhang, J.; et al. Off-site production of plasma-activated water for efficient disinfection: The crucial role of high valence NOx and new chemical pathways. Water Res. 2024, 267, 122541. [Google Scholar] [CrossRef] [Scilit] [PubMed]
  59. Sun, Y.; Wang, H.; Ma, H.; Li, Z.; Liu, L.; Li, Y.; Gao, C. A self-powered galvanic system for peroxymonosulfate activation: Unveiling a non-radical singlet oxygen dominant pathway for levofloxacin degradation and cobalt recovery. Chem. Eng. J. 2026, 514, 179313. [Google Scholar] [CrossRef] [Scilit]
  60. Goh, Q.H.; Tan, W.S.; Ho, Y.K.; Chew, I.M.L. Integrated optimisation of biowaste-based green hydrogen supply chains from economic, environmental, and safety perspectives. Comput. Chem. Eng. 2025, 199, 109120. [Google Scholar] [CrossRef] [Scilit]
  61. Han, W.; Liu, Z.; Fang, J.; Huang, J.; Zhao, H.; Li, Y. Techno-economic analysis of dark fermentative hydrogen production from molasses in a continuous mixed immobilized sludge reactor. J. Clean. Prod. 2016, 127, 567–572. [Google Scholar] [CrossRef] [Scilit]
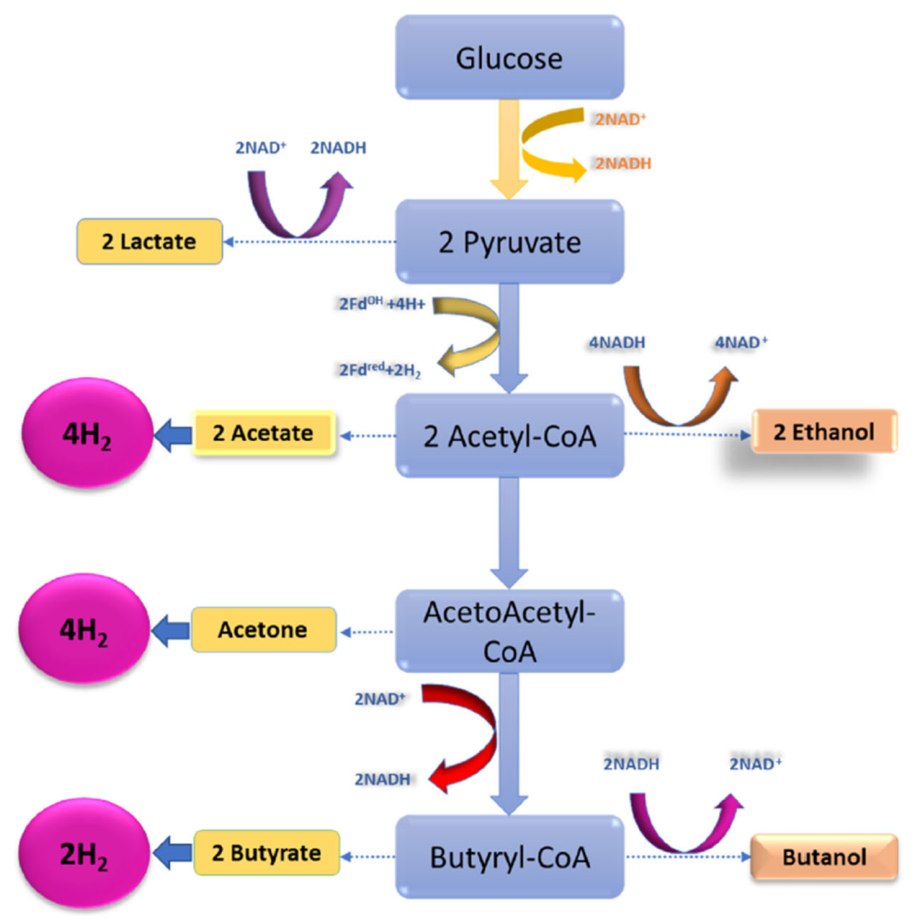
Figure 1. A schematic depiction of the anaerobic dark fermentation pathway that breaks down glucose and produces various metabolites. Reproduced from Ref. [24] with permission.
Processes 14 02972 g001
Figure 2. Biodegradation stages and microbiological pathways of dark fermentation. Reproduced from Ref. [15] with permission.
Processes 14 02972 g002
Figure 3. Biohydrogen yield (mL H2/g COD removed) per reactor in each experimental group (magnetite).
Processes 14 02972 g003
Figure 4. Average biohydrogen yield (mL H2/g COD removed) per reactor group.
Processes 14 02972 g004
Figure 5. Biohydrogen yield (mL H2/g COD removed) per reactor in each experimental group (AC/DC).
Processes 14 02972 g005
Figure 6. Mean biohydrogen yield (mL H2/g COD removed) per reactor group (AC/DC).
Processes 14 02972 g006
Figure 7. Integrated analysis of COD removal rate (%), TVS (g/L), and final pH for each group (magnetite).
Processes 14 02972 g007
Figure 8. Integrated analysis of COD removal rate (%), TVS (g/L), and final pH for each group (AC and DC).
Processes 14 02972 g008
Figure 9. SEM micrographs (300×): (a) magnetite; (b) granular activated carbon (AC); (c) nickel–iron-doped activated carbon (DC).
Processes 14 02972 g009
Figure 10. EDS elemental mapping: (a) magnetite; (b) granular activated carbon (AC); (c) nickel–iron-doped activated carbon (DC).
Processes 14 02972 g010
Figure 11. H2 yields from both experiments (Experiment 1: magnetite; Experiment 2: AC and DC).
Processes 14 02972 g011
Figure 12. Biohydrogen yield per treatment: (A) boxplots with Tukey grouping; (B) marginal means ± standard error; (C) Q-Q plot of one-way ANOVA residuals.
Processes 14 02972 g012
Table 1. Preliminary energy and additive-cost screening for the AC/DC experimental block (mean values per 0.50 L reactor; single-use additive assumption).
TreatmentCOD Removed (g)H2 (mL)H2 Energy (kJ)ΔH2 Energy vs. Control (kJ)Direct Additive Cost (R$)Gross ΔH2 Value (R$)Interpretation
Control15.90.860.0090.000Reference
AC 4 g15.01.600.0170.0080.1000.00002Not offset
DC 2 g19.13.610.0390.0300.3220.00009Not offset
DC 4 g19.14.750.0510.0420.6440.00011Not offset; best technical performance
Note: Hydrogen energy was calculated using the LHV of H2, 10.8 MJ Nm−3. Direct additive cost includes only the material amount dozed into each reactor. DC cost includes activated carbon and synthesis reagents but excludes energy, labor, water, equipment, regeneration, metal leaching control, gas purification, compression, and storage. The theoretical gross H2 value is an illustrative benchmark and does not represent actual revenue. Hydrogen volumes were reconstructed from mean yield × estimated mean COD removed. COD removed was estimated from the 0.50 L working volume, midpoint initial COD concentration of 59.93 g L−1, and treatment-specific removal fractions reported in Section 4.2. Material prices and equipment electricity demand are scenario assumptions described in Section 3.9; they are not measured procurement or metering data. The gross ΔH2 value uses R$30 kg−1 H2 and excludes all product-upgrading and market-delivery costs.
Disclaimer/Publisher’s Note: The statements, opinions and data contained in all publications are solely those of the individual author(s) and contributor(s) and not of MDPI and/or the editor(s). MDPI and/or the editor(s) disclaim responsibility for any injury to people or property resulting from any ideas, methods, instructions or products referred to in the content.