3.1. Dynamic Strength Evolution
The dynamic stress–strain curves were obtained from the strain-gauge signals using the three-wave method.
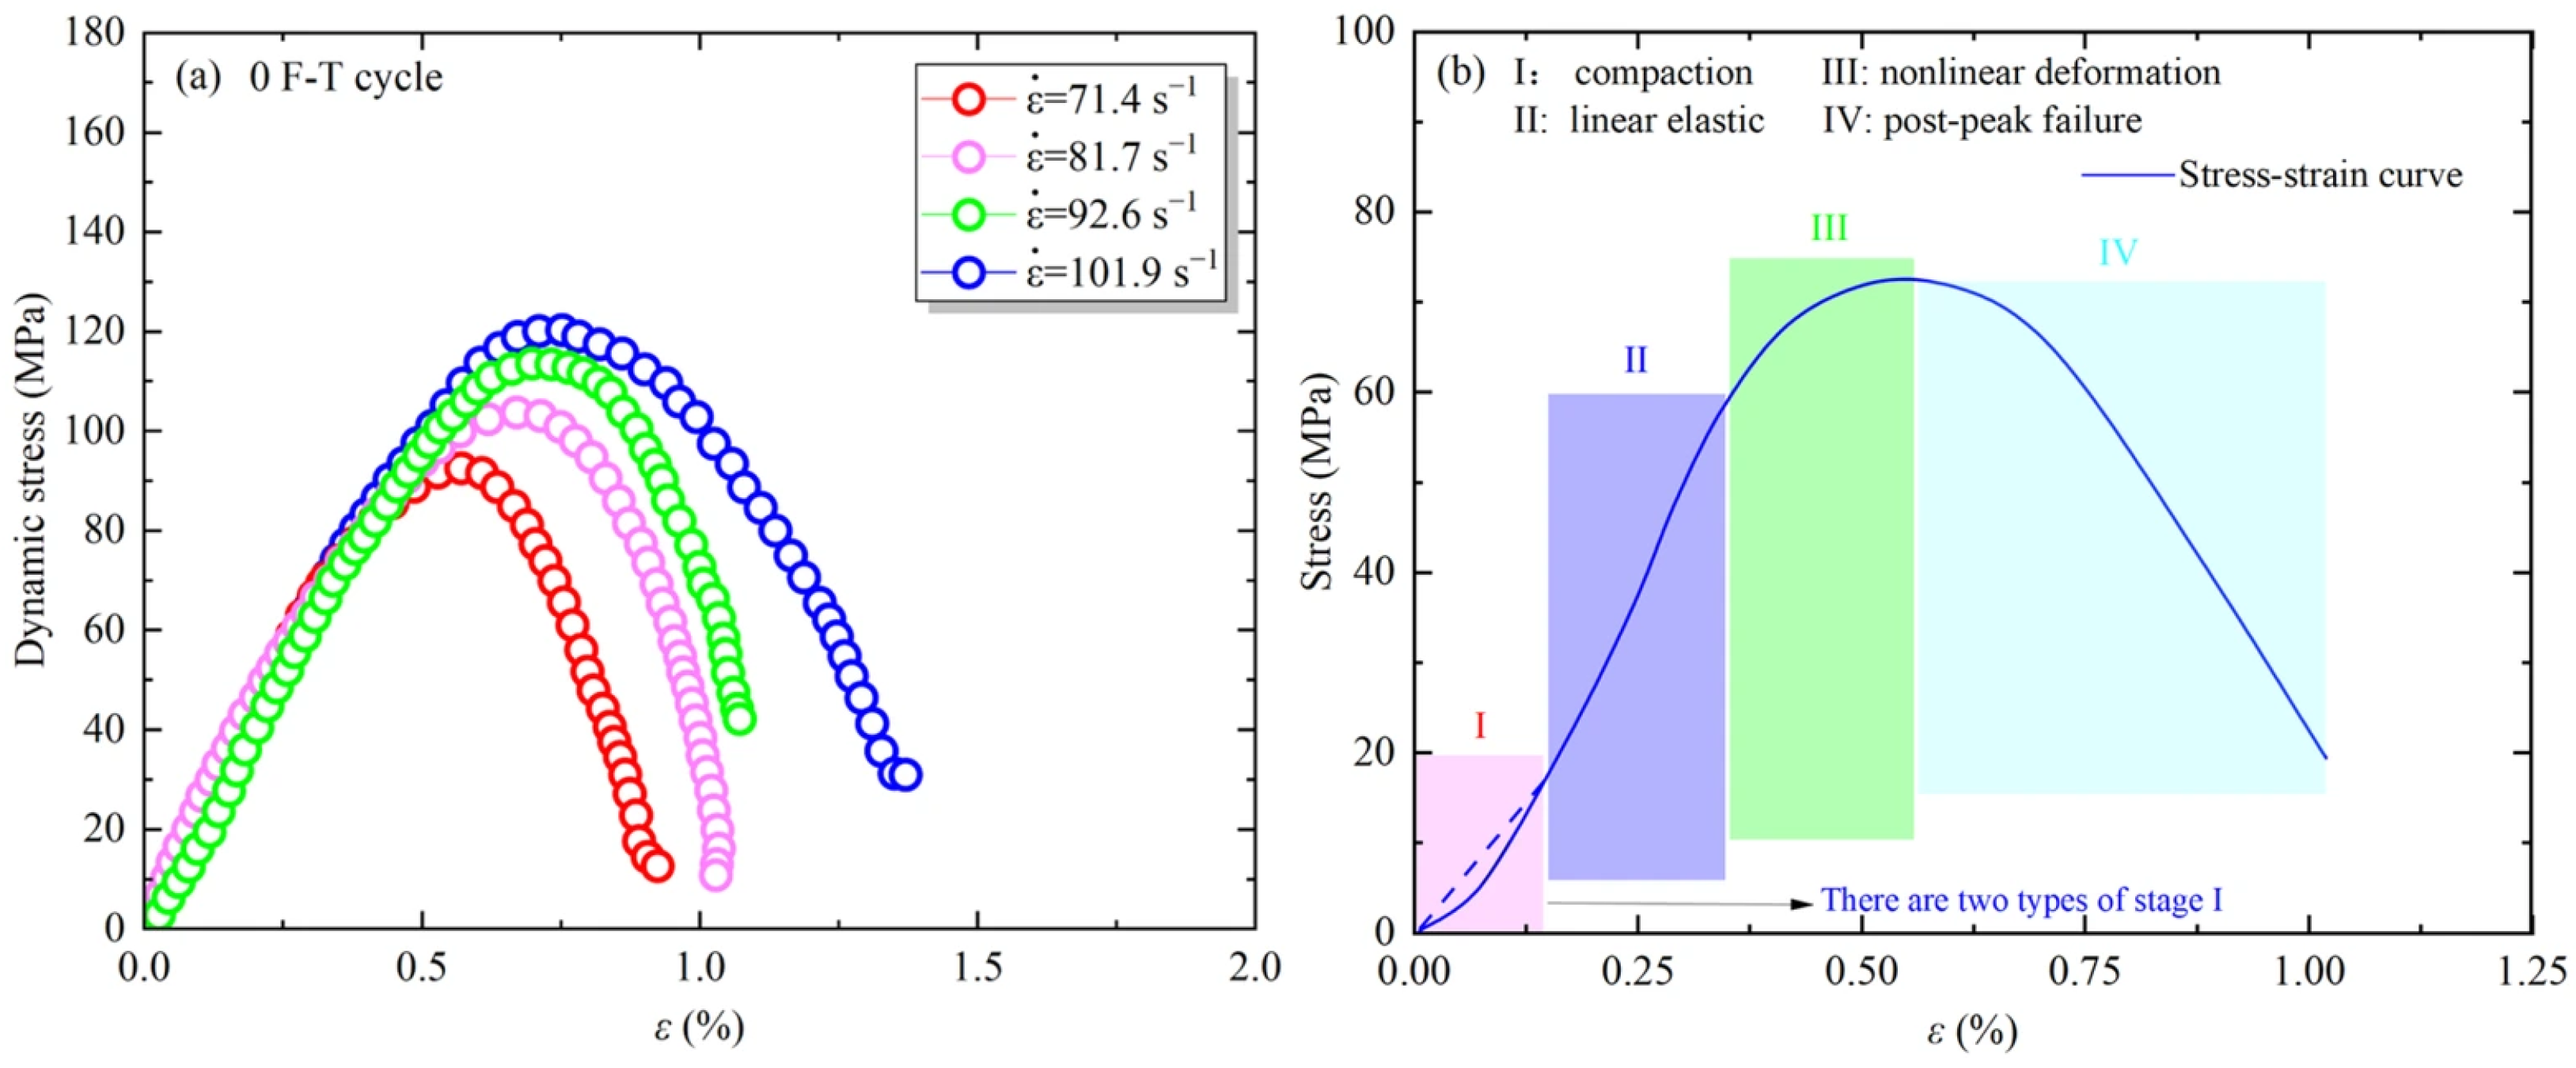
Figure 6a presents the dynamic responses of specimens without F–T treatment under four impact pressures. As the impact pressure increased, the strain rate rose from 71.4 to 101.9 s
−1, accompanied by an increase in dynamic strength from 92.6 to 122.4 MPa, confirming a clear strain-rate strengthening effect. A representative dynamic stress–strain curve is shown in
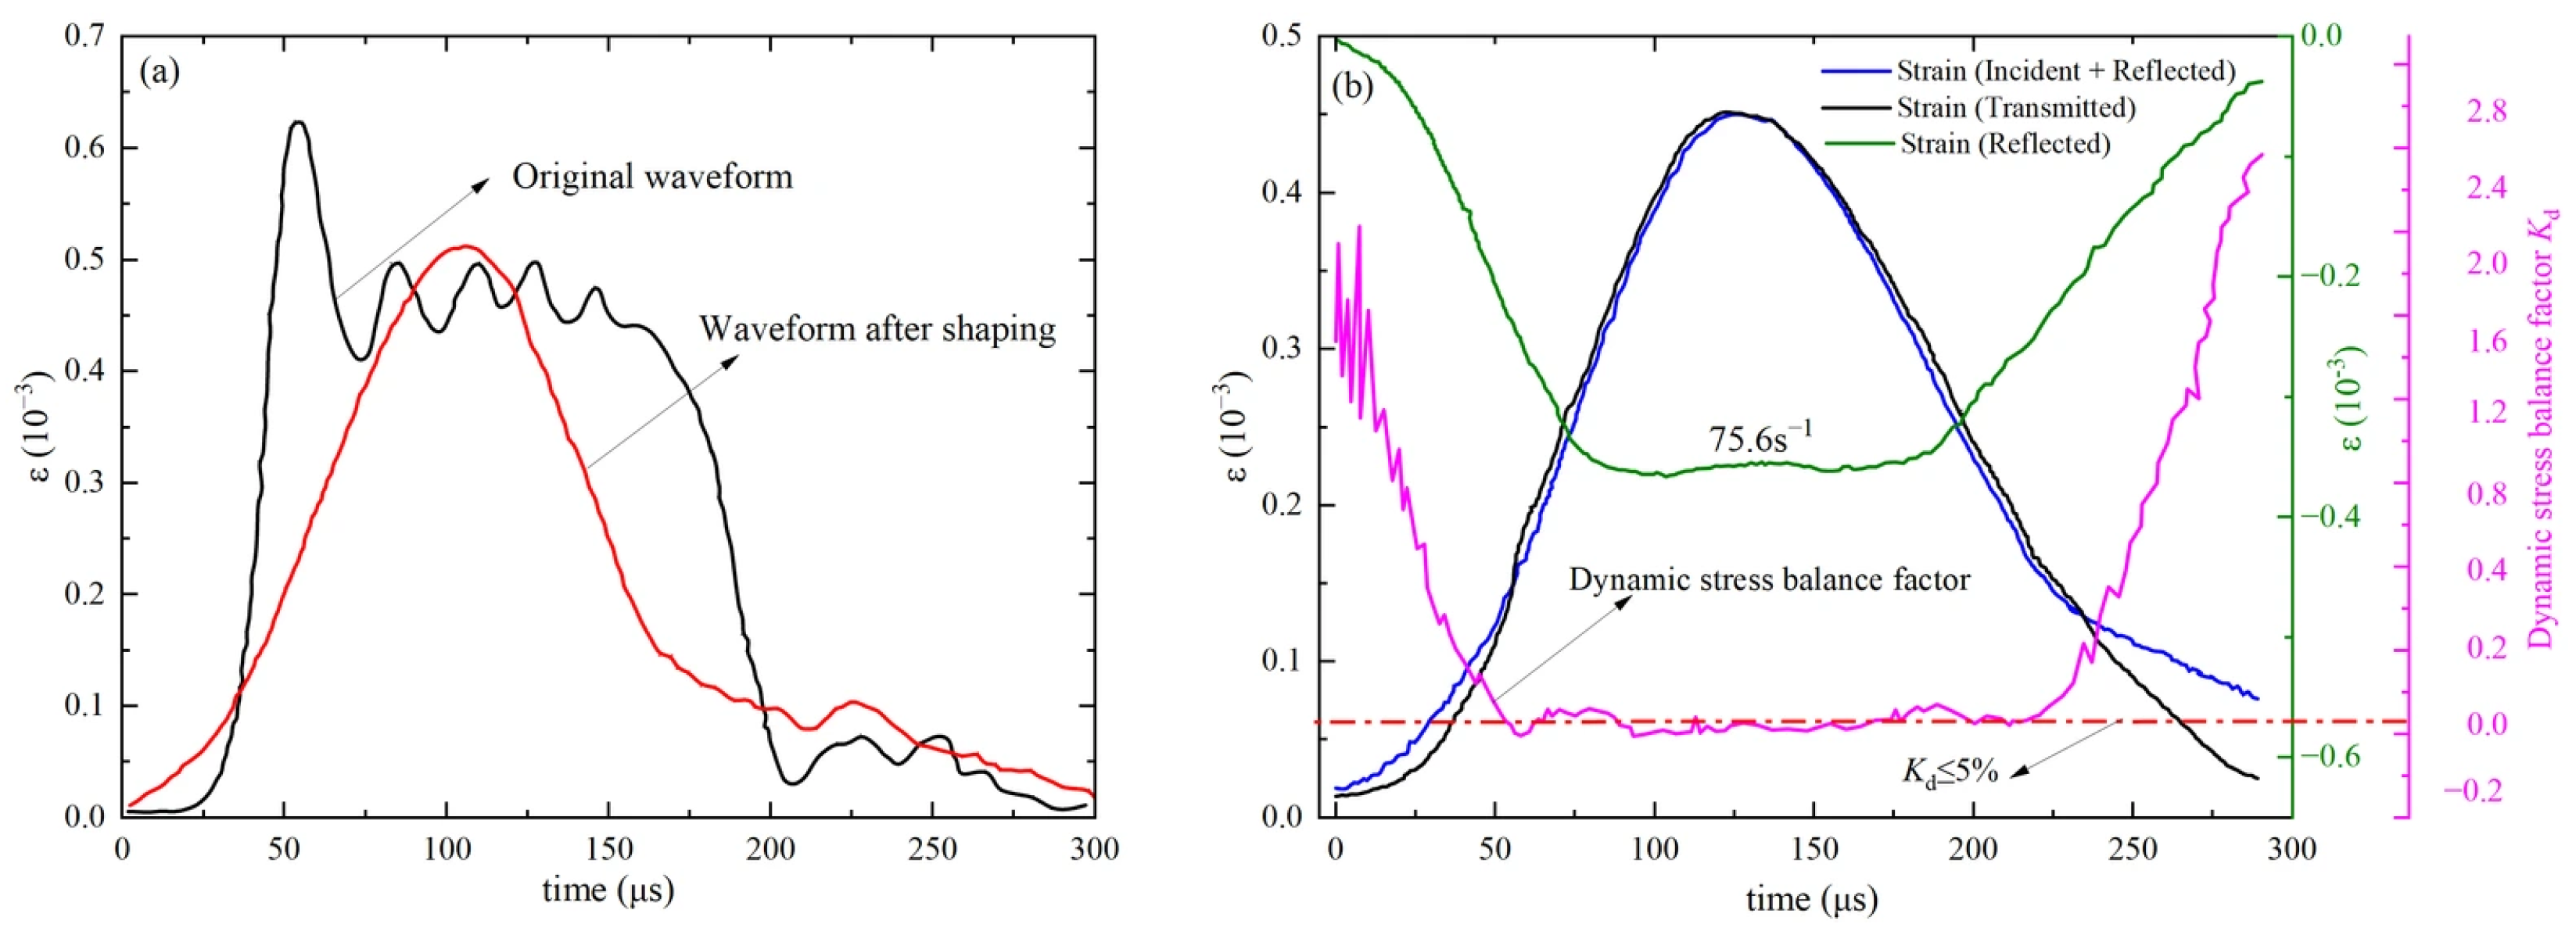
Figure 6b and can be divided into four stages: compaction, approximately linear deformation, pre-peak nonlinear deformation, and post-peak failure. The initial response was strongly influenced by the internal defect state. Specimens with fewer defects may enter the approximately linear stage directly, whereas more severely damaged specimens generally exhibit a more pronounced compaction stage.
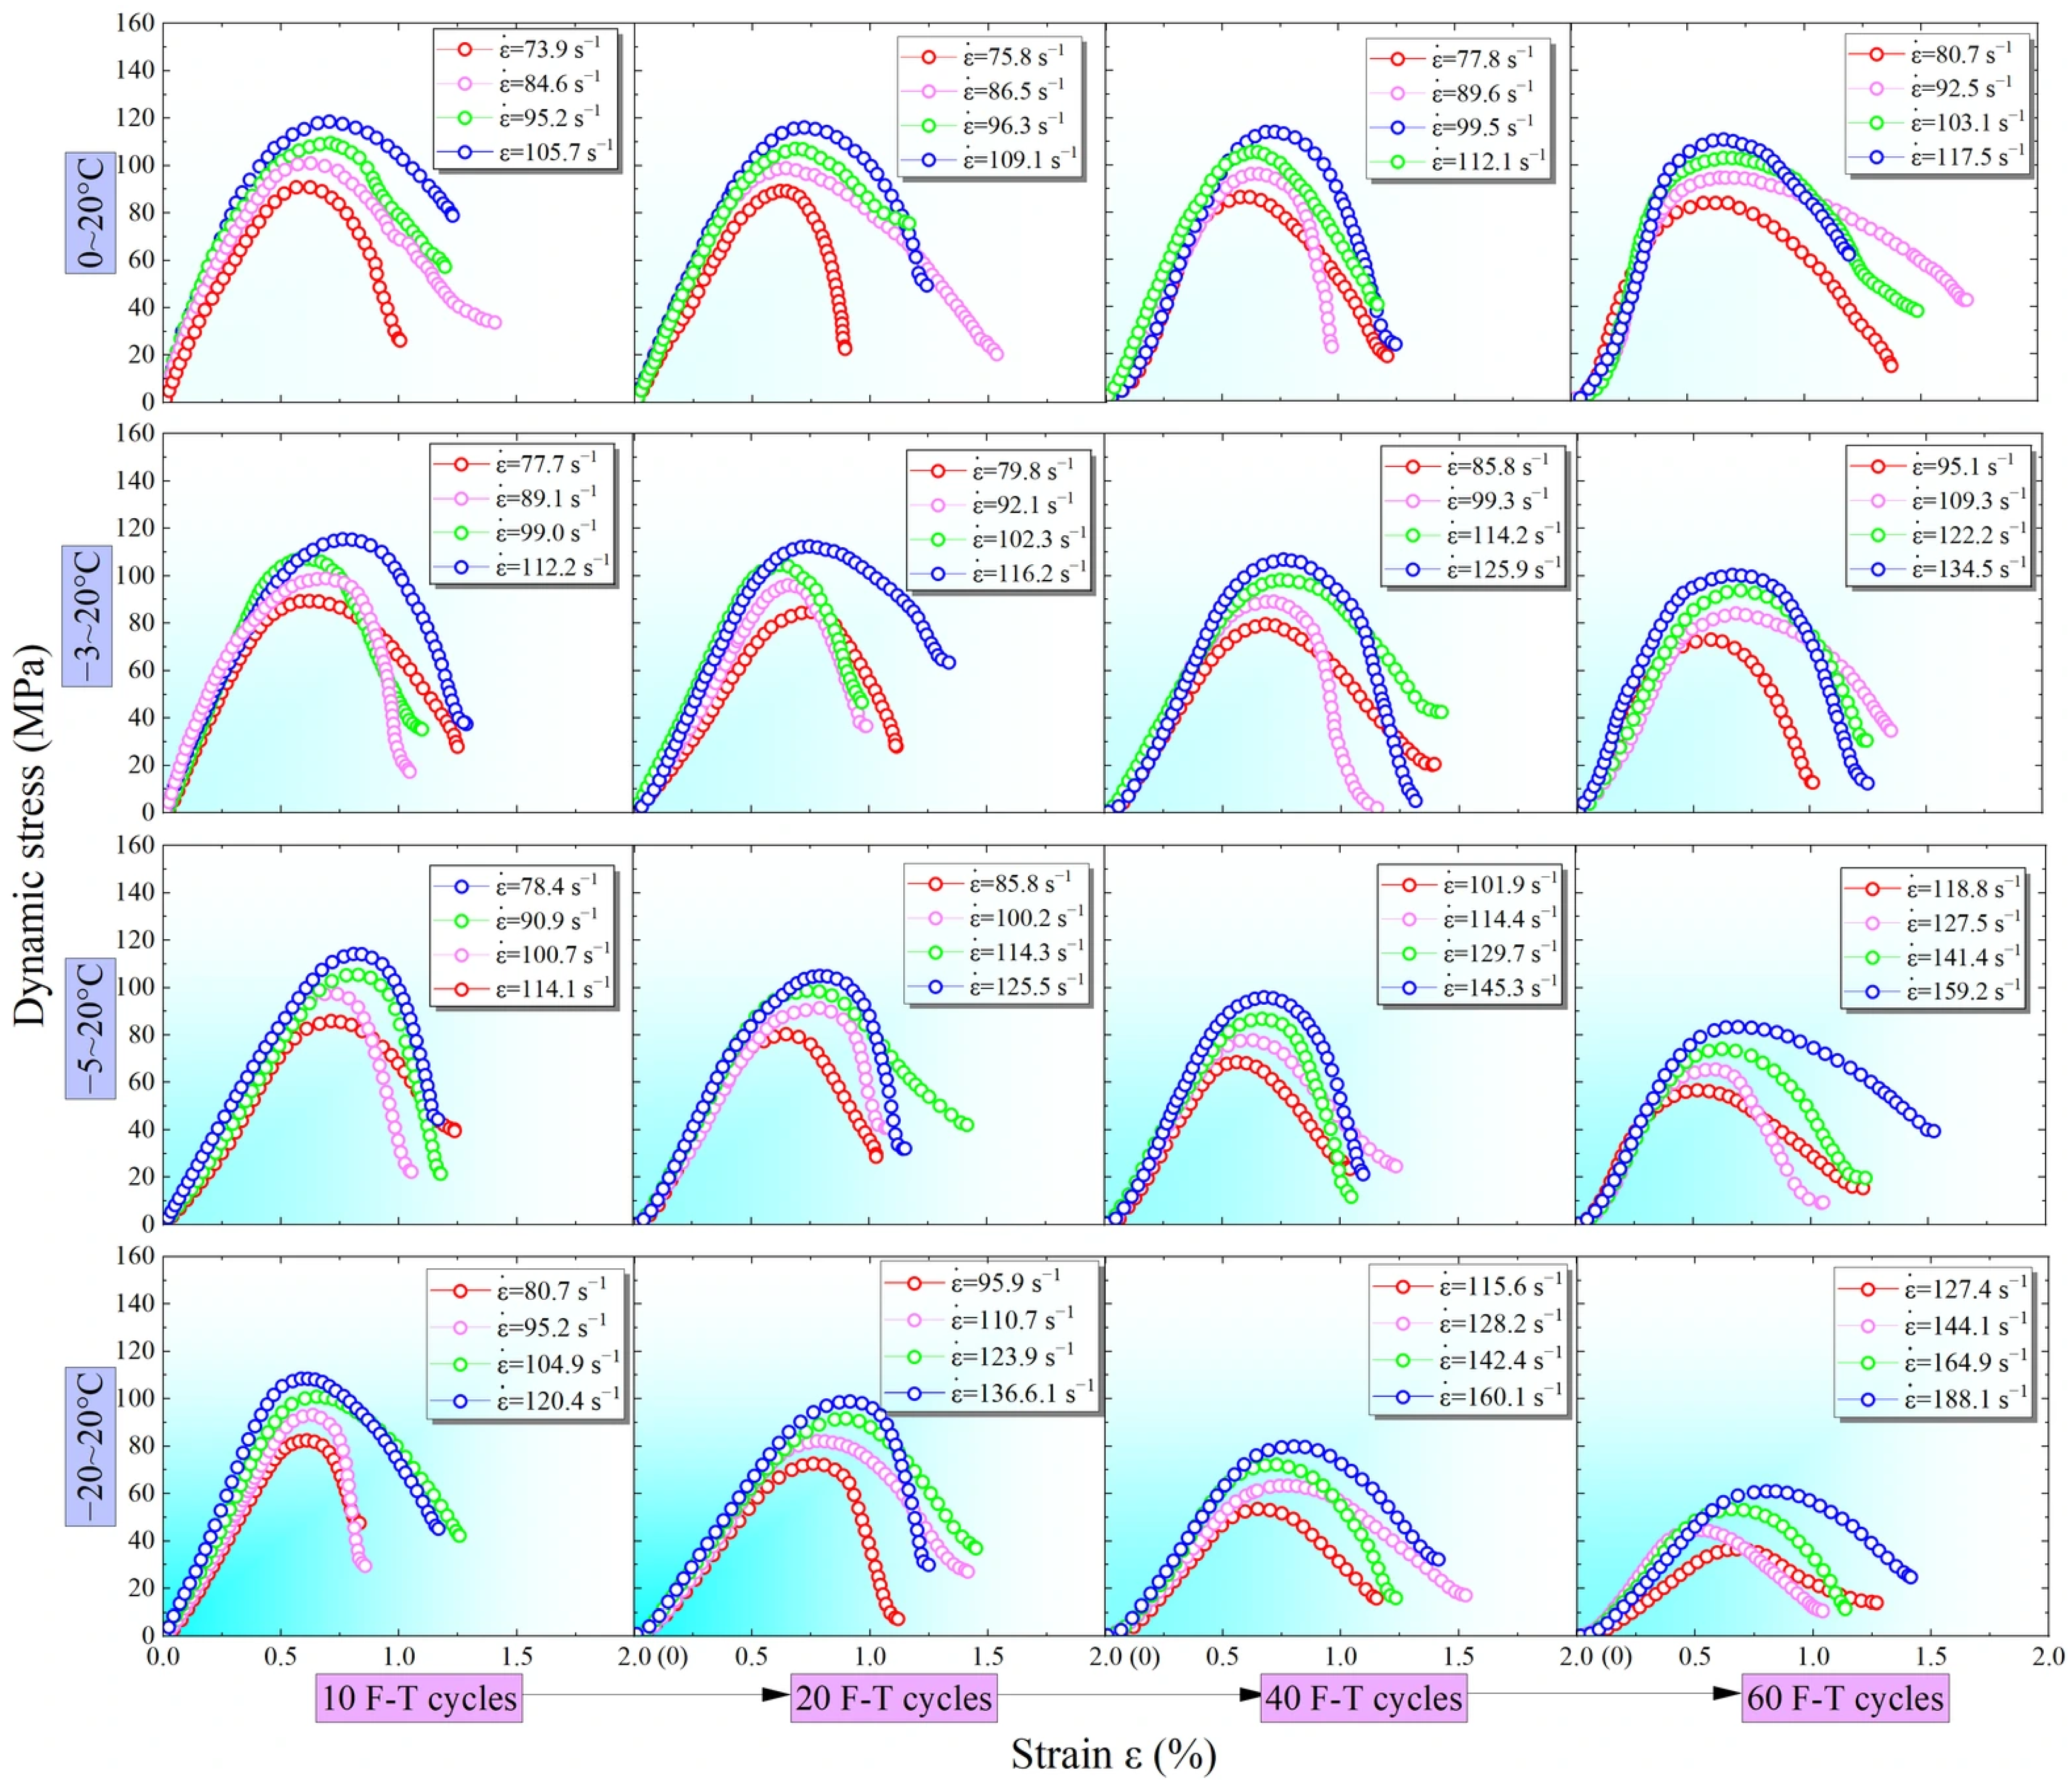
Figure 7 compares the dynamic responses of F–T-treated specimens under the tested freezing temperatures. These curves exhibited the four deformation stages identified in
Figure 6b, although the characteristics of each stage varied with the degree of F–T damage. Under the same F–T condition, the peak stress increased with increasing strain rate, confirming the strain-rate strengthening effect. By contrast, as the number of F–T cycles increased and the freezing temperature decreased, the stress–strain curves gradually shifted downward, the peak stress decreased, the initial compaction stage became more pronounced, and the post-peak load-bearing capacity decreased.
These overall changes in the curves were reflected in the corresponding dynamic strength values. Taking the −3 °C condition as an example, at a relatively low strain rate, the dynamic strength decreased from 89.6 MPa after 10 F–T cycles to 73.2 MPa after 60 cycles. As the freezing temperature decreased further, the reduction in dynamic strength became more pronounced. This was mainly because lower temperatures increased the proportion of frozen pore water and the frost-heave pressure, promoting the expansion of existing pores and the initiation and interconnection of microcracks [
25]. These defects, in turn, facilitated crack propagation and coalescence under impact loading.
To quantify the degree of strength deterioration under different impact pressures, the dynamic strength decay rate was defined as
where
is the dynamic strength decay rate;
is the dynamic peak strength of the specimen without F–T treatment at the same impact pressure; and
is the dynamic peak strength after
N F–T cycles.
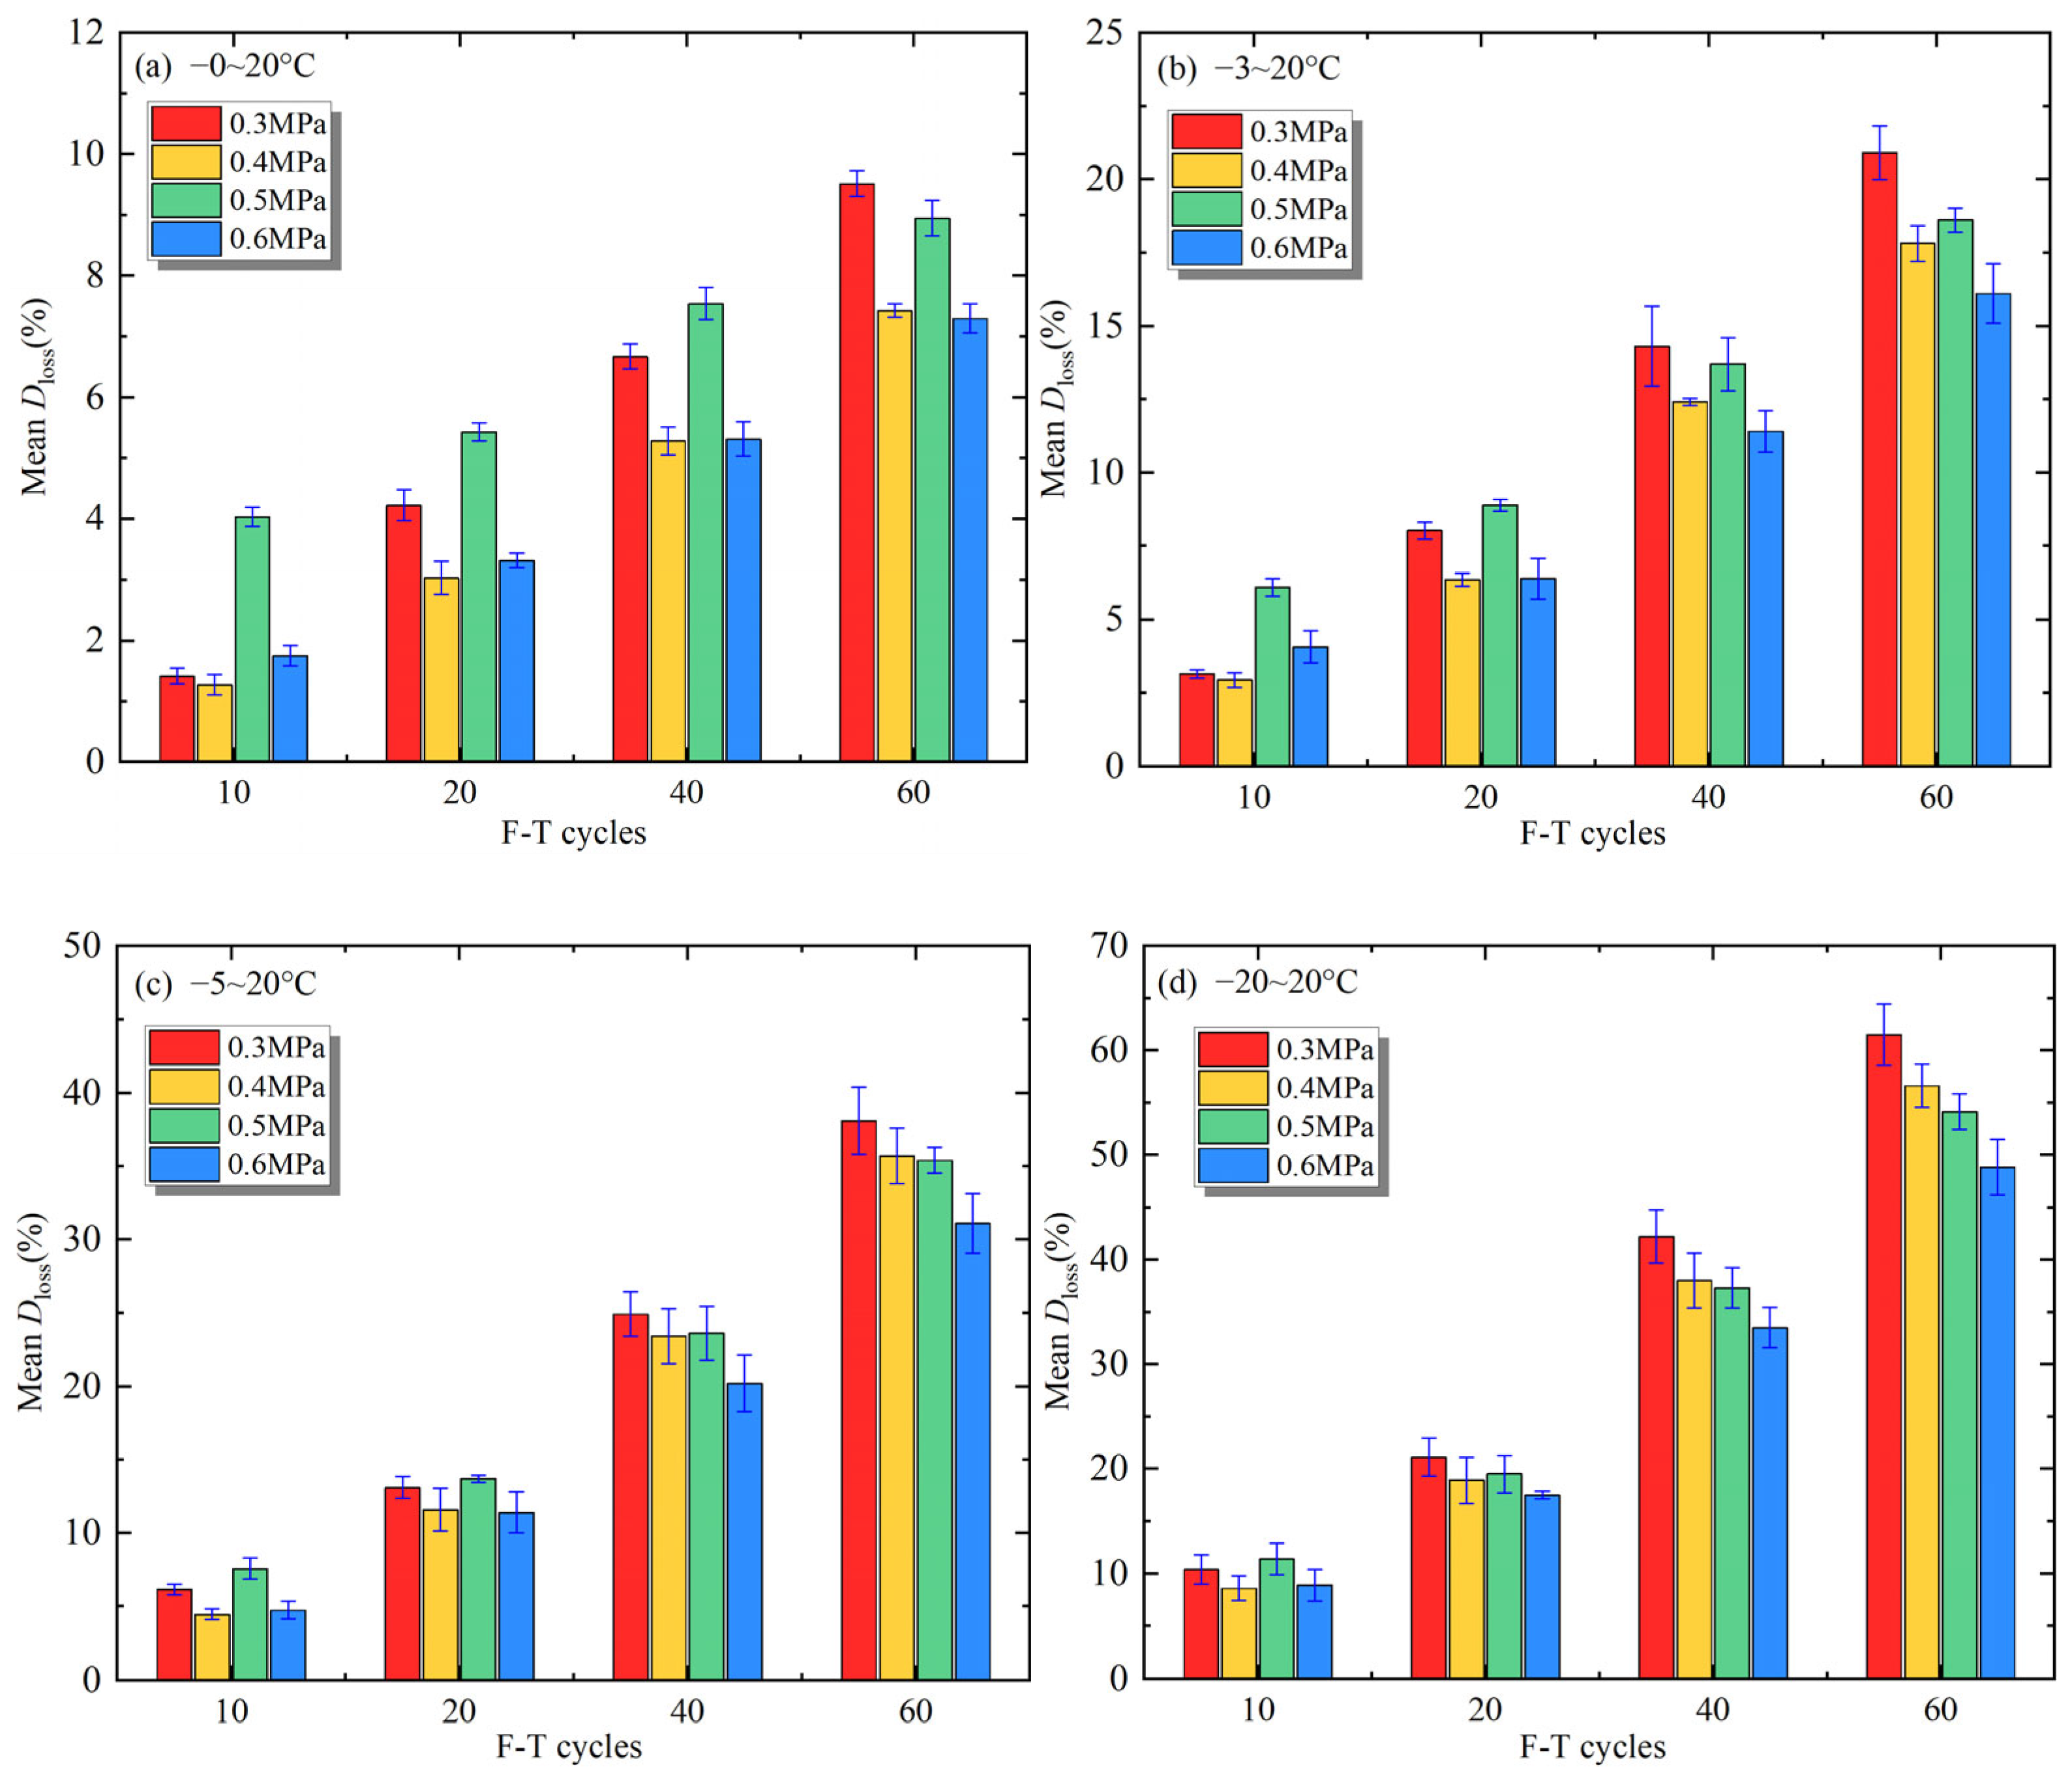
Figure 8 presents the evolution of the dynamic strength decay rate. The decay rate generally increased with the number of F–T cycles, and the increase became more pronounced at lower freezing temperatures. After 60 F–T cycles, at an impact pressure of 0.3 MPa, the dynamic strength decay rates were 9.51%, 20.9%, 38.1%, and 61.5% at freezing temperatures of 0, −3, −5, and −20 °C, respectively. These results indicate that lower freezing temperatures significantly accelerate the accumulation of F–T damage. When the F–T damage was more severe, the dynamic strength decay rate generally decreased with increasing impact pressure. For example, after 60 F–T cycles at −20 °C, the decay rate decreased from 61.5% at 0.3 MPa to 48.8% at 0.6 MPa, while at −5 °C, it decreased from 38.1% to 31.1%. This indicates that the dynamic strengthening effect at higher strain rates can partly compensate for the reduction in load-bearing capacity caused by F–T damage. At high strain rates, the time available for crack propagation is limited, and some cracks cannot fully propagate and connect before the peak stress is reached [
19]. As a result, the specimen can maintain a relatively high dynamic load-bearing capacity during the short loading duration. In contrast, at lower strain rates, the pre-existing defects have more time to develop, making the effect of F–T damage on dynamic strength more pronounced. Some fluctuations in the decay rate were observed at relatively high freezing temperatures or after fewer F–T cycles, which may be related to the natural heterogeneity of sandstone and differences in the initial defect distribution [
22]. Despite these fluctuations, the number of F–T cycles generally controls the accumulated damage, whereas freezing temperature affects the rate of damage development. To relate this macroscopic strength decay to the evolution of internal damage, microstructural parameters at different freezing temperatures are analyzed in the following section using the CT reconstruction results.
3.2. Microstructural Evolution
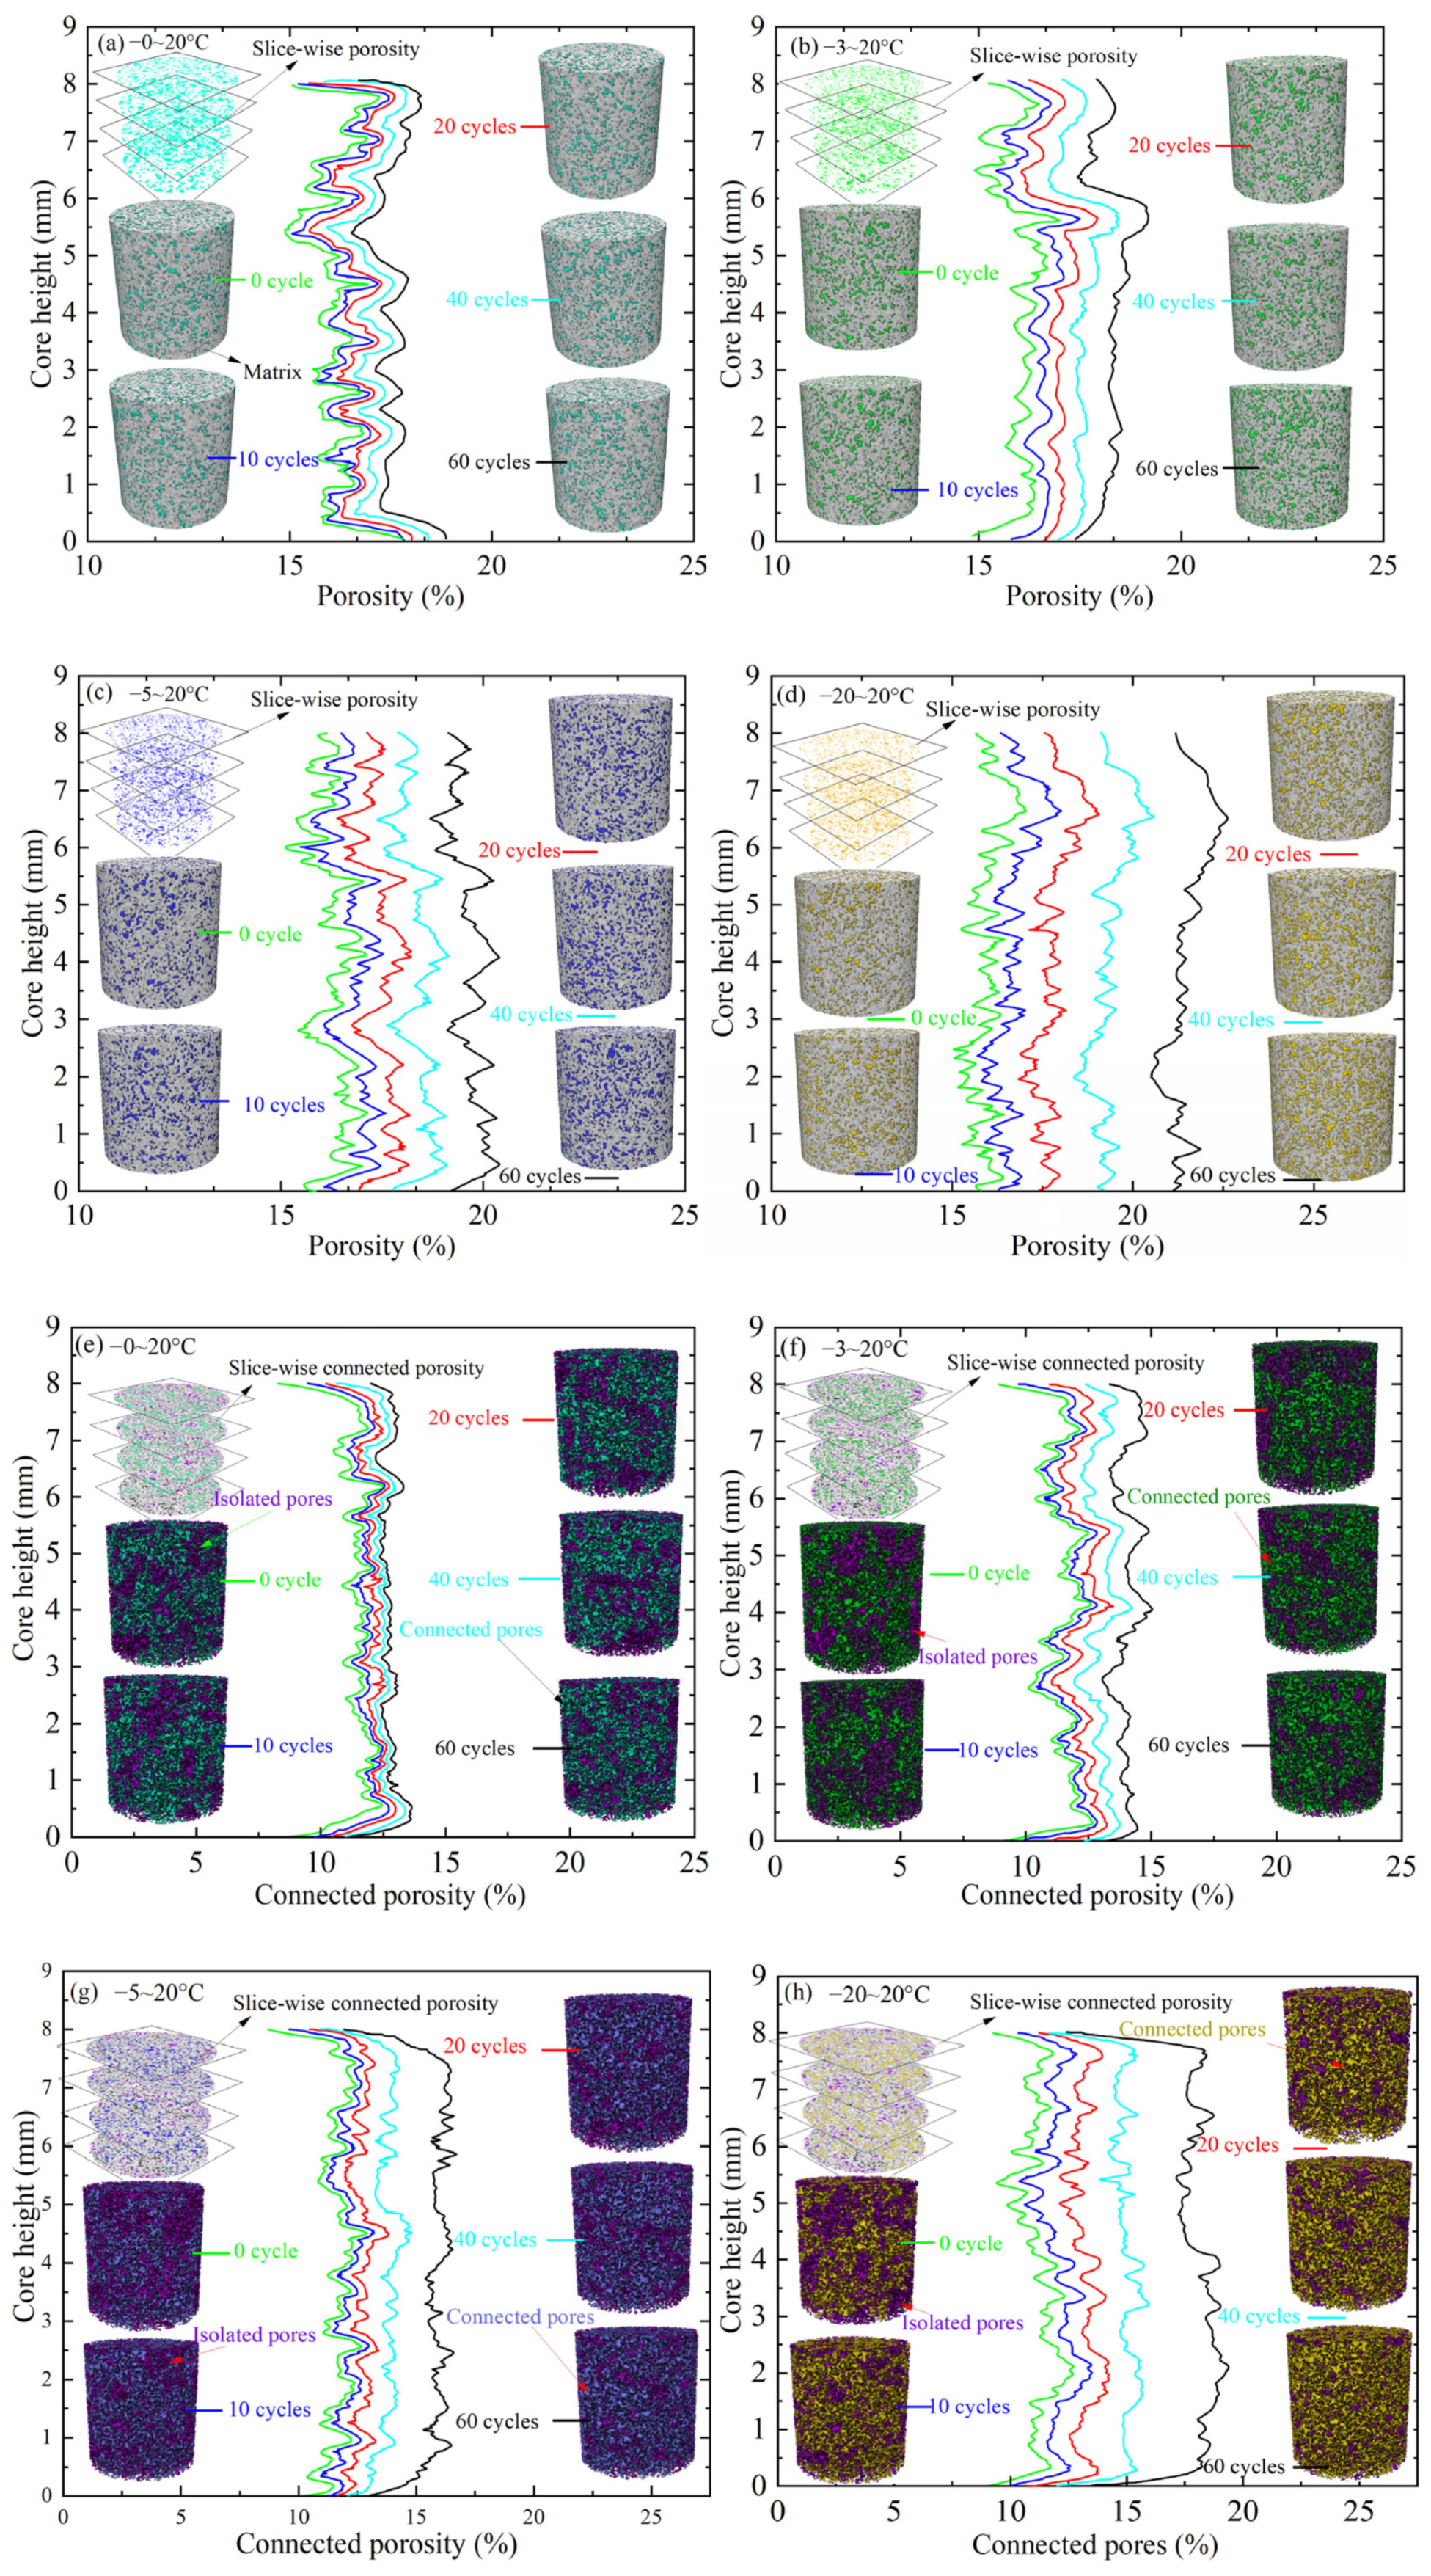
Figure 9 illustrates the distributions of areal porosity and areal connected porosity along the specimen height, together with the corresponding 3D pore reconstructions. The areal porosity varied along the height of the specimen under all F–T conditions, reflecting the inherent heterogeneity of the sandstone. Because the CT datasets at different F–T stages were spatially registered, the profiles obtained from the same specimen remained generally comparable. Relatively low porosity values were observed near the specimen ends, whereas higher porosity occurred in the middle region. At 0 °C, the profiles for different numbers of F–T cycles were similar, indicating only limited changes in pore volume. This does not necessarily imply negligible microstructural damage, because dynamic strength is also affected by defect distribution, pore connectivity, and weakening of grain contacts. In addition, microcracks below the CT resolution may contribute to strength decay without producing an obvious increase in the measured porosity. As the freezing temperature decreased to −5 and −20 °C, the differences among the profiles became more evident. In particular, pronounced increases were observed after 40 and 60 F–T cycles at −20 °C. The 3D reconstructions showed a similar tendency, showing a progressive expansion of the pore space while the pore distribution remained heterogeneous.
Compared with areal porosity, the variation in areal connected porosity along the specimen height was more complex because it depended not only on pore volume but also on pore size, spatial distribution, and connectivity (
Figure 9b). At 0 °C, the curves changed only slightly with increasing F–T cycles. At lower freezing temperatures, the curves shifted toward higher values, and the differences among the F–T stages became larger. At −20 °C, after 60 F–T cycles, the areal connected porosity was clearly higher than its initial value over most of the specimen height. These results indicate that lower freezing temperatures not only increased the pore space but also enhanced pore connectivity. The 3D reconstructions likewise indicated that connected pore regions gradually expanded from isolated areas into larger interconnected networks, suggesting that pore connectivity was more sensitive to F–T damage than pore volume. However, the spatial profiles presented in
Figure 9 cannot directly distinguish new pore formation from the growth of connecting throats [
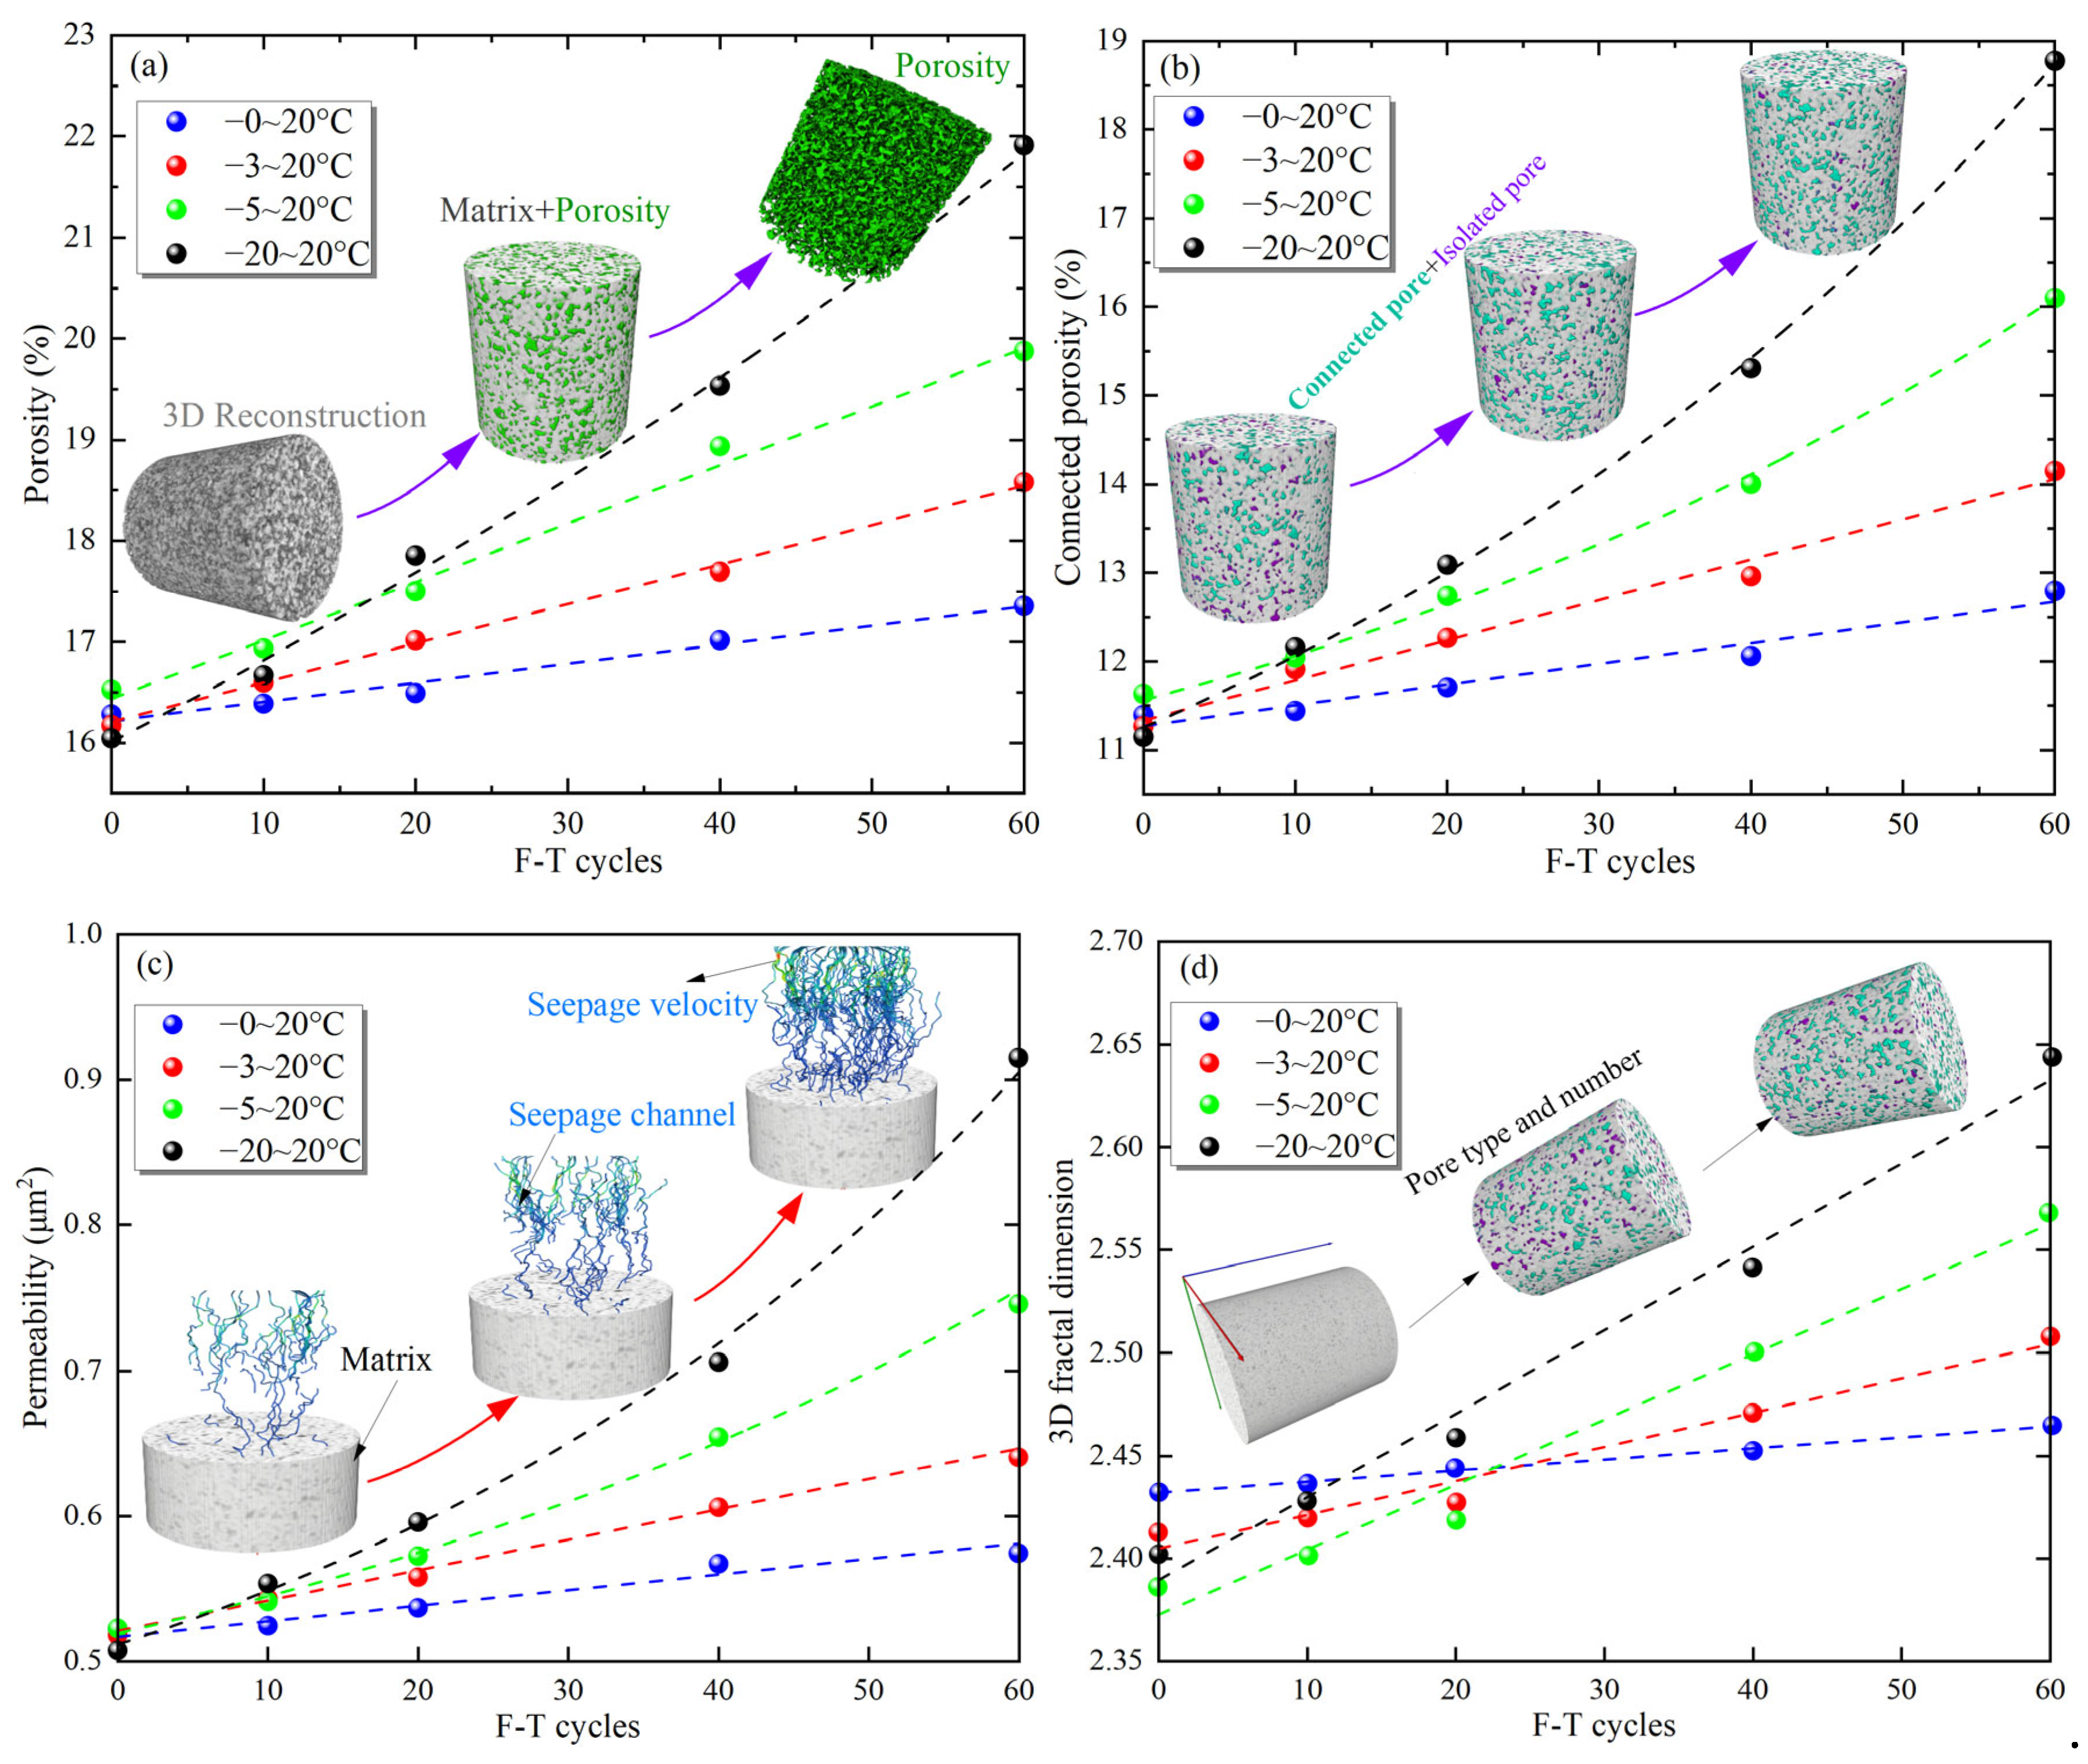
26]. Accordingly, porosity, connected porosity, permeability, and three-dimensional fractal dimension were further analyzed to quantify the overall changes in pore structure (
Figure 10).
Figure 10 summarizes the changes in porosity, connected porosity, permeability, and 3D fractal dimension with the number of F–T cycles at different freezing temperatures. All four parameters increased as the number of F–T cycles increased, but their rates of increase varied with freezing temperature. At 0 and −3 °C, the changes were relatively slow, and porosity and connected porosity increased almost linearly. The increase became faster at −5 °C and was most pronounced at −20 °C. After 60 F–T cycles at −20 °C, porosity increased from 16.06% to 21.80%, while connected porosity increased from 11.15% to 18.67%. The ratio of connected porosity to total porosity increased from 69.4% to 85.6%. After 40 F–T cycles, connected porosity increased by 5.84%, 15.02%, 20.39%, and 37.28% at 0, −3, −5, and −20 °C, respectively, indicating that connected porosity was more sensitive to freezing temperature than total porosity.
This temperature dependence was closely related to the freezing state of pore water and the resulting frost-heave effect. Water in smaller pores freezes at lower temperatures. Therefore, at freezing temperatures close to 0 °C, freezing occurs mainly in relatively large pores, while more unfrozen water remains in small pores, resulting in limited pore-ice expansion [
27]. The temperature-dependent partitioning between ice and unfrozen water has also been observed in frozen porous media, further indicating that freezing temperature plays an important role in controlling the phase transition of pore water [
28]. As the freezing temperature decreases, more water in medium-sized and small pores freezes, producing greater expansion pressure on the pore walls. When the local frost-heave stress exceeds the local resistance at grain-bond interfaces or pore tips, existing pores expand and connect with adjacent pores [
29]. During thawing, water migrates through these newly formed channels and supplies water for subsequent ice growth. Repeated phase changes, unfrozen-water migration, and frost heave therefore promote the evolution of the pore structure from pore expansion toward increased connectivity.
Consistent with the increase in connected porosity, the permeability results further support the development of the connected pore network. At −20 °C, permeability reached 0.915 μm
2 after 60 F–T cycles, approximately 90% higher than the initial value and 1.62, 1.45, and 1.24 times the corresponding values at 0, −3, and −5 °C, respectively. The trend in permeability was generally consistent with that of connected porosity, indicating that lower freezing temperatures not only enlarged the pore space but also promoted the formation of more continuous flow paths. The 3D fractal dimension also increased with F–T cycles. At −20 °C, for example, the fractal dimension increased from 2.402 to 2.459 during the first 20 cycles, an increase of 0.057, and then increased by 0.083 to 2.543 after 40 cycles. This suggests that the early stage of F–T damage was mainly characterized by the expansion and local connection of existing pores. With further cycling, repeated pore-ice expansion promoted the formation of new pores and additional connecting paths, making the pore structure increasingly complex [
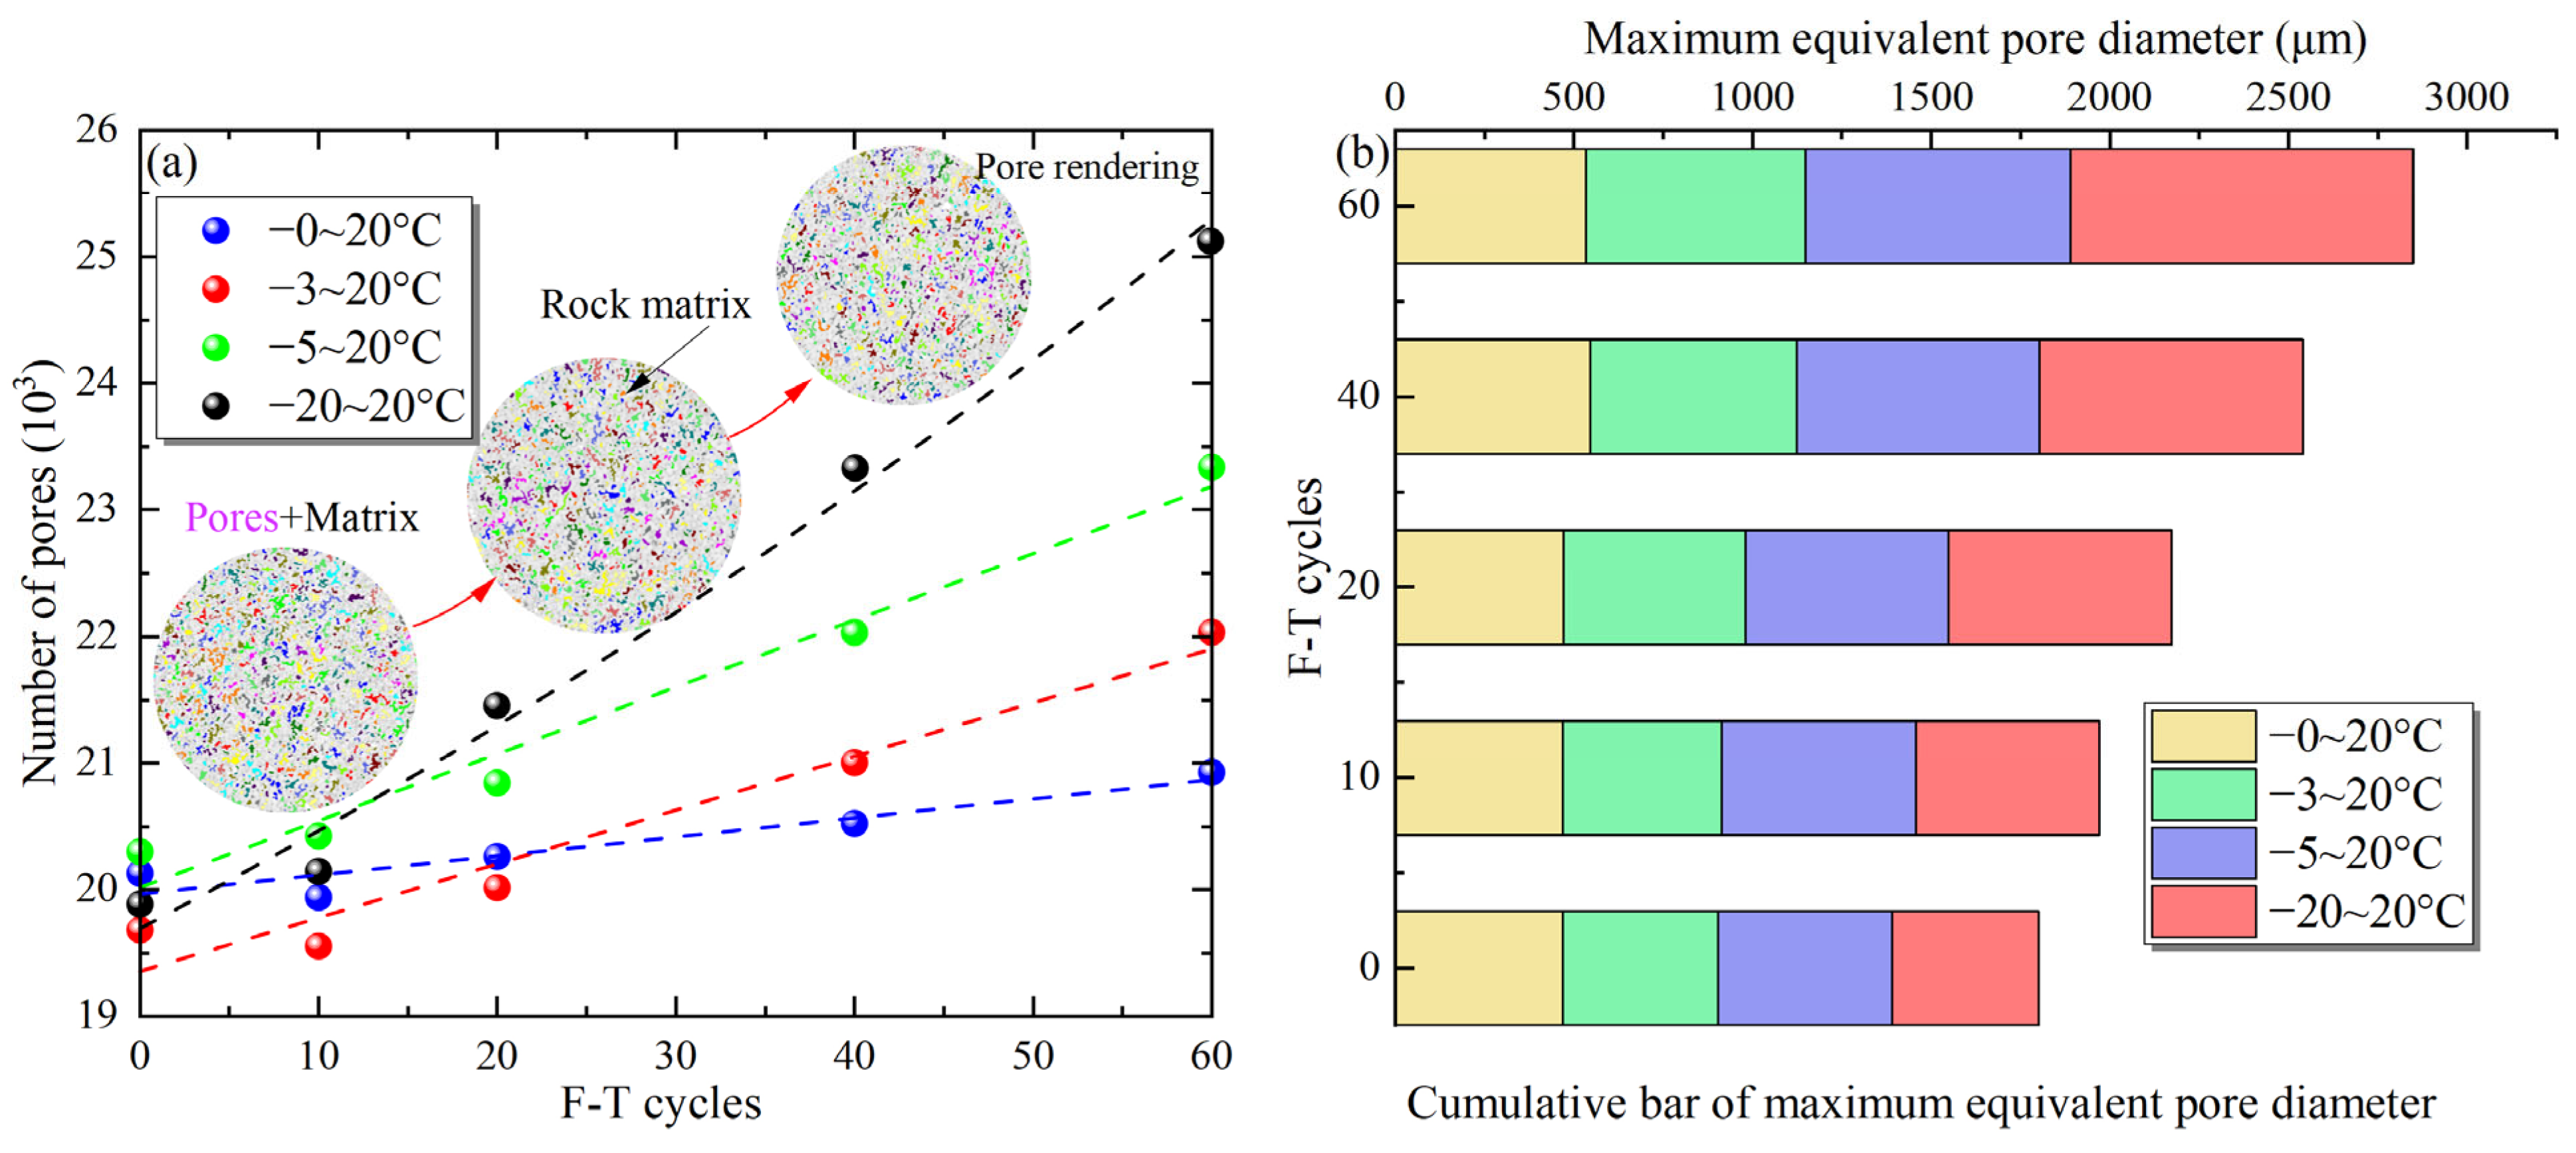
22]. To further distinguish pore formation, pore merging, and the development of connecting paths, the pore number and maximum equivalent pore diameter were analyzed, as shown in
Figure 11.
As shown in
Figure 11, the pore number generally increased with F–T cycles, although its variation during the early stage depended on the freezing temperature. At −3 °C, the pore number decreased from 19,787 to 19,446 after 10 cycles and then increased to 20,019 after 20 cycles. This suggests that, at relatively high freezing temperatures, the expansion and merging of existing pores played a greater role during the early F–T stage. In contrast, at −20 °C, the pore number increased from 19,886 to 20,149 and 21,557 after 10 and 20 cycles, respectively, indicating more active formation of new pores at lower freezing temperatures. The maximum equivalent pore diameter also increased with F–T cycles, and the increase became greater as the freezing temperature decreased. At −20 °C, it increased from 405 to 960 μm after 60 cycles, reaching 1.78, 1.56, and 1.28 times the corresponding values at 0, −3, and −5 °C, respectively. These changes indicate that lower freezing temperatures promote both the formation of new pores and the expansion and merging of existing pores.
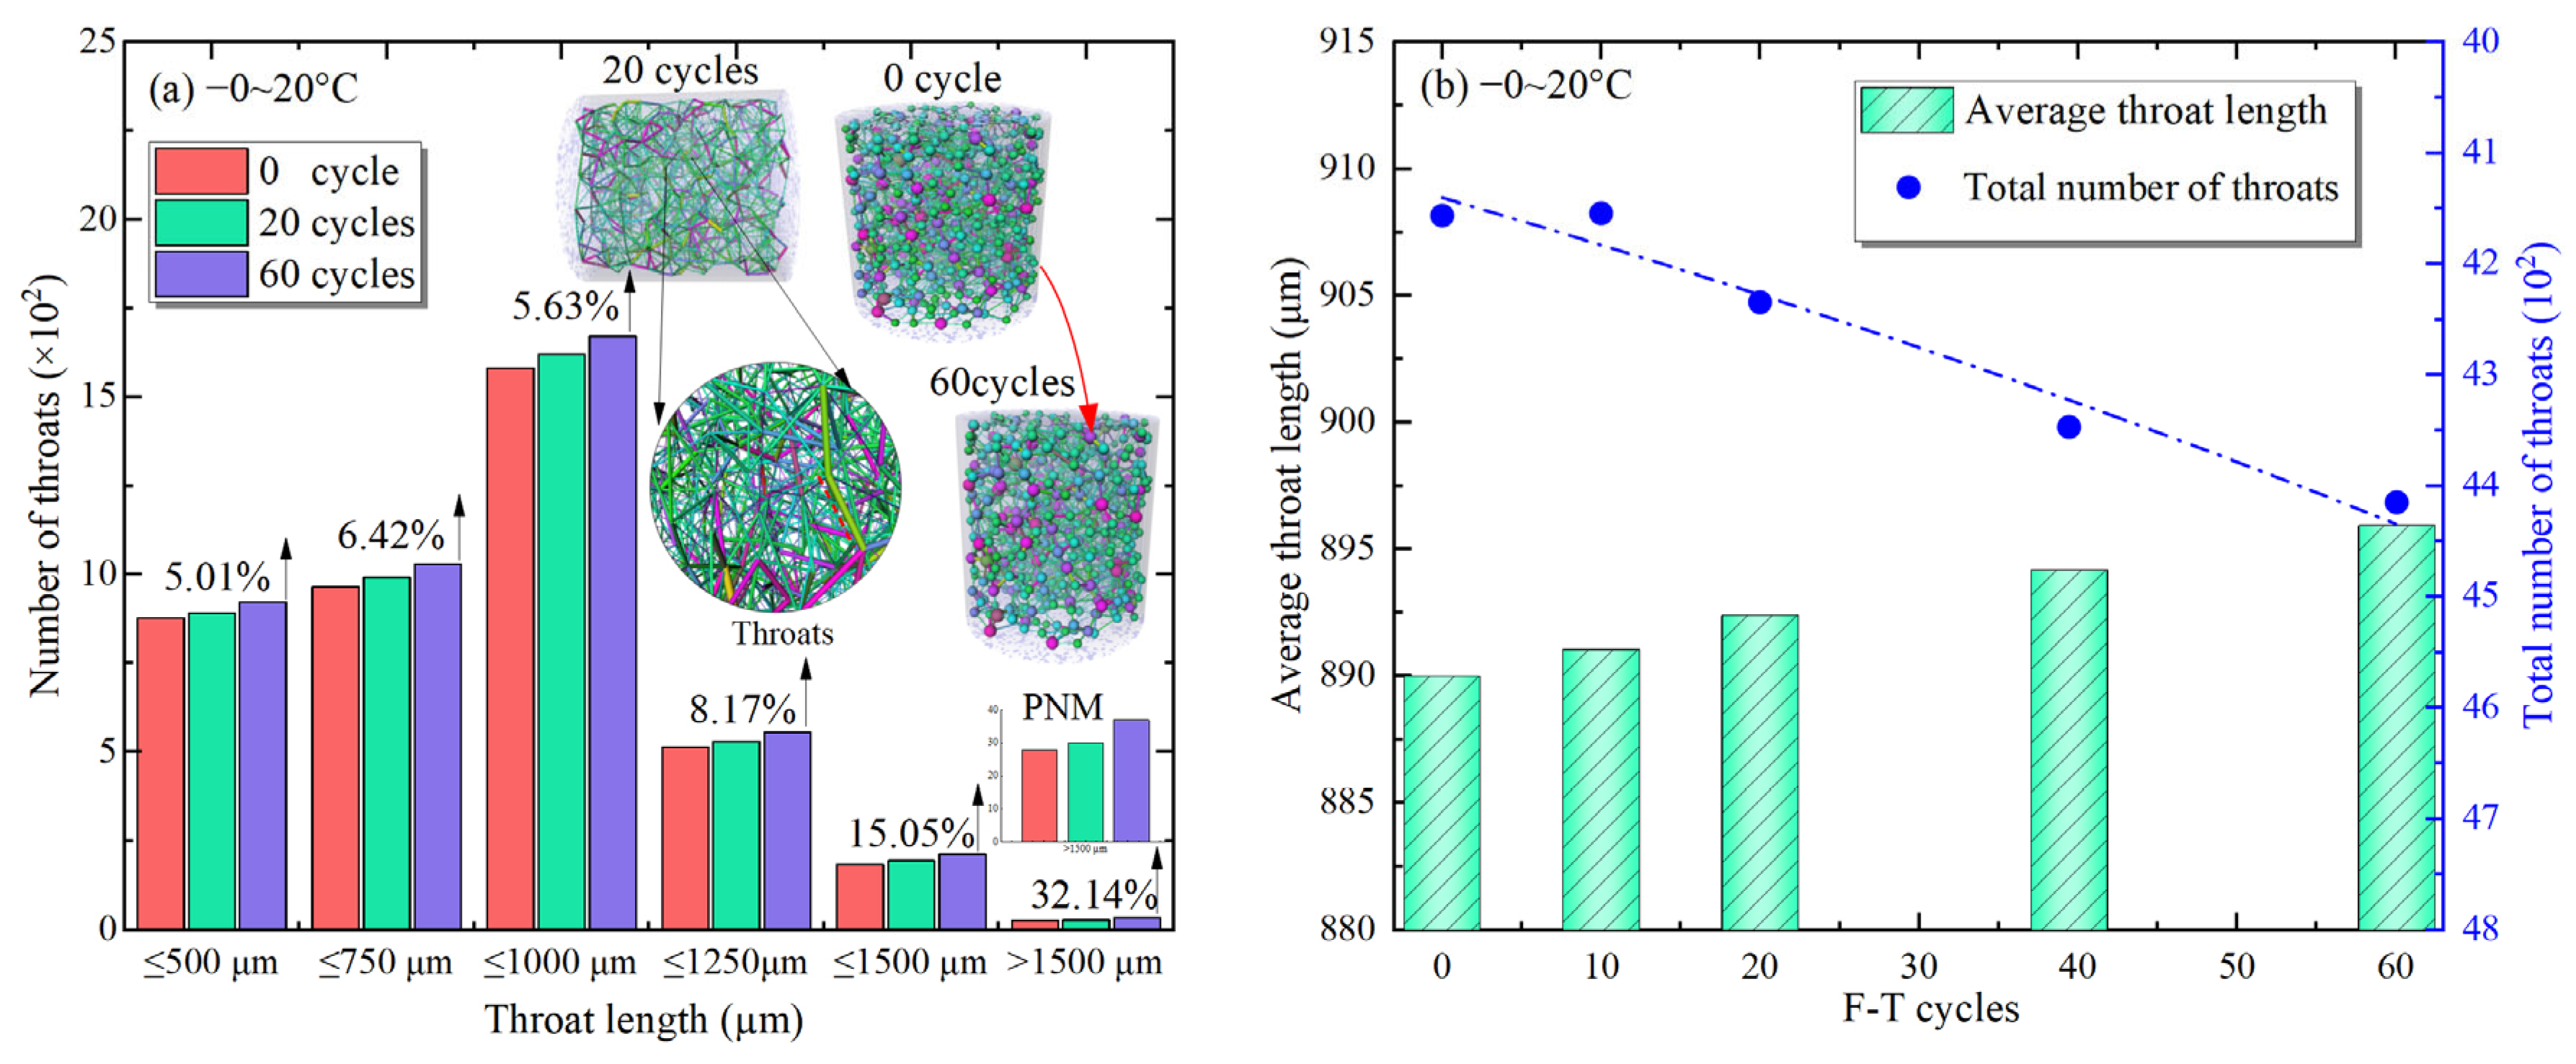
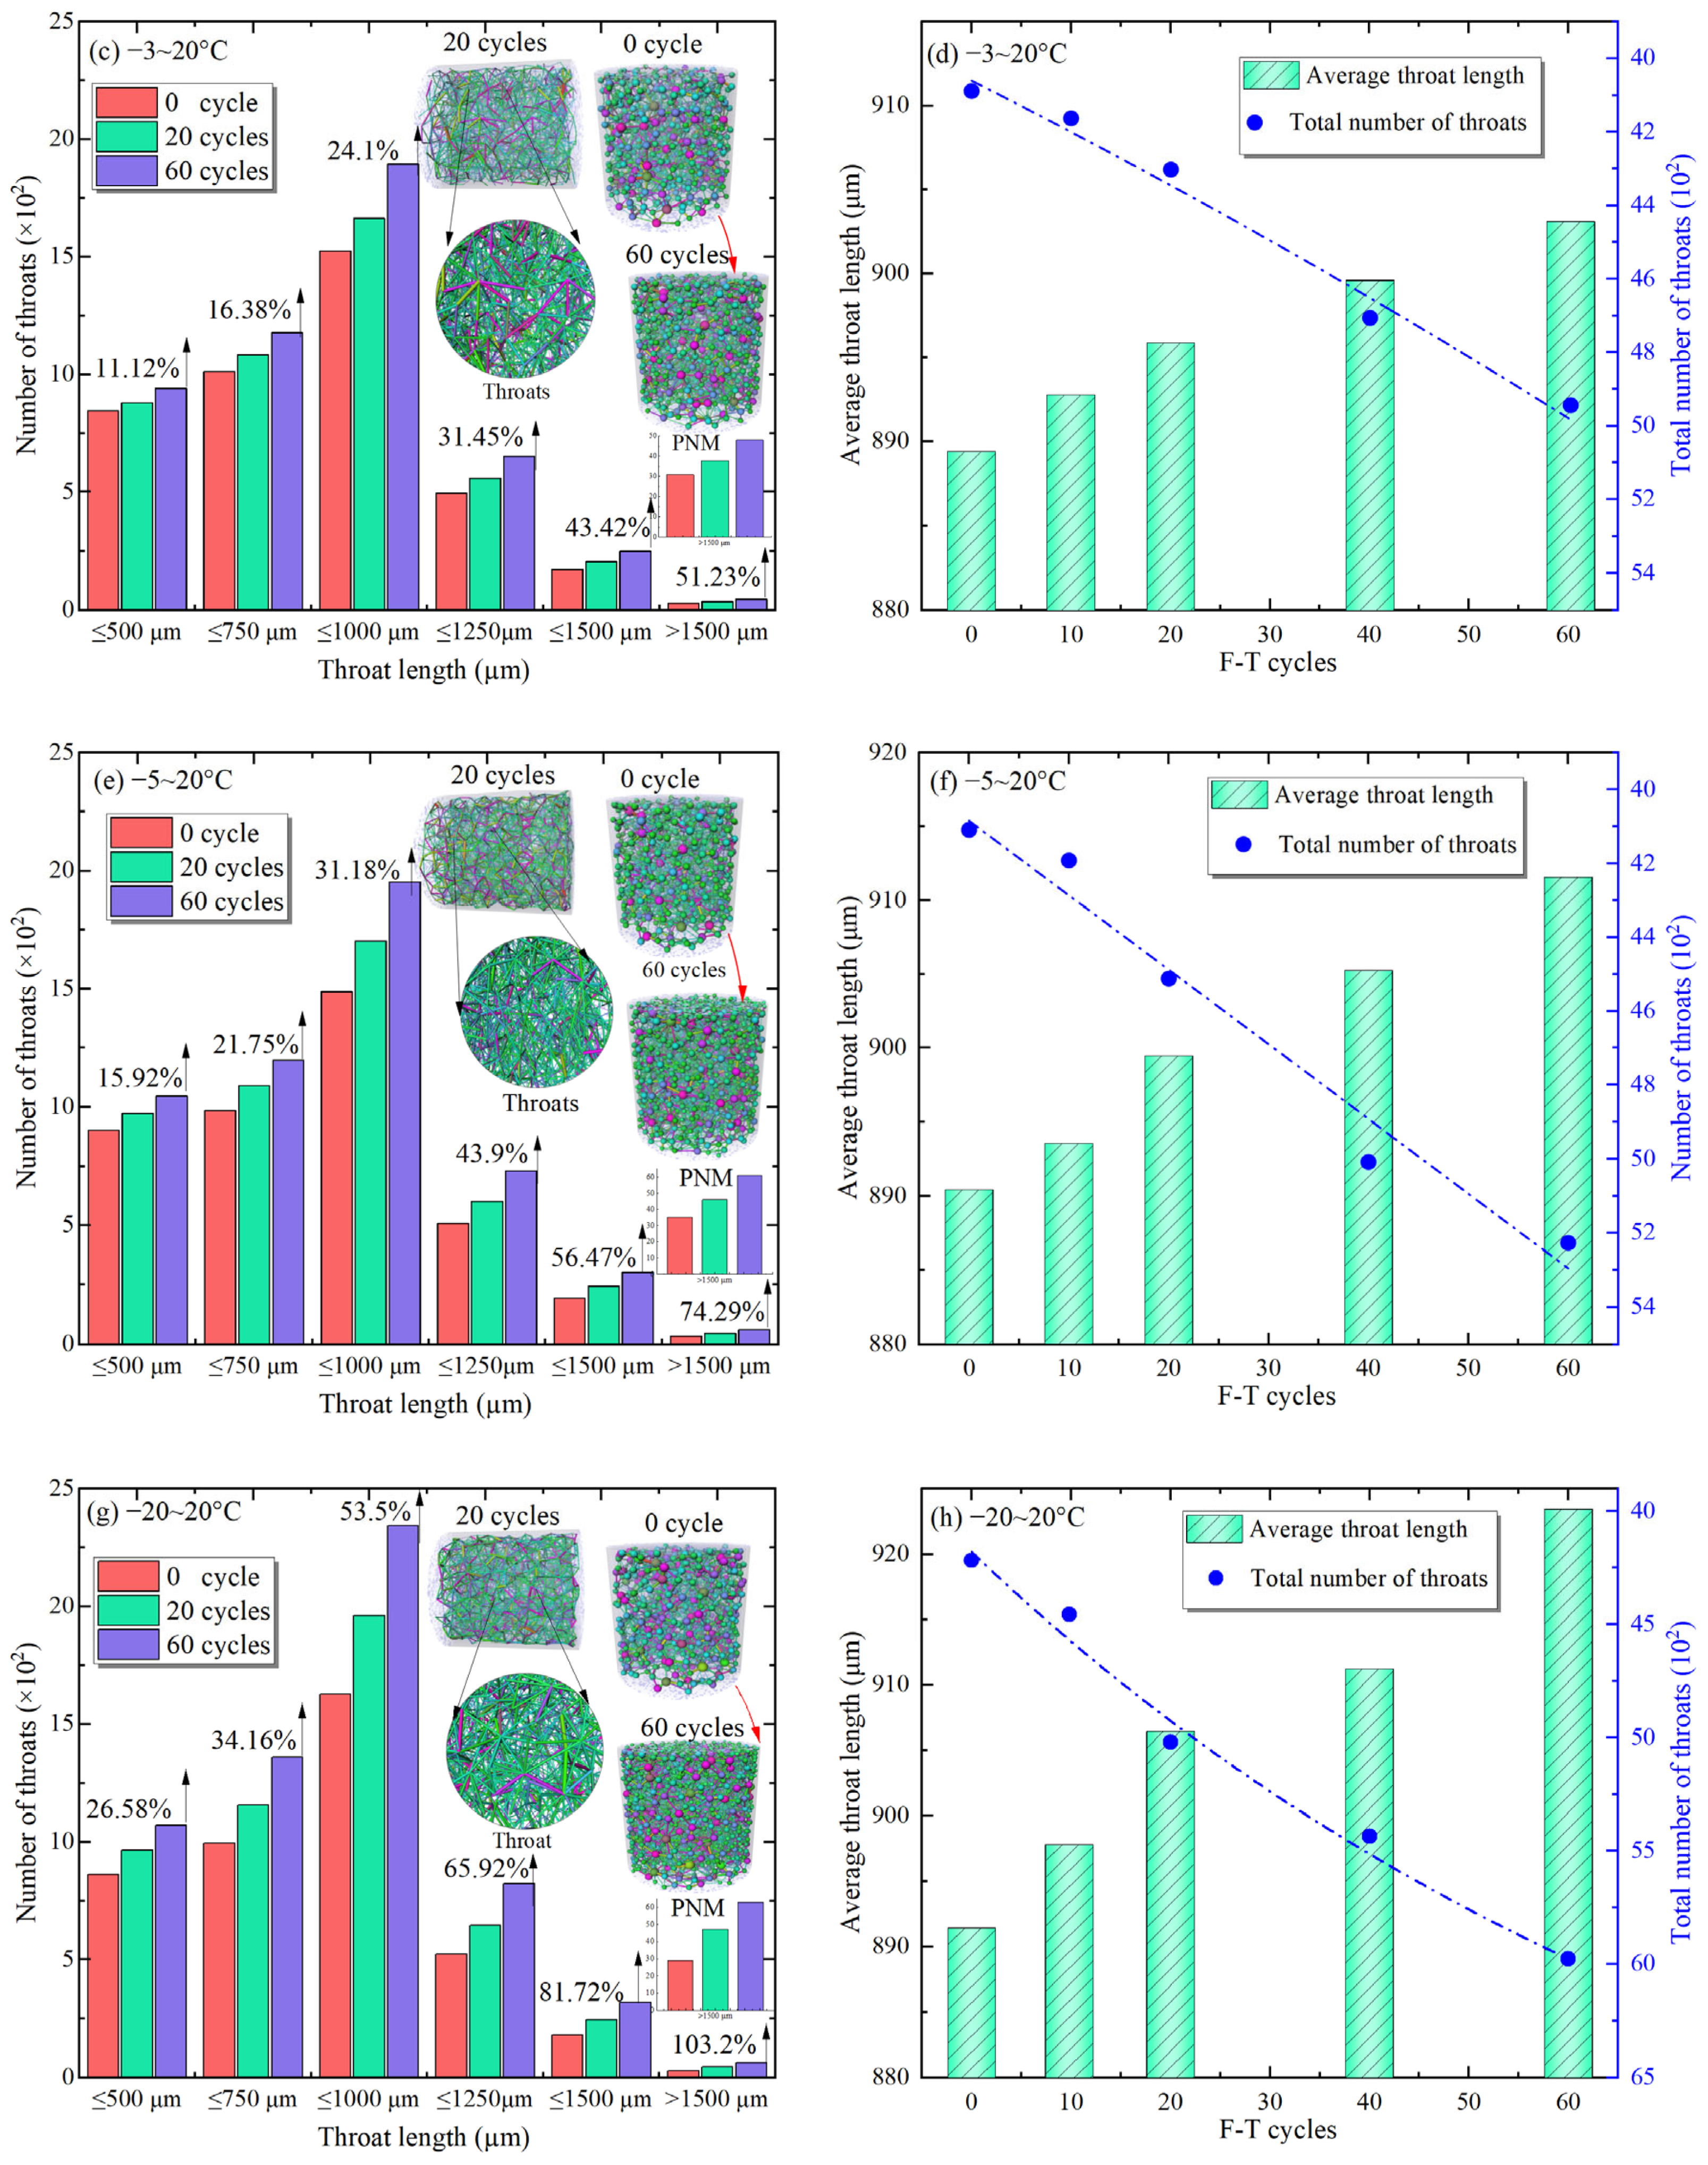
To further examine the development of pore connectivity, the throat-length distribution and average throat length were analyzed, as presented in
Figure 12. The number of throats in all length ranges increased with the number of F–T cycles, while longer throats were more sensitive to freezing temperature. At −20 °C, after 60 F–T cycles, the number of throats longer than 1500 μm increased by 103.2%, compared with only 26.58% for throats shorter than 500 μm. At −3 °C, the increase in throats longer than 1500 μm was 51.23%. Similarly, after 40 cycles, the total number of throats increased from 4109 to 5008 at −5 °C, whereas it increased only from 4156 to 4335 at −3 °C. These results suggest that, at relatively high freezing temperatures, early F–T damage mainly caused local expansion of existing connecting paths. As the freezing temperature decreased and F–T damage accumulated, more microcracks developed and connected with existing pores, resulting in more rapid development of the throat network. The average throat length exhibited a similar temperature dependence. After 60 F–T cycles, it increased by 5.40, 13.69, 22.14, and 32.01 μm at 0, −3, −5, and −20 °C, respectively. Although the increase in average throat length was relatively small, the simultaneous increases in throat number and length indicate a denser pore network with longer connecting paths. At lower freezing temperatures, stronger pore-ice expansion and frost-heave pressure promote microcrack growth, pore connection, and the extension of short throats. These connected weak paths facilitate crack propagation under impact loading, which is consistent with the greater dynamic strength decay observed at lower freezing temperatures.
Taken together, F–T cycles caused the sandstone microstructure to gradually evolve from the expansion and local connection of existing pores to the formation of new pores and the development of a connected pore network, and this process was clearly accelerated at lower freezing temperatures. The simultaneous increases in porosity, connected porosity, permeability, and fractal dimension indicated that F–T cycles at lower freezing temperatures enlarged the pore space and increased pore connectivity and structural complexity. Changes in pore number, maximum equivalent pore diameter, and throat parameters further indicated that stronger pore-ice expansion and frost-heave pressure promoted defect initiation, growth, and connection. These microstructural changes were consistent with the greater dynamic strength decay observed at lower freezing temperatures. The following section quantitatively examines which microstructural parameters are most closely associated with dynamic strength decay.
3.3. Macroscopic–Microstructural Correlation
To identify the microstructural parameters most closely associated with the dynamic strength decay of F–T sandstone, grey relational analysis (GRA) was used to evaluate the consistency between the changes in microstructural parameters and the dynamic strength decay rate. The dynamic strength decay rates at different numbers of F–T cycles were taken as the reference sequence, while the rates of change in permeability, 3D fractal dimension, connected porosity, pore number, and average throat length were taken as the comparison sequences. Since these parameters have different units and numerical ranges, min–max normalization was applied to scale each sequence to a range from 0 to 1 before the GRA calculation. The absolute differences between the reference and comparison sequences were then calculated as follows [
30]:
The grey relational coefficient and grey relational grade were calculated using
where
and
are the minimum and maximum absolute differences among all sequences, respectively;
is the distinguishing coefficient;
n is the number of F–T conditions; and
is the grey relational grade between the
ith microstructural parameter and the dynamic strength decay rate. The distinguishing coefficient controls the contrast among the grey relational coefficients, and
= 0.5 was adopted as a commonly used value in GRA, providing a moderate level of discrimination among the relational coefficients. A value of
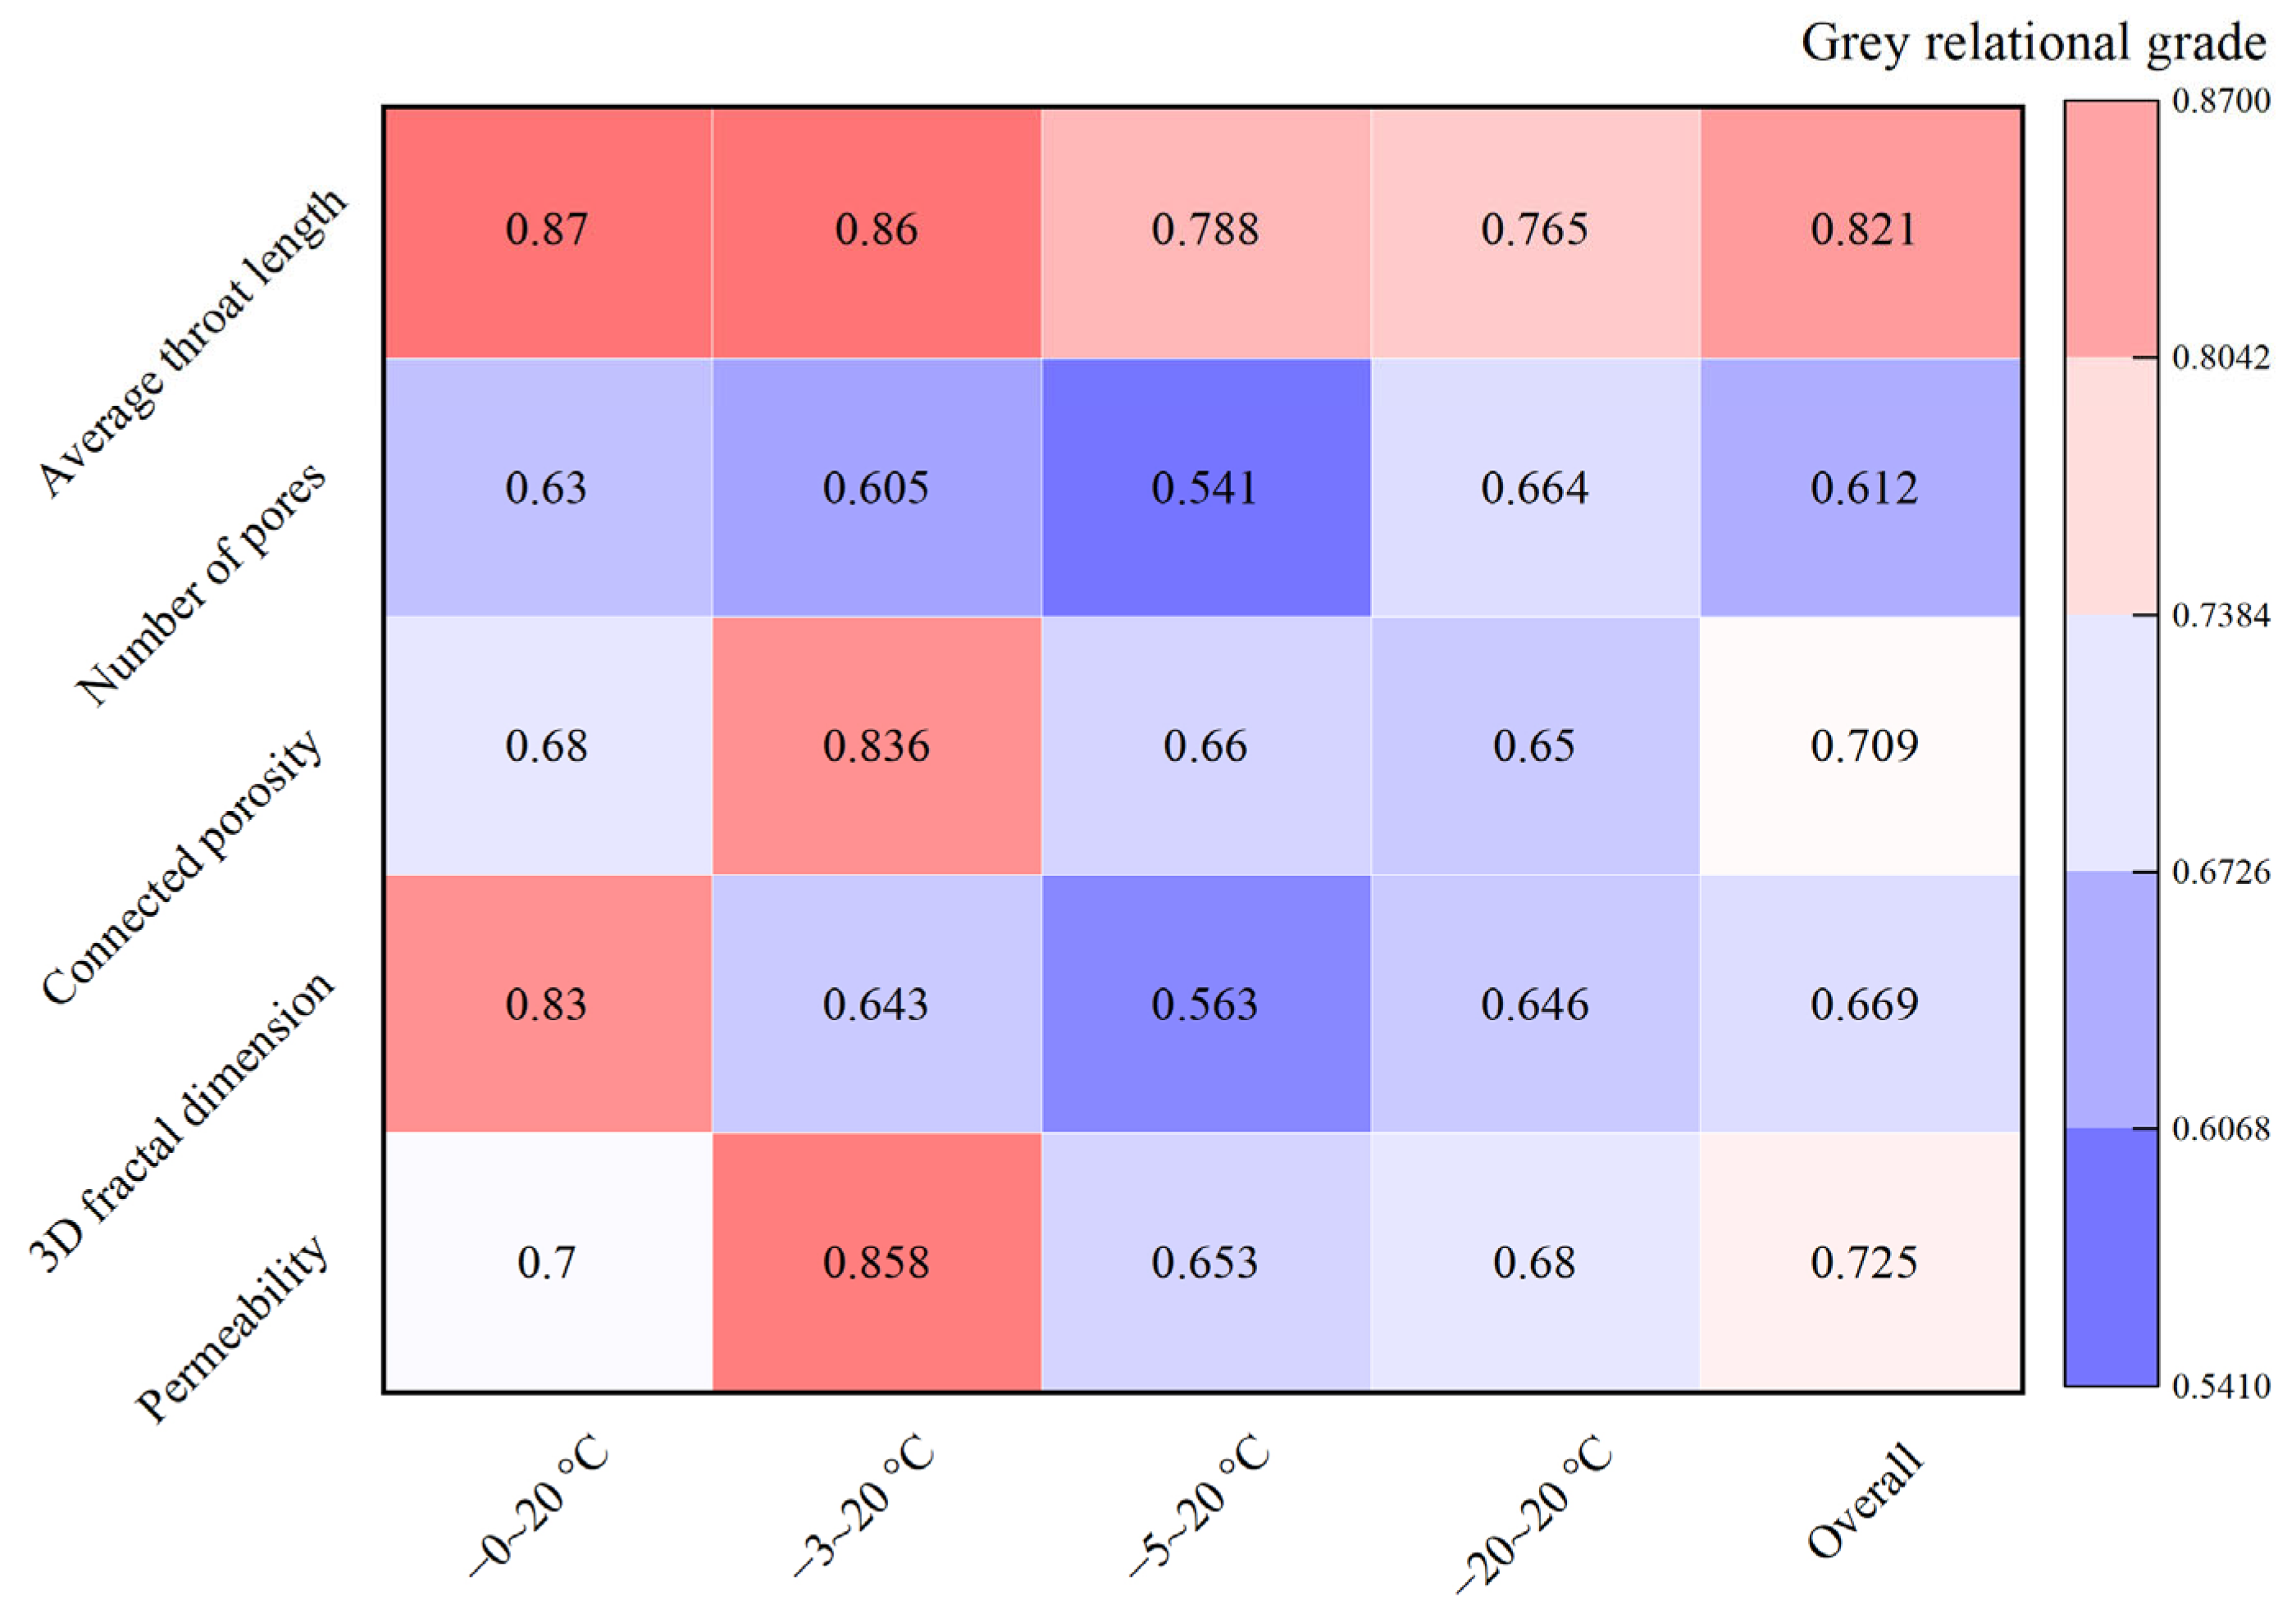
closer to 1 indicates greater similarity between the variation trends of the two sequences. The relational grades were calculated separately at the four impact pressures. Because the relative rankings of the microstructural parameters were generally consistent across the four pressure levels, the mean relational grade was used to characterize their overall association with dynamic strength decay and to avoid overemphasizing the result at any single impact pressure. The results are presented in
Figure 13.
As shown in
Figure 13, the relational grades of all microstructural parameters were greater than 0.60, indicating a relatively close association between pore-structure evolution and dynamic strength decay. At 0 °C, the relational grades of permeability, fractal dimension, connected porosity, pore number, and average throat length were 0.70, 0.83, 0.68, 0.63, and 0.87, respectively. Their association with dynamic strength decay increased in the order of pore number, connected porosity, permeability, fractal dimension, and average throat length. Under this relatively mild F–T condition, changes in structural complexity and connecting paths were more closely associated with dynamic strength decay. When the freezing temperature decreased to −3 °C, the relational grade of permeability increased to 0.858, while that of fractal dimension decreased to 0.643. The order changed to pore number < 3D fractal dimension < connected porosity < permeability < average throat length. This change suggests that, with increased pore-water freezing and frost-heave damage, pore connectivity and the development of flow paths became more closely associated with dynamic strength decay.
As the freezing temperature decreased further, the relational grades of most microstructural parameters generally decreased. For example, the relational grade of permeability decreased from about 0.86 at −3 °C to about 0.67 at −20 °C. This decrease does not necessarily indicate a weaker association between microstructural evolution and dynamic strength decay. Instead, the damage process at lower freezing temperatures became more complex, involving pore formation, pore expansion, pore connection, and increasing structural complexity. Therefore, dynamic strength decay could no longer be adequately described by a single microstructural parameter. Among all the parameters, average throat length consistently had the highest or nearly the highest relational grade, with values of 0.87, 0.86, 0.79, and 0.77 at 0, −3, −5, and −20 °C, respectively. When averaged across the four freezing temperatures, the relational grades of permeability, fractal dimension, connected porosity, pore number, and average throat length were 0.725, 0.669, 0.709, 0.612, and 0.821, respectively. Among these parameters, average throat length had the highest overall grey relational grade, suggesting that throat development was particularly closely associated with dynamic strength decay. This may be related to the role of throats in connecting adjacent pores and cracks and forming continuous connecting paths. Recent 3D CT studies have also shown that changes in fracture-path geometry, particularly tortuosity, are closely related to permeability evolution in impact-damaged porous materials [
31], further highlighting the importance of pore-network geometry and connectivity.
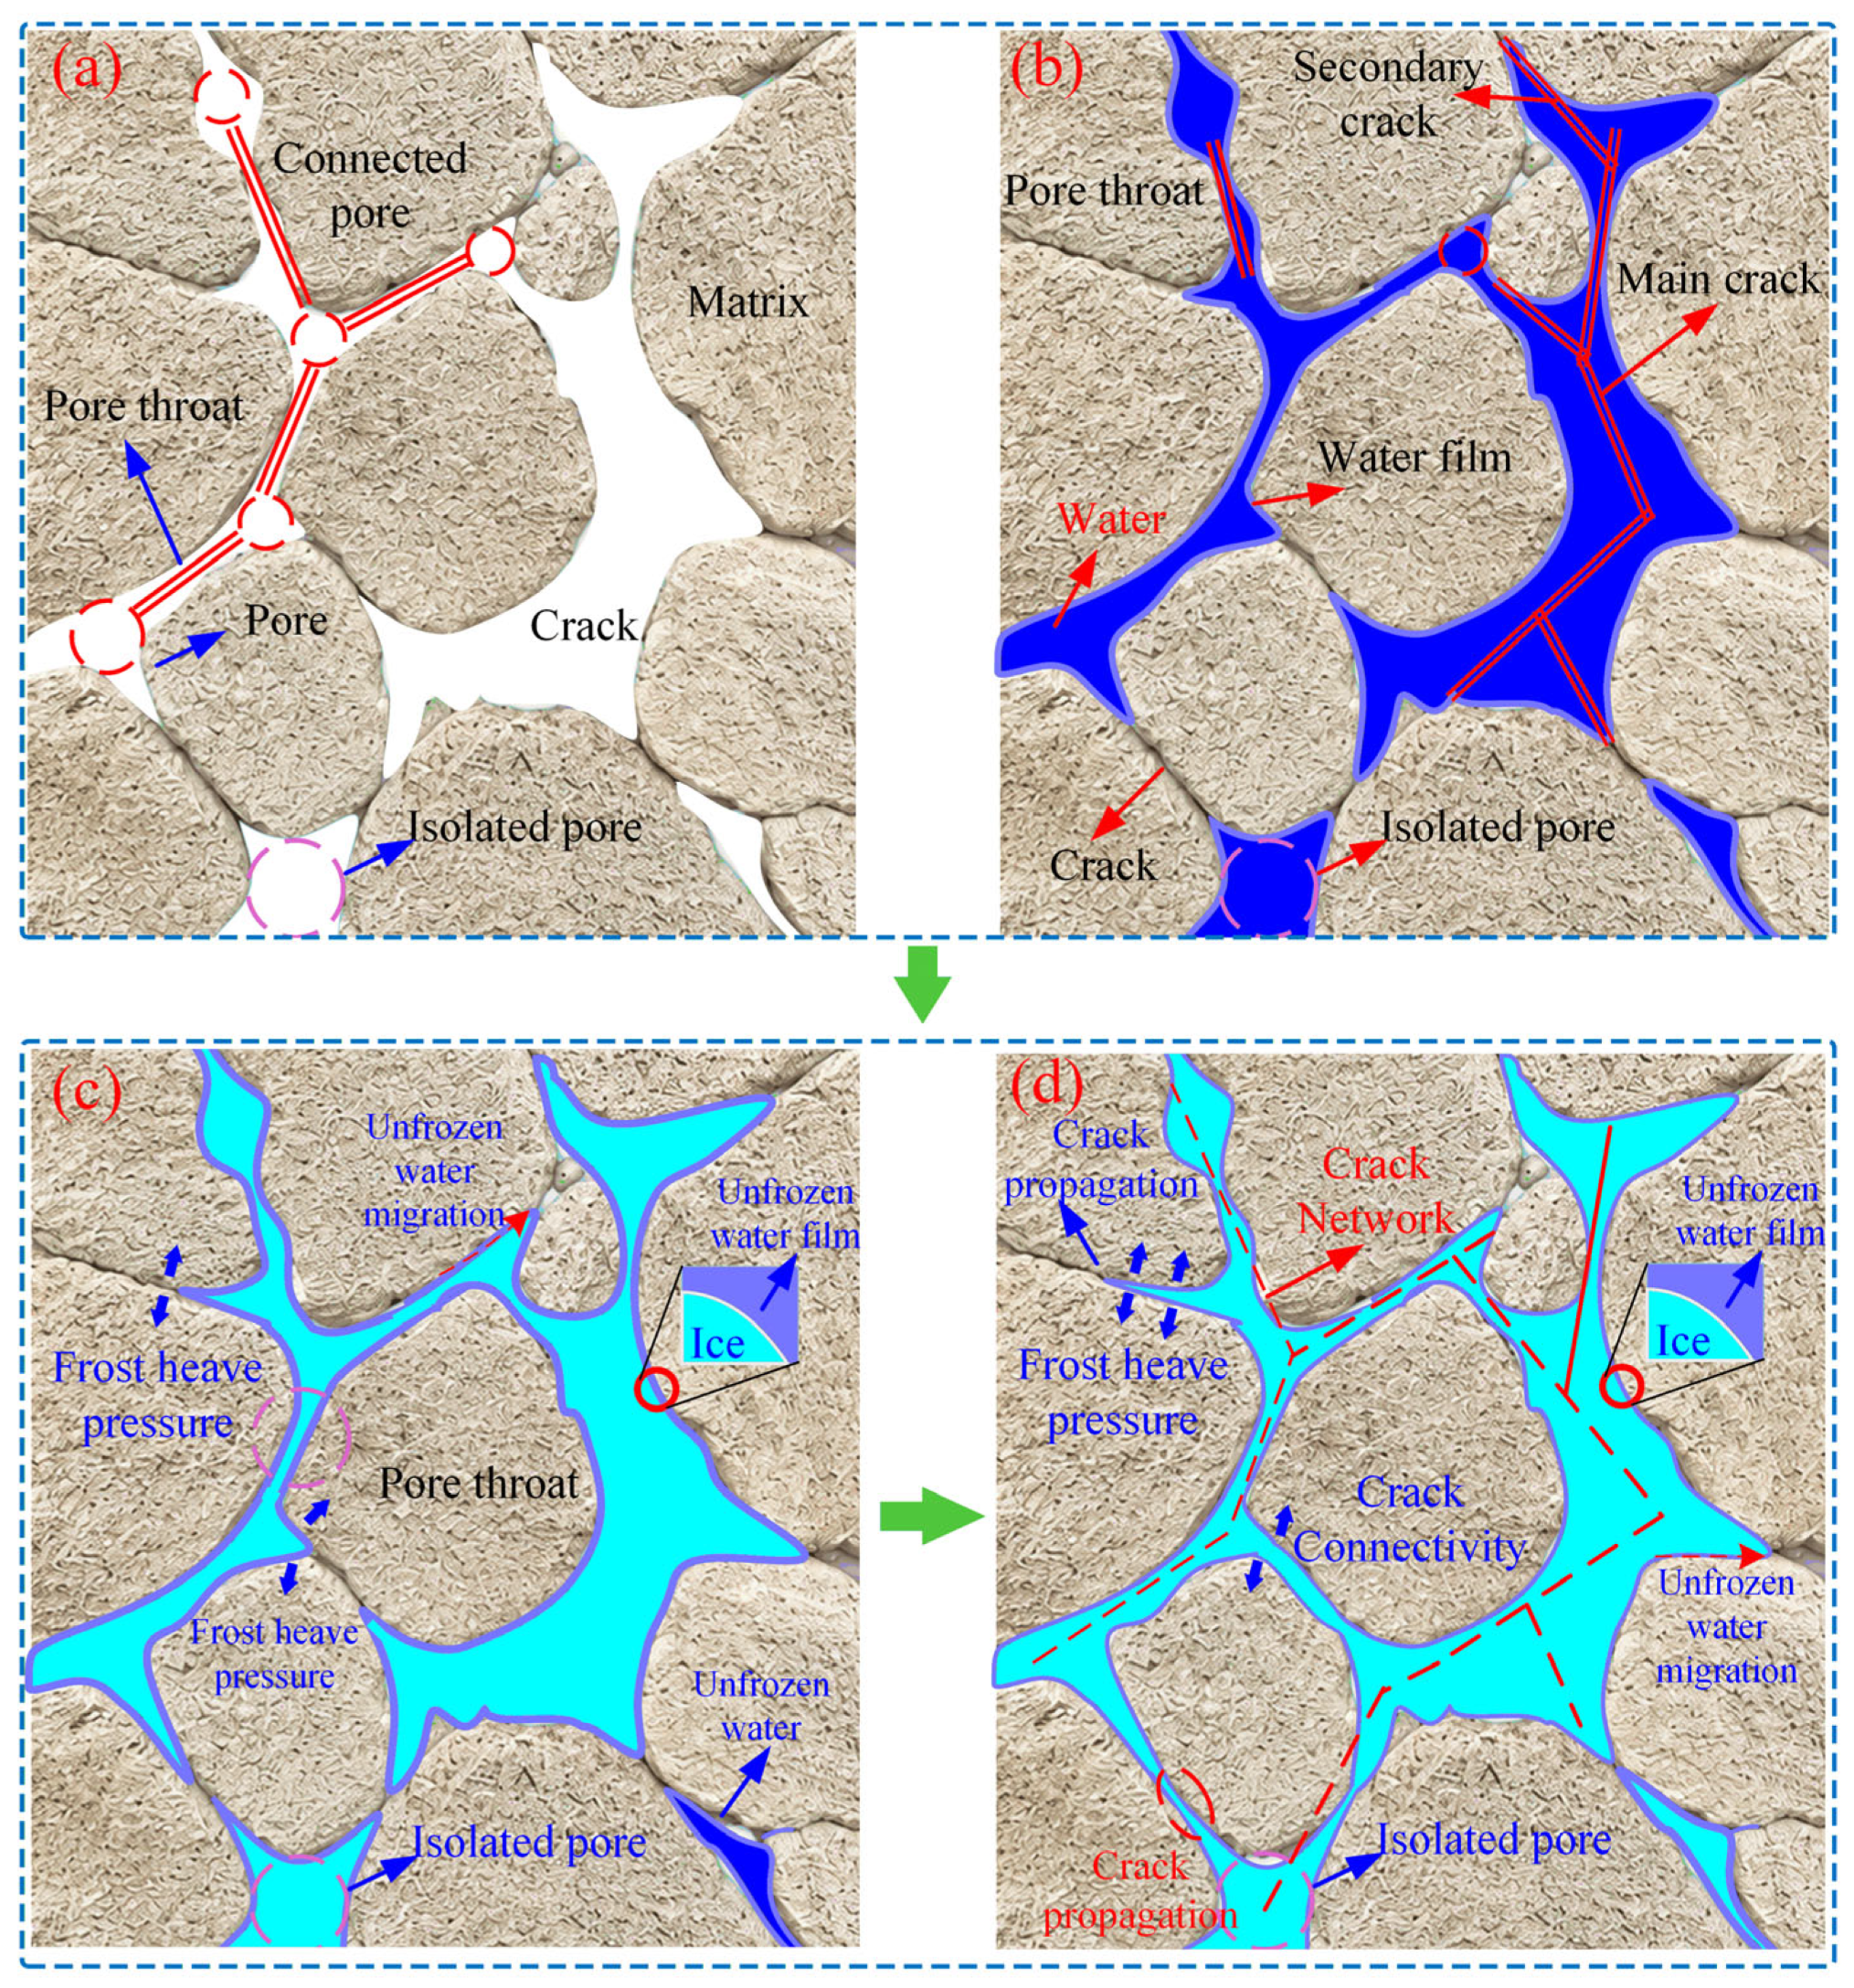
The microstructural evolution under different freezing temperatures is illustrated in
Figure 14. Before freezing, pore water is mainly distributed in pores, throats, and existing cracks. At −3 °C, part of the pore water freezes, while unfrozen water migrates toward the frozen regions through water films and connected paths. This promotes pore-ice growth and increases frost-heave pressure, causing existing throats and secondary cracks to expand. When the freezing temperature decreases to −20 °C, more water in small pores freezes. Enhanced pore-ice expansion, unfrozen-water migration, and frost-heave pressure promote crack growth and coalescence, gradually forming a continuous crack network [
29]. After thawing and drying, these F–T-induced connected defects remain in the sandstone. During subsequent impact loading, stress concentration is more likely to develop along connected pores and extended throats, promoting further crack propagation and reducing the dynamic load-bearing capacity of sandstone [
7]. It should be noted that the grey relational grade reflects the similarity in variation trends between parameters rather than a strict causal relationship.
3.4. Microscopic Damage Characteristics and Dynamic Strength Decay Mechanism
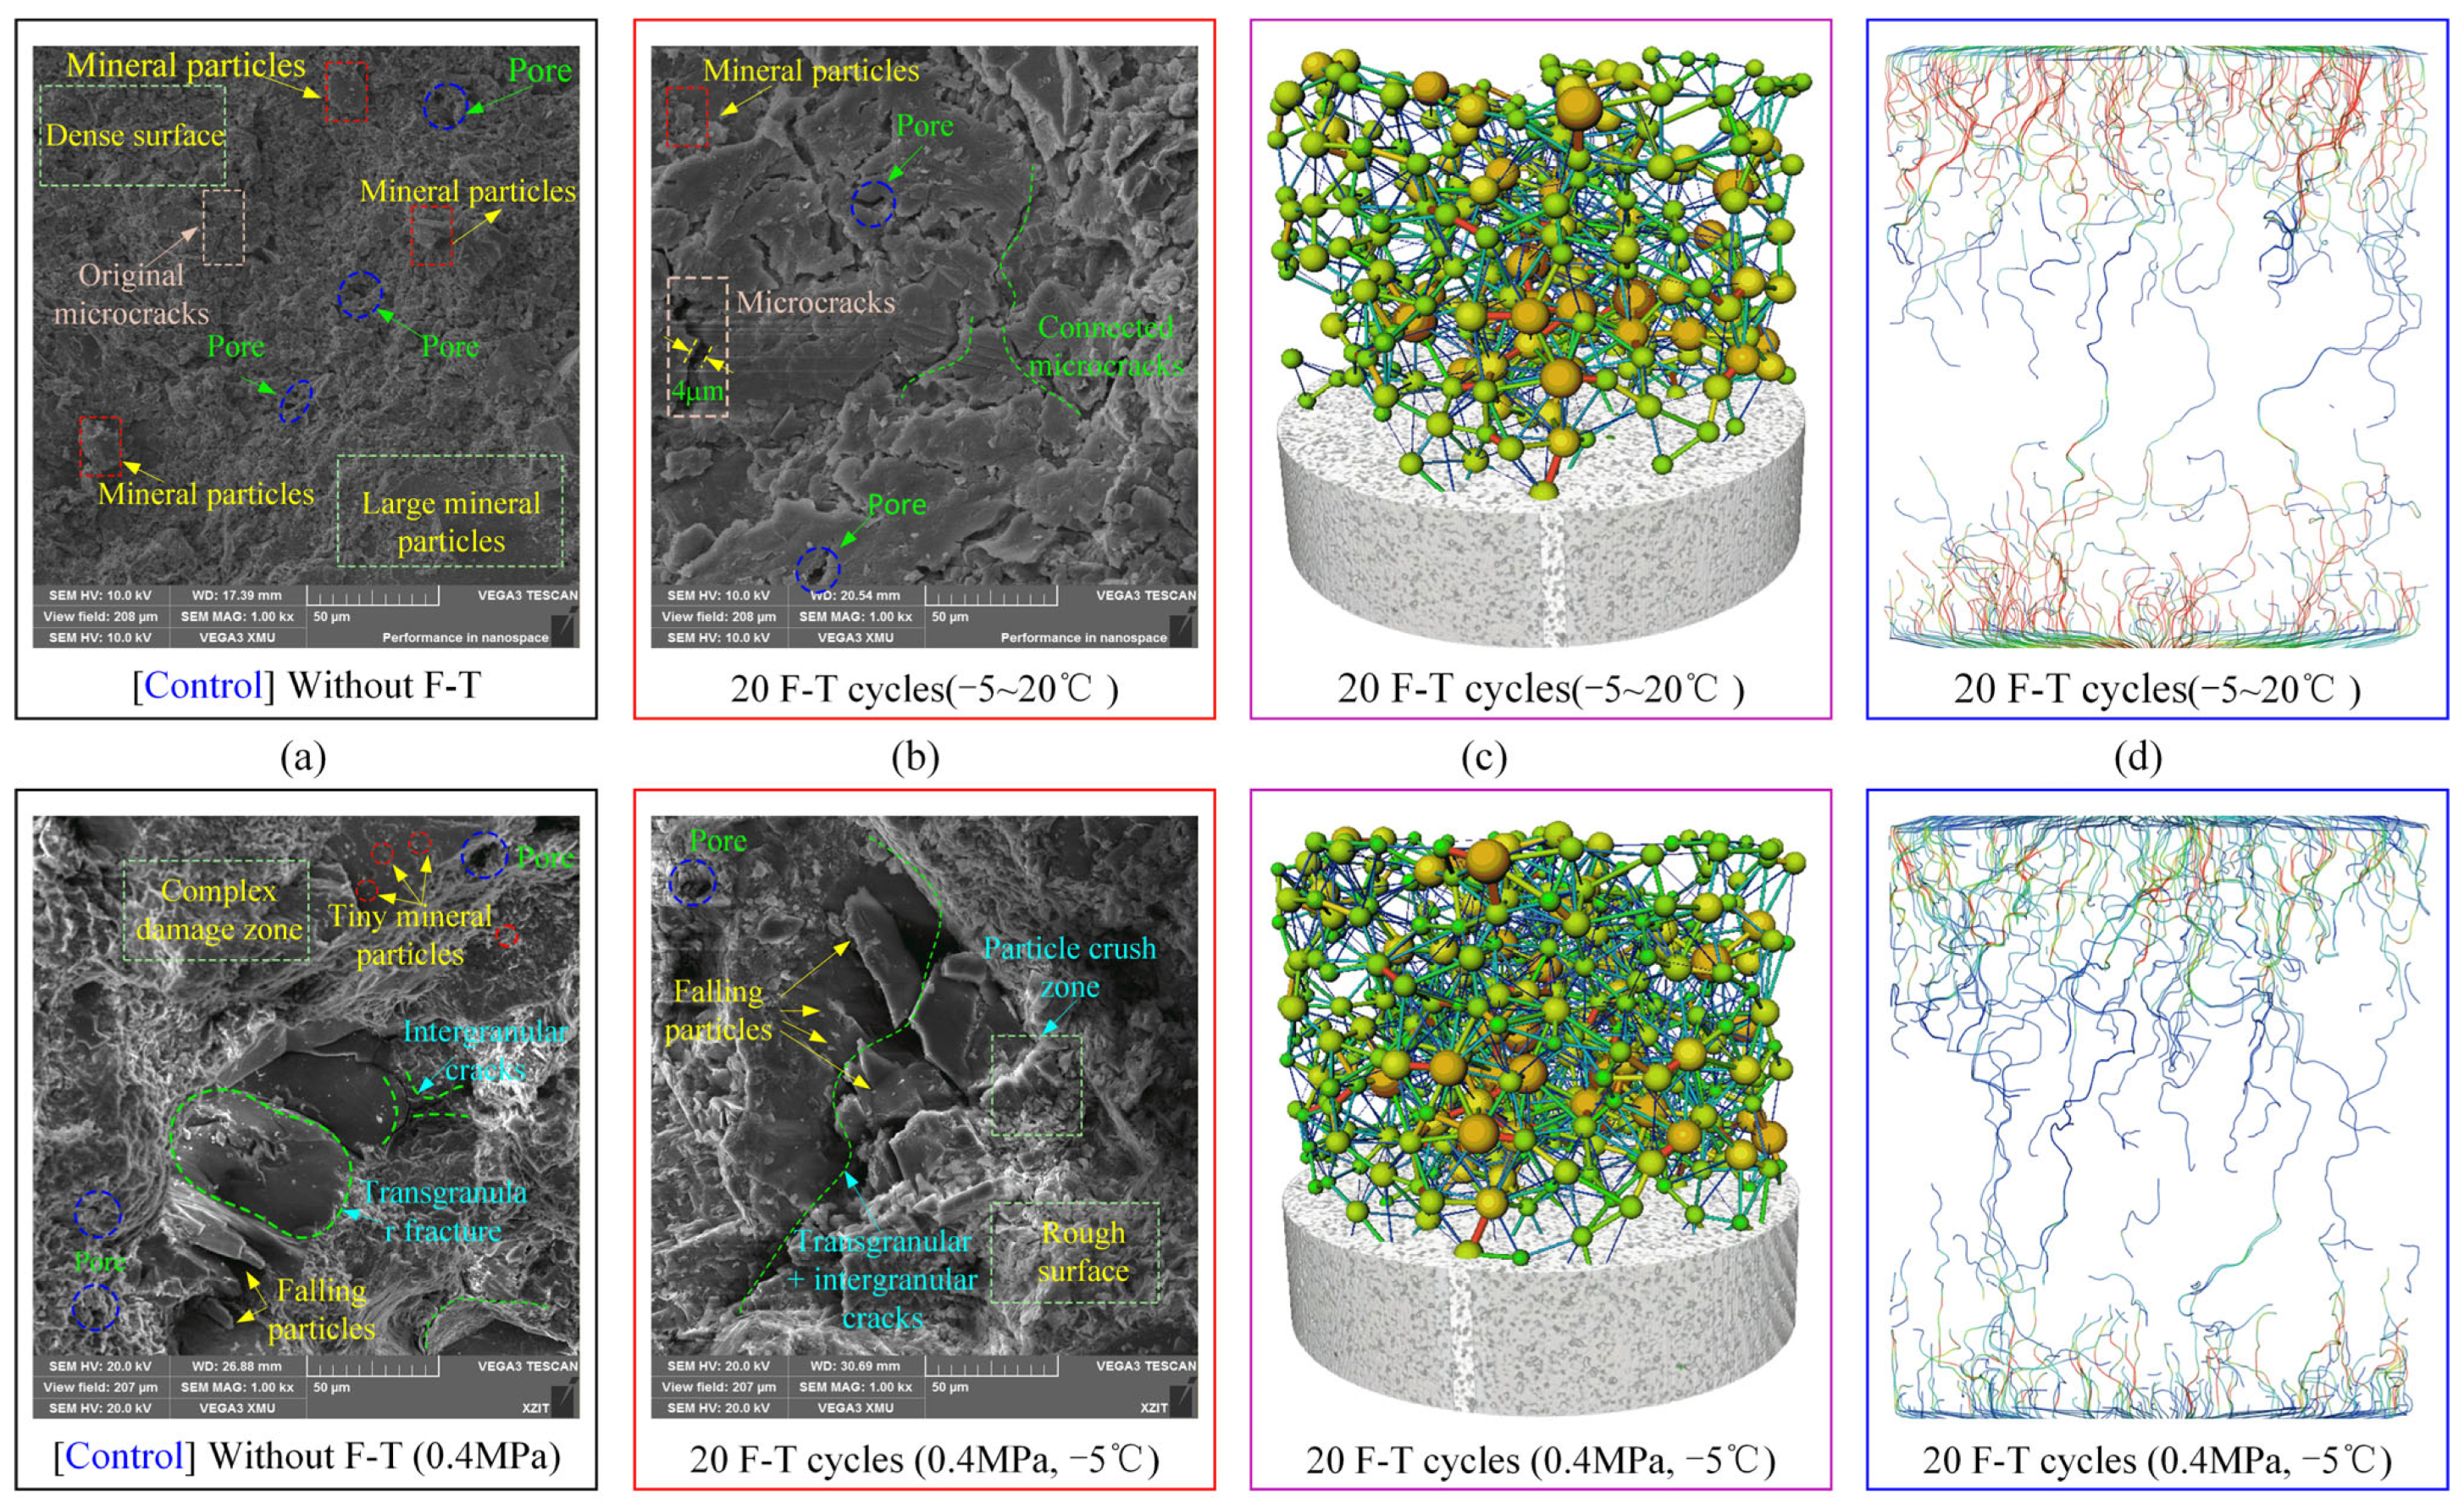
Figure 15 presents the SEM images, pore-network models, and flow paths of sandstone before and after F–T cycles and impact loading. Before F–T treatment, the specimen surface was relatively compact, with clear grain boundaries and only a few pre-existing pores and microcracks. After 20 F–T cycles at −5 °C, the number of pores and microcracks increased, and some cracks with widths of approximately 4 μm became connected to adjacent pores. These changes indicate that repeated freezing and thawing weakened grain bonding and promoted the growth and connection of existing defects. The PNM results showed a similar trend, with increases in pore bodies and connecting paths after F–T cycles. The flow paths also evolved from locally distributed channels into a more continuous network, consistent with the increases in connected porosity, permeability, and average throat length discussed in
Section 3.2.
Under an impact pressure of 0.4 MPa, the specimen without F–T treatment mainly exhibited intergranular and transgranular cracks accompanied by slight particle spalling. In contrast, after 20 F–T cycles, more severe particle crushing, grain detachment, rough fracture surfaces, and mixed intergranular and transgranular cracking were observed. F–T damage promotes the formation of a connected network of pores, throats, and microcracks, which reduces the resistance to further crack growth. Under impact loading, stress concentration tends to occur around pore edges, grain boundaries, and connected defects, promoting rapid crack propagation and coalescence. As F–T damage increases, the effective load-bearing structure is gradually weakened, resulting in lower dynamic strength and a higher dynamic strength decay rate.
Combined with the CT and GRA results, the SEM observations further indicate that dynamic strength decay is closely related to the progressive development of internal defects. Lower freezing temperatures increase pore-ice expansion and unfrozen-water migration, which weaken grain bonding and promote pore expansion, throat extension, and crack connection [
12]. These connected defects provide weak paths for crack propagation under impact loading, allowing F–T-induced microstructural damage to develop into macroscopic strength deterioration under dynamic loading. This also agrees with the GRA result that average throat length had the highest overall grey relational grade among the examined microstructural parameters.