1. Introduction
Currently, most onshore oilfields in China have entered the late stage of high-water-cut development, with comprehensive water cut generally ranging from 70% to 90% [
1,
2]. Conventional heating gathering processes face prominent challenges such as high energy consumption and operating costs. Consequently, unheated gathering technology has become a key development direction for surface engineering in high-water-cut oilfields due to its significant energy-saving benefits [
3]. However, the operational safety of inclined pipelines under high-water-cut conditions remains a severe challenge [
4]. During shutdown, as the temperature drops below the wax appearance temperature, the crude oil gels. Owing to its lower density compared to the water phase, the gelled oil floats to the upper pipe wall. Driven by the tangential component of the net buoyant force, it slips towards the high point and accumulates, easily causing blockages [
5]. Therefore, revealing the slip mechanism of gelled crude oil particles in inclined pipelines and establishing a corresponding restart-pressure calculation method are of great significance for ensuring the safe operation of gathering systems in high-water-cut oilfields.
Early investigations into unheated gathering primarily confirmed the feasibility of reducing pipeline operating temperatures through field-scale flow simulator tests [
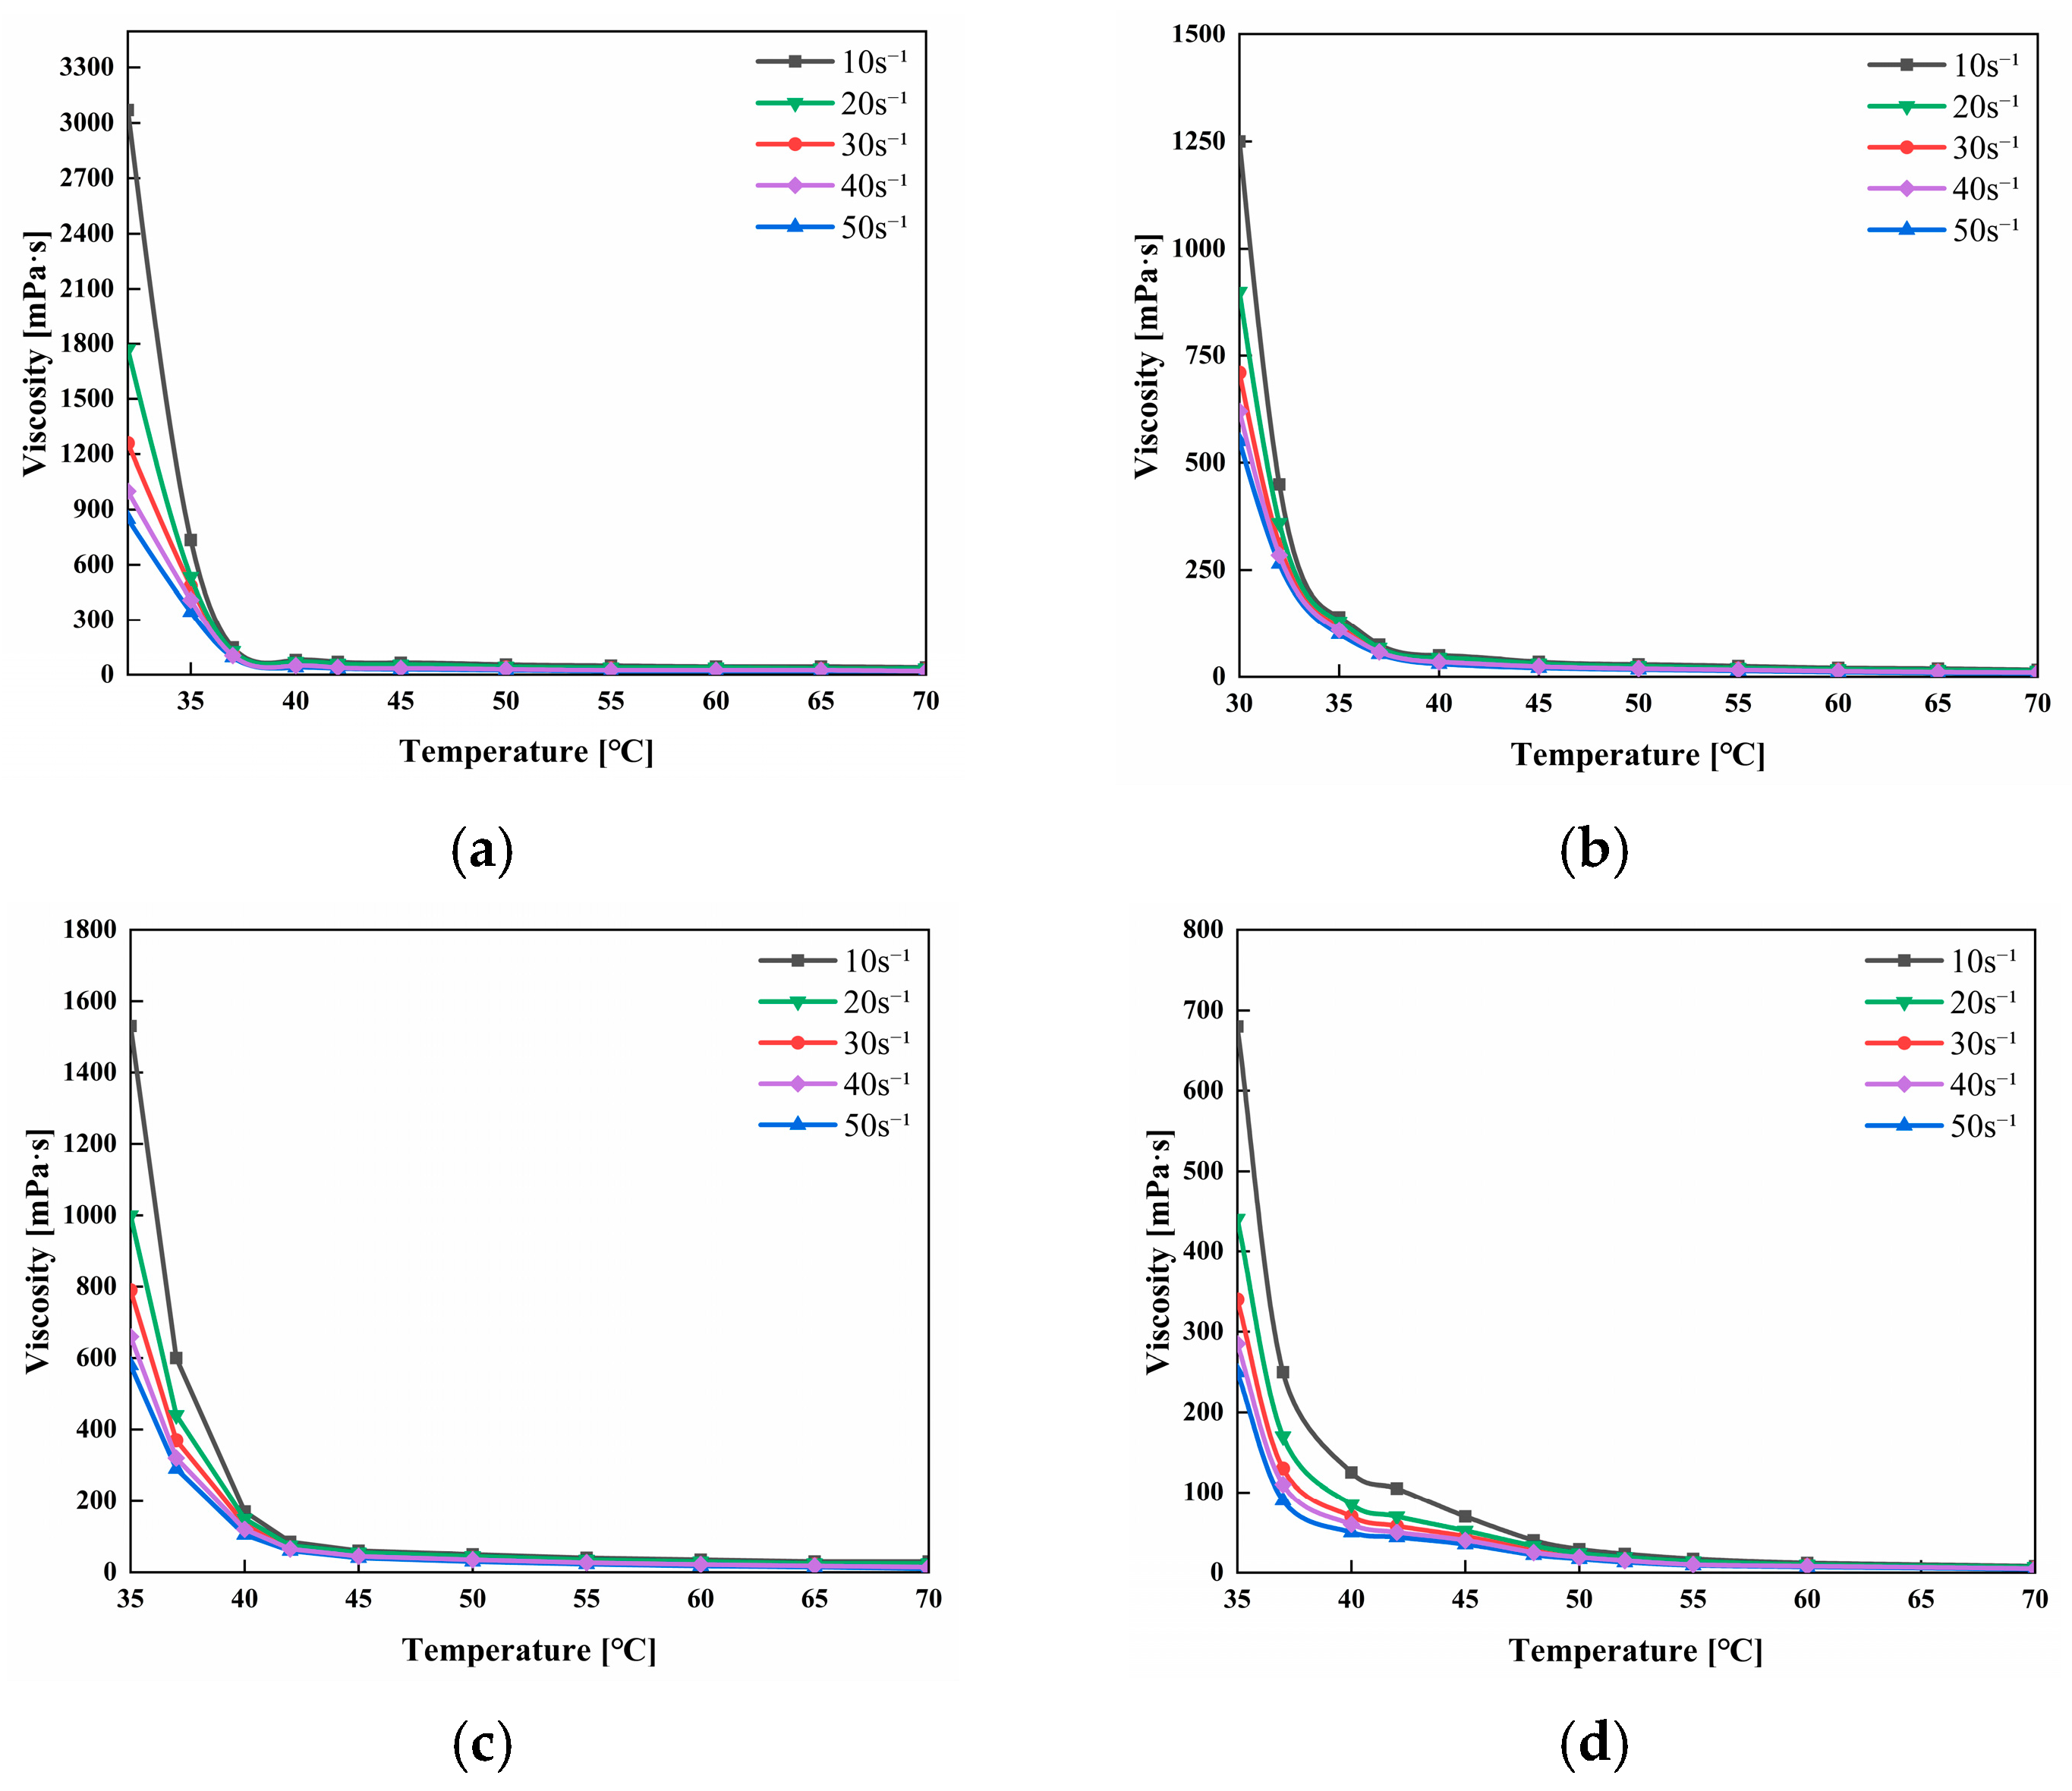
6]. As water cut has progressively risen toward and beyond 90%, the governing physics of low-temperature transport have undergone a qualitative shift: the continuous water phase becomes the dominant heat carrier, while the dispersed oil-phase transitions from an emulsified liquid to a semi-solid gel as the temperature falls below the WAT [
7,
8]. The operational envelope of unheated gathering is therefore constrained by the coupled effects of ambient temperature, pipeline geometry, water cut, and crude oil composition [
2,
8]. Among the physical phenomena governing this envelope, wall adhesion has received the most concentrated research attention. A consistent mechanistic picture has emerged: adhesion is triggered when gelation-driven viscosity escalation overcomes the hydrodynamic stripping forces exerted by the flowing water phase [
1,
9,
10]. Zhang et al. [
11] formalized this balance within an adhesion force theory relating the wall sticking occurrence temperature to interfacial free energy, water cut, and substrate surface properties. Subsequent work has extended this framework along three directions: Lyu et al. [
3] incorporated shear flow effects on the oil/brine/substrate interface; Yin R et al. [
12] demonstrated that non-metallic pipelines exhibit adhesion characteristics systematically different from carbon steel; and Qin Y et al. [
13] applied XDLVO theory to integrate Lifshitz–van der Waals, Lewis acid–base, and electrostatic double-layer interactions into a unified force balance defining the safety temperature boundary after shutdown. Despite this progressive refinement from empirical observation to interfacial thermodynamics, a critical gap persists: all of the aforementioned adhesion studies were conducted in horizontal configurations. In inclined pipes, the tangential component of buoyancy introduces a driving force for deposited gel to slip along the wall—a coupled adhesion–slip problem that has not been systematically addressed.
The transport of gelled oil particles in a water-filled inclined pipe draws on the broader physics of liquid–liquid two-phase flow yet extends beyond it in important respects. The foundational hydrodynamic framework for dispersed-phase transport was established by Clift et al. [
14], whose drag coefficient correlations remain the reference for terminal velocity calculations. Building on this, Xiao [
15] developed theoretical models for oil droplet rise in quiescent water, and Liu et al. [
16] extended the analysis to gelled crude oil particles, demonstrating through numerical simulation that particle deformation under hydraulic transport is governed by the competing effects of internal yield stress and external hydrodynamic shear. Han et al. [
17] further showed that oil droplet spreading dynamics on solid substrates vary strongly with surface wettability, implying that the post-collision behavior of a gelled particle at the pipe wall—adhesion, slip, or rebound—depends on the coupled physicochemical properties of the gel and the substrate. For inclined pipes specifically, the phase distribution becomes asymmetric: water preferentially wets the lower wall while oil accumulates near the upper generatrix [
18], yet existing inclined-pipe studies have focused almost exclusively on steady flowing conditions, leaving the quiescent cooldown period—during which gravity-driven phase segregation and wax gelation occur simultaneously—insufficiently characterized.
The restart difficulty of a gelled pipeline is ultimately governed by the mechanical strength of the wax gel that forms during shutdown. As comprehensively reviewed by Yin X N et al. [
19], the causal chain from wax molecular precipitation through crystal network formation to a space-spanning yield stress is now qualitatively well established, though quantitative linkages between successive stages remain under active investigation. A convergent finding across multiple studies is that the gel yield stress is controlled not by the total precipitated wax mass alone, but by the coupled influence of wax molecular composition—particularly the long-chained n-alkane fraction—and the thermal history experienced during cooling [
20,
21]. The presence of a dispersed water phase, characteristic of high-water-cut conditions, introduces additional complexity: water droplets serve as nucleation sites that alter the wax crystal network topology [
22], and the resulting gel yield stress varies non-monotonically with water volume fraction and droplet size distribution [
23]. Li Y H and Zhao [
24] further showed that crude oils differing in asphaltene content develop gels of markedly different strength under identical cooling protocols, implicating interfacial active species in mediating wax–water connectivity. On the rheological modeling front, the classical description treats gelled oil as a viscoplastic material with a well-defined yield stress [
25]; however, real waxy gels deviate from this ideal in that yielding is a progressive structural degradation process rather than a singular event [
26,
27]. Zhao et al. [
28] captured the axial stress localization accompanying gel breakdown through a strain-dependent viscosity correlation, and Bao [
29] incorporated viscoelastic and thixotropic effects into a modified constitutive framework, which Bao and Zhang [
30] subsequently applied to numerically simulate the spatial propagation of gel breakdown during pipeline restart. Fakroun and Benkreira [
31] provided the experimental linkage between laboratory rheological parameters and field-scale restart pressure through dimensionless scaling.
From an engineering perspective, Zhang et al. [
32] developed a restart-pressure calculation method integrating hydrostatic head, frictional pressure drop, and thixotropic contributions, validated against field data. Jing et al. [
5] and Li et al. [
4] independently demonstrated through pipeline-scale experiments that shutdown duration and pipeline inclination govern not only the degree of gelation but also the extent of gravitational oil–water-phase segregation. Yin et al. [
33] further showed that even for the idealized water-ring transport geometry, the restart-pressure drop evolves with time in a manner dependent on the gel’s prior shear and thermal history. On the numerical side, Kumar and Paso [
34] established that gel compressibility and thermal contraction are the dominant factors controlling pressure propagation velocity during non-isothermal restart. Tikariha and Sanyal [
35] extended the restart analysis to vertical riser geometries, and Ventura and Guimarães [
36] recently quantified the sensitivity of restart pressure to cooling rate and minimum shutdown temperature. A consistent insight from these numerical studies—with direct significance for the present work—is that the restart pressure is most sensitive to the gel yield stress in the near-wall region where flow first initiates, rather than to the volume-averaged gel strength.
The aforementioned studies clearly demonstrate the achievements that have been made to date, as summarized in
Table 1. Meanwhile, they also reveal several unresolved challenges that require further investigation. Wall adhesion is now reasonably well understood for horizontal pipes [
1,
3,
10,
11,
12,
13], and restart pressure can be estimated with engineering accuracy for single-phase gelled pipelines through combined yield stress measurement and numerical simulation [
5,
30,
31,
32,
33,
34,
35,
36]. The critical lacuna—and the focal point of the present study—is the behavior of gelled oil in the inclined, water-filled pipe segments that constitute the operational reality of onshore gathering networks. Specifically, the mechanical condition governing slip initiation of a gelled oil mass on an inclined pipe wall has not been reduced to a quantitative criterion: the constituent forces—net buoyancy along the pipe axis, gel–wall adhesion, and lubrication-mediated friction—have each been studied in isolation, but their synergistic action at an inclined boundary remains an unsolved mechanics problem. Furthermore, the post-initiation behavior—whether the gelled oil creeps, slides intermittently, or accelerates toward the pipe high point—has not been classified into distinct dynamical regimes, making it impossible to predict whether a given shutdown scenario will result in tolerable accumulation or complete blockage. Compounding these particle-scale uncertainties, none of the existing restart models accounts for the localized gel concentration at pipeline high points resulting from buoyancy-driven slip because they assume, without exception, a spatially uniform gel distribution. Bridging this multi-scale gap—from particle-level force balance through slip regime classification to system-level restart-pressure prediction—demands an integrated experimental, mechanical, and computational approach that has not been previously attempted.
Therefore, this paper takes gelled crude oil particles in high-water-cut inclined pipelines as the research object. Through laboratory experiments, mechanical analysis, and numerical calculation, it systematically studies the floating and slip behavior of gelled oil, establishes a prediction model for critical slip temperature, and develops a software tool for restart-pressure calculation. The research results aim to provide theoretical support and engineering tools for the safe shutdown and restart of gathering systems in high-water-cut oilfields.
The main innovations of this study are summarized as follows:
- (1)
A mechanistic innovation in assessing the slip behavior of gelled crude oil on inclined pipe walls. Through visualized experiments, this study systematically identifies three typical behaviors of gelled oil after floating to the inclined pipe wall, adhesion, adhesion–slip and bulk floating aggregation, and reveals the mechanical mechanism whereby the tangential component of net buoyancy drives slip while interfacial adhesion force and static friction resist slip.
- (2)
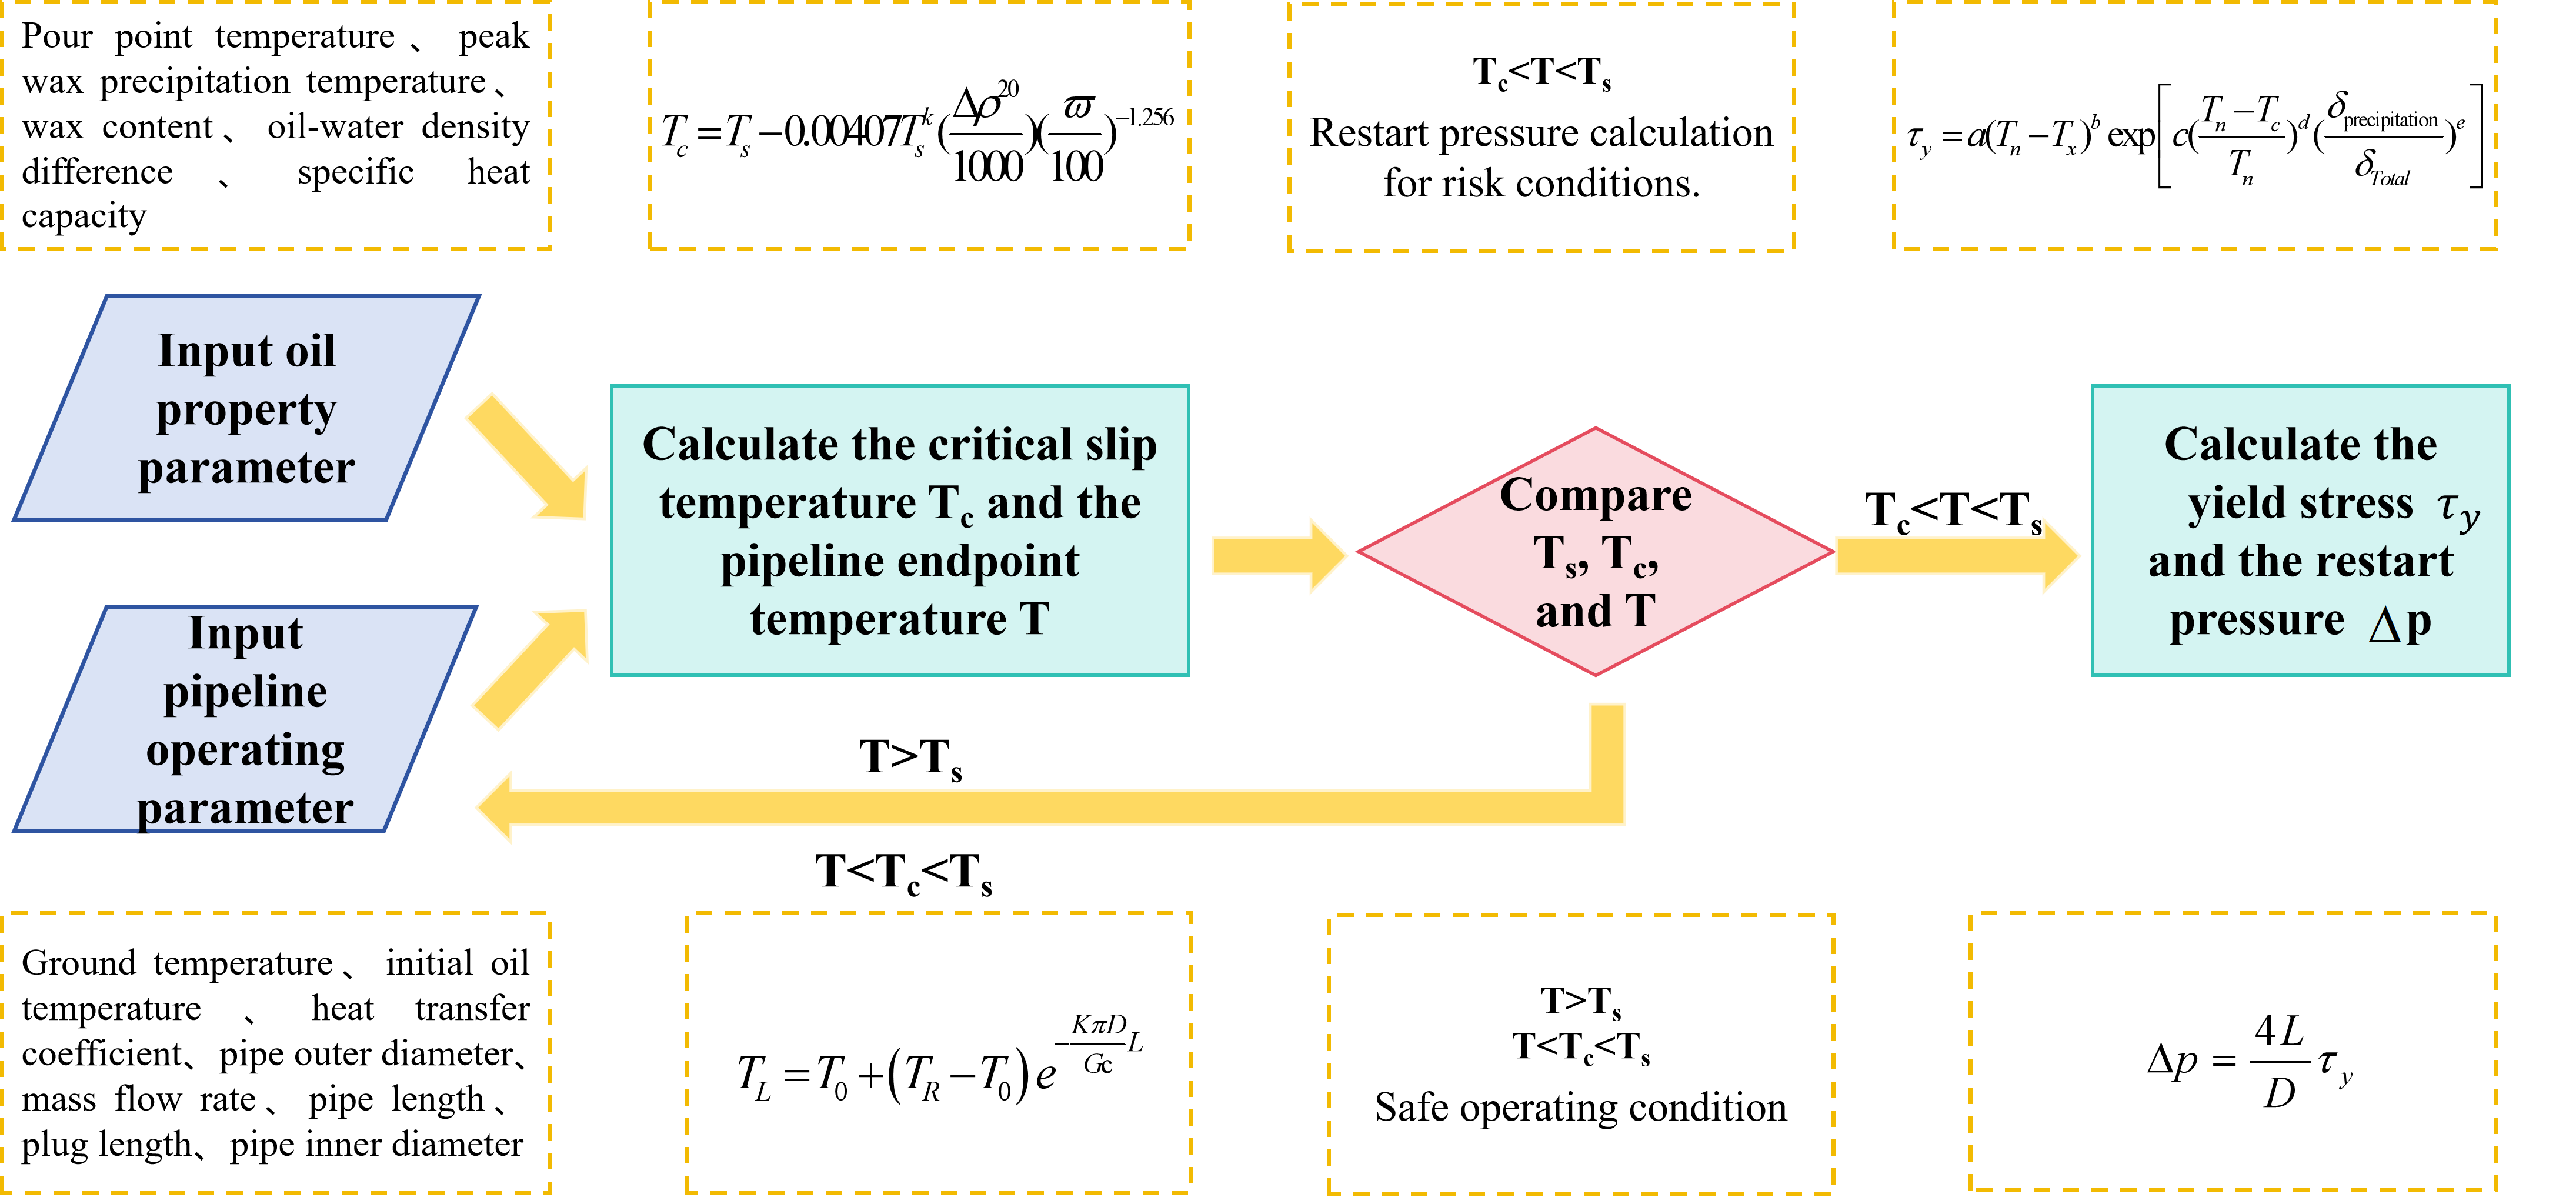
Engineering method and tool innovation for restart-pressure calculation. Coupling the Sukhov temperature-drop formula with the mechanical equilibrium equation of the gelled oil plug, this study proposes a complete calculation method for the restart pressure of high-water-cut inclined pipelines and develops dedicated calculation software integrating thermal calculation, yield stress determination, restart-pressure calculation and slip risk assessment.
3. Results
3.1. Gelled Oil Slip Experiment Results and Mechanical Analysis
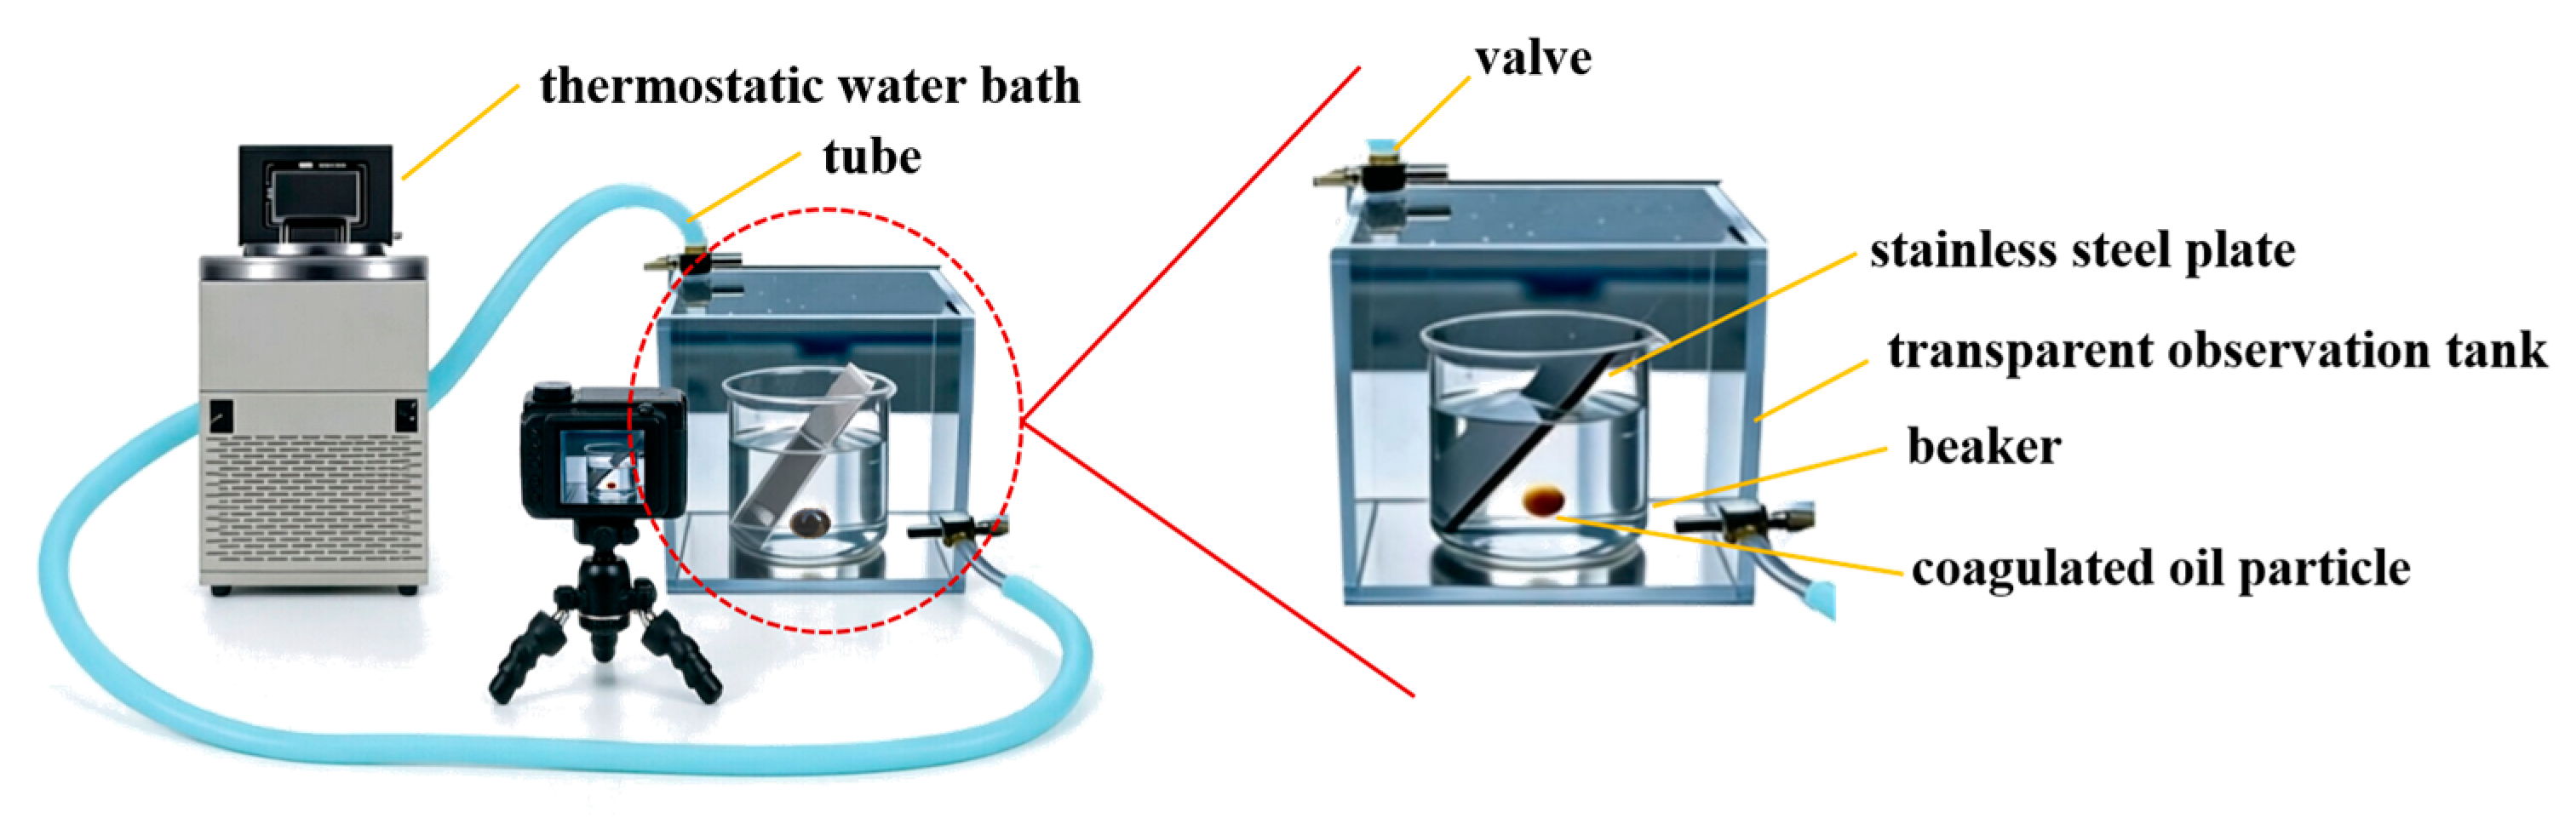
Floating and slip experiments were conducted on four oil samples (1#–4#) at temperatures below their respective gel points. The observed phenomena, classified as adhesion, adhesion–slip, or floating aggregation, are summarized in
Table 4.
Table 4 shows that the critical slip temperatures for each oil sample are: 33 °C for oil 1# (2 °C below its gel point), 29 °C for oil 2# (2 °C below its gel point), 36 °C for oil 3# (1 °C below its gel point), and 37 °C for oil 4# (1 °C below its gel point). Statistics indicate that the critical slip temperature is generally in the range of 1–3 °C below the gel point.
The experimental results show that the occurrence of gelled oil floating and slipping requires two basic conditions: first, that the oil temperature is below its gel point, providing the basis for gelation; second, that the oil temperature is above a certain critical value, so that the gelled oil has not yet developed a sufficiently rigid structure and can still float and slip under buoyancy. In other words, gelled oil floating and slipping occur in the temperature range where the oil temperature is below the gel point but above the critical slip temperature. For a blocked section, if the actual temperature falls within this range, the gelled oil is prone to slip and accumulate, leading to a high blockage risk. If the actual temperature drops below the critical slip temperature, the gelled oil adheres stably on the inclined section, and the pipeline can be safely shut down.
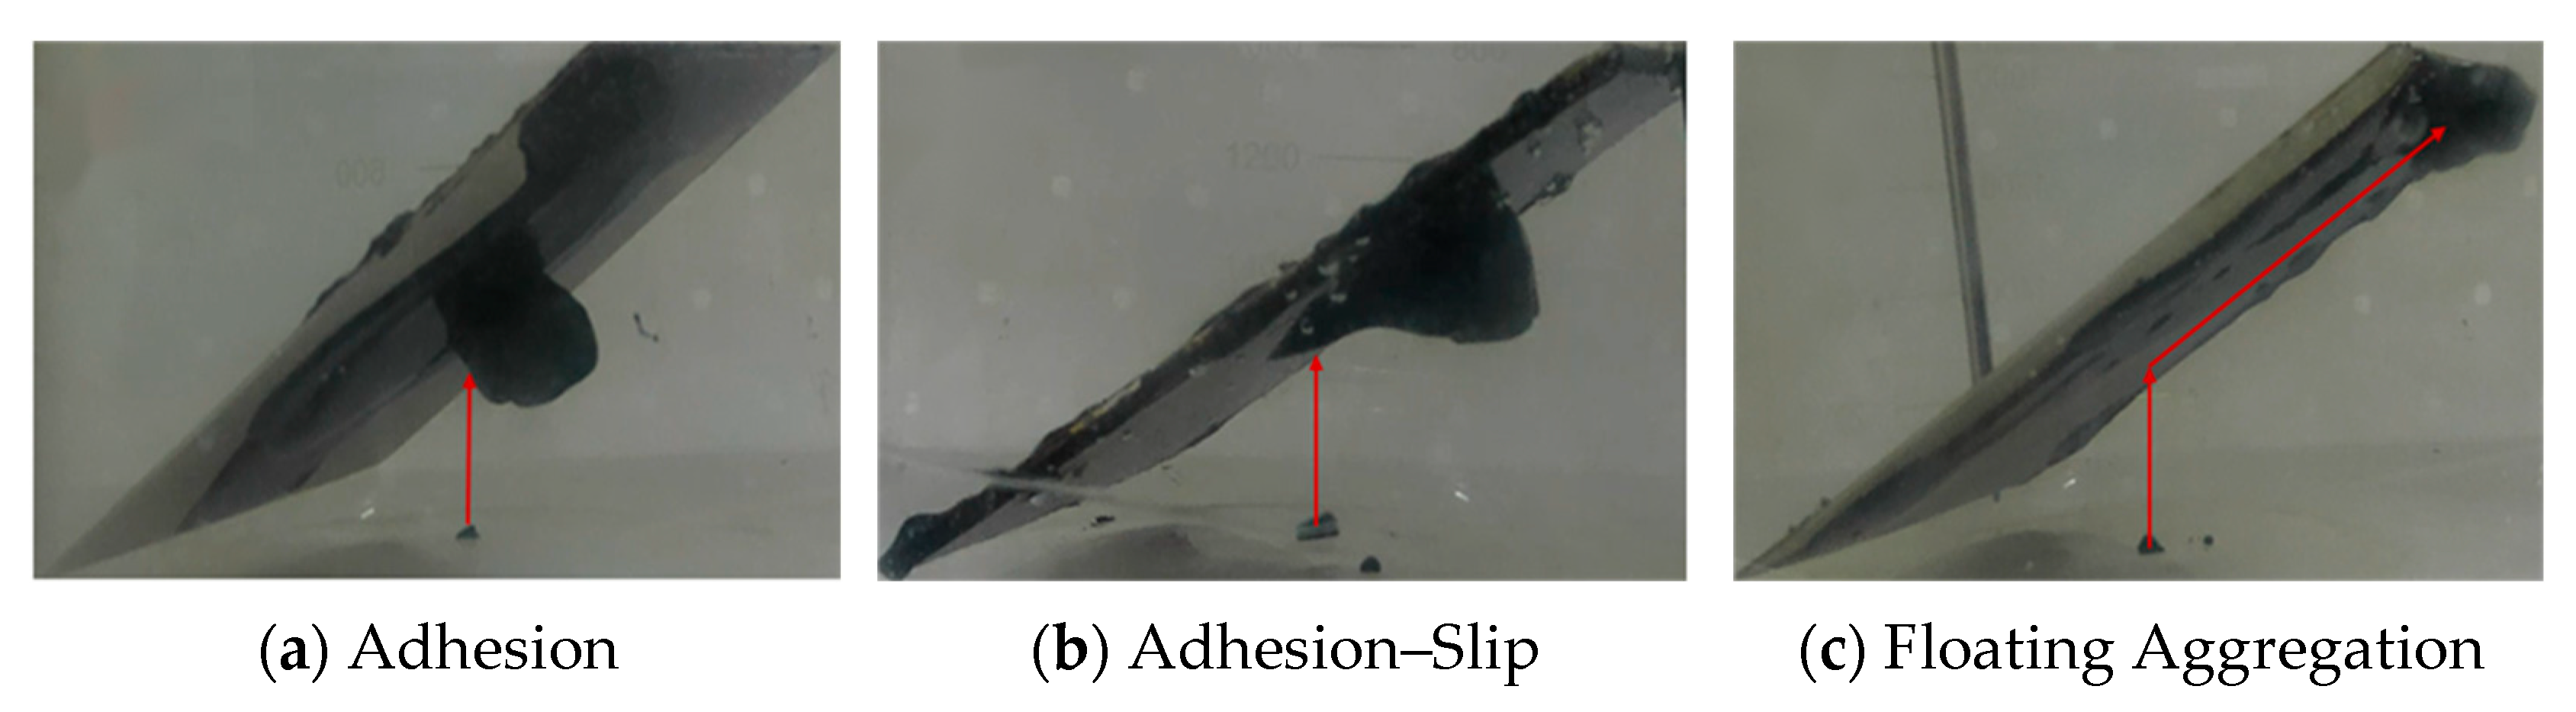
The behavior of gelled oil after floating to the pipe wall can be divided into three types (see
Figure 5): In the adhesion behavior, the gelled oil firmly adheres to the pipe wall without displacement, corresponding to a safe shutdown condition. In the adhesion–slip behavior, the gelled oil slowly and intermittently slips along the pipe wall, potentially converging towards the high point, corresponding to a risky condition. In the floating aggregation behavior, the gelled oil rapidly slips as a whole to the high point of the pipeline, forming a concentrated plug, corresponding to a risky condition [
52].
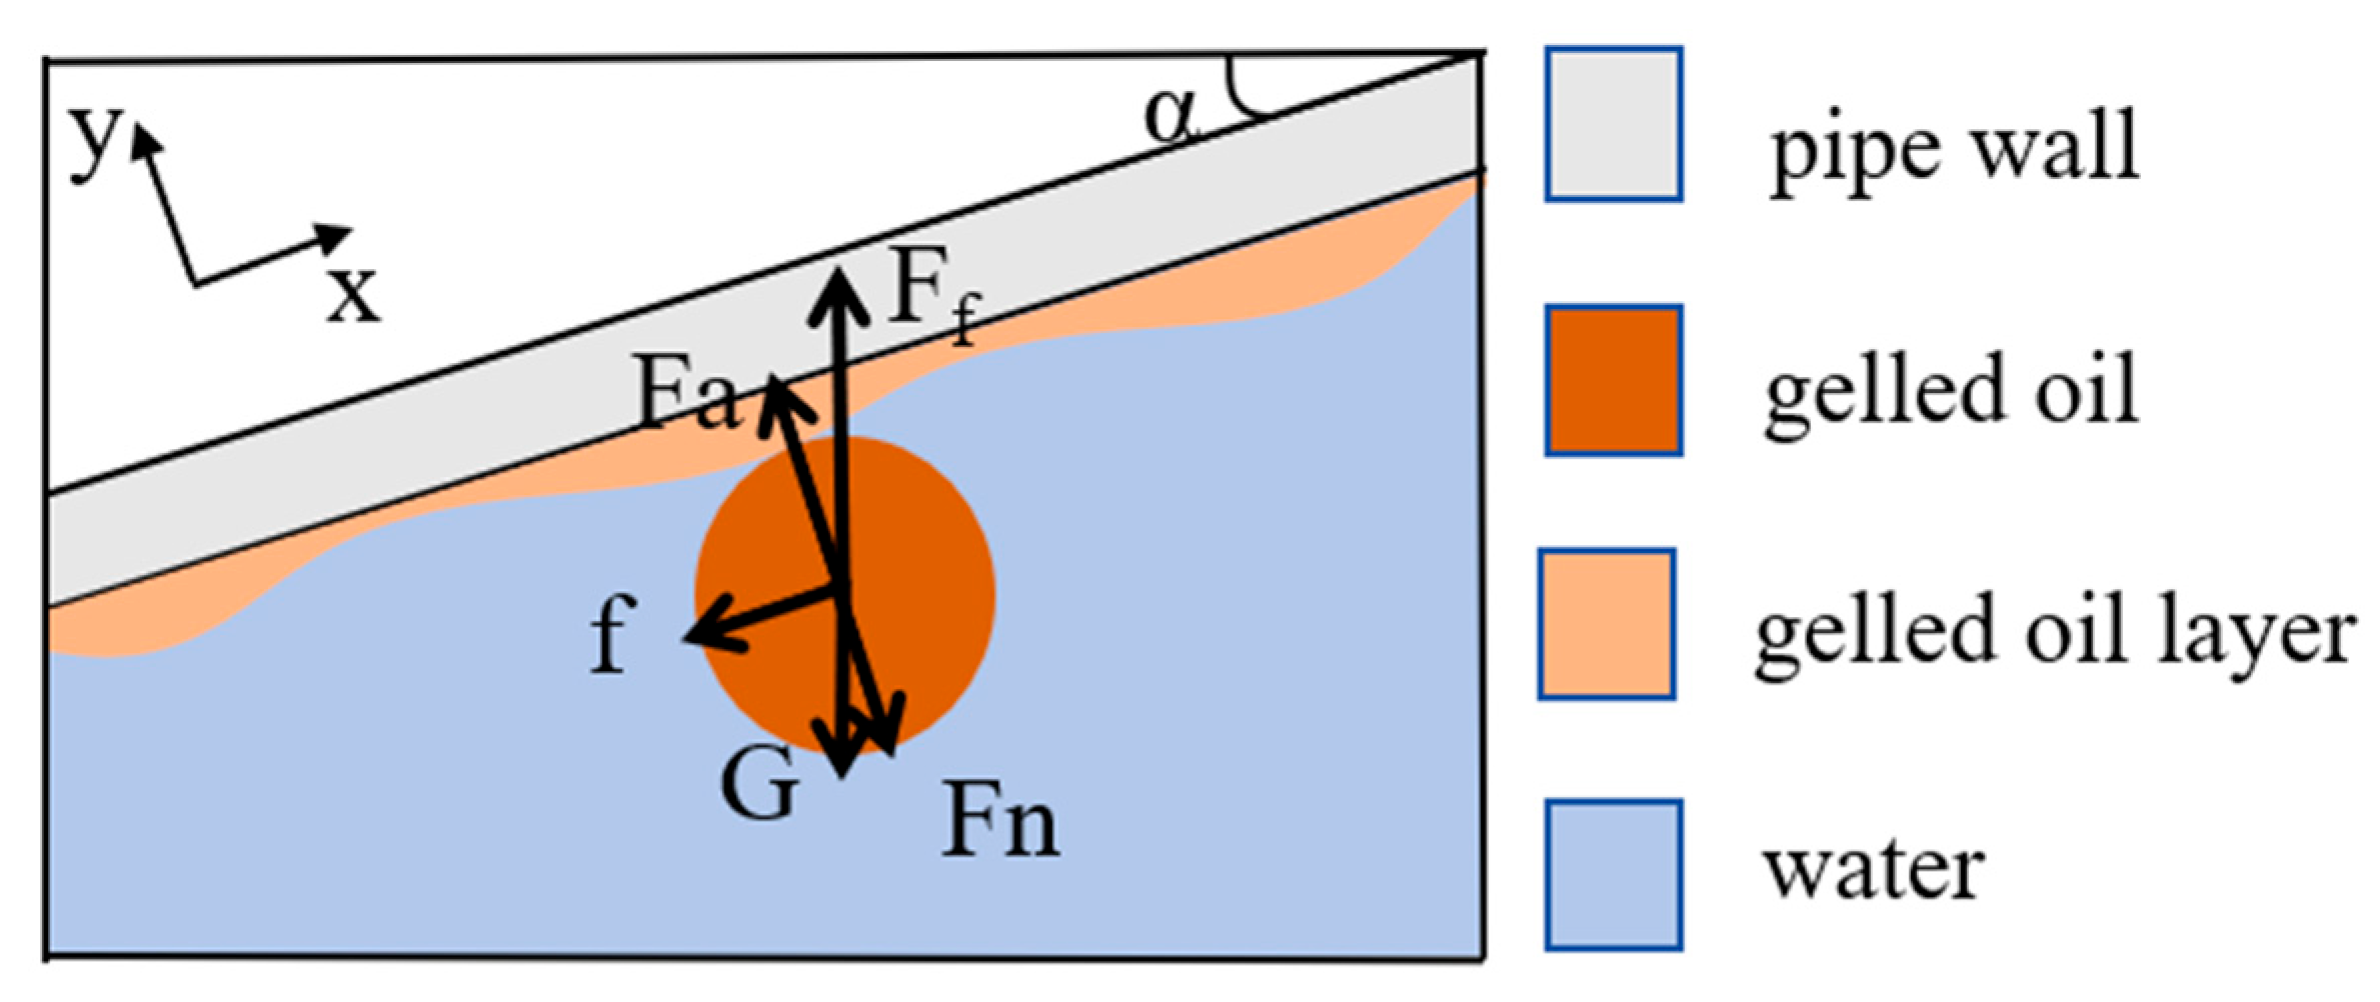
To reveal the mechanical mechanism of gelled oil slip, a force analysis is performed on the gelled crude oil particle adhering to the pipe wall (see
Figure 6). The gelled oil is assumed to be a standard sphere, and deformation is neglected. The upward direction along the pipe wall is taken as the positive
x-axis, and the direction perpendicular to the pipe wall upward is taken as the positive
y-axis.
The gelled oil is subjected to gravity G, buoyancy Ff, adhesion force Fa, normal support force Fn, and static friction f. The mechanical analysis indicates that the driving force for gelled oil slip originates from the tangential component of the net buoyant force, Fg, while the resistance comes from the support force and adhesion force from the pipe wall.
3.1.1. Surface Free Energy and Adhesion Force Calculation
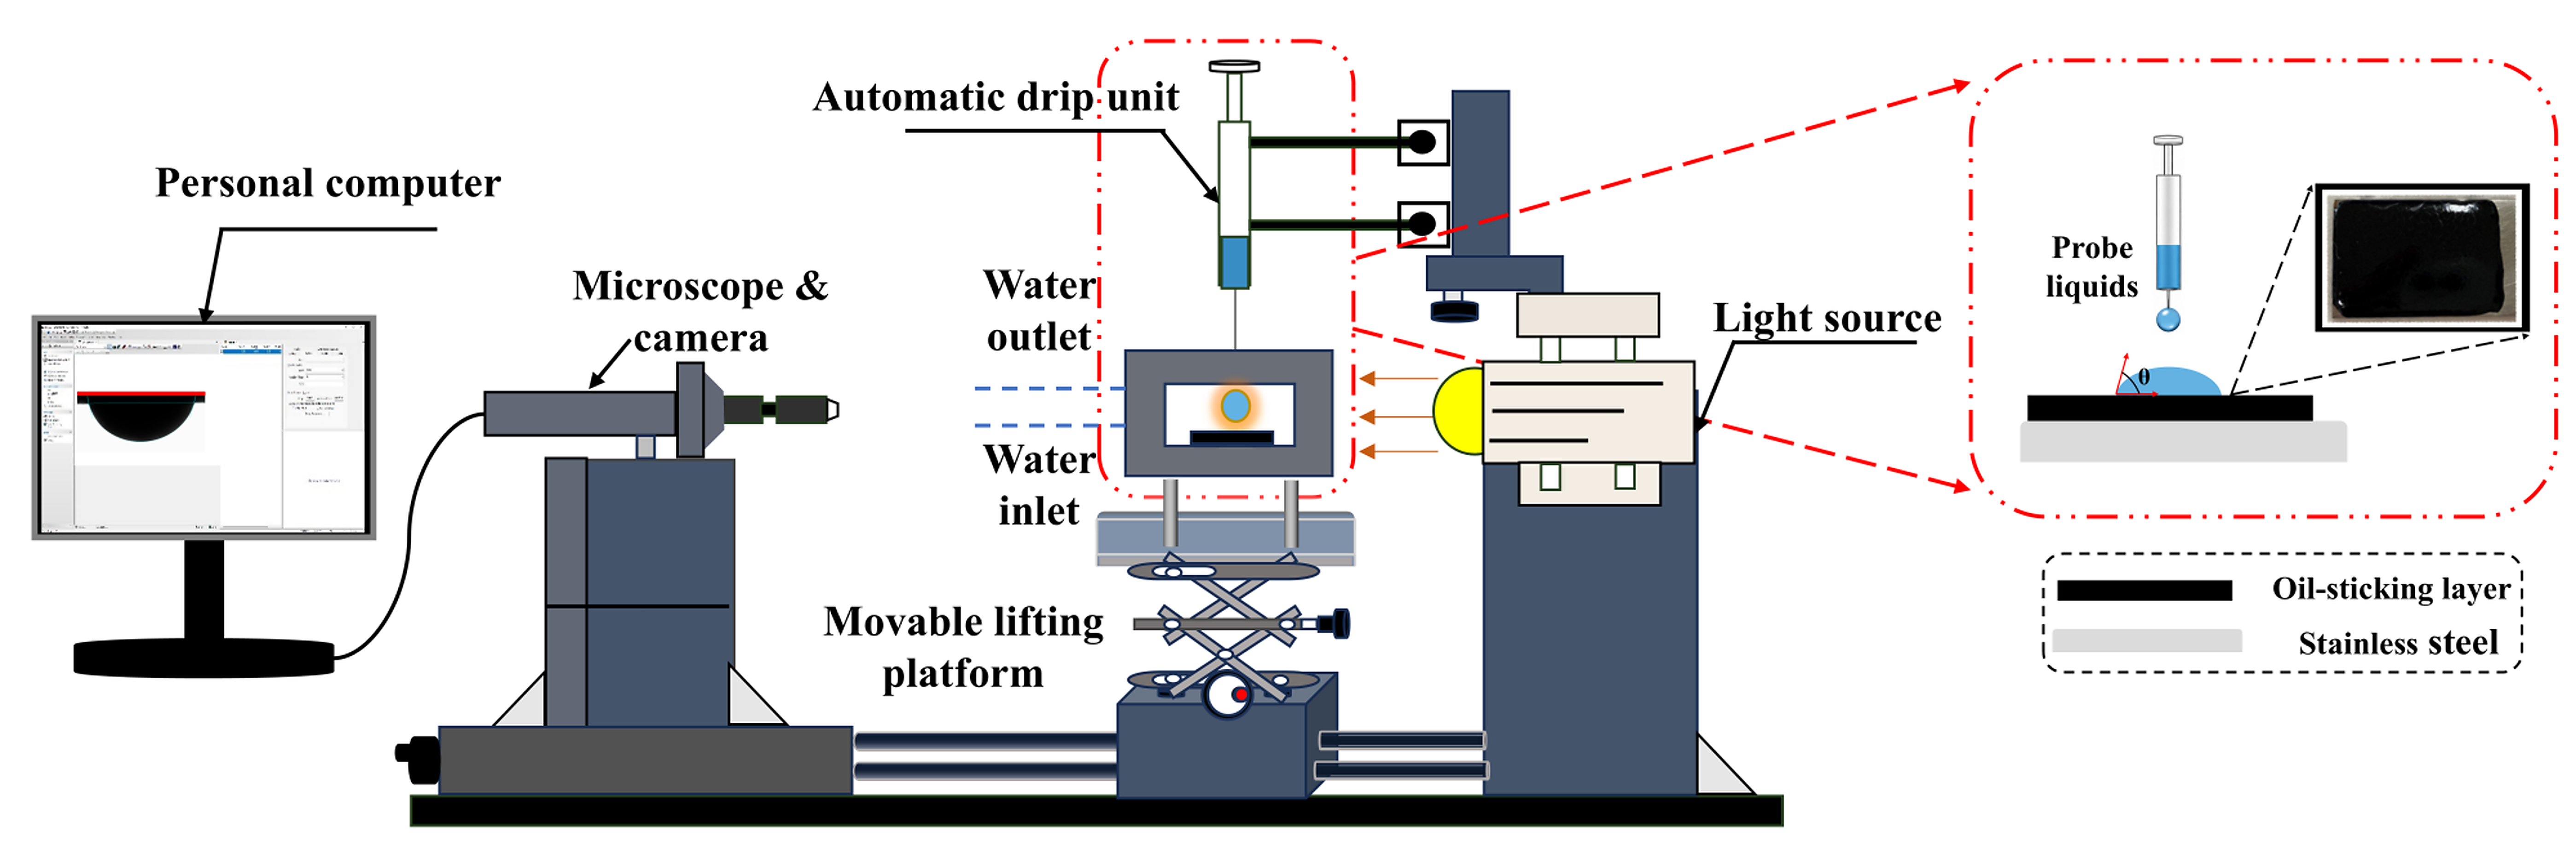
To quantify the interfacial interactions governing gelled oil adhesion and slip, the adhesion force between the gelled oil particle and the pipe wall was systematically analyzed. The calculation procedure involves three steps: (1) measurement of contact angles of probe liquids on the test surfaces, (2) determination of surface free energy components using the van Oss method, and (3) calculation of the work of adhesion and adhesion force based on the XDLVO theory. To calculate the adhesion force for oil samples 1#–4#, the contact angles of three probe liquids—deionized water, glycerol, and diiodomethane—on the surface of the gelled oil layer and on the stainless-steel plate were measured at the critical slip temperature using the sessile drop method. The measured contact angles are presented in
Table 5.
Based on the measured contact angles, the surface free energy components of each test solid surface were determined using the van Oss–Chaudhury–Good method. According to the van Oss–Chaudhury–Good surface-energy theory [
53], the total surface free energy of a solid is decomposed into the Lifshitz–van der Waals and Lewis acid–base components:
where
γ+ and
γ− are the electron-acceptor and electron-donor parameters, respectively. The calculated surface free energy components for the gelled oil layer and the stainless-steel plate are summarized in
Table 6.
For two solid surfaces interacting across a water medium, the total XDLVO work of adhesion was calculated as the sum of the Lifshitz–van der Waals and Lewis acid–base contributions, following the van Oss–Chaudhury–Good formulation [
53,
54]:
In Equation (8), the subscripts “O”, “S”, and “W” denote the gelled oil layer, stainless-steel surface, and water medium, respectively.
The calculated work of adhesion values is summarized in
Table 7. According to the XDLVO theory, the acid–base (AB) interaction is the dominant contribution to the adhesion between the gelled oil and the pipe wall.
The adhesion force characterizes the ability of gelled crude oil particles to adhere to the gelled oil layer on the pipe wall. A larger adhesion force indicates stronger adhesion, making the particle less likely to slip during shutdown. Conversely, particles with a smaller adhesion force are more prone to slip and accumulate at the high point of the pipeline.
3.1.2. Axial Force Analysis
In
Figure 5, taking the upward direction along the pipe wall as the positive
x-axis, the force in this direction is called the axial force; taking the direction perpendicular to the pipe wall upward as the positive
y-axis, the force in this direction is called the normal force. When the axial force
Fx > 0, the gelled oil particle slips upward along the pipe wall. By resolving the net buoyant force along the inclined wall and substituting Equations (1)–(3), the axial resultant force was derived in the present study as
When
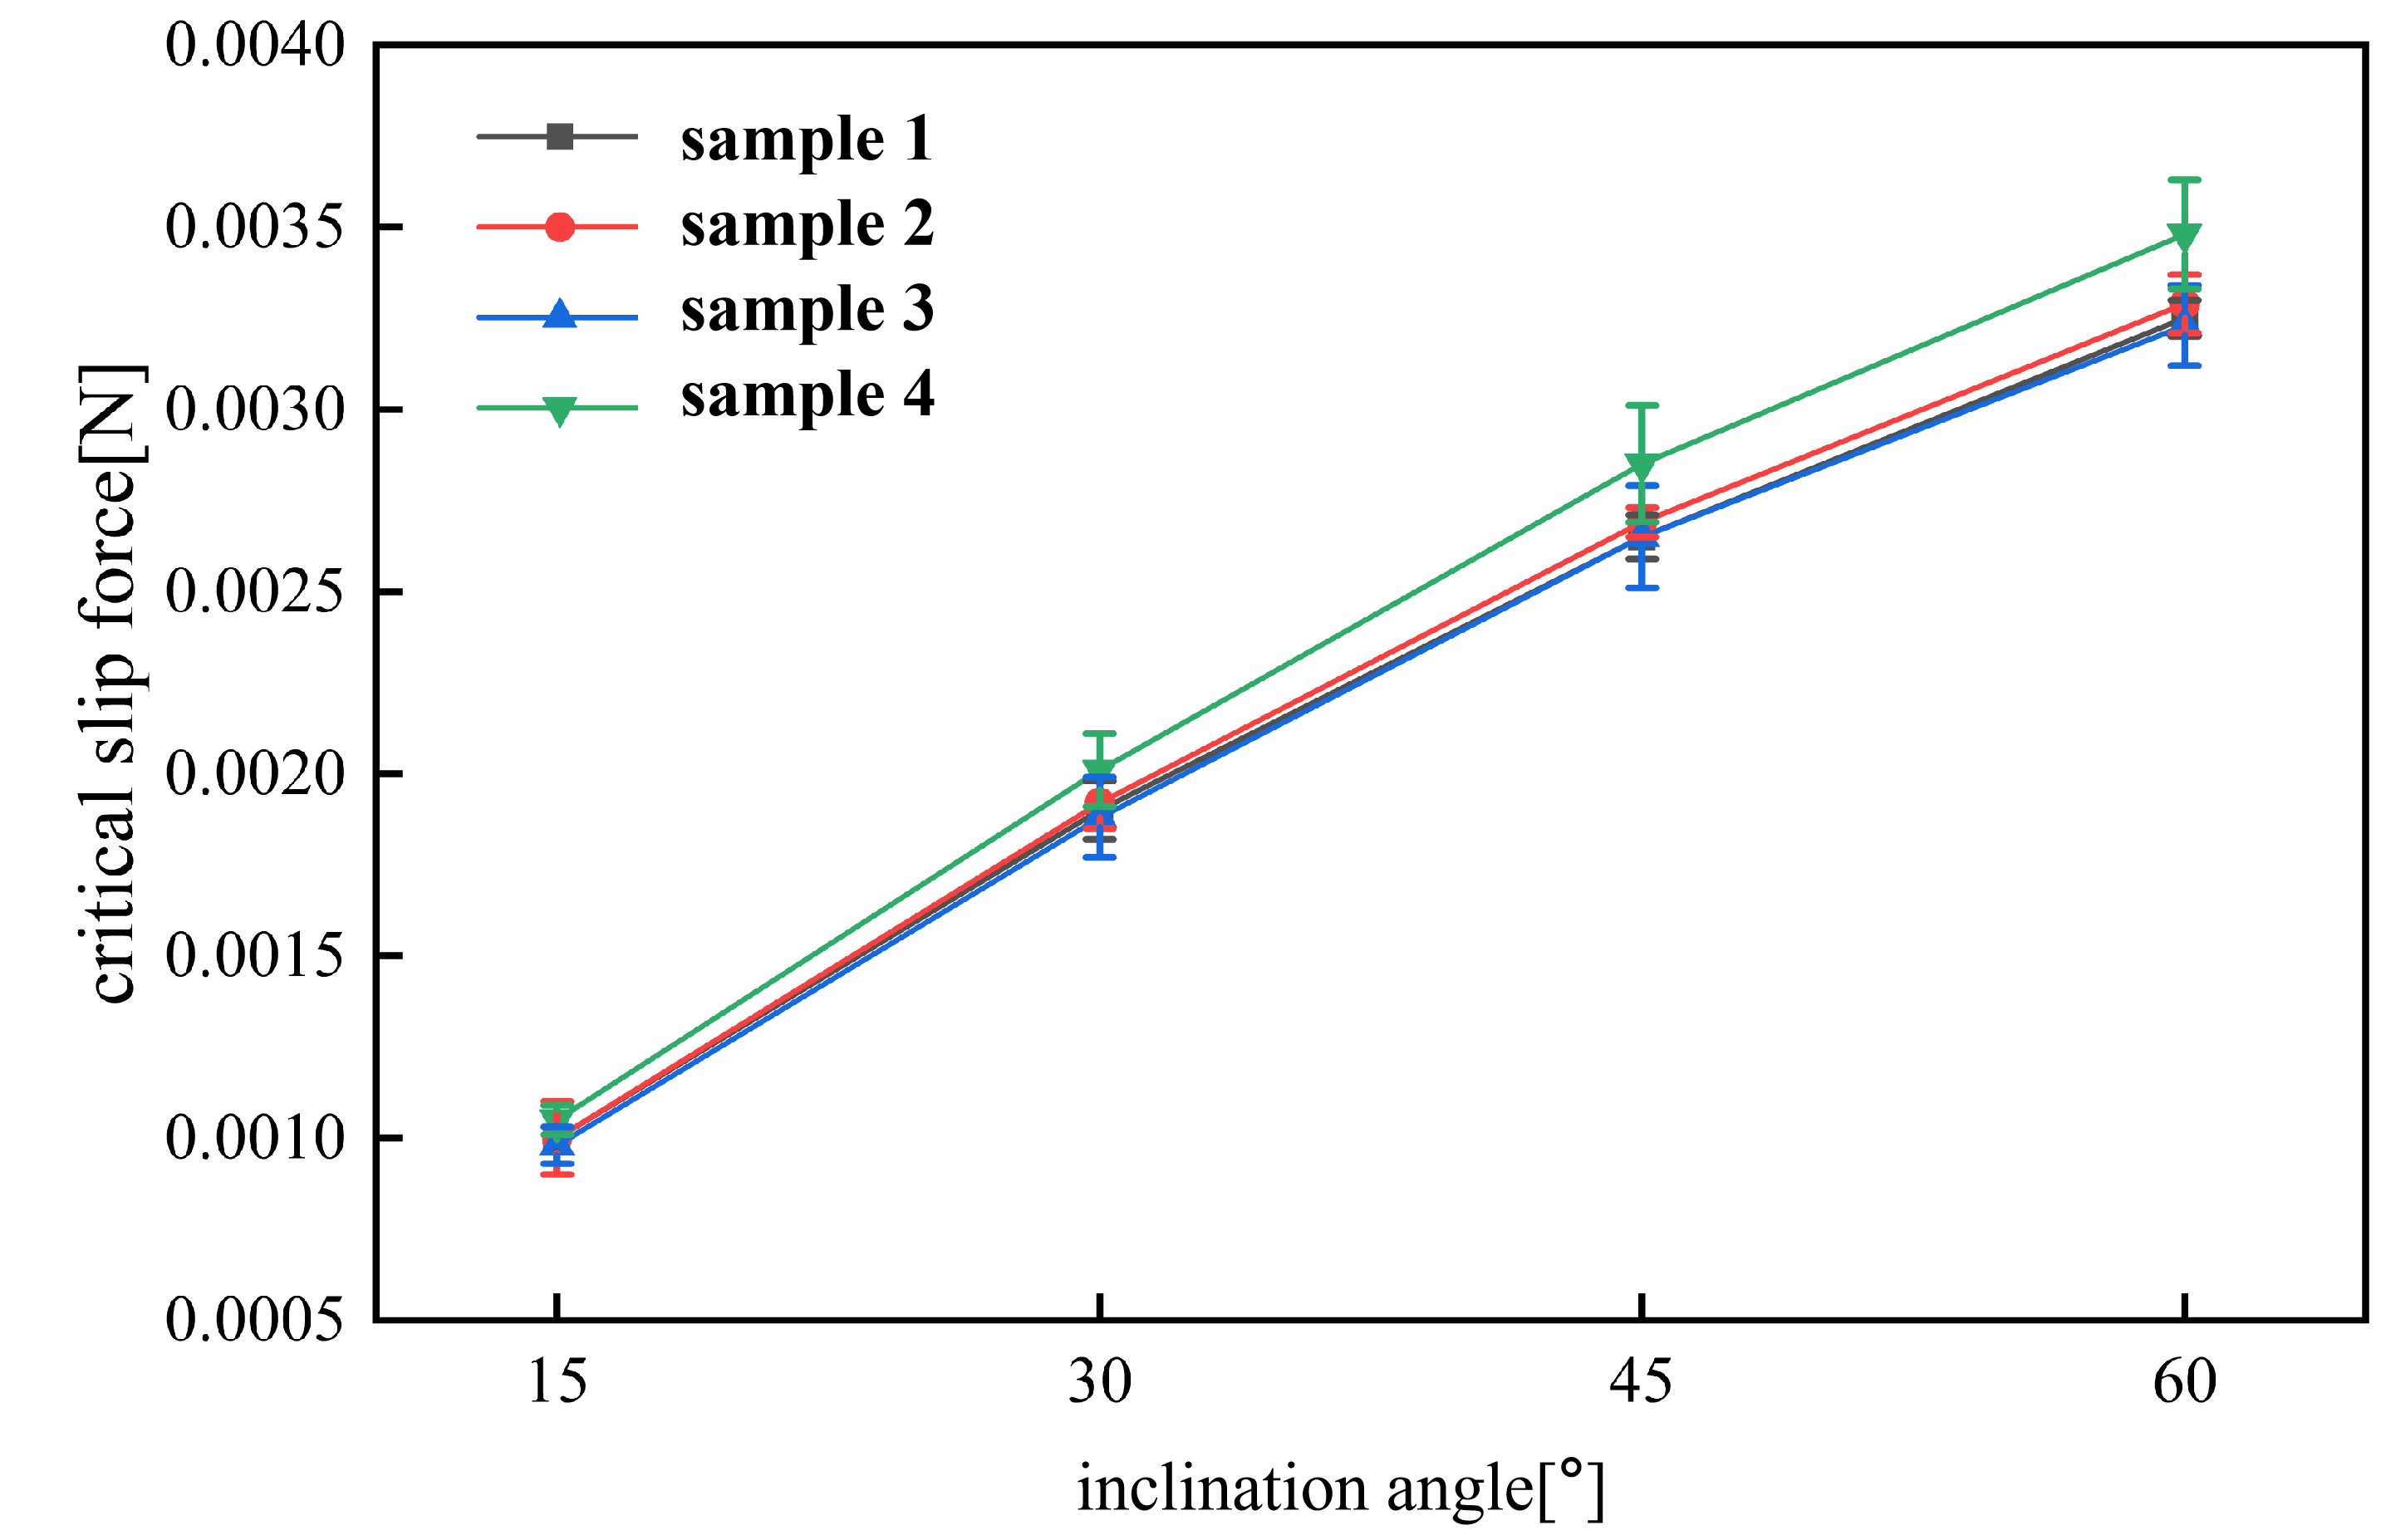
Fx > 0, the gelled oil particle initiates slip along the pipe wall. However, the theoretically calculated critical condition does not perfectly correspond to the experimentally measured critical slip temperature due to the finite sensitivity of macroscopic displacement detection. The experimentally observed critical slip temperature, determined by the onset of visible displacement of the gelled oil, is therefore slightly higher than the theoretical critical value. Using Equation (9), the axial forces for oil samples 1#–4# at their respective critical slip temperatures were calculated for inclination angles of 15°, 30°, 45°, and 60° (see
Figure 7).
The calculated results show that for all oil samples, the axial force, Fx, increases with increasing inclination angle. For example, for oil sample 1#, Fx rises from 0.0010 N to 0.0032 N, an absolute increase of 0.0022 N. For the same oil sample, with a constant particle diameter and density, the tangential component of the net buoyant force increases with angle, resulting in a larger axial driving force. The error bars increase slightly with inclination angle, indicating that the propagated variability in the experimental input parameters becomes more pronounced as Fx increases; however, their relatively limited magnitude does not alter the overall monotonic increasing trend.
Force analysis indicates that the pipeline inclination angle, θ, affects both the driving force (proportional to sinθ) and the normal force (proportional to cosθ), which in turn influences the static friction. As θ increases, sinθ increases while cosθ decreases. The combined effect results in a nonlinear increase in Fx with θ. In the lower inclination range, the increase in driving force dominates, leading to a rapid rise in Fx. At higher inclinations, the reduction in normal force and associated friction partially offsets the increase in driving force, resulting in a slower rate of increase in Fx.
The dominant uncertainty in the measured critical slip temperature arose from the 1 °C temperature interval used near the transition boundary and the finite sensitivity of the visual criterion used to identify the onset of particle displacement. These contributions were more significant than the temperature-control accuracy of the water bath (±0.01 °C). Accordingly, the experimental resolution of the critical slip temperature was approximately ±0.5 °C. Secondary uncertainty sources included irregularities in particle shape, ImageJ spatial calibration and boundary identification, between-droplet variation in the contact-angle measurements, and possible nonuniformity of the pre-coated gelled oil layer [
55,
56]. Repeated slip tests, six ImageJ determinations for each oil sample, and replicate contact-angle measurements were used to reduce and quantify these random contributions.
The experimental apparatus was designed to isolate the local quasi-static flotation, adhesion, and slip-initiation behavior of a gelled oil particle on an inclined stainless-steel surface, rather than to provide a geometrically scaled simulation of an entire pipeline. In the local force-balance model, particle diameter and wall inclination are included explicitly, whereas pipe diameter is not a direct parameter. Nevertheless, in an actual pipeline, pipe diameter and wall curvature may affect oil–water redistribution, confinement of the gelled oil particles, multiparticle accumulation, and the resulting restart pressure. Therefore, the measured critical slip boundary should be transferred only to systems with comparable crude oil properties, wall materials, inclination angles, and shutdown conditions. Application to pipelines with substantially different diameters or surface conditions requires additional validation.
3.2. Critical Slip Temperature Model
The critical slip temperature is the temperature limit below which the gelled oil begins to exhibit macroscopic slip along the pipe wall. Its value directly affects the shutdown safety assessment of high-water-cut inclined pipelines. Based on the experimental observations and mechanical analysis presented in the previous section, three key factors governing gelled oil slip were identified. The gel point is the characteristic temperature at which the oil loses fluidity, and the critical slip temperature must be lower than the gel point. A larger oil–water density difference results in a larger net buoyant force and stronger tangential driving force, making slip easier. A higher wax content leads to a denser wax crystal network, greater yield stress, and stronger resistance to slip. These three factors were selected as the basic parameters for the prediction model. The model was regressed using the properties of oil samples 1# and 2#, and its accuracy was verified using oil samples 3# and 4#.
To eliminate dimensional effects and reflect physical laws, the following dimensionless quantities are defined:
The dimensionless slip temperature difference,
β, is used to characterize the relative difficulty of gelled oil slip, defined as
where
β is the dimensionless slip temperature difference;
Ts is the gel point in Celsius, °C;
=
+ 273.15, is the gel point in Kelvin, K; and
Tc is the critical slip temperature, °C. This ratio represents the relative magnitude of the slip temperature below the gel point. A larger difference between the gel point and the critical slip temperature indicates that the gelled oil can remain stationary over a wider temperature range below the gel point, meaning that the slip temperature is relatively lower. Conversely, a smaller difference indicates that the gelled oil slips just after falling below the gel point, meaning the slip temperature is relatively higher.
The dimensionless density difference reflects the relative magnitude of the buoyancy driving force. Taking the density of water as 1000 kg/m
3 as a reference, it is defined as
where Δ
ρ is the dimensionless density difference and Δ
ρ20 is the water-oil density difference at 20 °C, kg/m
3. From the previous analysis, the tangential component of the net buoyant force is proportional to the density difference. Therefore, Δ
ρ directly reflects the intensity of the driving force for gelled oil floating and slipping. A larger Δ
ρ results in a larger buoyancy force per unit volume of gelled oil and a stronger tangential driving force, making slip easier. Conversely, a smaller Δ
ρ results in a weaker driving force, making slip more difficult.
The dimensionless wax content converts the percentage wax content into a decimal, defined as Equation (12).
where
is the dimensionless wax content and
is the wax content of the oil, wt%. Wax content is a key parameter determining the gel strength of waxy crude oil. During cooling, wax crystals precipitate and form a three-dimensional network structure, giving the gelled oil yield stress and enabling it to resist external forces. The higher the wax content, the denser the wax crystal network, the greater the yield stress, and the stronger the resistance to slip. Therefore,
is a dimensionless measure of the structural resistance of the gelled oil. A larger value makes slip more difficult.
From the above analysis, the characteristic stress under critical slip conditions is proportional to
. Considering that the density difference variation range is limited, this paper assumes a linear relationship between the characteristic stress and
, while expressing the nonlinear effect of wax content in a power-law form, as shown in Equation (13).
where
A and
δ are constants. Taking natural logarithms on both sides and rearranging gives Equation (14).
For linear parameter estimation, the auxiliary variable Z was defined in the present study as
Using data from oils 1# and 2# at the critical slip temperature, the dimensionless parameters and Z values were calculated and are presented in
Table 8.
Linear regression of Z against yields δ = −1.256, lnA = −5.508, and A = 0.00407.
Substituting these values into Equation (13) and rearranging gives the final critical slip temperature prediction model:
Substituting the physical property parameters of oil samples 3# and 4# into the model, the predicted critical slip temperatures were calculated and compared with the experimental values. The predicted values for oil samples 1# and 2# are also listed to assess the model’s fit to the calibration data, as shown in
Table 9.
For oil samples 1# and 2#, which were used for parameter calibration, the absolute prediction errors were both 0.5 °C. For the two validation oils, the absolute errors were 0.6 °C for sample 3# and 0.1 °C for sample 4#. Across all four oils, the absolute errors ranged from 0.1 to 0.6 °C, with a mean absolute error of approximately 0.4 °C.
Although the agreement between the predicted and experimental values is encouraging, the present database is too limited to establish the general applicability of the correlation. In particular, only two crude oils were used to determine the two model coefficients, leaving insufficient statistical information to evaluate coefficient uncertainty, goodness of fit, or model robustness. Moreover, the two validation oils represent only a narrow range of crude oil properties and experimental conditions.
The proposed equation should therefore be regarded as a preliminary empirical correlation applicable only to crude oils with physicochemical properties and experimental boundary conditions close to those investigated in this study. The current samples cover gel points of 31–38 °C, densities of 866–869 kg/m3 at 20 °C, and wax contents of 16.39–21.68 wt%. The correlation has not been validated for crude oils with substantially different compositions, rheological characteristics, cooling or shear histories, particle-size distributions, wall materials, surface roughnesses, aqueous-phase properties, or inclination angles. Additional crude oil samples and independent experimental conditions are required before broader application of the model.
3.3. Restart-Pressure Calculation Results and Verification for High-Water-Cut Inclined Pipelines
After completing the design and development of the restart-pressure calculation software, verification was conducted to ensure the correctness of its theoretical model, the reliability of its algorithm implementation, and its applicability in actual engineering scenarios. The winter, spring–autumn, and summer operating conditions of Pipeline A in a certain oilfield were selected for verification, along with the relevant oil parameters.
The oil sample in Pipeline A has a gel point of 38 °C, a density of 869 kg/m
3, a wax peak temperature of 26.92 °C, a total wax content of 21.66 wt%, and a specific heat capacity of 2010 J/(kg·K). The pipeline has a length of 4500 m, an inner diameter of 0.089 m, an inclination angle of 31°, and a water cut of 87%. The operating condition parameters are listed in
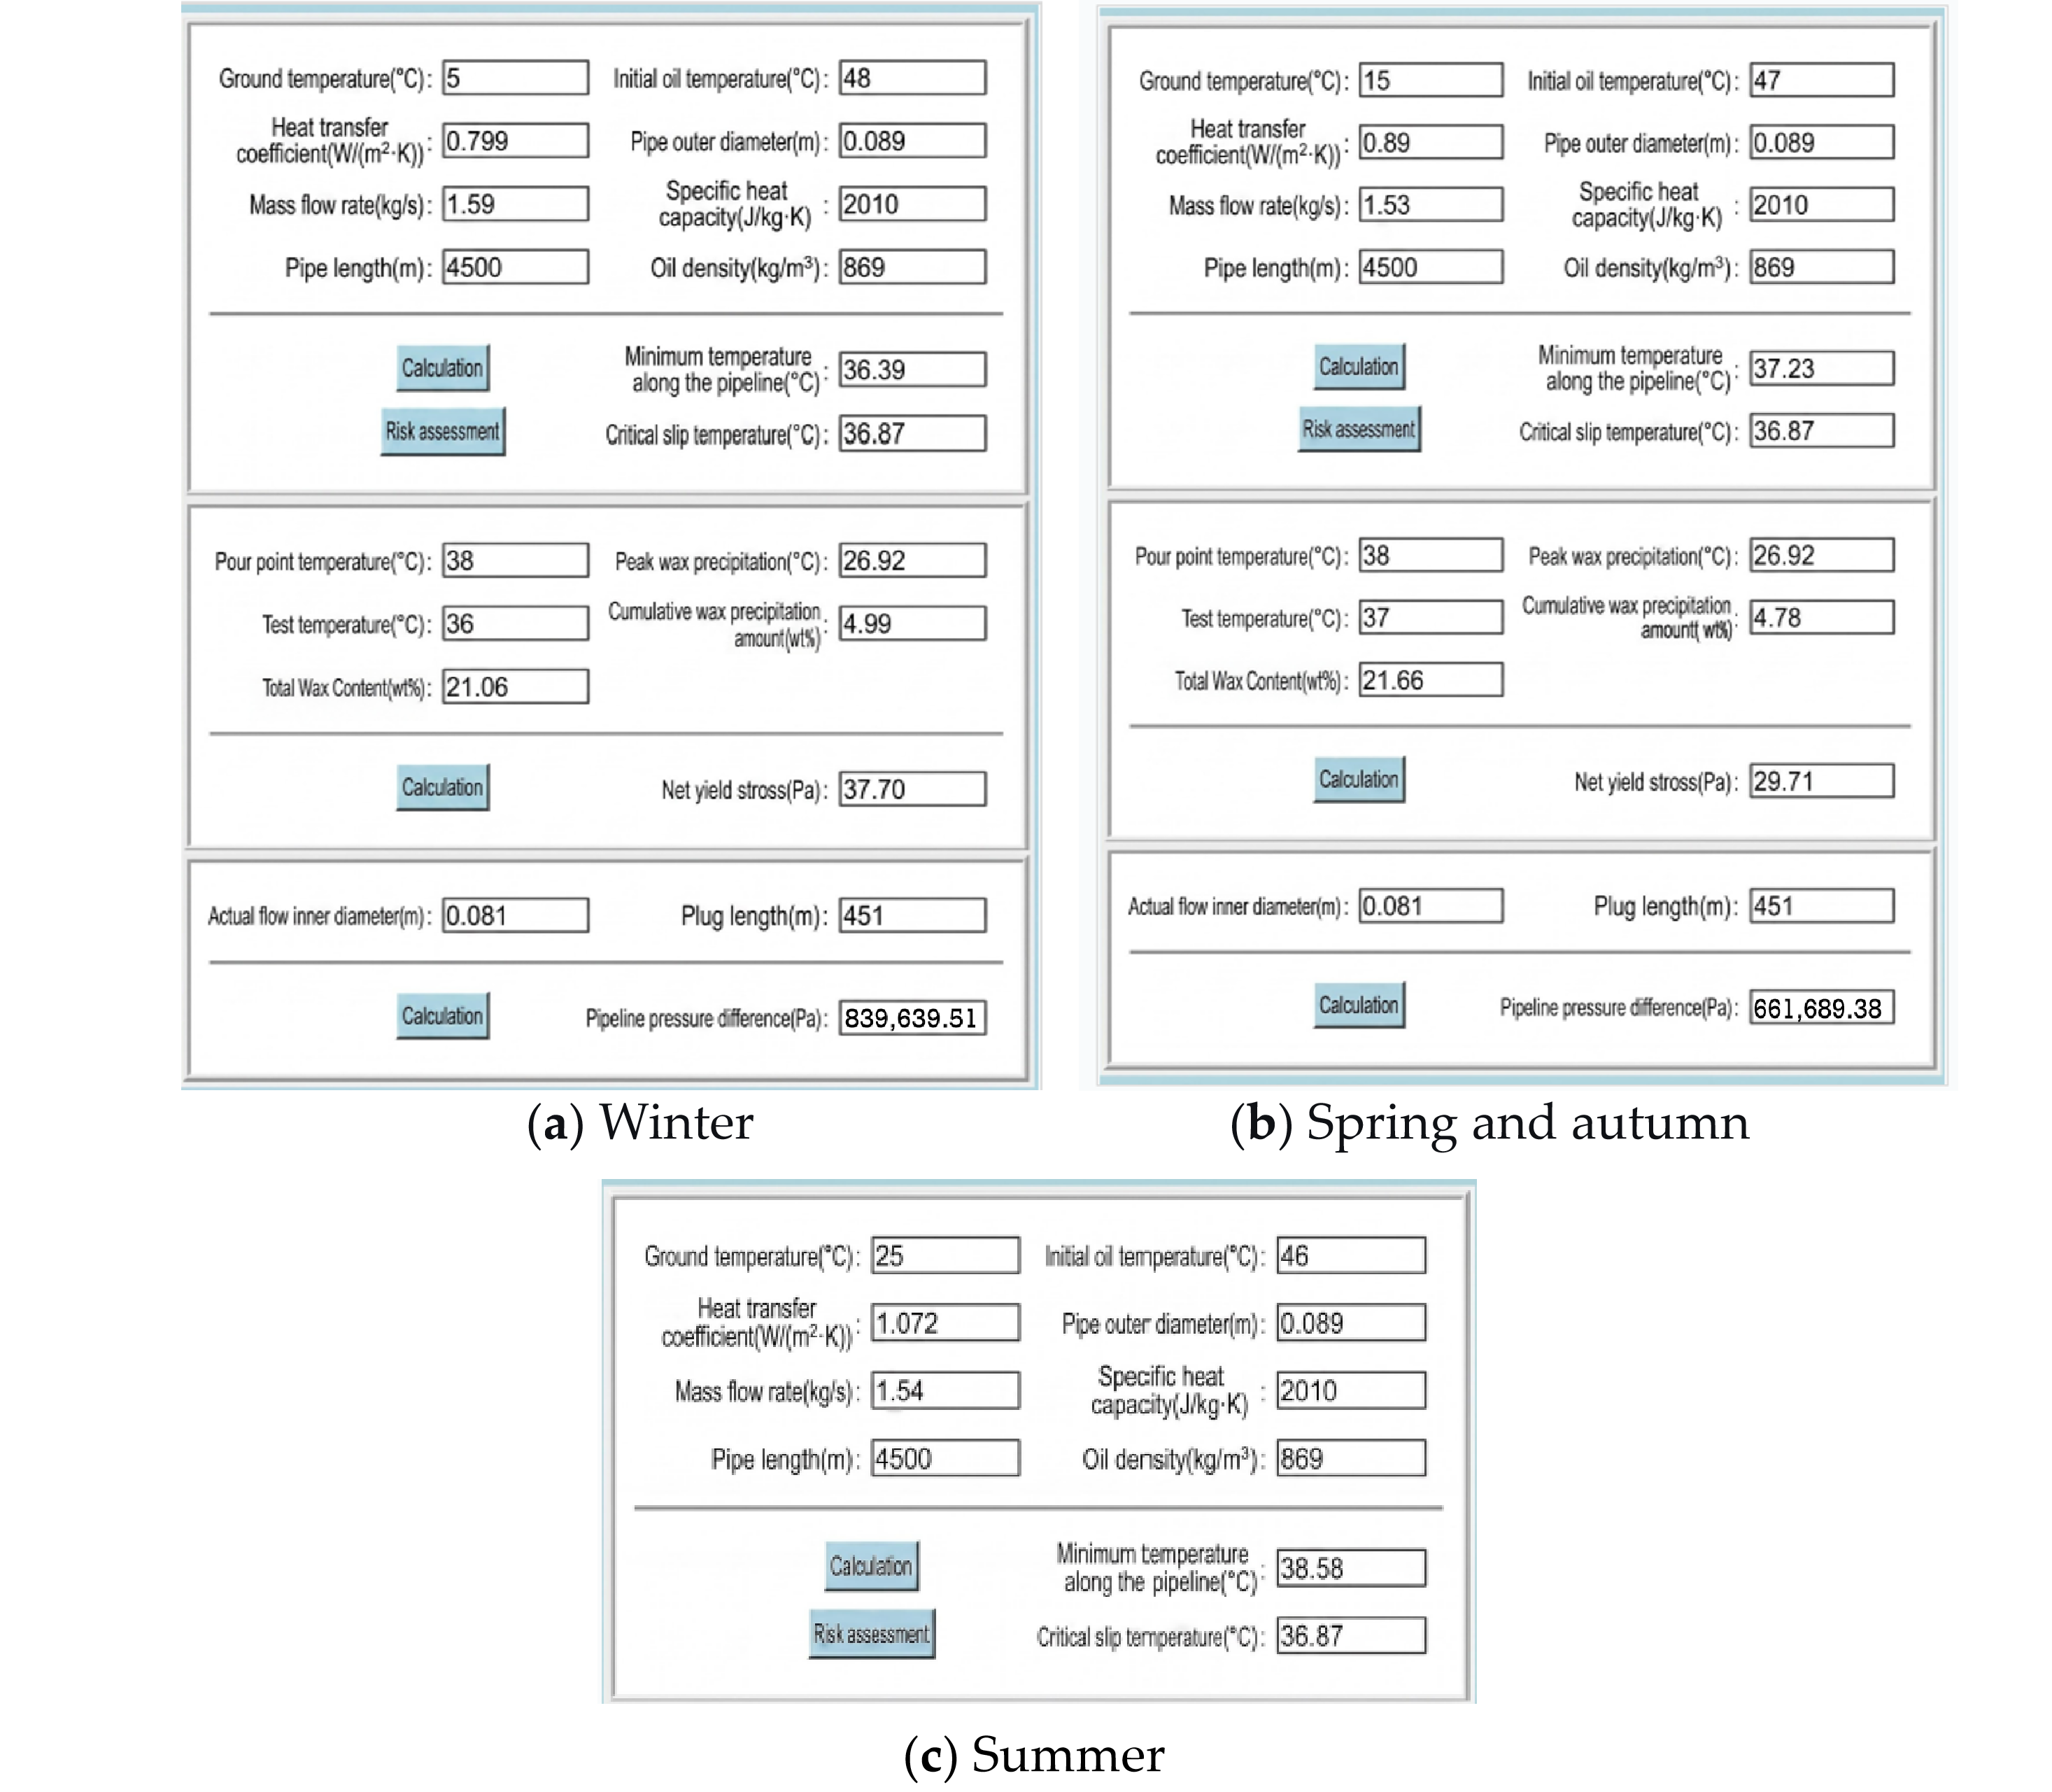
Table 10, and the calculation results are presented in
Figure 8.
The laboratory conditions reproduce the principal local features of the field shutdown condition, including a water-continuous environment, gelled oil particles, an inclined stainless-steel wall, and quasi-static thermal equilibration. The field pipeline considered in the engineering comparison had an inner diameter of 0.089 m, an inclination angle of 31°, and a water cut of 87%. Therefore, the laboratory experiments are representative of the local adhesion and slip-initiation mechanism in high-water-cut inclined gathering pipelines. However, the apparatus does not reproduce all full-scale effects. The field comparison should therefore be regarded as preliminary engineering support rather than a complete full-scale validation [
57].
For the winter condition, the minimum temperature along the pipeline is 36.4 °C, which is 0.5 °C below the critical slip temperature of 36.9 °C. According to the criterion established in
Section 3.1, the gelled oil should remain stably adhered under this condition. However, given the small margin and potential temperature fluctuations during long-term shutdown, a certain risk of pipe blockage cannot be completely ruled out. At the minimum temperature of 36.4 °C, the static yield stress is 37.70 Pa, and the calculated restart pressure is 0.84 MPa.
For the spring–autumn condition, the minimum temperature along the pipeline is 37.2 °C, and the critical slip temperature is 36.9 °C. Since the minimum temperature exceeds the critical slip temperature, this condition is classified as a risk condition. At 37.2 °C, the static yield stress is 29.71 Pa, and the calculated restart pressure is 0.66 MPa.
For the summer condition, the minimum temperature along the pipeline is 38.6 °C, which is above the gel point of 38 °C. Since the crude oil does not gel under this condition, there is no risk of gelled oil slip or blockage. This condition is therefore classified as no-risk, which is consistent with actual field observations where no pipe blockage occurred during summer operations.
The field test data were compared with the software predictions, and the results are summarized in
Table 11.
For the two field restart cases, the relative errors of the predicted restart pressures were 6.45% and 7.70%, with a maximum absolute error of 0.06 MPa. The remaining discrepancy is mainly associated with uncertainty in the blockage length and yield stress estimation, together with the simplified assumptions of one-dimensional steady heat transfer and simultaneous yielding of the gelled oil plug. These two cases provide preliminary field-scale support for the calculation framework under comparable pipeline conditions. Additional field validation covering different pipe diameters, inclination angles, crude oil properties, and shutdown histories is required before broader engineering application [
58].