Article

Why Is Offshore Gas-to-Wire with CCUS Geopolitically and Economically Critical to Decarbonization?


by
Icaro B. Boa Morte
1,2,
Israel Bernardo S. Poblete
2,
Cláudia R. V. Morgado
1,
José Luiz de Medeiros
2 and
Ofélia de Queiroz Fernandes Araújo
2,*
1
Escola Politécnica, Centro de Tecnologia, Universidade Federal do Rio de Janeiro (UFRJ), Rio de Janeiro 21941-909, RJ, Brazil
2
Escola de Química, Centro de Tecnologia, Universidade Federal do Rio de Janeiro (UFRJ), Rio de Janeiro 21941-909, RJ, Brazil
*
Author to whom correspondence should be addressed.
Processes 2026, 14(11), 1791; https://doi.org/10.3390/pr14111791 (registering DOI)
Submission received: 10 April 2026 / Revised: 18 May 2026 / Accepted: 26 May 2026 / Published: 30 May 2026
(This article belongs to the Special Issue Oil and Gas Drilling Processes: Control and Optimization, 2nd Edition)

Abstract

Carbon taxes and credits (CT&C) accelerate global deployment of carbon capture, utilization and storage (CCUS) technologies to enable energy transition. This study investigates the economic performance and resilience of floating gas-to-wire with CCUS (f-GTW-CCUS), deployed at the wellhead of stranded CO2-rich offshore oil and gas reservoirs. The f-GTW-CCUS platform integrates a natural gas combined cycle power plant with monoethanolamine post-combustion capture (PCC-MEA), producing low-carbon electricity (23 kgCO2e/MWh, competitive with renewables) while monetizing captured CO2 via enhanced oil recovery (EOR). The mass and energy balance data from the proposed process configuration were obtained in the literature. Critically, f-GTW-CCUS operates on wellhead-sourced in situ-associated gas, eliminating exposure to volatile natural gas markets, and achieves a levelized cost of electricity (LCOE) of USD 67.15/MWh. Monte Carlo analysis (10,000 Gaussian iterations, 30-year lifetime, 10% discount rate, three CT&C scenarios, namely, low/medium/high) is used to quantify economic feasibility across three stochastic variables: oil, natural gas, and electricity prices, starting in the 5th year. The results demonstrate the following: (1) Case A (f-GTW without CCUS) remains economically infeasible (NPV < 0) under all price volatility scenarios due to insufficient electricity-only revenue and carbon taxation penalties; (2) Case B (f-GTW-CCUS with immediate CCUS deployment) maintains positive NPV across all scenarios, with EOR monetization contributing 43% of total revenue; (3) the critical CCUS deployment-delay threshold is 6 years under high carbon taxation, extending to 10 years when carbon credits are included. Gate-to-gate environmental assessment (carbon intensity, water footprint, land transformation) shows f-GTW-CCUS superiority versus alternative power systems, with minimal water–land nexuses due to offshore desalination. An empirical consistency assessment based on the 2026 geopolitical energy crisis demonstrates the structural resilience of the f-GTW-CCUS plant: the wellhead sourcing provides resilience to global natural gas price shocks, while the concurrent crude price escalation amplifies EOR revenues by 43–57%, improving project feasibility during commodity disruptions. These findings position f-GTW-CCUS as a critical decarbonization pathway for O&G producers exploiting stranded gas reserves. The technology combines carbon intensity reduction with economic resilience under volatile energy market conditions and mandatory climate policies.

1. Introduction

The Kyoto Protocol [1], Paris Agreement [2], and COP-26 [3] are putting the oil and gas industry under increasing pressure to actively seek sustainable portfolios of cleaner processes and practices, complying with the increasingly strict environmental regulations related to greenhouse gas emissions (GHG). The Intergovernmental Panel on Climate Change (IPCC) report [4] states that, to meet the goal of limiting global temperature increase to 1.5 °C by 2050, it is necessary to reduce global emissions by 45% by 2030. In this scenario, natural gas (NG), with the lowest GHG emissions among fossil fuels [5,6], offers mature technological options as an energy vector, providing a continuous supply that balances renewable energy intermittency and thereby stabilizes electricity prices. It is recognized as a bridge fuel for the energy transition [7,8].
To foster the energy transition, carbon taxes and credits (CT&C) are being adopted worldwide, leveraging the deployment of technologies for carbon capture, utilization and storage (CCUS). Carbon taxes induce companies to decarbonize their processes and governments to mitigate emissions to meet the climate change agreements by creating a financial penalty for the CO2 producer [9]. In parallel, carbon credits are an administrative mechanism for controlling GHG emissions (expressed in CO2-equivalent, CO2e) from various sources by trading one credit per tonne of CO2e avoided or captured [10]. The two tradeable credit alternatives are as follows: (a) certificate, when a third-party body certifies that an organization has avoided 1 tCO2e emissions; (b) permit, when an industry is allowed to emit a certain amount of CO2e [11].
Adding large-scale, cost-effective carbon capture to f-GTW and utilizing the captured CO2 via EOR reduces its carbon footprint while monetizing CO2 through enhanced well productivity [12,13]. Several carbon-capture technologies are employed in CCUS [14]. Carbon-capture technologies for avoiding emissions from fossil-firing power plants are classified as post-combustion [15,16], pre-combustion [17,18] and oxy-combustion [19,20,21]. The post-combustion technologies are the most mature, although they pose an energy penalty due to solvent regeneration [22,23]. Otitoju et al. (2021) [24] assessed a large-scale natural gas combined cycle (NGCC) power plant with post-combustion capture by chemical absorption comparing piperazine (PZ) with the standard aqueous monoethanolamine (MEA, 30 wt%) solvent. The energy penalty decreases from 5.34 GJ/tCO2 (with 30 wt% MEA) to 2.76 GJ/tCO2 (with 40 wt% PZ).
Mostafavi et al. (2021) [25] evaluated PCC configurations using MEA and activated methyldiethanolamine (MDEA) solvents, and process modifications (absorber intercooling, parallel exchanger arrangement, and lean vapor recompression) to reduce the energy demand of the stripping tower. Despite the energy penalty reduction (9.2% to 8.1% comparatively to the conventional PCC process), the capital expenses increased, rendering the system less cost-effective. Sultan et al. (2021) [26] evaluated the solvent regeneration energy to identify avoidable cost components and suggested that the cost of CO2 avoided was reduced by USD 2.8/tCO2, with a USD 0.45/tCO2 increase in capital cost. The cost of carbon abatement depends on process configuration and scale. Mostafavi et al. (2021) [25] determined values of USD 58.80/tCO2 captured for a typical PCC-MEA process and USD 53.80/tCO2 captured for a typical PCC-MDEA process.
Pre-combustion processes use NG with oxygen or air to produce syngas, mainly composed of carbon monoxide (CO) and hydrogen (H2) [27]. CO2 is formed via water–gas shift reaction, increasing the H2 content of the syngas, and is commonly separated by a chemical or physical absorption process [28], with 80% of efficiency [28]. However, the elevated costs of implementing the syngas generation unit reduce the economic interest [27]. Oxy-combustion applies high-purity oxygen to firing NG, producing a CO2 rich flue gas (80 to 98% CO2) and reduced NOx formation. The almost pure CO2 stream is compressed, transported, and stored, allowing higher net efficiency and lower environmental impact [28,29]. Nonetheless, the significant oxygen consumption and the energy-intensive air separation unit are drawbacks of this technology [30].
For floating units, post-combustion is therefore preferable to the pre- and oxy-combustion alternatives. GTW systems are considered feasible solutions to monetize stranded offshore reserves of NG, transporting electrons instead of NG hydrocarbon molecules [31,32]. Furthermore, f-GTW-CCUS is an attractive alternative for monetizing gas at the wellhead of offshore oil reservoirs with CO2-rich associated NG. In such locations, the f-GTW-CCUS system enables the conversion of fuel gas into low-carbon energy while utilizing the captured CO2 in enhanced oil recovery (EOR) to increase oil productivity [12,13].
Nguyen et al. [33] evaluated the decarbonization potential of GTW-CCUS using multi-objective optimization in life cycle analysis to assess multiple conditions such as partial or total plant electrification. The authors employed thermodynamic, environmental, and economic indicators in the assessment, with the conclusion that chemical absorption has superior performance, and CO2 capture (either pre- or post-combustion) not only minimizes emissions but also maximizes profitability. Winden et al. [31] and Andrei and Sammarco [34] evaluated the performance of GTW-CCUS systems both offshore and onshore. The levelized cost of energy (LCOE) is similar in both scenarios. Moreover, Roussanaly et al. [35] evaluated offshore NGCC with CCUS, capturing carbon post-combustion through chemical absorption with monoethanolamine (PCC-MEA). The authors specifically evaluated the use of internal energy generation versus external energy transmitted from onshore facilities. Their results suggest that using onshore-supplied energy yields the best economic and environmental outcomes, reducing the cost of production from USD 178-258/MWh to USD 95/MWh.
Interlenghi et al. (2019) [13] investigate a large-scale f-GTW-CCUS considering a supersonic separator unit to process the CO2-rich NG. The unit processes approximately 7 MMsm3/d of raw NG, exports 513 MW of low-carbon electricity to onshore facilities and utilizes CO2 for enhanced oil recovery (EOR) fluid 494.2 t of supercritical CO2. The authors reported positive net present value (NPV) and 20% return-on-investment. They conclude that the increase in the molar percentage of CO2 in the fuel gas composition drastically improved the economic performance, e.g., firing 44 mol% CO2 doubled the NPV compared to the base-case alternative. The authors’ finding is particularly relevant for CO2-rich NG reservoirs as firing fuel gas with high CO2 contents eliminates the NG upgrading, releasing deck space for the post-combustion capture unit.
The present work identifies a research gap in the f-GTW-CCUS literature: the joint assessment of energy price volatility and carbon credit and tax (CT&C) policy on economic performance has not been addressed. For instance, Grant et al. [36] propose a method to evaluate the relationship between carbon emissions reduction and carbon dioxide removal (CDR) in a global integrated stochastic optimization assessment model. The authors consider the impact of discount rate scenarios (1, 3, and 5%) and conclude that reduction in discount rate increases near-term CDR costs but lowers long-term costs.
Economic parameters such as prices of electricity, oil and NG play an important role in determining project viability. For instance, the oil price is a fundamental criterion for making strategic investment decisions for oil and gas companies [37]. The volatility of oil prices (e.g., Brent crude) is associated with changes in oil price mean value [38]. Moreover, the economic conjuncture and geopolitical scenarios could directly or indirectly influence the synergy between oil demand and supply, increasing oil volatility [39]. Perifanis and Dagoumas (2018) [40] state that oil prices still provide a measure for pricing other energy commodities which impacts the economic reliability of NGCC design decisions.

The Present Work: Floating Gas-to-Wire with CCUS—Resilience, Monetization, and Decarbonization

This work evaluates the economic resilience and environmental performance of a floating gas-to-wire combined cycle power plant with post-combustion CO2 capture (f-GTW-CCUS), deployed at the wellhead of stranded, CO2-rich offshore oil and gas reservoirs. The f-GTW-CCUS integrates a natural gas combined cycle (NGCC) power generator with monoethanolamine-based post-combustion capture (PCC-MEA) to produce low-carbon electricity transmitted via subsea high-voltage direct current (HVDC) cables to onshore facilities [41]. Captured CO2 is monetized via enhanced oil recovery (EOR), converting a process byproduct into a revenue stream that improves project economics. The process design and mass–energy balance are based on the validated configuration reported by Interlenghi et al. [13], extended here through Monte Carlo analysis to quantify f-GTW-CCUS economic resilience under simultaneous uncertainties in oil, natural gas, and electricity prices—a stochastic framework absent from prior techno-economic feasibility studies.
Novelty and Research Gap: The existing literature [13,42,43,44] has evaluated f-GTW-CCUS technical feasibility and EOR monetization pathways but has not addressed the critical confluence of (i) commodity price volatility (oil, natural gas, electricity), (ii) mandatory carbon taxation and credit policies (CT&C), and (iii) stranded associated gas utilization within a single integrated economic framework. This gap is increasingly consequential: the 2026 geopolitical energy crisis, i.e., characterized by Strait of Hormuz disruption, elevated crude prices (Brent > USD 100/bbl), and natural gas supply constraints (TTF > EUR 60/MWh), demonstrates that f-GTW-CCUS operating on wellhead-sourced associated gas exhibits structural advantages unavailable to conventional gas-to-wire systems, e.g., including reduced direct exposure to global LNG market volatility and direct exposure to crude price upside via EOR monetization. Simultaneously, accelerating carbon taxation policies [1,2,3,4] create urgent economic incentives for rapid CCUS deployment in existing O&G infrastructure. The present work addresses this gap by adopting the base-case design from Interlenghi et al. [13] and conducting the first comprehensive evaluation of (i) how simultaneous energy price uncertainties and mandatory CT&C scenarios affect f-GTW-CCUS feasibility, (ii) the economic penalty and optimal delay tolerance of CCUS deployment deferral, and (iii) the structural resilience of wellhead-sourced f-GTW-CCUS under commodity price disruptions.
Research Questions: The work is structured to answer three interconnected research questions. (RQ1) Price volatility and feasibility: How do simultaneous uncertainties in oil, natural gas, and electricity prices—parametrized via Monte Carlo analysis—affect the economic viability of stranded gas monetization via f-GTW-CCUS, and what is the break-even cost structure required for a positive net present value across volatility scenarios? (RQ2) CCUS deployment timing: Is delayed CCUS capacity implementation a critical economic decision? What is the maximum delay tolerance (in years) before project net present value becomes negative under mandatory carbon taxation? How do carbon credit policies extend this tolerance? (RQ3) Policy impact: How does the intensity and timing of carbon- tax adoption relative to carbon credit availability affect f-GTW-CCUS project economics, and what policy conditions are necessary to ensure rapid CCUS deployment in stranded asset scenarios?
Environmental and Sustainability Metrics: Beyond economic analysis, this work benchmarks the f-GTW-CCUS against renewable energy alternatives using three critical sustainability indicators: (i) carbon intensity (kgCO2e/MWh), (ii) water footprint (m3/MWh), and (iii) land transformation (m2/GWh). This integrated assessment addresses the broader energy transition context where low-carbon electricity must compete with renewable technologies on both economic and environmental grounds, positioning f-GTW-CCUS as a viable decarbonization option for O&G-producing regions with mandatory climate commitments and abundant stranded gas reserves.
Table 1 maps the present study against seven previously published works across four thematic axes (gas-to-wire systems, stranded gas utilization, CCUS-EOR economics, and carbon pricing).

2. Methods

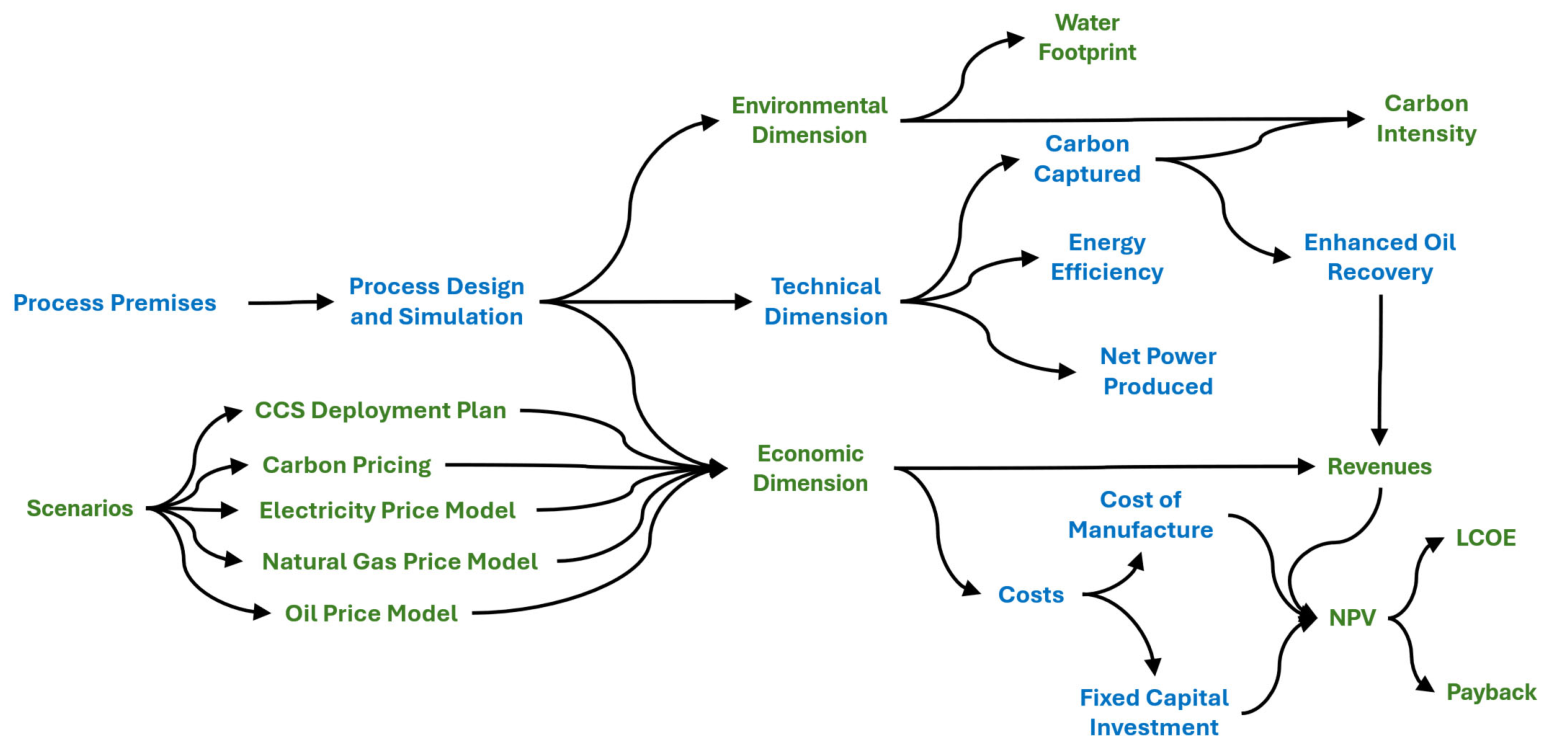
The work adopts the process topology, feedstock composition, temperature and flow rates reported by Interlenghi et al. (2019) [13]. Consequently, the mass and energy balances reported by the authors of [13] are the base case for the Monte Carlo analysis (MC, coded in MATLAB® R2022a, The MathWorks, Inc., Natick, MA, USA). The objective is to evaluate the economic impacts from exogenous economic variables, namely mandatory carbon taxes and carbon credits, and stochastic variations (volatility) in the energy prices (oil, natural gas and electricity), and CCUS deployment delay period. The economic performance is assessed as net present value (NPV) and payback time while the environmental impacts are expressed in terms of carbon, water, and land intensities. Figure 1 presents a schematic overview of the methodology adopted in this work: (a) the case studies and scenarios for the exogenous economic and policy-related inputs are defined (this work, in geen); (b) the process synthesis, simulation premises, and process design simulation results and the technical dimensions (energy efficiency, net power produced, and avoided emissions are from Interlenghi et al. [13] (in green); (c) the economic and environmental metrics are computed (in green).

2.1. Economic Analysis

The economic analysis follows Turton et al. (2018) [44] for equipment fixed capital investment (FCI, MMUSD), cost of manufacturing (COM, MMUSD/y) and the net present value (NPV, MMUSD), estimated via Equations (1) to (7). Here, CBM is the bare-module cost; CUT is the cost of utilities (electricity, EE, and cooling water, CW); COL is the cost of labor; CRM is the cost of raw materials (all in MMUSD/y); AP and GAP are, respectively, the net and gross annual profits (MMUSD/y); DEPR is the depreciation (MMUSD/y); i is the depreciation rate; and REV is the revenue from the process (MMUSD/y). In Equation (2), the estimated FCI via the framework by Turton et al. (2018) [44] is corrected to the offshore scenario [46]. CAPCOST [44] is employed for estimation of the equipment module costing (CBM). Equation (3) corrects CBM for economy of scale whenever an equipment item is sized beyond the upper limit of the correlation range of the cost correlations proposed by Turton et al. (2018) [44]. CBM is calculated from purchased costs in a reference condition corrected via design/pressure/material factors and updated via the Chemical Engineering Plant Cost Index (CEPCI) [44]. The year 2020, immediately following the publication of Interlenghi et al. (2019) [13], is adopted as the base year, corresponding to a CEPCI value of 635.5.
F C I O n s h o r e = 1.18 j = 1 N e q C B M ( j )
F C I O f f h o r e = 2   F C I O n s h o r e
C B M / C B M L i m = C B M / C B M L i m 0.6
C U T = C U T E E + C U T C W
C O M = 0.18   F C I + 2.73   C O L + 1.23   C U T + C R M
G A P = R E V C O M ; A P = G A P ( G A P D E P R ) · I T R / 100 ( G A P > D E P R ) G A P ( G A P D E P R )
N P V = 0.4 + 0.6   q 1   F C I + A P   k = 2 N + 2 q k ,     q = 1 + i / 100
Table 2 displays the economic premises used for calculating the economic variables.
The revenues (REV) from the evaluated f-GTW alternatives have four components: (i) net power exported; (ii) extra oil barrels from EOR; (iii) NGL from NG pre-processing; and (iv) carbon credit from CCUS. REV of the f-GTW process without CCUS consists of only two components: (i) net electricity exported and (ii) NGL from NG pre-processing. In other words, the CCUS implementation increases revenues via CO2-to-EOR and saves costs by avoiding CO2 taxes. EOR revenues are calculated using a CO2-injection yield of 1.5 barrels of additional oil produced per tonne of CO2 injected (EOR yield = 1.5 bbl/tCO2) [13], monetized at Brent crude prices; injection costs are embedded in the variable operating cost (COM) (Table 2).

2.1.1. Carbon Taxes and Credits

The mandatory adoption of carbon policy is a key novel consideration of the present work. This adoption affects economic performance and may vary in intensity and method of application according to future carbon-policy developments. The World Bank Group (2021) [9] reports that Japan has the lowest carbon CO2 taxation (USD 2.61/tCO2e), while Switzerland has the highest (USD 137.24/tCO2e). Regarding carbon credit policy, Oceania records an average price of USD 13.44/tCO2e. Some nations plan to impose carbon taxes, with uncertain intensity and time of adoption. To cope with the uncertainty, Table 3 presents a progressive adoption policy for carbon taxes and carbon credits within three scenarios: (i) low (slow adoption and low intensity); (ii) medium; and (iii) high. All scenarios assume that the carbon tax and carbon credit are implemented five years after the GTW plant startup.

2.1.2. Levelized Cost of Electricity (LCOE)

The levelized cost of electricity (LCOE, USD/MWh) is an economic indicator that measures the average revenue per unit of electricity produced by a powerplant required to retrieve the fixed capital investments (FCI) and the lifetime cost of manufacture (COM) [50,51]. Interlenghi et al. [13] present two models to determine the LCOE in GTW projects (Equation (8)), disregarding EOR credits, and Equation (9) with EOR credits (REVEOR), respectively, where the fixed charge factor (FCF) is the annualization factor applied to the FCI, converting the overall capital expenditure into a constant annual value (Equation (10)) [52].
L C O E = F C I · F C F + C O M N E T   E N E R G Y
L C O E = F C I · F C F + C O M R E V E O R N E T   E N E R G Y
F C F = r d 1 + r d T 1 + r d T 1
where the discount rate is represented as rd, and T denotes the project lifetime.

2.1.3. Case Studies

This work assesses the influence of combined scenarios of carbon policy profile (carbon tax and credit, CT&C) for f-GTW-CCUS alternatives. Case A is the benchmark: an f-GTW configuration without CCUS that faces CT&C adoption five years after its startup. Case B is an f-GTW-CCUS configuration that captures CO2 for five years before CT&C becomes mandatory. Cases C and D deploy CCUS after CT&C becomes mandatory and differ in whether carbon credits are present (extra revenue), which is the case only in Case D. With CCUS, the GTW process has revenues from EOR. Table 4 summarizes the studied scenarios.

2.2. Monte Carlo Analysis

Monte Carlo (MC) is a well-known method based on stochastic analysis for evaluating systems under non-deterministic scenarios [53]. The probability density function (PDF) considers Gaussian distribution. The normal distribution X (x) is applied with mean (µ) and standard deviation (σ), range from a to b, where a < b are real numbers, with PDF as described in Equation (11) [53]. Three stochastic inputs (Ui) are considered in the MC analysis: (i) U1—oil price (USD/bbl); (ii) U2—natural gas price (USD/MMBtu); (iii) U3—electricity price (USD/kWh). U1 and U2 are sampled as correlated stochastic inputs (natural gas correlated with oil volatility), while U3 is sampled as an independent stochastic input. These variables are typically subject to uncertainties, and may exhibit severe fluctuations over the project lifetime, affecting NPV. Table 5 reports the mean and standard deviation adopted for each stochastic input.
P D F X , µ , σ = 1 2 π σ 2 e x p ( X µ 2 2 σ 2 )
The MC analysis is implemented in MATLAB® R2022 with N = 10,000 independent realizations per evaluated scenario. The mean (μ) and standard deviation (σ) reported in Table 5 are derived from a 10-year historical window (2013–2022) for crude oil [54] and natural gas [55], and from a 4-year window (2018–2021) for electricity [56]. Although the Gaussian distribution of Equation (11) is theoretically supported over the real line, the practical sampling envelope explored by the analysis corresponds to the μ ± 2 × σ interval, yielding effective ranges of approximately USD 20.46–119.54/bbl for oil, USD 0.96–5.56/MMBtu for natural gas, and USD 0.1011–0.1131/kWh for electricity.

3. Results

The stationary f-GTW-CCUS mass and energy balance results by Interlenghi et al. [13] are used and summarized in Table 6 for Cases A, B and C. Data from Table 5 are the base information for the economic analysis. Case A presents the worst environmental performance in terms of carbon emission (534.1 t/h). Due to the CCUS unit, Case B reduces the emission from 534.1 t/h to 14.8 t/h. Case C also emits 14.8 t/h once the CCUS unit is deployed; however, each year of CCUS-deployment delay adds 4.84 Mt CO2 of cumulative emissions.
From the stationary (deterministic) results, the CCUS implementation imposes an economic penalty, increasing the FCI and COM. The costs of raw materials (CRM) and labor (COL) are not affected by the inclusion of the CCUS unit as it is assumed that there are no relevant additional utility costs because the plant is self-sufficient in energy and heat. Cases C and D share the same results of Case A before the CCUS unit implementation and follow Case B values after the CCUS implementation.
Table 7 displays the economic results, the base information for the MC analysis.

3.1. Floating GTW Without CCUS (f-GTW)

The concept of offshore GTW without CCUS (Case A) is the reference case. Case A is evaluated considering two conditions: (i) progressive low scenario of carbon taxation (W/CO2 Tax)—started from the 5th year (Table 2); and (ii) without progressive low scenario of carbon taxation (W/O CO2 Tax). The choice of the discount rate (rd) is a key parameter in assessing the NPV and project feasibility and is explored for both conditions using: rd = 10%, rd = 5%, and rd = 3%.
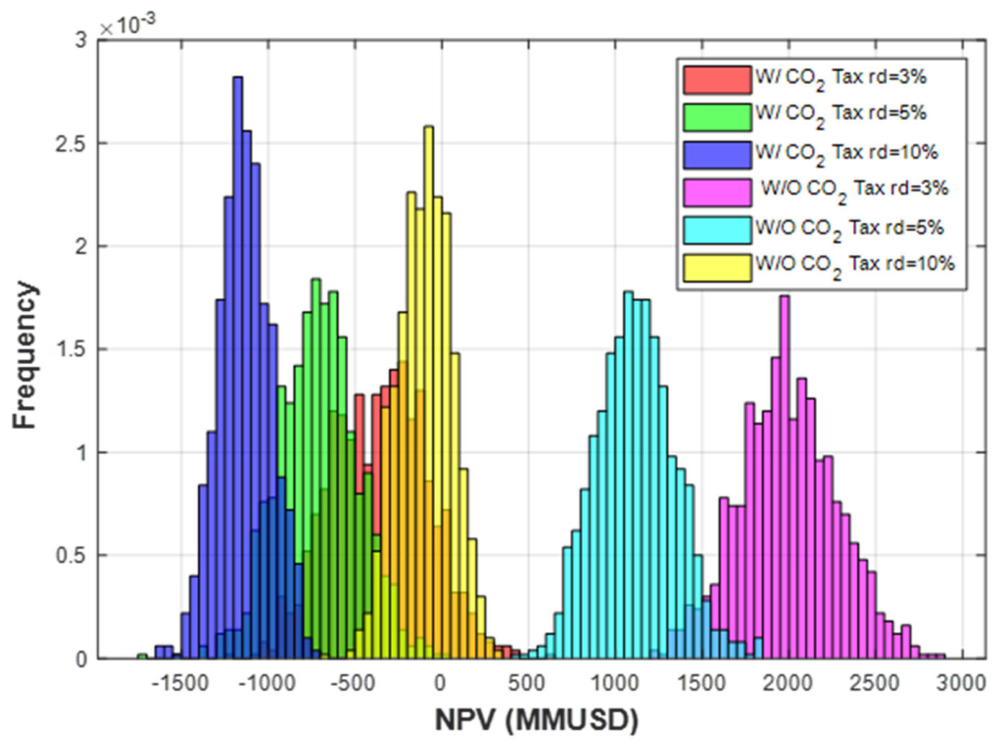
In the first condition, the f-GTW exhibits a negative NPV distribution; i.e., the process is infeasible. For rd = 10% and rd = 5%, the distribution of NPV remains in the negative zone, and only for rd = 3%, “Case A—W/CO2 Tax” shows frequencies in the positive NPV zone. For “Case A—W/O CO2 Tax” both rd = 5% and rd = 3% render NPV positive in all frequencies, while “Case A—W/O CO2 Tax” with rd = 10% yields NPV values in both positive and negative regions, indicating high probability of unfeasible f-GTW operating with CO2-Rich NG. These results emphasize the relevance of CO2 monetization through EOR, possible only with CCUS. Figure 2 presents the NPV distributions for “Case A—W/CO2 Tax” and “Case A—W/O CO2 Tax”, employing Table 4 values of µ and σ for the stochastic input variables (prices of oil, natural gas and electricity).
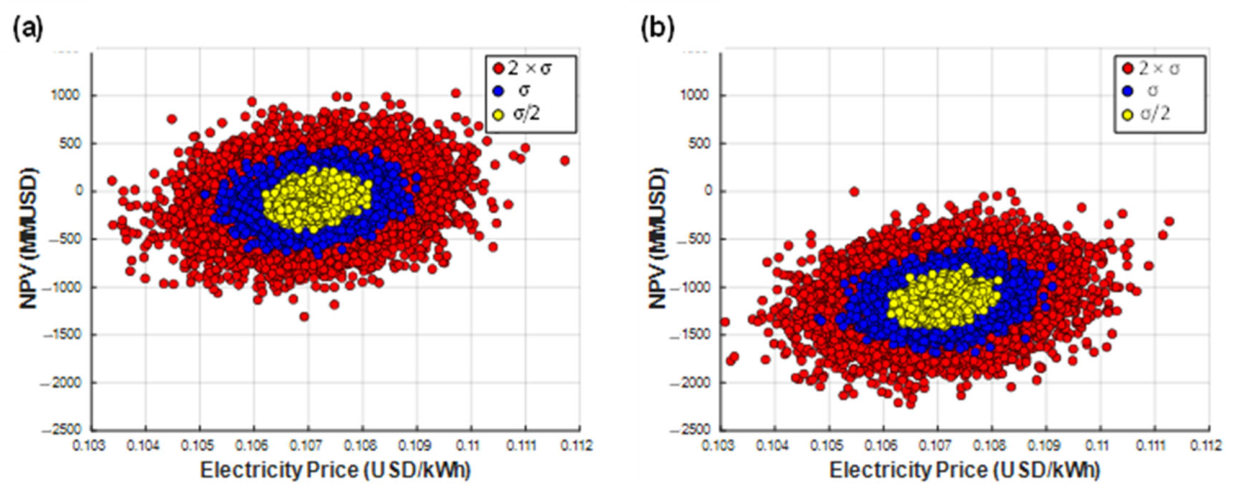
Since σ is a decisive parameter for the MC method, particularly for the energy and oil sectors, which are characterized by high volatility and unpredictability commodity prices, the MC analysis explores three scenarios: (i) high market instability, assuming twice the current volatility (2 × σ); (ii) current instability, resulting in the standard deviation (σ) according to [54,55]; (iii) low instability, assuming half the current volatility (σ/2). Figure 3 presents NPV results and electricity sales price for “Case A—W/O CO2 Tax” (Figure 3a) and “Case A—W/CO2 Tax” (Figure 3b), both at a conservative rd = 10%. The σ influence is clearly observed in the dispersion of the 10,000 simulation NPV results, where 2 × σ produces a wide NPV dispersion while σ/2 generates concentrated distribution. The results confirm the impact of the uncertainty of the energy commodities price on the financial outcome of the f-GTW project.
The implementation of CO2 tax imposes reductions of 101.24%, 191.70%, and 541.24% in the maximum NPV for 2 × σ, σ, and σ/2, respectively (Figure 3a). In ”Case A—W/CO2 Tax” (Figure 3b), even when market volatility is increased to 2 × σ, the NPV distribution does not reach the positive region, indicating that the electricity revenues are insufficient to compensate for the carbon taxation penalty. In other words, an increase in electricity prices beyond the modeled stochastic range would be required for positive NPV, implying a social cost associated with carbon intensity reduction (an environmental benefit) achieved through carbon taxation.

3.2. Floating GTW with CCUS (f-GTW-CCUS)

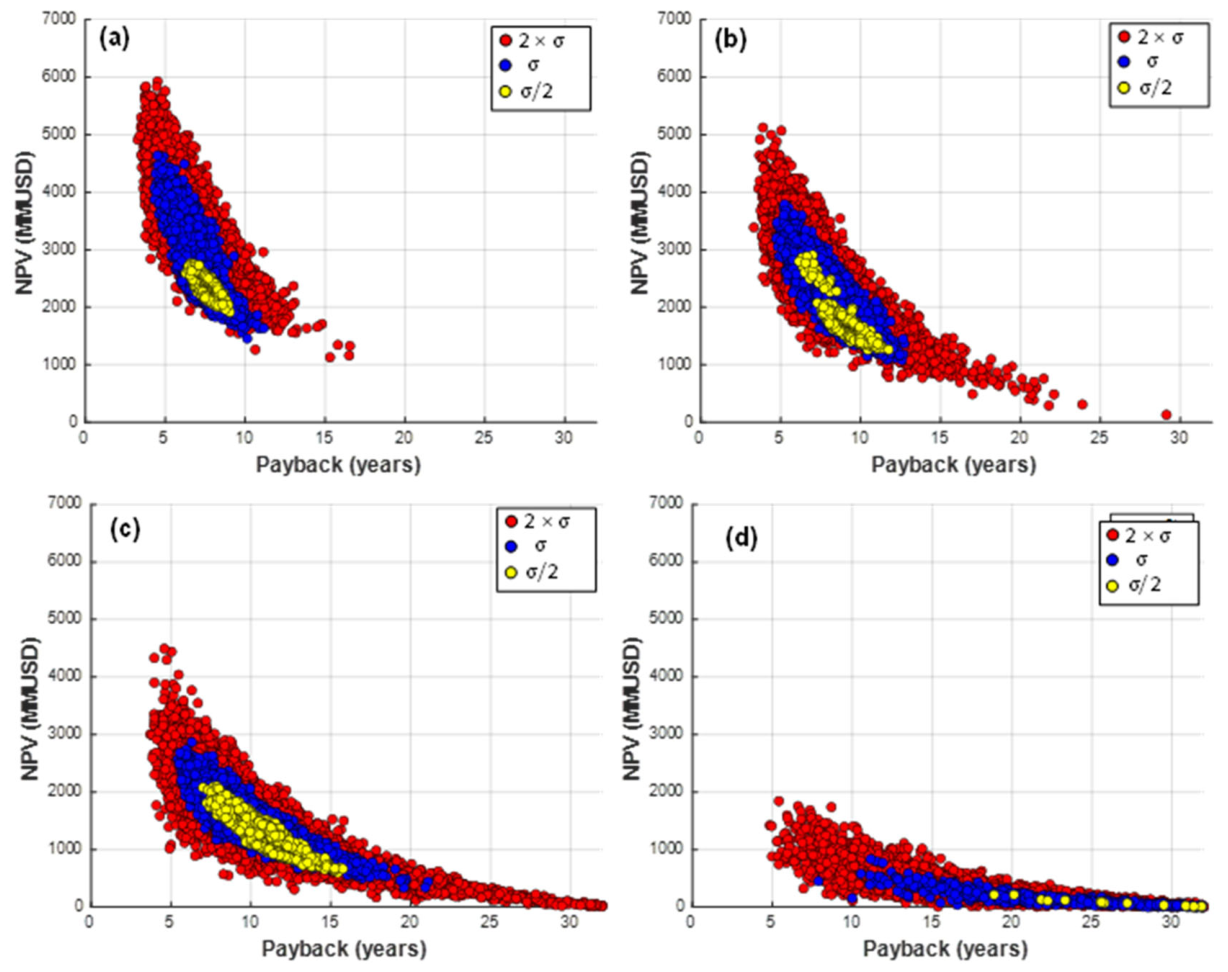
Case B considers the implementation of the CCUS unit from the plant startup while mandatory carbon taxation occurs only after the 5th year of operation. Figure 4 shows the payback and NPV distribution. As a result of the CO2 monetization from EOR, the NPV values are predominantly in the positive region. Additionally, σ values show strong influence on economic performance. The greatest dispersion in the economic indicators occurs for 2 × σ. In contrast, σ/2 concentrates the results around the stationary economic performance, i.e., Brent crude barrel price of USD 70.0/bbl. For “Case B—W/O CO2 Tax” (Figure 4a) the 2 × σ scenario yields an NPV range of MMUSD 1000–6000, with corresponding payback periods of 17 and 3 years, respectively. On the other hand, the reduction to σ/2 results in an NPV range of MMUSD 1900–2800, with respective payback periods of 6 and 9 years.
The impact of carbon tax severity is clearly demonstrated by low condition (Figure 4b), medium condition (Figure 4c), and high condition (Figure 4d), indicating a significant reduction in the project NPV after 30 years and an increase in the payback period. The worst economic performance is observed for “Case B—W/high Carbon Tax” (Figure 4d), with NPV < MMUSD 2000 across all σ scenarios.
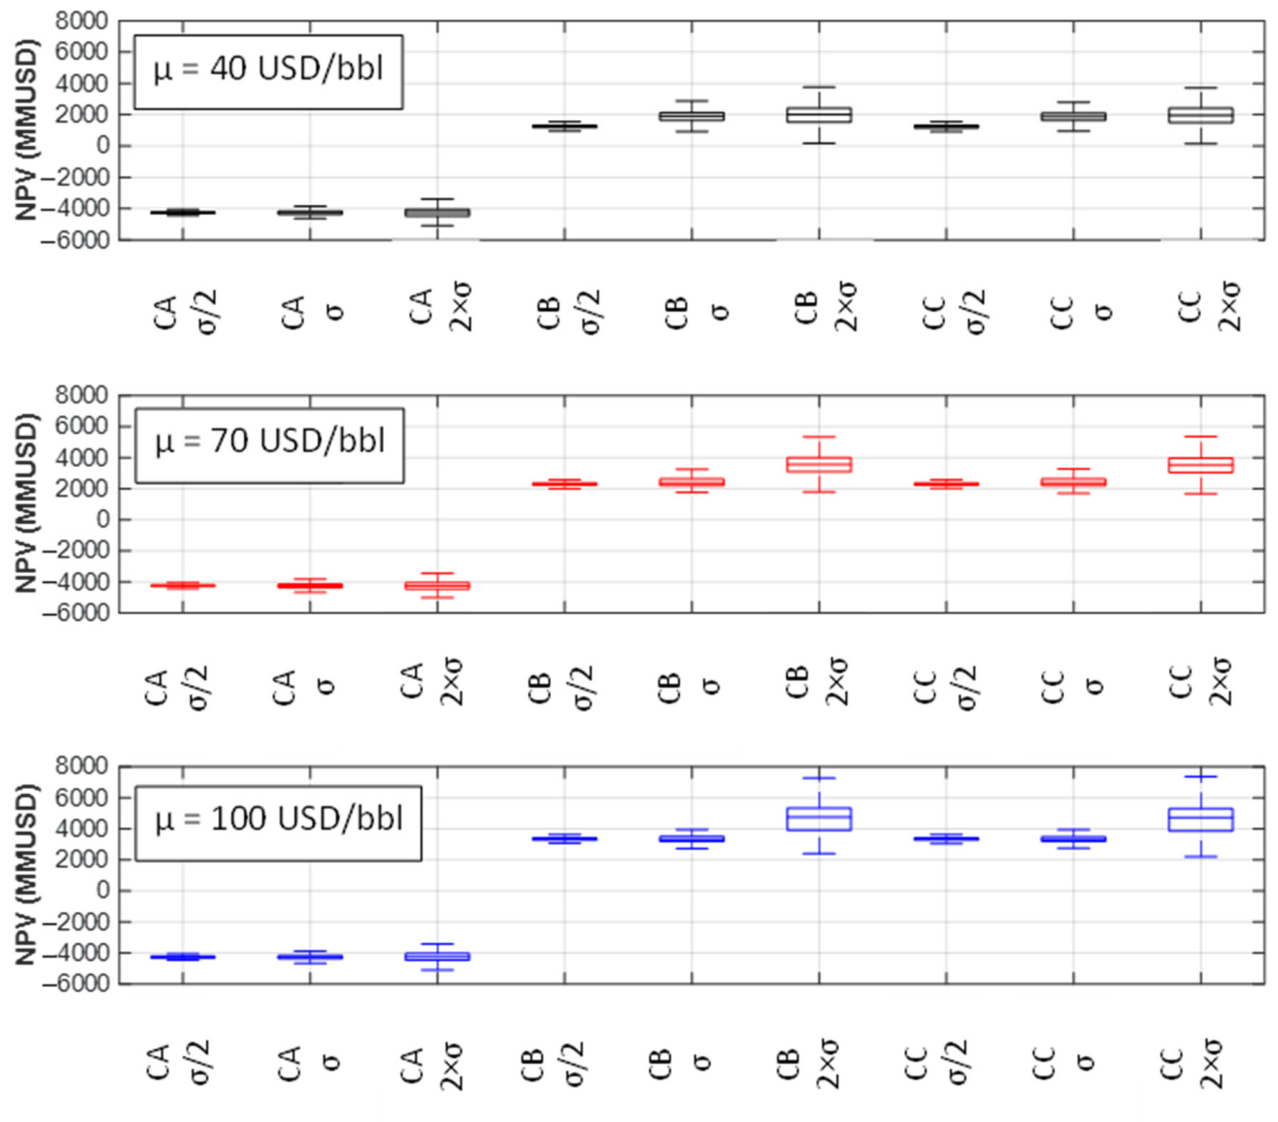
An exploratory analysis considering Brent oil barrel price value (µ) varying as USD 40/bbl (pessimistic); USD 70/bbl (standard); and USD 100/bbl (optimistic) is carried out with standard deviations of 2 × σ, σ, and σ/2. NG and Electricity prices remained fixed following Table 5, and high carbon tax policy according to Table 3 is considered, along with fixed rd = 10% (conservative value).
Case A (f-GTW without CCUS) is the only scenario in the unfeasible region (NPV < 0) for all standard deviations justified by the fact that electricity revenues are the only income source in this case. However, when the CCUS unit is implemented (Case B and C), the extra oil produced by EOR results in profitable projects despite the additional FCI penalty. Furthermore, the increase in the µ of oil raises the NPV results. Cases B and C show NPV variations of 106%, 77%, and 63% between the maximum and minimum observations for 2 × σ, σ, and σ/2, respectively. Case C incurs an economic penalty from the carbon tax applied to 4.84 Mt CO2 (resulting from the late deployment of CCUS); however, this penalty does not significantly reduce the NPV relative to Case B.
Figure 5 presents the Net Present Value (NPV, in MMUSD) distributions obtained from the Monte Carlo simulation for the evaluated scenarios (Case A—CA, Case B—CB, and Case C—CC) under three oil price assumptions—USD 40/bbl (pessimistic), USD 70/bbl (standard), and USD 100/bbl (optimistic)—each assessed at three uncertainty levels (σ/2, σ, and 2 × σ). Natural gas and electricity prices were kept fixed according to Table 5, a high carbon tax policy was adopted following Table 3, and a conservative discount rate of rd = 10% was assumed. This configuration enables a comparative assessment of the economic robustness of each alternative under combined market and uncertainty conditions.

3.3. Consequences of Carbon tax Policy Implementation

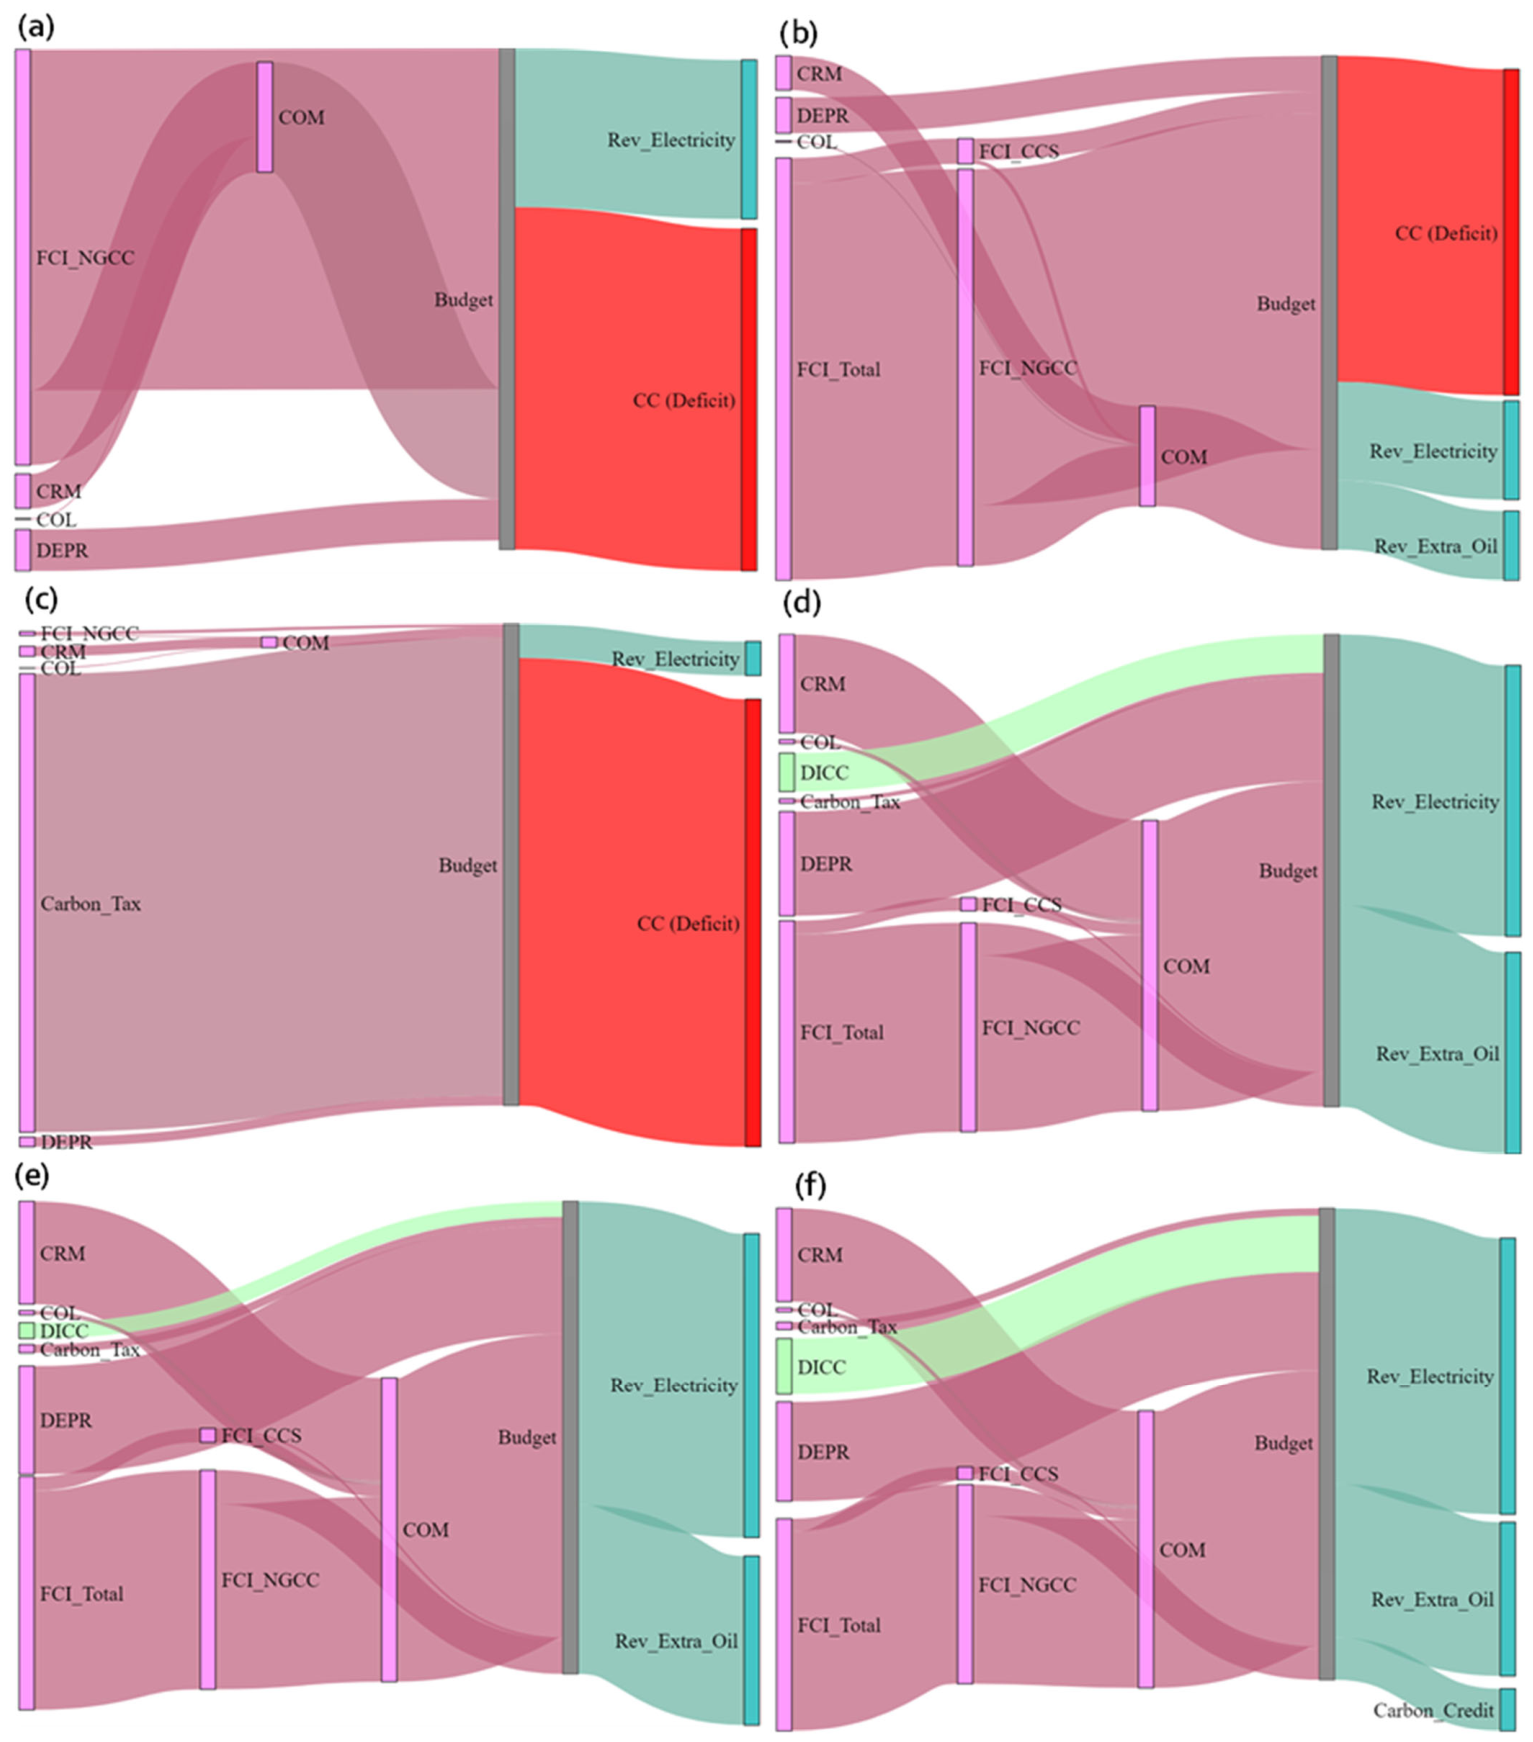
Figure 6 presents Sankey diagrams of the cash flow from the assessed cases under the following scenarios: (a) Case A, C, and D at 1st year of operation; (b) Case B at 1st year of operation; (c) Case A at 30th year of operation; (d) Case B at 30th year of operation; (e) Case C at 30th year of operation; and (f) Case D at 30th year of operation under high carbon tax and credit. The pink flows represent the negative cash flow for general expenses (COM, FCI, DEPR, COL, CRM and carbon taxes). Green flows express the revenues (from electricity, extra oil, or carbon credit) of the process. Red flows indicate the monetary deficit (cash shortfall, CC) of the evaluated alternative. Lastly, light green represents the direct and indirect carbon cost (DICC), which indicates the fraction of the cost regarding the income from the extra oil produced (due to EOR) and carbon credit. During the first year of operation in Cases A, C, and D (Figure 6a), the only income is from electricity sales, which increases the initial deficit of these alternatives compared with Case B (Figure 6b) as Case B has two revenue sources (electricity and extra oil from EOR). Figure 6c illustrates the financial balance of Case A at the end of 30th year with a total of 145.3 Mt CO2 emitted. Revenues from electricity are insufficient to render Case A economically feasible in a carbon tax scenario. On the other hand, Case B (Figure 6d) emits 3.73 Mt CO2 at the end of 30 years, resulting in significant costs from carbon taxation. The total amount of the revenues, i.e., electricity (≈57% total revenue) and extra oil (≈43% total revenue), are sufficient to make Case B feasible. Case D comprises a carbon tax, carbon credits, and a 6-year delay in CCUS implementation. Case D emits 26.9 Mt CO2, incurs ≈ 470 MMUSD in carbon tax costs, and yields ≈ 2585 MMUSD in carbon credit revenue over 30 years of operation. Moreover, the percentages of the electricity, extra oil, and carbon credits from the total income budget correspond to 58.67%, 32.43%, and 8.90%, respectively. This financial balance of Case D is depicted in Figure 6f.

3.4. The Outcome of Carbon Credit Policy Implementation

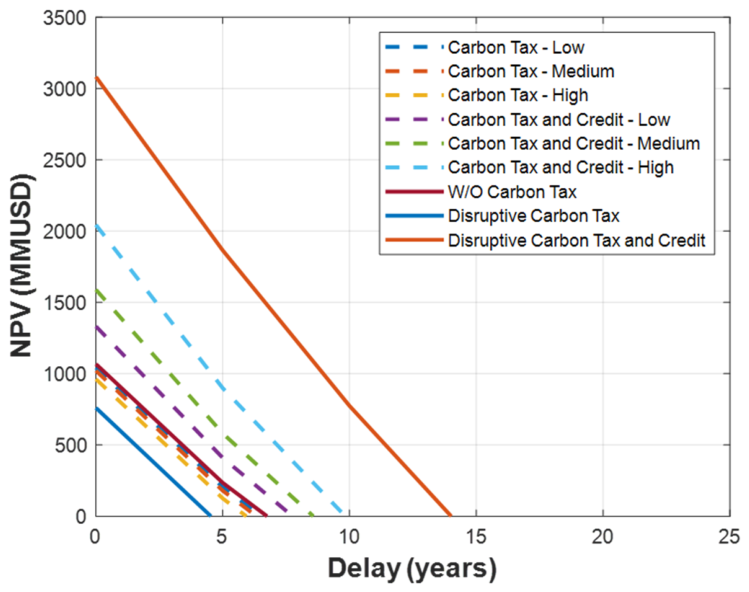
Figure 7 shows non-linear regression curves relating the NPV to the CCUS deployment delay under the evaluated policy scenarios. In all scenarios, the delay embeds an economic penalty; consequently, as the delay increases, the NPV decreases. The high scenario of carbon credits and taxation policies results in an NPV increase of ≈212% compared to the base case.
The viability window for f-GTW projects without CCUS becomes smaller with the rising of the severity of carbon taxes. The carbon credit mechanism extends the deployment window required for NPV > 0 from ≈6 to 10 years. Two disruptive scenarios are also evaluated—(i) “Disruptive Carbon Tax” and (ii) “Disruptive Carbon Tax and Credit”—both of which increase the severity of the carbon policies in Table 3 by 300%. The maximum delay to implement CCUS while assuring NPV > 0 region is 5 years for “Disruptive Carbon Tax” and 14 years for “Disruptive Carbon Tax and Credit”.
Two disruptive scenarios are analyzed to test f-GTW-CCUS resilience to extreme carbon policy changes. The high scenario (Table 3) for both policies is increased threefold. Under these conditions, the cumulative return on investment is ≈MMUSD 761 at the end of 30 years, considering only the carbon tax policy. In contrast, the disruptive scenario with the hybrid implementation of the policies leads to MMUSD 3082 over 30 years.

3.5. Carbon Intensity Assessment

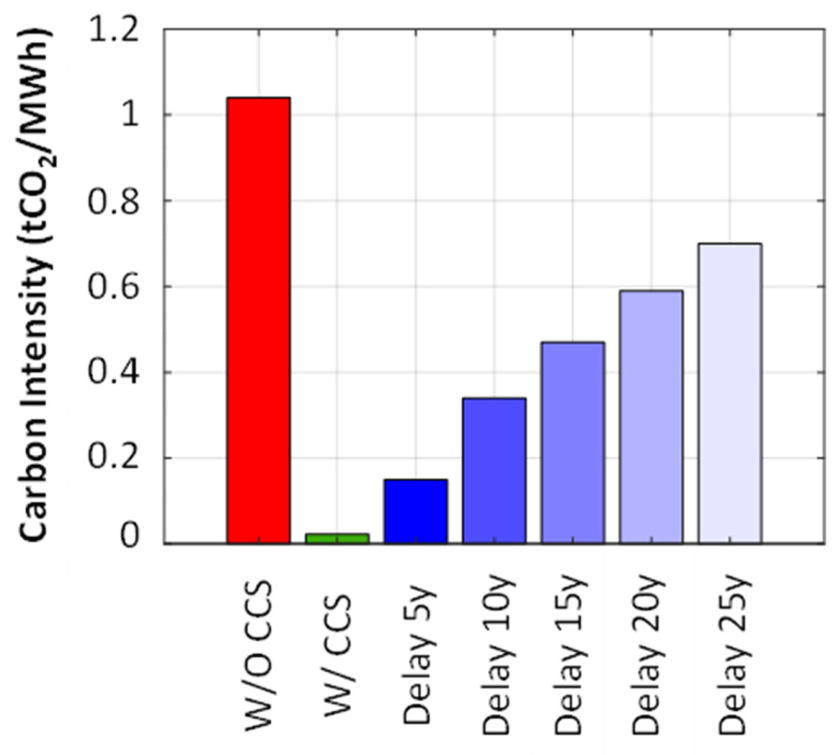
Figure 8 presents the carbon intensity (CI) (tCO2/MWh) for several process conditions by the end of 30 years of operation. The CI of the f-GTW without CCUS is 96% higher than that of the process with CCUS starting in the 1st year. Additionally, increasing the delay in deploying the CCUS unit proportionally increases the CI of the plant configuration. For instance, the growth of ≈81% in the CI is observed for CCUS installation between the 5th and 25th years. Finally, constructing the CCUS unit at the beginning of the last 5 years of plant operation reduces by 17% its CI compared to the 30 years of the f-GTW without CCUS alternative.
To consolidate the case-by-case findings developed throughout Section 3.1, Section 3.2, Section 3.3, Section 3.4 and Section 3.5, Table 8 presents a comparison of the four evaluated cases (A, B, C, and D), summarizing the policy and CCUS deployment configuration, the technical CO2 flows, and the main 30-year economic outcomes under the High CT&C scenario at base economic conditions (µoil = 70 USD/bbl, rd = 10%). Table 8 integrates information from the policy scenarios (Table 3), the case definitions (Table 4), and the stationary technical and economic results (Table 6 and Table 7). LCOE values are presented in Section 4.2.

4. Discussion

4.1. Carbon Tax Impact on f-GTW

The role of discount rates is noteworthy in CCUS projects since this economic measure could add flexibility to the emissions pathway of fossil-fired power plants [36]. Furthermore, lowering the discount rate of fossil energy sources under an increasing scenario of carbon taxation is a governmental measure to safeguard the “social contract” by ensuring energy security in developing countries [57].
Although f-GTW without a CCUS unit (Case A) is the most carbon-intensive process (Table 8), Figure 2 presents the impact of discount-rate reduction on the project feasibility under carbon taxation. Discount rates (rd) of 3 and 5% have a non-zero probability of producing positive NPV values. On the other hand, without carbon taxation policies, rd = 10, 5, and 3% show positive NPV. Thus, to provide energy access and equity among emerging nations, this measure is likely to be socially effective.
Lin and Tan [45] propose a quantitative deferred option model to evaluate the impact of oil price shocks and carbon trading mechanisms on CCUS and EOR investments via real option theory. The authors’ findings show that implementing a carbon trading mechanism could promote the investment value of the CCUS project and reduce the associated risk. Lin and Tan [45] also show that increasing oil and carbon trading prices promote the implementation of CCUS-EOR technology. Furthermore, the results of Lin and Tan [45] corroborate the present work’s main findings: the sooner carbon taxes and credit policies are launched, and the construction of CCUS units is implemented without delays relative to the carbon policies, the more profitable the f-GTW-CCUS will be. Under a carbon taxation scenario, Zhang et al. [58] evaluated a model to assess the economic and environmental trade-off of onshore recycle-CCUS-EOR projects. However, they diluted the carbon tax penalty in product prices, which is not herein considered.
The present work suggests that implementing carbon tax policies could accelerate the deployment of CCUS projects, reducing the carbon emissions from f-GTW while increasing oil production. For instance, if the decision maker chooses not to implement CCUS units after the start of carbon policies, it is likely that, in the long term, the project will become unfeasible. Furthermore, if the CCUS plant is constructed at the beginning of the project, the f-GTW-CCUS becomes more resilient—despite the higher CAPEX—to an imminent scenario of carbon taxation. In addition, the monetization of CO2 through the EOR increases the project NPV and reduces the payback time. Finally, increasing the delay between the onset of carbon taxation policies and the construction of the CCUS unit reduces the project’s economic feasibility.
Moreover, the combination of carbon taxes and crediting policies benefits GTW projects that have implemented the CCUS plant, reducing the negative impact of the carbon tax policy. The remaining credits could improve the company’s financial balance, reduce investment risks and promote the company’s global sustainability.

4.2. LCOE Results

Table 9 introduces the LCOE (USD/MWh) for several sources of energy production. For instance, Rubin et al. (2015) [59] determine the LCOE for onshore NGCC with and without CCUS. Although the f-GTW with and without CCUS lie outside the LCOE range reported by Rubin et al. (2015) [59], the upper-limit values determined in the present work, without and with EOR revenues, are approximately 20% and 40% above Rubin et al.’s upper limit, respectively. Additionally, the LCOE for the NGCC with EOR (offshore NGCC with CCUS) is approximately 49%, 72%, and 47% above the upper limit for wind, solar, and hydro energy production, respectively [60,61,62], indicating that the f-GTW-CCUS process is, under specific conditions, economically more advantageous.

4.3. Environmental Performance Indicator

Table 10 presents the carbon intensity (CI; kgCO2e/MWh), water footprint (WF; m3/MWh), and total land transformation (TLT; m2/GWh) using gate-to-gate boundaries for the assessed cases in this study. The Intergovernmental Panel on Climate Change (IPCC) [63] reports 631 kgCO2e/MWh, considering a natural gas simple cycle (NGSC) with an efficiency of 32% and without a CCUS unit. Similarly, the results obtained in the present work for an NGCC with and without CCUS are 630 and 23 kgCO2e/MWh, respectively. Considering the delay time of 5 years to construct and operate the CCUS plant, there is an increase of ≈439% in the f-GTW-CCUS case. Moreover, comparing the CI of the assessed cases with that of pulverized coal energy production as reported in Feng et al. [64], coal is ≈95% higher than the worst case in the present study (f-GTW without CCUS).
Regarding CI from renewable energy, the cases with f-GTW-CCUS (delay = 0) and with delay = 5 years are demonstrated to be competitive with biomass energy [64], wind energy [68,69], and solar and hydro energy [69]. Those results suggest that the f-GTW-CCUS alternative is a solution to produce low-carbon energy and could play an important role in the energy transition while establishing energy security in the context of increasing geopolitical tensions.
Moreover, another environmental advantage of the f-GTW-CCUS is its zero score in the WF and TLT indicators, since the units are located offshore, and all water use comes from on-board desalination units. In terms of WF, biomass and hydro energy are the most water-intensive [64,69]. On the other hand, the water footprint for wind energy is negligible [67]. For the TLT indicator, hydro-energy production is the most penalized, since it requires large land areas for facility installation [66].
The environmental indicators reported in this section are determined considering a gate-to-gate boundary. Therefore, the carbon intensity values represent operational emissions associated with the assessed f-GTW configurations and the corresponding net electricity production within the process boundary. Upstream gas production, methane leakage, equipment manufacturing, decommissioning, and EOR-related downstream emissions are not included. Accordingly, the comparison with renewable and conventional power-generation alternatives should be interpreted as an operational-boundary comparison rather than a full life-cycle assessment.

4.4. Geopolitical Energy Disruption and Empirical Consistency of Stochastic Price Assumptions

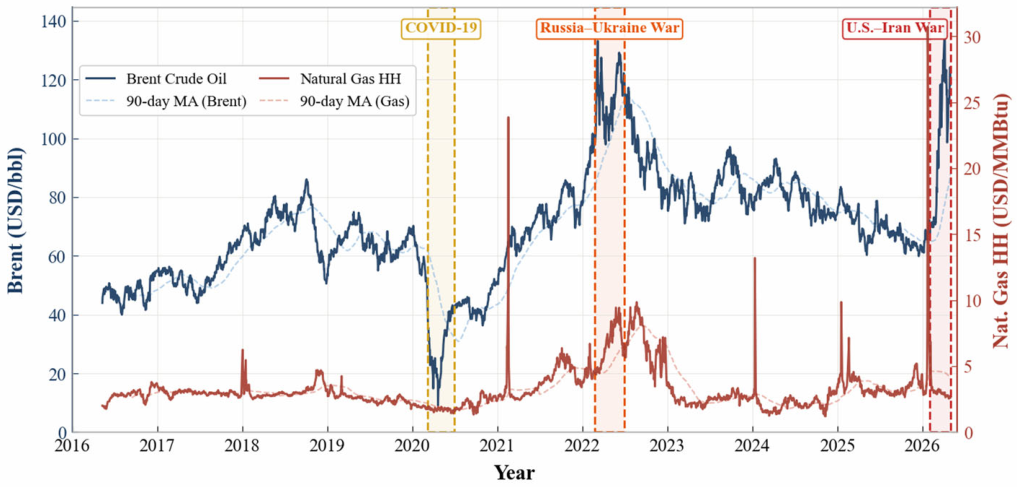
The empirical record of international energy commodity prices over the past decade provides direct support for the probabilistic framework adopted in this work. Figure 9 presents the daily evolution of Brent crude oil and Henry Hub natural gas spot prices, with three principal geopolitical crisis windows annotated. The Brent series exhibits a sharp collapse to below USD 20/bbl during the COVID-19 demand shock (2020), a peak exceeding USD 120/bbl during the Russia–Ukraine conflict (2022–present), and oscillations exceeding USD 100/bbl during the U.S.–Iran crisis (February 2026–present). The Henry Hub NG series shows dispersion comparable to that of Brent crude oil prices. In the COVID-19 pandemic, prices fell below USD 5/MMBtu. On the other hand, at the beginning of the Russia–Ukraine war, prices surpassed USD 5/MMBtu and ranged from USD 25 to 30/MMBtu during the 2026 crisis. Between these episodes, both series display mean-reverting behavior consistent with a long-run, non-crisis equilibrium. These features substantiate the stochastic specification adopted in Section 2.2. The mean values reported in Table 5 reflect the long-run central tendency of each commodity, while the standard deviations are inflated by the crisis episodes embedded in the calibration record, producing probability envelopes that extend naturally into the tails associated with geopolitical shocks.
The February–March 2026 geopolitical disruption of the Strait of Hormuz provides empirical validation of the energy security assumptions and stochastic commodity price volatilities adopted in this work. On 28 February 2026, the United States and Israel executed military strikes against Iranian infrastructure. Iran subsequently closed the Strait of Hormuz from 4 March 2026, disrupting approximately 20 million bpd of crude oil and petroleum products (approximately one-fifth of global supply). Approximately 110 billion m3 per year of liquefied natural gas (LNG) trade was suspended, nearly 19% of global LNG supply [70]. The International Energy Agency characterized this as the greatest energy security challenge in the history of the global oil market [71]. The magnitude of this O&G price shock empirically validates the stochastic input space adopted herein. Concerning the referred O&G prices’ shock, Goldman Sachs Commodities Research characterizes the price dynamics across three distinct scenarios, defined by the duration of disruption and magnitude of commercial oil inventory depletion [72].
(a)
Gradual recovery (1-month disruption): Brent prices baseline expectation of USD 71/bbl in 4Q2026. A 6% hit to global commercial inventories offset by 50% through strategic petroleum reserve (SPR) releases and Russian oil-on-water purchases. The scenario yields net upside of approximately USD 9/bbl over baseline expectation.
(b)
Sixty-Day Disruption: Brent prices average USD 93/bbl in 4Q2026. The supply shock generates a 20% hit to global commercial inventories. Even with increased SPR releases, ~70% of inventory depletion is not offset, resulting in ~USD 23/bbl upside over baseline prices.
(c)
Prolonged Disruption: Brent prices reach ~USD 110/bbl in 4Q2027, from persistent supply constraints [72].
Goldman Sachs identifies the risk premium as endogenous to market uncertainty required to offset inventory depletion risk. Rather than a fixed increment, the premium scales with perceived duration. As market participants gain certainty that flows will recover within weeks, prices compress toward the 1-month recovery scenario (USD 71/bbl). Conversely, if disruptions persist beyond two months or evidence of infrastructure scarring emerges, prices rise toward stress scenarios (USD 93–110/bbl). Goldman Sachs notes that Brent is likely to exceed its 2008 all-time high (~USD 147/bbl) should depressed flows persist and market focus remains on lengthier disruption risks [72].
The observed price range across Goldman Sachs scenarios spans approximately USD 39/bbl, roughly ±2.8 σ around the parametrized baseline (σoil = USD 24.77/bbl, μoil = USD 70/bbl). The 2 × σ scenario bounds (μ ± 2 × σ) produce an oil-price window of 20–120 USD/bbl, which encompasses Goldman Sachs’ outcomes. Thus, it empirically confirms that the Monte Carlo volatility herein assumed reflects realistic near-term commodity price dynamics under geopolitical supply disruption. The March 2026 price (>USD 100/bbl) falls comfortably within the 2 × σ envelope, validating the stochastic framework as neither conservative nor optimistic relative to actual market pricing under stress.
NG and LNG markets experienced equally severe disruptions, with infrastructure damage and extended supply constraints. Qatar, supplier of ~20% of global LNG, experienced direct attacks on energy infrastructure, including the 77 Mt per year (Mtpa) Ras Laffan LNG complex, with production damage estimated to reduce total Qatari LNG output nearly one-third in 2026 [72]. European TTF natural gas prices surged to EUR 61/MWh, approximately 90% above the pre-conflict baseline levels. This supply destruction creates gas-to-oil switching demand [72]. Goldman Sachs estimates that under a gradual recovery scenario with Qatari LNG ramp-up, TTF prices would decline to EUR 30–40/MWh in the second half of 2026. However, extended disruptions could increase TTF prices to USD 35/MMBTU [72].
These real-time price dynamics validate the NG stochastic parameters adopted in this work (μNG = USD 3.259/MMBtu, σNG = USD 1.15/MMBtu), corresponding to pre-conflict Henry Hub baseline assumptions, and confirm that NG pricing, while structurally correlated with crude oil dynamics (Section 2.2), also responds to its own supply-shock components, as observed during the 2026 disruption.
The 2026 geopolitical energy crisis reveals a critical structural advantage of floating gas-to-wire with CCUS (f-GTW-CCUS) sourced at the FPSO wellhead. Unlike LNG-dependent import economies facing European TTF price spikes [72], the f-GTW-CCUS platform operates on in situ associated gas recovered at the wellhead, as a byproduct of offshore crude oil production. This stranded, CO2-rich NG represents a cost liability when it is monetized through an NGCC with flue gas emitted without CO2 abatement (Case A).
Instead, Case B’s economic resilience derives from three structural mechanisms: (i) fixed-cost associated gas utilization (μNG = USD 3.259/MMBtu, σNG = USD 1.15/MMBtu), parametrizing mostly operational flow variance rather than market price volatility, (ii) oil price upside exposure via EOR monetization of the captured 492.2 t/h CO2, and (iii) low-carbon electricity production meeting decarbonization mandates. Monte Carlo analysis demonstrates that Case B maintains positive NPV across all parametrized volatility scenarios (σoil = USD 24.77/bbl, σNG = USD 1.15/MMBtu, σElectricity = USD 0.003/kWh). Critically, the 2026 crisis amplifies Case B’s advantage: Brent crude escalation from the baseline μoil = USD 70/bbl to >USD 100/bbl (observed) and stress scenarios reaching USD 110/bbl [72] directly increase EOR sales revenues by 43–57%, boosting projected NPV by MMUSD 6000–8000. Simultaneously, the absence of NG procurement exposure eliminates the major cost vulnerability facing conventional GTW systems. The structural immunity is confirmed by the parallel analysis showing that Case A (GTW without CCUS, dependent on electricity-only revenue) remains unfeasible (NPV < 0) across all scenarios.
The asymmetry between Case A and Case B is pronounced. The international energy markets face LNG supply constraints, elevated TTF pricing, and margin compression on conventional power generation. In contrast to Case A, the f-GTW-CCUS benefits from the oil peak prices. In fact, at the wellhead, Case B experiences no NG cost shock and benefits from amplified oil revenue (via EOR), with concurrent carbon credit support during the same crisis period. This combination, i.e., absence of NG market exposure coupled with direct oil price upside, creates a decarbonization pathway uniquely resilient to the 2026 geopolitical disruption. Furthermore, f-GTW-CCUS is a strategic option for rapid decarbonization of existing O&G infrastructure in regions with abundant stranded gas reserves, particularly under supply-shock conditions that reinforce fossil fuel price volatility and carbon policy urgency. The distribution of NPV outcomes and payback periods confirms that the f-GTW-CCUS architecture delivers feasible and economically attractive solutions even under the highest tested volatility scenarios and under conditions of carbon taxation. Simultaneously, it provides protection against the global energy supply disruptions that characterize the 2026 crisis.

4.5. S.W.O.T. Analysis

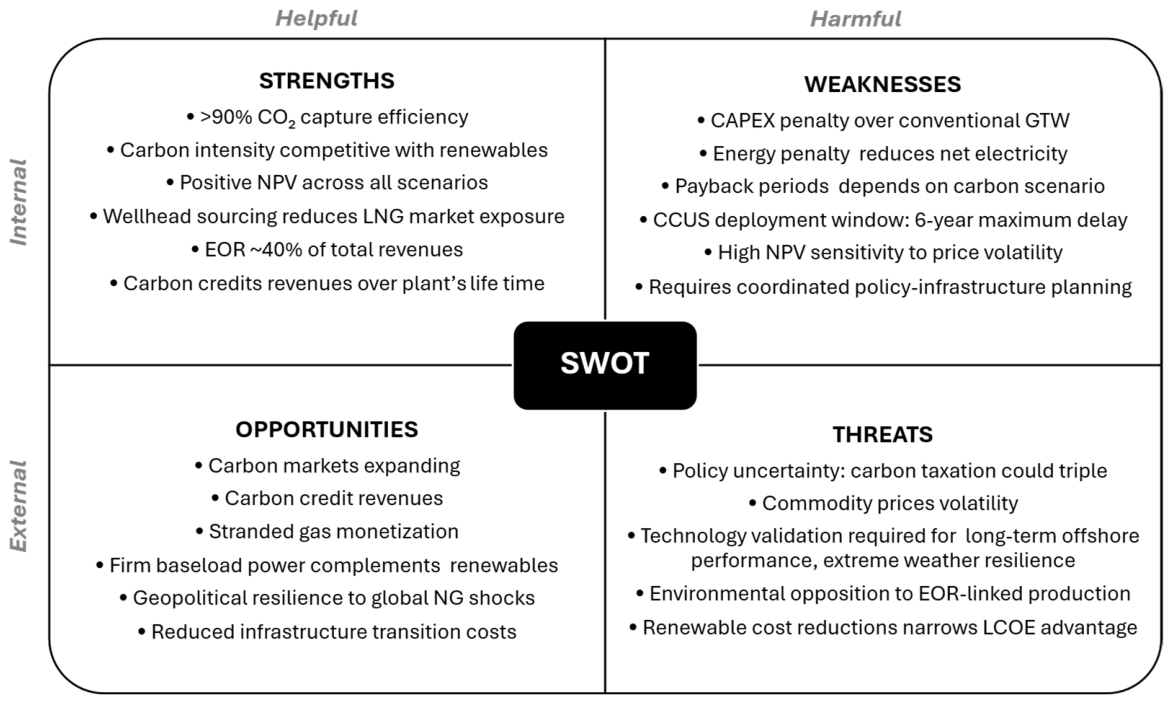
Figure 10 presents an assessment of the Strengths, Weaknesses, Opportunities, and Threats (SWOT) of f-GTW-CCUS in the context of global decarbonization policies and energy market dynamics.
Interlenghi’s [13] results show superior CO2 capture performance (MEA achieves over 90% CO2 capture). Consequently, it reduces NGCC’s carbon intensity to 23 kgCO2e/MWh, rendering it competitive with renewable technologies: solar-PV CI is 10–50 kgCO2e/MWh, wind CI is 5–15 kgCO2e/MWh (onshore) and 10–20 kgCO2e /MWh (offshore) and substantially lower than CI of conventional gas-to-wire without CCUS, of 630 kgCO2e/MWh. The economic analysis shows that the low-carbon fossil intensity has competitive LCOE: USD 67.15/MWh compares favorably to global renewable benchmarks of LCOEsolar-PV = USD 30–80/MWh; LCOEwind = USD 25–60/MWh (onshore) and USD 60–120/MWh (offshore) while providing firm, dispatchable baseload power with capacity factors > 85%. Across all Monte Carlo scenarios, including carbon taxation scenarios up to USD 100/tCO2e, Case B maintains positive NPV (30-year lifetime), while Case A (f-GTW without CCUS) exhibits negative NPV across all scenarios.
The geopolitical analysis suggests that f-GTW-CCUS has structural market immunity; operating on wellhead-sourced in situ associated gas (“reservoir-to-wire”), f-GTW-CCUS eliminates exposure to volatile global NG markets. The 2026 geopolitical crisis validates this advantage: while conventional GTW systems face NG cost shocks (TTF > EUR 60/MWh), f-GTW-CCUS feedstock costs remain closer to the baseline (μ = 3.259 USD/MMBtu). Another factor enhancing resilience is the revenue diversification from EOR monetization of the captured CO2 (43% of revenues). It is herein named “Asymmetric Resilience”: crude oil price escalation, with Brent reaching above USD 100/bbl, amplifies project NPV, improving feasibility. The other additional revenue is from carbon credits, accumulating over 30 years up to MMUSD 2585 at USD 12.50–50/tCO2e.
With these strengths come opportunities. Carbon market expansion shows that carbon pricing is accelerating globally, increasing carbon credit value. For stranded gas reserves, f-GTW-CCUS converts CO2-rich NG (>44% mol) from flared/reinjected assets into revenue-generating electricity and EOR-derived extra oil production monetizing CO2. In the context of energy transition, low-carbon electricity from NG creates grid stability and firm baseload power. NGCC has a capacity factor > 85%, complementing variable renewables as renewable penetration increases in the national grids. A very up-to-date issue is the geopolitical energy resilience from f-GTW-CCUS, suggested by the 2026 energy crisis. The wellhead-sourced configuration of f-GTW-CCUS is uniquely positioned to support low-carbon energy security during global commodity supply disruptions. It also enables rapid decarbonization of existing infrastructure rather than complete energy system replacement, reducing transition costs for O&G-producing nations.
However, these benefits and opportunities require capital-intensive deployment, with FCI 6.4% above that of conventional gas-to-wire, though this modest premium is offset by superior long-term economics and carbon credit revenue. Another weakness of f-GTW-CCUS is the energy penalty intrinsic to post-combustion carbon-capture processes, which reduces net power output from 847.51 MW (Case A, no CCUS) to 612.30 MW (Case B, with CCUS). The CAPEX and OPEX increases impact payback time, ranging from 3–17 years depending on carbon scenarios, which can create financing barriers in higher-risk markets. Also, the work has shown that CCUS deployment timing is critical to the economic performance of f-GTW-CCUS. A maximum 6-year delay tolerance was estimated under high carbon taxation, imposing 4.84 Mt CO2 per delayed year, requiring coordinated policy-infrastructure planning. Another weakness is the project’s sensitivity to carbon price: NPV varies by ~106% across 2 × σ volatility scenarios.
Threats also exist beyond the commodity price volatility evaluated above. For instance, policy uncertainties and the carbon price volatility could lead to a scenario of carbon taxation rates increasing without parallel carbon credit mechanisms, which would alter project economics. There are also technology and infrastructure risks because post-combustion capture, although mature, faces the challenge of operating long-term offshore with extreme weather resilience, requiring continued validation. Also, EOR-based CO2 utilization faces scrutiny in some jurisdictions; public acceptance requires clear communication of carbon intensity advantages. Lastly, f-GTW-CCUS faces competition from declining renewable costs driven by ongoing learning curve effects, which narrow its LCOE advantage. However, firm baseload capability and competitive carbon intensity remain structural differentiators.
Summarizing, f-GTW-CCUS economic viability is contingent on three policy enablers. First, the 6-year critical deployment window (identified as a weakness) is not a technical constraint but a policy-driven threshold: under high carbon taxation scenarios, delaying CCUS deployment by 6 years from project sanction reduces expected NPV by approximately 40%. This implies that carbon pricing policy credibility is a prerequisite for financing institutions to approve f-GTW-CCUS projects. Second, the capital intensity weakness can be mitigated through green financing mechanisms (export credit agency support, green bonds, concessional lending) that currently undervalue the structural wellhead-immunity advantage. Third, the NPV sensitivity to carbon taxation must be reduced by legislative mechanisms that create irreversible carbon price floors with notice periods (e.g., minimum 5-year or 10-year amendment notice), thereby reducing financing cost of capital. These policy interventions directly address the quantified weaknesses and unlock the identified strengths.
The SWOT Opportunities section identifies “Geopolitical Energy Resilience” as a strategic asset validated by the 2026 Strait of Hormuz crisis. This opportunity, however, requires integration into energy security policy frameworks that currently undervalue decarbonization infrastructure. Specifically, regulatory recognition of wellhead-sourced f-GTW-CCUS as a “strategic energy security asset” (equivalent to LNG diversification or strategic petroleum reserve expansion) would enable the following to take place: (i) fast-track permitting, allowing a reduction in the 36-month timeline to 12–18 months and thus increasing NPV; (ii) co-sponsorship of subsea infrastructure protection during geopolitical disruptions; (iii) cross-governance structures linking energy, climate, and defense policy objectives.
The 2026 crisis demonstrated that f-GTW-CCUS operates on wellhead-sourced feedstock with no exposure to LNG market volatility, while amplifying crude price exposure. This countercyclical behavior—improving feasibility during crude price spikes and energy supply shocks—is unique among decarbonization pathways and positions f-GTW-CCUS as a critical resilience option for O&G-producing nations seeking rapid decarbonization without sacrificing energy security. A suggested policy action is the incorporation of f-GTW-CCUS into national energy security strategies (G7, BRICS, IEA member states) with binding deployment timelines to unlock the geopolitical opportunity identified in this SWOT analysis.

5. Conclusions

The work analyzes the resilience of low-carbon f-GTW-CCUS in the context of mandatory carbon taxation and geopolitical energy market disruptions. Monte Carlo analysis (10,000 runs under σ-scenarios of 2 × σ, σ, and σ/2 around the means and standard deviations reported in Table 5), with oil, NG, and electricity as stochastic variables, shows that wellhead-sourced f-GTW-CCUS—fed by stranded associated gas rather than gas procured from volatile global markets—reduces direct exposure to volatility in the internationally traded LNG feedstock price under the assumed scenarios. The 2026 geopolitical crisis validates this advantage: while European TTF natural gas prices escalate amid Strait of Hormuz disruption, f-GTW-CCUS feedstock costs remain nearly constant (μNG = 3.259 USD/MMBtu, σNG = 1.15 USD/MMBtu). Simultaneously, crude price escalation (>100 USD/bbl) amplifies EOR monetization, providing superior economic performance. This asymmetric resilience, i.e., no cost shock with amplified revenue, confirms Case B feasibility improves during commodity price disruptions.
The f-GTW-CCUS process achieves promising and competitive advantages across environmental metrics: reduced land/water footprint, carbon intensity of 23 kgCO2e/MWh (competitive with renewables), and minimized water–land nexus via offshore desalination. However, CCUS deployment delays reduce carbon performance significantly. Under high carbon taxation, the critical viability tolerance is a delay of ~6 years, extending to ~10 years with carbon credits (Case D). Monte Carlo analysis demonstrates positive NPV feasibility across all parametrized volatility scenarios despite carbon taxation. The cash flow analysis reveals fundamental differentiation: Case A (f-GTW without CCUS) exhibits permanent economic deficit—630 kgCO2e/MWh emissions incur mounting carbon taxation penalties—while electricity revenue alone cannot offset these liabilities. Case B achieves positive cash flow through dual revenue—electricity plus CO2 monetization via EOR. For O&G producing regions with stranded gas reserves, f-GTW-CCUS represents a critical decarbonization pathway combining carbon intensity reduction (630→23 kgCO2e/MWh), cost-competitive LCOE (USD 67.15/MWh), economic feasibility under commodity price volatility and carbon taxation, and structural immunity to global energy supply disruptions. The 2026 geopolitical crisis provides an empirical consistency assessment that this resilience is operationally robust under extreme market conditions. These outcomes are conditional on the parameterization adopted in the present work and remain sensitive to the assumed oil price, carbon pricing, EOR yield, and market uncertainty.
The environmental assessment was conducted under a gate-to-gate operational boundary. Therefore, the reported carbon intensity values reflect process boundary emissions and net electricity production, and do not include methane leakage, equipment manufacturing, decommissioning, or EOR-related downstream emissions.

Limitations and Future Work

The literature on the application of the GTW concept in floating power generation plants with CCUS remains limited, introducing technical and economic uncertainties. For instance, submarine HVDC cables over long distances and in ultra-deep waters pose feasibility challenges, and unidentified offshore costs were herein assumed to be twice those of onshore counterparts. Furthermore, a significant portion of the revenues relies on the sale of electricity to the onshore grid, requiring governmental decisions to include this source in the electricity matrix. Energy security, although discussed qualitatively through the SWOT analysis (Section 4.5) and the 2026 geopolitical validation (Section 4.4), was not addressed via a dedicated quantitative framework in the present work.
For future work, the authors suggest two main research directions: (i) the application of the Monte Carlo method to renewable energy sources, considering their respective main economic variables and comparing the resulting performance with that of NGCC with and without CCUS reported herein; and (ii) the execution of a complete cradle-to-grave life cycle assessment (LCA) of the f-GTW-CCUS technology, extending the gate-to-gate boundaries adopted in the present work to encompass upstream feedstock extraction, manufacturing of process equipment and subsea infrastructure, operational stage, and end-of-life decommissioning.

Author Contributions

I.B.B.M.: Conceptualization; Data curation; Formal analysis; Investigation; Methodology; Software; Validation; Visualization; Writing—original draft. I.B.S.P.: Conceptualization; Data curation; Formal analysis; Investigation; Methodology; Software; Validation; Visualization; Writing—original draft. C.R.V.M.: Conceptualization; Formal analysis; Methodology; Project administration; Resources; Supervision, Writing—original draft. J.L.d.M.: Conceptualization; Formal analysis; Methodology; Project administration; Resources; Supervision, Writing—original draft. O.d.Q.F.A.: Conceptualization; Funding acquisition; Investigation; Methodology; Project administration; Resources; Supervision; Validation; Writing—review and editing. All authors have read and agreed to the published version of the manuscript.

Funding

This research was funded by PETROBRAS (Grant Cenpes/ANP 2017/00250-8) and CNPq (Grant 310958/2025-3).

Data Availability Statement

The code developed for the Monte Carlo model is available from the corresponding author upon reasonable request.

Acknowledgments

Icaro B. Boa Morte would like to thank the National Agency of Petroleum, Natural Gas and Biofuels PRH17.1/ANP-FINEP (FINEP No. 01.19.0220.00) for the scholarship.

Conflicts of Interest

The authors declare no conflicts of interest.

Abbreviations

The following abbreviations are used in this manuscript:
CCScarbon capture and storage
CCUScarbon capture, utilization, and storage
CIcarbon intensity
rddiscount rate
EORenhanced oil recovery
GTWgas-to-wire
HVDChigh-voltage direct current
MEAmonoethanolamine
NGnatural gas
NGCCnatural gas combined cycle
MMUSDUSD 1 million
PCC-MEApost-combustion capture with aqueous MEA
AP, GAPNet and gross annual profits (MMUSD/y)
COL, COMCosts of labor and of manufacturing (MMUSD/y)
CUT, DEPRCost of utilities and depreciation (MMUSD/y)
FCIFixed capital investment (MMUSD)
LCOELevelized cost of energy (USD/MWh)
NPVNet present value (MMUSD)
REVRevenues (MMUSD/y)

References

  1. UNFCC. Kyoto Protocol Reference Manual: On Accounting of Emissions and Assigned Amount; United Nations Framework Convention on Climate Change: Bonn, Germany, 2008; p. 130. [Google Scholar]
  2. UNFCC. Adoption of the Paris Agreement; United Nations Framework Convention on Climate Change: Bonn, Germany, 2015. [Google Scholar]
  3. UN. COP26 The Glasgow Climate Pact; United Nations: New York, NY, USA, 2021; p. 28. Available online: https://webarchive.nationalarchives.gov.uk/ukgwa/20230401054904/https://ukcop26.org/wp-content/uploads/2021/11/COP26-Presidency-Outcomes-The-Climate-Pact.pdf (accessed on 8 May 2026).
  4. IPCC. Climate Change 2022: Impacts, Adaptation and Vulnerability; Working Group II Contribution to the Sixth Assessment Report of the Intergovernmental Panel on Climate Change; IPCC: Geneva, Switzerland, 2022; pp. 1–3676. [Google Scholar]
  5. Bugaje, A.-A.B.; Dioha, M.O.; Abraham-Dukuma, M.C.; Wakil, M. Rethinking the Position of Natural Gas in a Low-Carbon Energy Transition. Energy Res. Soc. Sci. 2022, 90, 102604. [Google Scholar] [CrossRef]
  6. Szabo, J. Energy Transition or Transformation? Power and Politics in the European Natural Gas Industry’s Trasformismo. Energy Res. Soc. Sci. 2022, 84, 102391. [Google Scholar] [CrossRef]
  7. Gürsan, C.; de Gooyert, V. The Systemic Impact of a Transition Fuel: Does Natural Gas Help or Hinder the Energy Transition? Renew. Sustain. Energy Rev. 2021, 138, 110552. [Google Scholar] [CrossRef]
  8. International Energy Agency. The Role of Gas in Today’s Energy Transitions; IEA: Paris, France, 2019; Volume 59, p. 110. [Google Scholar]
  9. World Bank Group. State and Trends of Carbon Pricing 2021; World Bank: Washington, DC, USA, 2021. [Google Scholar]
  10. Agrawal, S.; Tiwari, G.N. Overall Energy, Exergy and Carbon Credit Analysis by Different Type of Hybrid Photovoltaic Thermal Air Collectors. Energy Convers. Manag. 2012, 65, 628–636. [Google Scholar] [CrossRef]
  11. Woo, J.; Fatima, R.; Kibert, C.J.; Newman, R.E.; Tian, Y.; Rinker, R.S.S.M. Applying Blockchain Technology for Building Energy Performance Measurement, Reporting, and Verification (MRV) and the Carbon Credit Market: A Review of the Literature. Build. Environ. 2021, 205, 108199. [Google Scholar] [CrossRef]
  12. de Queiroz Fernandes Araújo, O.; de Medeiros, J.L. Carbon Capture and Storage Technologies: Present Scenario and Drivers of Innovation. Curr. Opin. Chem. Eng. 2017, 17, 22–34. [Google Scholar] [CrossRef]
  13. Interlenghi, S.F.; de Pádua F. Silva, R.; de Medeiros, J.L.; de Q. Fernandes Araújo, O. Low-Emission Offshore Gas-To-Wire from Natural Gas with Carbon Dioxide: Supersonic Separator Conditioning and Post-Combustion Decarbonation. Energy Convers. Manag. 2019, 195, 1334–1349. [Google Scholar] [CrossRef]
  14. Araújo, O.Q.F.; Medeiros, J.L.D. How Is the Transition Away from Fossil Fuels Doing, and How Will the Low-Carbon Future Unfold? Clean Technol. Environ. Policy 2021, 23, 1385–1388. [Google Scholar] [CrossRef]
  15. Rúa, J.; Bui, M.; Nord, L.O.; Dowell, N.M. Does CCS Reduce Power Generation Flexibility? A Dynamic Study of Combined Cycles with Post-Combustion CO2 Capture. Int. J. Greenh. Gas Control 2020, 95, 102984. [Google Scholar] [CrossRef]
  16. Bhattacharyya, D.; Miller, D.C. Post-Combustion CO2 Capture Technologies—A Review of Processes for Solvent-Based and Sorbent-Based CO2 Capture. Curr. Opin. Chem. Eng. 2017, 17, 78–92. [Google Scholar] [CrossRef]
  17. Grasa, G.S.; Abanades, J.C. CO2 Capture Capacity of CaO in Long Series of Carbonation/Calcination Cycles. Ind. Eng. Chem. Res. 2006, 45, 8846–8851. [Google Scholar] [CrossRef]
  18. Thattai, A.T.; Wittebrood, B.J.; Woudstra, T.; Geerlings, J.J.C.; Aravind, P.V. Thermodynamic System Studies for a Natural Gas Combined Cycle (NGCC) Plant with CO2 Capture and Hydrogen Storage with Metal Hydrides. Energy Procedia 2014, 63, 1996–2007. [Google Scholar] [CrossRef][Green Version]
  19. Liu, S.; Li, H.; Zhang, K.; Lau, H.C. Techno-Economic Analysis of Using Carbon Capture and Storage (CCS) in Decarbonizing China’s Coal-Fired Power Plants. J. Clean. Prod. 2022, 351, 131384. [Google Scholar] [CrossRef]
  20. Dillon, D.J.; Panesar, R.S.; Wall, R.A.; Allam, R.J.; White, V.; Gibbins, J.; Haines, M.R. Oxy-Combustion Processes for CO2 Capture from Advanced Supercritical PF and NGCC Power Plant. In Greenhouse Gas Control Technologies 7; Elsevier: Amsterdam, The Netherlands, 2005; pp. 211–220. [Google Scholar] [CrossRef]
  21. Kanniche, M.; Gros-Bonnivard, R.; Jaud, P.; Valle-Marcos, J.; Amann, J.M.; Bouallou, C. Pre-Combustion, Post-Combustion and Oxy-Combustion in Thermal Power Plant for CO2 Capture. Appl. Therm. Eng. 2010, 30, 53–62. [Google Scholar] [CrossRef]
  22. Wang, M.; Lawal, A.; Stephenson, P.; Sidders, J.; Ramshaw, C. Post-Combustion CO2 Capture with Chemical Absorption: A State-of-the-Art Review. Chem. Eng. Res. Des. 2011, 89, 1609–1624. [Google Scholar] [CrossRef]
  23. Plaza, J.M.; Wagener, D.V.; Rochelle, G.T. Modeling CO2 Capture with Aqueous Monoethanolamine. Int. J. Greenh. Gas Control 2010, 4, 161–166. [Google Scholar] [CrossRef]
  24. Otitoju, O.; Oko, E.; Wang, M. Technical and Economic Performance Assessment of Post-Combustion Carbon Capture Using Piperazine for Large Scale Natural Gas Combined Cycle Power Plants through Process Simulation. Appl. Energy 2021, 292, 116893. [Google Scholar] [CrossRef]
  25. Mostafavi, E.; Ashrafi, O.; Navarri, P. Assessment of Process Modifications for Amine-Based Post-Combustion Carbon Capture Processes. Clean. Eng. Technol. 2021, 4, 100249. [Google Scholar] [CrossRef]
  26. Sultan, H.; Quach, T.Q.; Muhammad, H.A.; Bhatti, U.H.; Lee, Y.D.; Hong, M.G.; Baek, I.H.; Chan, N.S. Advanced Post Combustion CO2 Capture Process—A Systematic Approach to Minimize Thermal Energy Requirement. Appl. Therm. Eng. 2021, 184, 116285. [Google Scholar] [CrossRef]
  27. Jansen, D.; Gazzani, M.; Manzolini, G.; Dijk, E.V.; Carbo, M. Pre-Combustion CO2 Capture. Int. J. Greenh. Gas Control 2015, 40, 167–187. [Google Scholar] [CrossRef]
  28. Lau, H.C.; Ramakrishna, S.; Zhang, K.; Radhamani, A.V. The Role of Carbon Capture and Storage in the Energy Transition. Energy Fuels 2021, 35, 7364–7386. [Google Scholar] [CrossRef]
  29. Brigagão, G.V.; de Medeiros, J.L.; de Queiroz F. Araújo, O.; Mikulčić, H.; Duić, N. A Zero-Emission Sustainable Landfill-Gas-to-Wire Oxyfuel Process: Bioenergy with Carbon Capture and Sequestration. Renew. Sustain. Energy Rev. 2021, 138, 110686. [Google Scholar] [CrossRef]
  30. Serrano, J.R.; Martín, J.; Gomez-Soriano, J.; Raggi, R. Theoretical and Experimental Evaluation of the Spark-Ignition Premixed Oxy-Fuel Combustion Concept for Future CO2 Captive Powerplants. Energy Convers. Manag. 2021, 244, 114498. [Google Scholar] [CrossRef]
  31. Windén, B.; Chen, M.; Okamoto, N.; Kim, D.K.; McCaig, E.; Shenoi, A.; Wilson, P. Investigation of Offshore Thermal Power Plant with Carbon Capture as an Alternative to Carbon Dioxide Transport. Ocean Eng. 2014, 76, 152–162. [Google Scholar] [CrossRef]
  32. Brito, T.L.F.; Galvão, C.; Fonseca, A.F.; Costa, H.K.M.; dos Santos, E.M. A Review of Gas-to-Wire (GtW) Projects Worldwide: State-of-Art and Developments. Energy Policy 2022, 163, 112859. [Google Scholar] [CrossRef]
  33. Nguyen, T.V.; Tock, L.; Breuhaus, P.; Maréchal, F.; Elmegaard, B. CO2-Mitigation Options for the Offshore Oil and Gas Sector. Appl. Energy 2016, 161, 673–694. [Google Scholar] [CrossRef]
  34. Andrei, M.; Sammarco, G. Gas to Wire with Carbon Capture & Storage: A Sustainable Way for on-Site Power Generation by Produced Gas. In Abu Dhabi International Petroleum Exhibition and Conference; SPE: Richardson, TX, USA, 2017. [Google Scholar] [CrossRef]
  35. Roussanaly, S.; Aasen, A.; Anantharaman, R.; Danielsen, B.; Jakobsen, J.; Heme-De-Lacotte, L.; Neji, G.; Sødal, A.; Wahl, P.E.; Vrana, T.K.; et al. Offshore Power Generation with Carbon Capture and Storage to Decarbonise Mainland Electricity and Offshore Oil and Gas Installations: A Techno-Economic Analysis. Appl. Energy 2019, 233–234, 478–494. [Google Scholar] [CrossRef]
  36. Grant, N.; Hawkes, A.; Mittal, S.; Gambhir, A. Confronting Mitigation Deterrence in Low-Carbon Scenarios. Environ. Res. Lett. 2021, 16, 064099. [Google Scholar] [CrossRef]
  37. Köse, N.; Ünal, E. The Effects of the Oil Price and Oil Price Volatility on Inflation in Turkey. Energy 2021, 226, 120392. [Google Scholar] [CrossRef]
  38. Liu, Y.; Sharma, P.; Jain, V.; Shukla, A.; Shabbir, M.S.; Tabash, M.I.; Chawla, C. The Relationship among Oil Prices Volatility, Inflation Rate, and Sustainable Economic Growth: Evidence from Top Oil Importer and Exporter Countries. Resour. Policy 2022, 77, 102674. [Google Scholar] [CrossRef]
  39. Bourghelle, D.; Jawadi, F.; Rozin, P. Oil Price Volatility in the Context of COVID-19. Int. Econ. 2021, 167, 39–49. [Google Scholar] [CrossRef]
  40. Perifanis, T.; Dagoumas, A. Price and Volatility Spillovers between the US Crude Oil and Natural Gas Wholesale Markets. Energies 2018, 11, 2757. [Google Scholar] [CrossRef]
  41. Carminati, H.B.; de Medeiros, J.L.; de Queiroz, F.; Araújo, O. Sustainable Gas-to-Wire via Dry Reforming of Carbonated Natural Gas: Ionic-Liquid Pre-Combustion Capture and Thermodynamic Efficiency. Renew. Sustain. Energy Rev. 2021, 151, 111534. [Google Scholar] [CrossRef]
  42. Flórez-Orrego, D.; Freire, R.A.; da Silva, J.A.; Neto, C.A.; de Oliveira Junior, S. Centralized Power Generation with Carbon Capture on Decommissioned Offshore Petroleum Platforms. Energy Convers. Manag. 2022, 252, 115110. [Google Scholar] [CrossRef]
  43. Barbera, E.; Mio, A.; Pavan, A.M.; Bertucco, A.; Fermeglia, M. Fuelling Power Plants by Natural Gas: An Analysis of Energy Efficiency, Economical Aspects and Environmental Footprint Based on Detailed Process Simulation of the Whole Carbon Capture and Storage System. Energy Convers. Manag. 2022, 252, 115072. [Google Scholar] [CrossRef]
  44. Turton, R.; Bailie, R.C.; Whiting, W.B.; Shaeiwitz, J.A.; Bhattacharyya, D. Analysis, Synthesis, and Design of Chemical Processes, 4th ed.; Goodwin, B., Fuller, J., Ryan, E., Wood, B., Eds.; Pearson Education: London, UK, 2012; Volume 4, ISBN 978-0-13-261812-0. [Google Scholar]
  45. Lin, B.; Tan, Z. How Much Impact Will Low Oil Price and Carbon Trading Mechanism Have on the Value of Carbon Capture Utilization and Storage (CCUS) Project? Analysis Based on Real Option Method. J. Clean. Prod. 2021, 298, 126768. [Google Scholar] [CrossRef]
  46. Araújo, O.D.Q.F.; Reis, A.D.C.; De Medeiros, J.L.; Nascimento, J.F.D.; Grava, W.M.; Musse, A.P.S. Comparative Analysis of Separation Technologies for Processing Carbon Dioxide Rich Natural Gas in Ultra-Deepwater Oil Fields. J. Clean. Prod. 2017, 155, 12–22. [Google Scholar] [CrossRef]
  47. Forecast International. The Market for Gas Turbine Marine Engines; Forecast International: Sandy Hook, CT, USA, 2010; p. 24. [Google Scholar]
  48. Mongird, K.; Viswanathan, V.; Balducci, P.; Alam, J.; Fotedar, V.; Koritarov, V.; Hadjerioua, B. Energy Storage Technology and Cost Characterization Report; Pacific Northwest National Laboratory: Richland, WA, USA, 2019. [Google Scholar]
  49. Angays, P.; Guilhem, J.C.; Arjona, J. Monetization of Associated Gases from Offshore Oil Fields by Electrical Power Generation. In PCIC Europe; IEEE: Piscataway, NJ, USA, 2013. [Google Scholar]
  50. Cheng, F.; Small, A.A.; Colosi, L.M. The Levelized Cost of Negative CO2 Emissions from Thermochemical Conversion of Biomass Coupled with Carbon Capture and Storage. Energy Convers. Manag. 2021, 237, 114115. [Google Scholar] [CrossRef]
  51. Park, J.H.; Heo, J.Y.; Lee, J.I. Techno-Economic Study of Nuclear Integrated Liquid Air Energy Storage System. Energy Convers. Manag. 2022, 251, 114937. [Google Scholar] [CrossRef]
  52. Rubin, E.S.; Short, C.; Booras, G.; Davison, J.; Ekstrom, C.; Matuszewski, M.; McCoy, S. A Proposed Methodology for CO2 Capture and Storage Cost Estimates. Int. J. Greenh. Gas Control 2013, 17, 488–503. [Google Scholar] [CrossRef]
  53. Wu, C.; Buyya, R. Real Option Theory and Monte Carlo Simulation. In Cloud Data Centers and Cost Modeling; Morgan Kaufmann: Burlington, MA, USA, 2015; pp. 707–772. [Google Scholar] [CrossRef]
  54. EIA Petroleum and Others Liquids Spot Price 2022. Available online: https://www.eia.gov/dnav/pet/pet_pri_spt_s1_a.htm (accessed on 8 May 2026).
  55. EIA Natural Gas Spot and Futures Prices (NYMEX) 2022. Available online: https://www.eia.gov/dnav/ng/ng_pri_fut_s1_d.htm (accessed on 25 May 2026).
  56. EIA Electricity Sales (Consumption), Revenue, Prices & Customers 2022. Available online: https://www.eia.gov/electricity/sales_revenue_price (accessed on 25 May 2026).
  57. Araújo, O.Q.F.; Medeiros, J.L.D. Sustainable and Equitable Decarbonization. Clean Technol. Environ. Policy 2022, 24, 1945–1947. [Google Scholar] [CrossRef] [PubMed]
  58. Zhang, X.; Liao, Q.; Wang, Q.; Wang, L.; Qiu, R.; Liang, Y.; Zhang, H. How to Promote Zero-Carbon Oilfield Target? A Technical-Economic Model to Analyze the Economic and Environmental Benefits of Recycle-CCS-EOR Project. Energy 2021, 225, 120297. [Google Scholar] [CrossRef]
  59. Rubin, E.S.; Davison, J.E.; Herzog, H.J. The Cost of CO2 Capture and Storage. Int. J. Greenh. Gas Control 2015, 40, 378–400. [Google Scholar] [CrossRef]
  60. Stehly, T.; Beiter, P.; Duffy, P. 2019 Cost of Wind Energy Review; National Renewable Energy Laboratory: Golden, CO, USA, 2020; p. 68.
  61. Badouard, T.; Oliveira, D.M.D.; Yearwood, J.; Torres, P. Cost of Energy (LCOE)—Energy Costs, Taxes and the Impact of Government Interventions on Investments; Publications Office of the European Union: Luxembourg, 2020; p. 62. [Google Scholar]
  62. Jones-Albertus, R.; Feldman, D.; Fu, R.; Horowitz, K.; Woodhouse, M. Technology Advances Needed for Photovoltaics to Achieve Widespread Grid Price Parity. Prog. Photovolt. Res. Appl. 2016, 24, 1272–1283. [Google Scholar] [CrossRef]
  63. IPCC. Climate Change 2007 Mitigation of Climate Change; IPCC: Geneva, Switzerland, 2007; Volume 9780521880, pp. 1–861. [Google Scholar]
  64. Feng, K.; Hubacek, K.; Siu, Y.L.; Li, X. The Energy and Water Nexus in Chinese Electricity Production: A Hybrid Life Cycle Analysis. Renew. Sustain. Energy Rev. 2014, 39, 342–355. [Google Scholar] [CrossRef]
  65. Zhu, Y.; Jiang, S.; Zhao, Y.; Li, H.; He, G.; Li, L. Life-Cycle-Based Water Footprint Assessment of Coal-Fired Power Generation in China. J. Clean. Prod. 2020, 254, 120098. [Google Scholar] [CrossRef]
  66. Fthenakis, V.; Kim, H.C. Land Use and Electricity Generation: A Life-Cycle Analysis. Renew. Sustain. Energy Rev. 2009, 13, 1465–1474. [Google Scholar] [CrossRef]
  67. Gerbens-Leenes, P.W.; Hoekstra, A.Y.; van der Meer, T. The Water Footprint of Energy from Biomass: A Quantitative Assessment and Consequences of an Increasing Share of Bio-Energy in Energy Supply. Ecol. Econ. 2009, 68, 1052–1060. [Google Scholar] [CrossRef]
  68. Al-Behadili, S.H.; El-Osta, W.B. Life Cycle Assessment of Dernah (Libya) Wind Farm. Renew. Energy 2015, 83, 1227–1233. [Google Scholar] [CrossRef]
  69. WNA. Comparison of Lifecycle Greenhouse Gas Emissions of Various Electricity Generation Sources; World Nuclear Association: London, UK, 2011; Volume 525, p. 10. [Google Scholar]
  70. Oil Market Report—March 2026—Analysis—IEA. Available online: https://www.iea.org/reports/oil-market-report-march-2026 (accessed on 10 May 2026).
  71. 2026 Energy Crisis Policy Response Tracker—Data Tools. Available online: https://www.iea.org/data-and-statistics/data-tools/2026-energy-crisis-policy-response-tracker (accessed on 10 May 2026).
  72. Goldman Sachs Research Iran Conflict: How Long and How Bad? Goldman Sachs Equity Research 2026. Available online: https://www.goldmansachs.com/pdfs/insights/goldman-sachs-research/iran-conflict-how-long-and-how-bad/report.pdf (accessed on 8 April 2026).
Figure 1. Mental map of the adopted methodology: (a) the case studies and scenarios for the exogenous economic and policy-related inputs are defined (this work, in green); (b) the process synthesis, simulation premises, and process design simulation the technical dimensions (energy efficiency, net power produced, and avoided emissions, in green) are taken from Interlenghi et al. [13] (in blue); and (c) the economic and environmental metrics are computed (in green).
Processes 14 01791 g001
Figure 2. NPV (MMUSD) sensitivity analyses for Case A, considering the following: (i) progressive low scenario of carbon taxation (W/CO2 Tax)—started from the 5th year; and (ii) without progressive low scenario of carbon taxation (W/O CO2 Tax). The discount rate (rd) impact on NPV is shown for rd = 10%, rd = 5%, and rd = 3%.
Processes 14 01791 g002
Figure 3. Sensitivity analysis of NPV (MMUSD) with respect to electricity price (USD/kWh) for Case A, calculated in the present work via Monte Carlo simulation at rd = 10% and σ-scenarios of 2 × σ, σ, and σ/2 (Table 5): (a) Case A—W/O CO2 Tax; (b) Case A—W/CO2 Tax (low carbon tax scenario, Table 3).
Processes 14 01791 g003
Figure 4. NPV (MMUSD) versus payback (years) for Case B under the following conditions: (a) without carbon tax, (b) with low carbon tax, (c) with medium carbon tax, and (d) with high carbon tax.
Processes 14 01791 g004
Figure 5. NPV (MMUSD) variation according to the oil prices: USD 40/bbl (pessimistic); USD 70/bbl (standard); and USD 100/bbl (optimistic), with standard deviation of 2 × σ, σ, σ/2. NG and Electricity prices remained fixed following Table 5, and high carbon tax policy according to Table 3 is considered; and rd = 10% (conservative value).
Processes 14 01791 g005
Figure 6. (a) Cases A, C and D at 1st year of operation, (b) Case B at 1st year of operation, (c) Case A at 30th year of operation, (d) Case B at 30th year of operation, (e) Case C at 30th year of operation, and (f) Case D at 30th year of operation; DICC represents the direct and indirect carbon cost.
Processes 14 01791 g006
Figure 7. NPV variation considering different carbon tax scenarios and proposed credit policies (Table 3) and disruptive scenarios—(i) “Disruptive Carbon Tax” and (ii) “Disruptive Carbon Tax and Credit”—which increase by 300% the severity of the carbon policies of Table 3. The maximum delay tolerated for CCUS implementation while ensuring a positive NPV region is 5 years for “Disruptive Carbon Tax” and 14 years for “Disruptive Carbon Tax and Credit”.
Processes 14 01791 g007
Figure 8. Average carbon intensity [kgCO2e/MWh] for different delays in deploying the CCUS unit (time zero is the deployment of the f-GTW startup). Case A (no CCUS): ~630 kgCO2e/MWh; Case B (CCUS from start): ~23 kgCO2e/MWh; Cases C, D: intermediate values.
Processes 14 01791 g008
Figure 9. Historical daily spot prices of Brent crude oil (left axis, USD/bbl) and Henry Hub natural gas (right axis, USD/MMBtu) over 2016–2026. The principal geopolitical crisis windows of the period are annotated: COVID-19 (2020), Russia–Ukraine conflict (2022–to date), and U.S.–Iran crisis (2026). Geopolitical crises impose atypical variations in oil and natural gas prices that lie outside the steady-state pattern, broadening the commodity price range covered by the adopted standard-deviation scenarios. MA: moving average. Data extracted from the U.S. Energy Information Administration (EIA).
Processes 14 01791 g009
Figure 10. SWOT matrix for f-GTW-CCUS.
Processes 14 01791 g010
Table 1. Comparison of the present work with prior literature on f-GTW and CCUS-EOR techno-economic analysis.
ReferenceFloating Offshore ConfigurationWellhead-Sourced Stranded GasCCUS-EOR MonetizationStochastic Price Uncertainty (Oil, NG, Electricity)Mandatory Progressive CT&CCCUS Deployment-Delay Analysis
[33]NONONONONONO
[31]YESIndirect (conceptual, marginal/stranded gas as motivation)NONONONO
[34]NOYESIndirect (mentioned as economic benefit)NONONO
[35]YESYESYESNONONO
[13]YESYESYESNONONO
[45]NONOYESYES (oil + carbon, real options)Indirect (carbon trading)YES (deferred option)
This workYESYESYESYES (joint MC over 3 stochastic inputs)YES (three progressive scenarios)YES (quantitative delay tolerance)
Table 2. Economic premises for f-GTW-CCUS.
ItemAssumptionSource
Operation Lifetime30 yearsThis work
Construction Time2 yearsThis work
Operation8400 h/year[44]
ITR34%[44]
Annual Depreciation Rate10%[44]
Gas PriceUSD 3.259/MMBtuThis work
Electricity PriceUSD 0.1071/kWhThis work
Oil PriceUSD 40, 60, and 80/bblThis work
Labor CostUSD 89,100/y operator[44]
EOR-yield1.5 bbl/t CO2[13]
Gas TurbineUSD 13,136,574[47]
Steam TurbineUSD 698/kW[48]
HVDC/AC Converter aUSD 50,017,627[49]
Subsea HVDC CableUSD 1970/MW.km[31]
Hub ConstructionUSD 246,268,009 [31]
Riser1 MMUSD/km[31]
a—The HVDC/AC system represents the offshore-to-onshore electricity transmission route through submarine cables, for which a 5% transmission power loss is considered.
Table 3. Carbon tax and carbon credit scenarios definitions.
Carbon PolicyTime of the Carbon Policy (*) (TCP, Years)Scenario
LowMediumHigh
Carbon Tax (USD/tCO2e)TCP <5 000
5 ≤ TCP < 1012.502550
10 ≤ TCP < 2018.7537.5075
TCP 202550100
Carbon credit (USD/tCO2e)<5 000
5 ≤ TCP < 106.2512.5025
10 ≤ TCP < 209.4018.7537.50
TCP 2012.502550
(*) Time is set to zero at the f-GTW deployment.
Table 4. Cases definitions under evaluation.
CaseCCUSCarbon TaxCarbon Credit
ANoAfter five years from f-GTW startup No
BYesAfter five years from f-GTW-CCUS startupNo
CDeployed after carbon tax policy implementationAfter five years from f-GTW-CCUS startupNo
DDeployed after carbon tax policy implementationAfter five years from f-GTW-CCUS startupYes
Table 5. Monte Carlo model parameters delimitations.
VariableCommoditiesUnitMean (µ) dSt. Deviation (σ)
U1Oil a USD/bbl70.024.77
U2Natural Gas b USD/MMBtu3.2591.15
U3Electricity c USD/kWh0.10710.003
a Crude oil Brent prices for 2013 to 2022 [54]; b NG Henry HUB for 2013 to 2022 period [55]; c all sector for 2018 to 2021 period [56]. d All stochastic variables are modeled using normal probability distributions with parameters derived from 10-year historical data (2013–2022) [54,55,56].
Table 6. Main stationary technical results.
ParametersCases
ABC a
Gas Turbines (MW)681.92681.92681.92
Rankine Cycle (MW)210.2459.9259.92 a
Gross Power (MW)892.12741.84741.84 a
Power Demand (MW)44.60129.50129.50
Net Power Produced (MW)847.51612.30612.30
Energy Efficiency (%LHV)50.4936.4836.48
CO2 to EOR (t/h)0492.2492.2 a
CO2 emitted (t/h)534.114.8534.1–14.8 a
a After CCUS unit implementation.
Table 7. Main stationary economic results at rd = 10%.
ParametersCase ACase B
FCI (MMUSD)1908.702031.20
CRM (MMUSD/y) a156.58156.58
COL (MMUSD/y)2.942.94
COM (MMUSD/y)544.19566.24
a CRM considering USD 2.82/MMBtu; after deployment of the CCUS unit.
Table 8. Comparison of evaluated cases: policy assumptions, technical configuration, and main 30-year operational outcomes under the High CT&C scenario, base economic conditions (µoil = 70 USD/bbl, rd = 10%).
ItemCase ACase BCase CCase D
POLICY AND DEPLOYMENT CONFIGURATION
CCUS deployment timingNot deployedProject start
(t = 0)
Delayed deployment after carbon tax onset (year 5)Delayed deployment after carbon tax onset (year 5)
Carbon tax (CT) (USD/tCO2e) aActive from t = 5: CT#1: 50 CT#2: 75 CT#3: 100Active from t = 5: CT#1: 50 CT#2: 75 CT#3: 100Active from t = 5: CT#1: 50 CT#2: 75 CT#3: 100Active from t = 5: CT#1: 50 CT#2: 75 CT#3: 100
Carbon credit (CC) (USD/tCO2e) aNot applicableNot applicableNot applicableActive from t = 5: CC#1: 25 CC#2: 37.50
CC#3: 50
TECHNICAL CONFIGURATION
(Steady state, post-CCUS where applicable)
CO2 capture rate0%>90%Pre-CCUS: 0%
Post-CCUS: >90%
Pre-CCUS: 0%
Post-CCUS: >90%
CO2 utilized for EOR (t/h)0492.20 to 492.20 to 492.2
CO2 emitted (t/h)534.114.8Pre-CCUS: 534.1
Post-CCUS: 14.8
Pre-CCUS: 534.1
Post-CCUS: 14.8
Net power exported (MW)847.51612.30Pre-CCUS: 847.51
Post-CCUS: 612.30
Pre-CCUS: 847.51 post-CCUS: 612.30
FCI (MMUSD)1908.702031.202031.202031.20
30-YEAR OPERATIONAL OUTCOMES
Cumulative CO2 emitted (Mt)145.33.73Function of CCUS deployment delay (see Section 3.4)26.9 (at 6-year delay)
LCOE (USD/MWh)104.59 b67.15 c
30-y carbon tax cost (MMUSD)Dominant economic penalty (continuous emissions over 25 taxed years)Limited (residual emissions of 14.8 t/h over 25 taxed years)Function of CCUS deployment delay≈470
30-y carbon credit revenue (MMUSD)≈2585
NPV feasibility across price-volatility scenariosNPV < 0 (all volatility scenarios)NPV > 0 (all volatility scenarios)NPV > 0 if tCCUS ≤ 6 yearsNPV > 0 if tCCUS ≤ 10 years
Maximum CCUS deployment delay (tCCUS) * for NPV > 0Not applicableNot applicable6 years (under high CT)10 years (under high CT&C)
a Three progressive levels (low/medium/high) are detailed in Table 2 (CT&C scenarios; values shown here correspond to the high scenario). b Without EOR revenue. c With EOR revenue at μoil = USD 70/bbl. The CCUS deployment delay is defined as the number of years after the onset of the carbon tax (year 5) at which the CCUS unit is installed in Cases C and D. * tCCUS: the time of CCUS unit deployment delay.
Table 9. LCOE for different energy-production sources.
Energy OptionLCOE (USD/MWh)
Offshore NGCC w/o CCS104.59 a
Offshore NGCC w/CCS *67.15 b
Wind37–132 c
Solar100–239 d
Hydro34.5–126.5 e
* Considering EOR-Yield 1.5 bbl/tCO2 and µ = 70 USD/bbl. a Present work (determined via Equation (8)); b present work (determined via Equation (9)); c Stehly et al. [60]; d Jones-Albertus et al. [62]; e Badouard et al. [61].
Table 10. Carbon intensity, water footprint, and total land transformation for different energy-production sources.
Energy OptionCarbon Intensity (kgCO2e/MWh)Water Footprint (m3/MWh)Total Land Transformation (m2/GWh)
f-GTW without CCUS630 a --
f-GTW-CCUS23 a
f-GTW-CCUS delay 5 y101 a--
f-GTW-CCUS delay 10 y226 a--
f-GTW-CCUS delay 15 y334 a--
f-GTW-CCUS delay 20 y432 a--
f-GTW-CCUS delay 25 y520 a--
NGSC @ η = 32%631 b--
Coal1230 c0.84–3.90 d6–33 e
Biomass97.3 c86.4–514.8 f 101–193 e
Wind6–124 g,hNegligible f 2780 e
Solar PV13–731 h1.08 f 438 e
Hydro2–237 h79.2 f 3–20,000 e
a Present work; b IPCC [63]; c Feng et al. [64]; d Zhu et al. [65]; e Fthenakis et al. [66]; f Gerbens-Leenes et al. [67]; g Al-Behadili et al. [68]; h WNA [69].
Disclaimer/Publisher’s Note: The statements, opinions and data contained in all publications are solely those of the individual author(s) and contributor(s) and not of MDPI and/or the editor(s). MDPI and/or the editor(s) disclaim responsibility for any injury to people or property resulting from any ideas, methods, instructions or products referred to in the content.