Article

Environmental and Economic Assessment of the Intensification of an Isomerization Column–Reactor Through Vapor Recompression Electrification


by
Fernanda Ribeiro Figueiredo
1,*,
Roymel Rodríguez Carpio
1,
Diego Martinez Prata
2 and
Argimiro Resende Secchi
1
1
School of Chemistry, Programa de Engenharia de Processos Químicos e Bioquímicos (EPQB), Universidade Federal do Rio de Janeiro, Cidade Universitária, Ilha do Fundão, Rio de Janeiro 21941-909, RJ, Brazil
2
Department of Chemical and Petroleum Engineering, Universidade Federal Fluminense, Passo da Pátria 156, E315, Niterói 24210-240, RJ, Brazil
*
Author to whom correspondence should be addressed.
Processes 2026, 14(11), 1790; https://doi.org/10.3390/pr14111790 (registering DOI)
Submission received: 6 May 2026 / Revised: 26 May 2026 / Accepted: 27 May 2026 / Published: 30 May 2026

Abstract

Purification of isobutane remains a fundamental step in the production of a cleaner alkylated gasoline, and the distillation operation employed for this separation is notoriously energy-intensive and a significant contributor to environmental impacts. To address these challenges, this work proposes vapor recompression (VR) as an intensified alternative process to fully electrify the conventional column–reactor configuration used in n-butane isomerization and separation. An external VR scheme was designed and globally optimized with the objective of minimizing total annualized cost. The optimized VR configuration showed a clear economic advantage, achieving an approximate 13.83% reduction in costs over a 10-year horizon with a break-even time of 7.13 years. Additionally, overall energy demand was reduced by 74%, and operational safety was enhanced, as the boiler is required only during plant start-up and shutdown. To account for economic uncertainty, a sensitivity analysis was conducted to evaluate the effects of fluctuations in electricity and steam prices. Environmental performance was further assessed through CO2 emissions using different national electricity emission factors. While emission reductions depend strongly on grid carbon intensity, regions with low-carbon electricity mixes show significant mitigation potential. Overall, VR emerges as a promising strategy to improve the economic and environmental sustainability of industrial processes.

1. Introduction

The complex relationship between economic development and environmental preservation has become increasingly urgent amid the growing frequency and severity of natural disasters. International forums prominently feature objectives such as “Net Zero,” “1.5 °C limit,” and “Sustainable Development Goals,” which are central to conferences like the recent COP 30, advocating for climate action [1]. Within this context, the decarbonization of major economic sectors is widely recognized as a critical pathway toward a more sustainable and resilient future [2].
The industrial sector is estimated to account for approximately 32% of global CO2 emissions [3,4], largely due to the continued dominance of fossil fuels in global energy consumption [2,5]. Specifically, in the chemical and petrochemical sectors, distillation represents over 90% of all separation processes and remains one of the most energy-intensive operations, characterized by low thermodynamic efficiency [6]. This has driven growing interest in process intensification strategies that focus on enhancing separation efficiency and reducing energy demand [2,7,8].
Process intensification is defined as a technological approach grounded in the principles of sustainability, accessibility, and attractiveness, with the goal of integrating and optimizing industrial processes to achieve higher efficiency while enhancing profitability and safety [9,10,11]. In response to the inherent limitations of conventional distillation, a variety of intensification strategies have been proposed and extensively investigated in the literature. These include divided-wall columns [12,13,14], reactive distillation columns [15,16], vapor recompression systems [17,18,19,20], multiple-effect distillation [21,22], bottom-flash configurations [23,24], and thermally coupled columns [25,26], among the combinations of the aforementioned strategies.
In the face of environmental challenges, one of the main objectives of Industry 4.0 is the transition from fossil fuels to electrified low-carbon processes [2,4]. Among the technologies that show significant promise in this context is vapor recompression (VR), a relatively simple heat-pump-based technique applicable to distillation columns, particularly for separating mixtures with close boiling points [27]. In VR systems, the overhead vapor from the column is compressed and reused as a heat source in an energetically integrated condenser–reboiler configuration [28,29]. This approach requires the use of a compressor to increase the vapor’s enthalpy, thereby enabling effective heat transfer between process streams [30]. Consequently, VR strategy stands out for its simplicity, ease of implementation—typically as an external configuration assisting distillation column—and proven efficiency [8,31]. With reported energy savings of about 70% [6], VR has become an attractive retrofit option for real industrial process intensification and electrification [11,32], especially under constraints related to capital investment and uninterrupted operation [29,33]. Nevertheless, in situations where VR alone is insufficient to fully satisfy the column heat demand and an auxiliary reboiler is still required, its integration with flash vapor circulation may represent a promising alternative for achieving complete process electrification [34,35].
The application of VR has been widely studied as a strategy to enhance the efficiency of different chemical systems, including retrofitting options to existing plants as outlined by De Miranda et al. [30] and Figueiredo and Prata [17]. The former study investigated an operating cryogenic extractive distillation plant for CO2–ethane separation in China. The results showed that the proposed VR scheme offers both economic and environmental benefits, reducing operating utility costs, energy demand, water consumption, and CO2 emissions by 22.72%, 24.2%, 24.5%, and 25.5%, respectively. The latter study designed a vapor recompression arrangement combined with heat integration (VRHI) to enhance energy recovery in an industrial monochlorobenzene–benzene separation process located in the U.S. Gulf Coast. The results showed that VRHI reduced utility costs by 50.2% and total annualized cost (TAC) by 18.1%, while achieving corresponding reductions of 85.9%, 85.4%, and 73.3% in energy demand, water consumption, and CO2 emissions, respectively. Additionally, VRHI outperformed a double-effect distillation with heat integration (DEDHI) revamping alternative, yielding additional reductions of 64.7%, 60.4%, and 32.9% in energy demand, water consumption, and CO2 emissions, respectively. However, its economic viability required a payback period exceeding 10 years due to the high capital cost of compressor equipment.
Furthermore, recent research has sought to enhance the gains and efficiency associated with this strategy. Li et al. [36], Figueiredo and Prata [37], and Zhang et al. [38] investigated the potential for optimizing the VR structure, aiming to reduce utility consumption and avoid equipment oversizing, presenting significant improvements over the original process. In turn, Feng et al. [18] showed the benefits of integrating VR with the preheating of the inlet stream through optimization, proposing a highly integrated system which resulted in reductions of 11.55% in the TAC and 54.24% in CO2 emissions, along with approximately 3% increase in thermodynamic efficiency when compared to the conventional process for the separation of n-hexane and ethyl acetate. Building on these advancements, the exploration of the synergy between VR and different process intensification strategies is also highlighted, aiming at the development of more sustainable and economically competitive configurations [39,40,41].
Particularly, the isomerization of n-butane is a relevant process in the petroleum industry, as it produces isobutane, a compound widely used as a replacement for hydrofluorocarbons in refrigerants [42] and, more importantly, as a key reactant in alkylate production for formulating cleaner gasoline with low sulfur, aromatic, and unsaturated hydrocarbon contents [42,43]. In an effort to improve and modernize the original process, which comprises a reactor, a furnace, and two distillation columns arranged in series [44], Luyben [43] proposed an alternative configuration employing a single distillation column with a side reactor. Despite this advancement and the development of corresponding control approaches [43,45], other process intensification approaches for n-butane isomerization remain largely unexplored in the literature. Accordingly, this work presents a new fully electrified vapor recompression system (VRE) for the isomerization of n-butane in the one-column–reactor process. A global economic optimization of the VRE technology for this process was carried out, integrating energy, economic, and environmental analyses. The results show the feasibility of a fully electrified configuration, providing new insights into its potential to significantly reduce energy consumption and CO2 emissions, aligning with sustainable development guidelines.

2. Methodology

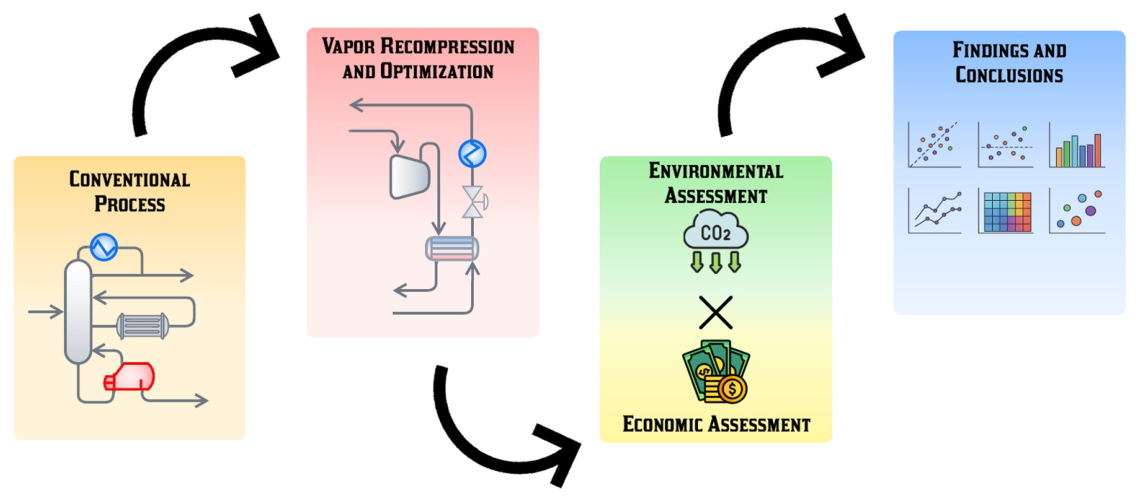
The methodology employed in this study was theoretical–computational, carried out using Aspen HYSYS version 15, and comprised four key steps:
I.
Comprehension and simulation of the conventional column–reactor configuration described by Luyben [43], followed by computational validation of the model.
II.
Intensification and optimization of the VR external arrangement, aimed at minimizing the TAC economic criteria.
III.
Economic and environmental (CO2 emissions) assessment of the considered configurations, including comparison and evaluation. In addition, a sensitivity analysis of utility prices (e.g., steam and electricity) was performed.
IV.
Findings and conclusions.
Aspen HYSYS incorporates rigorous thermodynamic models and detailed distillation column representations based on the MESH equations (Mass balance, phase Equilibrium, mole fraction Summation, and Heat balance), enabling accurate and reliable simulation of separation processes. The plug-flow reactor (PFR) model without axial mixing represents the kinetic reaction rate, which is well suited for gas-phase reactions and for capturing detailed axial profiles of composition and temperature.
Regarding the thermodynamic model, the SRK equation of state was selected, following the base benchmarking study [43], due to its well-established capability to accurately represent the vapor–liquid equilibrium (VLE) of hydrocarbon-containing mixtures, such as the one investigated in this work [46]. The components and the binary interaction coefficients used in the model are listed in Table A1 (Appendix A).
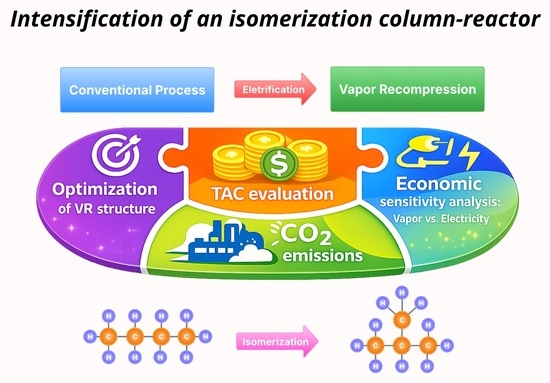
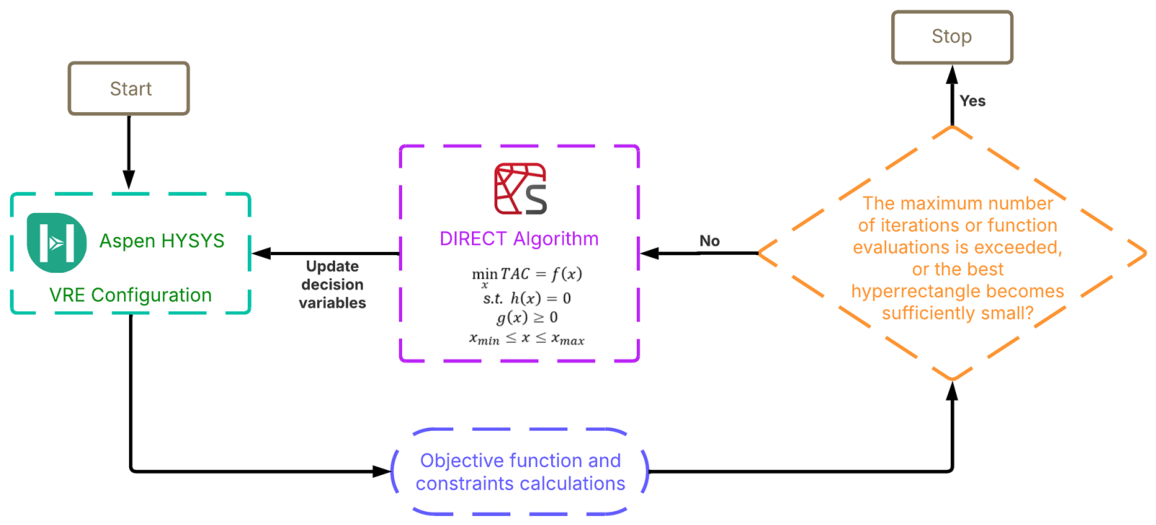
The diagram in Figure 1 illustrates the strategy adopted based on the aforementioned steps, which will be further detailed and analyzed in the following sections.

2.1. Conventional Column–Reactor Process (CP) Description

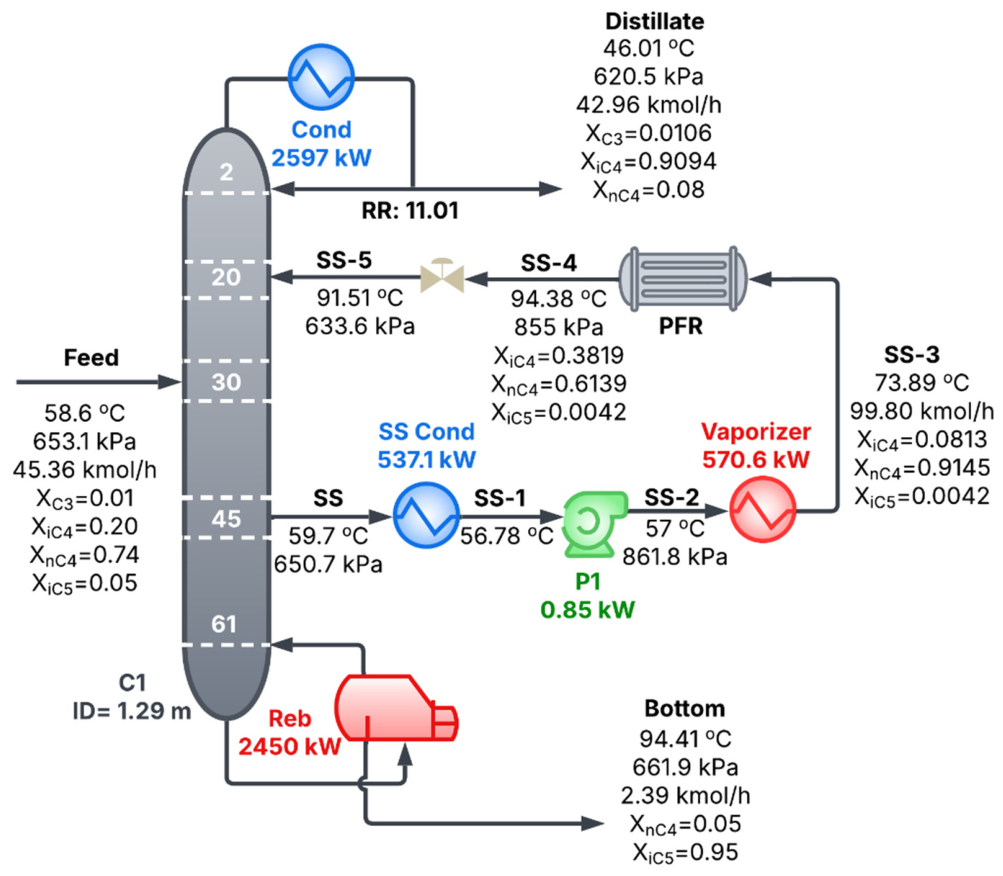
Figure 2 presents a schematic of the CP for n-butane isomerization described by Luyben [43], along with the computational results obtained. The feed stream, with a flow rate of 45.36 kmol/h (100 lbmol/h) and a composition of 1 mol% propane, 20 mol% isobutane, 74 mol% n-butane, and 5 mol% isopentane, at a temperature of 58.6 °C (137.4 °F) and pressure of 653.1 kPa (94.73 psia), enters the distillation column at tray 30. The column comprises 62 stages (including condenser and reboiler), has a diameter of 1.29 m, and a tray spacing of 0.601 m. The column pressure decreases from 661.9 kPa (96 psia) at the bottom to 620.5 kPa (90 psia) at the top. The condenser (Cond) operates at 46.01 °C (114.8 °F) and the reboiler (Reb) at 94.41 °C (201.9 °F), allowing the use of cooling water and low-pressure steam as the cold and hot utilities, respectively. Pressure drops in these heat exchanger units are assumed to be negligible [43]. All propane is removed along with most of the isobutane in the distillate stream, containing 8 mol% of n-butane impurity. Meanwhile, the bottom stream recovered isopentane with a purity of 95 mol%, according to the product quality specification.
To enhance the conversion of n-butane to isobutane, a PFR is coupled to a vapor sidestream from the stripping zone (stage 45). The vapor is condensed at 56.8 °C (134.2 °F) in a sidestream condenser (SS Cond) using cooling water, pressurized by an electrically driven pump to 861.8 kPa (125 psia), and heated to 73.89 °C (165 °F) using low-pressure steam before entering the reactor. The tubular reactor has a diameter of 0.42 m (1.4 ft) and a length of 4.27 m (14 ft), with a catalyst bulk density of 1602 kg·m−3 (100 lb·ft−3) and a void fraction of 0.5. The exothermic isomerization reaction (Equation (1)) increases the adiabatic reactor temperature to 94.4 °C (202 °F). The reactor effluent, enriched in isobutane (0.3819 mol), is then depressurized and recycled to stage 20 in the rectification section of the column.
n C 4 i C 4
Due to the reversible nature of the isomerization reaction, the conversion is limited by chemical equilibrium and is favored at lower reactor temperatures [43]. The forward ( R F ) and reverse ( R R ) reaction rates, expressed in kmol·s−1·m−3 and taken from the base study [43], are given in Equations (2) and (3). Under the operational conditions considered, the conversion of n-butane to isobutane is approximately 32.9%.
R F = P n C 4 k F e E F R T
R R = P i C 4 k R e E R R T
In Equations (2) and (3), P nC 4 and P iC 4 denote the partial pressures in Pa of n-butane and isobutane, respectively. The parameters k F and k R , together with E F and E R , represent the pre-exponential factors and activation energies of the forward and reverse reactions. Their respective values are 1 kmol·s−1·m−3·Pa−1, 15.6 kmol·s−1·m−3·Pa−1, 46,520 kJ·kmol−1 (20,000 Btu·lbmol−1), and 53,498 kJ·kmol−1 (23,000 Btu·lbmol−1).
The computational implementation is straightforward. Once the reaction type is defined as “kinetic,” the stoichiometric coefficients, reaction orders, and the aforementioned parameters are specified to establish the reaction basis and supply the required Arrhenius equation data. In this case, partial pressure is selected as the reaction basis, and the reaction is defined in the vapor phase.
Although the original study does not specify the catalyst employed, the literature indicates that catalysts commonly used for n-butane isomerization include platinum supported on chlorinated alumina (Pt–Cl/Al2O3), as applied in the Butamer process, as well as sulfide metal oxides [47].

2.2. Vapor Recompression Proposal

Energy generation from fossil fuels generally requires lower capital investment, as it relies on mature and readily deployable technologies. Nevertheless, volatility in fossil fuel prices, low thermal efficiency due to combustion-related losses, and high maintenance requirements lead to substantially higher operational costs [17,48]. To address these challenges while reducing greenhouse gas emissions, process electrification has emerged as a promising alternative. In this context, heat pumps stand out as a key decarbonization technology, particularly in regions where the electricity mix is predominantly based on renewable energy sources [2,37,48].
VR has emerged as a technology for adapting industrial processes to more environmentally sustainable standards [2,4]. The core principle of VR lies in recovering the heat rejected at the column condenser and reusing it as the heat source for the reboiler, thereby reducing utility consumption and enhancing overall process efficiency [49]. The feasibility of this technology depends on the installation of a compressor capable of increasing the pressure and consequently the temperature of the overhead vapor, enabling effective energy integration within the process [37]. The requirement for additional and more complex equipment, particularly the compressor, leads to higher capital investment, which represents a key drawback of this alternative [17,37]. Nevertheless, the substantial reduction in operating utility costs, together with lower maintenance demands, allows this technology to deliver significant economic and environmental benefits over the long term [48]. Moreover, as VR is implemented as an external modification that does not alter the column’s internal temperature or composition profiles, it can be readily retrofitted to existing units without extended shutdowns or major plant modifications [29,30,50].
Although VR has strong potential for many real applications [32], its feasibility is not always guaranteed for a specific operation. Therefore, Pleşu et al. [51] proposed a simplified criterion based on the Carnot cycle heat pump’s efficiency (ηCarnot), using the coefficient of performance (COP) as a preliminary thermodynamic evaluation parameter, as presented in Equation (4). This criterion employs both the condenser ( T C o n d ) and reboiler ( T R e b ) temperatures, expressed in Kelvin, which can be obtained from either actual industrial measurements or process computational simulations. The process retrofit is particularly advantageous when the resulting value exceeds 5.
C O P = 1 η C a r n o t = T C o n d T R e b T C o n d
Thus, computational simulation plays a crucial role in the early-stage design phase, enabling rapid preliminary assessments of the potential of different process intensification strategies without the need for experimental testing or full-scale implementation [17]. It is essential, however, that such simulations be conducted rigorously to ensure that the resulting solutions remain consistent with real operating conditions and the inherent constraints of industrial systems [52,53]. Therefore, several restrictions must be imposed to guarantee the feasibility of VR within acceptable operational limits. These include maintaining the compressor discharge temperature below 250 °C [54], preventing condensation of the overhead vapor during the compression stage [2], respecting minimum thermal approach temperatures in heat exchangers, 5.6 °C for condensers and 10 °C for reboilers and other external exchangers [52,55], while neglecting pressure drops [43], and limiting the compression ratio (CR) to a maximum of four per stage [52]. For overall compression ratios exceeding this limit, identical ratios are assumed between stages.
For the process under study, the resulting COP is 6.96 ( T C o n d = 319.74 K and T R e b = 365.7 K), indicating that VR is feasible for implementation.
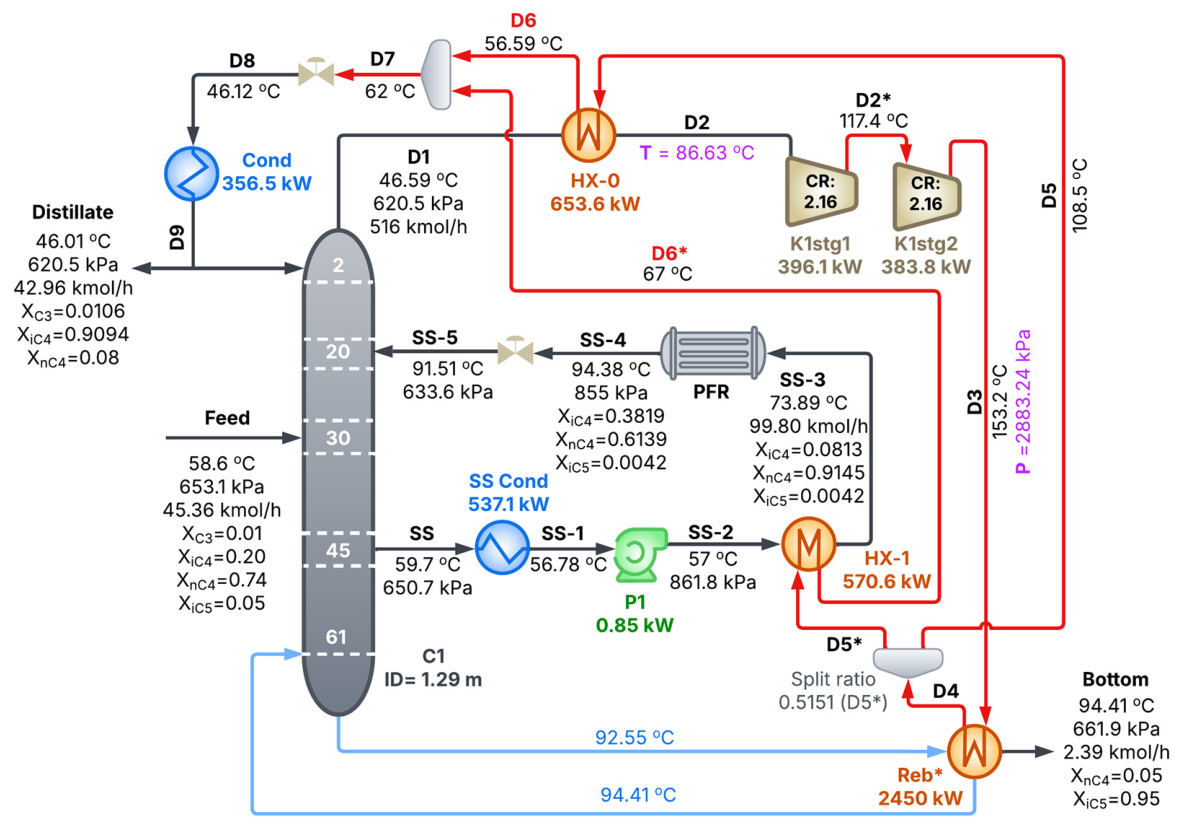
Figure 3 illustrates the application of vapor recompression in a fully electrified version (VRE) of the conventional isomerization process. Accordingly, both the original reboiler (Reb) and vaporizer are replaced with equivalent heat exchangers (Reb* and HX-1) driven by the compressor discharge stream instead of steam heating from the boiler. In this configuration, the column’s top vapor is initially heated to 86.63 °C, transitioning from a saturated to a superheated state to prevent condensation during compression. Furthermore, raising the compressor suction temperature proves to be an effective strategy for reducing mechanical energy consumption and enhancing the overall thermodynamic efficiency of the system [37]. The vapor is then pressurized in a two-stage compressor up to 2883.24 kPa. The compressed stream subsequently transfers heat to the bottom stream in the Reb* heat exchanger until the boil-up stream meets its heating requirements. After this stage, the remaining heat in the top vapor is utilized by splitting the stream: one fraction heats the reactor feed, while the other preheats the top stream itself before entering the compressor. Finally, the streams are recombined, depressurized, and condensed, with a portion withdrawn as distillate and the remainder recirculated as column reflux.
To identify the optimal operational conditions for VR, an economic optimization of the external recompression system was performed, with the decision variables at the optimum highlighted in purple (i.e., outlet preheater HX-0 temperature, T, and output compressor K1 pressure, P) in Figure 3. A detailed description of this optimization procedure is provided in Section 2.3.

2.3. TAC and Economic Optimization

The initial estimation of investment costs is a challenging task, becoming increasingly complex as the project progresses to more detailed stages [56]. In preliminary economic feasibility studies, where the level of design detail is still limited, various methods can be used to provide an initial estimate of the required capital [57,58]. Economic analysis is critical for assessing process intensification alternatives, as financial feasibility usually governs new project decisions [58]. In the field of process intensification, a commonly adopted approach is the total annualized cost [19,31,59].
The TAC serves as a comprehensive economic indicator, encompassing both capital expenditures and costs associated with process utilities [60]. This metric is calculated according to Equation (5). Operating costs (OPEX) include expenses for electricity, steam, and cooling water, while capital expenditures (CAPEX) cover the costs of the main plant equipment, such as columns, heat exchangers, reactors, and compressors. Smaller equipment and accessories, including piping, valves, and low-power pumps, generally have a minor economic impact and are therefore typically excluded from preliminary estimates [60,61]. In the present study, the estimated payback period was 10 years, assuming 8322 h of operation, with a Marshall & Swift index of 2121.1 [36,37].
T A C = C A P E X P a y b a c k   P e r i o d + O P E X
The calculation equations for each of the main pieces of equipment in the plant are summarized in Table 1, while the utility costs employed are presented in Table 2. The literature highlights a significant divergence in the utility values considered representative of industrial practice, particularly for steam and electricity costs. To account for this variability, average values were adopted based on the ranges more commonly reported. For electricity, values ranged from $16.8/GJ [58,62,63,64] to $18.72/GJ [21,30,57], yielding an average of $17.76/GJ. For low-pressure steam, the range varied between $7.78/GJ [36,37,58,62] and $13.28/GJ [59,65,66], resulting in an average of $10.53/GJ. This approach aims to provide a balanced representation of the various scenarios reported in the literature during the optimization process. Complementarily, a sensitivity analysis was performed to address potential uncertainties associated with regional and temporal fluctuations in utility prices.
Nevertheless, when proposing a new process intensification strategy, it is essential to identify the optimal operating point by considering one or more performance objectives relevant to the process. Optimization techniques applied to process simulations, particularly derivative-free methods, are well suited to this task, as they rely on input–output relationships rather than on derivatives of the objective function that is analytically unavailable or numerically costly. As a result, they can effectively address problems characterized by high complexity and strong nonlinearity, which are commonly encountered in industrial plants [37,53,70]. Frequently, in the development of intensification proposals, non-deterministic algorithms are used as search procedures to explore neighboring solutions in pursuit of improved alternatives [16,36,37,71,72], yet these methods do not guarantee convergence to the global optimum [73,74].
An alternative optimization strategy is the DIRECT (DIviding RECTangles) algorithm, a deterministic global optimization method based on a branch-and-bound framework that exploits Lipschitz continuity of the objective function to compute bounds [75]. DIRECT is designed to systematically explore the decision-variable space, even in the presence of multiple local minima, by balancing global exploration and local refinement without requiring algorithm-specific tuning parameters [76]. The method iteratively partitions the unit hypercube into subrectangles and evaluates the objective function at their center points. At each iteration, rectangles identified as potentially optimal are further subdivided, with new function evaluations performed at the centers of the resulting subrectangles. The algorithm proceeds until it reaches a stopping criterion, or a predefined limit on the number of iterations or function evaluations is reached [75,77,78]. Due to its simplicity and robustness, DIRECT has proven effective for low-dimensional, real-world optimization problems [75,78].
In the present study, DIRECT was employed to perform the global optimization of the external VR configuration, with the objective of minimizing the TAC criterion. The algorithm was implemented in Python 3.11 using SciPy package with the submodule optimize and routine direct. The value of eps (i.e., the minimum required difference between the objective function values of the current best hyperrectangle and the next potentially optimal hyperrectangle to be subdivided) was set to 10−6, providing a balanced trade-off between global exploration and local refinement. An approximate upper bound of 4000 was imposed on the number of objective function evaluations (maxfun), while all remaining settings were kept at their default values (e.g., maximum iterations of 1000).
In the formulation of the algorithm, x represents the vector of decision variables, comprising two operational parameters: the outlet temperature of the HX-0 heat exchanger (T) and the compressor outlet pressure (P). To establish appropriate bounds for each variable, an initial exploratory sweep was performed using the Aspen HYSYS Case Studies tool, with the objective of restricting the search space to regions associated with feasible solutions that did not violate the system constraints. Accordingly, the optimization problem is defined by Equations (6)–(13). Figure 4 schematically illustrates the optimization framework, highlighting the integration of the different software tools employed.
min x T A C
Subject to:
78 °C ≤ T (D2) ≤ 100 °C
2800 kPa ≤ P (D3) ≤ 4964 kPa
Correction factor, FT (Heat exchangers) ≥ 0.8 (Penalty)
Minimum Approach (condenser) ≥ 5.56 °C (Penalty)
Minimum Approach (HX-0 and Reb*) ≥ 10 °C (Penalty)
Minimum Approach (HX-1) = 10 °C (Penalty)
Model equations (Aspen HYSYS)
Figure 4. Optimization procedure.
Processes 14 01790 g004
It is important to emphasize that the distillation column was not reoptimized (e.g., number of stages), as the original study had already adjusted its design to minimize the energy consumption of the process. Thus, the central objective of this work focused exclusively on optimizing the external VR structure in order to evaluate it as a retrofit alternative to the conventional process, especially in cases where the plant is already in operation.

2.4. CO2 Emissions

In 2020, the average atmospheric concentration of CO2 reached 412.5 ppm, the highest level ever recorded [79]. The increase in greenhouse gas emissions has been associated with several adverse consequences, including global warming, ocean acidification, and rising sea levels [79]. These impacts have intensified public and regulatory pressure for industrial decarbonization [2,7], reinforcing the need to transition toward more sustainable processes. CO2 emissions are directly associated with United Nations Sustainable Development Goal 13 (Climate Action), which prioritizes urgent action to mitigate climate change and its impacts. Accordingly, when proposing a new technique or technology, it is essential to assess CO2-related metrics in order to quantify potential environmental benefits and support the adoption of more efficient solutions.
To estimate CO2 emissions resulting from the combustion of fossil fuels, Gadalla et al. [80] proposed a specific methodology for steam boilers, which has been widely applied in studies involving distillation columns, as it explicitly accounts for boiler efficiency [19]. To extend the approach of Gadalla et al. [80] to the estimation of indirect emissions, such as those associated with electricity consumption, an additional term can be included to account for electrical energy use, adjusted by equipment efficiency and multiplied by the emission factor of the local power grid. Using this formulation, CO2 emissions expressed in kgCO2 h−1 can be estimated according to Equations (14) and (15).
[ C O 2 ] e m i s s i o n s = [ Q F u e l N H V × C % 100 × α × 3600   s h ] + [ ( Q C o m p   + Q P u m p ) × β ]
Q F u e l = Q P r o c e s s λ P r o c e s s × ( h P r o c e s s 419 ) × T F T B T o T F T B T S t a c k
In Equation (14), the stoichiometric factor relating carbon to CO2 (α) is equal to 3.67. The Net Heating Value (NHV) corresponds to the useful calorific value of the fuel, with a value of 51,600 kJ·kg−1 for natural gas, which is used in boiler operation. The variable C% represents the carbon content of the fuel, equal to 75.4%. The terms Q C o m p   and Q P u m p denote the electrical demands of the compressor and the pump, respectively, calculated considering an adiabatic efficiency of 75% for each device, while β represents the local emission factor, expressed in kgCO2 kWh−1 of electricity consumed. To broaden the scope of the analysis, average grid emission factors from 80 countries were adopted based on literature data reported for the year 2022 [2].
Finally, Q F u e l represents the thermal energy supplied by fuel combustion, calculated according to Equation (15). In this equation, Q P r o c e s s is the energy required by the process in the form of steam, obtained directly from the simulation environment. λ P r o c e s s denotes the latent heat of vaporization, equal to 2085.36 kJ kg−1, and h P r o c e s s is the enthalpy of the low-pressure steam, 2756.25 kJ kg−1 [58,81]. The boiler feed water is assumed to enter at 100 °C with an enthalpy of 419 kJ/kg [19,20]. The temperatures T F T B (1800 °C), T S t a c k (160 °C), and T o (25 °C) correspond, respectively, to the flame temperature, the boiler exhaust gas temperature, and the ambient temperature [58,80].

3. Results and Discussion

3.1. Simulation Results

In the Supplementary Material, Tables S1 and S2 compare the process conditions regarding mass balance (e.g., flow rates and molar compositions) and energy balance (e.g., temperatures, pressures, and energy demand on the reboiler and condenser) outcomes from the simulations with those reported in the reference benchmarking work for the conventional process [43]. Figures S1–S3 present detailed profiles: Figure S1 shows the column temperature, Figure S2 the column composition, and Figure S3 the reactor composition. Figures S4 and S5 illustrate the CP and VRE process schemes simulated in Aspen HYSYS software.
These results provide a quantitative assessment, showing minor differences compared to the values reported by Luyben [43], which may be attributed to the use of different software (e.g., binary coefficients of the thermodynamic model, tolerances to reaching convergence on each equipment and recycle stream, etc.), as the author employed Aspen Plus. Nevertheless, these minor discrepancies are considered acceptable, as they do not exceed 5% [82]. Accordingly, the system can be regarded as consistent with literature values and suitable for evaluating intensification strategies.

3.2. Economic Assessment

3.2.1. Optimization Results of the Vapor Recompression Structure

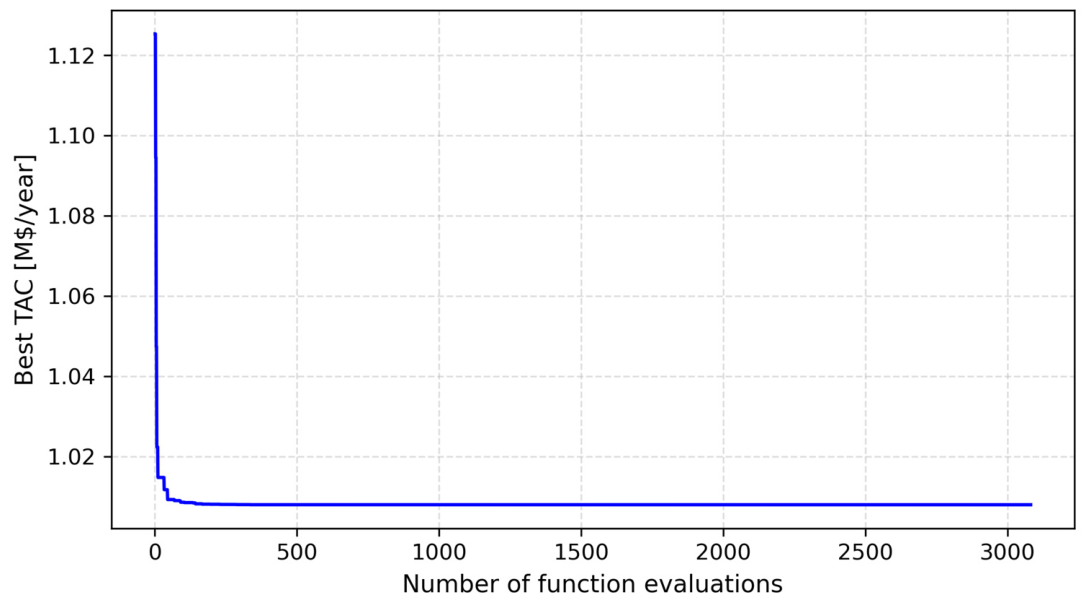
In this study, process simulation and optimization were carried out on a notebook equipped with an Intel® Core™ i7-1165G7 processor running at 2.80 GHz and 16 GB of RAM. The results of the VR optimization are presented in Figure 5, which shows the evolution of the best TAC value with respect to the number of function evaluations. The computation was completed in approximately 1938 s (32.2 min), requiring 203 iterations and 3081 function evaluations to reach a minimum TAC of approximately $1,008,049.83/year. The method took 3081 function evaluations to reach the minimum, and the remaining evaluations were necessary to certify its globality. The corresponding optimal solution vector, [86.63 °C; 2883.24 kPa], is highlighted in purple in the flowchart shown in Figure 3.

3.2.2. TAC: Comparative Analysis of Processes

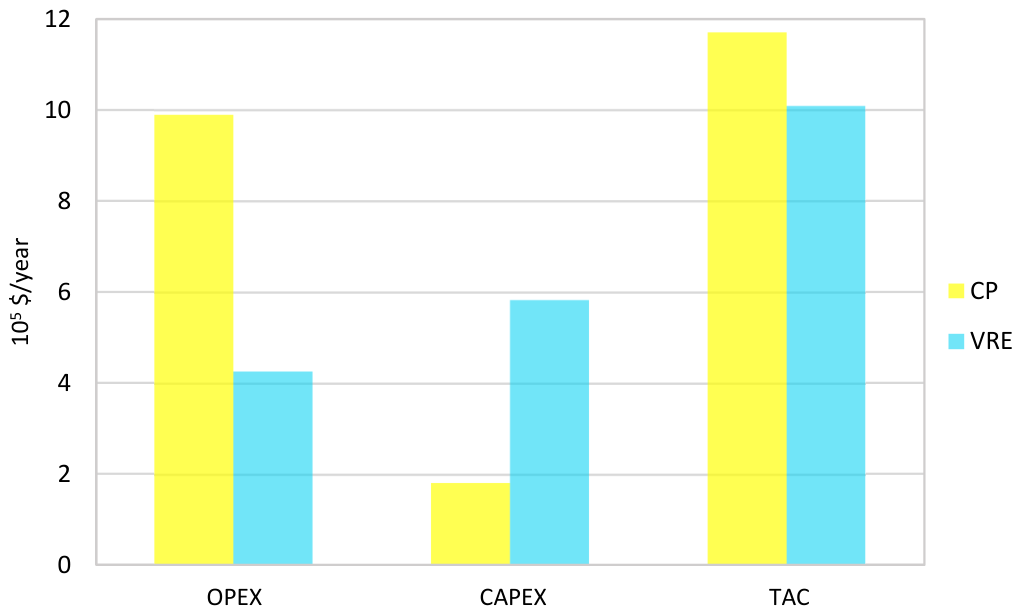
Table 3 presents a summary of the main costs associated with each configuration analyzed, while Figure 6 graphically displays the relative share of OPEX and CAPEX expenses in the composition of the TAC for each alternative.
As shown in Table 3, the main drawback of the VRE scheme is the requirement to acquire a process compressor, which accounts for approximately 63% of the total CAPEX, as expected [19,37]. On the other hand, VRE achieves a 56.97% reduction in operational costs compared to the CP, allowing the initial investment to be offset over the long term. In the case of the intensification proposal analyzed, considering the adopted costs and parameters, the return on investment is estimated at approximately 7.13 years. Over a 10-year horizon, VRE demonstrates an economic advantage of around 13.83%. Furthermore, it is important to note that industrial equipment, when properly maintained, typically has a lifespan exceeding 20 years, further enhancing the long-term economic benefits beyond the period considered in this study [20].
Additionally, various governments have been promoting industrial electrification through subsidies and financing programs aimed at implementing technologies such as heat pumps, particularly in large-scale industries [2]. This trend, combined with growing environmental pressure and the adoption of policies such as carbon taxation, is gradually making conventional processes less competitive compared to alternatives like vapor recompression.
However, it is important to note that full electrification still faces significant challenges. For this approach to be truly sustainable and economically viable, it must rely on renewable energy sources and be supported by a robust infrastructure capable of ensuring the safe and reliable generation, transmission, and distribution of electricity for industrial facilities [4].

3.2.3. Utility Prices: Sensitivity Analysis

Utility prices are strongly influenced by location, political conditions, and seasonal variations [37,83]. Therefore, it is important to assess how changes in these costs affect the economic performance of different configurations. In this study, the main utilities are low-pressure steam (LPS) for the CP and electricity for the VRE scheme, whose price fluctuations can substantially impact operating costs. Understanding these effects is essential for identifying the most cost-effective configuration under varying economic conditions.
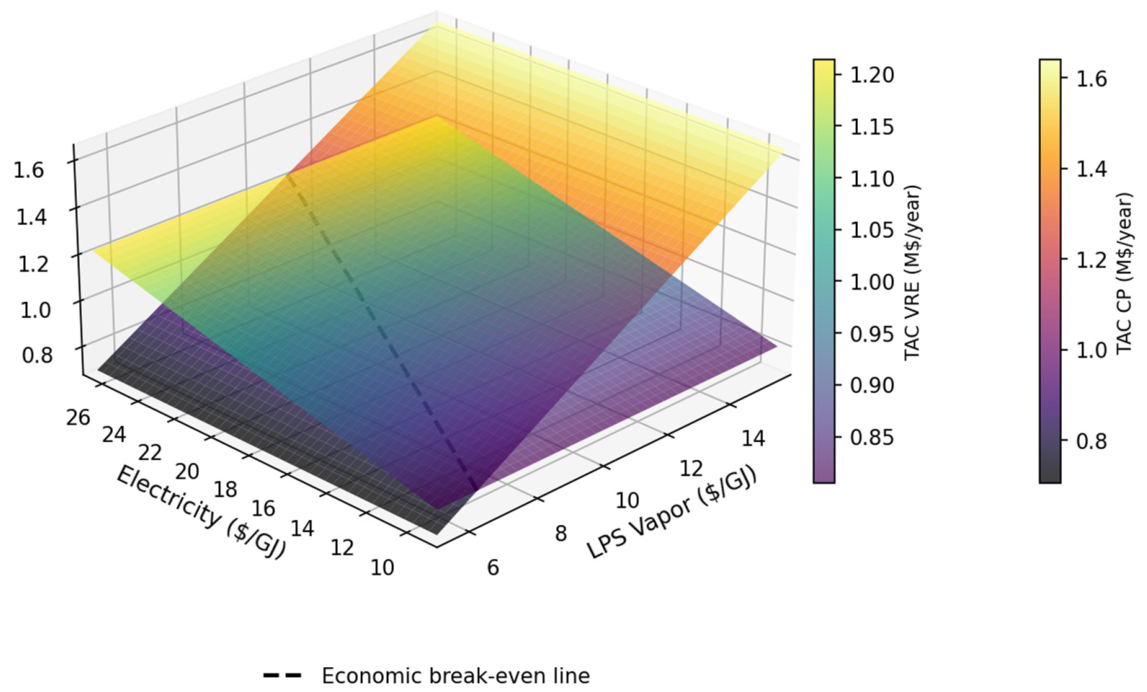
Electricity and low-pressure steam prices were varied by ±50% around their base-case values. A total of 180 uniformly distributed points were generated for each variable within the ranges of 8.9–26.7 $/GJ (electricity) and 5.3–15.8 $/GJ (steam) and integrated using a mesh grid to conduct a two-dimensional sensitivity analysis. Figure 7 shows the impact of these variations on the TAC for each configuration, with the dashed line indicating the break-even point. In particular, the TAC of the VRE configuration becomes equal to that of the conventional process when the utility costs satisfy the following linear relationship: LPS ($/GJ) = 0.26·Electricity ($/GJ) + 4.16. As expected, the conventional process is more sensitive to the cost of low-pressure steam due to its higher energy demand, whereas electricity prices have a negligible effect. Specifically, the conventional process becomes more economically attractive when steam prices are low and electricity prices are high, whereas the opposite scenario favors the vapor recompression alternative.
It should be noted that the present economic assessment was performed considering average utility prices, which represents a simplified approach suitable for preliminary techno-economic analysis. However, in electricity markets with high penetration of renewable energy sources, electricity prices may exhibit significant temporal fluctuations, including periods of very low or even negative prices [84]. Under these conditions, electrified configurations such as the VRE system could further benefit from operational flexibility strategies, including demand response and load shifting, by increasing compressor operation during periods of lower electricity prices. Consequently, the economic competitiveness of vapor recompression systems may be underestimated when constant average electricity prices are assumed, particularly in scenarios characterized by highly dynamic electricity markets.

3.3. Assessment of CO2 Emissions

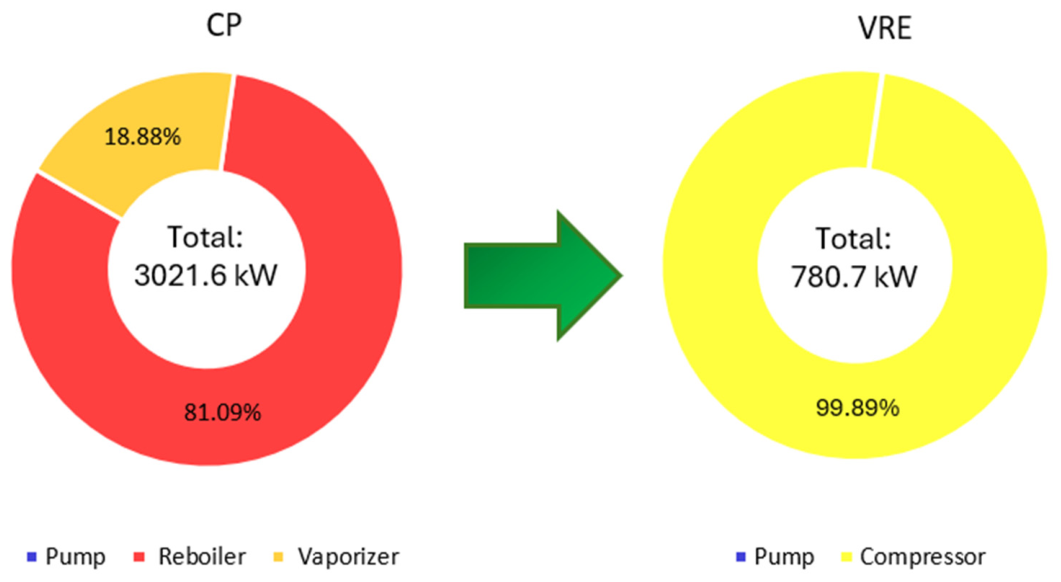
Figure 8 illustrates the energy consumption per equipment for the CP and the VRE configurations. In line with previous findings, a substantial reduction of approximately 74% is observed when comparing the conventional process with the electrified alternative. This decrease is primarily due to the utilization of the latent heat of the overhead vapor, which now supplies a significant portion of the system’s heating requirements, thereby increasing the overall process efficiency.
An important aspect is the complete transformation of the energy supply pattern: the process shifts from being almost entirely dependent on fossil fuels to operating with a fully integrated and electrified structure. This transition not only reduces environmental impact but also simplifies boiler operation and enhances safety [17], lowering both its load and the associated steam production requirements.
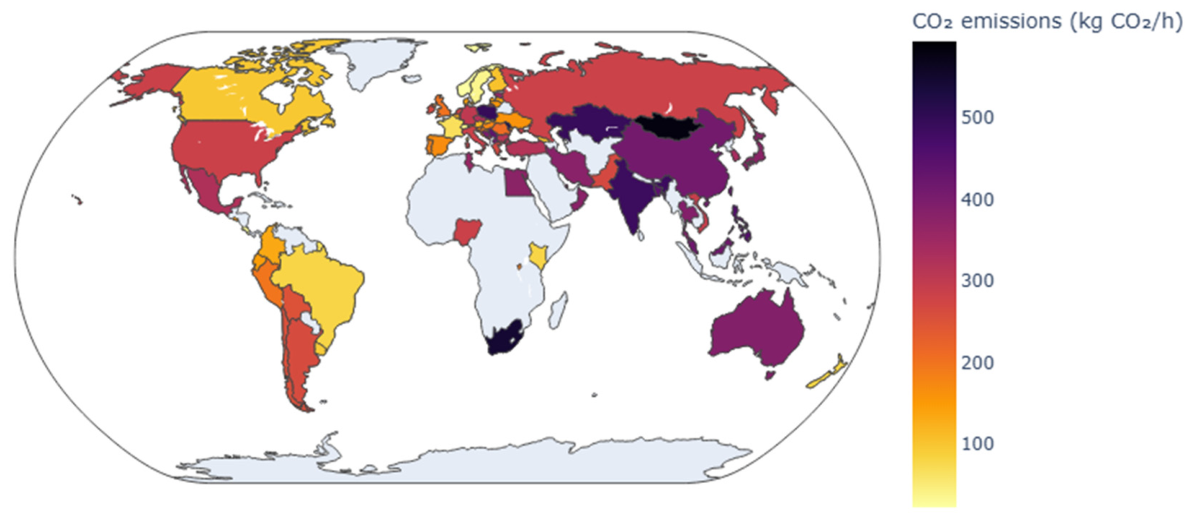
Consistent with the reduction in energy demand, CO2 emissions also decreased following the implementation of vapor recompression. For the conventional process, which relies almost entirely on low-pressure steam and assumes the use of the same natural gas in the boiler regardless of location, emissions are estimated at approximately 708 kg CO2 h−1. In contrast, the CO2 emission profile of the VRE is strongly influenced by the regional electricity grid. Figure 9 illustrates how emissions vary across countries as a function of their reported electricity emission factors (β in Equation (14)) [2] for VRE configuration. Countries like Mongolia, South Africa, and Kazakhstan, which heavily rely on fossil-fuel-based electricity, experience comparatively limited environmental benefits from vapor recompression. Conversely, in regions with cleaner electricity mixes (e.g., Norway, Sweden, and Costa Rica), CO2 emission reductions are significantly more pronounced.
For instance, reductions of approximately 88.64%, 41.91%, and 59.70% were observed for Brazil, China, and the United States, respectively, when compared to the conventional process. In absolute terms, this mitigation corresponds to an estimated annual (8322 h) reduction ranging from about 2469 to 5219 tonnes of CO2, highlighting the potential of VRE as a more environmentally advantageous alternative across countries with distinct electricity generation mixes.

3.4. Column Design Analysis

In accordance with Luyben [43], the sidestream was withdrawn as a vapor-phase stream, since vapor withdrawal leads to lower iC5 impurity levels than a liquid side draw. Nevertheless, as shown in Figure S2, n-butane remains the predominant component in the liquid phase between stages 44 and 51, indicating that a liquid side draw from this region could also represent a feasible alternative configuration.
Such a modification could eliminate the need for the sidestream condenser, thereby reducing both capital investment and cooling water consumption. Likewise, removing part of the liquid traffic from the stripping section before it reaches the column bottom would decrease the required vapor boil-up, consequently reducing the reboiler duty. Furthermore, additional improvements in process performance could potentially be achieved through the simultaneous re-optimization of the column–reactor configuration and the vapor recompression system. Future investigations may also consider the integration of dynamic electricity pricing and flexible operation strategies, particularly for operation under renewable-based electricity markets with significant temporal price variability.

4. Conclusions

The present study assessed the electrification of a distillation column with a side reactor process applied to the isomerization process of n-butane to isobutane, using the vapor recompression technique. A detailed comparative analysis was performed to evaluate the economic and environmental performance of the proposed configurations, using total annualized cost and CO2 emissions as evaluation metrics, which have not previously been examined for this system.
The implementation of vapor recompression enabled a significant reduction in utility demand by recovering and reutilizing the latent heat of the column overhead vapor. As a result, the electrified configuration achieved an approximate 74% decrease in energy consumption compared to the conventional process. Although the installation of a compressor increased capital costs, accounting for a large fraction of the CAPEX, operating costs were reduced by 56.97%. The optimized VRE configuration resulted in a payback period of approximately 7.13 years and an economic advantage of about 13.83% over a 10-year operating horizon, with even greater benefits expected over the typical lifetime of industrial equipment. Nevertheless, it is important to emphasize that the present study is based on a preliminary economic analysis. Therefore, for an actual industrial implementation, a more rigorous economic assessment would still be required.
A sensitivity analysis of utility prices revealed a clear shift in economic preference between the two configurations. The conventional process is strongly affected by low-pressure steam costs, whereas the VRE scheme is primarily influenced by electricity prices. Consequently, the economic viability of vapor recompression is highly dependent on local energy prices and market conditions, favoring regions with lower electricity costs and higher steam prices. In addition, the economic attractiveness of the electrified configuration may be further enhanced in electricity markets characterized by strong temporal price fluctuations and periods of low-cost renewable electricity availability.
From an environmental standpoint, the adoption of vapor recompression resulted in substantial reductions in CO2 emissions, consistent with the observed decrease in overall energy demand. In the conventional configuration, emissions are mainly associated with direct CO2 emissions from steam generation using natural gas, whereas in the electrified VRE configuration, emissions are associated with indirect emissions from electricity consumption. To broaden the scope of the environmental assessment, average grid emission factors from 80 countries were adopted, acknowledging that the environmental performance of the VRE configuration is strongly dependent on the carbon intensity of the local electricity mix. While emission reductions are more limited in regions with fossil-fuel-dominated grids, significantly greater benefits can be achieved under low-carbon electricity scenarios, such as renewable-based electricity systems. These findings highlight the strong synergy between process electrification and clean electricity generation, reinforcing vapor recompression as a promising strategy for more sustainable industrial separation processes.

Supplementary Materials

The following supporting information can be downloaded at: https://www.mdpi.com/article/10.3390/pr14111790/s1, Table S1: Analysis of CP flow streams condition; Table S2: Analysis of CP energy streams; Figure S1: Temperature profile of the distillation column; Figure S2: Liquid-phase composition profile of the distillation column; Figure S3: Variation in the molar fraction of i-C4 and n-C4 along the reactor; Figure S4: CP simulated in the Aspen HYSYS interface; Figure S5: VRE simulated in the Aspen HYSYS interface.

Author Contributions

Conceptualization, F.R.F.; methodology, F.R.F.; software, F.R.F.; validation, F.R.F.; formal analysis, F.R.F.; investigation, F.R.F.; data curation, F.R.F.; writing—original draft preparation, F.R.F.; writing—review and editing, F.R.F., R.R.C., D.M.P. and A.R.S.; visualization, F.R.F.; supervision, D.M.P., R.R.C. and A.R.S.; project administration, D.M.P. and A.R.S. All authors have read and agreed to the published version of the manuscript.

Funding

This research received no external funding.

Data Availability Statement

The original contributions presented in the study are included in the article; further inquiries can be made on request.

Acknowledgments

The authors would like to thank the Coordination for the Improvement of Higher-Level Personnel (Coordenação de Aperfeiçoamento de Pessoal de Nível Superior, CAPES) for the financial support code 0001. Argimiro R. Secchi and Diego Martinez Prata are grateful to the Brazilian National Council for Scientific and Technological Development (Conselho Nacional de Desenvolvimento Científico e Tecnológico, CNPq) for the financial support from grants 300744/2025-0 and 307704/2025-4, respectively, CNPq. Diego Martinez Prata acknowledges the financial support from FAPERJ (Fundação Carlos Chagas Filho de Amparo à Pesquisa do Estado do Rio de Janeiro), grant number E-26/210.938/2024.

Conflicts of Interest

The authors declare no conflicts of interest.

Abbreviations

The following abbreviations are used in this manuscript:
CAPEXCapital Expenditure
COPCoefficient Of Performance
CPConventional Process
CRCompression Ratio
DIRECTDividing Rectangles
LPSLow-Pressure-Steam
M&SMarshall & Swift index
MESHMass balance, phase Equilibrium, mole fraction Summation, and Heat balance
OPEXOperational Expenditure
PFRPlug-Flow Reactor
SRKSoave-Redlich-Kwong equation
TACTotal Annualized Cost
VLEVapor–Liquid Equilibrium
VRVapor Recompression
VREVapor Recompression (Fully) Electrified
VRHIVapor Recompression Heat-Integration
cType factor of the heat exchanger
C%Carbon content of fuel
EFActivation energies of the forward reaction
ERActivation energies of the reverse reaction
FTLogarithmic mean temperature difference correction factor
HHeight of the column
hProcessVapor enthalpy
IDInternal Diameter of column
kFForward pre-exponential factor
kRReverse pre-exponential factor
LLength of the PFR reactor
NTNumber of trays
NHVNet Heating Value
POutlet pressure of the compressor
PiC4Partial pressure of i-Butane
PnC4Partial pressure of n-Butane
QHeat duty of the heat exchanger
QCompPower of the compressor
QFuelFuel combustion energy consumption
QProcessEnergy required by the process
QPumpPower of the pump
RFForward reaction rate
RRReverse reaction rate
RRReflux Ratio
TTemperature of the stream that enters the compressor
T0Ambient temperature
TCondCondenser temperature
TFTBFlame temperature
TRebReboiler temperature
TStackTemperature of the furnace flue gases
UOverall heat transfer coefficient
xDecision variable vector
αCO2 and Carbon molar weight ratio
βCO2 local emission factor
∆TLogarithmic mean temperature difference in the heat exchanger
ηCarnotCarnot efficiency
λprocLatent heat

Appendix A

Table A1 presents the binary interaction coefficients of the SRK model used for the simulation of the system under study.
Table A1. Binary interaction coefficients for the SRK model.
Propanei-Butanen-Butanei-Pentane
Propane-0.001040.000820.00258
i-Butane0.00104-0.000010.00035
n-Butane0.000820.00001-0.00050
i-Pentane0.002580.000350.00050-

References

  1. United Nations Climate Action: COP 30. Available online: https://www.un.org/en/climatechange/cop30#:~:text=COP30%20will%20focus%20on%20the,finance%20pledges%20made%20at%20COP29 (accessed on 30 March 2026).
  2. Cui, C.; Qi, M.; Zhang, X.; Sun, J.; Li, Q.; Kiss, A.A.; Wong, D.S.-H.; Masuku, C.M.; Lee, M. Electrification of Distillation for Decarbonization: An Overview and Perspective. Renew. Sustain. Energy Rev. 2024, 199, 114522. [Google Scholar] [CrossRef]
  3. Adami, M.; Schnurr, J.; Skiborowski, M. Electrified Distillation—Optimized Design of Closed Cycle Heat Pumps with Refrigerant Selection and Flash-Enhanced Mechanical Vapor Recompression. Appl. Therm. Eng. 2025, 273, 126559. [Google Scholar] [CrossRef]
  4. Mekidiche, Z.; Labarta, J.A.; Javaloyes-Anton, J.; Caballero, J.A. From Power to Heat: Strategies for Electrifying Distillation for Sustainable Chemical Processes. Appl. Therm. Eng. 2024, 257, 124316. [Google Scholar] [CrossRef]
  5. Chowdhury, J.I.; Hu, Y.; Haltas, I.; Balta-Ozkan, N.; Matthew, G., Jr.; Varga, L. Reducing Industrial Energy Demand in the UK: A Review of Energy Efficiency Technologies and Energy Saving Potential in Selected Sectors. Renew. Sustain. Energy Rev. 2018, 94, 1153–1178. [Google Scholar] [CrossRef]
  6. Kong, Z.Y.; Sánchez-Ramírez, E.; Yang, A.; Shen, W.; Segovia-Hernández, J.G.; Sunarso, J. Process Intensification from Conventional to Advanced Distillations: Past, Present, and Future. Chem. Eng. Res. Des. 2022, 188, 378–392. [Google Scholar] [CrossRef]
  7. Tang, W.-T.; Chien, C.-K.; Ward, J.D. A Review of Energy Intensification Strategies for Distillation Processes: Cyclic Operation, Stacking, Heat Pumps, Side-Streams, Dividing Walls and Beyond. Sep. Purif. Technol. 2025, 357, 130030. [Google Scholar] [CrossRef]
  8. Kiss, A.A.; Smith, R. Rethinking Energy Use in Distillation Processes for a More Sustainable Chemical Industry. Energy 2020, 203, 117788. [Google Scholar] [CrossRef]
  9. Li, Q.; Somoza-Tornos, A.; Grievink, J.; Kiss, A.A. Challenges and Opportunities for Process Intensification in Europe from a Process Systems Engineering Perspective. Front. Energy Res. 2024, 12, 1340635. [Google Scholar] [CrossRef]
  10. Segovia-Hernández, J.G.; Hernández, S.; Cossío-Vargas, E.; Sánchez-Ramírez, E. Challenges and Opportunities in Process Intensification to Achieve the UN’s 2030 Agenda: Goals 6, 7, 9, 12 and 13. Chem. Eng. Process. 2023, 192, 109507. [Google Scholar] [CrossRef]
  11. Kooijman, H.A.; Sorensen, E. Recent Advances and Future Perspectives on More Sustainable and Energy Efficient Distillation Processes. Chem. Eng. Res. Des. 2022, 188, 473–482. [Google Scholar] [CrossRef]
  12. Figueiredo, F.R.; Prata, D.M. Environmental Assessment and Eco-Efficiency Analysis of the Dividing Wall Distillation Column for Separating a Benzene–Toluene–Xylene Mixture. Processes 2025, 13, 391. [Google Scholar] [CrossRef]
  13. Adami, M.; Bertram, S.; Espert, D.; Skiborowski, M. Beyond Dividing Wall Columns: Improved Process Intensification through Liquid-Only Transfer and Heat Integration. Chem. Eng. Process. 2025, 218, 110559. [Google Scholar] [CrossRef]
  14. Segovia-Hernández, J.G.; Hernández, S.; Sánchez-Ramírez, E.; Mendoza-Pedroza, J. A Short Review of Dividing Wall Distillation Column as an Application of Process Intensification: Geographical Development and the Pioneering Contribution of Prof. Arturo Jimenez in Latin America. Chem. Eng. Process. 2021, 160, 108275. [Google Scholar] [CrossRef]
  15. Gotama, B.; Halomoan, T.; Chen, Y.-Y.; Lee, H.-Y. Energy Saving Design and Control of Side-Streams Reactive Distillation Configuration for Diphenyl Carbonate Production Process. Chem. Eng. Res. Des. 2024, 204, 316–329. [Google Scholar] [CrossRef]
  16. Yang, A.; Su, Y.; Sun, S.; Shen, W.; Bai, M.; Ren, J. Towards Sustainable Separation of the Ternary Azeotropic Mixture Based on the Intensified Reactive-Extractive Distillation Configurations and Multi-Objective Particle Swarm Optimization. J. Clean. Prod. 2022, 332, 130116. [Google Scholar] [CrossRef]
  17. Figueiredo, F.R.; Prata, D.M. Eco-Efficiency Analysis and Intensification of the Monochlorobenzene Separation Process through Vapor Recompression Strategy. Chem. Eng. Process. 2025, 207, 110073. [Google Scholar] [CrossRef]
  18. Feng, Z.; Zhang, J.; Leng, J.; Fan, S.; Wan, Q.; Dong, L. Enhancing Economic, Exergy Efficiency and Environment of Extractive Distillation Processes via Integrating Two-Enthalpy-Feed and Vapor Recompression Heat Pump. Sep. Purif. Technol. 2025, 360, 130950. [Google Scholar] [CrossRef]
  19. Lemos, I.d.S.; Figueiredo, F.R.; Prata, D.M. Intensification of an Extractive Distillation Process for 2-Methoxyethanol/Toluene Separation via Double Vapor Recompression Strategy. Chem. Eng. Process. 2025, 218, 110558. [Google Scholar] [CrossRef]
  20. Ribeiro, R.M.d.A.C.; Figueiredo, F.R.; Prata, D.M. Single-Column Partial Vapor Recompression Retrofit Design for Separation of 1,2-Propanediol and Ethylene Glycol Mixture. Processes 2026, 14, 421. [Google Scholar] [CrossRef]
  21. Figueiredo, F.R.; Paiva, A.P.R.; Oliveira dos Santos, R.; Maia, M.P.; Prata, D.M. Eco-Efficiency Analysis and Intensification of the Monochlorobenzene Separation Process through Double-Effect Strategy. Chem. Eng. Process. 2024, 197, 109709. [Google Scholar] [CrossRef]
  22. Gao, X.; Chen, J.; Tan, J.; Wang, Y.; Ma, Z.; Yang, L. Application of Mechanical Vapor Recompression Heat Pump to Double-Effect Distillation for Separating N, N -Dimethylacetamide/Water Mixture. Ind. Eng. Chem. Res. 2015, 54, 3200–3204. [Google Scholar] [CrossRef]
  23. Fan, S.; Feng, Z.; Lu, R.; Lv, L.; Dong, L. Enhanced Extractive Distillation Processes for Separating N-Hexane and 1,2-Dichloroethane via Bottom Flash Heat Pump. Chem. Eng. Process. 2022, 179, 109069. [Google Scholar] [CrossRef]
  24. Kazemi, A.; Mehrabani-Zeinabad, A.; Beheshti, M. Novel Heat Pump Assisted Distillation Configurations for Energy and Economic Savings and Their Application on Propylene/Propane and I-Butane/N-Butane Separation Systems. Chem. Eng. Sci. 2024, 295, 120139. [Google Scholar] [CrossRef]
  25. Yin, C.; Jiang, G.; Wang, Z.; Zhang, D.; Guo, L.; Liu, G. Synthesis of Distillation Sequence with Sloppy Split and Thermally Coupled Column and Its Integration with Reactor and Heat Exchanger Network. Chem. Eng. Sci. 2025, 306, 121208. [Google Scholar] [CrossRef]
  26. Chen, Y.-C.; Hung, S.-K.; Lee, H.-Y.; Chien, I.-L. Energy-Saving Designs for Separation of a Close-Boiling 1,2-Propanediol and Ethylene Glycol Mixture. Ind. Eng. Chem. Res. 2015, 54, 3828–3843. [Google Scholar] [CrossRef]
  27. Waheed, M.A.; Oni, A.O.; Adejuyigbe, S.B.; Adewumi, B.A.; Fadare, D.A. Performance Enhancement of Vapor Recompression Heat Pump. Appl. Energy 2014, 114, 69–79. [Google Scholar] [CrossRef]
  28. Zhang, Q.; Liu, M.; Zeng, A. Performance Enhancement of Pressure-Swing Distillation Process by the Combined Use of Vapor Recompression and Thermal Integration. Comput. Chem. Eng. 2019, 120, 30–45. [Google Scholar] [CrossRef]
  29. Jana, A.K. Advances in Heat Pump Assisted Distillation Column: A Review. Energy Convers. Manag. 2014, 77, 287–297. [Google Scholar] [CrossRef]
  30. de Miranda, T.d.C.R.D.; Figueiredo, F.R.; de Souza, T.A.; Ahón, V.R.R.; Prata, D.M. Eco-Efficiency Analysis and Intensification of Cryogenic Extractive Distillation Process for Separating CO2–C2H6 Azeotrope through Vapor Recompression Strategy. Chem. Eng. Process. 2024, 196, 109636. [Google Scholar] [CrossRef]
  31. Mantingh, J.; Kiss, A.A. Enhanced Process for Energy Efficient Extraction of 1,3-Butadiene from a Crude C4 Cut. Sep. Purif. Technol. 2021, 267, 118656. [Google Scholar] [CrossRef]
  32. Gopichand, S.; Devotta, S.; Omideyi, T.O.; Holland, F.A. Heat Pump Assisted Distillation. X: Potential for Industrial Applications. Int. J. Energy Res. 1988, 12, 569–582. [Google Scholar] [CrossRef]
  33. Rangaiah, G.P. Chemical Process Retrofitting and Revamping: Techniques and Applications, 1st ed.; John Wiley & Sons, Ed.; John Wiley & Sons, Inc.: Oxford, UK, 2016. [Google Scholar]
  34. Cui, C.; Zhang, X.; Qi, M.; Skogestad, S.; Kiss, A.A. Self-Optimizing Control of Fully Electrified Heat Pump Assisted Distillation Process by Flash Vapor Circulation. Chem. Eng. Res. Des. 2026, 230, 698–717. [Google Scholar] [CrossRef]
  35. Cui, C.; Zhang, X.; Qi, M.; Lyu, H.; Sun, J.; Kiss, A.A. Fully Electrified Heat Pump Assisted Distillation Process by Flash Vapour Circulation. Chem. Eng. Res. Des. 2024, 206, 280–284. [Google Scholar] [CrossRef]
  36. Li, Y.; Gao, Y.; Li, G.; Zheng, Y.; Pan, H.; Ling, H. An Effective Procedure for Optimized Design of Heat Pump Distillation Process. Chem. Eng. Process. 2025, 208, 110096. [Google Scholar] [CrossRef]
  37. Figueiredo, F.R.; Prata, D.M. Double Vapor Recompression Strategy as a Retrofit Solution for the Conventional Benzene-Toluene-Xylene Distillation. Chem. Eng. Process. 2025, 216, 110382. [Google Scholar] [CrossRef]
  38. Zhang, Q.; Chen, Y.; Yue, C.; Yin, T.; Xiang, W. Process Intensification and Dynamic Control of a Vapor-Recompression-Assisted Heterogeneous Azeotropic Distillation for Separating N-Butanol/Water. Chem. Eng. Process. 2024, 202, 109865. [Google Scholar] [CrossRef]
  39. Ding, L.; Zhou, Y.; Sun, P.; Lv, X.; Qu, J.; Xue, Y. Integrating Vapor Recompression Heat Pump into N-Propyl Acetate Reactive Distillation Process for Decarbonization and Performance Enhancement. Chem. Eng. Process. 2025, 216, 110447. [Google Scholar] [CrossRef]
  40. Zhu, J.; Jing, C.; Hao, L.; Wei, H. Inherent Safer, Eco-Friendly and Energy Saving Vapor Recompression Assisted Extractive Dividing-Wall Column Process for the Separation of Minimum-Boiling Azeotrope. Sep. Purif. Technol. 2022, 286, 120368. [Google Scholar] [CrossRef]
  41. Xu, L.; Li, M.; Yin, X.; Yuan, X. New Intensified Heat Integration of Vapor Recompression Assisted Dividing Wall Column. Ind. Eng. Chem. Res. 2017, 56, 2188–2196. [Google Scholar] [CrossRef]
  42. Nawaz, K.; Shen, B.; Elatar, A.; Baxter, V.; Abdelaziz, O. R290 (Propane) and R600a (Isobutane) as Natural Refrigerants for Residential Heat Pump Water Heaters. Appl. Therm. Eng. 2017, 127, 870–883. [Google Scholar] [CrossRef]
  43. Luyben, W.L. Control of an Isomerization Column/Reactor Process. Ind. Eng. Chem. Res. 2011, 50, 3382–3389. [Google Scholar] [CrossRef]
  44. Luyben, W.L.; Tyréus, B.D.; Luyben, M.L. Plantwide Process Control, 1st ed.; McGraw-Hill: New York, NY, USA, 1998. [Google Scholar]
  45. Tan, H.K.; Vasudevan, S.; Chua, A.S.M.; Chuah, C.Y. Plantwide Control and Economic Analysis of n-Butane Isomerization Process. Asia-Pac. J. Chem. Eng. 2025, 20, e70073. [Google Scholar] [CrossRef]
  46. Soave, G.; Gamba, S.; Pellegrini, L.A. SRK Equation of State: Predicting Binary Interaction Parameters of Hydrocarbons and Related Compounds. Fluid Phase Equilib. 2010, 299, 285–293. [Google Scholar] [CrossRef]
  47. Urzhuntsev, G.A.; Ovchinnikova, E.V.; Chumachenko, V.A.; Yashnik, S.A.; Zaikovsky, V.I.; Echevsky, G.V. Isomerization of N-Butane over Pd–SO4/ZrO2 Catalyst: Prospects for Commercial Application. Chem. Eng. J. 2014, 238, 148–156. [Google Scholar] [CrossRef]
  48. Boldyryev, S.; Ivashchuk, O.S.; Krajačić, G.; Atamanyuk, V.M. Review of Challenges in Heat Exchanger Network Development for Electrified Industrial Energy Systems. Energies 2025, 18, 3685. [Google Scholar] [CrossRef]
  49. Hou, W.; Zhang, Q.; Zeng, A. Separation of N-Heptane/Isobutanol via Eco-Efficient Vapor Recompression-Assisted Distillation: Process Optimization and Control Strategy. Front. Chem. Sci. Eng. 2021, 15, 1169–1184. [Google Scholar] [CrossRef]
  50. Tahir, N.M.; Zhang, J.; Armstrong, M. Control of Heat-Integrated Distillation Columns: Review, Trends, and Challenges for Future Research. Processes 2024, 13, 17. [Google Scholar] [CrossRef]
  51. Pleşu, V.; Bonet Ruiz, A.E.; Bonet, J.; Llorens, J. Simple Equation for Suitability of Heat Pump Use in Distillation; Elsevier: Amsterdam, The Netherlands, 2014; pp. 1327–1332. [Google Scholar]
  52. Seider, W.D.; Seader, J.D.; Lewin, D.R.; Widagdo, S.; Gani, R. Process Design Principles: Synthesis, Analysis, and Evaluation, 4th ed.; Wiley: West Sussex, UK, 2016; pp. 1–784. [Google Scholar]
  53. Prata, D.M.; Lima, E.L.; Pinto, J.C. Simultaneous Data Reconciliation and Parameter Estimation in Bulk Polypropylene Polymerizations in Real Time. Macromol. Symp. 2006, 243, 91–103. [Google Scholar] [CrossRef]
  54. Jensen, J.K.; Markussen, W.B.; Reinholdt, L.; Elmegaard, B. On the Development of High Temperature Ammonia–Water Hybrid Absorption–Compression Heat Pumps. Int. J. Refrig. 2015, 58, 79–89. [Google Scholar] [CrossRef]
  55. Couper, J.R.; Penny, W.R.; Fair, J.R.; Walas, S.M. Chemical Process Equipment: Selection and Design, 3rd ed.; Elsevier/Butterworth-Heinemann: Oxford, UK, 2012; pp. 1–864. [Google Scholar]
  56. Lemmens, S. Cost Engineering Techniques and Their Applicability for Cost Estimation of Organic Rankine Cycle Systems. Energies 2016, 9, 485. [Google Scholar] [CrossRef]
  57. Turton, R.; Shaeiwitz, J.A.; Bhattacharyya, D.; Whiting, W.B. Analysis, Synthesis, and Design of Chemical Processes, 5th ed.; Prentice Hall: Upper Saddle River, NJ, USA, 2018; pp. 1–1520. [Google Scholar]
  58. Junqueira, P.G.; Caxiano, I.N.; Mangili, P.V.; Prata, D.M. Environ-Economic Analysis of Conceptual Intensification Alternatives Applied to the Ethylbenzene Production. Comput. Chem. Eng. 2020, 136, 106783. [Google Scholar] [CrossRef]
  59. Feng, Z.; Shen, W.; Rangaiah, G.P.; Dong, L. Design and Control of Vapor Recompression Assisted Extractive Distillation for Separating N-Hexane and Ethyl Acetate. Sep. Purif. Technol. 2020, 240, 116655. [Google Scholar] [CrossRef]
  60. Cruz Valdez, J.A.; Patiño-Herrera, R.; Avilés Martínez, A.; Pérez, E. Separation of the Cyclohexane-Benzene Mixture by the Extractive Distillation Process Using Ethylene Glycol as a Solvent. Chem. Eng. Process. 2024, 196, 109686. [Google Scholar] [CrossRef]
  61. Zhang, F.; Sun, D.; Li, Y.; Shan, B.; Ma, Y.; Wang, Y.; Li, X.; Zhu, Z. Heat Integration and Dynamic Control for Separating the Ternary Azeotrope of Butanone/Isopropanol/n-Heptane via Pressure-Swing Distillation. Chem. Eng. Process. 2022, 170, 108657. [Google Scholar] [CrossRef]
  62. Kadam, R.S.; Nirukhe, A.B.; Yadav, G.D. Heat Utilized Pressure Swing Distillation (PSD) Process for the Separation of the Maximum Boiling Azeotrope HCl and Water in the Cu-Cl Cycle. Chem. Eng. Process. 2024, 196, 109616. [Google Scholar] [CrossRef]
  63. Contreras-Zarazúa, G.; Sánchez-Ramirez, E.; Hernández-Vargas, E.A.; Segovia-Hernández, J.G.; Ramírez, J.J.Q. Process Intensification in Bio-Jet Fuel Production: Design and Control of a Catalytic Reactive Distillation Column for Oligomerization. Chem. Eng. Process. 2023, 193, 109548. [Google Scholar] [CrossRef]
  64. Janković, T.; Straathof, A.J.J.; McGregor, I.R.; Kiss, A.A. Bioethanol Separation by a New Pass-through Distillation Process. Sep. Purif. Technol. 2024, 336, 126292. [Google Scholar] [CrossRef]
  65. Li, X.; Ye, Q.; Xu, Y.; Chen, L.; Li, J. Analysis and Performance Enhancement of Heat Pump Technology Assisted Pressure-Swing Distillation Process in the Separation of Azeotropic Mixtures. Chem. Eng. Process. 2022, 178, 109037. [Google Scholar] [CrossRef]
  66. Chen, Z.; Zhang, Z.; Zhou, J.; Chen, H.; Li, C.; Li, X.; Li, H.; Gao, X. Efficient Synthesis of Isobutylene Dimerization by Catalytic Distillation with Advanced Heat-Integrated Technology. Ind. Eng. Chem. Res. 2021, 60, 6121–6136. [Google Scholar] [CrossRef]
  67. Olujić, Ž.; Sun, L.; de Rijke, A.; Jansens, P.J. Conceptual Design of an Internally Heat Integrated Propylene-Propane Splitter. Energy 2006, 31, 3083–3096. [Google Scholar] [CrossRef]
  68. Douglas, J.M. Conceptual Design of Chemical Processes, 1st ed.; McGraw-Hill: New York, NY, USA, 1988; pp. 1–600. [Google Scholar]
  69. Yin, C.; Liu, G. Optimization of Solvent and Extractive Distillation Sequence Considering Its Integration with Reactor. Processes 2021, 9, 565. [Google Scholar] [CrossRef]
  70. Santos, L.d.S.; de Souza, K.M.F.; Bandeira, M.R.; Ruiz Ahón, V.R.; Peixoto, F.C.; Prata, D.M. Dynamic Optimization of a Continuous Gas Lift Process Using a Mesh Refining Sequential Method. J. Pet. Sci. Eng. 2018, 165, 161–170. [Google Scholar] [CrossRef]
  71. Cheng, Y.; Fan, S.; Li, R.; Wang, X.; Zhang, Z.; Sun, L. Multi-Objective Optimization for Carbon Footprint Reduction of a Novel Pressure-Swing Distillation Process Integrating Heat Pump and Solar Energy for Methyl Tert-Butyl Ether/Methanol Separation. Energy 2026, 342, 139585. [Google Scholar] [CrossRef]
  72. Si, Z.; Chen, H.; Cong, H.; Li, X. Energy, Exergy, Economic and Environmental Analysis of a Novel Steam-Driven Vapor Recompression and Organic Rankine Cycle Intensified Dividing Wall Column. Sep. Purif. Technol. 2022, 295, 121285. [Google Scholar] [CrossRef]
  73. Edgar, T.F.; Himmelblau, D.M.; Lasdon, L.S. Optimization of Chemical Processes, 1st ed.; McGraw-Hill: New York, NY, USA, 1989; pp. 1–652. [Google Scholar]
  74. Prata, D.M.; Lima, E.L.; Pinto, J.C. Nonlinear Dynamic Data Reconciliation in Real Time in Actual Processes. Comput. Aided Chem. Eng. 2009, 27, 47–54. [Google Scholar] [CrossRef]
  75. Jones, D.R.; Martins, J.R.R.A. The DIRECT Algorithm: 25 Years Later. J. Glob. Optim. 2021, 79, 521–566. [Google Scholar] [CrossRef]
  76. Gablonsky, J.M.; Kelley, C.T. A Locally-Biased Form of the DIRECT Algorithm. J. Glob. Optim. 2001, 21, 27–37. [Google Scholar] [CrossRef]
  77. Jones, D.R.; Perttunen, C.D.; Stuckman, B.E. Lipschitzian Optimization without the Lipschitz Constant. J. Optim. Theory Appl. 1993, 79, 157–181. [Google Scholar] [CrossRef]
  78. Baeyens, E.; Herreros, A.; Perán, J. A Direct Search Algorithm for Global Optimization. Algorithms 2016, 9, 40. [Google Scholar] [CrossRef]
  79. Ramírez-Márquez, C.; Al-Thubaiti, M.M.; Martín, M.; El-Halwagi, M.M.; Ponce-Ortega, J.M. Processes Intensification for Sustainability: Prospects and Opportunities. Ind. Eng. Chem. Res. 2023, 62, 2428–2443. [Google Scholar] [CrossRef]
  80. Gadalla, M.A.; Olujic, Z.; Jansens, P.J.; Jobson, M.; Smith, R. Reducing CO 2 Emissions and Energy Consumption of Heat-Integrated Distillation Systems. Environ. Sci. Technol. 2005, 39, 6860–6870. [Google Scholar] [CrossRef]
  81. TVL Engineering Calculator: Saturated Steam Table by Pressure. Available online: https://toolbox.tlv.com/global/ME/calculator/steam-table-pressure.html?advanced=on (accessed on 30 March 2026).
  82. Mangili, P.V.; Souza, Y.P.D.M.; de Menezes, D.Q.F.; Santos, L.S.; Prata, D.M. Eco-Efficiency Evaluation of Acetone-Methanol Separation Processes Using Computational Simulation. Chem. Eng. Process. 2018, 123, 100–110. [Google Scholar] [CrossRef]
  83. Duanmu, F.; Sorensen, E. Optimal Design of Reduced Vapor Transfer Dividing Wall Structures with and without Heat Integration. AIChE J. 2024, 70, e18572. [Google Scholar] [CrossRef]
  84. Qi, M.; Zhang, X.; Wong, D.S.; Shu, C.; Cui, C.; Kiss, A.A. Electrified Distillation with Flash Vapor Circulation and Thermal Storage for Dynamic Electricity Markets. AIChE J. 2025, 71, e18750. [Google Scholar] [CrossRef]
Figure 1. Key steps considered in the present study.
Processes 14 01790 g001
Figure 2. Flowchart of the CP n-butane isomerization process [43].
Processes 14 01790 g002
Figure 3. Flowchart of VRE scheme at its optimal point.
Processes 14 01790 g003
Figure 5. Evolution of the best TAC with number of function evaluations.
Processes 14 01790 g005
Figure 6. Distribution of OPEX and CAPEX in the TAC criteria (payback period of 10 years).
Processes 14 01790 g006
Figure 7. Utility cost sensitivity analysis.
Processes 14 01790 g007
Figure 8. Energy consumption per equipment for the CP and VRE.
Processes 14 01790 g008
Figure 9. CO2 emissions for the VRE scheme in different locations.
Processes 14 01790 g009
Table 1. Equipment costs.
EquipmentCost EquationReference
Column I C S h e l l = M & S 280 × k × I D 1.066 × H 0.802
I C T r a y s = M & S 280 × 97.243 × I D 1.55 × H
H = N T r a y × 0.61 × 1.2
k = 3966.2 (3.4 bar < Pressure < 6.8 bar)
ID: Internal diameter (m)
H: Height (m)
NTray: Number of trays
[36,37,67,68]
Heat Exchangers I C H e a t   E x c h a n g e r = M & S 280 × c × A 0.65
where
A = Q U × T
A: Heat transfer area (m2)
Q: heat duty (kW)
c: 1775.26 (reboiler and external heat exchangers)
1609.13 (condensers)
T : Logarithmic mean temperature difference (LMTD)
U: Heat-transfer coefficient (kW/m2·K):
0.852 (Cond, SS cond)
0.284 (HX-0, HX-1, Vaporizer)
0.568 (Reb, Reb*)
[17,37,67,68]
Compressor
(Centrifugal)
I C C o m p r e s s o r = M & S 280 × 2047.24 × Q C o m p 0.82
QComp: Power consumption of the compressor (kW)
[36,37,67,68]
Reactor I C S h e l l = M & S 280 × k × D 1.066 × L 0.802
k = 4059.96 (6.8 bar < Pressure < 13.6 bar)
D: Diameter of the reactor (m)
L: Length of the reactor (m)
[68,69]
Table 2. Base case cost adopted for the utilities.
UtilityPriceReference
Low-pressure steam (6 bar, 433.2 K)$10.53/GJMean value
Electricity$17.76/GJMean value
Cooling water (5 bar, 30 to 40 °C)$0.378/GJ[57]
Table 3. TAC Summary for the CP and VRE schemes.
ItemUnitCPVRE
Column (trays + shell)
Column (C1)M$0.880.88
Heat exchangers
Condm2287.2940.68
M$0.480.14
SS Condm227.3427.34
M$0.100.10
Rebm264.85
M$0.20
Reb*m2 133.27
M$ 0.32
Vaporizerm221.31
M$0.10
HX-0m2 189.90
M$ 0.41
HX-1m2 110.35
M$ 0.29
Reactor
PFRM$0.040.04
Compressor
K1M$ 3.65
CAPEXM$1.815.83
CAPEX increase%-221.99
Utilities
WaterM$/year0.040.01
ElectricityM$/year0.45 × 10−30.42
Low-pressure steamM$/year0.950.00
OPEXM$/year0.990.43
OPEX Savings%-56.97
TACM$/year1.171.01
TAC Savings%-13.83
Disclaimer/Publisher’s Note: The statements, opinions and data contained in all publications are solely those of the individual author(s) and contributor(s) and not of MDPI and/or the editor(s). MDPI and/or the editor(s) disclaim responsibility for any injury to people or property resulting from any ideas, methods, instructions or products referred to in the content.