Article

Hard Carbons from Textile Waste Cotton as Sustainable Anodic Component for Sodium Ion Batteries
Instituto de Tecnología Química, Consejo Superior de Investigaciones Científicas-Universitat Politècnica de València (CSIC-UPV), Avda. de los Naranjos s/n, 46022 Valencia, Spain
*
Author to whom correspondence should be addressed.
Processes 2026, 14(11), 1735; https://doi.org/10.3390/pr14111735
Submission received: 2 April 2026 / Revised: 19 May 2026 / Accepted: 22 May 2026 / Published: 26 May 2026

Abstract

The increasing share of renewable energy, such as solar and wind energy, in the energy mix implies a demand for sustainable energy storage systems for the mitigation of the intermittency of these energy sources. One option, therefore, is stationary batteries based on abundant sodium, stored in hard carbon (HC) anodes. In this work, following the sustainable by design principle, HCs were synthesized from cotton-based textile waste using three different thermochemical routes: hydrothermal carbonization (HTC) followed by pyrolysis under nitrogen atmosphere (HC-250-N), HTC followed by pyrolysis under a water vapor stream (HC-250-W), and direct pyrolysis (HC-direct-N). The impact of the synthesis method on the physicochemical properties and electrochemical performance of the HCs was thoroughly investigated. X-ray diffraction, Raman spectroscopy, electron microscopy, and gas adsorption analyses revealed that the HTC pre-treatment significantly enhanced the carbon content, microporosity, and degree of structural graphitic order. HC-250-N exhibited the highest graphitic character and more uniform microstructure, while HC-250-W showed the largest specific surface area and broader micropore distribution. Electrochemical evaluation in sodium-ion half-cells indicated that HC-250-N delivered the most balanced performance, with a reversible capacity of 335 mAh g−1 and good cycling stability. These findings confirm the potential of textile waste-derived HCs as promising and sustainable anode materials for sodium-ion batteries and highlight the importance of tailoring synthesis parameters—such as HTC treatment and pyrolysis conditions—to optimize their structural and electrochemical properties.

1. Introduction

Global fiber production reached 116 Mt in 2022 and is projected to reach 147 Mt by 2030, generating approximately 125 Mt of textile waste annually [1]. Currently, most textile waste is incinerated or landfilled, making textiles the fifth highest-pressure category for greenhouse gas emissions in the EU Circular Economy Action Plan (CEAP) [2]. In response, regulatory measures now require producers to ensure textile waste separation and implement recycling within a circular economy framework. Beyond mechanical and chemical recycling, the valorization of textile waste as a precursor for high-value carbon materials represents a promising alternative [3,4,5,6]. In particular, the conversion of textile waste into hard carbons (HCs) offers a dual opportunity: mitigating waste accumulation while providing a sustainable pathway for advanced energy storage applications [6,7].
At the same time, the increasing global energy demand and more stringent environmental regulations drive the need for advanced energy storage technologies capable of storing electricity generated from intermittent renewable sources like wind, solar, and tidal energy. Lithium-ion batteries (LIBs) have dominated the rechargeable battery market for decades due to their high energy density, efficiency, and reliability. However, the extensive reliance on lithium-ion technology has raised concerns about the scarcity of lithium resources (0.002 wt% or 20 ppm of the upper continental Earth crust) [8], high production costs, and the environmental and social impacts of lithium extraction. These challenges underscore the pressing need to develop alternative battery technologies that are both economically viable and environmentally sustainable.
Sodium-ion batteries (SIBs) [9] have emerged as a promising alternative to LIBs. Sodium is significantly more abundant (2.89 wt% of the upper continental Earth crust) [8] and evenly distributed across the globe compared to lithium, making it a cost-effective and sustainable choice for large-scale energy storage, at least at the raw material level [10,11]. In contrast to LIBs, which require copper foil as the current collector, SIBs allow the use of a more cost-effective, more abundant, and lighter aluminum collector, enhancing the sustainability of SIB technology [12]. However, the development of high-performance anode materials for SIBs remains a critical challenge [12]. Graphite is the most commonly used anode material in LIBs due to its high theoretic storage capacity (372 mAh g−1) [13]. However, the storage capacity of sodium ions in graphite is very limited due to the inability of sodium ions (which have a larger radius than lithium ions) to effectively intercalate within graphitic layers. As an alternative to graphite, HC, a type of non-crystalline layered carbon, has shown great potential as an anode material for SIBs due to its high sodium storage capacity, low working potential, and good cycling stability [13,14].
The distinction between hard and soft carbon is rooted in graphitizability: soft carbon can be converted into graphite when heat-treated at high temperatures (~2500–3000 °C) because its structure lacks strong cross-linking, while hard carbon remains disordered regardless of temperature due to its heavily cross-linked turbostratic structure. This concept was formally established by Rosalind Franklin in 1951 using X-ray diffraction and remains the scientific reference point today. In practice, the demarcation is assessed through a combination of interlayer spacing (d002), Raman spectroscopy (D/G band evolution), and precursor chemistry, but there is no single official ISO or ASTM standard that draws a hard line between the two.
Compared to graphite, HCs have a larger interlayer distance and higher porosity, allowing for more effective insertion of sodium ions and, therefore, higher storage capacity. The sodium storage mechanism in HCs is still under debate and several options are considered: initial adsorption on surface defects, filling nanopores with sodium, and insertion into small turbostratic graphitic domains (with expanded interlayer spacing relative to highly crystalline graphite). This multi-step storage process provides HCs with higher capacity than graphite, despite their less ordered structure [15].
Among the different carbon-based precursors [14,16,17,18] used for the synthesis of HCs, biomass-derived materials and particularly biomass waste [19] are the most sustainable source. Hence, following the “sustainable by design” principle, cotton textile waste, composed predominantly of cellulose, has been found to be an excellent precursor to produce high-quality HCs [20,21]. Various synthetic approaches have been described in the literature to convert cotton and cellulose-based biomass into HCs suitable as anodes for SIBs [20,21,22,23]. However, most of the methods involve the direct carbonization of precursors at high temperatures (above 1200 °C) to produce HCs with the desired structure and electrochemical performance. Nevertheless, the high energy consumption and low yield of the direct carbonization process run counter to environmental protection goals, making it less sustainable and less suitable for large-scale applications [24,25].
One promising strategy to enhance the yield and structural properties of HCs is the hydrothermal carbonization (HTC) pre-treatment of biomass-derived sources, including cotton waste [26,27,28]. Hydrothermal carbonization is known as an effective, sustainable method for the conversion of biomass waste into valuable carbon material (hydrochar) [29] by thermal treatment at moderate temperatures (180–280 °C) in an aqueous medium. However, the use of this method as a preliminary step prior to pyrolysis for HC production remains largely unexplored. According to previous studies, applying HTC before pyrolysis can influence the structural parameters of HCs and predefine their structure based on the reactions occurring during HTC. In this context, Hu et al. discussed the HTC process of biomass (either isolated carbohydrates or crude plants) as a promising route to design a rich family of carbonaceous materials with different particle shapes, sizes, and functional groups for multiple applications, including catalysis, energy storage, biological applications and sensors [27]. Recently, Xu et al. investigated the important role of the hydrothermal pre-treatment in regulating the structure of HC anodes for their optimized electrochemical performance when employing glucose as a carbon precursor [26]. In this study, by comparing HC anodes with and without hydrothermal pretreatment, it was confirmed that the additional hydrothermal process contributes to improved electrochemical performance, higher carbon yields, and reduced carbon emissions. It was suggested that HTC promotes the formation of additional active sites (defects, closed pores) within HCs, thus enhancing their sodium storage capacity. Nieto et al. also observed that the use of HTC prior to the pyrolysis step improved the specific capacity of all HC materials when compared to those that were directly pyrolyzed when employing biomass waste (spent coffee grounds, sunflower seed shells, and rose stems) [28].
An innovative approach to address the dual challenges of textile waste and sustainable energy storage is the conversion of cotton-based textile waste, with cellulose as its predominant component, into HC. Through controlled pyrolysis processes, cotton waste can be transformed into HC with structural and electrochemical properties tailored for sodium-ion battery applications. To the best of our knowledge, cotton-derived HCs used as anodes for sodium-ion batteries (SIBs) are typically prepared through direct pyrolysis of cotton at high temperatures (>1000 °C) [20,21,22]. Therefore, in this work, we studied the effect of the HTC process applied before the pyrolysis step on the structure and electrochemical performance of the final HCs. Unlike previous studies that primarily focus on direct pyrolysis of cotton waste, our work systematically evaluates how HTC pre-treatment influences structural parameters and electrochemical properties. Additionally, the use of a water stream during pyrolysis as an alternative to an inert atmosphere offers a route to modify the HC properties. Comprehensive characterization of the HCs via X-ray diffraction analysis (XRD), Raman, Electron Microscopy (TEM and SEM), X-ray photoelectron spectroscopy (XPS), and CO2 and N2 adsorption isotherms revealed appreciable changes in the HCs’ structure with different applied synthetic routes. The synthesized HCs were tested as anodes in half-cells using sodium as the counter electrode.

2. Experimental Section

2.1. Synthesis of HCs

HCs were prepared from textile cotton industrial waste (Recovery Textile Systems, S.L.; 99% purity) by three different synthetic methods. Two HCs were prepared by a two-step carbonization process and the third sample by direct pyrolysis.
The first step, applied to the first two samples, consisted of an HTC process at 250 °C. In a non-stirred 1 L Parr autoclave, a mixture of 100 g of cotton and 400 g of deionized water was heated under autogenous pressure from room-temperature to the desired temperature over 1.4 h, followed by an isothermal hold of four hours. After cooling to room temperature, the carbonaceous material was collected by filtration and washed with deionized water. The obtained solid, referred to as hydrochar, was dried at 100 °C overnight.
The second process consisted of a thermal treatment at 900 °C, either under a nitrogen atmosphere or in the presence of water vapor at standard pressure. Hence, the hydrochar was placed onto a frit in a vertical tubular quartz reactor (length 475 mm, diameter 44 mm; Dario Lorusso, Cuarzo & Vidrio, Hontoria, Segovia, Spain). The sample (approx. 10 g of dry powder) was heated by a heating mantle (Watlow, Ceramic fiber Heater, VC402A06A-0000R, Madrid, Spain) from room temperature to 900 °C with a heating rate of 15 °C min−1 and the final temperature was maintained for one hour. Nitrogen was passed at a flow rate of 20 mL min−1 and water was supplied at a flow rate of 10 mL h−1. The HC obtained in the presence of nitrogen was denoted as HC-250-N and the one produced in the presence of water vapor was denoted as HC-250-W.
The third HC sample was prepared by direct pyrolysis of cotton at 900 °C under a nitrogen atmosphere. The obtained HC was called HC-direct-N.
The yield for the hydrochar prepared at 250 °C was 42 wt%. The pyrolysis treatments of this material in the presence of nitrogen resulted in 50 wt% of HC, while in a water vapor atmosphere, 46 wt% of solid was obtained. The direct pyrolysis of cotton yielded 12 wt% of carbonaceous solid. From these data, the following overall yields from cotton to HCs were obtained: HC-250-N: 21 wt%; HC-250-W: 19 wt%; and HC-direct-N: 12 wt%.
Before structural and electrochemical characterization, the HC samples were ball-milled to obtain particles that were uniform and smaller than 1 µm. Ball milling was performed using a FRITSCH planetary ball mill (Pulverisette 6 classic line), using an 80 mL stainless-steel jar and 50 balls (10 mm diameter). HC (2 g) was placed in the jar and milled for 1 h at 350 rpm, consisting of 4 cycles of 15 min with a 10 min break after each cycle.

2.2. Characterization Techniques

CHN elemental analysis of HCs was performed using a PerkinElmer M CHN Analyzer 2400.
The inner structure of the synthesized HCs was studied by X-ray diffraction analysis (XRD). Powder XRD patterns were collected on a PANalytical Cubix FAST diffractometer using Cu Kα radiation (λ = 0.154 nm), without any correction for instrumental broadening. The interplanar distance d002 between graphene nanosheets was calculated using the Bragg equation, crystallite domain sizes La and Lc were calculated from the XRD patterns using the Scherrer equation [30] (2), and the results are presented in Figure 1B.
Bragg equation: d = λ/2sin θ
Scherrer equation: L = K·λ/β·cos θ,
where λ is the wavelength of the X-rays (Cu Kα radiation, 0.154 nm), θ is the Bragg angle of the peaks (degrees), and β is the full width at half-maximum (FWHM) of the XRD peak. The form factor K is 1.84 for La and 0.89 for Lc. For the HC-direct-N sample, an additional overlapping contribution in the range of 2Θ100 was detected, suggesting the presence of a second structural component. A deconvolution was applied (Figure S1) and the contribution with a similar shape as in the other two cases was considered for the determination of the crystallite size. The number of graphite-like microcrystal layers (N) in the HC crystallite was also calculated using the following equation:
N = (Lc/d002) + 1
Raman spectra were recorded on a Renishaw Raman (“Reflex”) spectrometer equipped with a CCD detector and a laser wavelength of 514 nm.
X-ray photoelectron spectroscopy (XPS) analysis was performed using a SPECS spectrometer equipped with a Mg Kα (1253.6 eV) X-ray source and a 150MCD-9 Phoibos detector. All binding energies were corrected using the C=C signal at 284.5 eV as an internal reference.
A field emission scanning electron microscope (FESEM, ULTRA 55, Zeiss) was used to study the morphology and particle size of the synthesized materials. SEM micrographs were recorded at 2 kV using a high-resolution in-lens detector. The elemental composition of the samples was determined by FESEM analysis using an X-ray detector (EDS).
A high-resolution transmission electron microscope (HR-TEM, JEM 2100F JEOL) was used to study the porosity and microstructure of the synthesized materials. TEM micrographs were recorded at 200 kV.
High-resolution nitrogen adsorption–desorption isotherms were measured using a BELSORP MAX II apparatus at −196 °C. Before the analysis, 200 mg of each HC sample was degassed at 400 °C at 5 × 10⁻⁶ bar overnight. The BET surface area was calculated using the Brunauer–Emmett–Teller equation, and the micropore volume was calculated using the t-plot method. CO2 adsorption isotherms were measured using an ASAP 2010 apparatus at 25 °C. Before the analysis, HC samples were degassed at 400 °C at 5 × 10⁻⁶ bar overnight. The surface area was determined through the monolayer capacity of CO2 at 25 °C using the Dubinin–Astakhov equation. The pore size distribution of HCs was determined from CO2 and N2 isotherms using non-localized density functional theory and the Grand Canonical Monte Carlo (NLDFT/GCMC) method appropriate for carbon materials.

2.3. Electrochemical Tests

The working electrodes were prepared by mixing 86% of active material (synthesized HC), 10% of conductive carbon black (C-NERGY SUPER C 65 from IMERYS, >96% battery grade), 2% of carboxymethyl cellulose (CMC) of low viscosity (MTI, >99.5%), and 2% of styrene-butadiene rubber (SBR; MTI, >99.5%) added as binders. All components were dispersed in deionized water and mixed until a homogeneous slurry was obtained. After that, the slurry was deposited on copper foil (current collector) using the Doctor blade technique (Figure S2A) and dried first at 60 °C for 30 min and then at 110 °C for 30 min.
The electrodes obtained were cut into 15 mm diameter discs and placed against a metallic sodium disc (used as counter and reference electrode) to form pouch-type anodic half-cells, as shown in Figure S2B. The electrolyte consisted of 1 M NaPF6 in ethylene carbonate:ethyl methyl carbonate (30:70, wt%; ELYTE innovations, 99% battery grade). Glass fiber (GF, 18 × 1.55 mm) was used as a separator between the electrodes. The cells were assembled inside an Ar-filled glovebox (MBraun; H2O, O2 < 0.5 ppm). Table S1 summarizes the average thicknesses of the electrodes as well as the average mass loading of active material (HC) in each electrode.
Electrochemical impedance spectroscopy (EIS) measurements were carried out on a Potentiostat-Galvanostat (Metrohm)—Autolab (PGStat302) within a frequency range from 100 kHz to 0.1 Hz, with a sinusoidal perturbation of 10 mV. Cyclic voltammetry (CV) was performed on the same instrument. The voltage range was set to 0.01–3 V with a scan rate of 0.1 mV s−1. For galvanostatic charge/discharge (GCD), a Neware Tech battery test system was employed, with the potential range of 0.01–3 V and a maximum current of 30 mA. For cycling tests, the current was set to 50 mA.

3. Results and Discussion

3.1. Synthesis and Structural Characterization of HCs

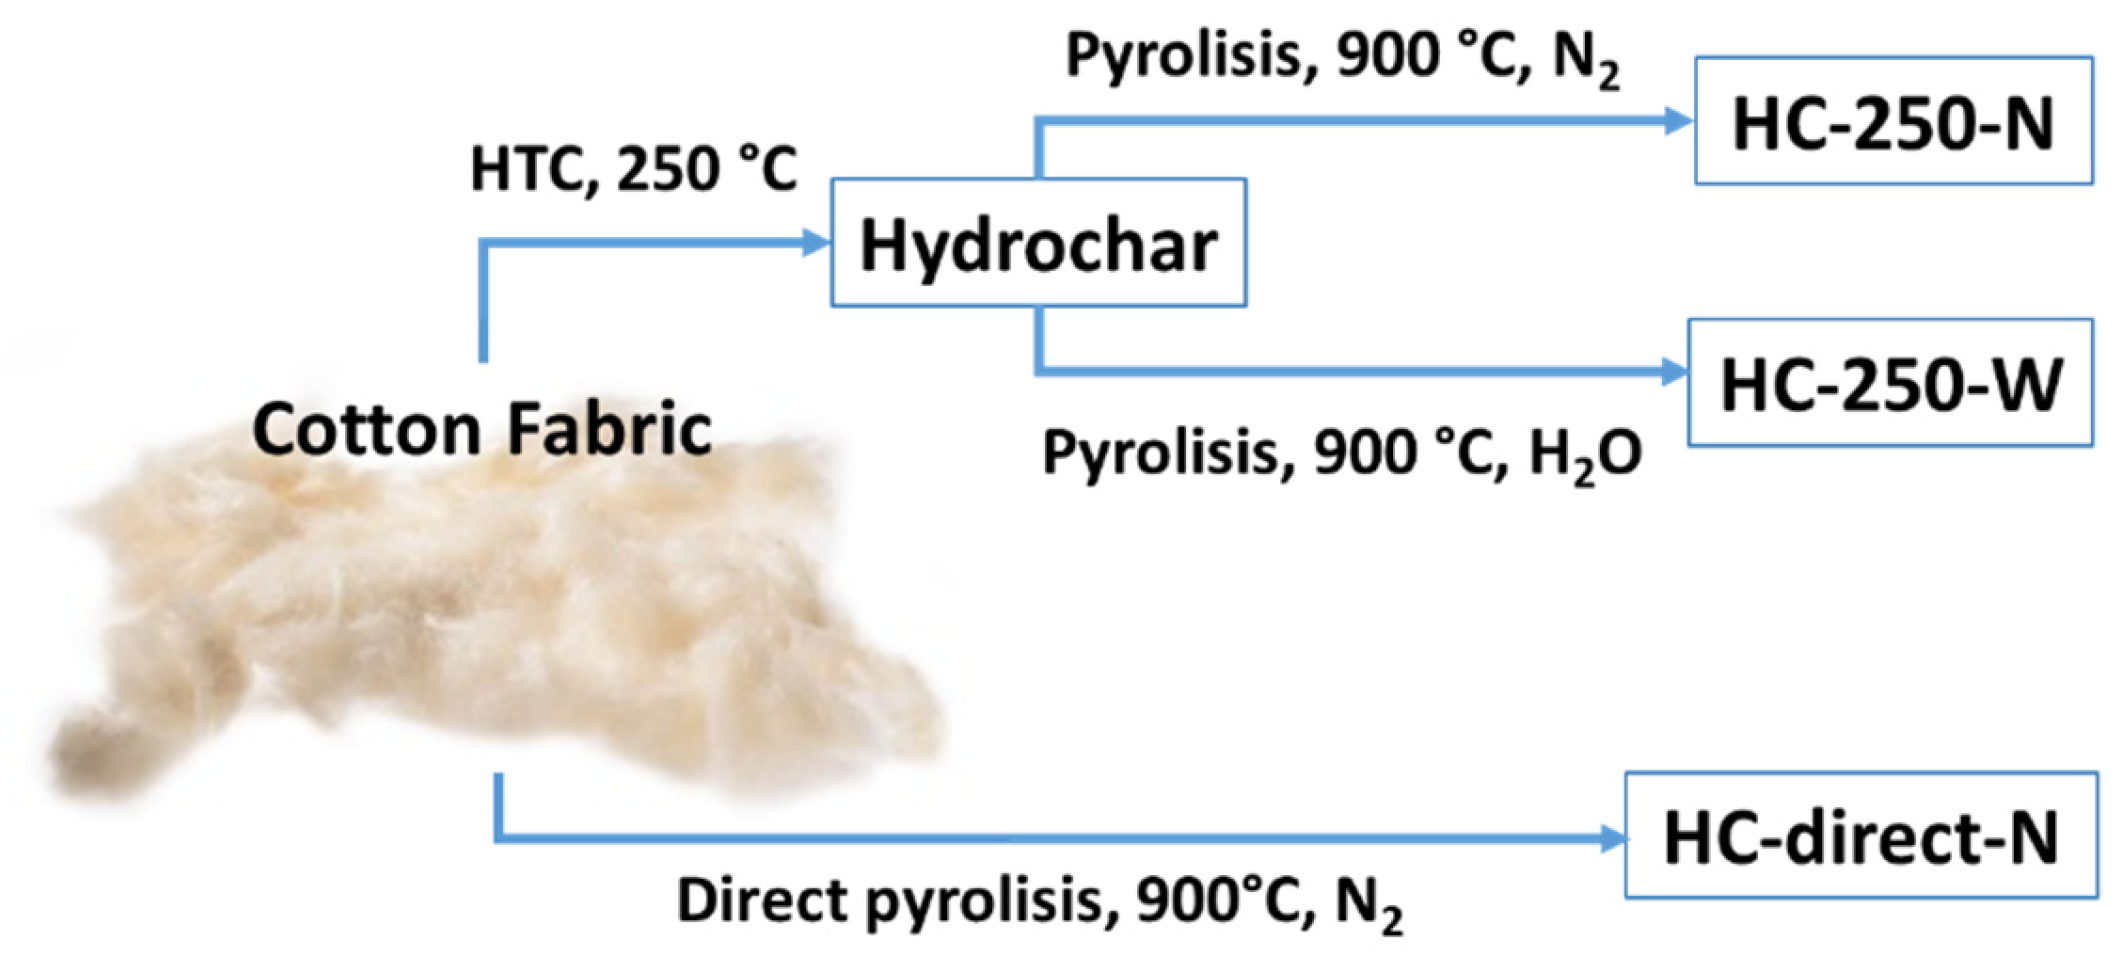
The synthesis of HCs from textile cotton waste was carried out using three different synthetic pathways, as illustrated in Scheme 1. Two samples of HCs were prepared by hydrothermal carbonization (HTC) at 250 °C, followed by thermal treatment at 900 °C in the presence of water (HC-250-W) or a N2 atmosphere (HC-250-N). For comparison, direct pyrolysis of cotton textile waste at 900 °C under N2 atmosphere was applied and the obtained sample was labeled as HC-direct-N. The following overall yields from cotton to HCs were obtained: HC-250-N: 21 wt%; HC-250-W: 19 wt%; and HC-direct-N: 12 wt%. Interestingly, when a two-step procedure including the HTC pre-treatment was used, the yield increased by 60–75% in comparison with the direct pyrolysis, which is a notable advantage from a sustainability perspective.
The HCs were characterized by elemental analysis: the bulk carbon content of the HC samples was determined by CHN elemental analysis and compared to superficial values obtained from SEM-EDS elemental mapping analysis (Table S2). The results indicate that the bulk carbon content of HC-250-N and HC-250-W samples pretreated by HTC was significantly higher than that of the HC-direct-N sample. The same trend was observed by Nieto et al., suggesting that an HTC pretreatment decreases the oxygen content while increasing the carbon content of HCs after the pyrolysis step [28]. This reduction in oxygen content can be attributed to dehydration and decarboxylation reactions occurring during HTC, which effectively eliminate oxygen-containing functional groups such as hydroxyl (–OH), carboxyl (–COOH), and carbonyl (–C=O) groups. The dehydration reactions may occur in an intermolecular manner, e.g., by aldol condensations, thereby introducing new carbon–carbon bonds. In this way, more extensive macromolecule networks are formed, which are more resistant to fragmentation and volatilization during the pyrolysis step. This observation is consistent with the previously reported improvements in overall yield. Additionally, the higher carbon content prior to pyrolysis results in a final material with lower oxygen content compared to that produced by direct pyrolysis. Similar effects have been reported in biomass-derived carbon materials, where HTC pre-treatment enhances carbonization efficiency and structural stability [31].
SEM-EDS elemental mapping analysis was performed to determine the near-surface chemical composition of synthesized samples, the distribution of detected elements over the HC samples, as well as the presence of certain impurities (Figure S3). The main elements detected by EDS analysis are carbon (C) and oxygen (O), with Al, Si, Fe, and Cr also present in small quantities (Figure S3). The oxygen content is slightly higher for HC-250-W and HC-250-N (7.5% and 8.6%, respectively) when employing this near-surface technique compared to the bulk analysis (6.2% and 6.4%, respectively; Table S2), which might be related to partial surface oxidation or oxygen functionalities at graphene plane edges. In contrast, for the HC-direct-N sample, the superficial oxygen content (9.7%) was significantly lower compared to the bulk content (13.7%; Table S2). This is likely due to the formation of ultramicropores (see textural properties below), resulting from the rapid formation of small fragments of cellulose or glucose during pyrolysis. This leads to incomplete structural rearrangement and the enclosure of small pore domains containing residual carbohydrate fragments. Oxygen-containing groups can influence surface chemistry, potentially enhancing sodium adsorption sites in electrochemical applications. Additionally, the presence of trace elements (Al, Si, Fe, and Cr) was observed. They could originate from the textile precursor or processing conditions, and due to their low concentration, the potential effects on electrochemical performance should be minimal.
From this comparison of bulk and surface elemental analysis, it can be concluded that the HTC pre-treatment facilitates oxygen-eliminating chemical reactions. This transformation produces two beneficial effects: improved carbon yield and higher carbon content in the final material. These factors are expected to result in improved electrochemical performance.
X-ray diffraction was employed to gain insight into the crystallographic order of carbon materials. XRD patterns of synthesized HCs showed two main broad peaks at around 23° and 43° 2θ (Figure 1A), corresponding to the (002) and (100) crystallographic planes, characteristic of HC materials [32,33]. The (002) peak of the HC-250-W sample is slightly shifted toward higher 2θ angles compared to the other two samples (Figure 1A). This indicates that the interplanar distance d002 calculated from Bragg’s law (1) is slightly lower for HC-250-W than that obtained for the other two samples (see values of d002 in the table of Figure 1B). It should be noted that interplanar distance d002 in the HC materials is attributed to the distance between graphene nanosheets, curved, and randomly distributed within the HC crystallites [34]. In this context, all synthesized samples exhibited a higher d002 interlayer distance (3.63–3.72 Å) compared to that of graphite (3.4 Å), which is favorable for effective sodium intercalation between graphene layers [34,35]. However, this point is under discussion since a previous theoretical study suggested that the upper d002 value should be less than 4.0 Å, as otherwise, surface sodium ion adsorption reactions occurred instead of intercalation [13].
Additionally, from the XRD patterns, crystallite domain sizes La and Lc were calculated using the Scherrer equation [36] (2) and the results are presented in the table of Figure 1B. La is related to the layer plane (100) length along the a-axis, whereas the Lc corresponds to the thickness of the crystallite along the c-axis (002) (Figure 1C). Many theoretical studies have suggested that the higher La and Lc values correspond to the higher ordered and graphite-like HC structural domains [33]. For all synthesized samples, the thickness Lc of crystallite domains is similar (Figure 1B), with the Lc of the HC-250-W sample being slightly smaller than that of the other two samples. As a result, the number of graphite-like layers (N) is approximately four for all samples. Similarly, the La parameter is in the same range for the three samples, being 5% smaller in HC-direct-N (38.6 Å) than in HC-250-W (40.2 Å) and HC-250-N (40.6 Å) samples. The slightly higher La values of the HC-250-W and HC-250-N samples compared to HC-direct-N suggest that the two-step treatment leads to the formation of larger graphene sheets and, consequently, more highly ordered materials than those produced by the direct pyrolysis of waste cotton (HC-direct-N). Additionally, it was observed that the XRD peak at approximately 43° corresponding to the HC-direct-N sample exhibits an asymmetric shape, with at least two components revealed by precise Gaussian fitting (Figure S1). The broad peak 1 (2θ = 43.89°) was attributed to the (100) plane of graphitic-like domains, like the other two samples. The origin of peak 2 (2θ = 44.38°) remains unclear; however, its presence may suggest a more heterogeneous structure in the HC-direct-N sample, potentially resulting from non-uniform ordering caused by direct pyrolysis.
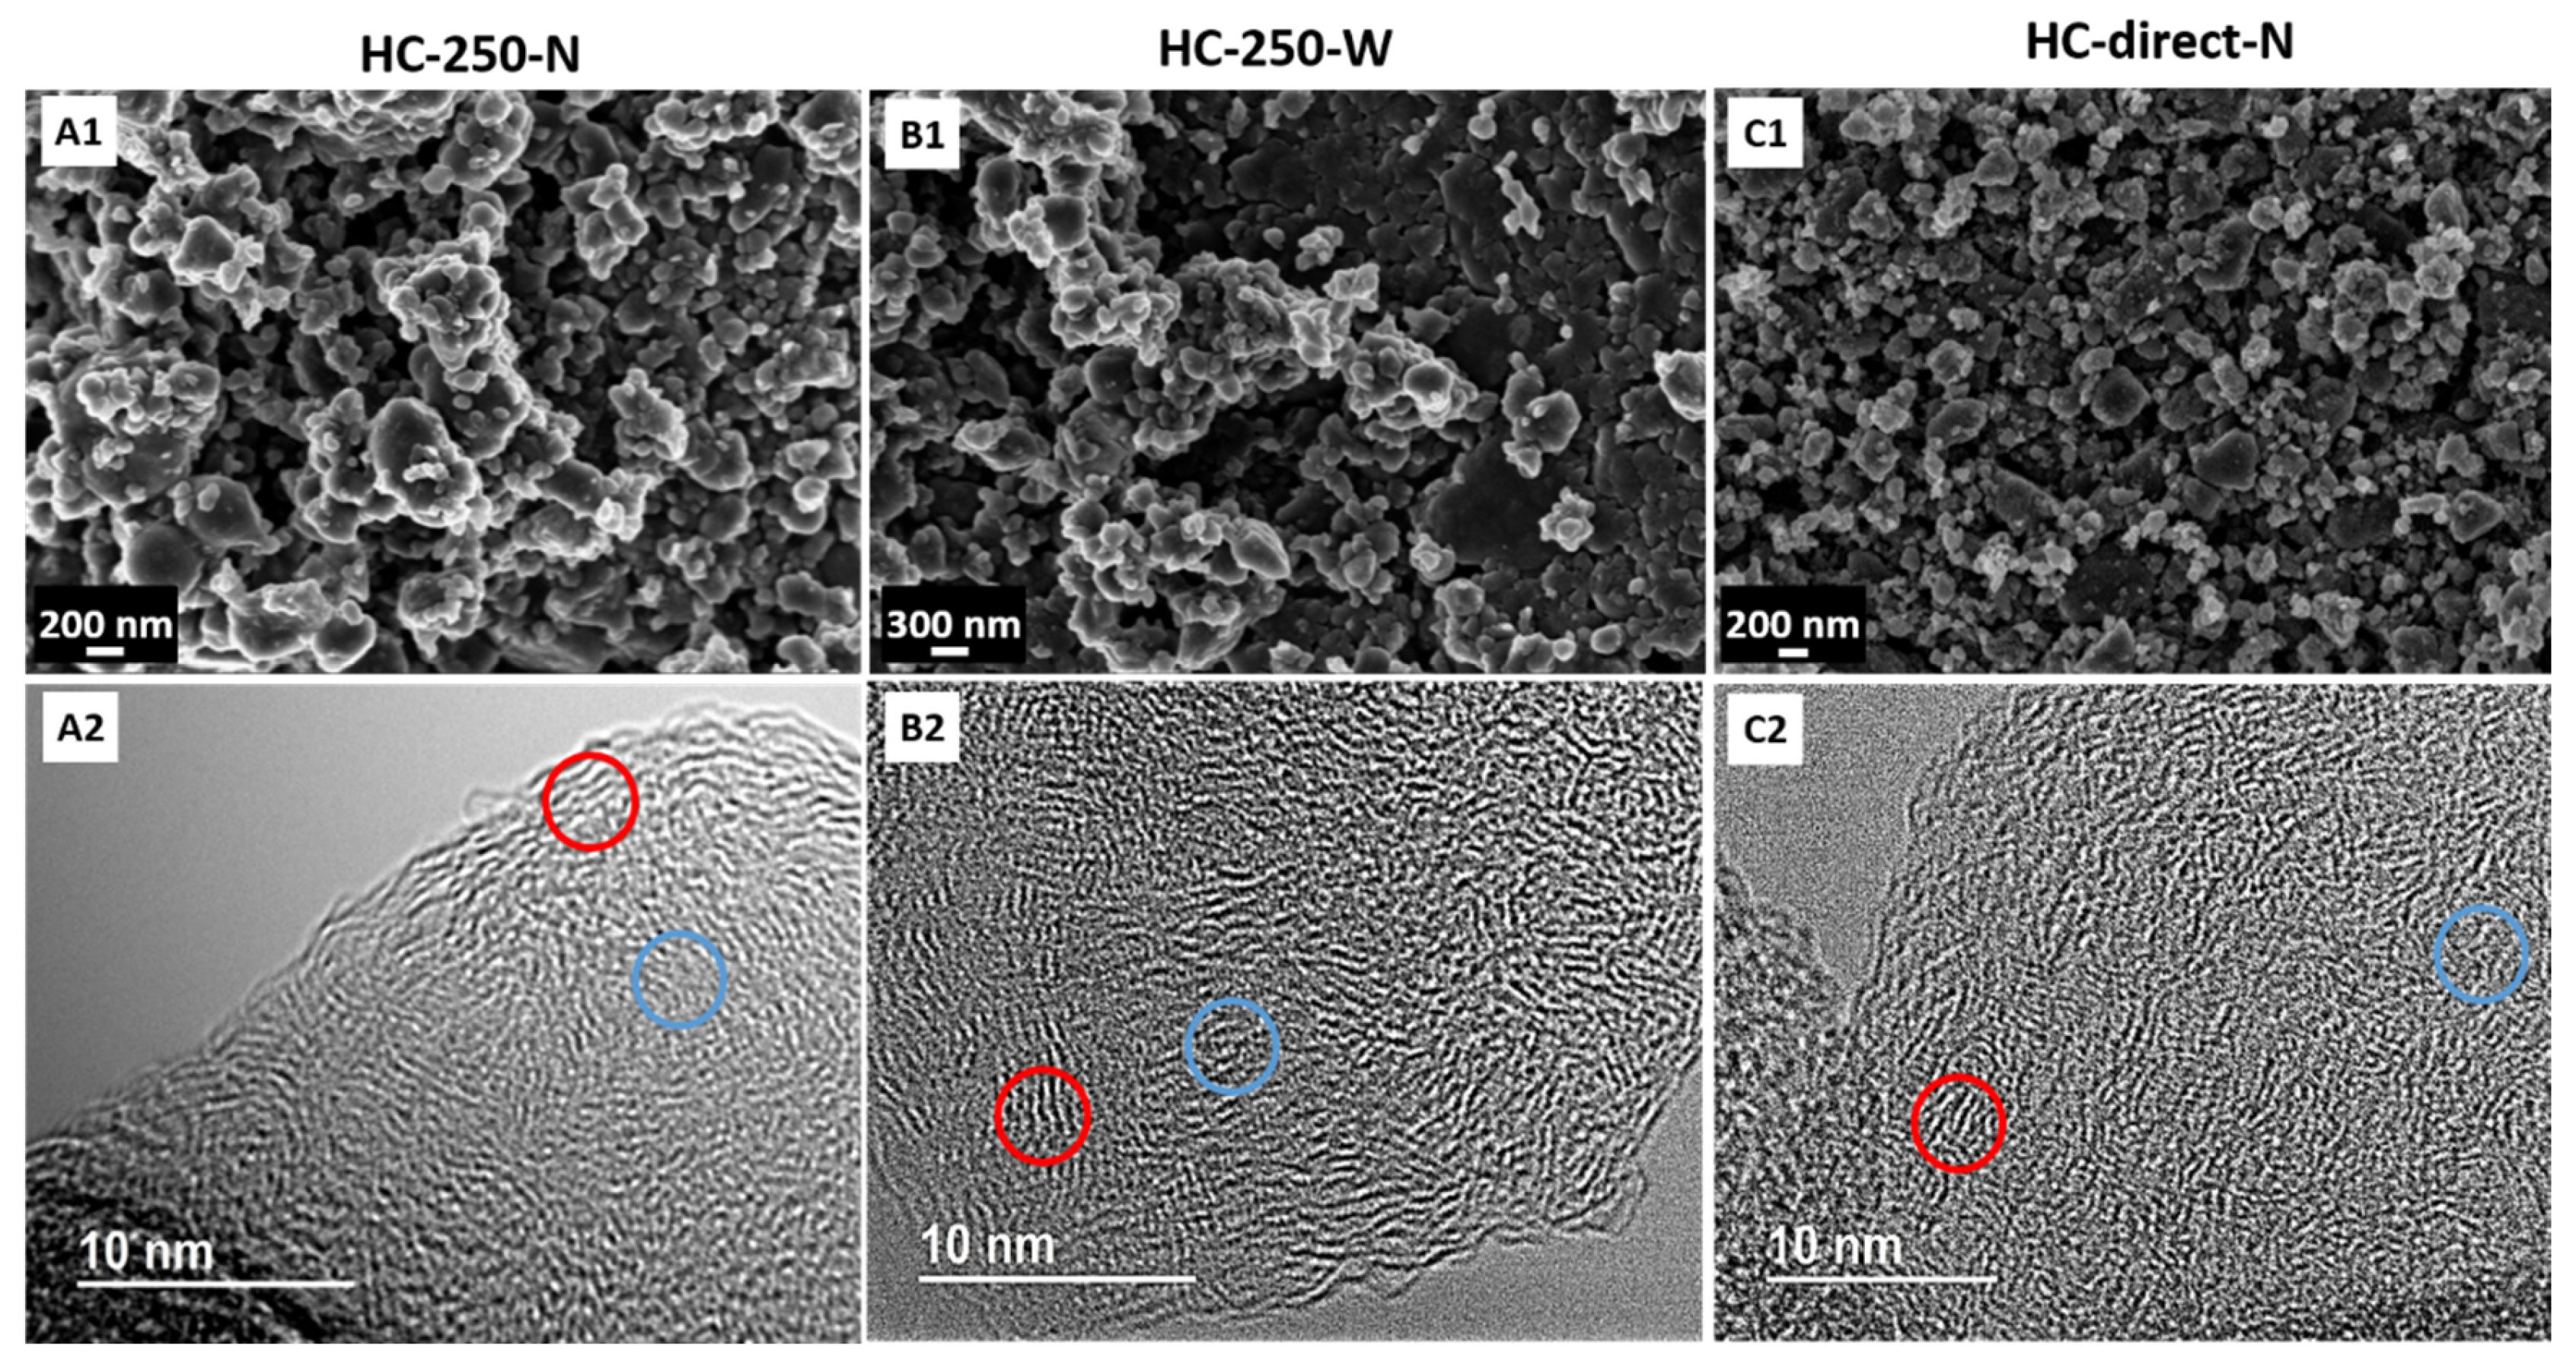
The morphology and microstructure of the prepared HC were analyzed in more detail by HR-FESEM and HR-TEM techniques. As shown in Figure 2(A1–C1), small, randomly shaped particles were observed in all samples. The average particle size is similar across the three samples, ranging between 135 and 200 nm (Figure S2).
HR-TEM images (Figure 2(A2–C2)) show two main structural domains of synthesized HCs corresponding to pseudo-graphitic regions characterized by the presence of parallel curved graphene layers (red circles in Figure 2(A2–C2)) and disordered regions with randomly distributed porosity (blue circles in Figure 2(A2–C2)). The curved graphene layers consist of approximately four units, consistent with the XRD analysis discussed above. While the three HC samples share a common structural framework characteristic of these materials, namely amorphous and turbostratic graphitic domains [33,37,38], there are subtle differences in the degree of structural ordering, the extent of amorphous content, and the curvature of the graphitic layers. However, it is important to note that microscopy images always reflect a local scene, and therefore, their significance is local, and subtle differences observed should not be overinterpreted. Nevertheless, TEM provides a valuable complement to the XRD analysis. As illustrated in Figure 1C, the TEM analysis reveals that the planar graphene domains concept needs to be adapted for curved surfaces.
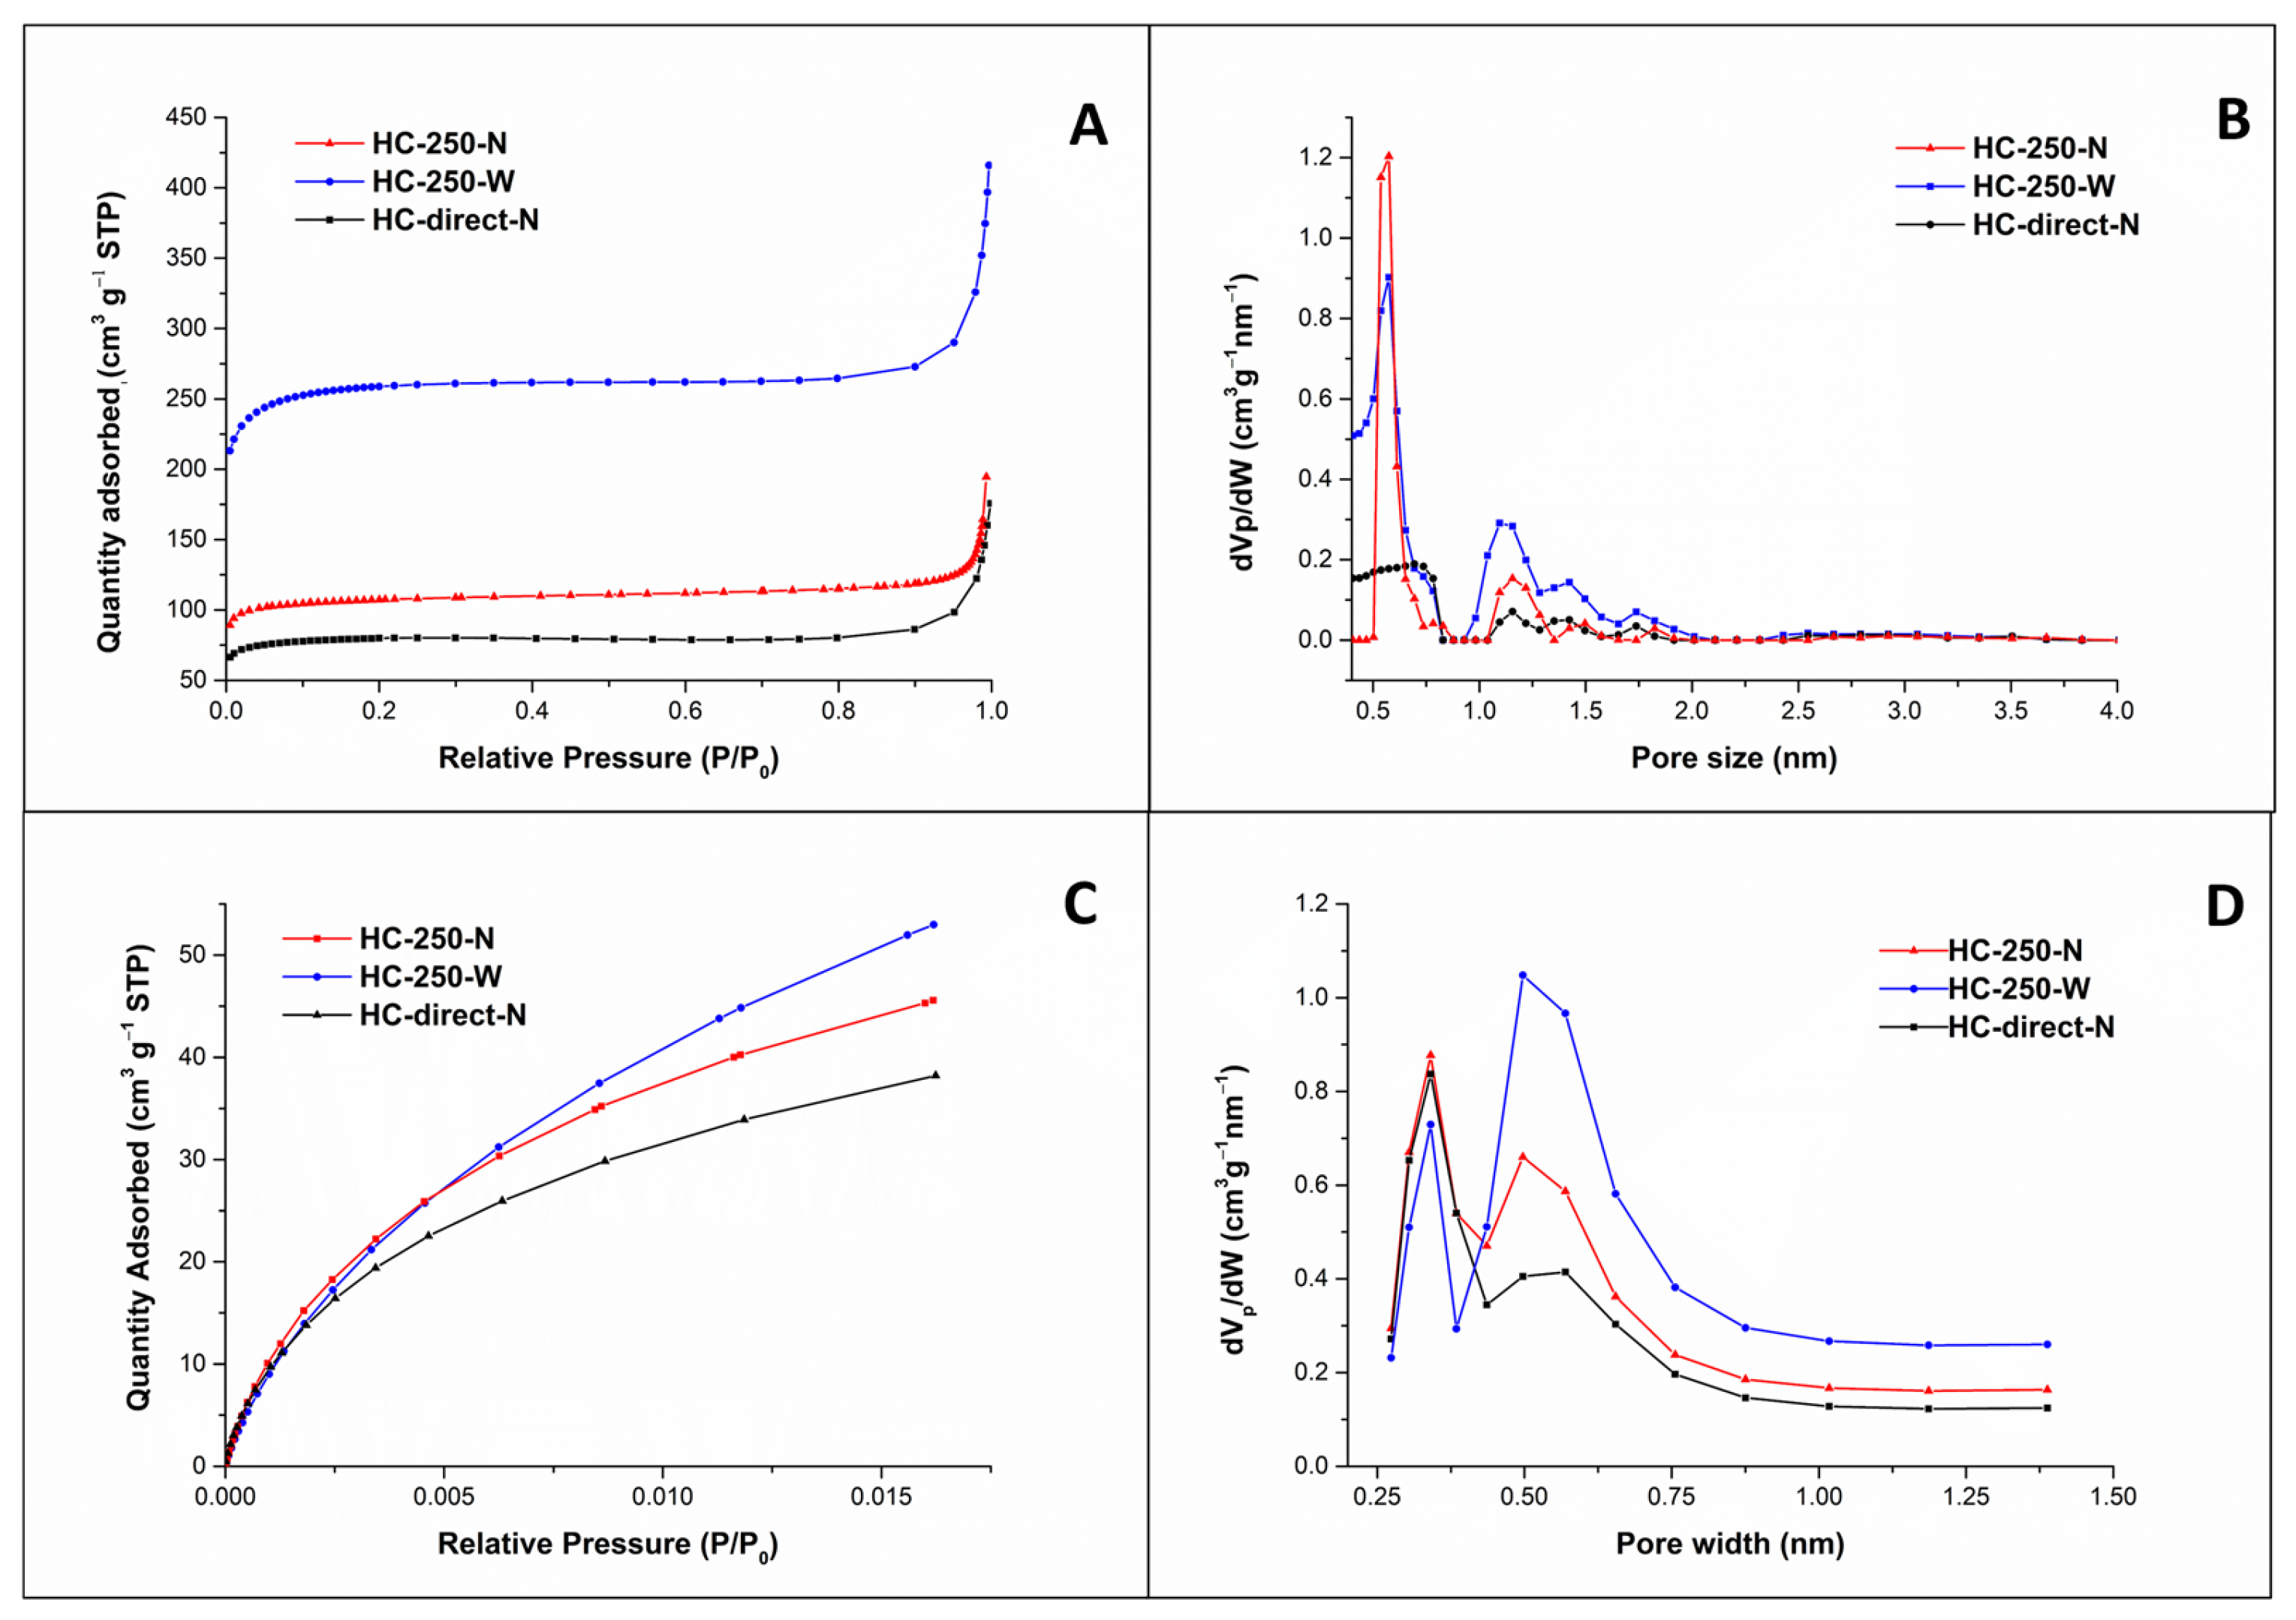
To examine the pore structure and specific surface area of HCs synthesized under different conditions, N2 and CO2 adsorption–desorption analyses were performed. The N2 adsorption results show that all samples exhibit a type I isotherm (Figure 3A), characteristic of microporous materials [39]. Pore size distribution analysis was therefore performed on the adsorption branch using the NLDFT model, as the desorption branch does not yield additional information in the absence of mesopores. The specific surface area (SBET) was determined using the BET method, and the total pore volume was calculated using the t-plot method, both based on nitrogen adsorption data.
The BET surface area results, presented in Table 1, show that the sample HC-250-N (427 m2 g−1) synthesized by the two-step HTC-pyrolysis method exhibited a higher specific surface area compared to the HC-direct-N sample (312 m2 g−1). These findings are consistent with previously reported results, suggesting that a low-temperature hydrothermal carbonization step prior to pyrolysis promotes the formation of additional microporosity, resulting in increased specific surface area [26,28].
Additionally, the pyrolysis of HCs in the presence of water (instead of a nitrogen atmosphere) led to a significant increase in the specific surface area (from 427 to 1011 m2 g−1) and micropore volume (from 0.159 to 0.403 cm3 g−1) in the HC-250-W material (Table 1). It can be hypothesized that the water present during the pyrolysis treatment resulted in the formation of defect sites, i.e., holes, in the graphene planes. This is supported by the elevated oxygen content evidenced by the elemental analysis (Table S2). In addition, these defect sites may contribute to the development of interconnected microporous networks or to the enlargement of existing pores. It has been reported that the formation of steam-derived oxygen functionalities could also influence the final pore structure by altering the reactivity of the carbon surface during pyrolysis [40]. In addition, the presence of water during pyrolysis can facilitate gasification reactions, leading to the formation of CO and CO2 through reactions such as C + H2O → CO + H2 (steam reforming reaction) and C + 2H2O → CO2 + 2H2. These reactions promote the selective removal of carbon, generating additional porosity and increasing the micropore volume.
The pore width distribution of HCs was calculated using the non-local density functional theory (NLDFT) model for N2 adsorption isotherm [41]. The pore size distributions (dVp/dW) of HC-250-N, HC-250-W, and HC-direct-N samples reveal distinct microporosity profiles (Figure 3B). Specifically, a sharp peak with a maximum at 0.57 nm for HC-250-N indicates a higher concentration of micropores, while HC-250-W exhibits a profile with a more significant contribution from the mesoporous region (1–2 nm). In contrast, the HC-direct-N sample does not show a clear peak at 0.57 nm and exhibits a broader micropore size distribution overall, with less pronounced maxima and a relatively lower pore volume than the other samples. This is likely a consequence of the absence of a hydrothermal carbonization step, which, in the case of HC-250-W and HC-250-N, appears to create better-defined and higher-volume microporosity.
Additionally, the CO2 adsorption analysis was performed at room temperature (25 °C) to study the presence of ultramicropores smaller than 0.4 nm, inaccessible for nitrogen gas molecules at −196 °C. It is well known that CO2 gas provides faster diffusion kinetics to narrow pores compared to N2, due to the higher measurement temperature employed [32,42]. The specific surface area of HCs was calculated from the CO2 adsorption isotherm data using the Dubinin–Astakhov equation [43], chosen as the most suitable method. It has been developed for carbon materials [32,42,44], specifying a slit geometry for the pores. As presented in Table 1 and Figure 3C, the specific surface area obtained from CO2 is higher for all samples than that obtained from N2 adsorption isotherms. This observation indicates the presence of ultramicropores (<0.4 nm) that are inaccessible to N2. Additionally, the increase in the specific surface area measured by CO2 versus nitrogen for the HC-direct-N sample is significantly greater (the surface more than doubles) than for the other two samples. These results suggest that HC-direct-N possesses a distinct microporous structure, characterized by a higher contribution of ultramicropores that are exclusively accessible to CO2. The pore size distribution derived from CO2 adsorption data (Figure 3D) exhibits a similar profile for all samples. A comparable volume was observed for the pore size of 0.3 nm, together with a second component with a larger diameter in the range of 0.4–0.75 nm. The volumes of this second component differed among the samples and corresponded to the volume distribution observed by nitrogen adsorption. These findings imply that the HC-direct-N sample largely comprises ultramicropores, thus exhibiting a greater adsorption capacity for CO2 compared to N2. This higher concentration of ultramicropores in HC-direct-N may be attributed to the direct pyrolysis process, where rapid formation of small fragments at high temperature leads to incomplete structural rearrangement and trapping of small pore domains, in line with the higher bulk content of oxygen, as confirmed by elemental analysis, as discussed before (Table S2). In contrast, the two-step HTC-pyrolysis treatment enables gradual structural reorganization involving carbon–carbon bond formation (also evidenced by CHN analysis and a lower oxygen content, see above) and promoting the formation of larger pores, as evidenced by nitrogen adsorption. The observed variations in pore size distribution and specific surface area could significantly impact the sodium storage mechanism. While a higher surface area and microporosity could enhance the initial sodium uptake via adsorption, excessive ultramicroporosity in HC-direct-N may lead to higher irreversible capacity losses.
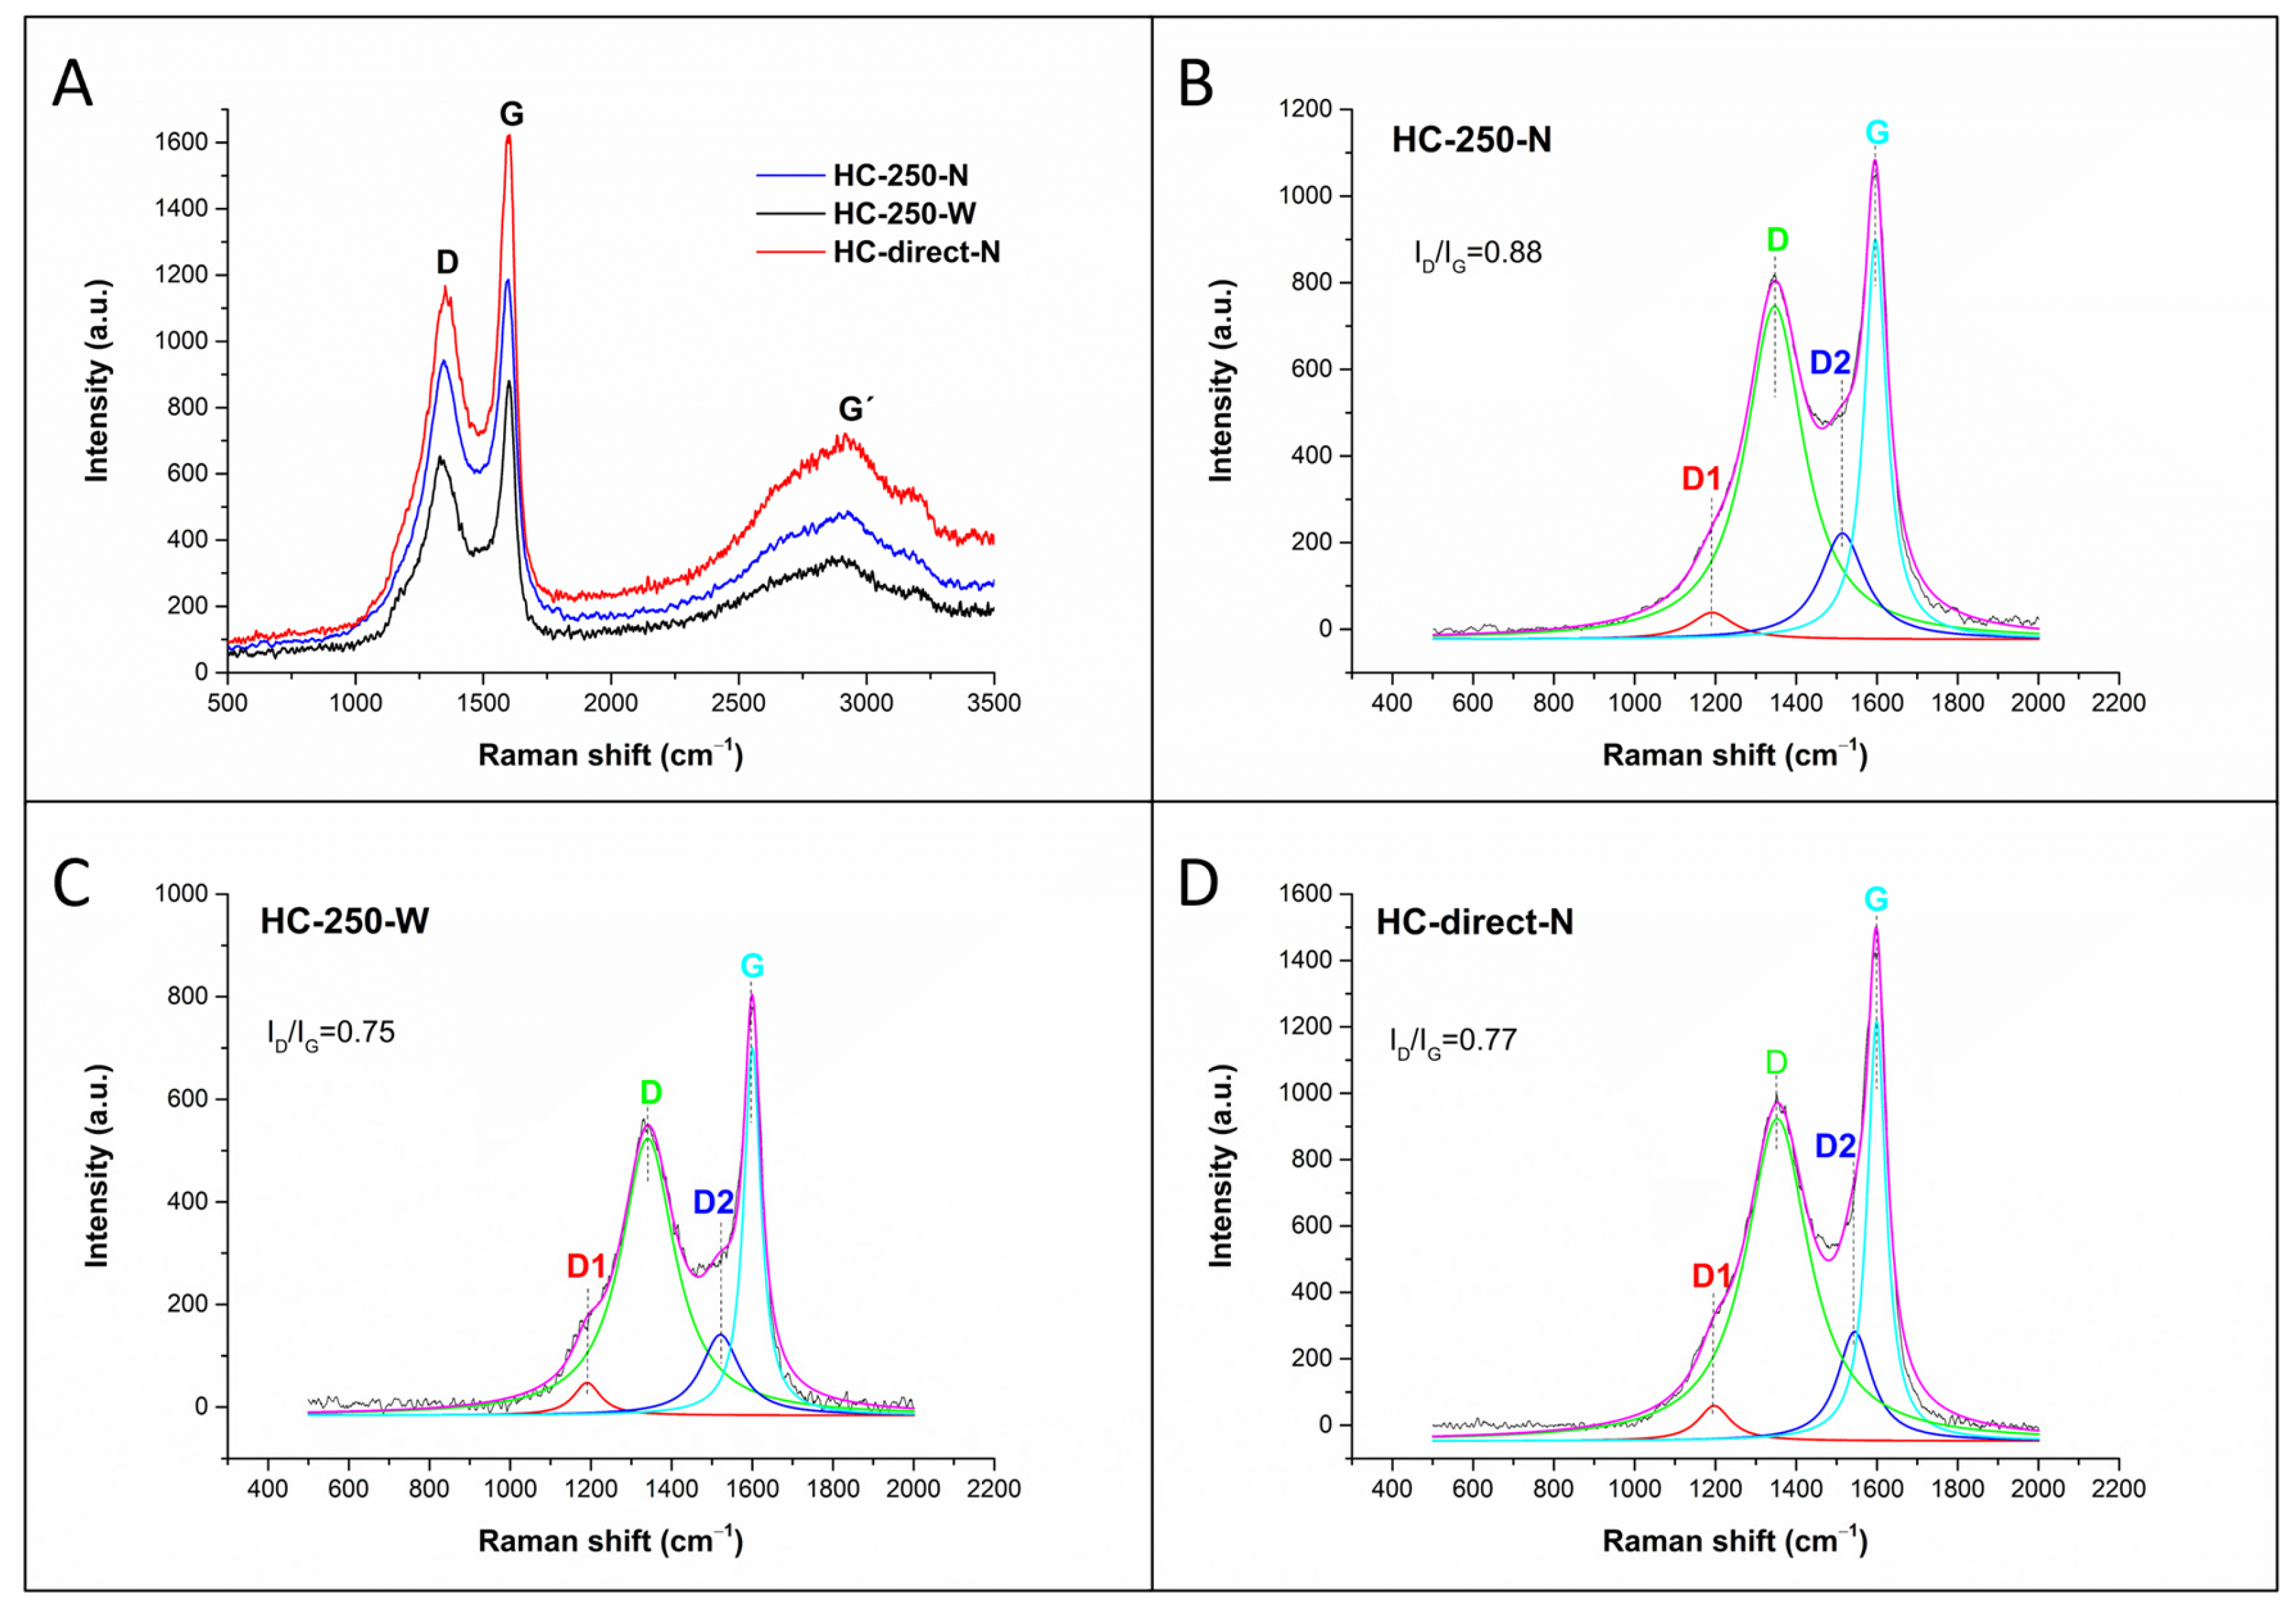
Raman spectroscopy has become a powerful technique for the characterization of carbon-based materials, providing information about their structure, degree of ordering, electronic properties, and defects. Raman spectra of the HC samples (Figure 4A) exhibit three characteristic bands at approximately 1350 cm−1, 1600 cm−1, and 2900 cm−1, assigned as the D, G, and G′ bands, respectively (Table S3). According to previous studies, the G band is related to the E2g vibration of sp2 carbon in planar graphite sheets [45], thus confirming the presence of turbostratic graphitic domains in HC samples. These domains are based on aromatic C6 rings in which all carbon atoms exhibit sp2 hybridization. The D band is typically assigned to the A1g vibration of C6 rings [46], which is forbidden in perfect graphene planes but becomes active due to neighboring structural disorder [47], for instance, by vacancies in graphitic domains, by edges or by sp3 carbon atoms [48]. It is well known that the D-band does not occur in the Raman spectra of highly ordered pyrolytic graphite (HOPG) [45]. The G′ band (2D band) corresponds to the second-order overtone and combinational Raman mode of graphite-like structures and it is rarely investigated in HCs due to the limited structural information it provides.
For a deeper understanding of the HC structure, a more precise deconvolution of the Raman spectra was performed (Figure 4B–D). There is no standardized methodology for deconvolution and interpretation of Raman spectra contributions in HCs [49]. However, the most commonly used deconvolution models in the literature contain four [30,46,50] or five [51,52,53] components, all of which include the D and G bands as main features. A deconvolution of four Lorentzian peaks (G, D, D1, and D2) was applied, as this approach yielded the most accurate fitting. The G peak at 1596–1600 cm−1 was assigned to the ordered turbostratic graphitic domain, whereas the D peak at 1340–1353 cm−1 was attributed to the presence of structural defects of the graphitic order. The attribution of the D1 band (1190–1197 cm−1) and the D2 band (1514–1520 cm−1) remains unclear. According to several Raman spectroscopy studies in carbon materials [45,51], D1 and D2 contributions are present in highly defective carbons (carbon black). Therefore, these bands were taken as further evidence of structural disorder, consistent with the three previously mentioned origins of the D band: vacancies, edges, or sp3-hybridized carbon atoms.
The intensity and area ratio between D and G bands (ID/IG) is commonly used to describe the degree of disorder caused by structural defects of carbon materials. According to the three-stage Raman model of Ferrari [54], the ID/IG ratio increases as graphitic ordering increases within stage II carbons, even as the absolute number of defects decreases. Specifically, this phenomenon occurs because, in the transition from amorphous to nanocrystalline carbon (stage II), the formation of small ordered turbostratic graphitic domains is accompanied by a higher Raman-visible defect density in the neighborhood of aromatic C6 rings, leading to an increase in ID/IG. However, at later stages, where graphitic ordering is dominant, ID/IG starts to decrease again. Considering the XRD results, in particular the crystallite extension along the a-axis, HC-250-N possesses the highest degree of order, which is consistent with the highest ID/IG ratio observed for this sample compared to HC-250-W and HC-direct-N. Xu et al. also observed that the ID/IG ratio of HC samples derived from glucose increases when the defect concentration decreases according to the Ferrari stage II model [26].
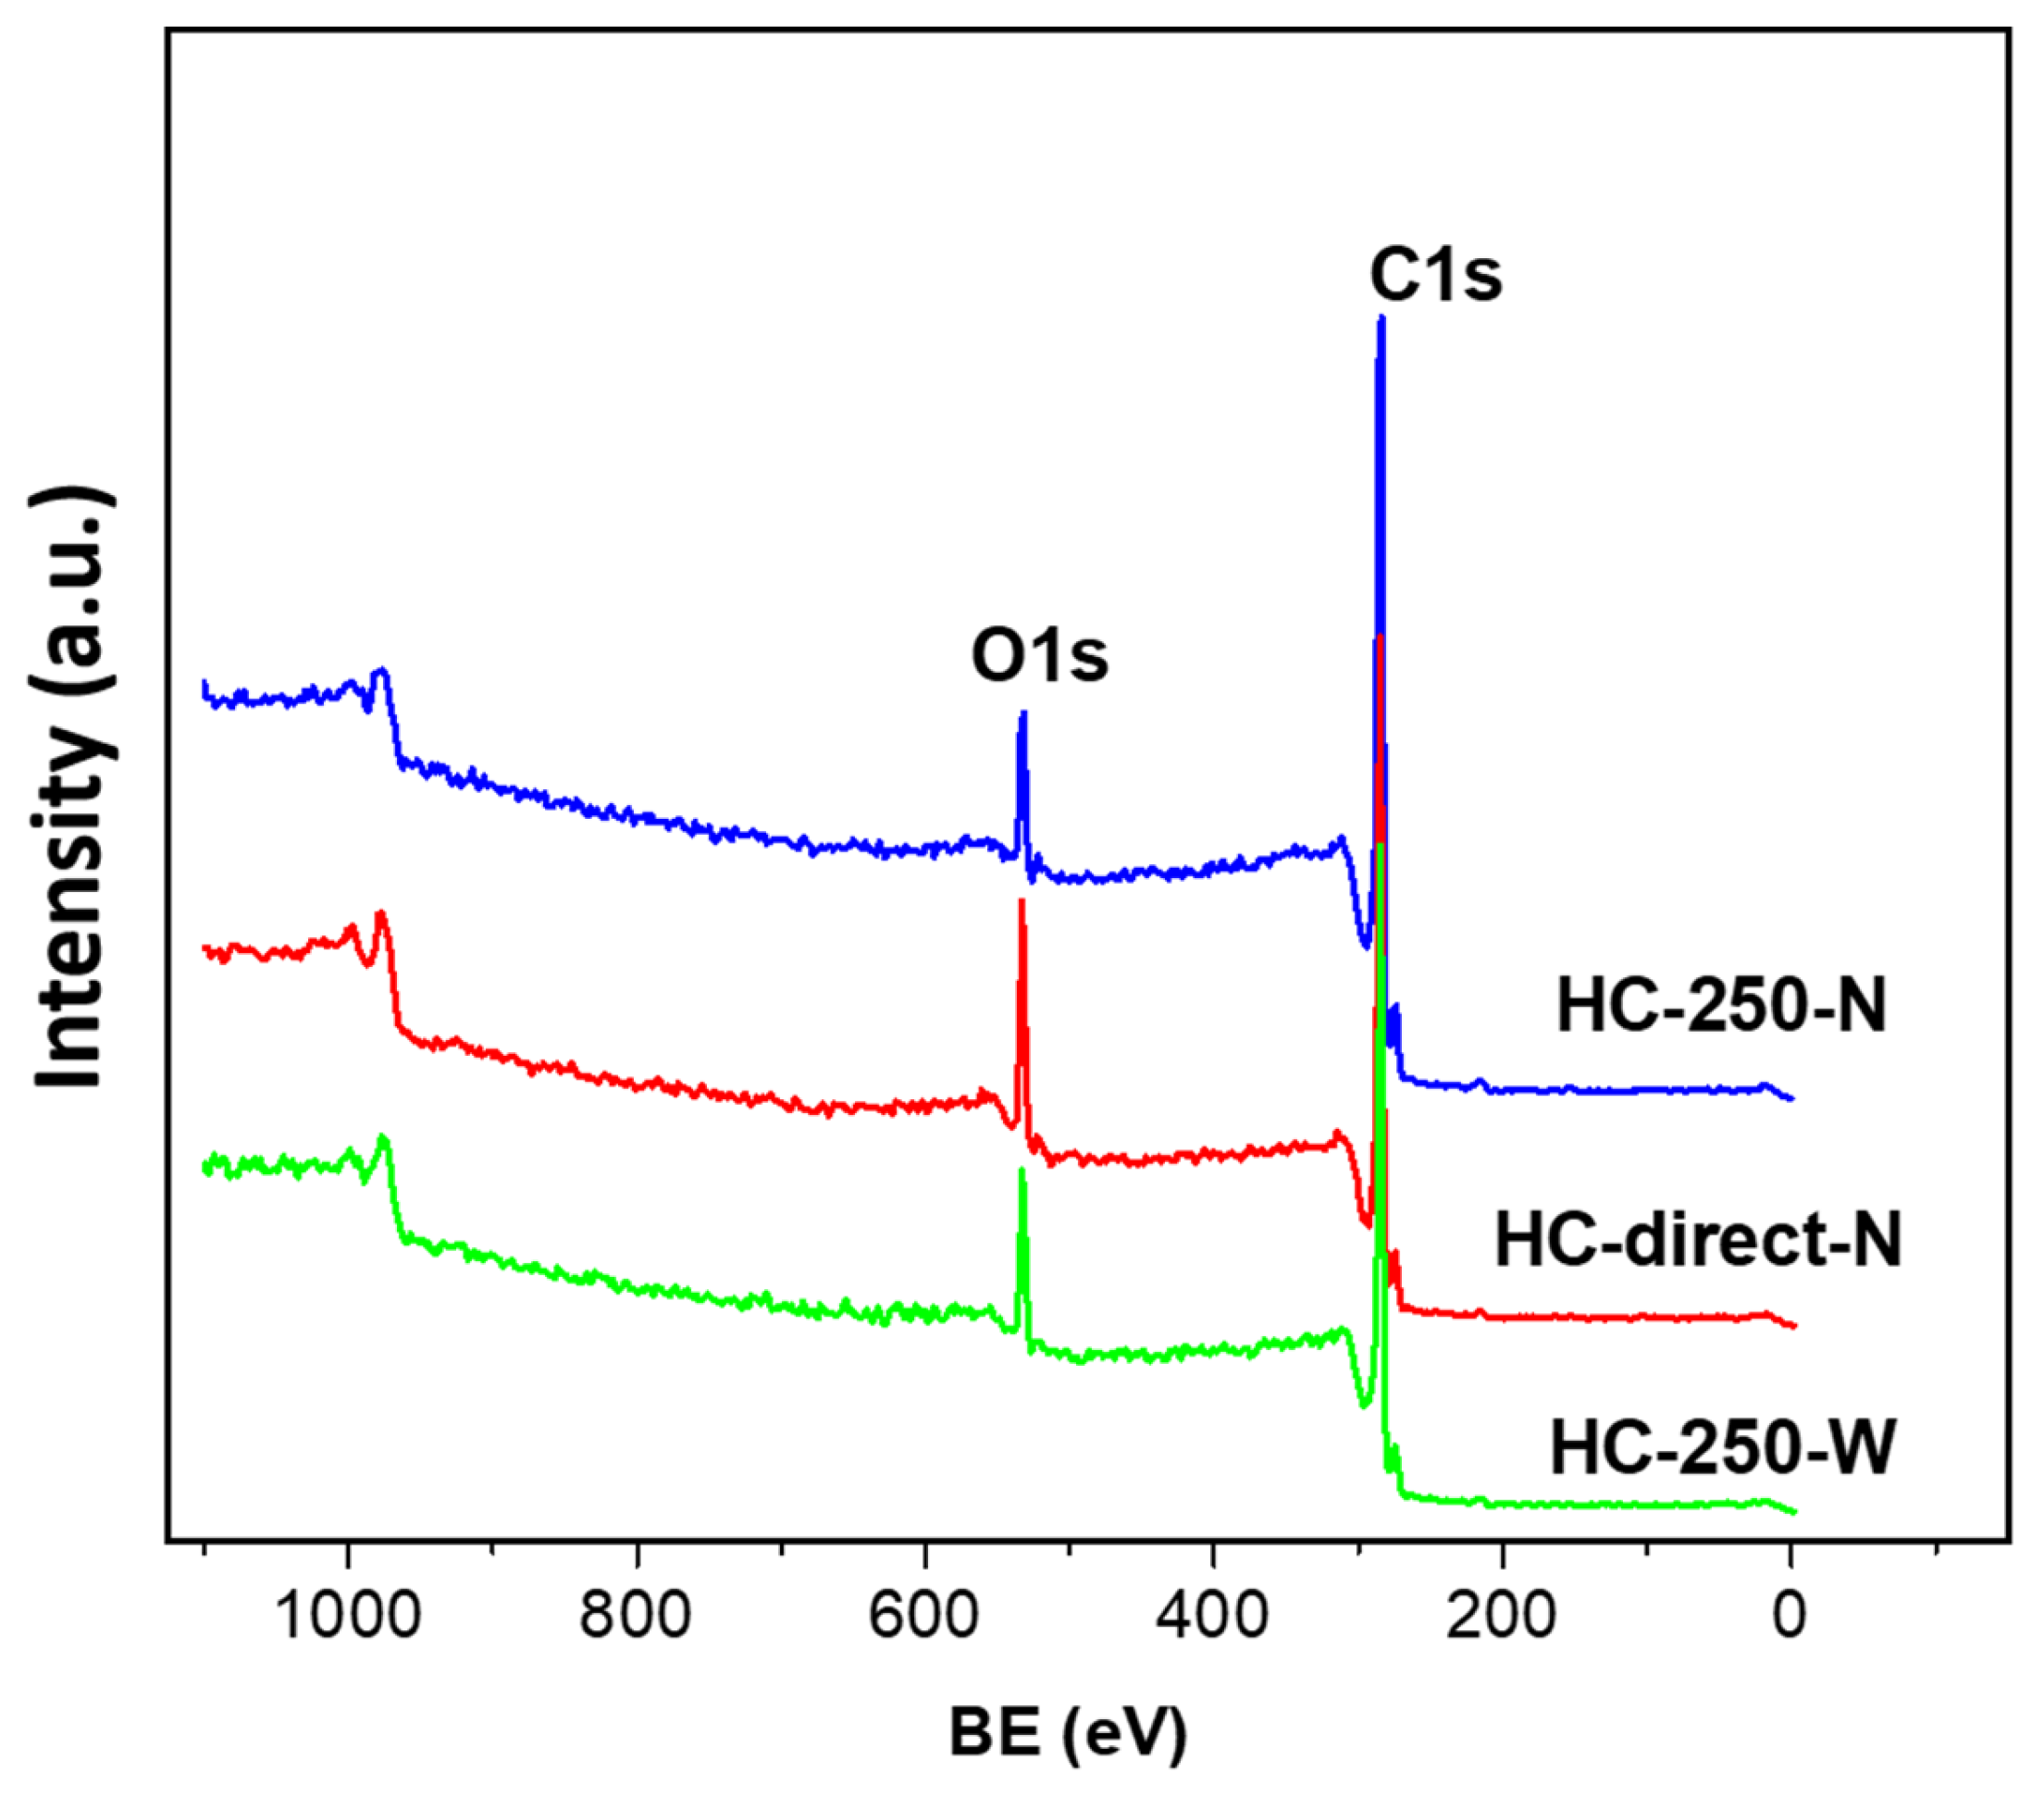
X-ray photoelectron spectroscopy (XPS) analysis was applied to further elucidate the surface composition, chemistry, and extrinsic structural defects of the HCs. As shown in Figure 5, all HCs are composed of C and O atoms. XPS quantitative analysis is in good agreement with CHN analysis (Table S2) and SEM-EDS elemental mapping analysis (Figure S3) with minor differences, which may be attributed to the regions selected for analysis. Again, the HC-direct-N sample contains significantly more oxygen (above 10 wt%) than the other two samples. The value for the water-vapor-treated sample is close to the one obtained by SEM-EDS and clearly higher than for the HC sample treated in a nitrogen atmosphere; the latter contained only 6% oxygen (measured by XPS), which is very close to the bulk value (measured by CHN). In conclusion, it can be stated that all three techniques provide consistent results for the carbon and oxygen content of the HCs.
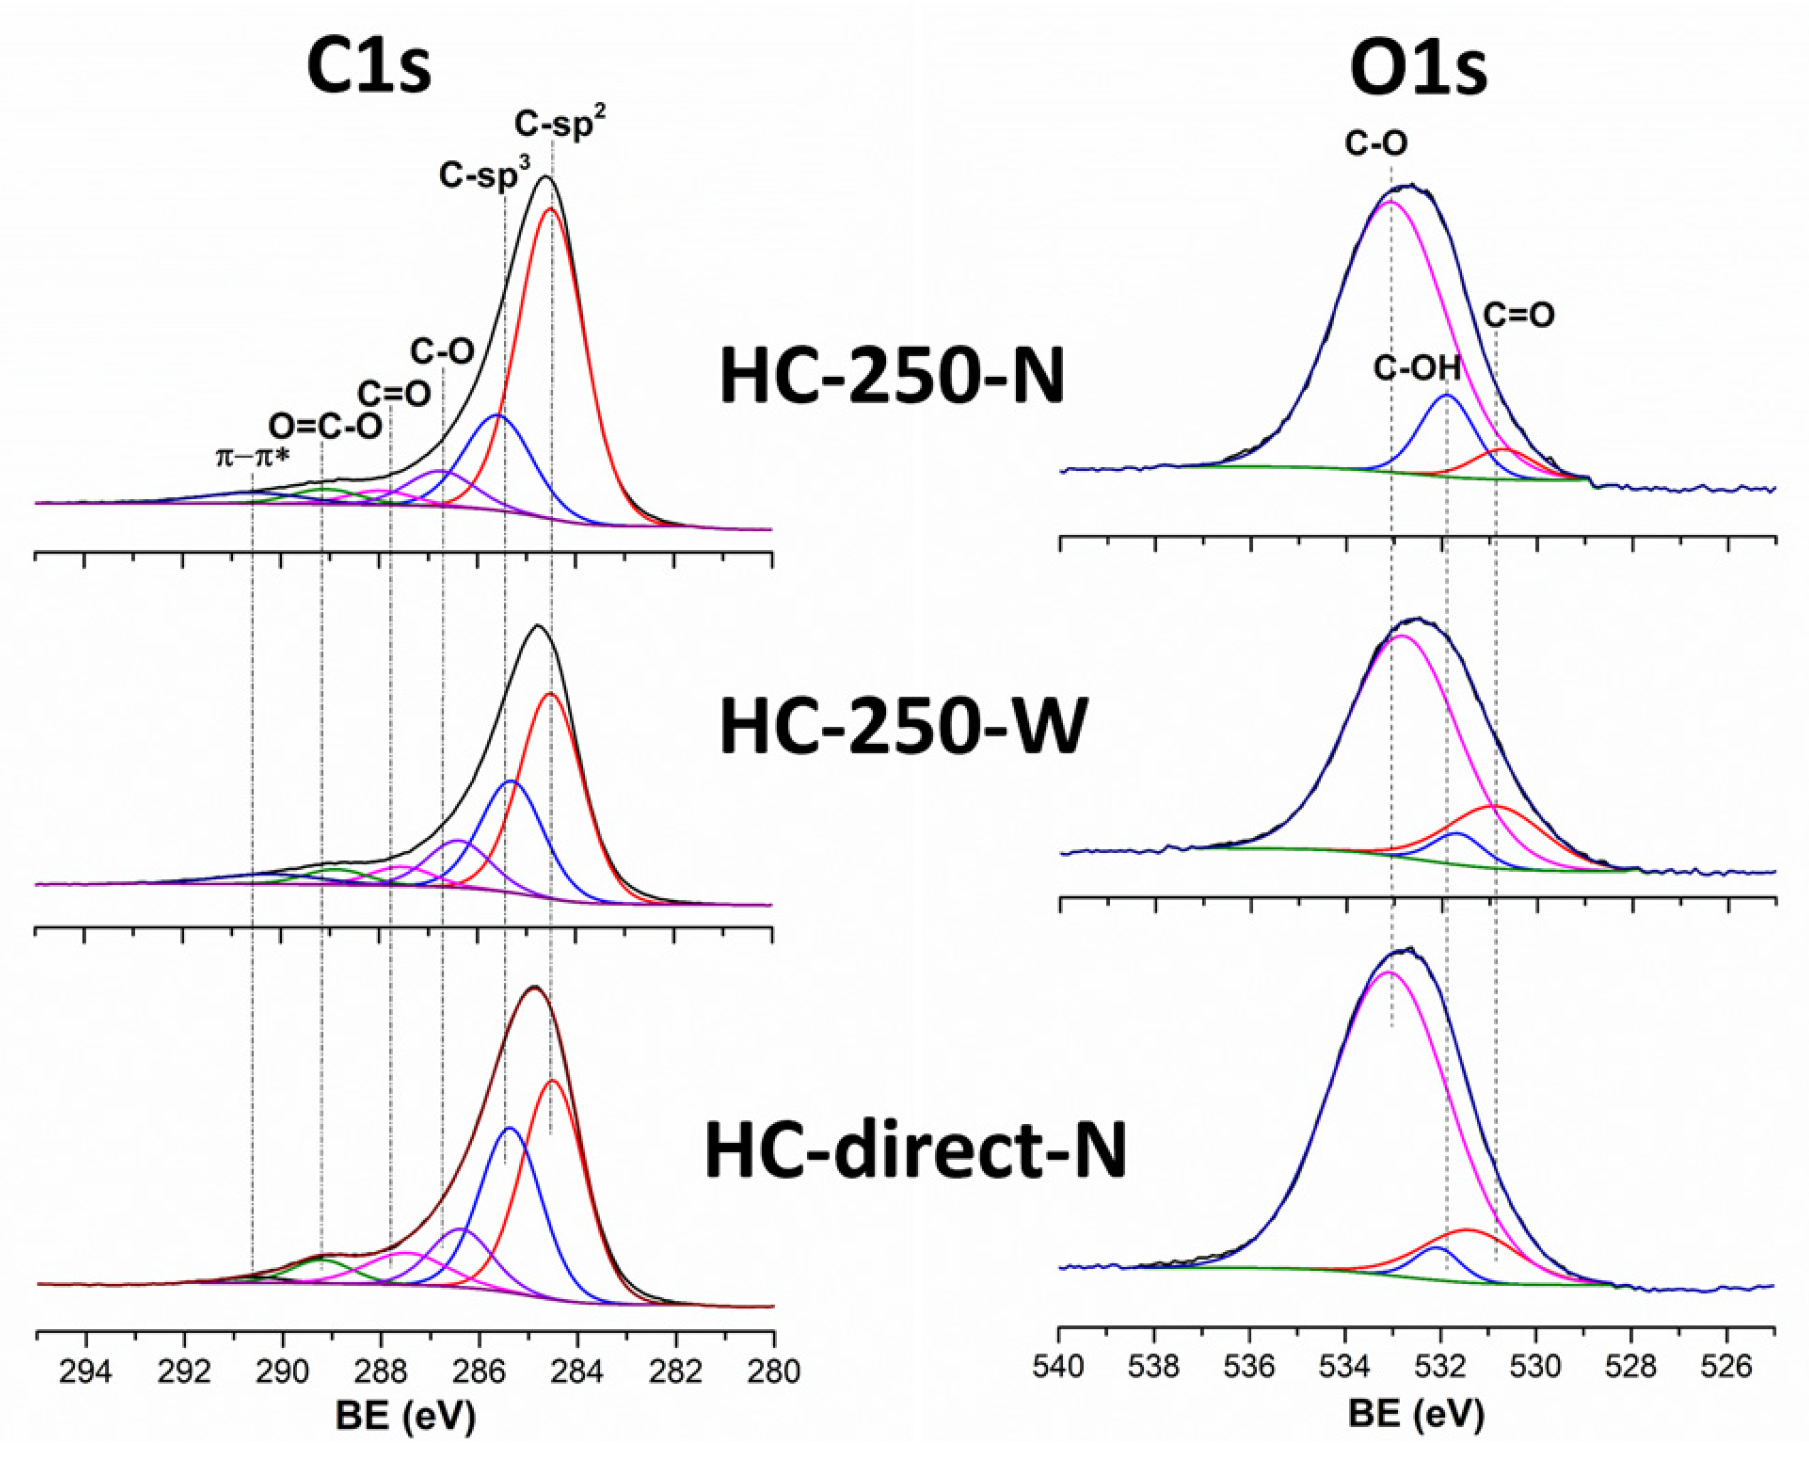
The XPS spectra of C1s were deconvoluted into six main peaks (Figure 6 and Table S4) assigned to aromatic C-sp2 (284.5 eV), aliphatic C-sp3 (285.3–285.5 eV), C–O/C–O–C (286.3–286.7 eV), C=O (287.4–287.9 eV), O=C–O (288.8–289.2 eV) and π–π* (290.0–290.6 eV) carbon species in accordance with previous studies [20,28]. The presence of C-sp2 species as well as the π–π* satellite bond, characteristic of graphitic-based carbons, confirms the existence of graphitic crystallite domains in all synthesized HCs [55]. The HC-250-N sample exhibits a higher fraction of C=C (C-sp2) species compared to the other two carbons (Table S4), suggesting a greater number of aromatic C6 rings in this sample. These findings are consistent with the XRD and Raman analysis results discussed above. It should be noted that sp3 carbon atoms are one type of defect sites in Raman spectroscopy of HC materials [48].
The lower ratio between the C-sp2 species and the C-sp3 species for the HC-direct-N sample is in line with the smaller graphite crystallite domains along the a-axis.
XPS spectra of the O1s region (Figure 6) were deconvoluted into three main components corresponding to C–O (533.1 eV), C=O (530.7–531.4 eV), and C–OH (531.7–532.1 eV) bonds [47,56]. C–O bonds, attributed to C6H5–O or C–O–C species, are the most abundant oxygen species in all three samples. Chemically, this makes sense since the elimination of such species during pyrolysis seems to be less favorable, in contrast to carboxyl groups or aliphatic alcohols, which are more readily eliminated.
In summary, the structural characterization identified the HC-250-N sample as the most ordered sample, i.e., as the one with the most extended turbostratic graphitic domains. Specifically, this statement is supported by the highest ratio of C-sp2 species to the C-sp3 species as determined by XPS (Table S4), the largest graphitic crystallite size as evidenced by XRD (Figure 1), the highest ID/IG ratio in Raman spectroscopy (Figure 4), corresponding to the most advanced transition from amorphous to nanocrystalline carbon, and by the highest carbon content as determined by various elemental analysis techniques (Table S2).
The water vapor treatment during pyrolysis significantly affected the textural properties, particularly the surface area and the pore volume, due to the formation of defect sites (holes, vacancies) that enlarged existing pores and interconnected them into a three-dimensional network. Consequently, the HC-250-W sample was identified as a more defective and less ordered material according to the results of Raman and XPS analysis. Specifically, a lower number of C-sp2 species (which are the structural units of aromatic graphitic structures) relative to C-sp3 species was determined by XPS (Table S4), and a lower transition toward nanocrystalline carbon was observed by Raman spectroscopy, i.e., the ID/IG ratio was smaller (Figure 4).
The most significant difference in the HC-direct-N was its higher oxygen content (Table S2). This higher oxygen content demonstrates the positive impact of the HTC pre-treatment on the carbonization process. The latter promotes oxygen elimination reactions and the formation of carbon–carbon bonds (e.g., by intermolecular aldol condensations). A second advantage of this step is the higher overall yield: additional carbon–carbon bonds reduce the volatilization losses during pyrolysis. Furthermore, the HC-direct-N sample possessed the lowest surface area with a particularly significant contribution from ultramicropores (diameter < 0.4 nm).
The effect of material properties on electrochemical performance is described in the next section. Although significant differences were identified through structural characterization, all materials are expected to exhibit promising electrochemical behavior due to the presence of graphitic crystallites consisting of curved domains with an average of four layers (XRD, Figure 1; TEM, Figure 2) and an interlayer distance (3.63–3.72 Å) greater than that of graphite (3.4 Å), which is favorable for sodium intercalation between the graphene layers.

3.2. Electrochemical Properties

The electrochemical performance of the synthesized HCs as anodes in sodium-ion batteries was evaluated by means of a pouch-type half-cell. Pouch cells were selected over the more commonly used coin-cell format to provide conditions closer to practical battery operation, including uniform stack pressure and the ability to capture engineering-relevant effects such as electrolyte distribution and electrode swelling [57,58,59]. Metallic sodium was used as both the counter and 1 M NaPF6 in ethylene carbonate:ethyl methyl carbonate (EC:EMC) was employed as the electrolyte.
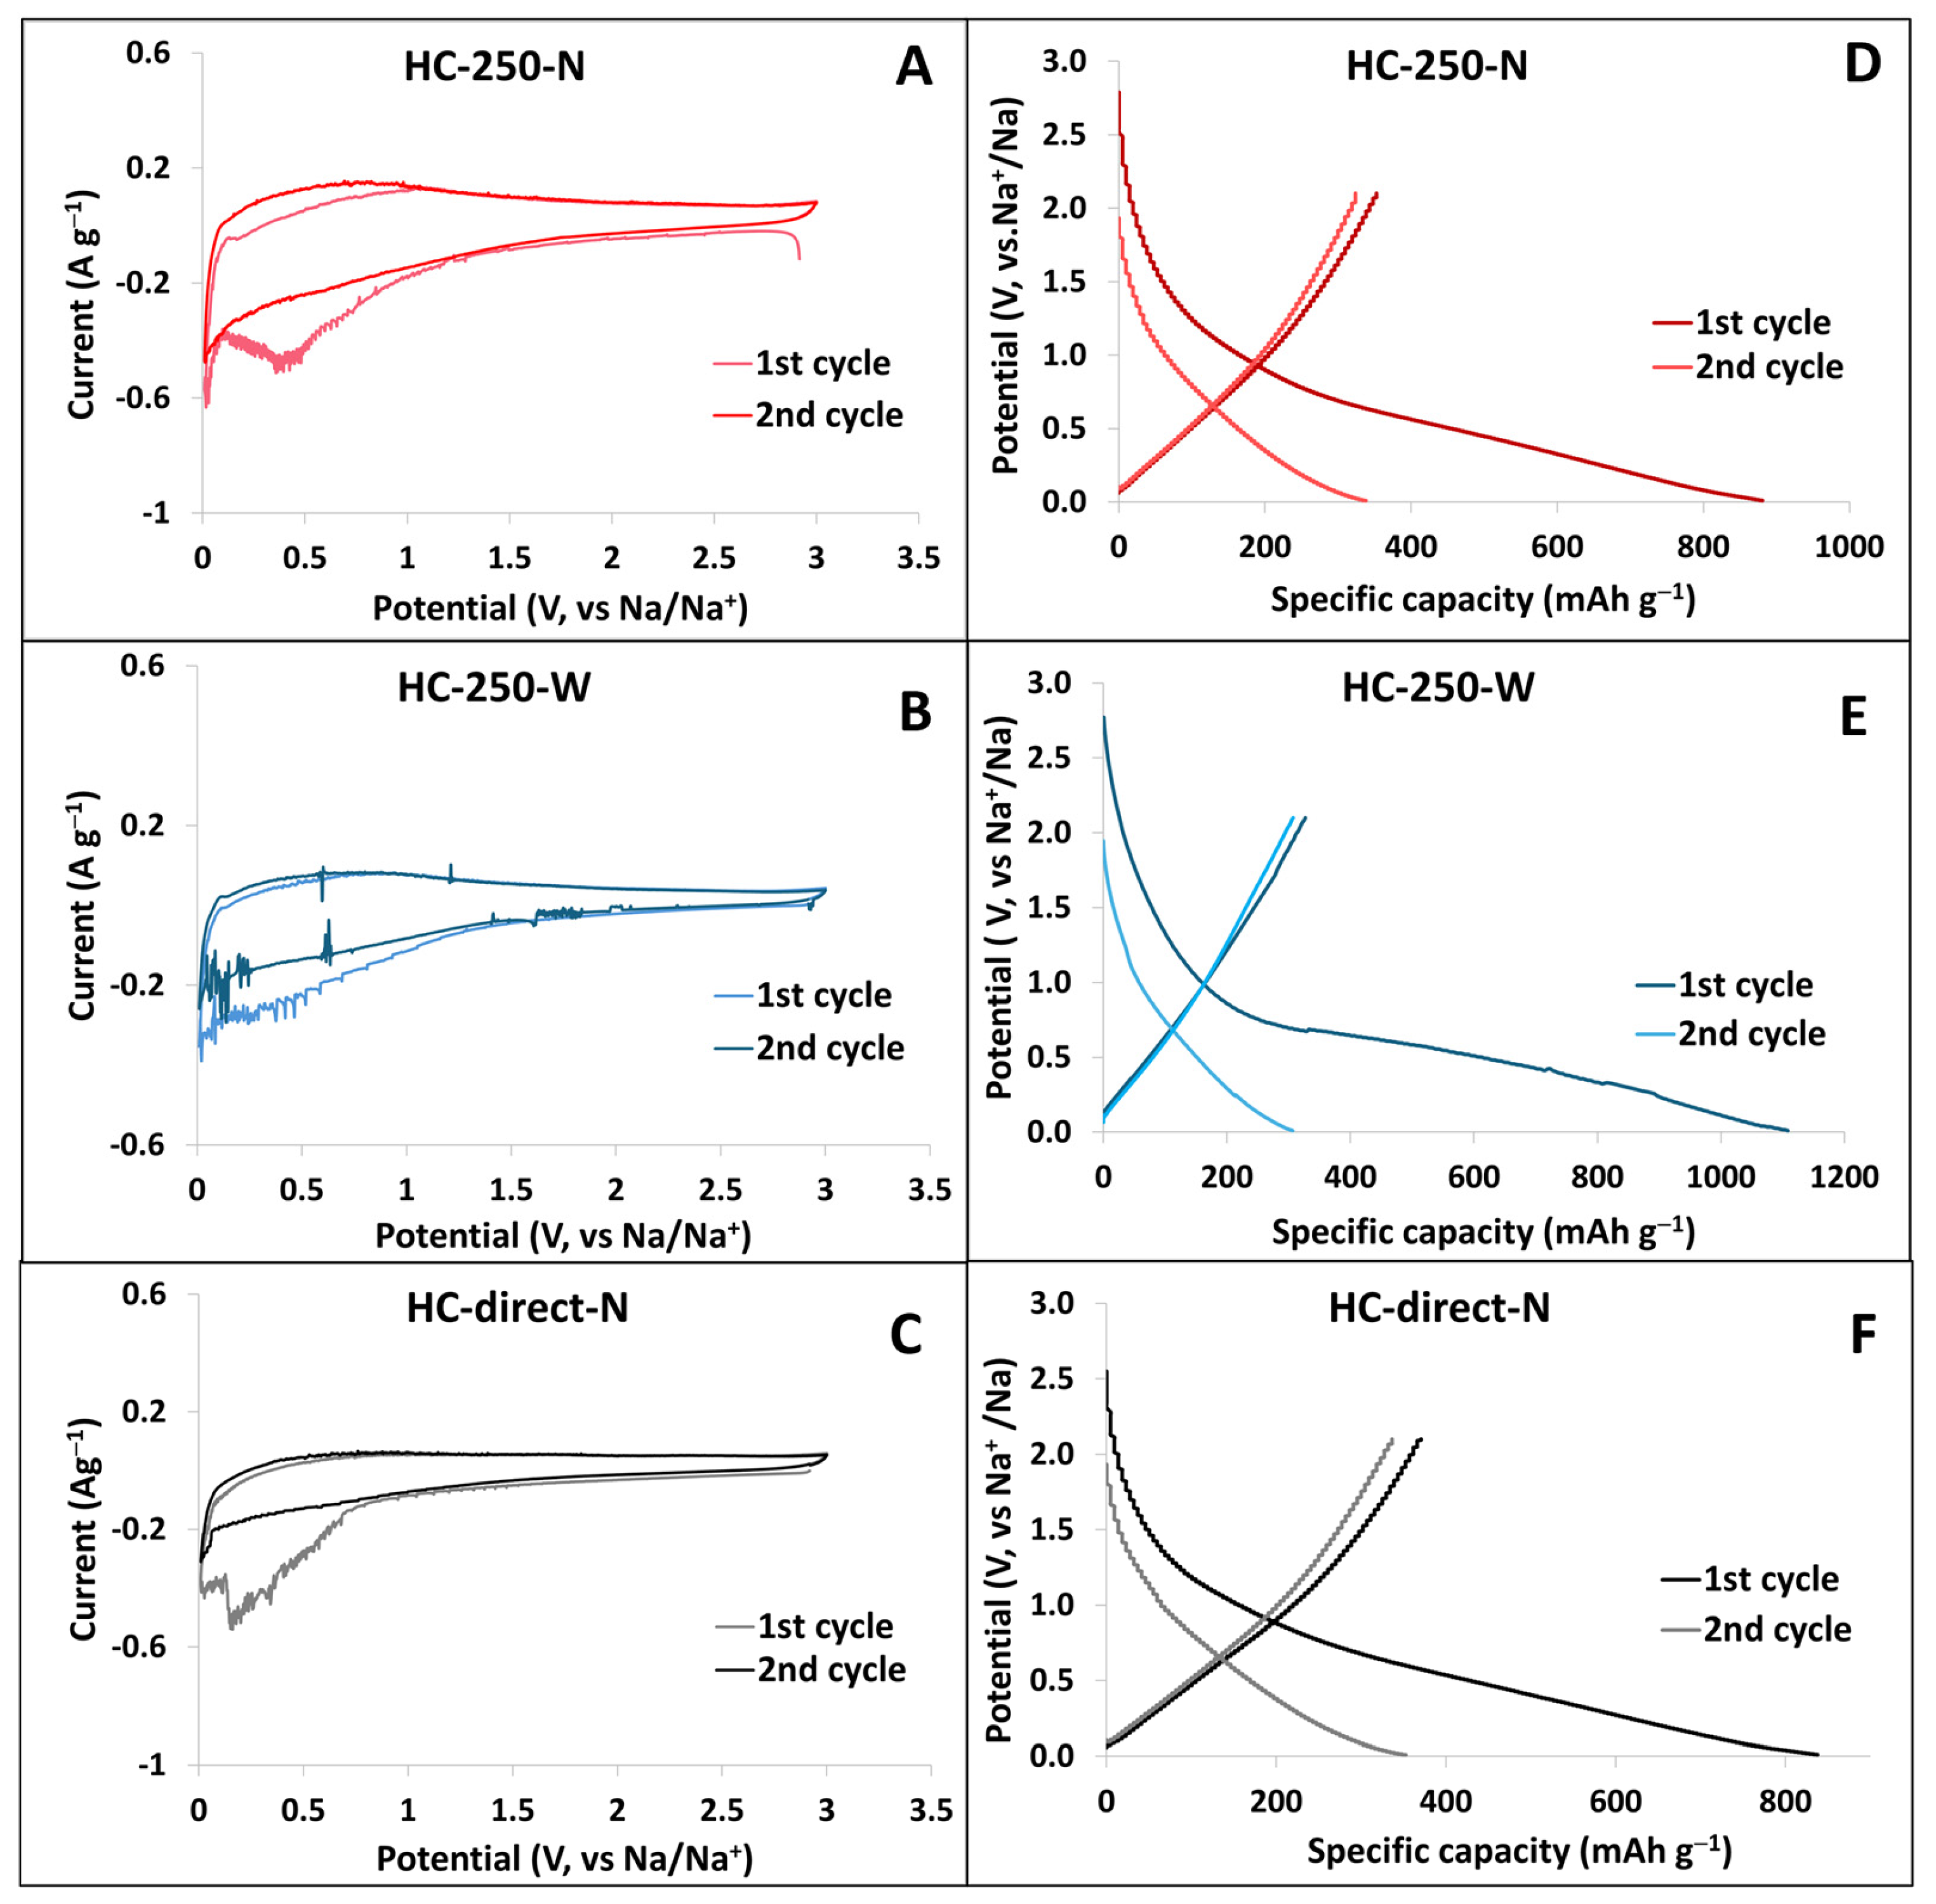
To study the sodium ion storage behavior in anode HC materials, cyclic voltammetry (CV) measurements were carried out within a 0.01–3 V voltage range at a scan rate of 0.1 mV s−1. As shown in the CV curves (Figure 7A–C) of the three samples, a sharp, irreversible peak appears between 0.30 and 0.35 V in the first cycle for all three materials. This peak can be associated with irreversible capacity loss caused by decomposition of the electrolyte and the formation of a solid electrolyte interphase (SEI) layer [21,60]. This reduction peak disappears in the subsequent cycle for all the studied materials, which can be attributed to the isolation of the anode from the electrolyte due to the formation of the SEI layer on the anode surface. According to previous studies [23], the appearance of such a pronounced sharp reduction peak in the first cycle is observed in HCs pyrolyzed at a relatively low temperature (below 1200 °C). A higher concentration of surface functional groups and a higher surface area, characteristic of HCs (HCs) pyrolyzed at low temperatures, promote more side reactions and lead to extensive SEI formation, resulting in a low Initial Coulombic Efficiency (ICE) [26], as observed for the studied HCs here. Additionally, a pair of redox peaks is observed at a lower potential (approximately 0.1 V versus Na+/Na), corresponding to the insertion/extraction of Na+ into and from HCs.
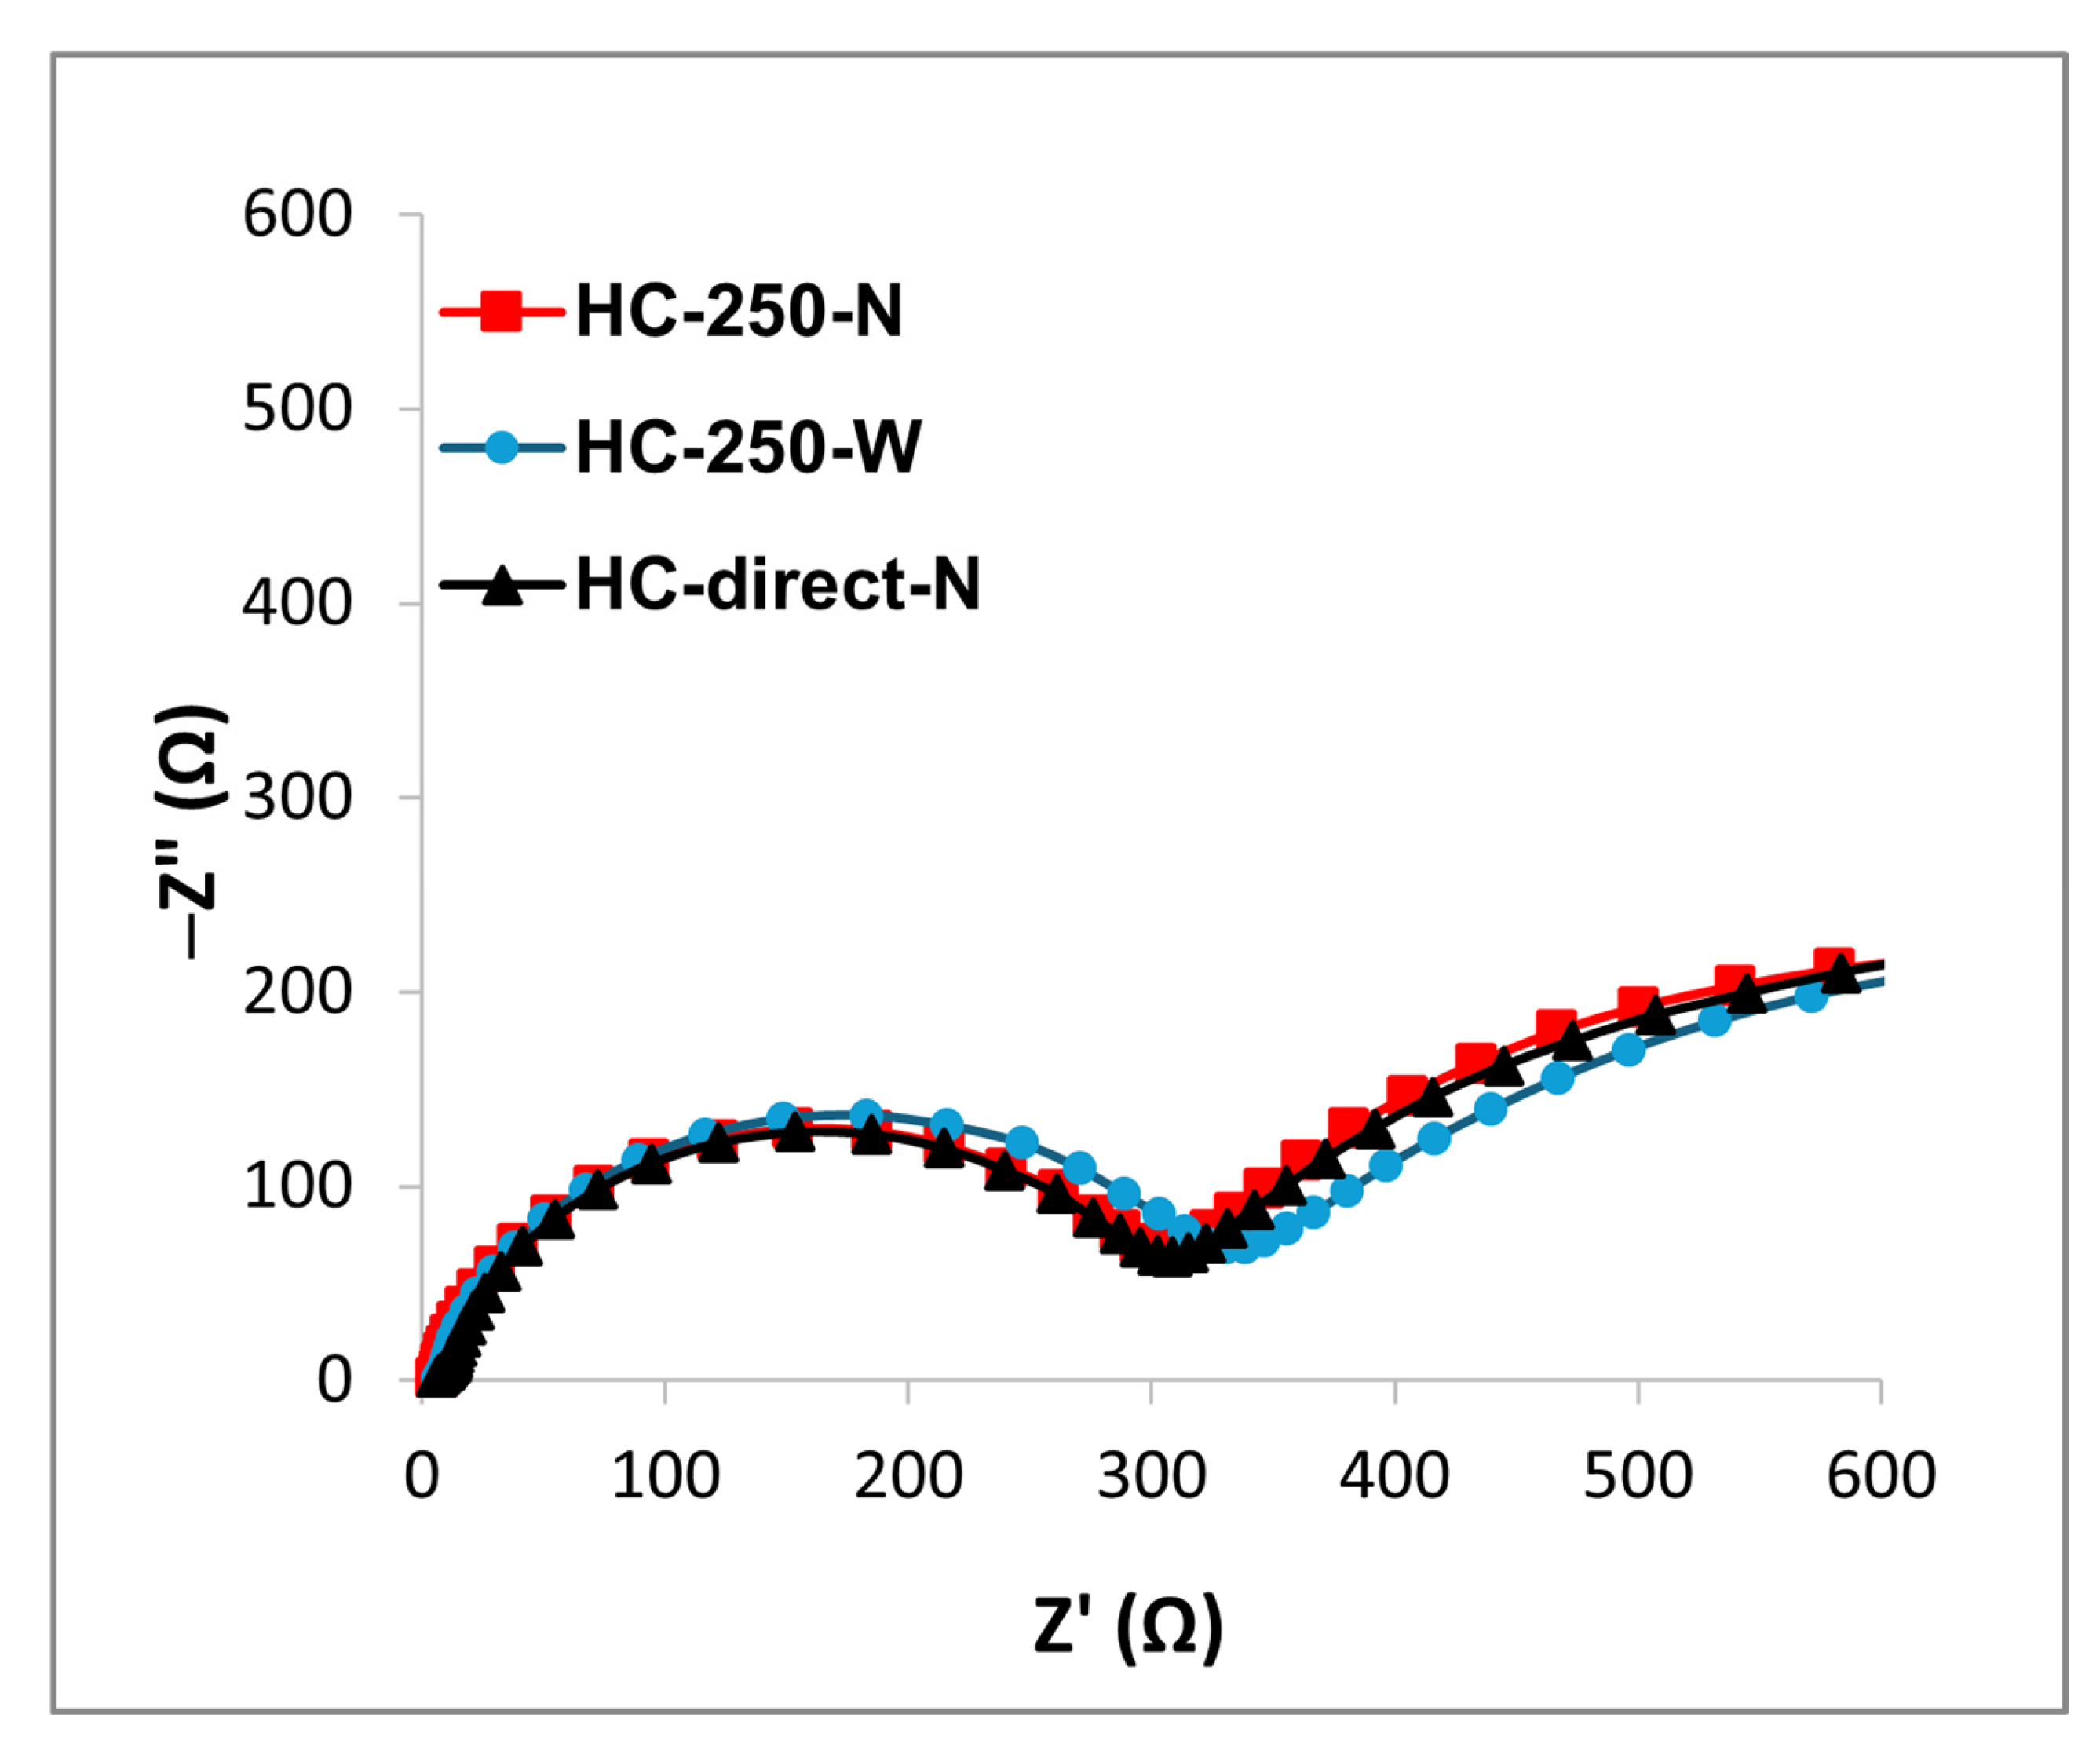
Electrochemical impedance spectroscopy (EIS) was performed to better understand the sodium storage process in the HC samples. The Nyquist plots presented in Figure 8 reveal similar electrochemical resistance behavior for the three HCs. The diameter of the semicircles in the medium frequency region is very similar for all three samples, thus indicating similar charge transfer resistance at the electrode–electrolyte interface [61]. However, a small deviation toward larger charge transfer resistance can be observed for the water-treated HC-250-W sample. This behavior may be related to its higher oxygen content, which has been reported to increase the internal resistance of carbon-based electrodes [62]. Furthermore, the slope of the Nyquist plots in the low-frequency region reflects the diffusion behavior of electrolyte ions within the anode material. As illustrated in Figure 8, all three samples exhibit very similar slopes in this region, suggesting comparable ion diffusion mechanisms and kinetics [26,60].
The initial galvanostatic charge/discharge (GCD) cycles were performed at a current density of 0.1 C within the voltage range of 0.01–3 V. GCD curves presented in Figure 7D–F show similar profiles for all synthesized HCs. The predominant contribution of the sloping region compared to the plateau region observed in GCD curves is characteristic of HCs pyrolyzed at temperatures below 1100 °C. According to the previous studies [63,64], the capacity associated with the sloping region is widely assigned to the adsorption of sodium ions at defective surface sites rather than intercalation within graphitic layers or closed-pore filling [65], which is attributed to the plateau capacity. However, some recent studies on sodium insertion behavior suggested an “intercalation/defect adsorption-closed pore filling” [63] mechanism associating the sloping capacity with both the intercalation and adsorption of Na+ ions, while the plateau capacity was attributed to the closed-pore filling. Thus, considering that the interlayer spacing d002 of all samples exceeds 3.6 Å (Figure 1), we hypothesize that sodium ion intercalation within turbostratic graphitic domains, in addition to surface adsorption, plays an important role in all three HC samples.
In the first GCD cycle, all three samples exhibit a high specific capacity within the 838–1116 mAh g−1 range (Table 2), with HC-250-W exhibiting the highest initial capacity. All three samples exhibit outstanding reversible capacity, ranging from 320 to 343 mAh g−1 (Table 2), which aligns with the highest reported values for this type of HC. However, as expected from the CV results, these HCs present low ICE (29–43%). The HC-250-N and HC-direct-N samples possess similar ICE values of 40 and 43%, respectively, while the HC-250-W sample exhibits an ICE of only 29%. We hypothesize that the initial capacity is strongly influenced by the surface area, as HC-250-W exhibits both the highest initial capacity (Table 2) and the highest surface area and pore volume (Table 1). In contrast, the reversible capacity (Table 2) seems to be consistent with the average graphitic crystallite sizes estimated by XRD (Figure 1), which are comparable in size. The similar reversible capacities, combined with their correlation with turbostratic graphitic domain sizes, further support the intercalation mechanism contributing to the sloping region capacity discussed above.
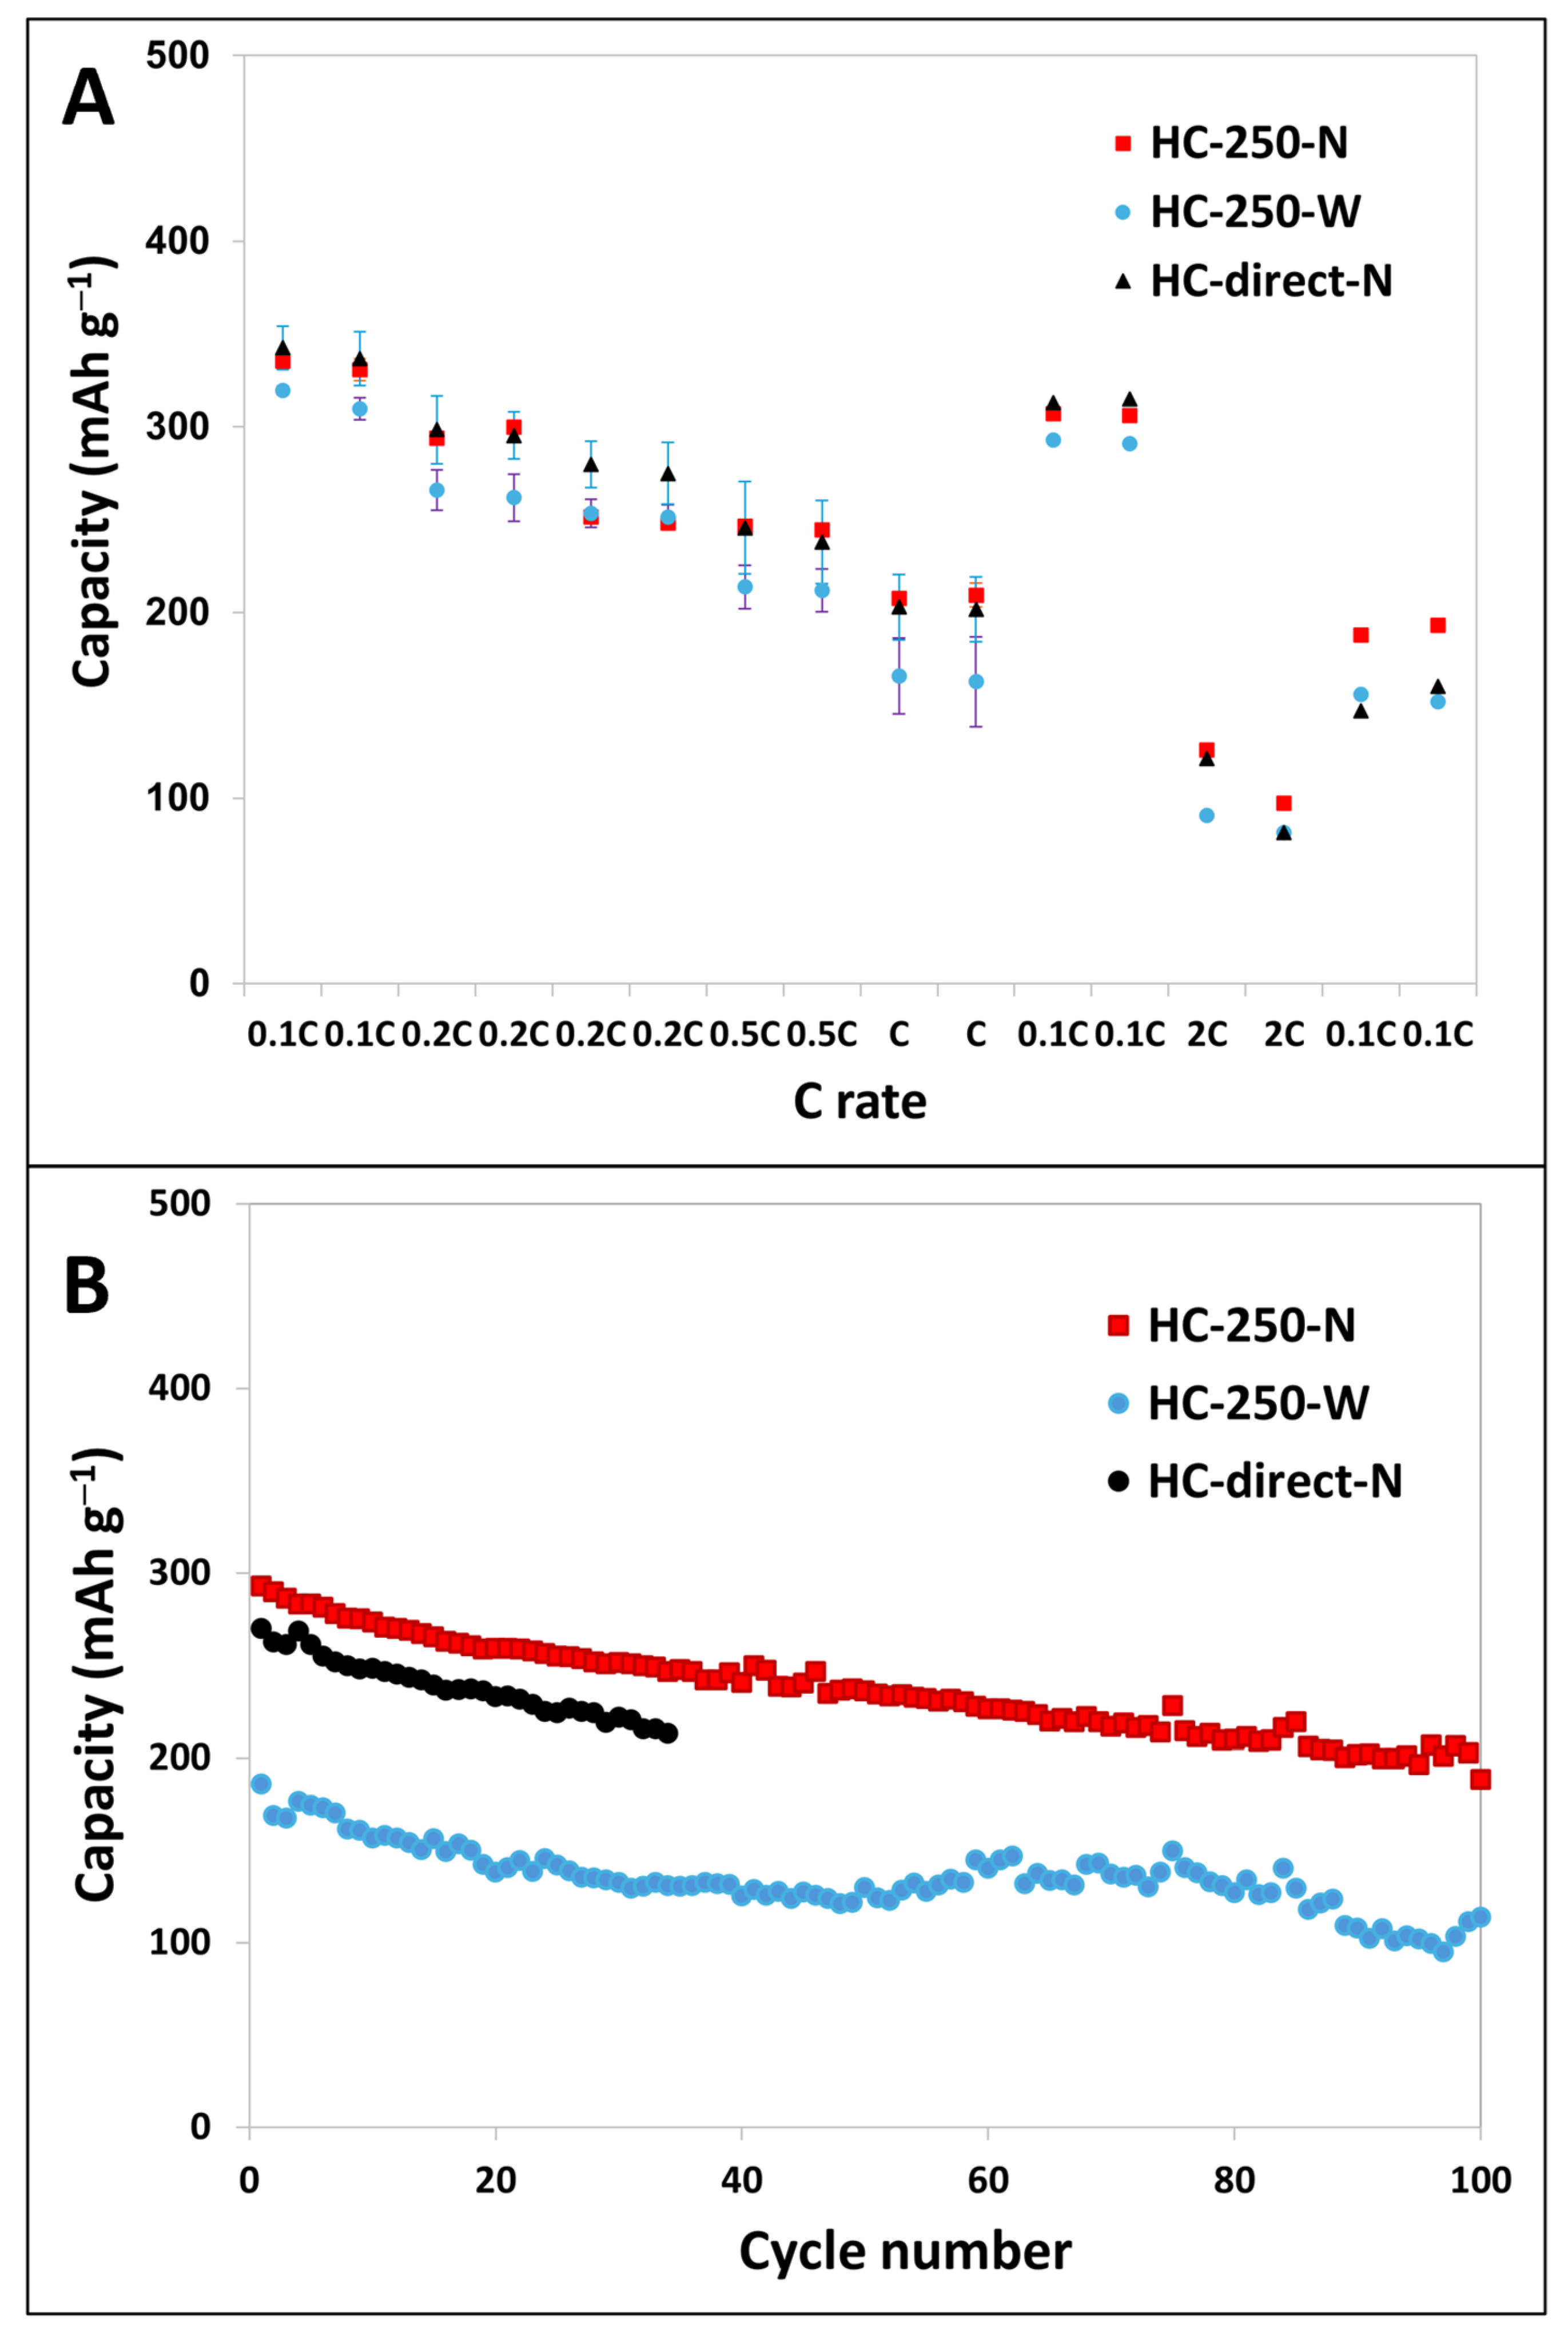
Additionally, the electrochemical behavior of HCs as anodes in sodium half-cells was studied by applying different current rates from 0.1 C to 2 C. As can be observed in Figure 9A, as the current rate increased, the capacity of all three HCs gradually decreased. Specifically, the HC-250-N and HC-direct-N samples maintained about 60% of their reversible capacity, showing better rate performance than the HC-250-W sample, which exhibited a 50% capacity reduction at a more demanding 1 C rate. When the current rate was restored from 1 C to 0.1 C, all three samples recovered approximately 91% of their reversible capacity, demonstrating good reversibility under more demanding conditions. However, at a 2 C rate, a significant loss of capacity was observed for all three materials, presenting only 28–37% of reversible capacity, and with HC-250-N showing the best performance in terms of rate resistance at 2 C (37% of reversible capacity) and capacity recovery (56% of initial capacity at 0.1 C). In contrast, the HC-250-W sample demonstrated the worst resistance behavior with only 28% of reversible capacity at a 2 C rate, whereas HC-direct-N was the one with the lowest capacity recovery (42% of its initial capacity) after restoring the current rate from 2 C to 0.1 C. As is well known, the current rate behavior is associated with the adsorption/desorption and diffusion kinetics of sodium ions within anode materials, which are closely related to their porosity and the structure of turbostratic graphitic domains. Thus, high surface area and pore volume of HC-250-W seem to play a detrimental role in its capacity at a very demanding 2 C rate, likely because fast surface adsorption of sodium ions dominates rather than the slower diffusion process within graphitic layers. The lowest capacity recovery of the HC-direct-N sample can be associated with its ultramicroporous nature and the low desorption capability of sodium ions.
Finally, the cyclic stability of HCs was measured at a 0.5 C rate for 100 cycles. As shown in Figure 9B, all three samples exhibit distinct capacity retention behavior. Particularly, the HC-250-N sample with 292 mAh g−1 of initial capacity (at 0.5 C) exhibits good cyclic stability with a remaining capacity of 188 mAh g−1 after the 100th cycle and a capacity retention of 64% (Table 2). The capacity of HC-250-W starts from a significantly lower capacity, namely from 186 mAh g−1, and decreases to 113 mAh g−1 after 100 cycles, revealing almost the same cyclic stability as HC-250-N, namely 61% (Table 2). A greater scatter in the capacity values is observed during cycling of HC-250-W, likely attributed to its more irregular microporous structure. The results for HC-direct-N were less conclusive, as the sample did not withstand more than approximately 30 cycles. In any case, the capacity of the HC-direct-N sample exhibited a general decreasing trend, like the HC-250-N sample, at a slightly lower capacity (Figure 9).
Waste cotton has previously been utilized as a raw material, as reported in the literature [21,22]. In those studies, the HC was prepared via direct pyrolysis at 1000 °C and capacities of 240 mAh g−1 and 272 mAh g−1 were achieved at a current rate of 50 mA g−1 (Table 3, entries 2 and 3). The present work demonstrates that combining hydrothermal carbonization with pyrolysis leads to an improvement in capacity. A higher capacity of 315 mAh g−1 has been reported when natural cotton was subjected to direct pyrolysis at 1300 °C for HC production (Table 3, entry 4) [23]. However, the applied current rate was not specified in that study. Alternatively, oxidative treatment of cottonseed cake at 300 °C, prior to pyrolysis at 1400 °C, yielded a capacity of 302 mAh g−1 at a current rate of 100 mA g−1 (Table 3, entry 5) [66]. Taken together, these comparative data indicate that the described two-step approach—hydrothermal carbonization followed by pyrolysis—not only enhances the overall mass yield of the HC but also improves the reversible capacity of the materials by 10 to 25%.
Natural cotton and waste cotton have a high cellulose content of approximately 90%. When employing the purified and cellulose-enriched materials, similar capacities have been achieved. Fiber cellulose or microcrystalline cellulose pyrolyzed at 1300 °C provided a capacity of 300 mAh g−1 (Table 3, entry 6) [67]. Using a sequential two-step pyrolysis at 600 °C and 1500 °C, and starting from a mixture of cellulose with corn starch, the capacity was increased to 328 mAh g−1 at 30 mA g−1, which is still in the same range as the values obtained in the present study (335 mAh g−1 at 67 mA g−1, Table 2, entry 1), or 300 mAh g−1 with the temperature combination of 450 °C and 1300 to 1600 °C (Table 3, entries 7 and 8) [6,68]. A decrease in current rate from 30 mA g−1 to 20 mA g−1 benefits the capacity and an increase to 377 mAh g−1 was observed (Table 3, entry 9) [69]. However, it seems that a higher pyrolysis temperature, i.e., 1500 °C versus 900 °C, slightly improves the capacity from 335 mAh g−1 at 67 mA g−1 (Table 2, entry 1) to 343 mAh g−1 at 30 mA g−1 (Table 3, entry 10) [70]. Further pre-treatments such as pre-oxidation, ethylene-glycol-modified carbonization, or cross-linking of the cellulose precursor likewise yield capacity values in the same range of 324 mAh g−1 to 335 mAh g−1 (Table 3, entry 11) [71,72,73].
In summary, the reported capacity ranks among the highest values found in the literature. However, the Initial Coulombic Efficiency (ICE) remains low and requires further optimization. Although often neglected in the literature, 75% to 92% seem to be achievable [22,23,66,67,68,69,70,71,73]. In this regard, a higher pyrolysis temperature may be beneficial, and indeed, preliminary results indicate that when increasing the temperature from 900 °C to 1200 °C, ICE was doubled from 40% to 80%, which is already within the literature range. However, the optimization of the pyrolysis temperature and the comprehensive characterization of the resulting HCs was beyond the scope of the present study.

4. Conclusions

In this work, we demonstrated that HCs derived from cotton-based textile waste can be successfully synthesized through different thermal treatments, offering a sustainable route to valorize industrial and post-consumer waste into functional materials for sodium-ion batteries. The use of hydrothermal carbonization (HTC) as a pre-treatment step, followed by pyrolysis, was found to significantly influence the structural, morphological, and surface properties of the resulting HCs, while improving the overall yield by 75%. Among the three synthesis approaches explored, the sample prepared via HTC followed by pyrolysis under nitrogen (HC-250-N) exhibited the best balance of microstructural features, including moderate microporosity, higher content of turbostratic graphitic domains with curved layers and enhanced structural ordering, and lowest bulk and sub-surface oxygen content. These characteristics resulted in excellent electrochemical performance, with a reversible capacity of 335 mAh g−1 and good capacity retention after 100 cycles (64%). In contrast, the HC-250-W sample, despite showing the highest initial capacity due to its large surface area and extensive microporosity, suffered from the lowest Initial Coulombic Efficiency. The HC-direct-N sample, obtained via one-step pyrolysis, displayed intermediate structural properties and slightly inferior electrochemical performance compared to HC-250-N. For all three samples, the ICE needs to be improved for potential industrial implementation, which can be achieved, for instance, by pyrolysis at a higher temperature. These findings highlight the crucial role of HTC pre-treatment and pyrolysis conditions in tailoring the microstructure and performance of HCs.

Supplementary Materials

The following supporting information can be downloaded at: https://www.mdpi.com/article/10.3390/pr14111735/s1, Figure S1. Deconvolution of peak at 2θ = 43.9° for the HC-direct-N sample; for the quantification of the crystallite domain size La the peak 1 (100) was used. Figure S2. A-Image of electrodes obtained with HC-250-N (left), HC-direct-N (middle) and HC-250-W (right) materials; B- Image of prepared pouch-type anodic half-cell. Figure S3. Histograms of particle size distribution of HCs from the HR-FESEM measurement. Figure S4. SEM-EDS layered images (A1–A3), elemental maps of Carbon (B1–B3) and Oxygen (C1–C3); map spectrum (D1–D3) of HC samples. Table S1. Average weight loading of HC and thickness of electrodes. Table S2. Comparative results of CHN, SEM_EDS and XPS analysis. Table S3. Wavenumbers for the G and D bands and the ratio of their intensities for the three HC samples. Table S4. Results of XPS analysis of C1s and O1s elements of HC-250-N, HC-250-W and HC-direct-N samples.

Author Contributions

Conceptualization, U.D. and M.R.; methodology, U.D. and M.R.; investigation, A.R.; writing—original draft preparation, A.R., U.D. and M.R.; writing—review and editing, A.E.P., U.D. and M.R.; supervision, U.D. and M.R.; project administration, M.R.; funding acquisition, A.E.P., U.D. and M.R. All authors have read and agreed to the published version of the manuscript.

Funding

This work was funded by MCIN/AEI/10.13039/501100011033 and, as appropriate, by “ERDF A way of making Europe”, by the “European Union” or by the “European Union NextGenerationEU/PRTR”, with the grant reference TED2021-131715B-I00 and the acronym Fabrics2SIB. Financial support by the Spanish Ministry of Science and Innovation (CEX2021-001230-S grant funded by MCIN/AEI/10.13039/501100011033) is gratefully acknowledged.

Data Availability Statement

Data is contained within the article or Supplementary Materials.

Acknowledgments

The authors are grateful to the Instituto Tecnológico de la Energía (ITE), Valencia, for the electrochemical measurements and for the fruitful discussion.

Conflicts of Interest

There are no conflicts of interest to declare.

References

  1. Materials Market Report 2023—Textile Exchange. Available online: https://textileexchange.org/knowledge-center/reports/materials-market-report-2023/ (accessed on 3 September 2025).
  2. Circular Economy Action Plan—European Commission. Available online: https://environment.ec.europa.eu/strategy/circular-economy-action-plan_en (accessed on 3 September 2025).
  3. Anceschi, A.; Trotta, F.; Zoccola, M.; Caldera, F.; Magnacca, G.; Patrucco, A. From Waste to Worth: Innovative Pyrolysis of Textile Waste into Microporous Carbons for Enhanced Environmental Sustainability. Polymers 2025, 17, 341. [Google Scholar] [CrossRef]
  4. Kowalik-Klimczak, A.; Życki, M.; Łożyńska, M.; Barszcz, W. Study on Possible Transformation of Leather and Textile Wastes in Carbonised Materials by Pyrolysis Under Different Gas Conditions. Sustainability 2025, 17, 1637. [Google Scholar] [CrossRef]
  5. Yang, H.; Choi, G.R.; Choi, D.; Lee, J.; Lee, C.G. Textile Waste-Derived Functional Carbon Materials for Selective Pharmaceutical Pollutant Removal. Alex. Eng. J. 2025, 116, 321–330. [Google Scholar] [CrossRef]
  6. Wang, Y.; Luo, H.; Zhong, X.; Zhou, Y.; Jin, A.; Yu, L.; Li, M.; Xiong, J.; Peng, J. Conversion of Waste Denim Fabrics into High-Performance Carbon Fiber Anodes for Sodium-Ion Batteries. J. Mater. Sci. 2024, 59, 20351–20363. [Google Scholar] [CrossRef]
  7. Zhang, X.; Wan, Y.; Yang, K.; Song, K.; Mi, L.; Zheng, G.; Feng, X.; Chen, W. Cotton Cloth-Induced Flexible Hierarchical Carbon Film for Sodium-Ion Batteries. ChemElectroChem 2020, 7, 2136–2144. [Google Scholar] [CrossRef]
  8. McLennan, S.M. Relationships between the Trace Element Composition of Sedimentary Rocks and Upper Continental Crust. Geochem. Geophys. Geosystems 2001, 2, 2000GC000109. [Google Scholar] [CrossRef]
  9. Hwang, J.Y.; Myung, S.T.; Sun, Y.K. Sodium-Ion Batteries: Present and Future. Chem. Soc. Rev. 2017, 46, 3529–3614. [Google Scholar] [CrossRef]
  10. Abraham, K.M. How Comparable Are Sodium-Ion Batteries to Lithium-Ion Counterparts? ACS Energy Lett. 2020, 5, 3544–3547. [Google Scholar] [CrossRef]
  11. Nekahi, A.; Dorri, M.; Rezaei, M.; Bouguern, M.D.; Madikere Raghunatha Reddy, A.K.; Li, X.; Deng, S.; Zaghib, K. Comparative Issues of Metal-Ion Batteries toward Sustainable Energy Storage: Lithium vs. Sodium. Batteries 2024, 10, 279. [Google Scholar] [CrossRef]
  12. Titirici, M.-M.; Johansson, P.; Crespo Ribadeneyra, M.; Au, H.; Innocenti, A.; Passerini, S.; Petavratzi, E.; Lusty, P.; Tidblad, A.A.; Naylor, A.J.; et al. 2024 Roadmap for Sustainable Batteries. J. Phys. Energy 2024, 6, 041502. [Google Scholar] [CrossRef]
  13. Thompson, M.; Xia, Q.; Hu, Z.; Zhao, X.S. A Review on Biomass-Derived Hard Carbon Materials for Sodium-Ion Batteries. Mater. Adv. 2021, 2, 5881–5905. [Google Scholar] [CrossRef]
  14. Shao, W.; Shi, H.; Jian, X.; Wu, Z.-S.; Hu, F. Hard-Carbon Anodes for Sodium-Ion Batteries: Recent Status and Challenging Perspectives. Adv. Energy Sustain. Res. 2022, 3, 2200009. [Google Scholar] [CrossRef]
  15. Wang, Y.; Li, M.; Zhang, Y.; Zhang, N. Hard Carbon for Sodium Storage: Mechanism and Performance Optimization. Nano Res. 2024, 17, 6038–6057. [Google Scholar] [CrossRef]
  16. Beda, A.; Taberna, P.L.; Simon, P.; Matei Ghimbeu, C. Hard Carbons Derived from Green Phenolic Resins for Na-Ion Batteries. Carbon N. Y. 2018, 139, 248–257. [Google Scholar] [CrossRef]
  17. Zhu, Y.E.; Gu, H.; Chen, Y.N.; Yang, D.; Wei, J.; Zhou, Z. Hard Carbon Derived from Corn Straw Piths as Anode Materials for Sodium Ion Batteries. Ionics 2018, 24, 1075–1081. [Google Scholar] [CrossRef]
  18. Tang, Z.; Zhang, R.; Wang, H.; Zhou, S.; Pan, Z.; Huang, Y.; Sun, D.; Tang, Y.; Ji, X.; Amine, K.; et al. Revealing the Closed Pore Formation of Waste Wood-Derived Hard Carbon for Advanced Sodium-Ion Battery. Nat. Commun. 2023, 14, 6024. [Google Scholar] [CrossRef]
  19. Jin, Y.; Shi, Z.; Han, T.; Yang, H.; Asfaw, H.D.; Gond, R.; Younesi, R.; Jönsson, P.G.; Yang, W. From Waste Biomass to Hard Carbon Anodes: Predicting the Relationship between Biomass Processing Parameters and Performance of Hard Carbons in Sodium-Ion Batteries. Processes 2023, 11, 764. [Google Scholar] [CrossRef]
  20. Luo, F.; Yi, C.; Yang, D.; Fan, D.; Liu, W.; Qiu, X.; Zhang, W. Facile Fabrication of Cellulose-Derived Hard Carbon for High-Rate Performance Sodium-Ion Batteries by Regulating Degrees of Polymerization. Green Chem. 2025, 27, 1703–1713. [Google Scholar] [CrossRef]
  21. Sarma, H.R.; Sun, J.; Gunathilaka, I.E.; Hora, Y.; Rajkhowa, R.; Forsyth, M.; Byrne, N. Effect of Precursor Morphology of Cellulose-Based Hard Carbon Anodes for Sodium-Ion Batteries. Front. Batter. Electrochem. 2024, 2, 1330448. [Google Scholar] [CrossRef]
  22. Sarma, H.R.; Sun, J.; Hora, Y.; Forsyth, M.; Byrne, N. Effect of Carbonization Behaviour of Cotton Biomass in Electrodes for Sodium-Ion Batteries. ChemElectroChem 2023, 10, e202300127. [Google Scholar] [CrossRef]
  23. Li, Y.; Hu, Y.-S.; Titirici, M.-M.; Chen, L.; Huang, M.; Li, X.Y.; Hu, Y.; Chen, L.Q.; Huang, X.J.; Li, Y.M.; et al. Hard Carbon Microtubes Made from Renewable Cotton as High-Performance Anode Material for Sodium-Ion Batteries. Adv. Energy Mater. 2016, 6, 1600659. [Google Scholar] [CrossRef]
  24. Mohammed, M.; Hossain, M.M.; Bari, M.A. Al Optimizing Hard Carbon Anodes for Sodium-Ion Batteries: Effects of Pre-Treatment and Post-Treatment Techniques. Batter. Energy 2025, 4, e70047. [Google Scholar] [CrossRef]
  25. Kong, J.; Su, Z.; Dong, C.; Chen, Q.; Pan, G. Overview of Coals as Carbon Anode Materials for Sodium-Ion Batteries. Clean Energy 2024, 8, 197–218. [Google Scholar] [CrossRef]
  26. Xu, Z.; Wang, J.; Guo, Z.; Xie, F.; Liu, H.; Yadegari, H.; Tebyetekerwa, M.; Ryan, M.P.; Hu, Y.; Titirici, M. The Role of Hydrothermal Carbonization in Sustainable Sodium-Ion Battery Anodes. Adv. Energy Mater. 2022, 12, 2200208. [Google Scholar] [CrossRef]
  27. Hu, B.; Wang, K.; Wu, L.; Yu, S.; Antonietti, M.; Titirici, M. Engineering Carbon Materials from the Hydrothermal Carbonization Process of Biomass. Adv. Mater. 2010, 22, 813–828. [Google Scholar] [CrossRef]
  28. Nieto, N.; Porte, J.; Saurel, D.; Djuandhi, L.; Sharma, N.; Lopez-Urionabarrenechea, A.; Palomares, V.; Rojo, T. Use of Hydrothermal Carbonization to Improve the Performance of Biowaste-Derived Hard Carbons in Sodium Ion-Batteries. ChemSusChem 2023, 16, e202301053. [Google Scholar] [CrossRef]
  29. Petrović, J.; Ercegović, M.; Simić, M.; Koprivica, M.; Dimitrijević, J.; Jovanović, A.; Janković Pantić, J. Hydrothermal Carbonization of Waste Biomass: A Review of Hydrochar Preparation and Environmental Application. Processes 2024, 12, 207. [Google Scholar] [CrossRef]
  30. Alvin, S.; Yoon, D.; Chandra, C.; Susanti, R.F.; Chang, W.; Ryu, C.; Kim, J. Extended Flat Voltage Profile of Hard Carbon Synthesized Using a Two-Step Carbonization Approach as an Anode in Sodium Ion Batteries. J. Power Sources 2019, 430, 157–168. [Google Scholar] [CrossRef]
  31. Li, J.; Xu, R.; Zhang, J.; Li, C.; Bao, J.; Liang, W. Technical Exploration of Combined Hydrothermal Carbonization and Pyrolysis to Produce High-Quality Biochar. SSRN Electron. J. 2022. [Google Scholar] [CrossRef]
  32. Beda, A.; Rabuel, F.; Morcrette, M.; Knopf, S.; Taberna, P.L.; Simon, P.; Matei Ghimbeu, C. Hard Carbon Key Properties Allow for the Achievement of High Coulombic Efficiency and High Volumetric Capacity in Na-Ion Batteries. J. Mater. Chem. A 2021, 9, 1743–1758. [Google Scholar] [CrossRef]
  33. Chu, Y.; Zhang, J.; Zhang, Y.; Li, Q.; Jia, Y.; Dong, X.; Xiao, J.; Tao, Y.; Yang, Q.H. Reconfiguring Hard Carbons with Emerging Sodium-Ion Batteries: A Perspective. Adv. Mater. 2023, 35, e2212186. [Google Scholar] [CrossRef]
  34. Katsuyama, Y.; Nakayasu, Y.; Kobayashi, H.; Goto, Y.; Honma, I.; Watanabe, M. Rational Route for Increasing Intercalation Capacity of Hard Carbons as Sodium-Ion Battery Anodes. ChemSusChem 2020, 13, 5762–5768. [Google Scholar] [CrossRef]
  35. Beda, A. Development of Eco-Friendly Hard Carbons for Na-Ion Batteries; University of Upper Alsace: Mulhouse, France, 2019; pp. 1–223. [Google Scholar]
  36. Huang, Y.; Wang, Y.; Bai, P.; Xu, Y. Storage Mechanism of Alkali Metal Ions in the Hard Carbon Anode: An Electrochemical Viewpoint. ACS Appl. Mater. Interfaces 2021, 13, 38441–38449. [Google Scholar] [CrossRef]
  37. Zhang, Q.; Deng, X.; Ji, M.; Li, Y.; Shi, Z. Hard Carbon Microspheres Derived from Resorcinol Formaldehyde Resin as High-Performance Anode Materials for Sodium-Ion Battery. Ionics 2020, 26, 4523–4532. [Google Scholar] [CrossRef]
  38. Thommes, M.; Kaneko, K.; Neimark, A.V.; Olivier, J.P.; Rodriguez-Reinoso, F.; Rouquerol, J.; Sing, K.S.W. Physisorption of Gases, with Special Reference to the Evaluation of Surface Area and Pore Size Distribution (IUPAC Technical Report). Pure Appl. Chem. 2015, 87, 1051–1069. [Google Scholar] [CrossRef]
  39. Barszcz, W.; Łożyńska, M.; Molenda, J. Impact of Pyrolysis Process Conditions on the Structure of Biochar Obtained from Apple Waste. Sci. Rep. 2024, 14, 10501. [Google Scholar] [CrossRef]
  40. Irisarri, E.; Amini, N.; Tennison, S.; Ghimbeu, C.M.; Gorka, J.; Vix-Guterl, C.; Ponrouch, A.; Palacin, M.R. Optimization of Large Scale Produced Hard Carbon Performance in Na-Ion Batteries: Effect of Precursor, Temperature and Processing Conditions. J. Electrochem. Soc. 2018, 165, A4058–A4066. [Google Scholar] [CrossRef]
  41. Beda, A.; Vaulot, C.; Matei Ghimbeu, C. Hard Carbon Porosity Revealed by the Adsorption of Multiple Gas Probe Molecules (N2, Ar, CO2, O2 and H2). J. Mater. Chem. A 2021, 9, 937–943. [Google Scholar] [CrossRef]
  42. Dubinin, M.M. Fundamentals of the Theory of Adsorption in Micropores of Carbon Adsorbents: Characteristics of Their Adsorption Properties and Microporous Structures. Carbon N. Y. 1989, 27, 457–467. [Google Scholar] [CrossRef]
  43. Hu, Y.H.; Ruckenstein, E. Applicability of Dubinin-Astakhov Equation to CO2 Adsorption on Single-Walled Carbon Nanotubes. Chem. Phys. Lett. 2006, 425, 306–310. [Google Scholar] [CrossRef]
  44. Bokobza, L.; Bruneel, J.-L.; Couzi, M. Raman Spectra of Carbon-Based Materials (from Graphite to Carbon Black) and of Some Silicone Composites. C 2015, 1, 77–94. [Google Scholar] [CrossRef]
  45. Li, Z.; Jian, Z.; Wang, X.; Rodríguez-Pérez, I.A.; Bommier, C.; Ji, X. Hard Carbon Anodes of Sodium-Ion Batteries: Undervalued Rate Capability. Chem. Commun. 2017, 53, 2610–2613. [Google Scholar] [CrossRef]
  46. Hou, H.; Ji, X. Carbon Anode Materials for Sodium-Ion Batteries. Adv. Batter. Mater. 2019, 1–86. [Google Scholar] [CrossRef]
  47. Eckmann, A.; Felten, A.; Mishchenko, A.; Britnell, L.; Krupke, R.; Novoselov, K.S.; Casiraghi, C. Probing the Nature of Defects in Graphene by Raman Spectroscopy. Nano Lett. 2012, 12, 3925–3930. [Google Scholar] [CrossRef]
  48. Li, X.; Sun, J.; Zhao, W.; Lai, Y.; Yu, X.; Liu, Y. Intergrowth of Graphite-Like Crystals in Hard Carbon for Highly Reversible Na-Ion Storage. Adv. Funct. Mater. 2022, 32, 2106980. [Google Scholar] [CrossRef]
  49. Meng, Q.; Chen, B.; Jian, W.; Zhang, X.; Sun, S.; Wang, T.; Zhang, W. Hard Carbon Anodes for Sodium-Ion Batteries: Dependence of the Microstructure and Performance on the Molecular Structure of Lignin. J. Power Sources 2023, 581, 233475. [Google Scholar] [CrossRef]
  50. Sadezky, A.; Muckenhuber, H.; Grothe, H.; Niessner, R.; Pöschl, U. Raman Microspectroscopy of Soot and Related Carbonaceous Materials: Spectral Analysis and Structural Information. Carbon N. Y. 2005, 43, 1731–1742. [Google Scholar] [CrossRef]
  51. Marino, C.; Cabanero, J.; Povia, M.; Villevieille, C. Biowaste Lignin-Based Carbonaceous Materials as Anodes for Na-Ion Batteries. J. Electrochem. Soc. 2018, 165, A1400–A1408. [Google Scholar] [CrossRef]
  52. Yuan, L.; Zhang, Q.; Pu, Y.; Qiu, X.; Liu, C.; Wu, H. Modulating Intrinsic Defect Structure of Fibrous Hard Carbon for Super-Fast and High-Areal Sodium Energy Storage. Adv. Energy Mater. 2024, 14, 2400125. [Google Scholar] [CrossRef]
  53. Ferrari, A.C.; Robertson, J. Interpretation of Raman Spectra of Disordered and Amorphous Carbon. Phys. Rev. B 2000, 61, 14095–14107. [Google Scholar] [CrossRef]
  54. Chen, X.; Wang, X.; Fang, D. A Review on C1s XPS-Spectra for Some Kinds of Carbon Materials. Fuller. Nanotub. Carbon Nanostructures 2020, 28, 1048–1058. [Google Scholar] [CrossRef]
  55. Qin, L.; Xu, S.; Lu, Z.; Wang, L.; Chen, L.; Zhang, D.; Tian, J.; Wei, T.; Chen, J.; Guo, C. Cellulose as a Novel Precursor to Construct High-Performance Hard Carbon Anode toward Enhanced Sodium-Ion Batteries. Diam. Relat. Mater. 2023, 136, 110065. [Google Scholar] [CrossRef]
  56. Che, H.; Yang, X.; Wang, H.; Liao, X.Z.; Zhang, S.S.; Wang, C.; Ma, Z.F. Long Cycle Life of Sodium-Ion Pouch Cell Achieved by Using Multiple Electrolyte Additives. J. Power Sources 2018, 407, 173–179. [Google Scholar] [CrossRef]
  57. Zhang, X.; Ding, F.; Han, K.; Chen, Z.; Wan, H.; Xu, X.; Wang, X.; Meng, J.; Qin, Z.; Li, B.; et al. Bridge the Gaps Between Lab-Level Sodium-Ion Coin Cells and Practical Pouch Cells. Adv. Mater. 2026, 38, e21756. [Google Scholar] [CrossRef]
  58. Stüble, P.; Müller, C.; Bohn, N.; Müller, M.; Hofmann, A.; Akçay, T.; Klemens, J.; Koeppe, A.; Kolli, S.; Rajagopal, D.; et al. From Powder to Pouch Cell: Setting up a Sodium-Ion Battery Reference System Based on Na3V2(PO4)3/C and Hard Carbon. Batter. Supercaps 2024, 7, e202400406. [Google Scholar] [CrossRef]
  59. Pei, L.; Cao, H.; Yang, L.; Liu, P.; Zhao, M.; Xu, B.; Guo, J. Hard Carbon Derived from Waste Tea Biomass as High-Performance Anode Material for Sodium-Ion Batteries. Ionics 2020, 26, 5535–5542. [Google Scholar] [CrossRef]
  60. Wang, N.; Liu, Q.; Sun, B.; Gu, J.; Yu, B.; Zhang, W.; Zhang, D. N-Doped Catalytic Graphitized Hard Carbon for High-Performance Lithium/Sodium-Ion Batteries. Sci. Rep. 2018, 8, 9934. [Google Scholar] [CrossRef]
  61. Yang, W.; Li, Y.; Feng, Y. High Electrochemical Performance from Oxygen Functional Groups Containing Porous Activated Carbon Electrode of Supercapacitors. Materials 2018, 11, 2455. [Google Scholar] [CrossRef]
  62. Cheng, D.; Zhou, X.; Hu, H.; Li, Z.; Chen, J.; Miao, L.; Ye, X.; Zhang, H. Electrochemical Storage Mechanism of Sodium in Carbon Materials: A Study from Soft Carbon to Hard Carbon. Carbon N. Y. 2021, 182, 758–769. [Google Scholar] [CrossRef]
  63. Qiu, S.; Xiao, L.; Sushko, M.L.; Han, K.S.; Shao, Y.; Yan, M.; Liang, X.; Mai, L.; Feng, J.; Cao, Y.; et al. Manipulating Adsorption–Insertion Mechanisms in Nanostructured Carbon Materials for High-Efficiency Sodium Ion Storage. Adv. Energy Mater. 2017, 7, 1700403. [Google Scholar] [CrossRef]
  64. Ding, J.; Wang, H.; Li, Z.; Kohandehghan, A.; Cui, K.; Xu, Z.; Zahiri, B.; Tan, X.; Lotfabad, E.M.; Olsen, B.C.; et al. Carbon Nanosheet Frameworks Derived from Peat Moss as High Performance Sodium Ion Battery Anodes. ACS Nano 2013, 7, 11004–11015. [Google Scholar] [CrossRef]
  65. Kuang, Y.; Fan, Y.; Yue, F.; Zhang, B.; He, X.; Hwang, J.-Y.; Zhou, D. Cottonseed Cake-Derived Hard Carbon Anode with Modulated Carbon Layer Spacing and Pores for Highly Reversible and Durable Sodium-Ion Batteries. J. Mater. Chem. A 2026, 14, 6284. [Google Scholar] [CrossRef]
  66. Kim, J.B.; Lee, G.H.; Lau, V.W.H.; Zhang, J.; Zou, F.; Chen, M.; Zhou, L.; Nam, K.W.; Kang, Y.M. Microstructural Investigation into Na-Ion Storage Behaviors of Cellulose-Based Hard Carbons for Na-Ion Batteries. J. Phys. Chem. C 2021, 125, 14559–14566. [Google Scholar] [CrossRef]
  67. Xin, Q.; Feng, Y.; Gan, S.; Deng, X.; Feng, Z.; Xiong, D.; He, M. Hard Carbon Derived from Biomass Composite as a High Initial Coulombic Efficiency Anode for Sodium-Ion Batteries. Ionics 2025, 31, 4309–4320. [Google Scholar] [CrossRef]
  68. Sun, C.; Gao, F.; Wu, J.-Y.; Yang, Y.; Sun, Q. Microcrystalline Cellulose-Derived Hard Carbon for Robust and Low-Potential Sodium Storage. Carbon N. Y. 2025, 232, 119771. [Google Scholar] [CrossRef]
  69. Liu, H.; Yuan, R.; Long, H.; Shen, Q.; Zhao, B.; Liu, X.; Song, H. Structure Regulation and Sodium Storage Performance of Cellulose-Based Hard Carbon. J. Petrochem. Univ. 2024, 37, 62–73. [Google Scholar] [CrossRef]
  70. Mao, Y.; Yi, Z.; Xie, L.; Dai, L.; Su, F.; Wang, Y.; Ji, W.; Wei, X.; Hui, G.; Chang, Y.; et al. Elimination of Hydrogen Bonds in Cellulose Enables High-Performance Disordered Carbon Anode in Sodium-Ion Batteries. Energy Storage Mater. 2024, 73, 103845. [Google Scholar] [CrossRef]
  71. Du, Y.; Zhou, J.; Zeng, J. High-Performance Na-Storage and Sodiation Behavior Identification in Cellulose-Derived Hard Carbon by High-Resolution Element Mapping Microscopy. Adv. Energy Sustain. Res. 2025, 6, 2400249. [Google Scholar] [CrossRef]
  72. Chen, L.; Li, F.; Liu, K.; Wang, F.; Bai, Z.; Zhang, Y.; Tang, Y. Nanoconfinement-Induced High-Rate Performance of Hard Carbon for Densified Sodium Cluster Storage. Chem. Sci. 2026, 17, 5616–5626. [Google Scholar] [CrossRef]
  73. Simone, V.; Boulineau, A.; de Geyer, A.; Rouchon, D.; Simonin, L.; Martinet, S. Hard Carbon Derived from Cellulose as Anode for Sodium Ion Batteries: Dependence of Electrochemical Properties on Structure. J. Energy Chem. 2016, 25, 761–768. [Google Scholar] [CrossRef]
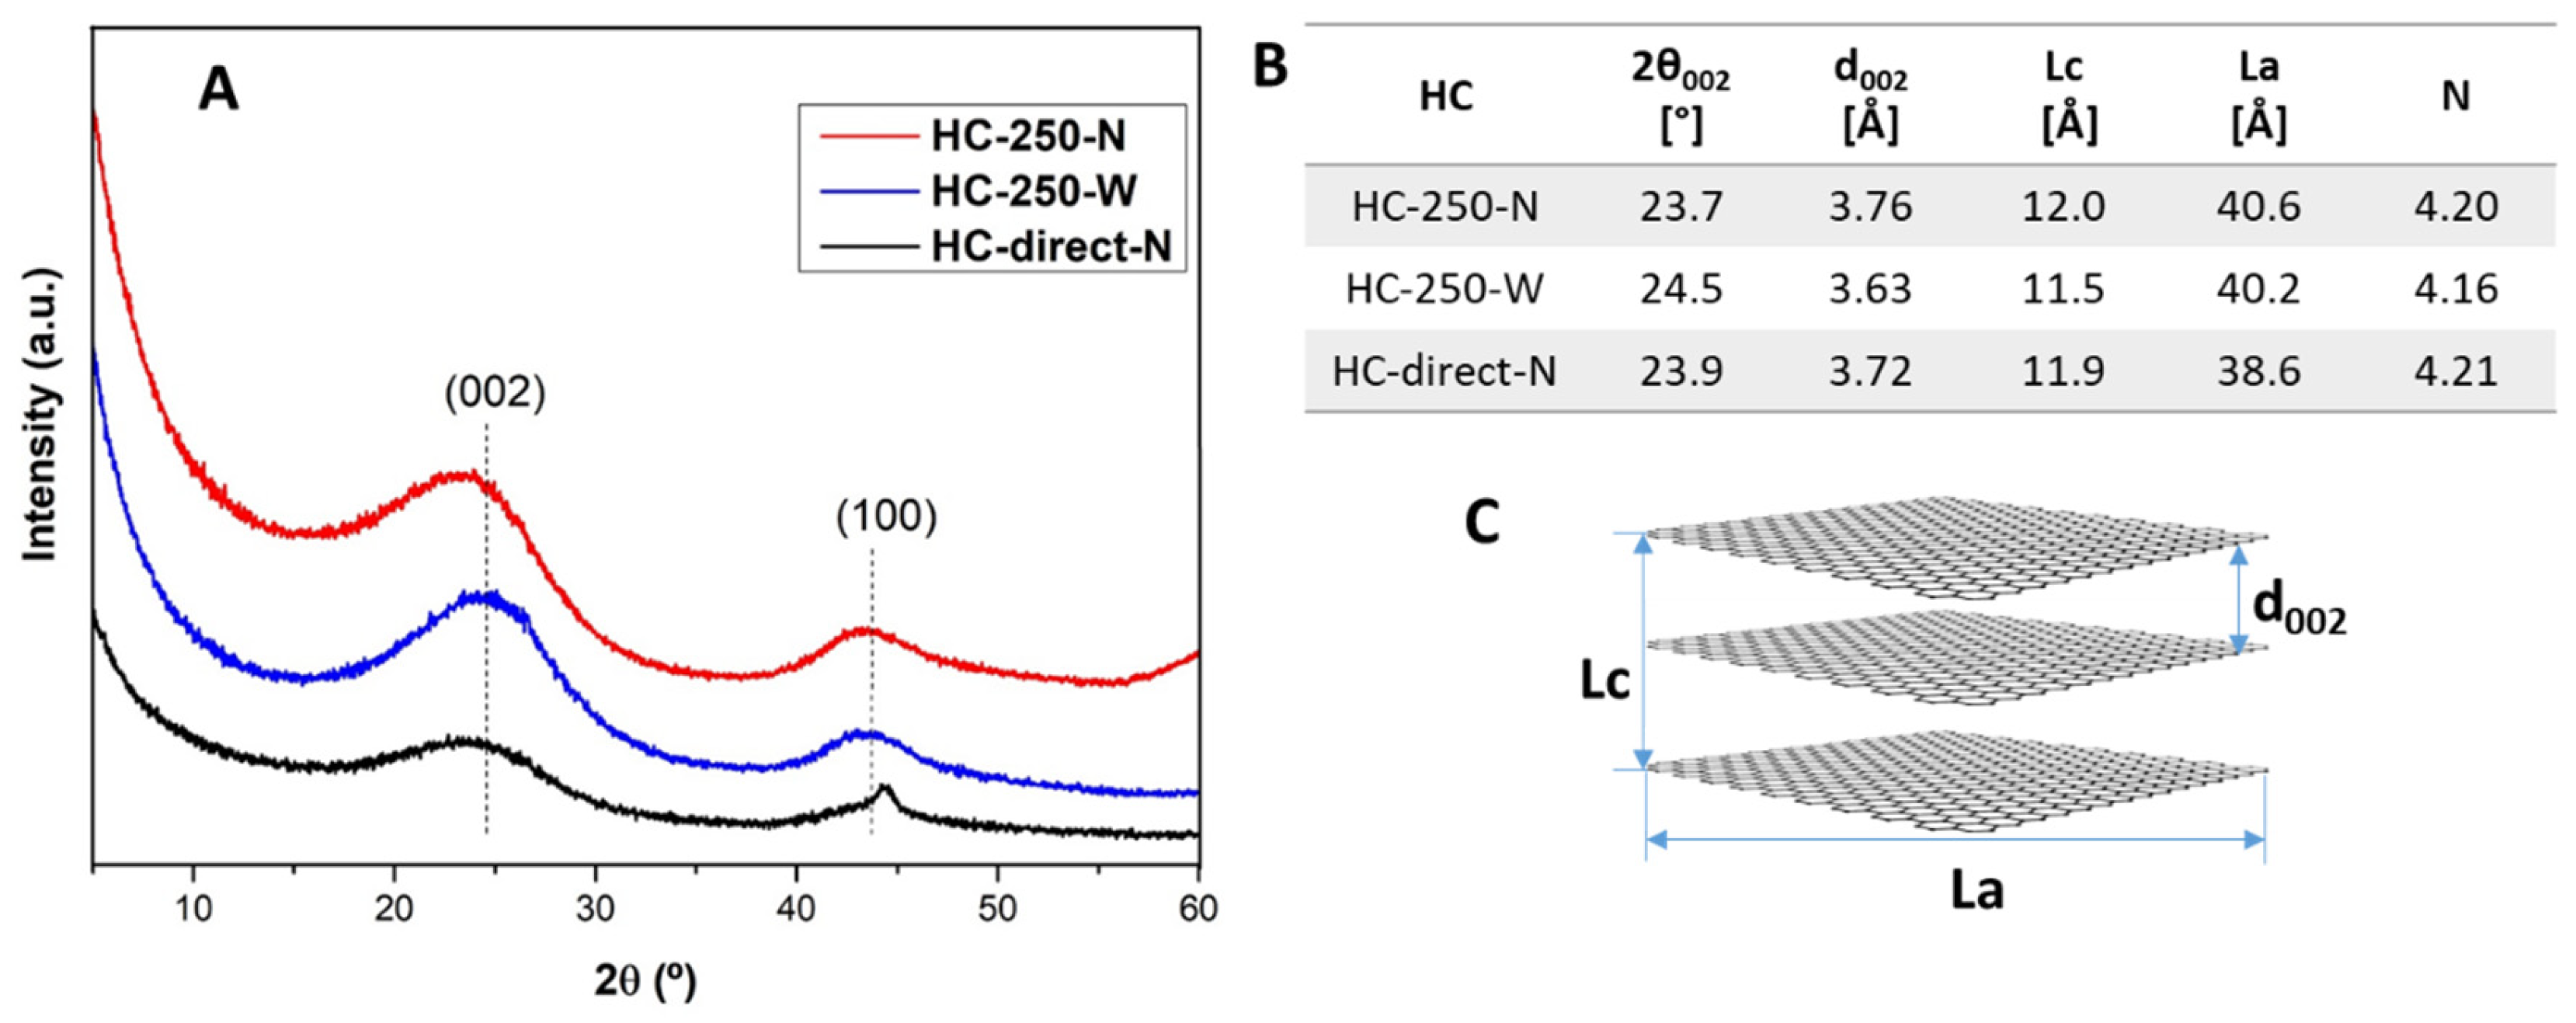
Figure 1. XRD patterns (A), structural parameters (B) and graphical representation of graphite-like microcrystal (C) of synthesized HCs.
Processes 14 01735 g001
Scheme 1. Schematic illustration of different synthesis pathways for HCs.
Processes 14 01735 sch001
Figure 2. SEM images (in-lens detector) of HC samples at 25,000× magnification (A1C1); HR-TEM images of synthesized HC-250-N, HC-250-W, and HC-direct-N samples (A2C2). Red circles represent pseudo-graphitic regions; blue circles represent disordered regions.
Processes 14 01735 g002
Figure 3. (A) N2 adsorption–desorption isotherms measured at 77 K. (B) NLDFT pore size distribution from N2 adsorption isotherm. (C) CO2 adsorption–desorption isotherms measured at 298 K. (D) DFT pore size distribution from CO2 adsorption isotherm (D) of synthesized HCs.
Processes 14 01735 g003
Figure 4. Comparative graph of HCs Raman spectra (A); deconvoluted Raman spectra of HC-250-N (B), HC-250-W (C) and HC-direct-N (D) samples.
Processes 14 01735 g004
Figure 5. XPS survey spectra of synthesized HCs.
Processes 14 01735 g005
Figure 6. Deconvoluted XPS spectra of C1s and O1s elements of HC-250-N, HC-250-W and HC-direct-N samples.
Processes 14 01735 g006
Figure 7. Cyclic voltammetry profiles (AC) and initial galvanostatic charge/discharge curves (DF) of synthesized anode materials.
Processes 14 01735 g007
Figure 8. Electrochemical impedance spectra (EIS) of HC-250-N, HC-250-W, and HC-direct-N electrodes recorded at open circuit potential in the frequency range of 100 kHz to 0.1 Hz with a sinusoidal perturbation amplitude of 10 mV. The Nyquist plot shows the real (Z′) and negative imaginary (−Z″) components of the complex impedance.
Processes 14 01735 g008
Figure 9. Rate capability (A) and cyclic performance (B) of HCs at 0.5 C.
Processes 14 01735 g009
Table 1. Textural properties of synthesized HCs determined by CO2 and N2 adsorption analysis.
SampleSBET
[m2 g−1]
N2
Sµpore
[m2 g−1]
N2
Vtot
[cm3 g−1]
N2
Vµpore
[cm3 g−1]
N2
S
[m2 g−1]
CO2
Vµpore
[cm3 g−1]
CO2
HC-250-N4274090.3000.1595940.382
HC-250-W101110080.6430.40311790.520
HC-direct-N3122680.2720.1047760.305
Table 2. Electrochemical performance of HCs.
SampleInitial Capacity [mAh g−1]Reversible Capacity [mAh g−1]ICE [%]Capacity After 100 Cycles [mAh g−1]Stability After 100 Cycles [%]
HC-250-N8843354018864
HC-250-W11163202911461
HC-direct-N83834343215 a(80) a
a After 33 cycles.
Table 3. Comparison of hard carbon (HC) materials from cotton and cellulose precursors.
Precursor MaterialPreparation MethodPyrolysis Temp.
[°C]
Capacity
[mAh g−1]
Current Rate
[mA g−1]
Ref.
Waste cottonHydrothermal carbonization + pyrolysis90033567This work
Waste cottonDirect pyrolysis100024050[21]
Waste cottonDirect pyrolysis100027250[22]
Natural cottonDirect pyrolysis1300315Not specified[23]
Cottonseed cakeOxidative treatment (300 °C) + pyrolysis1400302100[66]
Fiber/microcrystalline celluloseDirect pyrolysis1300300[67]
Cellulose + corn starch mixtureSequential two-step pyrolysis600 + 150032830[6,68]
CelluloseTwo-step pyrolysis450 + 1300–1600300[6,68]
CelluloseDirect pyrolysis37720[69]
CelluloseDirect pyrolysis150034330[70]
Cellulose (pre-treated)Pre-oxidation/EG-modified carbonization/cross-linking + pyrolysis a324–335[71,72,73]
a EG = ethylene glycol.
Disclaimer/Publisher’s Note: The statements, opinions and data contained in all publications are solely those of the individual author(s) and contributor(s) and not of MDPI and/or the editor(s). MDPI and/or the editor(s) disclaim responsibility for any injury to people or property resulting from any ideas, methods, instructions or products referred to in the content.