Article

Research on Intelligent Geological Structural Modelling Guided by a Geological Structure Knowledge Graph

1
Research Institute of Petroleum Exploration & Development-Northwest (NWGI), Petrochina, Lanzhou 730060, China
2
Key Laboratory of Internet of Things, CNPC, Lanzhou 730060, China
3
School of Geosciences, China University of Petroleum, Qingdao 266580, China
*
Author to whom correspondence should be addressed.
Processes 2026, 14(11), 1736; https://doi.org/10.3390/pr14111736
Submission received: 14 April 2026 / Revised: 6 May 2026 / Accepted: 7 May 2026 / Published: 26 May 2026
(This article belongs to the Topic Advanced Technology for Oil and Nature Gas Exploration)

Abstract

Three-dimensional geological structural modelling provides the geometric framework for sub-surface exploration and development. However, conventional workflows, driven primarily by seismic interpretation, often lack explicit constraints from expert knowledge and are difficult to update when interpretations evolve. In particular, the conventional surface-based workflow follows a sequential pipeline—from seismic interpretation through manual intersection editing to surface generation and pillar gridding—in which geological knowledge is embedded only implicitly through operator-dependent parameter tuning, making knowledge transfer and model reproducibility difficult. This study proposes an intelligent modelling methodology guided by a geological structure knowledge graph. The method includes: (i) a three-tier knowledge architecture (TKA) that formalises domain knowledge in entity, relationship and inference layers using RDF/OWL; (ii) a knowledge-driven intersection line generation algorithm (KILGA) coupled with a hierarchical adaptive mesh refinement scheme based on a posteriori error estimation (HAMR-APEE) to integrate geological constraints and mitigate boundary aliasing; and (iii) a bidirectional linkage mechanism between the knowledge graph and 3D models to support incremental updates following knowledge revision. The approach is validated in three petroliferous basins in China (Ordos, Qaidam and Sichuan), representing micro-amplitude, thrust-nappe and deep complex structural styles. Compared with a conventional surface-based workflow, the proposed method reduces modelling RMSE from 15–20 m to 5–8 m, improves geological reasonableness from ~85% to >95%, and shortens modelling cycles from months to weeks. These results demonstrate that explicit integration of formalised geological knowledge into the modelling pipeline can substantially enhance both accuracy and efficiency across a range of structural settings.

1. Introduction

Three-dimensional geological structural modelling constitutes a fundamental technology for sub-surface resource exploration and development, providing critical geometric frameworks for reservoir characterisation, fluid simulation, and well trajectory optimisation [1,2]. As exploration targets progressively shift towards deeper and more structurally complex formations, the demands on modelling accuracy and efficiency have increased substantially [3]. Complex geological processes—including multi-stage tectonic superimposition, fault reactivation, and episodic depositional events shaped by tectonic–climatic coupling [4,5]—create intricate sub-surface architectures that further challenge conventional modelling approaches. However, conventional modelling methods face persistent challenges that limit their effectiveness in complex geological settings.
Two interrelated problems are particularly prominent. First, existing modelling workflows struggle to integrate expert geological knowledge with quantitative computational processes. Traditional interpolation methods, such as kriging and radial basis functions, tend to over-smooth structural features near fault intersections and stratigraphic terminations, producing models that violate established geological principles [6,7]. Explicit surface methods (e.g., Delaunay triangulation) exhibit high grid distortion and poor boundary consistency when handling intersecting fault networks, requiring extensive manual correction [8]. Although implicit modelling approaches using fault potential fields have enabled automatic handling of complex faults, they do not systematically incorporate or dynamically invoke expert knowledge, thereby limiting the model’s geological reasoning capability [9]. Second, the absence of effective dynamic updating mechanisms constrains model timeliness. When new seismic interpretation data become available or expert understanding evolves, conventional workflows require near-complete model reconstruction, resulting in modelling cycles of several months for structurally complex areas [10].
These challenges are well documented in industrial practice. In the Ordos Basin, conventional surface-based modelling of the Wangyaonan Block required over 45 days of iterative manual editing to capture micro-amplitude features with structural amplitudes of only 5–15 m, and the resulting model still exhibited approximately 15% geological inconsistencies at fault intersection zones. In the Qaidam Basin’s Ganchaigou thrust belt, reinterpretation of key thrust-fault positions necessitated near-complete model reconstruction, delaying exploration decisions by 2–3 months. These experiences highlight a fundamental limitation of conventional workflows: geological knowledge is embedded implicitly through operator-dependent parameter tuning at each processing step, making the modelling process difficult to reproduce, transfer, or efficiently update; recent open and time-aware modelling frameworks have highlighted the need for more transparent and reusable geological modelling workflows [3,10,11].
Recent advances in knowledge representation offer potential solutions to these challenges. Knowledge graph technology, which organises domain knowledge as structured entity-relationship networks, has demonstrated success in fields such as biomedical informatics and industrial manufacturing [12,13]. In geosciences, knowledge graphs have been applied to geological data integration [14], mineral prospectivity mapping [15], and stratigraphic correlation [16]. However, existing geological knowledge graph applications remain largely confined to flat relational structures, supporting only simple entity queries rather than the multi-hop reasoning required for complex structural inference. Ma et al. [14] demonstrated knowledge graph construction for geoscientific data integration but did not address real-time coupling with three-dimensional modelling processes. Bergen et al. [16] and Wu et al. [17] applied machine learning to geological model construction with improved feature extraction, yet their approaches lack the capacity to embed geological rules as explicit constraints. No existing study has established a systematic framework that integrates hierarchical geological knowledge reasoning with adaptive structural modelling algorithms.
To address these gaps, this study develops a knowledge graph-guided intelligent geological structural modelling methodology. The specific objectives are threefold: (1) to construct a three-tier knowledge architecture that enables hierarchical geological reasoning from basic entities to structural cognition; (2) to develop knowledge-constrained modelling algorithms, including automated intersection line generation and adaptive mesh refinement, that enforce geological plausibility throughout the modelling process; and (3) to establish bidirectional linkage between the knowledge graph and three-dimensional models, supporting real-time model updating in response to evolving geological understanding.
The principal innovations of this work are as follows:
A hierarchical geological knowledge architecture (TKA) comprising entity, relationship, and inference layers, capable of supporting multi-hop structural reasoning that existing flat knowledge graph approaches have not demonstrated.
A knowledge-driven intersection line generation algorithm (KILGA) that integrates R-tree spatial indexing with geological expert constraints, enabling automated identification and validation of geological interface intersections.
An adaptive mesh refinement algorithm (HAMR-APEE) employing a posteriori error estimation with anisotropic refinement strategies, effectively eliminating aliasing artefacts at fault zones and unconformity surfaces.
A bidirectional knowledge–model linkage mechanism that propagates knowledge graph modifications to model geometry in real time through incremental updates.
The proposed method is validated through three application cases representing distinct structural styles in China’s major petroliferous basins, demonstrating its broad applicability and effectiveness.

2. Materials and Methods

2.1. Construction of Geological Structure Knowledge Graph

2.1.1. Three-Tier Knowledge Architecture

The knowledge graph is constructed based on Description Logic and Ontology Engineering, employing the W3C Resource Description Framework (RDF) and Web Ontology Language (OWL 2.0) for formalised knowledge expression [18,19]. The Neo4j graph database serves as the storage engine, utilising a Labelled Property Graph model with native graph storage and index-free adjacency, which reduces the time complexity of relationship traversal queries from O(n) to approximately O(1) for indexed queries [20,21]. The knowledge graph adopts triple representation:
K G = { ( h , r , t ) h , t E , r R }
where E is the geological entity set, R is the relationship set, and (h, r, t) denotes a semantic triple connecting head entity h to tail entity t through relationship r [22].
This study constructs a three-tier knowledge architecture (TKA) comprising three hierarchical layers:
Geological entity layer: This layer defines atomic-level geological objects including faults, stratigraphic horizons, structural nodes, and geological boundaries. Each entity is identified through a unique resource identifier (URI) and characterised by spatial geometric attributes Ageo and geological property attributes Aprop.
e = ( U R I i , A g e o , A p r o p )
Geological relation layer: This layer establishes spatial topological relationships based on the OGC Simple Feature Access specification (intersects, touches, crosses, contains) [23] and genetic relationships (fault cutting, stratigraphic onlap, pinch-out, conformable contact). Relationship semantics are constrained through OWL axioms. For example, a fault necessarily cutting a stratigraphic interface is expressed as:
F a u l t c u t s . H o r i z o n
Structural inference layer: This layer implements automatic deduction from low-level geological knowledge to high-level structural cognition through a rule-based reasoning engine combined with SWRL rules [24]. Inference rules take the general form:
A n t e c e d e n t ( x 1 , , x n ) C o n s e q u e n t ( y 1 , , y m )
enabling structural type identification, fault system classification, and evolution sequence inference.

2.1.2. Structural Meta-Knowledge Extraction

Structural meta-knowledge refers to fundamental geological relationships extracted from seismic interpretation data, forming the informational foundation for knowledge graph construction. An automated intersection relationship identification algorithm based on computational geometry systematically extracts formation–formation, formation–fault, and fault–fault intersection relationships.
Three-dimensional spatial intersection detection employs the Separating Axis Theorem (SAT) combined with the Gilbert–Johnson–Keerthi (GJK) algorithm [25]. Coarse filtering uses Axis-Aligned Bounding Boxes (AABBs):
A A B B ( S ) = [ x min , x max ] × [ y min , y max ] × [ z min , z max ]
Precise triangle–triangle intersection testing applies the Möller–Trumbore algorithm [26], expressing intersection points through barycentric coordinates:
P = ( 1 u v ) V 0 + u V 1 + v V 2
where valid intersections satisfy u , v 0 ,   a n d   u + v 1 .
Intersection relationship types are classified based on structural geological principles into: conformable/unconformable contacts and angular/parallel unconformities (strata–strata); normal, reverse, and strike–slip fault cutting and fault branching (strata–fault); and conjugate, en échelon, Y-shaped, and horsetail structures (fault–fault). Automatic type recognition employs geometric feature vectors:
f = ( Δ α , Δ β , d t h r o w , r d i s p , κ )
where Δ α is the dip angle difference, Δβ is the strike difference, d t h r o w is the throw displacement, r d i s p is the displacement ratio, and κ is the interface curvature.
The constraint rules used for automatic type recognition are defined based on three sources: (i) established structural geology principles (e.g., normal faults typically dip > 45°, thrust faults typically dip < 45°); (ii) basin-specific geological understanding obtained from the published literature and exploration reports; and (iii) statistical analysis of existing interpretation data within each study area. For example, in the Wangyaonan Block, the constraint that strike–slip faults should exhibit near-vertical dip angles (>70°) and limited vertical displacement (<5 m) was derived from regional structural analysis and verified against well data [3,4,27].

2.1.3. Meta-Knowledge Quality Control

A three-layer quality control system ensures meta-knowledge reliability. Geometric consistency validation employs ε-neighbourhood detection to identify anomalies including dangling nodes, duplicate vertices, and self-intersecting curves [28]:
A g e o = p i | min j i p i p j < ε
Topological consistency verification examines closed geological bodies based on the Euler characteristic [29]:
V E + F = 2 ( 1 g )
where V, E, F denote vertices, edges, and faces respectively, and g is the genus. Semantic consistency verification employs the OWL 2 DL Tableau algorithm [30] to detect ontological conflicts.

2.2. Knowledge Graph-Guided Intelligent Structural Modelling

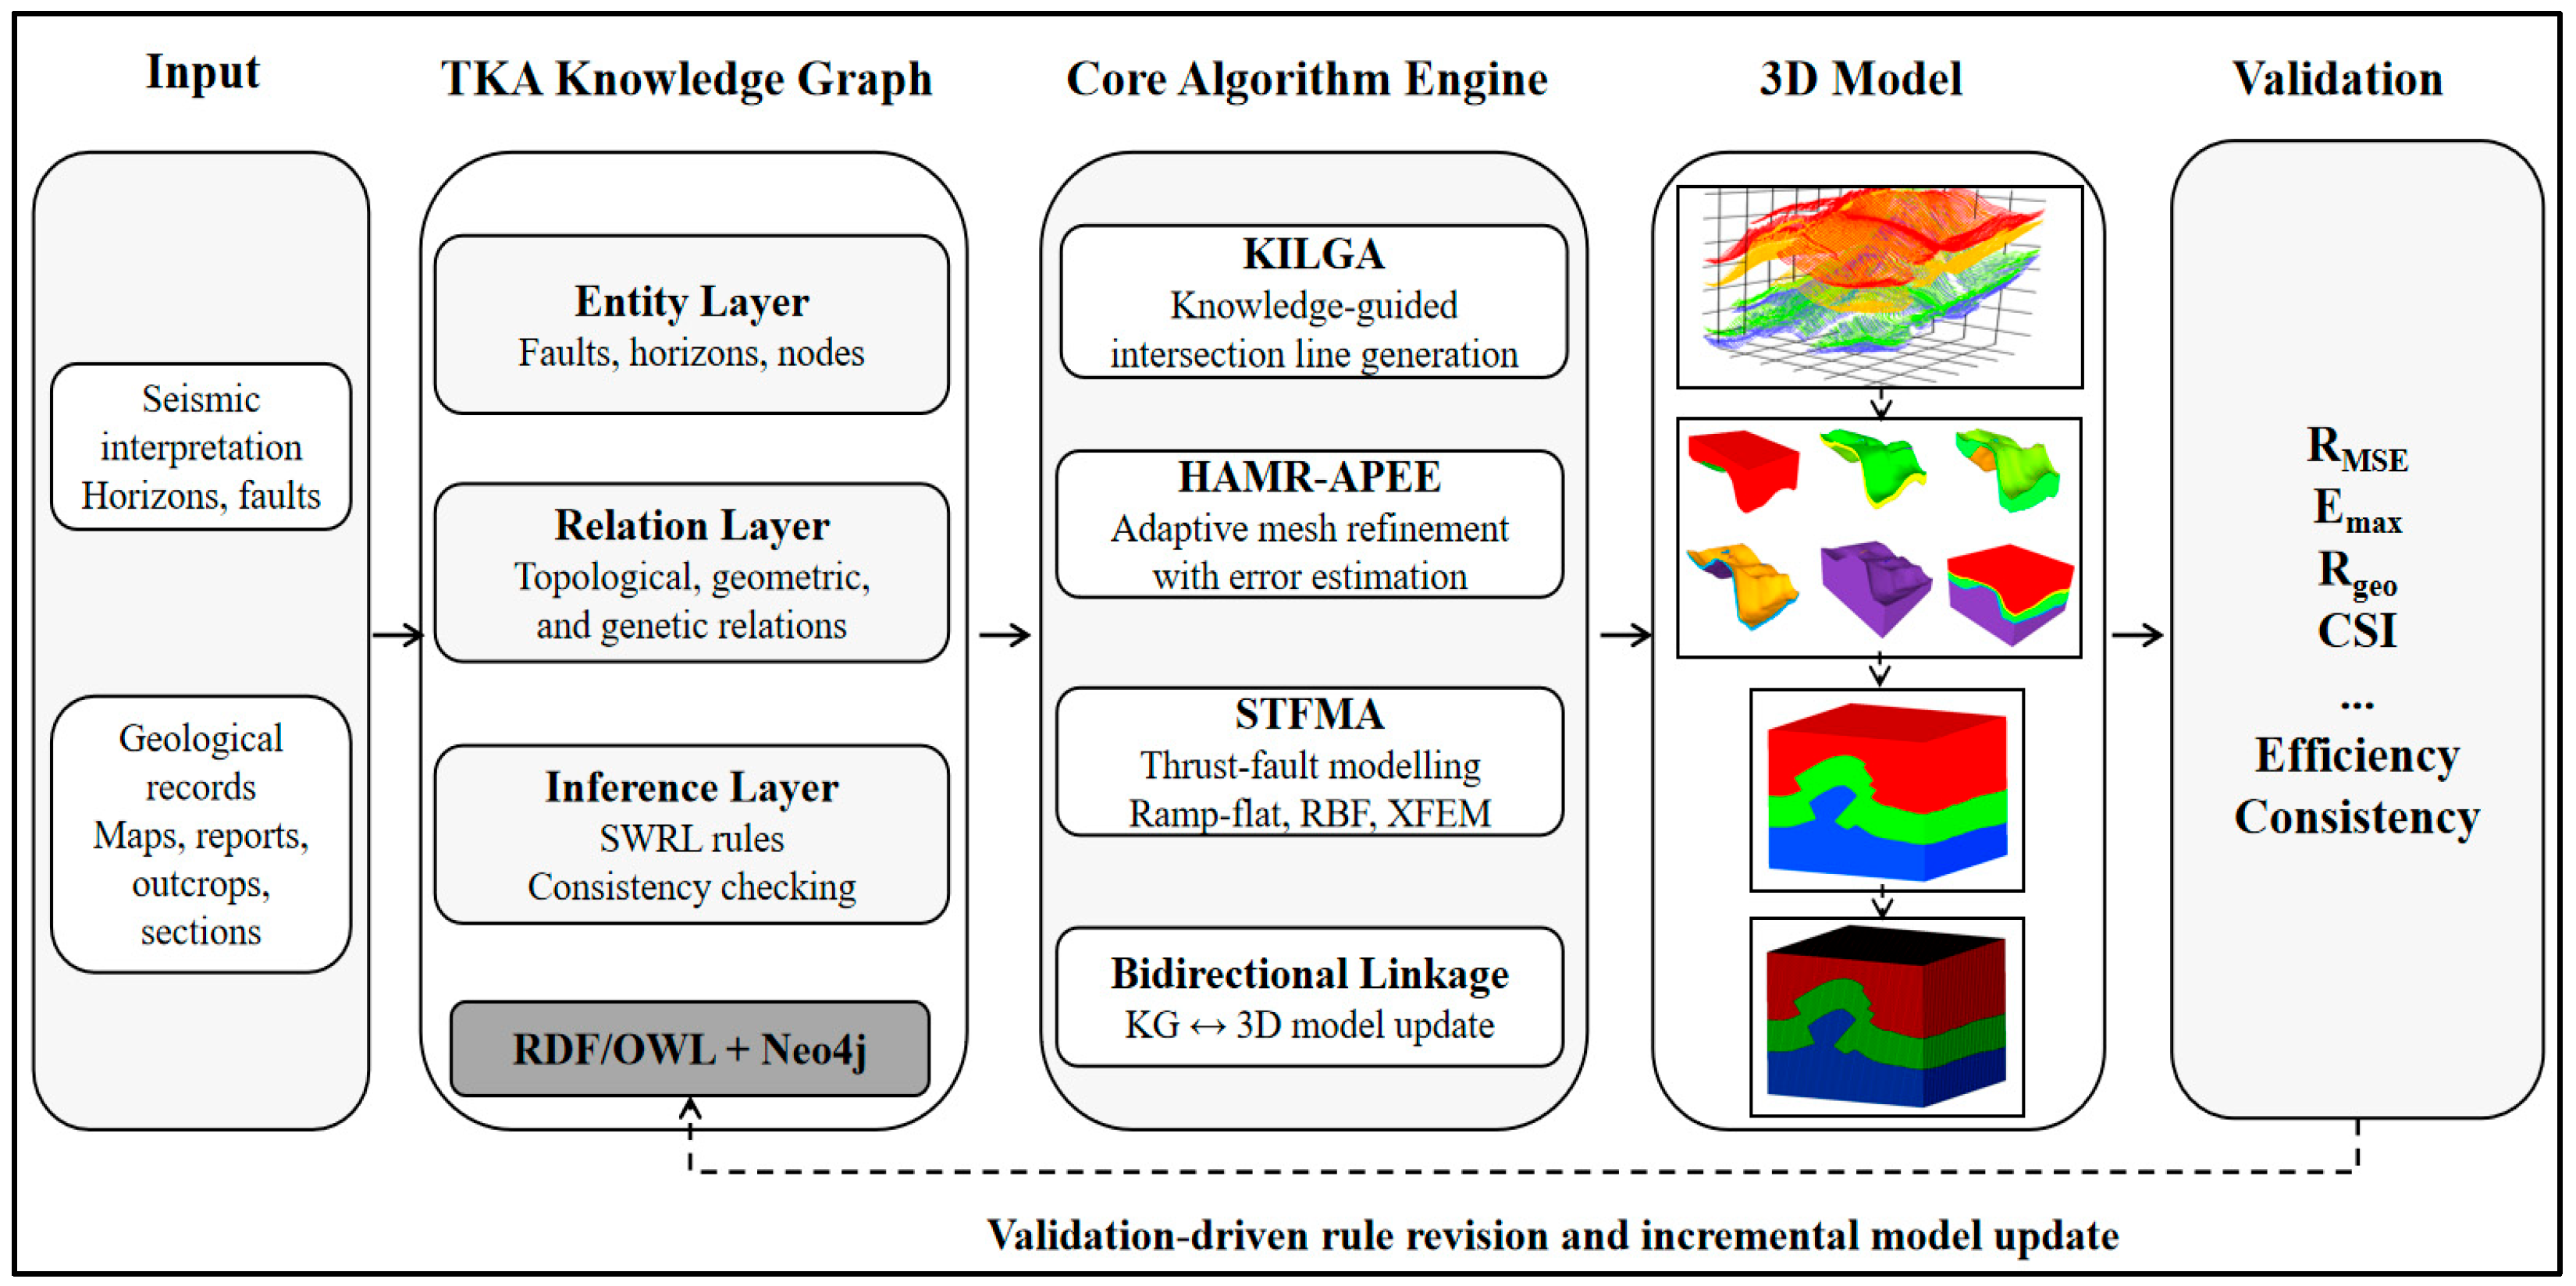
As illustrated in Figure 1, this study proposes an intelligent geological structure modelling workflow guided by a Knowledge Graph (TKG Knowledge Graph). The process firstly takes seismic interpretation results, geological stratification and fault information as inputs, organies them semantically using the knowledge graph’s entity layer (such as faults, horizons, nodes) and relationship layer (topology, configuration and general relations), and structuralises the knowledge into computable constraints through inference layer rules (including SWRL rules and consistency validation). Subsequently, in the core algorithm engine, KG-guided intersection line generation is employed to generate structural intersection lines, followed by HAMR-APEE adaptive mesh refinement to achieve error-driven densification in complex structural regions. The process then combines STFMA to perform inference-fault modelling (encompassing RBF implicit surfaces and XFEM representation methods) to complete 3D structural model reconstruction. Finally, a Validation module is introduced to evaluate the generated model using metrics such as RMSE, Rgeo and CSI, and based on validation results, validation-driven rule revision and incremental model updating are performed to realise closed-loop iteration of modelling quality and consistency.
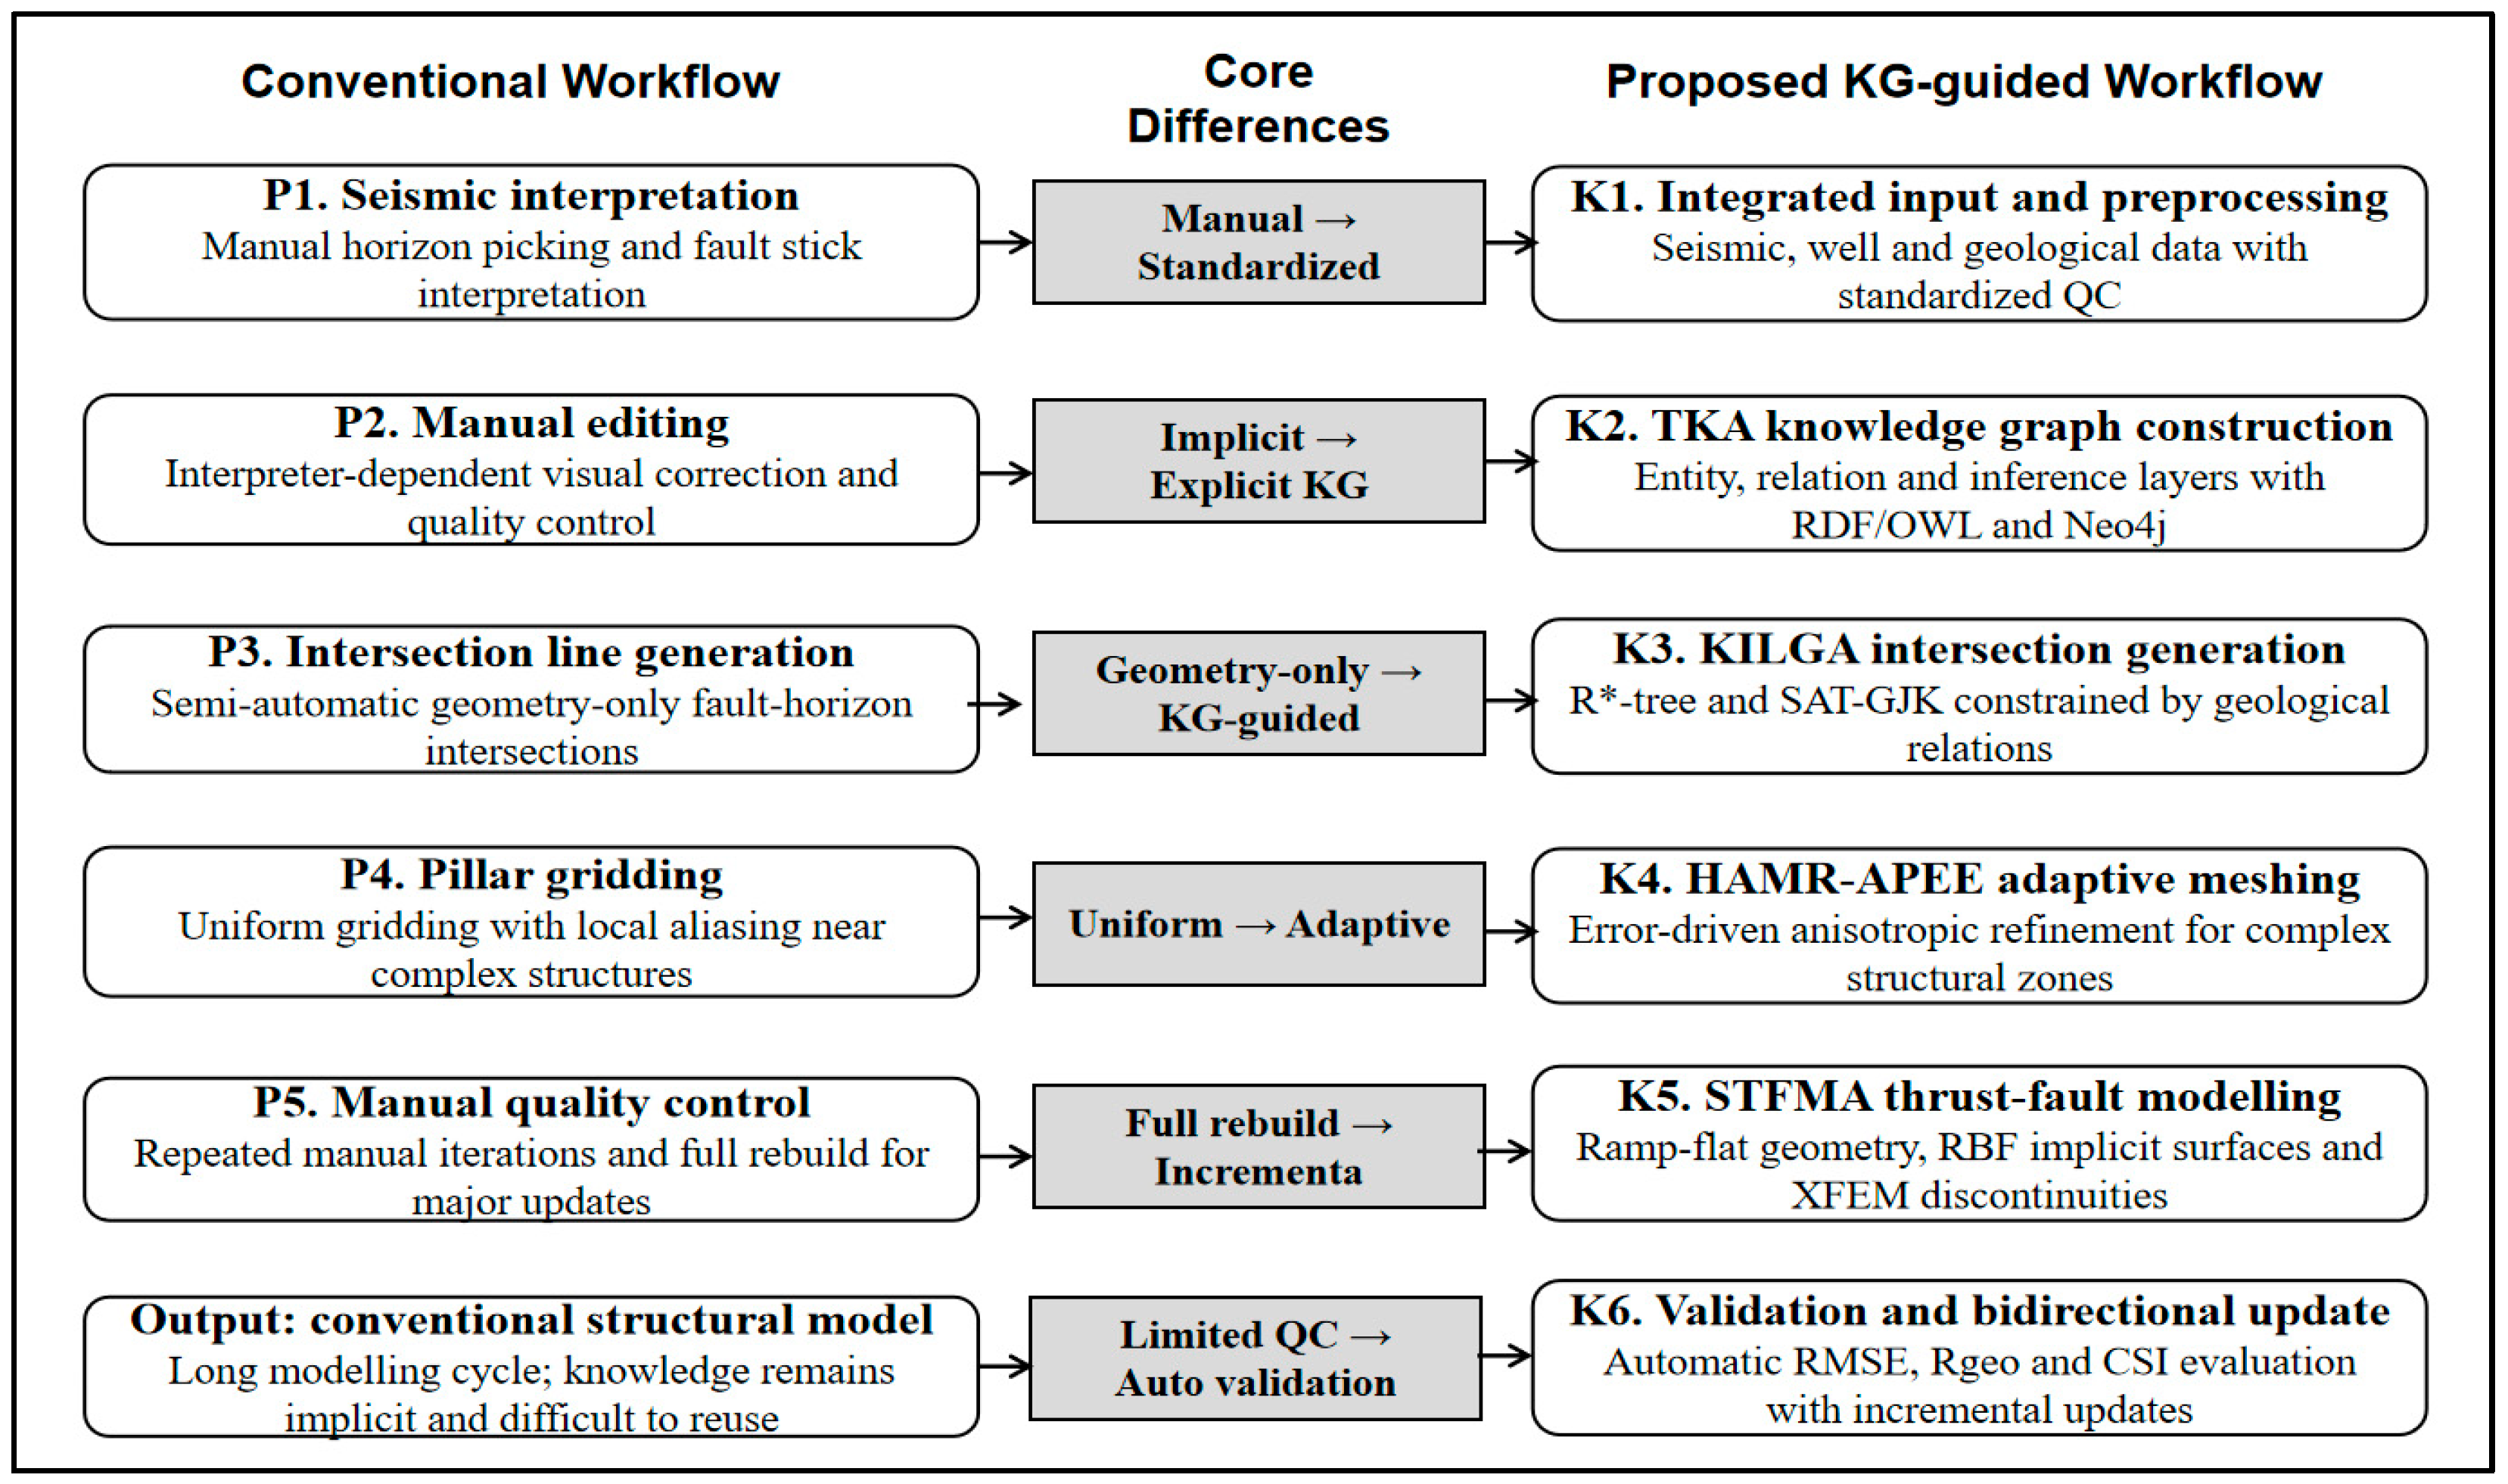
Concurrently, Figure 2 compares this method with the traditional workflow primarily based on commercial geological modelling software: the conventional workflow relies heavily on manual interpretation, manual editing and incremental quality control, making it difficult to directly embed explicit geological knowledge into each step of the modelling process. In contrast, the proposed KG-guided workflow achieves standardisation of input and preprocessing, knowledge graph construction and explicit constraint integration, rule-guided intersection line generation, adaptive mesh and modelling algorithms, and metric-based automation and bidirectional updating during stages K1–K6, thereby enhancing overall automation and reusability whilst strengthening model robustness and acceptability in pilot validation scenarios.

2.2.1. Data Preprocessing

The raw seismic interpretation data undergo standardised preprocessing, including coordinate system unification via the seven-parameter Bursa–Wolf model [31], anomalous data detection combining the Grubbs test [32] and local surface fitting, and adaptive resampling with curvature-dependent density:
ρ ( x ) = ρ 0 · ( 1 + α · κ ( x ) )
where ρ 0 is the reference density, α is the curvature sensitivity coefficient, and κ ( x ) is the Gaussian curvature.
In this study, the reference density ρ 0 is set based on the average seismic interpretation point spacing in each study area (Table 1). The curvature sensitivity coefficient α controls the degree to which high-curvature regions receive additional sampling density; its value is calibrated empirically for each structural style to ensure that high-curvature regions (fault bends, unconformity surfaces) receive 2–4× higher sampling density than planar regions.

2.2.2. Knowledge-Driven Intersection Line Generation Algorithm (KILGA)

Based on the constructed meta-knowledge, the KILGA achieves intelligent extraction of geological interface intersection lines, as outlined in Algorithm 1. The algorithm employs an R*-tree spatial index [33] to organise geological surface patch data, reducing the average query complexity from O(n) (linear scan) to O(log n).
Algorithm 1: KILGA
  • Input: Surface set S = { S 1 , S 2 , , S n } , knowledge graph KG
  • Output: Intersection lines I L = { L 1 , L 2 , L m }
  • Initialise R t r e e index R T with surfaces in S
  • For each surface pair ( S i , S j ) in S :
  •         Query KG for geological constraints C ( S i , S j )
  •         If spatial_intersection_possible ( S i , S j ) :
  •             candidates ← SAT_GJK_intersection ( S i , S j )
  •             filtered ← apply_geological_rules (candidates, C ( S i , S j ) )
  •             IL ← IL ∪ {connect_valid_points (filtered)}
  • Return IL
For triangular mesh surfaces M1 and M2, the algorithm constructs AABB trees, prunes non-intersecting subtree pairs, and calculates precise intersection segments using Equation (6). Connected segments form continuous intersection lines, with topological validity verified through combinatorial topology [34]:
v V d e g ( v ) = 2 E + χ G B

2.2.3. Hierarchical Adaptive Mesh Refinement (HAMR-APEE)

To address aliasing and staircase artefacts in conventional geological modelling, the HAMR-APEE algorithm, as detailed in Algorithm 2, employs the Zienkiewicz–Zhu error estimator based on gradient recovery [35].
Algorithm 2: HAMR-APEE
  • Input: Initial mesh M 0 , error threshold η t o l , geological surfaces S u r
  • Output: Refined mesh M r e f
  • Initialise current mesh M k = M 0
  • Repeat:
  •    For each element τ in M k do:
  •       Compute η τ using Equation (12)
  •        If η τ > θ · max τ η τ :mark τ for refinement
  •    Apply red–green refinement to marked elements
  •    Update mesh connectivity (DCEL structure)
  •    Validate geological constraints from KG
  • Until convergence or maximum iterations
  • Return M r e f
For discrete geological surface representation s h , the local error on element τ is:
η τ = ( τ σ σ h 2 d ζ ) 1 / 2
where σ is the gradient recovery operator using super-convergent patch recovery (SPR):
σ = i N i ( x ) · σ ^ i
with σ ^ i obtained through nodal least-squares fitting and N i being a shape function.
Geological surfaces adopt quadtree structures and geological bodies adopt octree structures [36]. The refinement criterion is:
η τ > θ · max τ   η τ
where θ [ 0 , 1 ] . Refinement employs a red–green strategy: red refinement subdivides one triangle into four similar triangles, while green refinement addresses hanging nodes [37].
In this study, the refinement fraction θ is fixed at 0.5, meaning elements with an error exceeding 50% of the maximum element error are marked for refinement. The error threshold η t o l is set to 0.3 for initial refinement iterations and progressively reduced to 0.1 for final iterations. Convergence is declared when the global relative error change between consecutive iterations falls below 2%, i.e., η ( k ) η ( k 1 ) / η ( k 1 ) < 0.02 , or when the maximum iteration count (set to 8) is reached. In practice, convergence was typically achieved within 4–6 iterations for all three study areas (see Table 1).
In high-gradient regions (fault zones, unconformity surfaces), anisotropic refinement is applied with a metric tensor:
M = R T h 1 2 0 0 h 2 2 R
where R is the rotation matrix along the principal directions, and h 1 , h 2 are target mesh sizes permitting larger elements along fault strikes and finer elements perpendicular to faults [38].

2.2.4. Fault Intersection Line Refinement

The quality of fault intersection lines directly affects structural modelling accuracy. A fault plane intersection refinement algorithm processes hanging-wall and footwall intersection lines. Fault kinematic constraints require:
s · n = s cos θ
where s is the slip vector and n is the fault plane normal.
Stratigraphic correspondence is validated using Allan diagram technology [39]:
z h w ( x , y ) = z f w ( x , y ) + d d ( x , y )
where z h w and z f w are hanging-wall and footwall stratigraphic depths, and d d is fault displacement.
Intersection line smoothing employs shape-preserving cubic spline interpolation [40], with control point optimisation minimising the energy functional:
E = λ | κ ( s ) 2 | d s + ( 1 λ ) | d i | i 2
balancing smoothness ( κ : curvature) and data fidelity ( d i : distance from original line).

2.2.5. Specialised Thrust-Fault Modelling Algorithm (STFMA)

Reverse/thrust faults present unique modelling challenges due to low-angle fault planes (typically < 45°), hanging-wall stratigraphic repetition, and listric/ramp–flat geometries [41]. Fault plane geometry is described by piecewise functions:
θ ( z ) = θ r a m p z [ z 1 , z 2 ] θ f l a t z [ z 2 , z 3 ]
Fault plane reconstruction employs the radial basis function (RBF) implicit surface method [42], with the fault surface as the zero isosurface:
f ( x ) = i = 1 N w i ϕ ( | x x i | ) + p ( x ) = 0
using multiquadric basis functions φ ( r ) = r 2 + c 2 . The RBF interpolation incorporates kinematic constraints: f · s = | s | for hanging-wall displacement. In regions with complex geometry, the Extended Finite Element Method (XFEM) [43] handles displacement discontinuities through Heaviside enrichment functions:
u h ( x ) = i N i ( x ) u i + j N j ( x ) H ( x ) a j

2.2.6. Sublayer Division Constrained by Sequence Stratigraphy

Sublayer division employs wavelet transform-based sequence boundary identification [44], with boundaries corresponding to the modulus maxima of the wavelet coefficients. High-frequency depositional cycle recognition follows Milankovitch cyclostratigraphy [45], and multi-well correlation uses dynamic time warping [46]. A hierarchical geological unit management system supports multi-scale queries from regional structural units to sublayer units, implemented using the composite pattern [47].

2.2.7. Logical Sub-Surface Recognition

Logical sub-surface recognition abstracts the geological boundary network as a planar graph G = (V, E), employing DCEL data structures for topological information storage and half-edge chain traversal to identify enclosed regions [48]. Recognised sub-surfaces inherit attribute information through spatial centroid queries.

2.3. Visualisation and Bidirectional Linkage

The knowledge graph visualisation employs an improved force-directed layout algorithm [49] with Louvain community detection for semantic clustering [50]. Three-dimensional geological model rendering uses WebGL 2.0 with frustum culling, occlusion culling, and LOD switching [51,52].
Critically, bidirectional data binding between knowledge graphs and three-dimensional models employs a publish–subscribe pattern [53]. When knowledge graph node attributes are modified, corresponding geometric update events are triggered. An incremental update strategy rebuilds only affected local regions, with transaction mechanisms ensuring data consistency [54,55].

2.4. Model Validation and Quality Assessment

Geometric accuracy is assessed through deviation statistics against original interpretation data. For modelling surface Smodel and interpretation point set Pinterp:
R M S E = 1 n i = 1 n d ( p i , S mod e l ) 2
E max = max i   d ( p i , S mod e l )
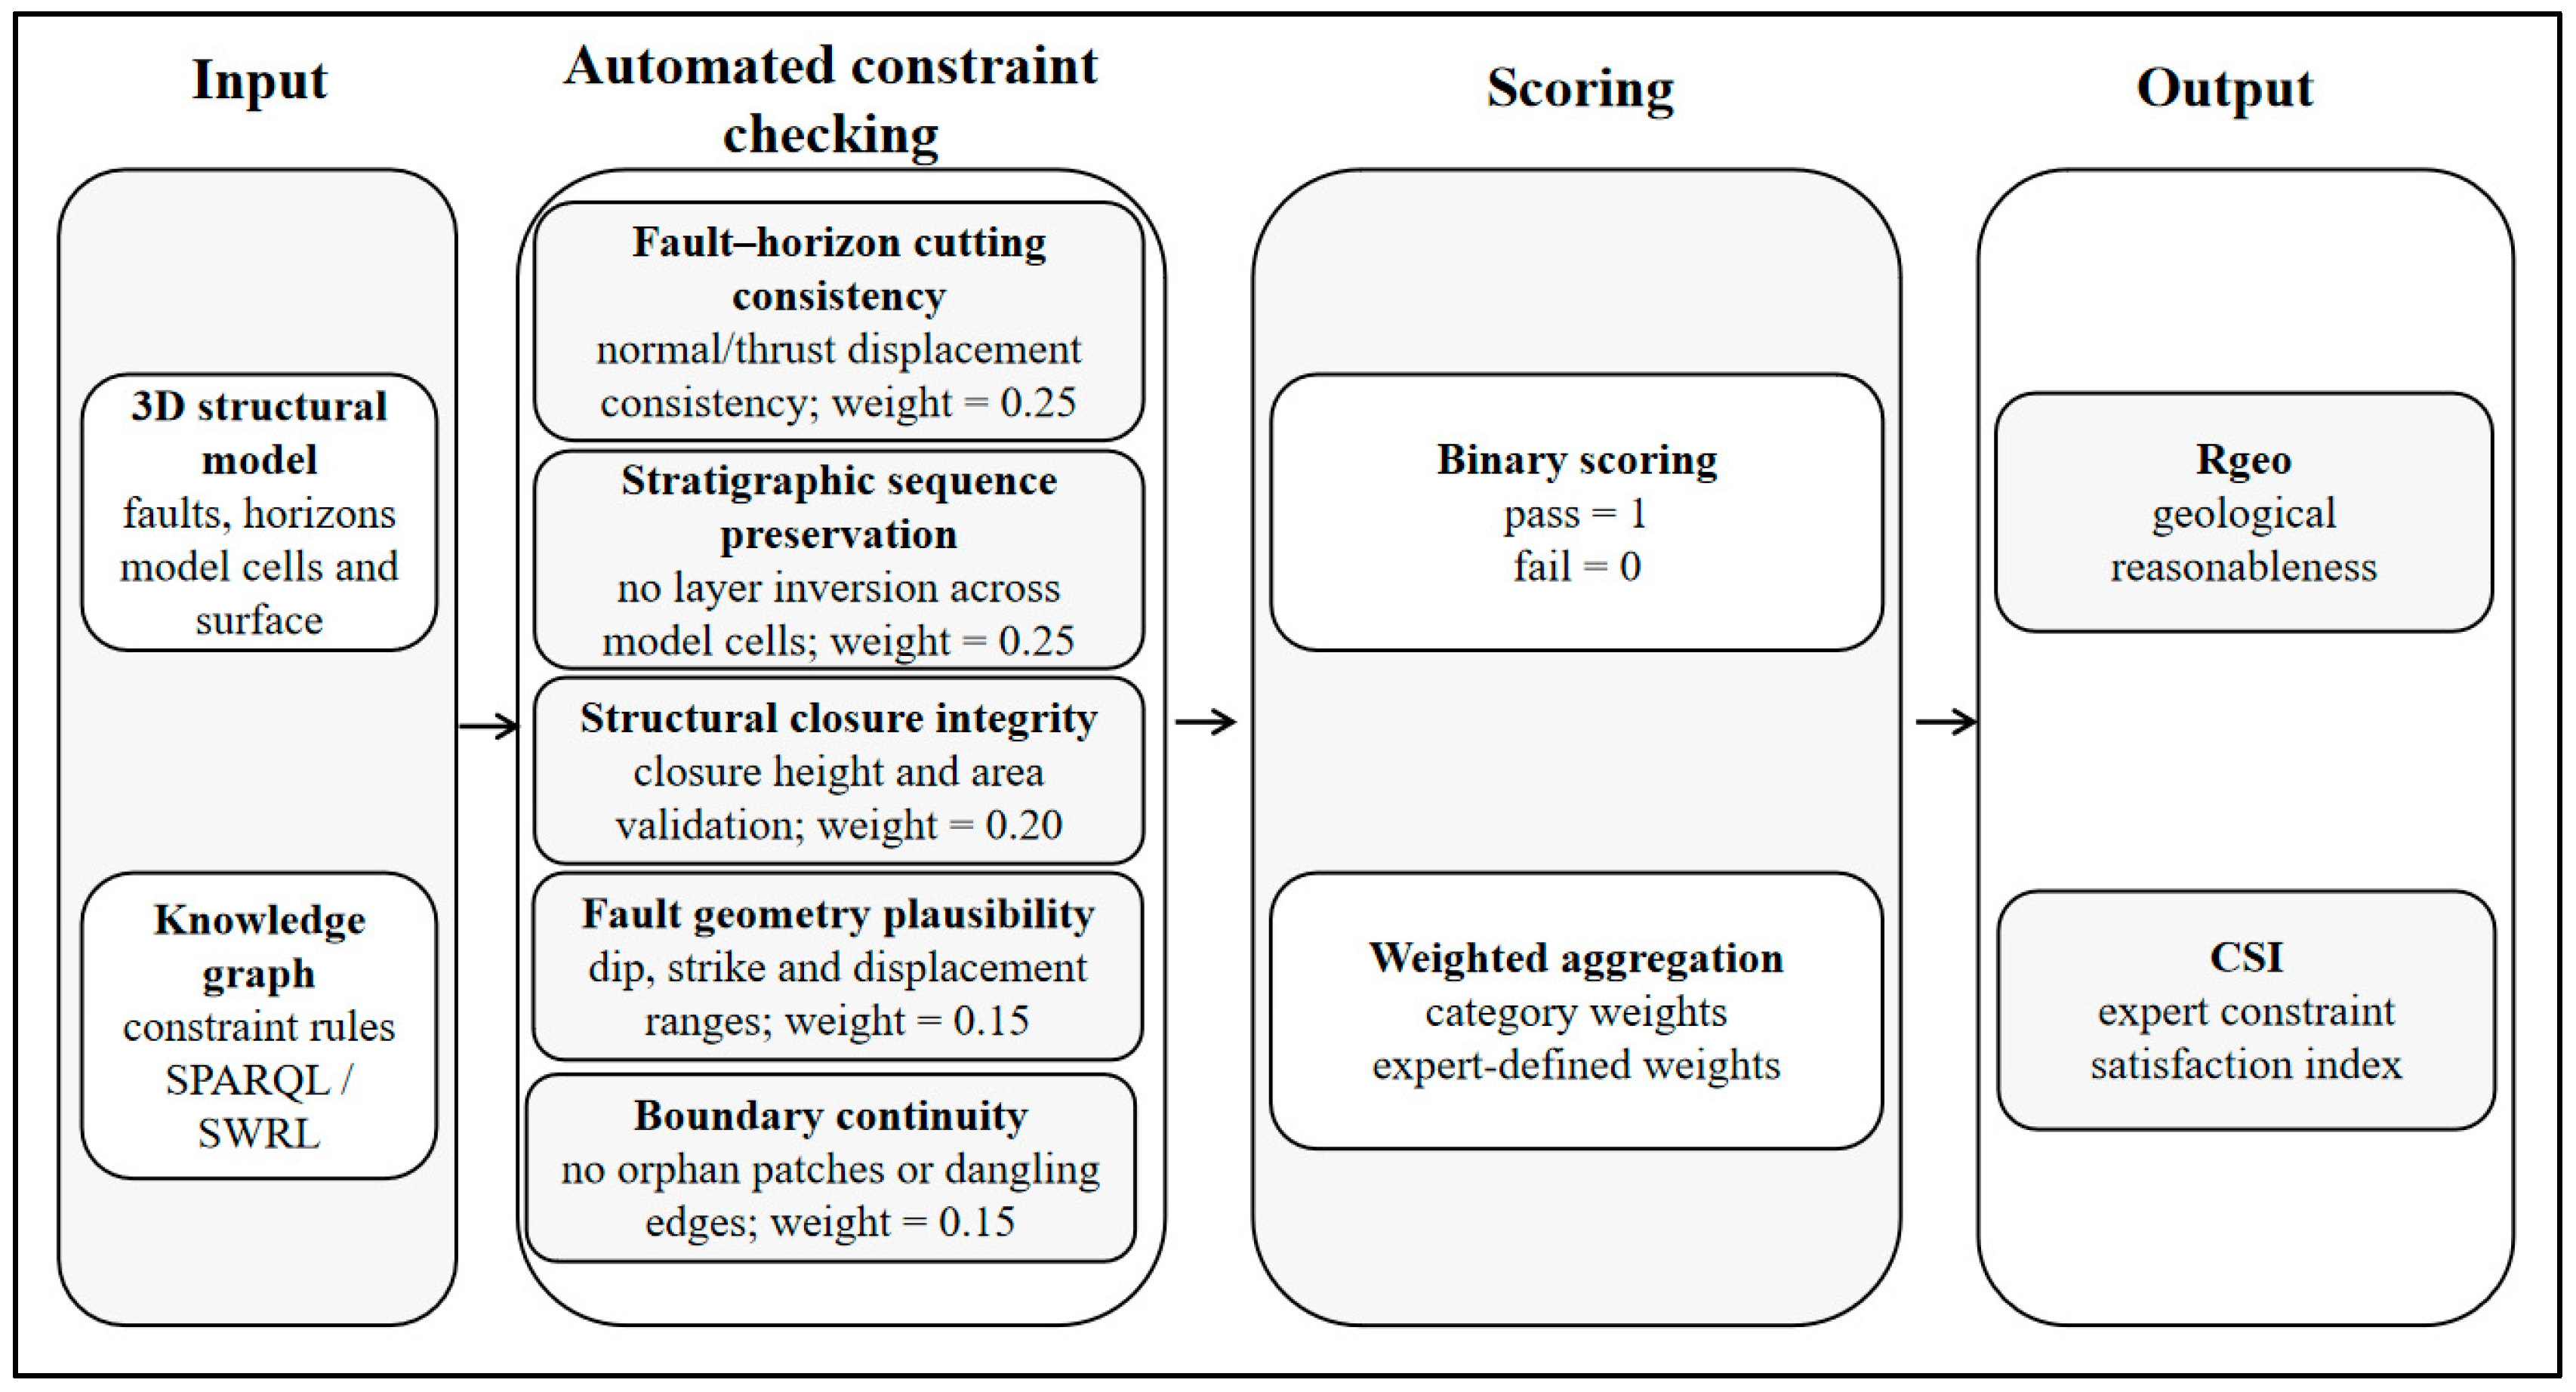
Geological reasonableness validation employs knowledge graph reasoning engines to verify constraint satisfaction [56], as illustrated in Figure 3:
R g e o = N s a t i s f i e d N t o t a l × 100 %
Specifically, R g e o is evaluated through automated verification of five categories of geological constraints, each assessed via knowledge graph SPARQL queries:
(i)
Fault–horizon cutting consistency (weight w 1 = 0.25) verifies whether fault displacement directions and magnitudes are consistent with the interpreted fault type (e.g., normal faults exhibit hanging-wall downthrow, thrust faults exhibit hanging-wall upthrow).
(ii)
Stratigraphic sequence preservation ( w 2 = 0.25) checks whether the chronological ordering of stratigraphic layers is maintained without inversions across all model cells.
(iii)
Structural closure integrity ( w 3 = 0.20) validates whether anticline and syncline closures are geometrically well-defined, with closure heights and areas within ranges consistent with seismic interpretation.
(iv)
Fault geometry plausibility ( w 4 = 0.15) verifies that fault dip angles, strike orientations, and displacement profiles fall within geologically reasonable ranges defined in the knowledge graph.
(v)
Boundary continuity ( w 5 = 0.15) checks whether horizon surfaces maintain geometric continuity across fault blocks without orphaned patches or dangling edges.
Each constraint is evaluated as binary (pass = 1/fail = 0). R g e o is computed as the weighted sum:
R g e o = i = 1 5 w i · n p a s s , i n t o t a l , i
where n p a s s , i and n t o t a l , i are the number of passed and total constraint checks in category i , respectively.
As an illustrative example, in the Wangyaonan Block, 66 fault–horizon intersection relationships were tested against all five constraint categories, yielding a total of 330 individual constraint checks. Of these, 317 passed ( R g e o = 96.2%). The 13 failures comprised: 4 cases of marginal fault geometry plausibility (minor faults with dip angles deviating 2–3° from the defined acceptable range), 1 case of fault–horizon cutting inconsistency (an ambiguous fault type classification), and 8 cases of boundary continuity issues at model edges where horizon surfaces were truncated by the model boundary rather than by geological features.
Expert knowledge constraint satisfaction uses a weighted indicator [57]:
S c o n s t r a int = k w k · f k ( c k )
where w i is constraint weight and s i is the satisfaction function (binary for hard constraints, continuous for soft constraints).
The CSI distinguishes between hard constraints and soft constraints. Hard constraints represent inviolable geological rules (e.g., no self-intersecting fault surfaces, no stratigraphic sequence inversions) and are evaluated as binary functions: s i ( M ) { 0 , 1 } . Soft constraints represent geological preferences (e.g., preferred smoothness levels, expected thickness ratios) and are evaluated as continuous functions: s i ( M ) [ 0 , 1 ] , where the value reflects the degree of satisfaction. Hard constraints are assigned weights w i 0.3 to reflect their critical importance, while soft constraints receive weights 0.05 w i 0.2 . The weight assignments are determined through consultation with domain experts and normalised such that w i = 1 .

3. Results

3.1. Geological Setting

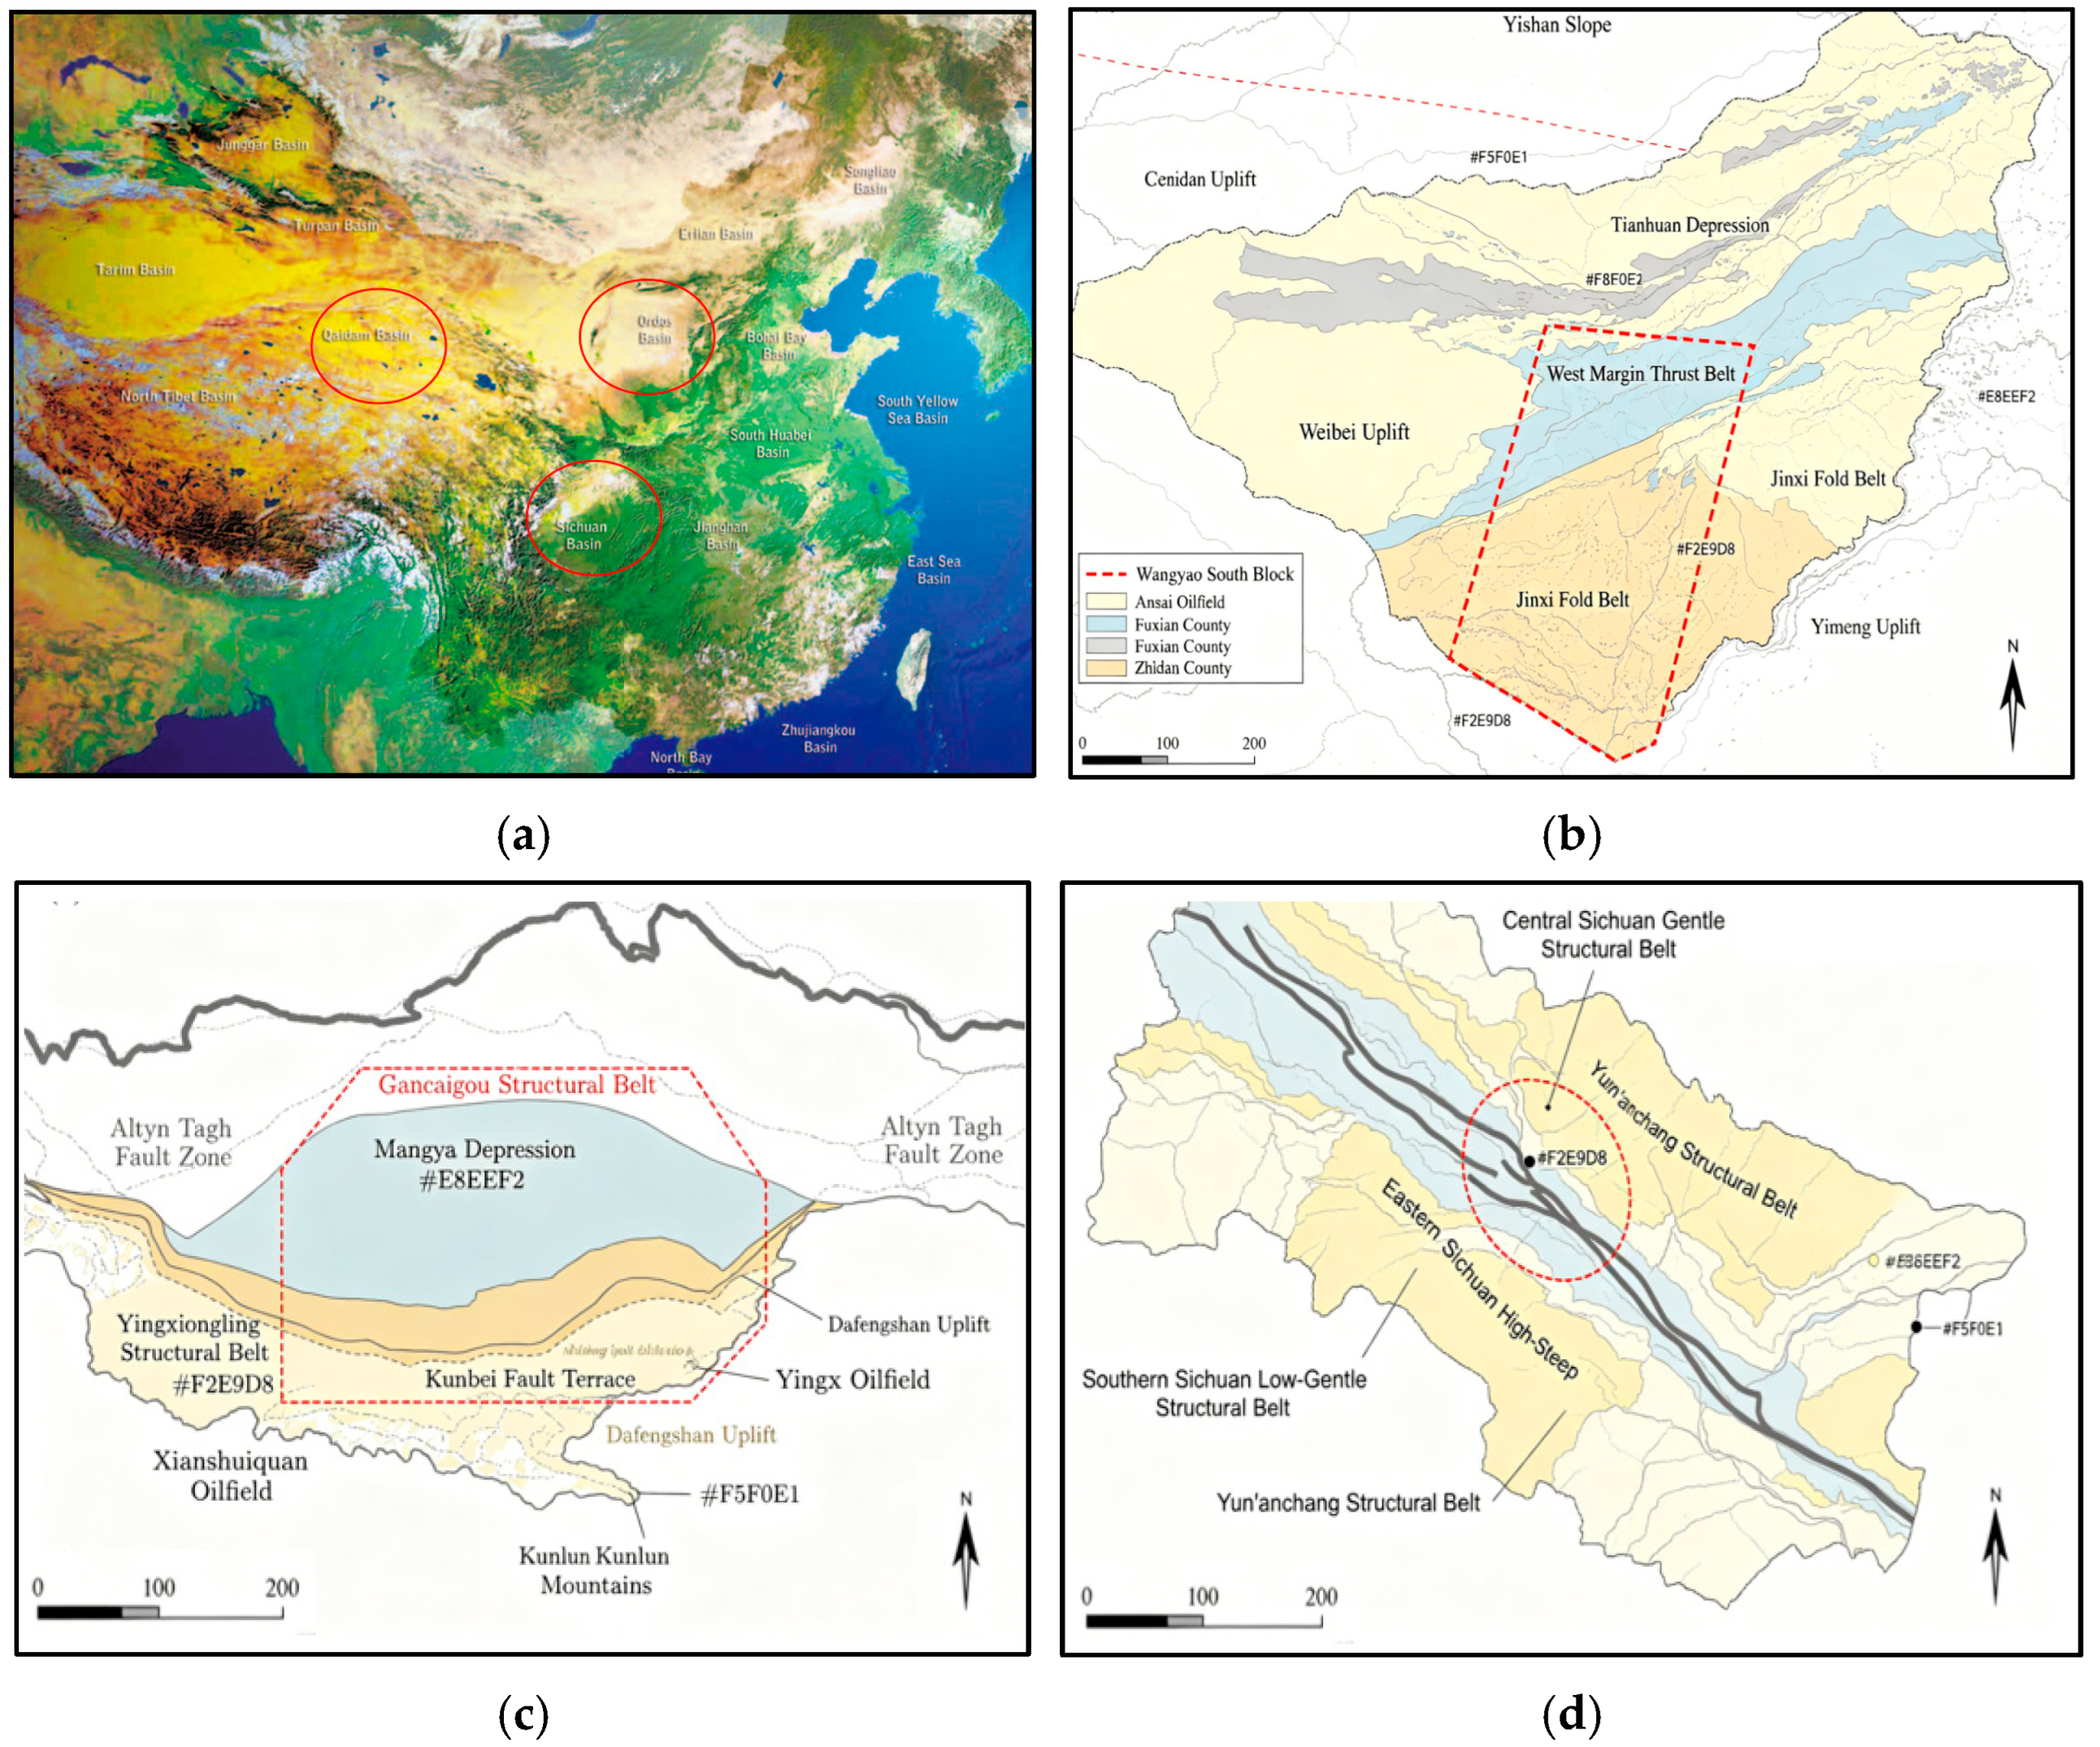
This study selects three representative petroliferous basins in China to validate the proposed methodology (Figure 4). These basins represent three fundamentally different structural styles commonly encountered in petroleum exploration: intracratonic micro-amplitude structures (Ordos Basin), compressional thrust-nappe systems (Qaidam Basin), and deep buried structures in superimposed basins (Sichuan Basin).
The Wangyaonan Block is located in the central eastern part of the northern Shaanxi slope in the Ordos Basin. Structurally, it lies within the transitional zone from the Yishan slope to the Tianhuan Depression, generally displaying a westward dipping, broad and gentle monoclinic structure with locally developed minor-amplitude nose-like uplifts and structural ridges. During the Yanchang Formation depositional period, influenced by Yanshanian tectonic movements, a series of low-order fold structures trending NE–SW and nearly E–W were formed, with structural amplitudes generally ranging from 5 to 15 m. This represents a typical geological characteristic of minor-amplitude structural–lithological composite reservoirs in stable intracratonic regions. The Ordos Basin is one of the largest intracratonic basins in China, hosting extensive tight gas and oil reservoirs where subtle structural closures play decisive roles in hydrocarbon accumulation [4]. Its stable tectonic framework and gentle structural relief make it an ideal test case for evaluating the method’s ability to capture micro-amplitude features that are easily over-smoothed by conventional interpolation approaches.
The Ganchaigou Structural Belt is located at the southern margin of the northern marginal thrust-nappe structural system of the Qaidam Basin, representing a typical compressive foreland basin structural style. The structural evolution experienced three main stages: Palaeozoic passive continental margin, Mesozoic initial compression, and Cenozoic intense compression. The Ganchaigou anticline features a nearly E–W axial trend with asymmetric limbs (southern limb 35–45°, northern limb 15–25°) and thrust-fault displacements generally ranging from 50 to 200 m, locally exceeding 500 m. The Qaidam Basin’s northern marginal thrust system records complex Cenozoic compressional tectonic evolution driven by the India–Asia collision and subsequent intracontinental deformation [5]. The structural complexity of this area, characterised by imbricate thrust sheets, fault-related folds, and listric fault geometries, provides a rigorous test case for the STFMA thrust-fault modelling algorithm.
The Fengjiawan concealed anticline is located in the northern part of Wanzhou District, belonging to the Yun’anchang structural belt within the eastern Sichuan fold-and-thrust belt. This deep buried structure features a NE–SW axial orientation (~15 km × 8 km, closure height 60–80 m) formed through superimposed basement-involved thrusting and cover-detached folding during Indosinian–Yanshanian tectonic movements. The Sichuan Basin’s eastern fold-and-thrust belt is characterised by polyphase tectonic superimposition, resulting in complex structural configurations that challenge both seismic imaging and three-dimensional modelling [27]. The deep burial depth (>4000 m) and multi-generational fault systems make this area particularly suitable for evaluating the HAMR-APEE adaptive mesh refinement algorithm’s capacity to eliminate aliasing artefacts.

3.2. Wangyaonan Block, Ordos Basin

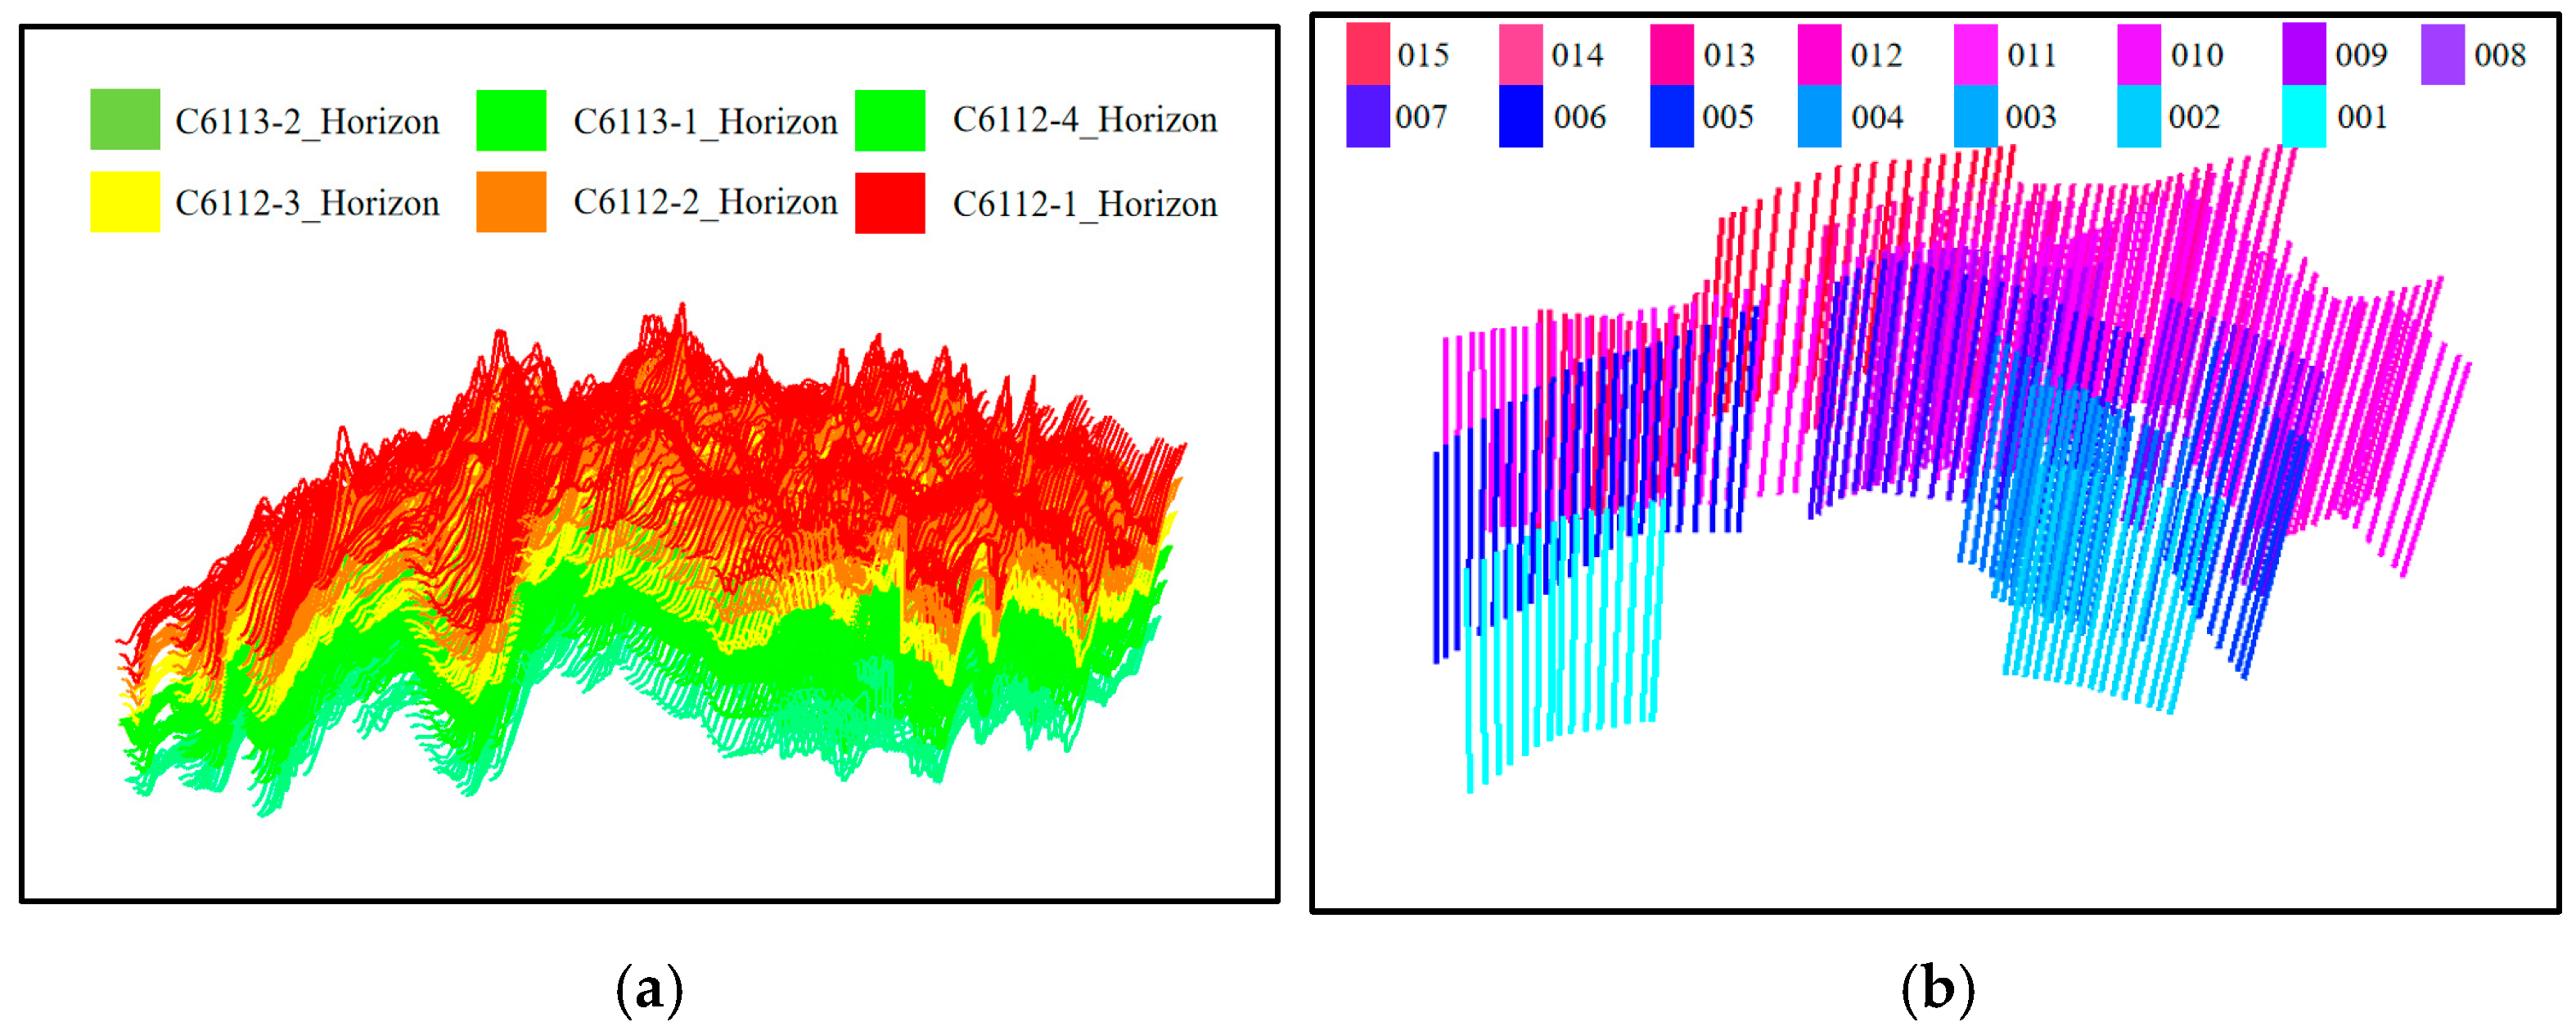
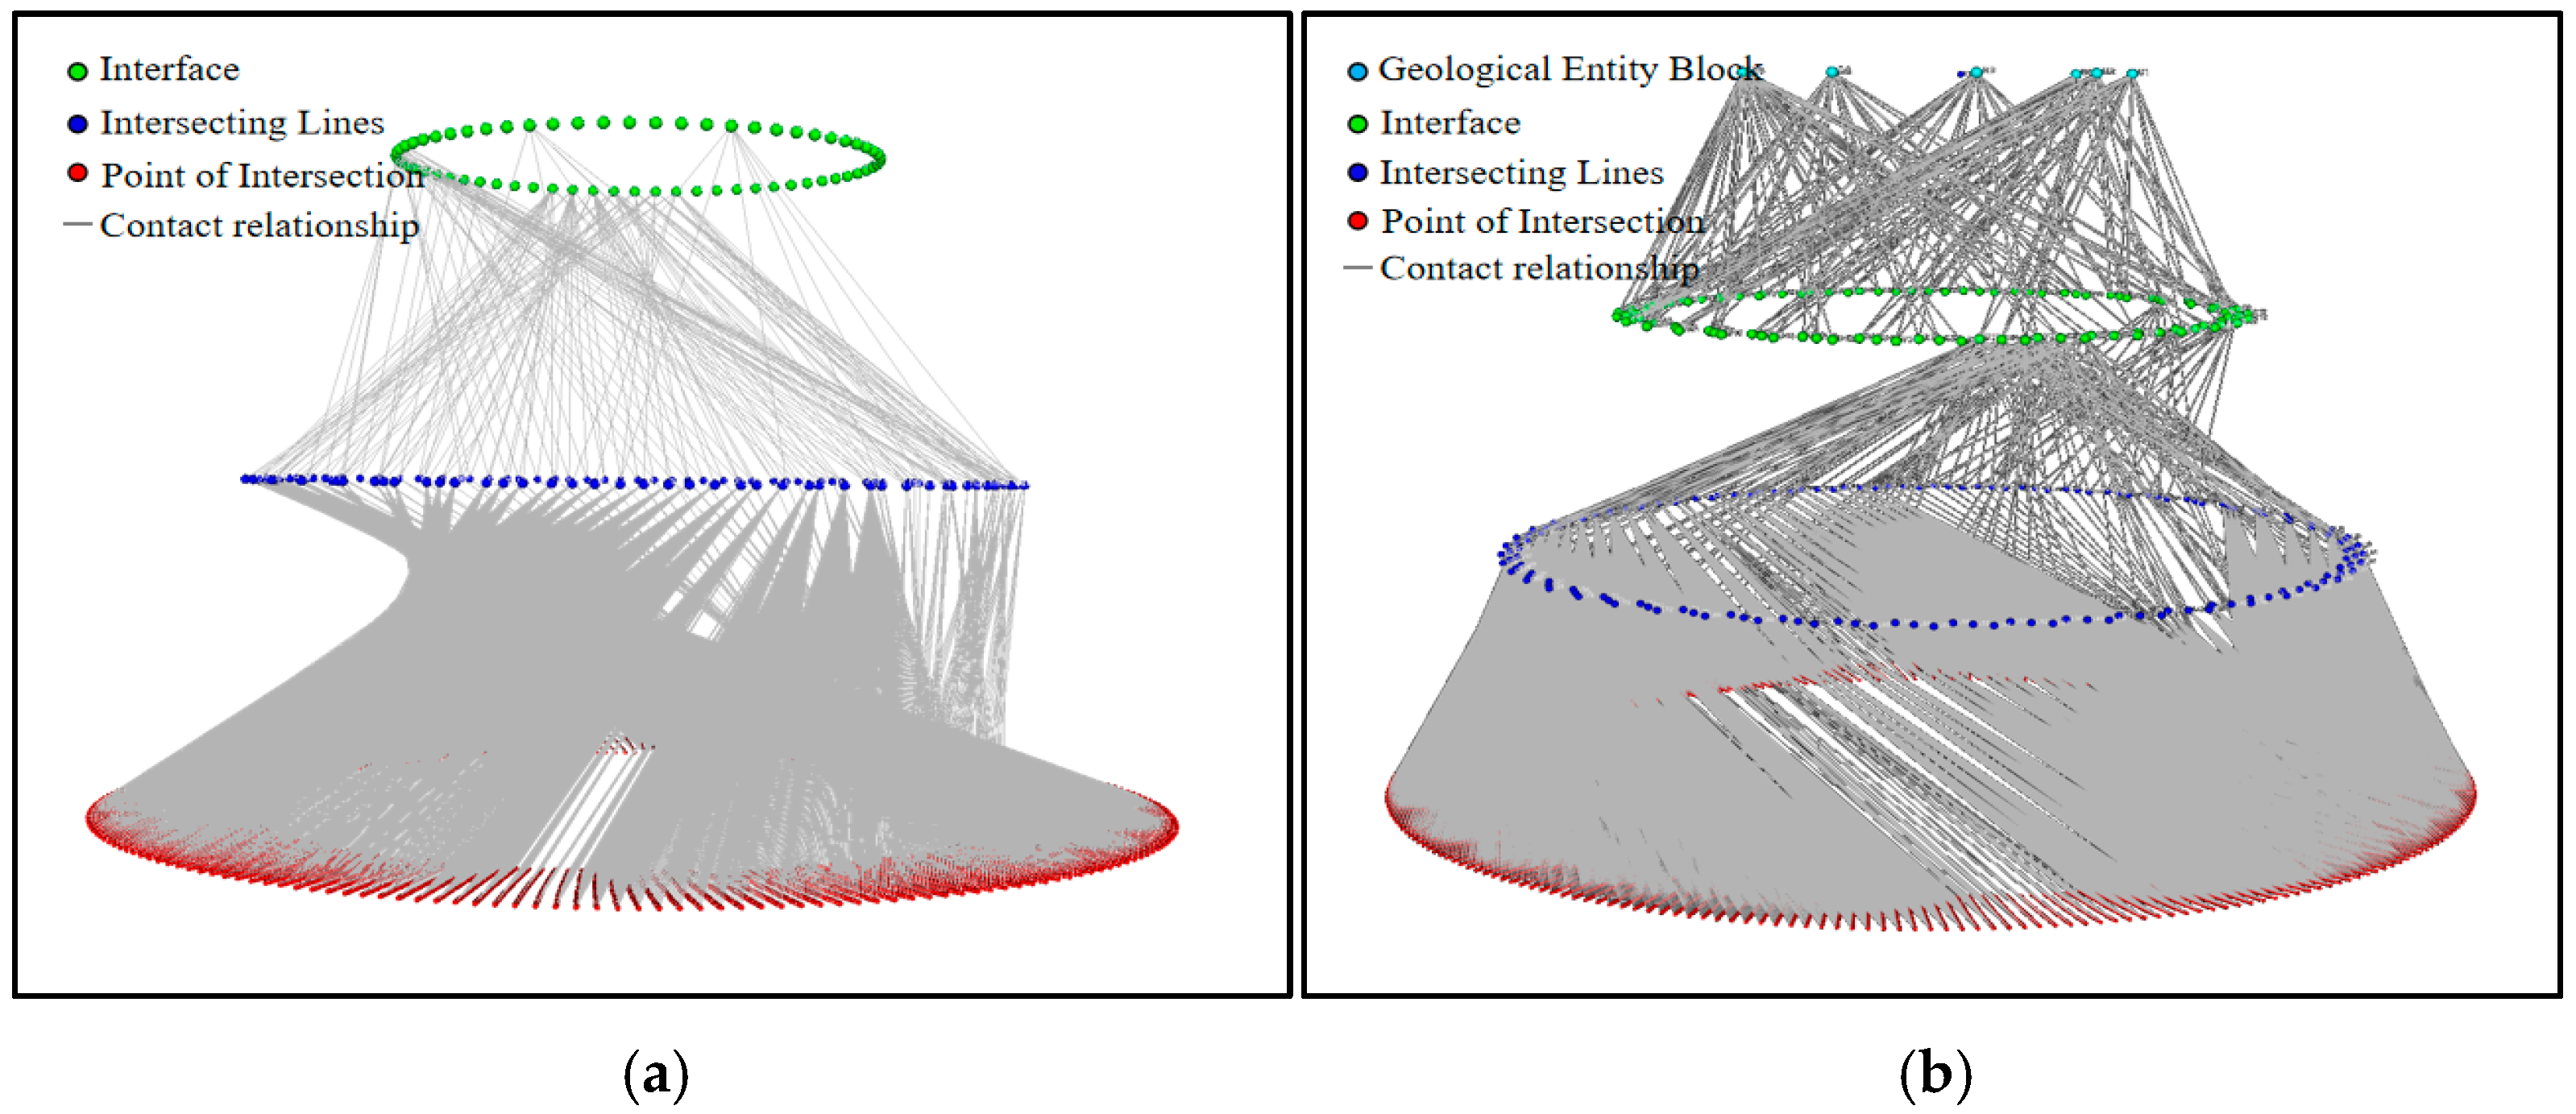
The Wangyaonan Block comprises 6 horizons and 15 major faults (Figure 5). This area is primarily characterised by the development of strike–slip faults with relatively complex fault systems, where local interpretations of horizons in the footwall of reverse faults are absent. A geological structural knowledge graph was constructed using the three-tier knowledge architecture (TKA) based on the Neo4j graph database. The system established a fundamental geological entity layer, a geological relationship layer with spatial topological relationships and genetic associations, and a structural reasoning layer with SWRL rules (Figure 6).
Through the KILGA, the system automatically identified 66 pairs of fault–horizon intersection relationships across 6 stratigraphic levels and 15 fault structures (Figure 7). Table 2 summarises the intersection statistics; the complete 66-pair intersection line data are provided in Supplementary Table S1.
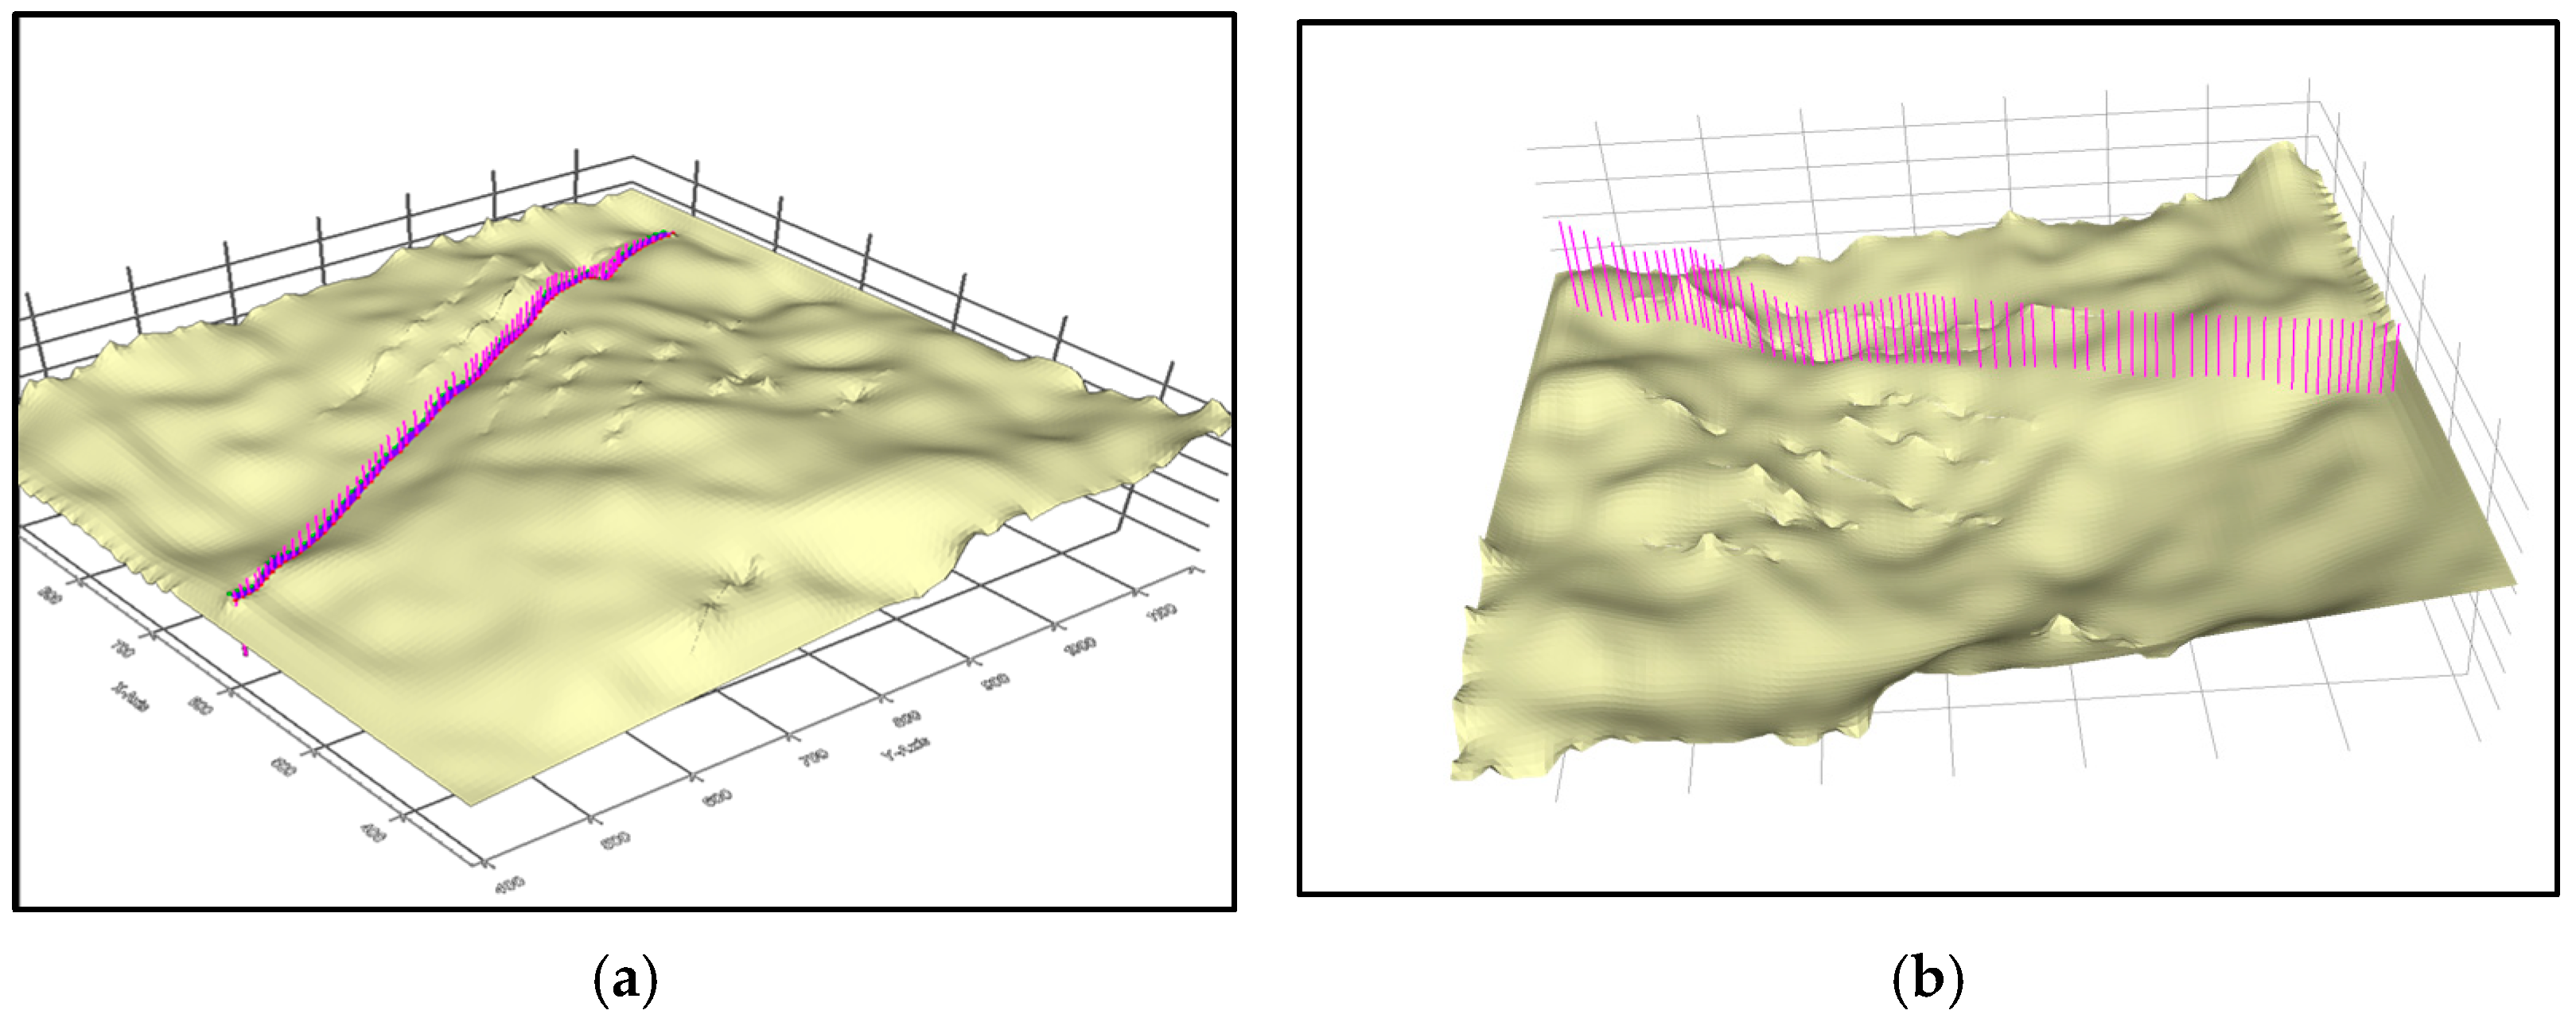
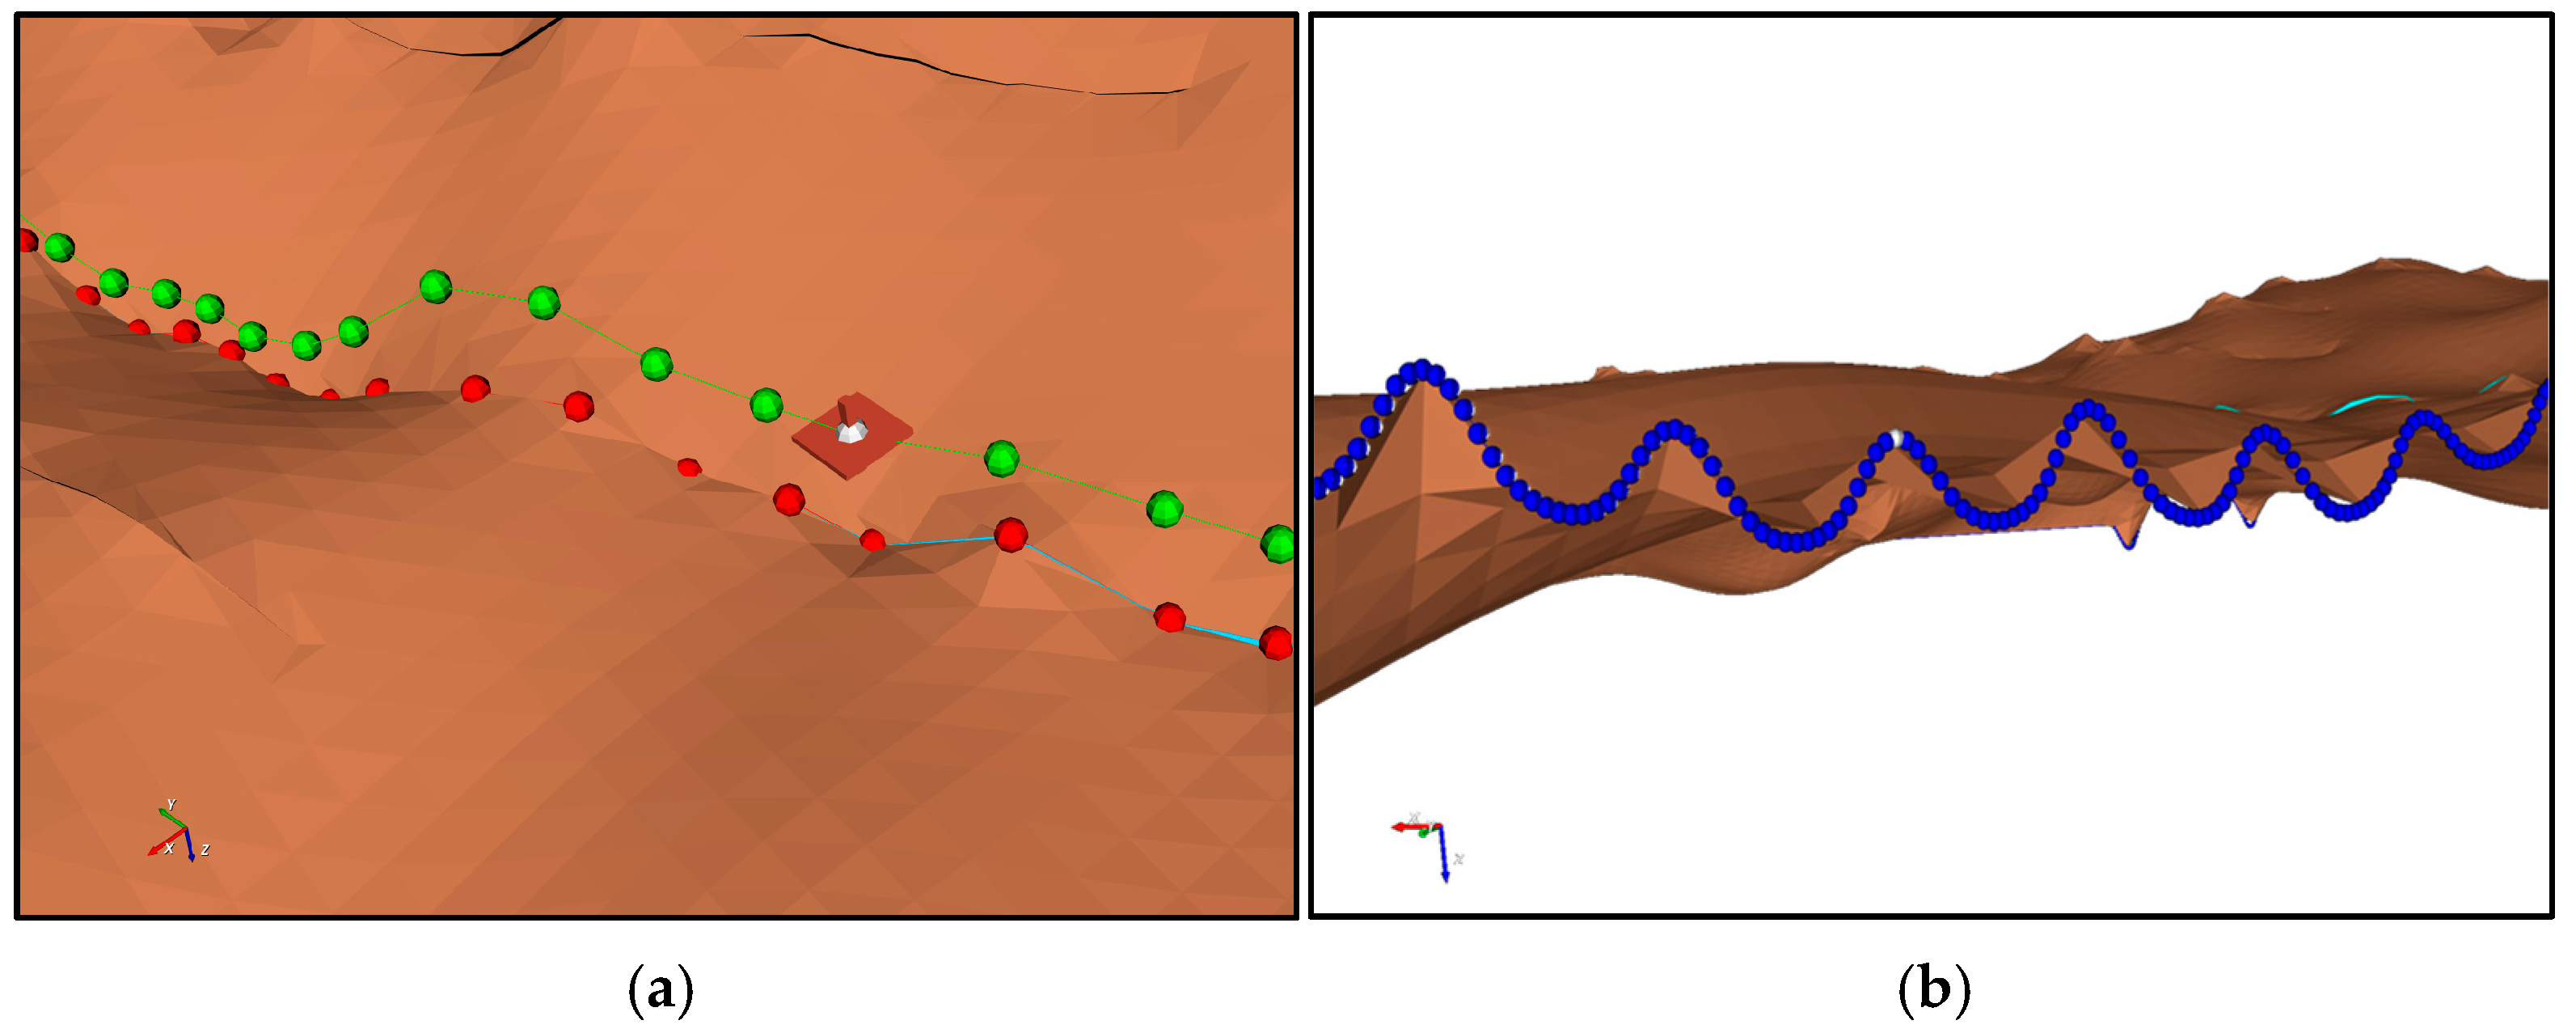
The three-layer quality control system verified meta-knowledge quality through geometric, topological, and semantic consistency checks. During the knowledge graph construction process, the system supported the interactive modification of intersection relationships with real-time updates to model intersection line data and structural models. Figure 8 demonstrates the model change effects before and after removing the intersection relationship between the C6112-1_Horizon and fault 011.
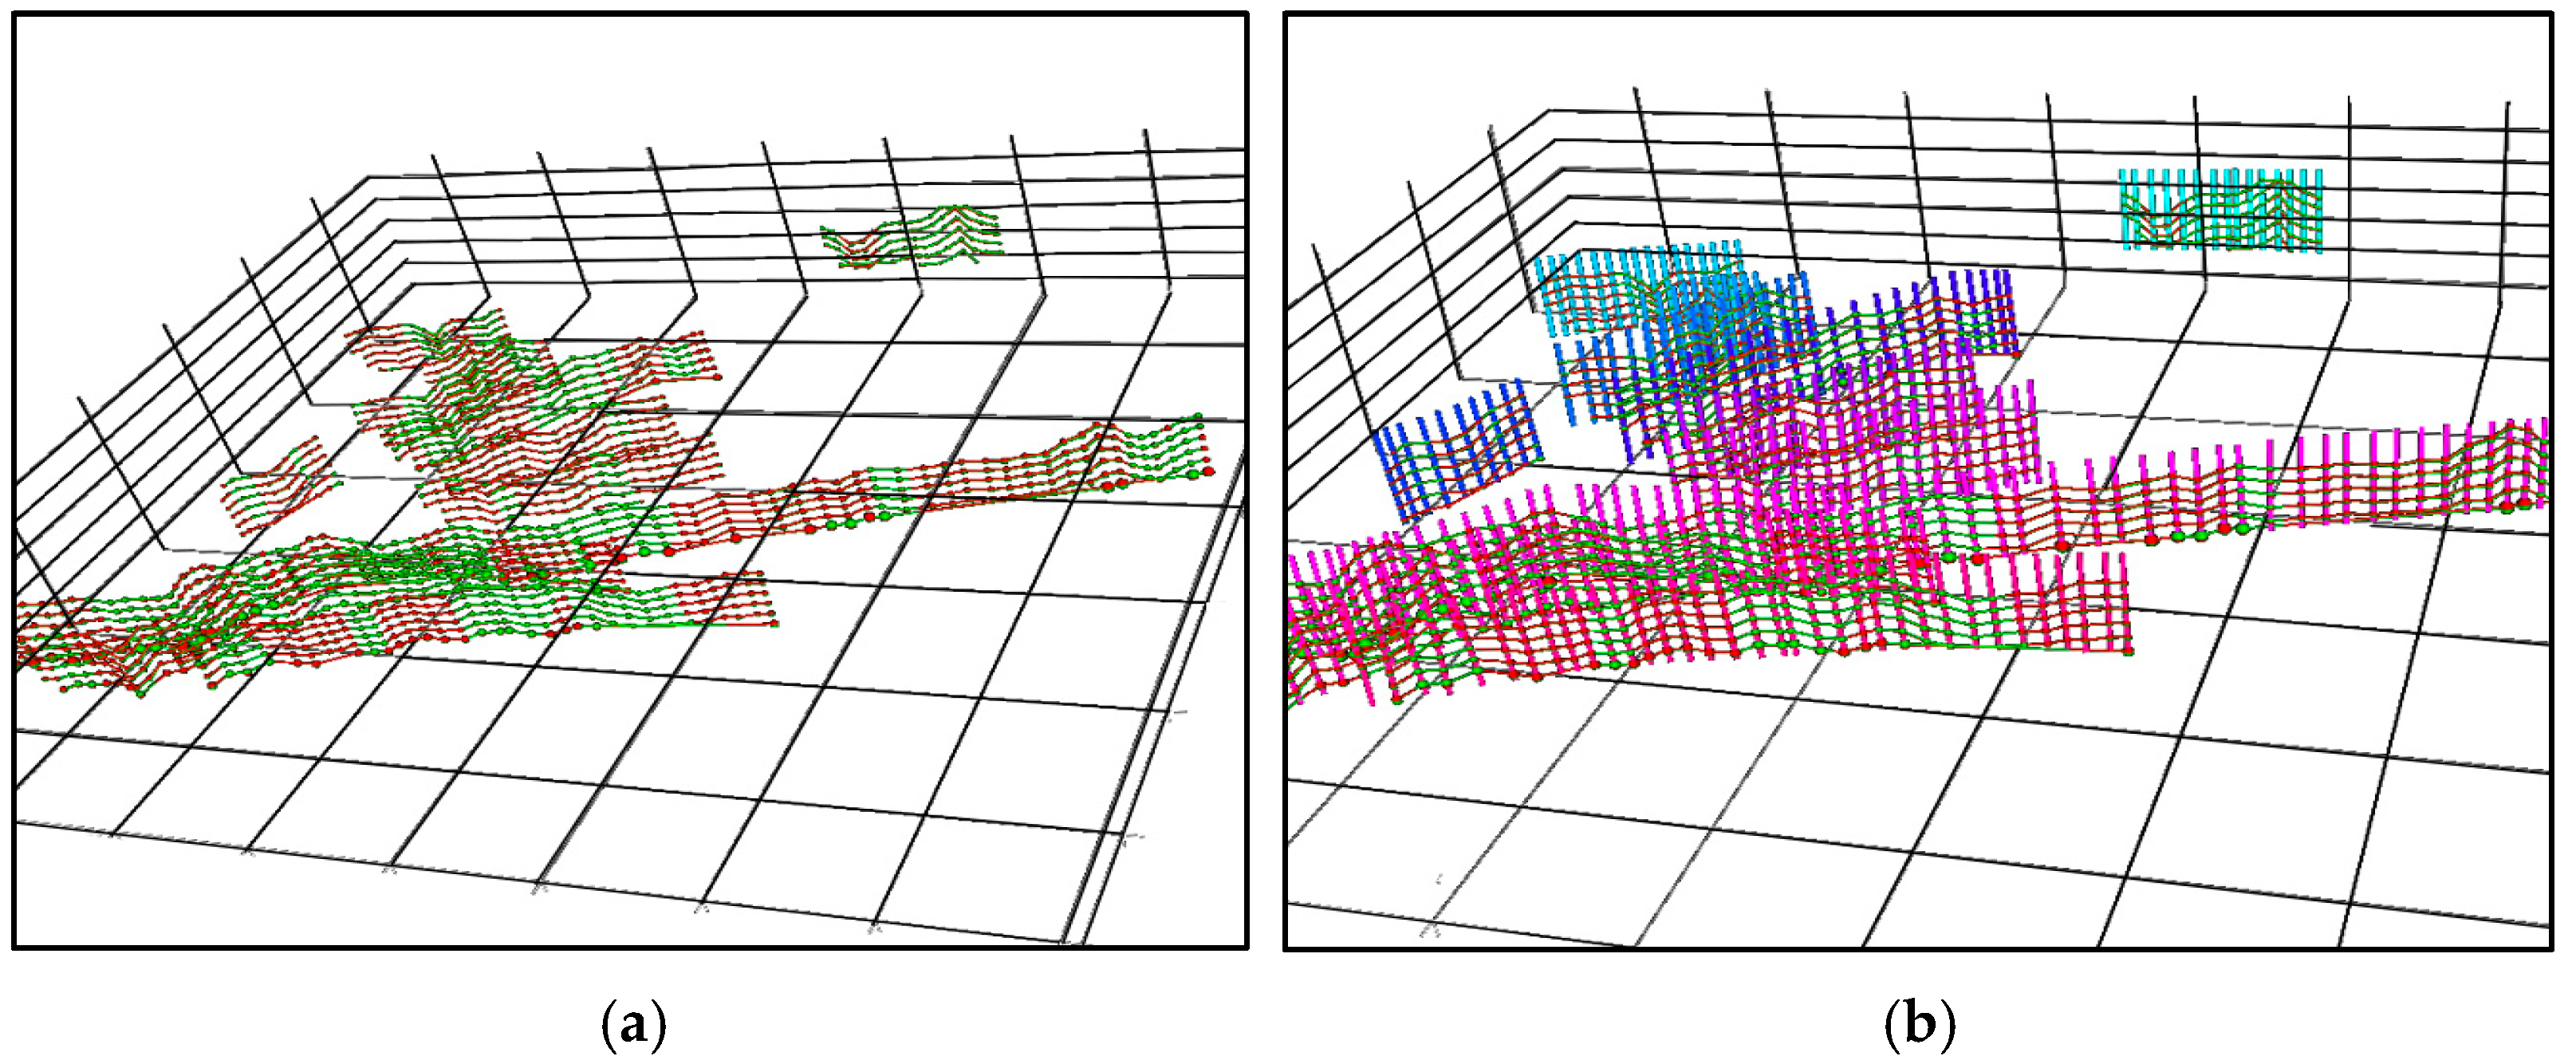
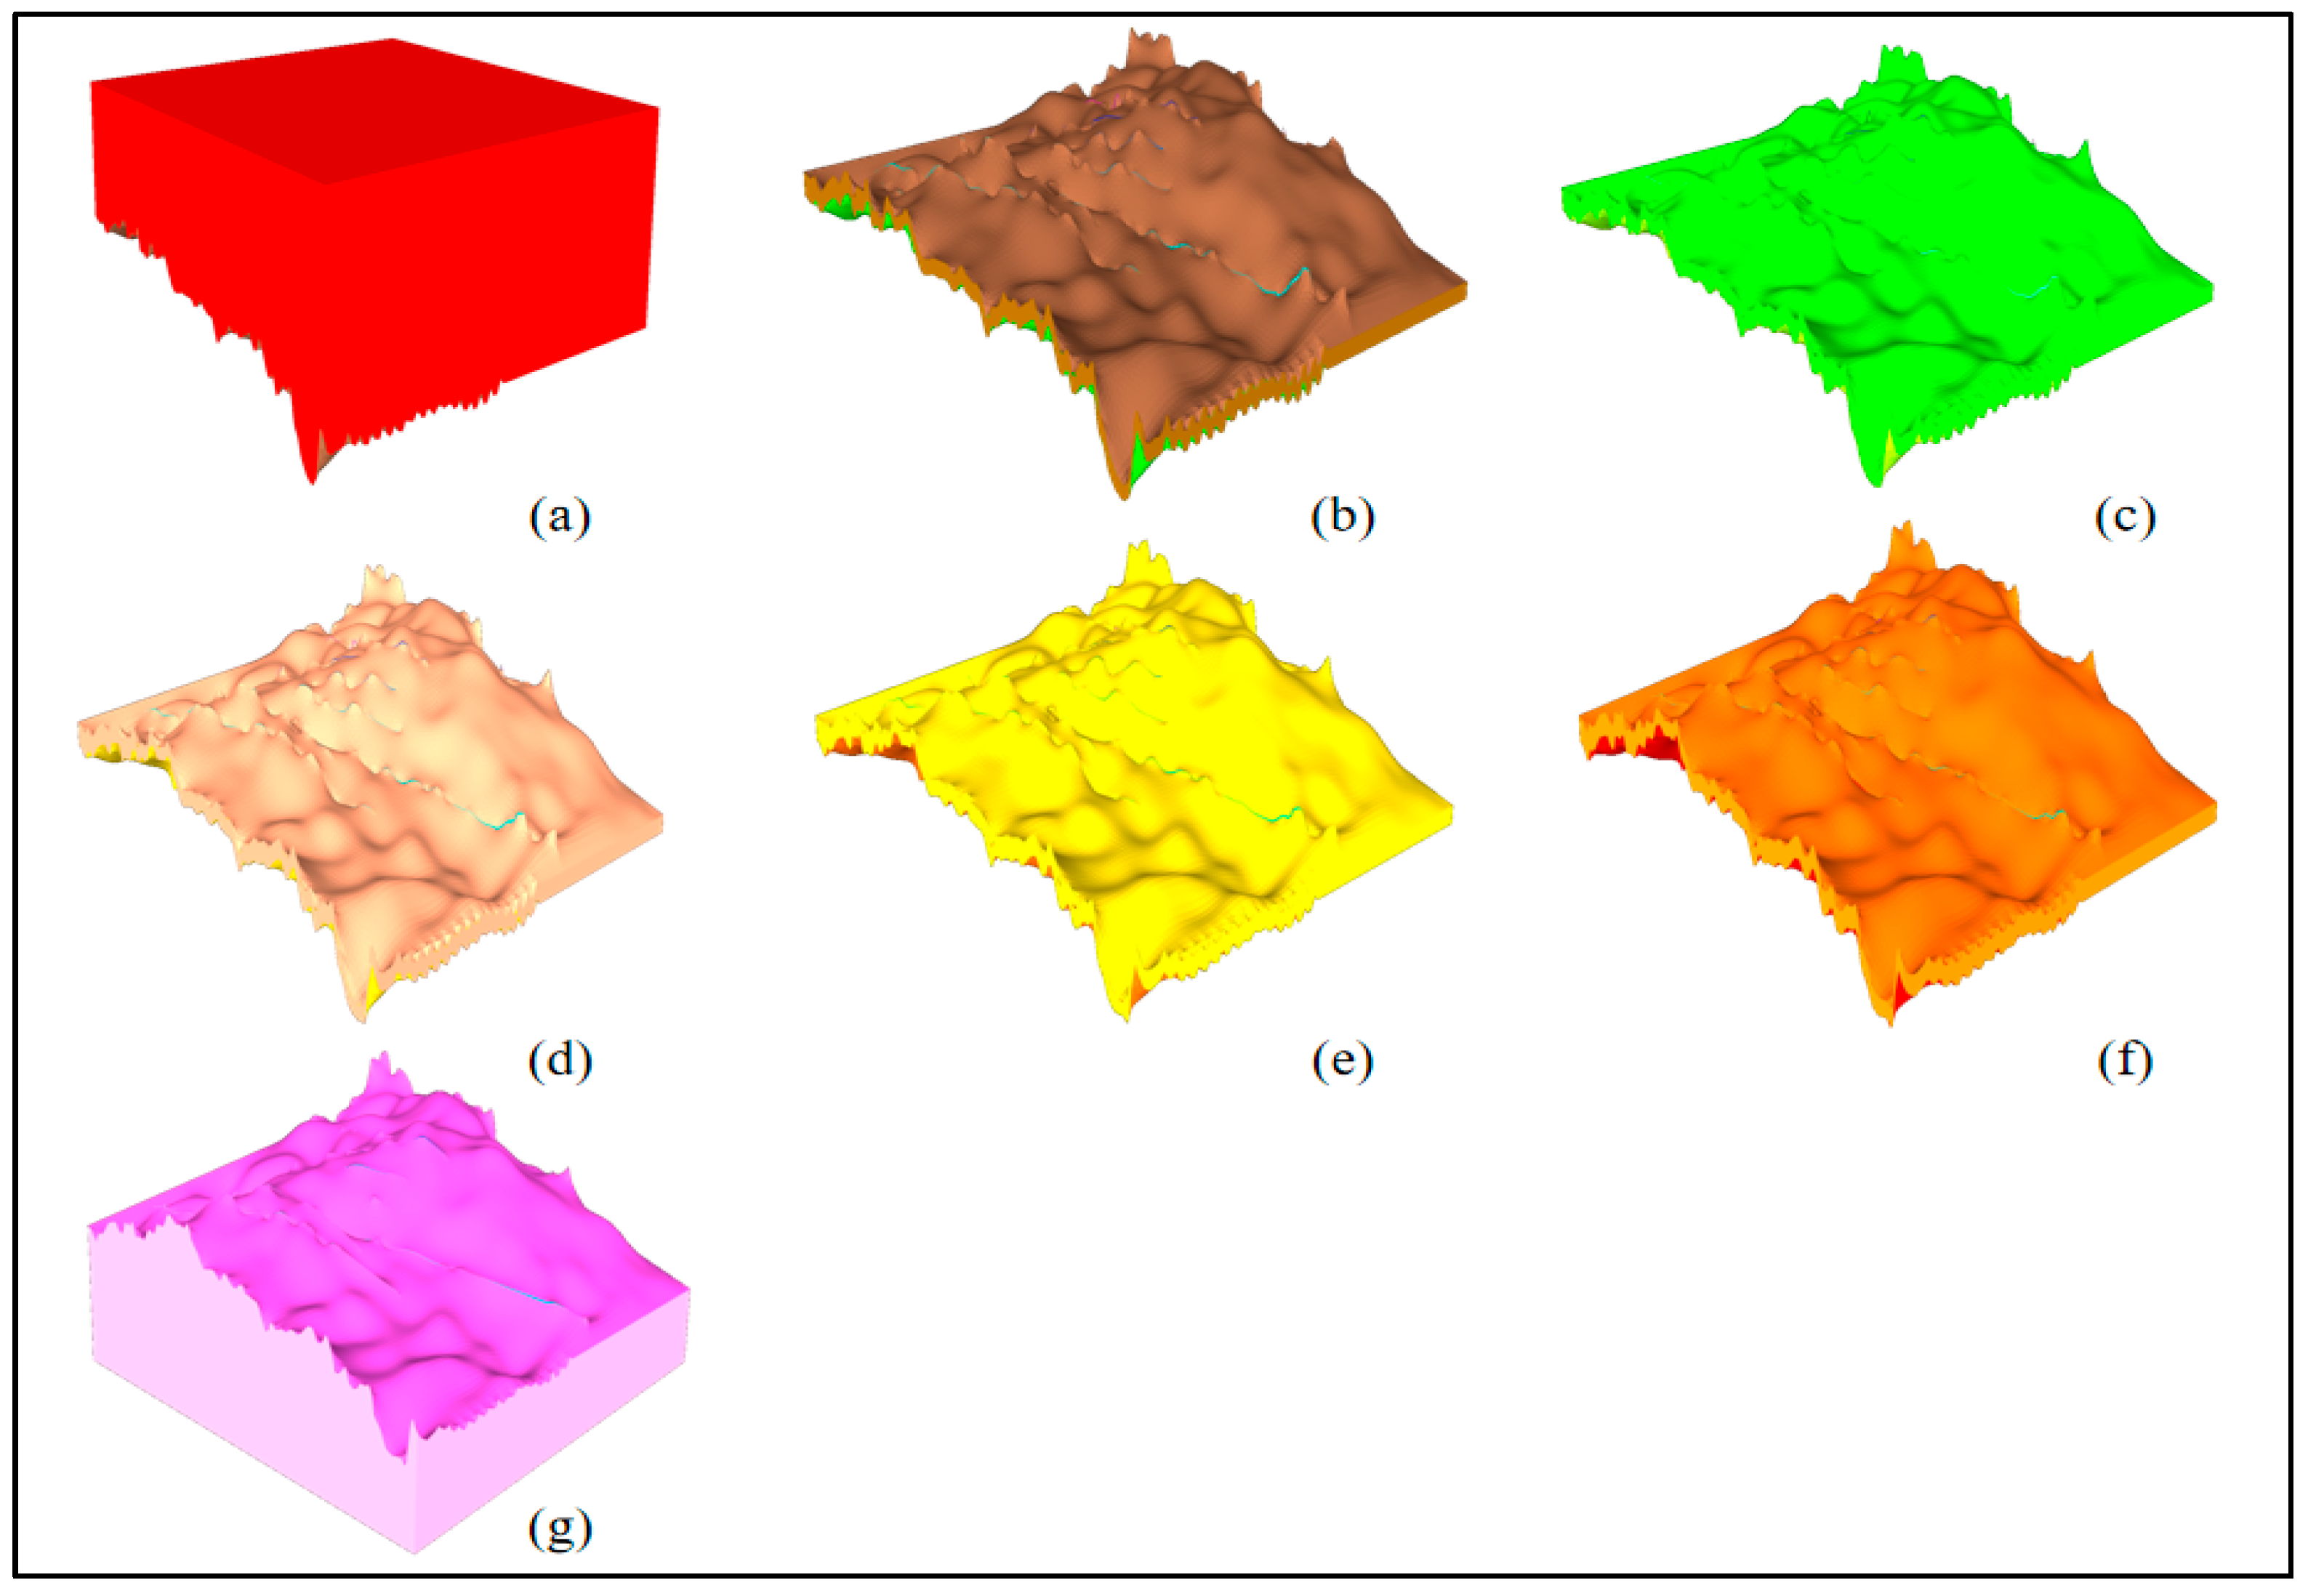
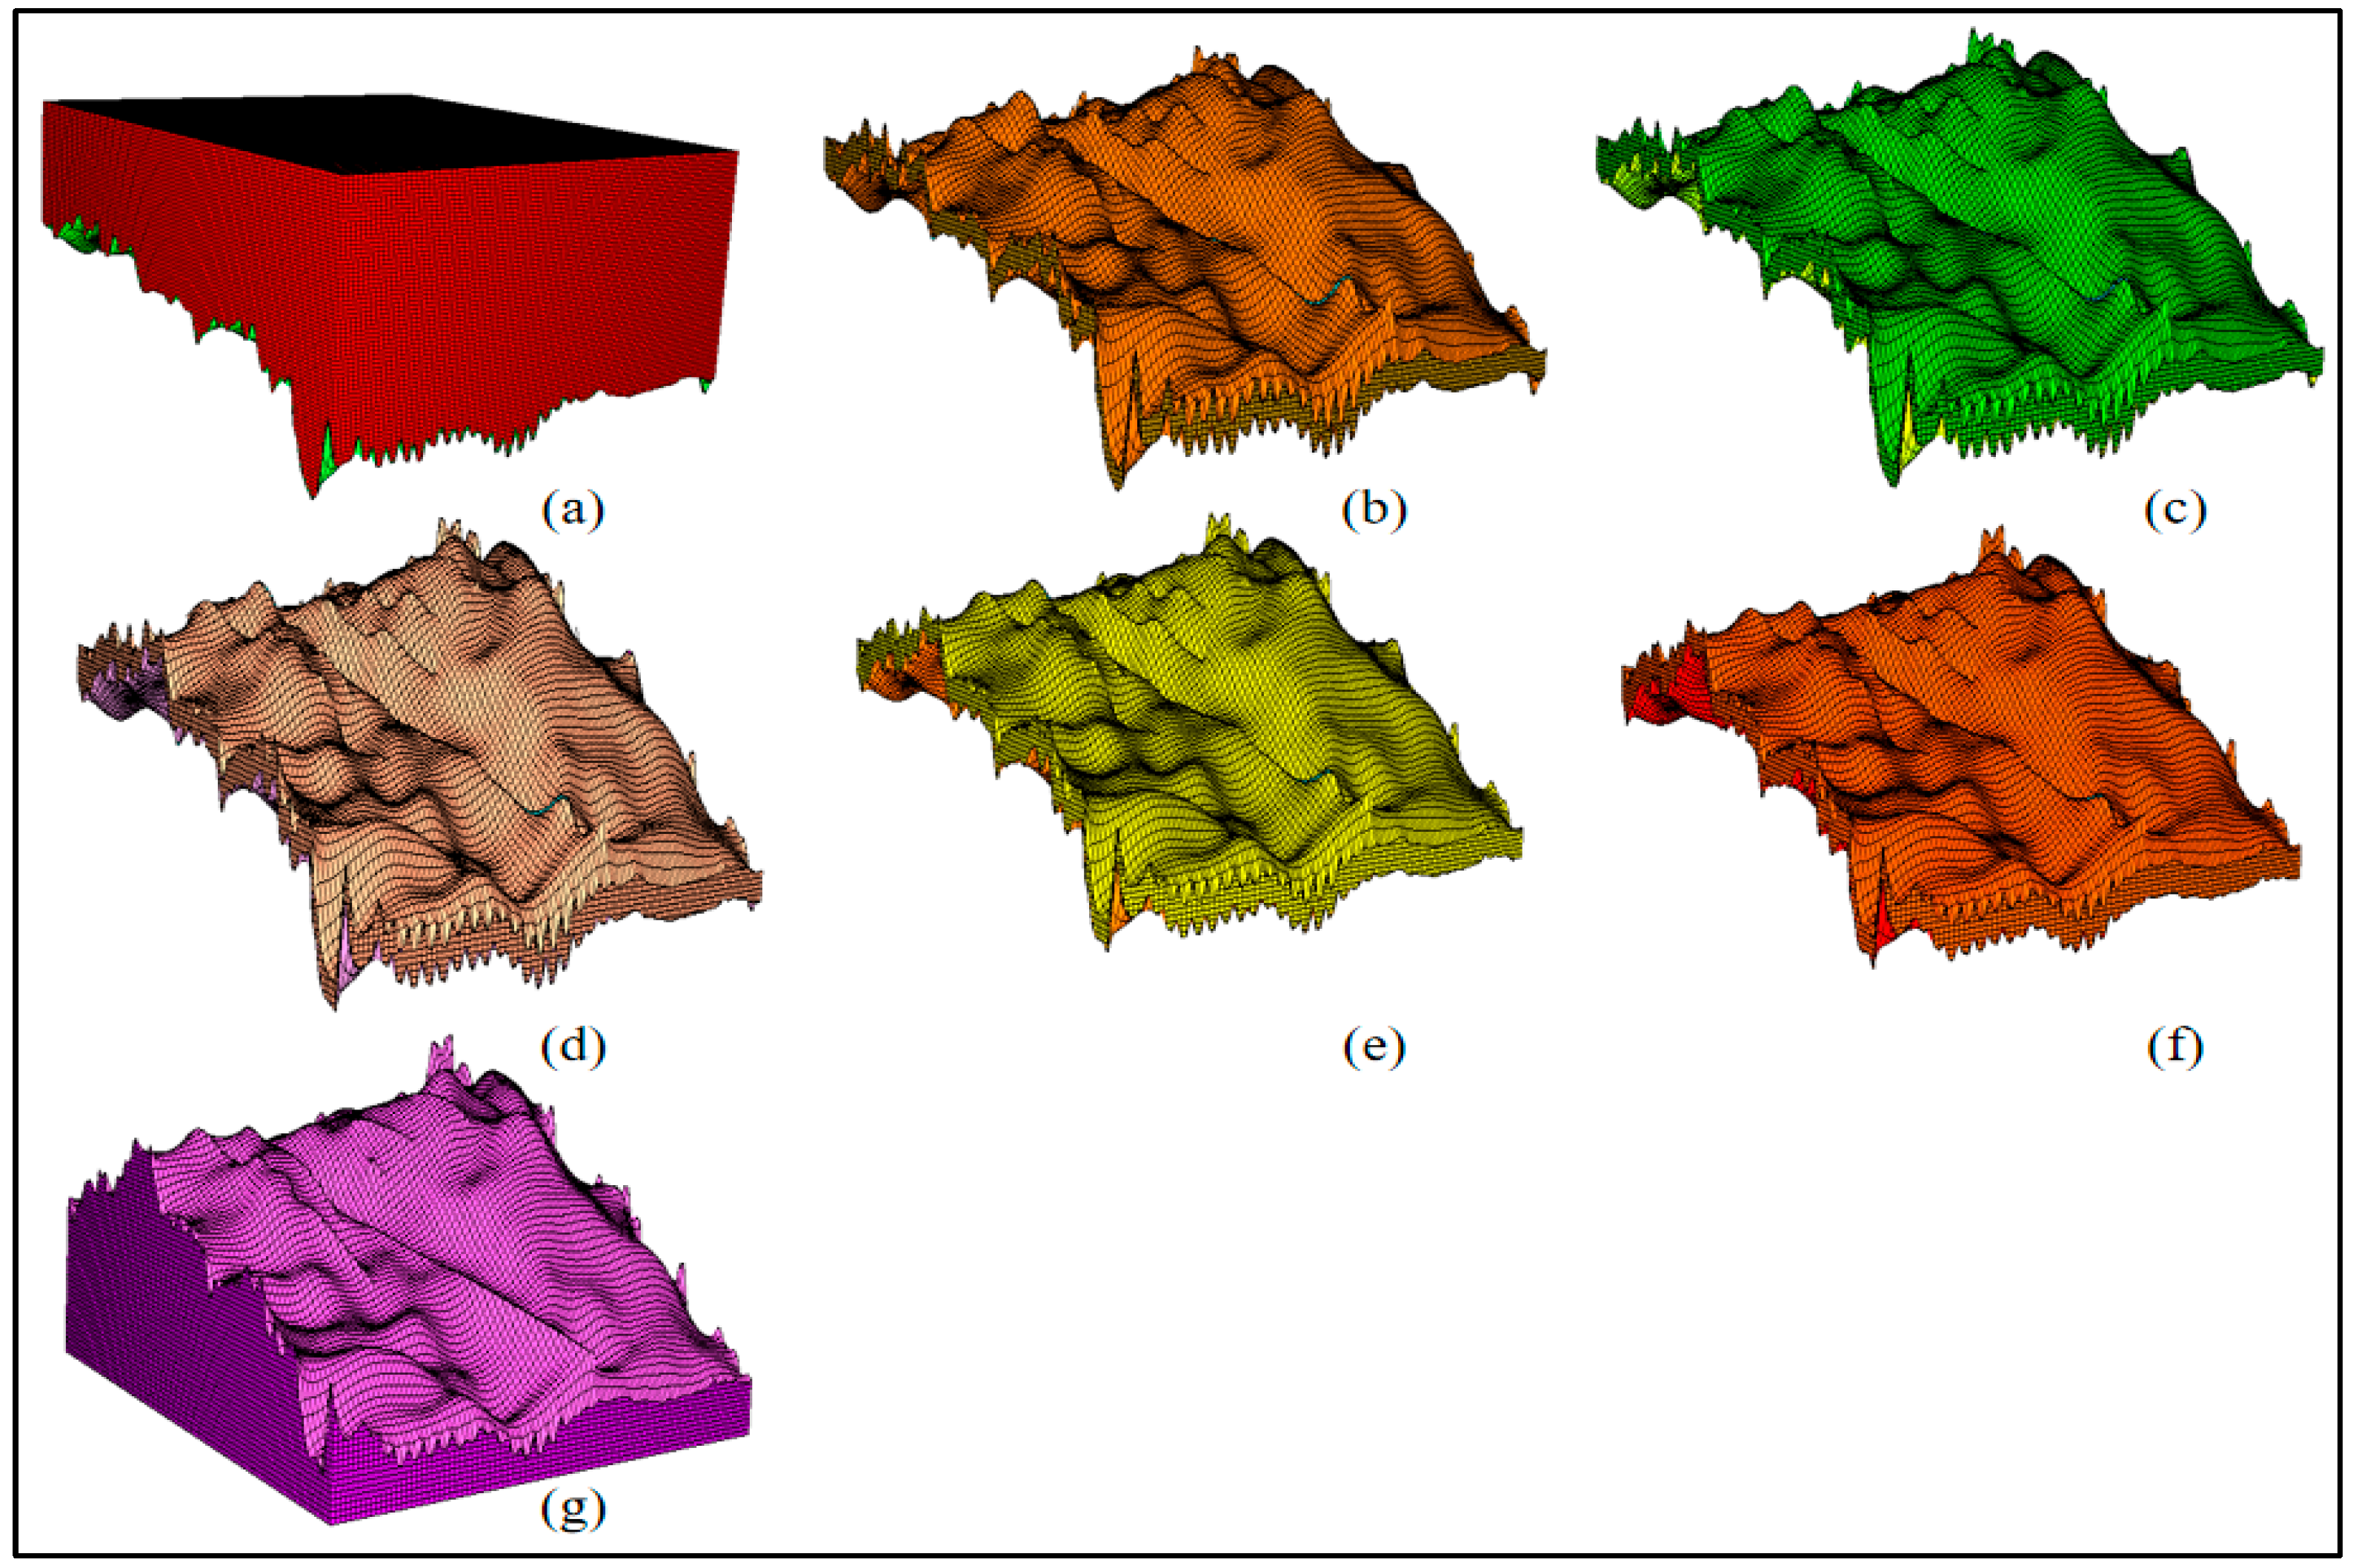
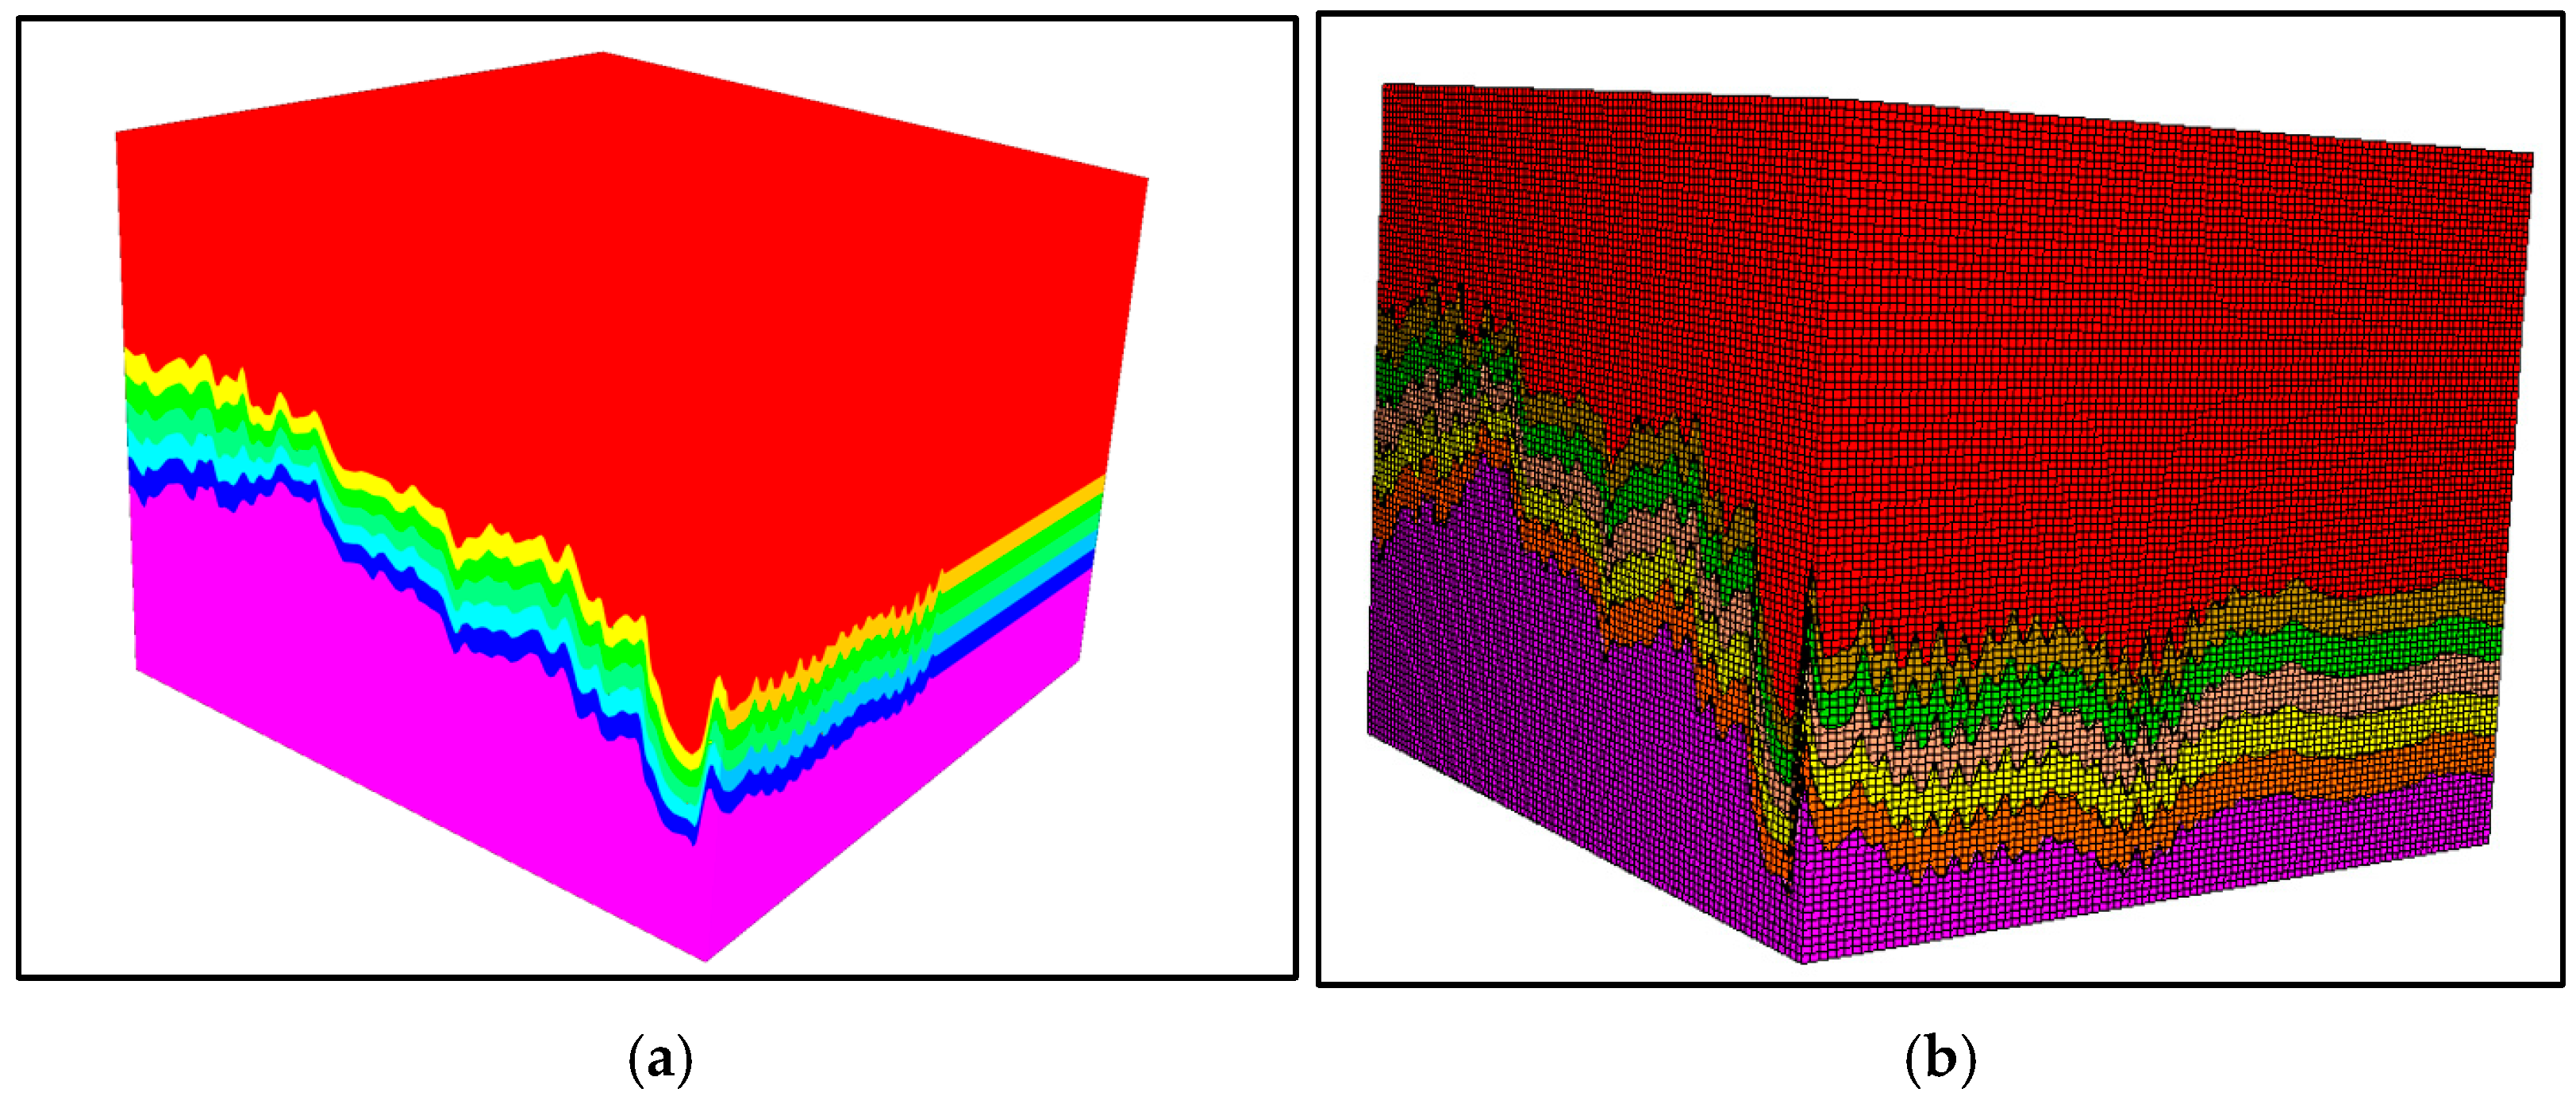
The fault intersection line refinement algorithm was applied to optimise intersection lines, employing Allan diagram techniques to verify stratigraphic correspondence across fault blocks (Figure 9). Through logical sub-surface identification using DCEL data structures, geological sub-block models were generated (Figure 10) and subsequently meshed (Figure 11). The final structural model (Figure 12) accurately reproduces micro-amplitude structural features, with the solid closed model (Figure 12a) converted to a gridded model (Figure 12b) suitable for property population workflows.

3.3. Ganchaigou Structural Belt, Qaidam Basin

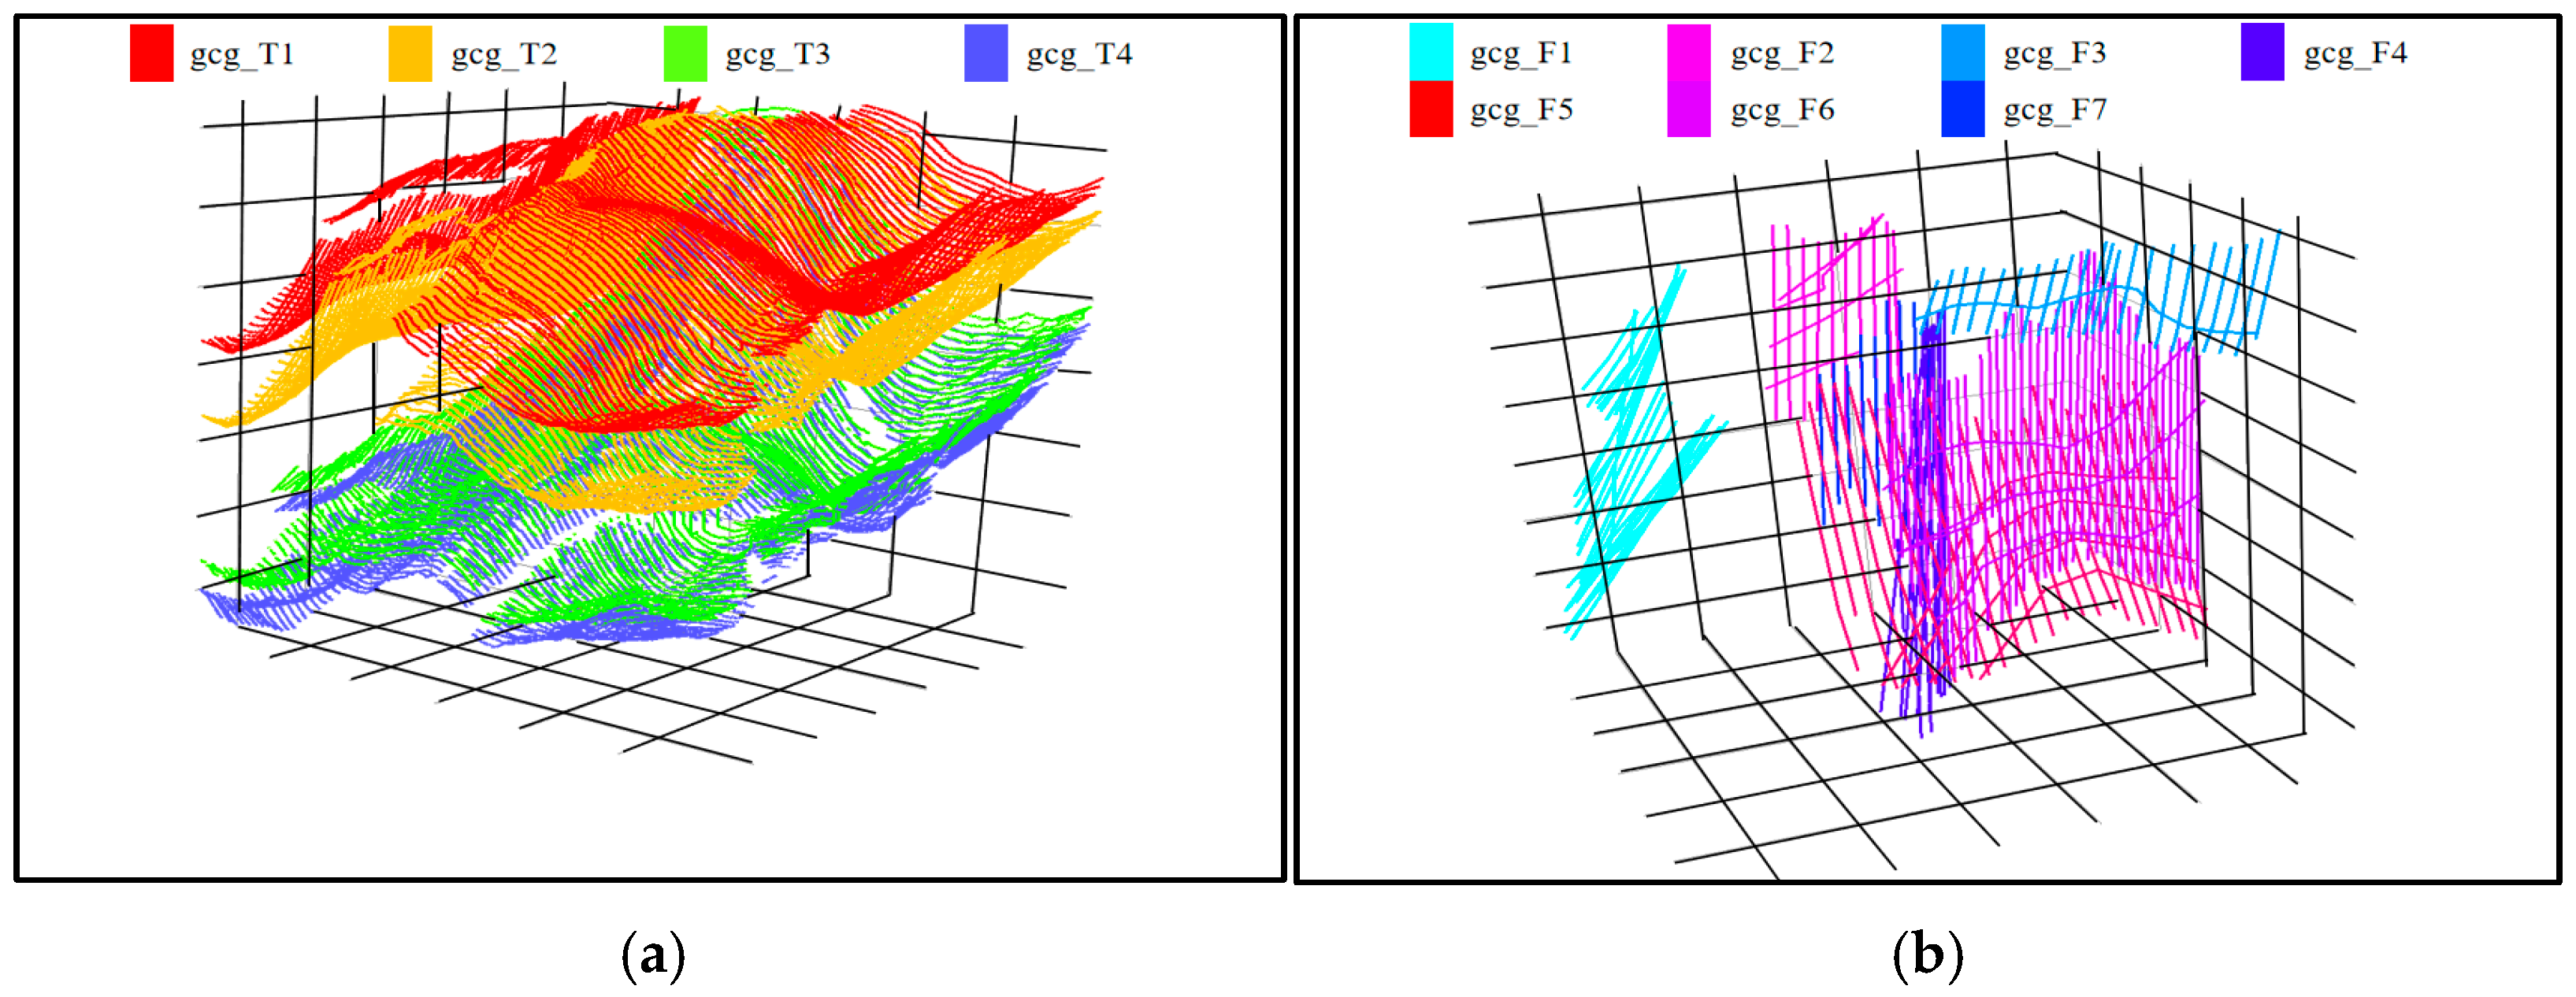
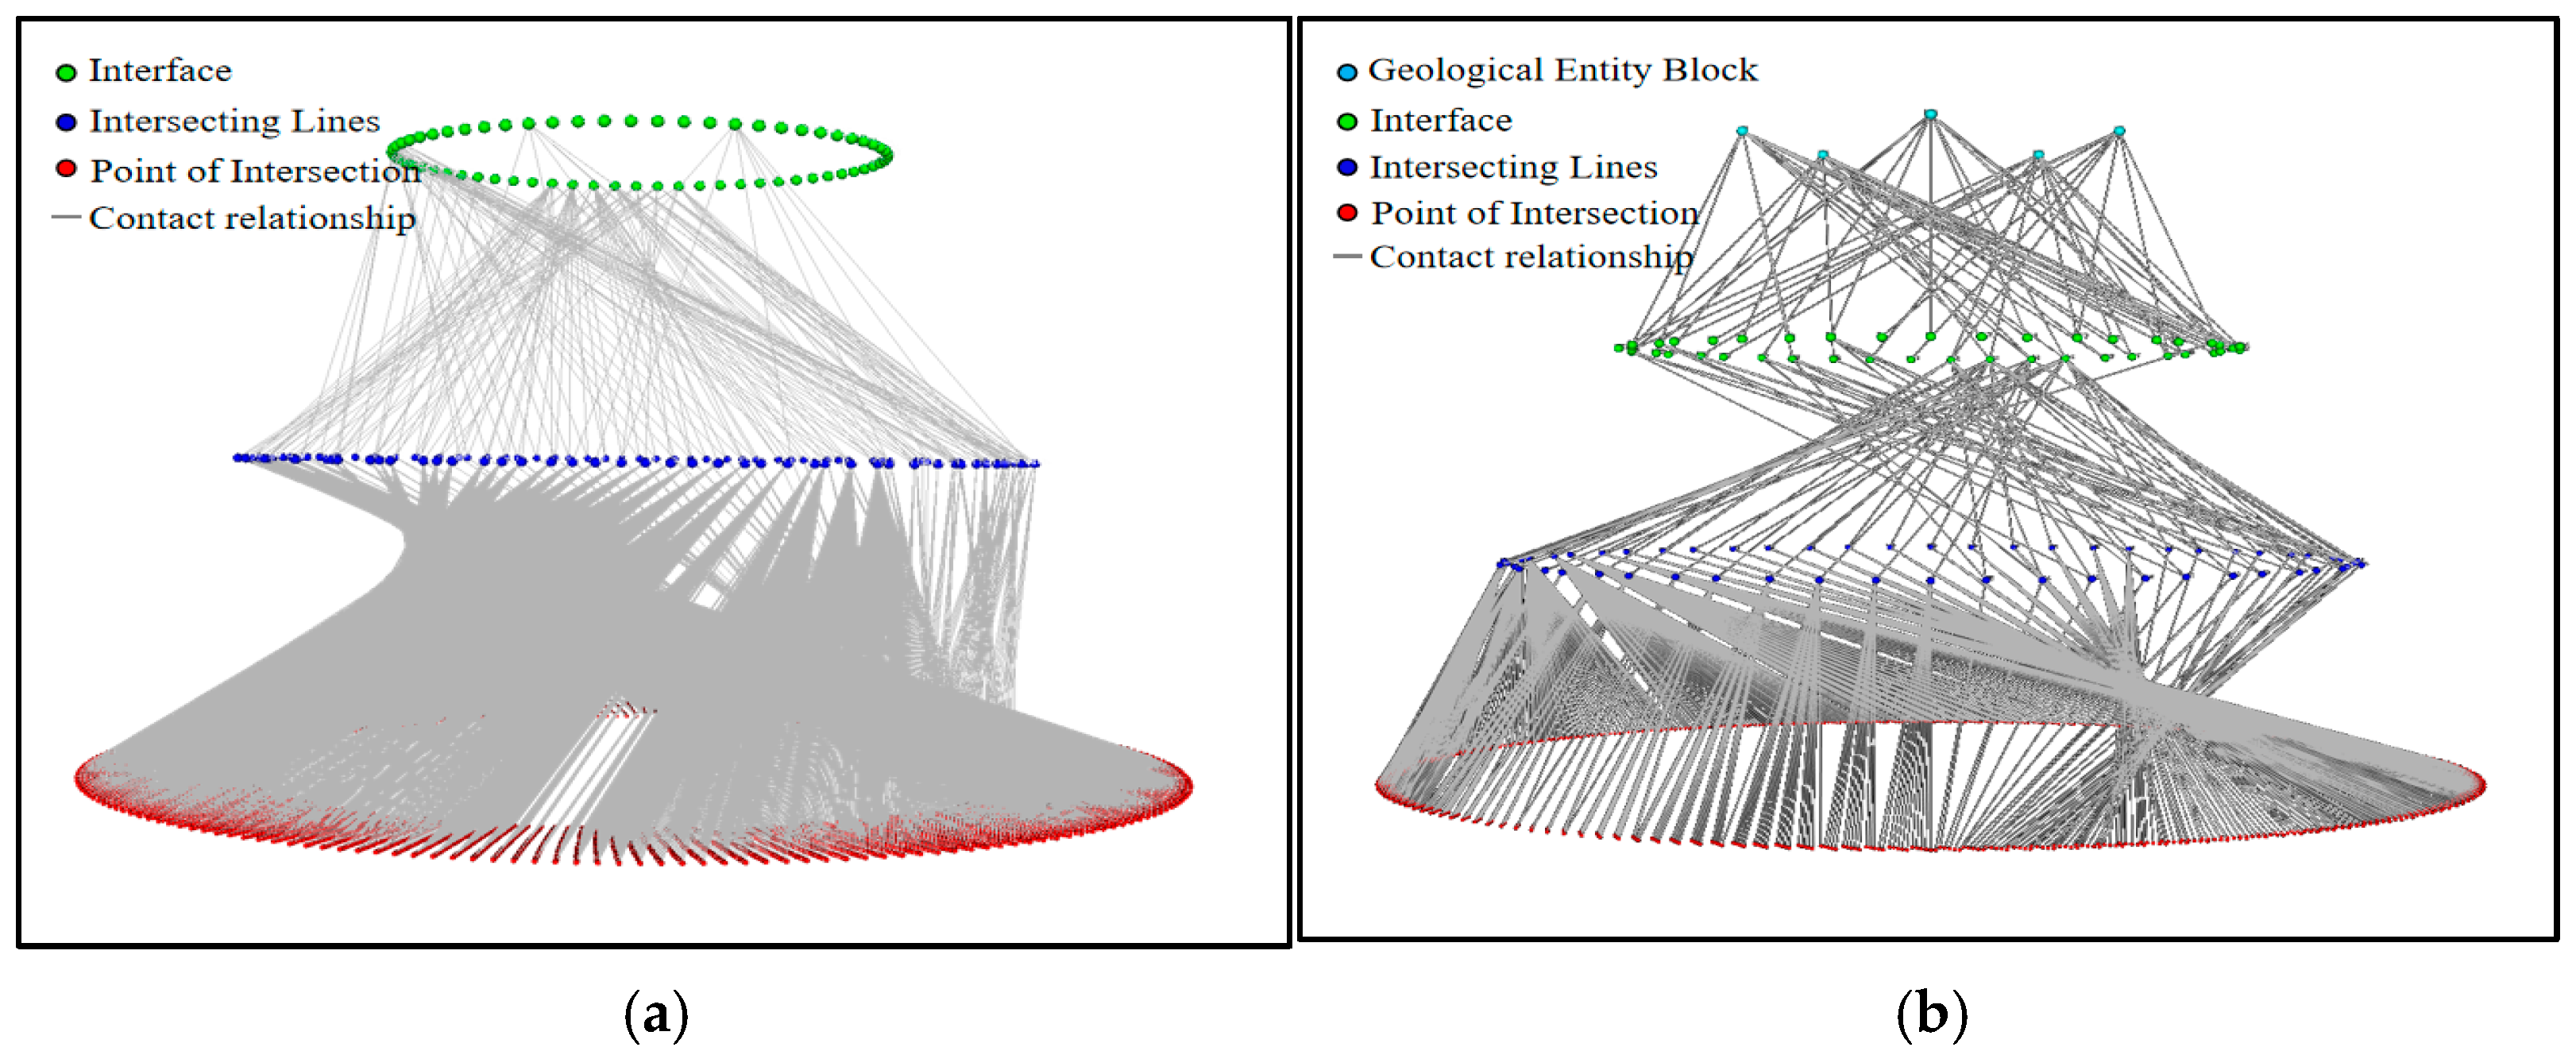
The Ganchaigou work area comprises four horizons and seven faults (Figure 13). Compared to the Wangyaonan Block, this area exhibits more complex structural styles with well-developed thrust faults and complex fault cutting relationships. The system applied the STFMA for fault surface reconstruction using the RBF implicit surface method, processing complex listric and ramp–flat geometries through multiquadric basis functions (Figure 14).
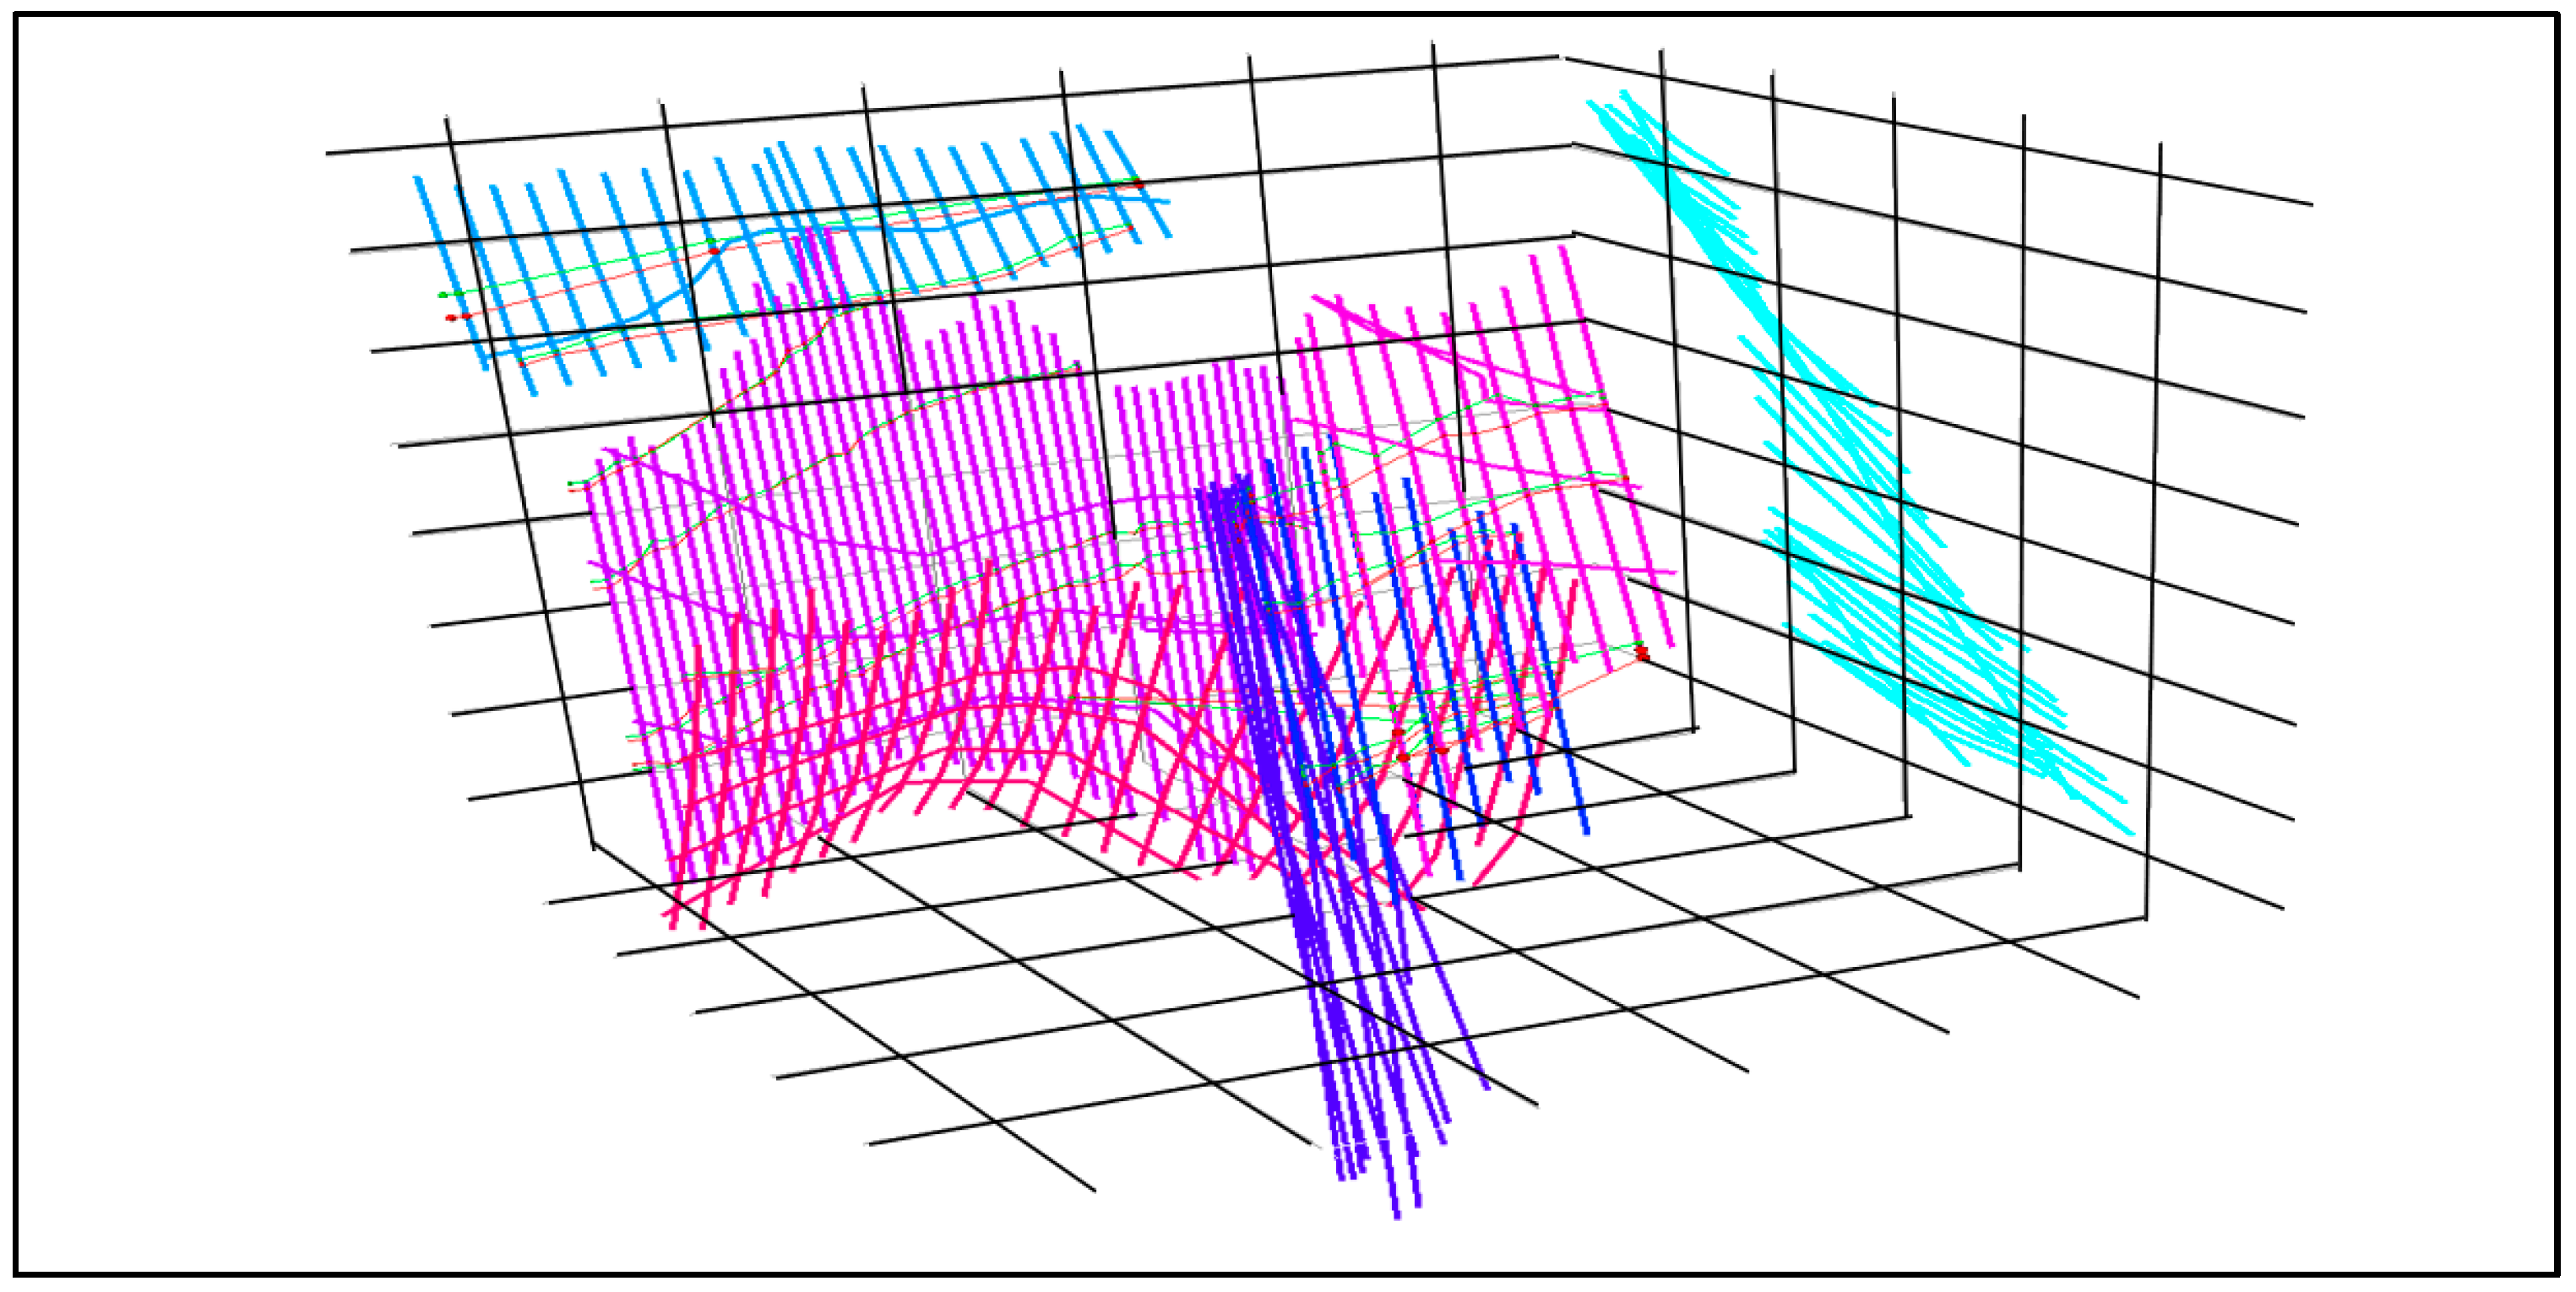
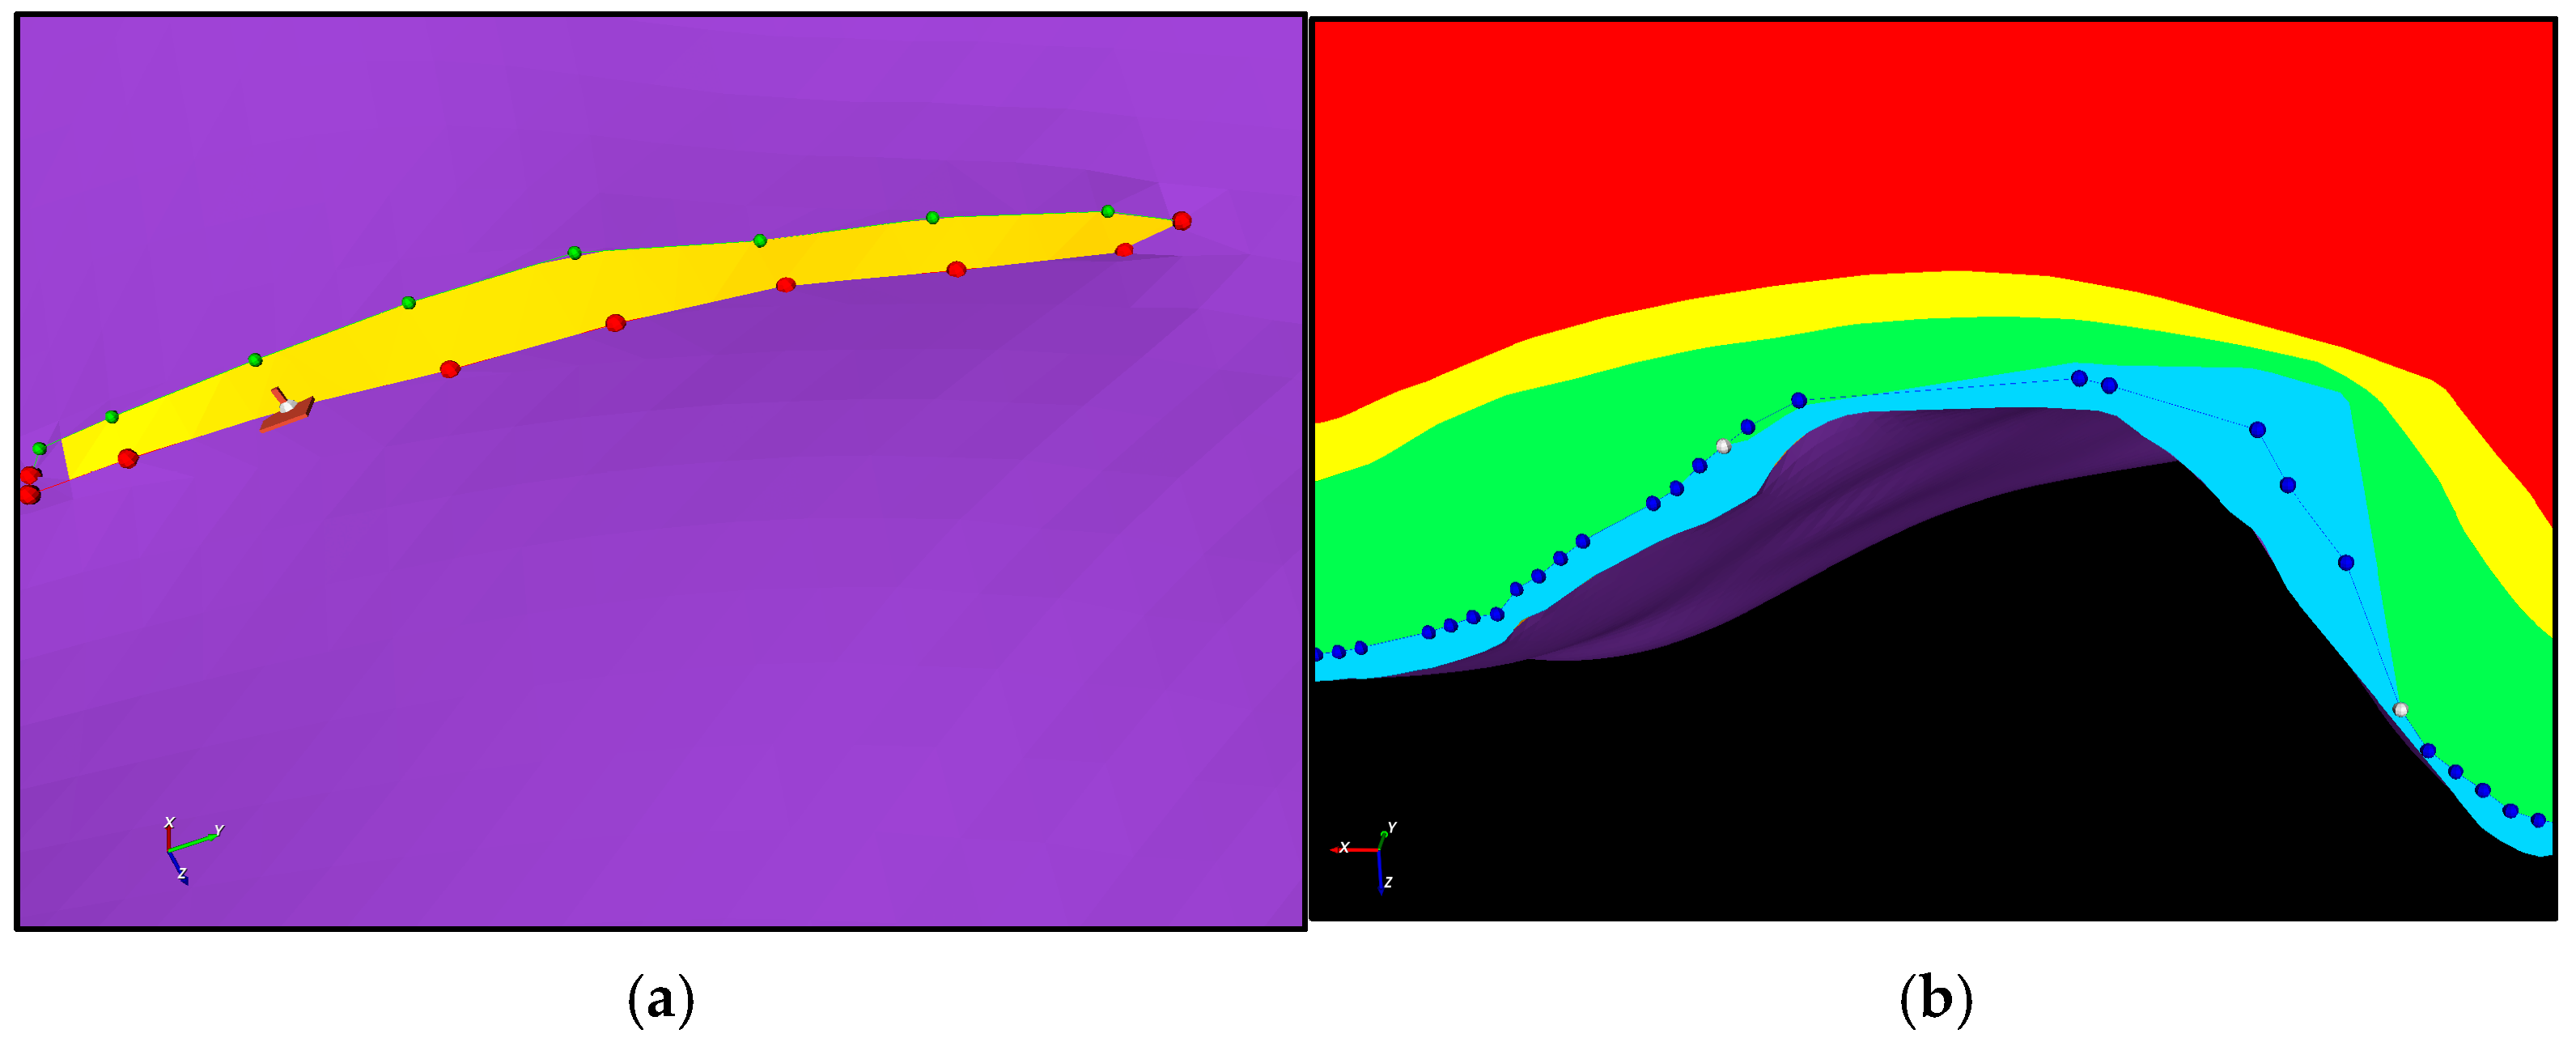
Through the KILGA, 17 pairs of geological intersection line data were generated (Figure 15, Table 3). Expert-guided quality control optimised intersection lines to ensure compliance with geological understanding (Figure 16). To handle displacement discontinuities in thrust faults, XFEM concepts with Heaviside enrichment functions were incorporated during fault surface reconstruction.
Based on knowledge graph-guided reasoning, geological sub-blocks were modelled and integrated according to stratigraphic chronological relationships (Figure 17). The final model accurately reproduces the three-dimensional geometry of the Ganchaigou anticline and the spatial configuration of the thrust-fault system.

3.4. Fengjiawan Buried Structure, Sichuan Basin

The Fengjiawan work area comprises five horizons and eight faults, including three reverse faults and five normal faults. Table 4 summarises the fault–horizon intersection relationships identified by the KILGA for this area.
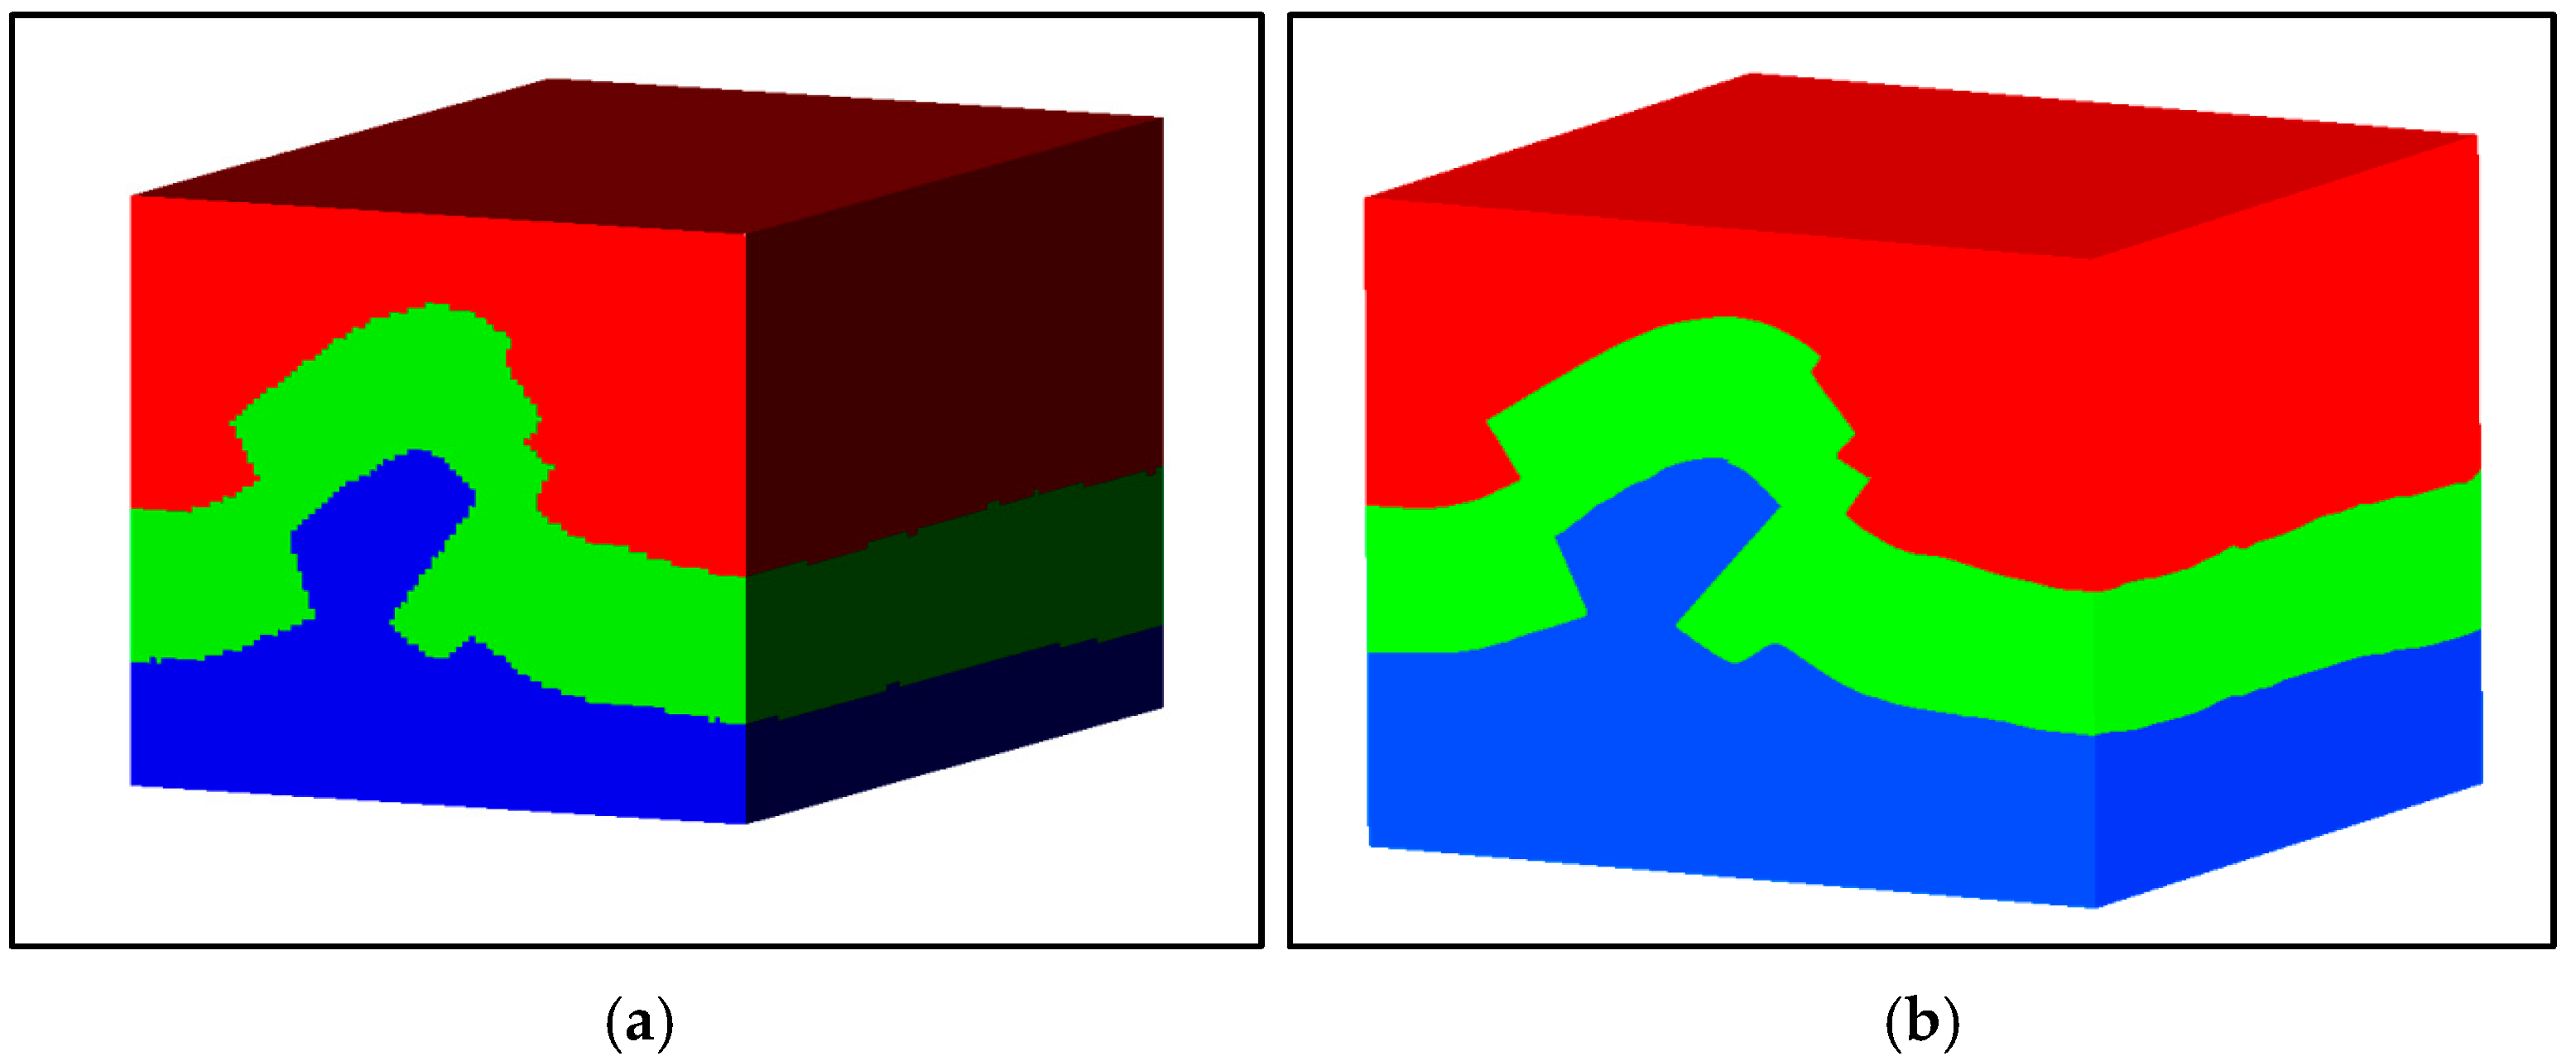
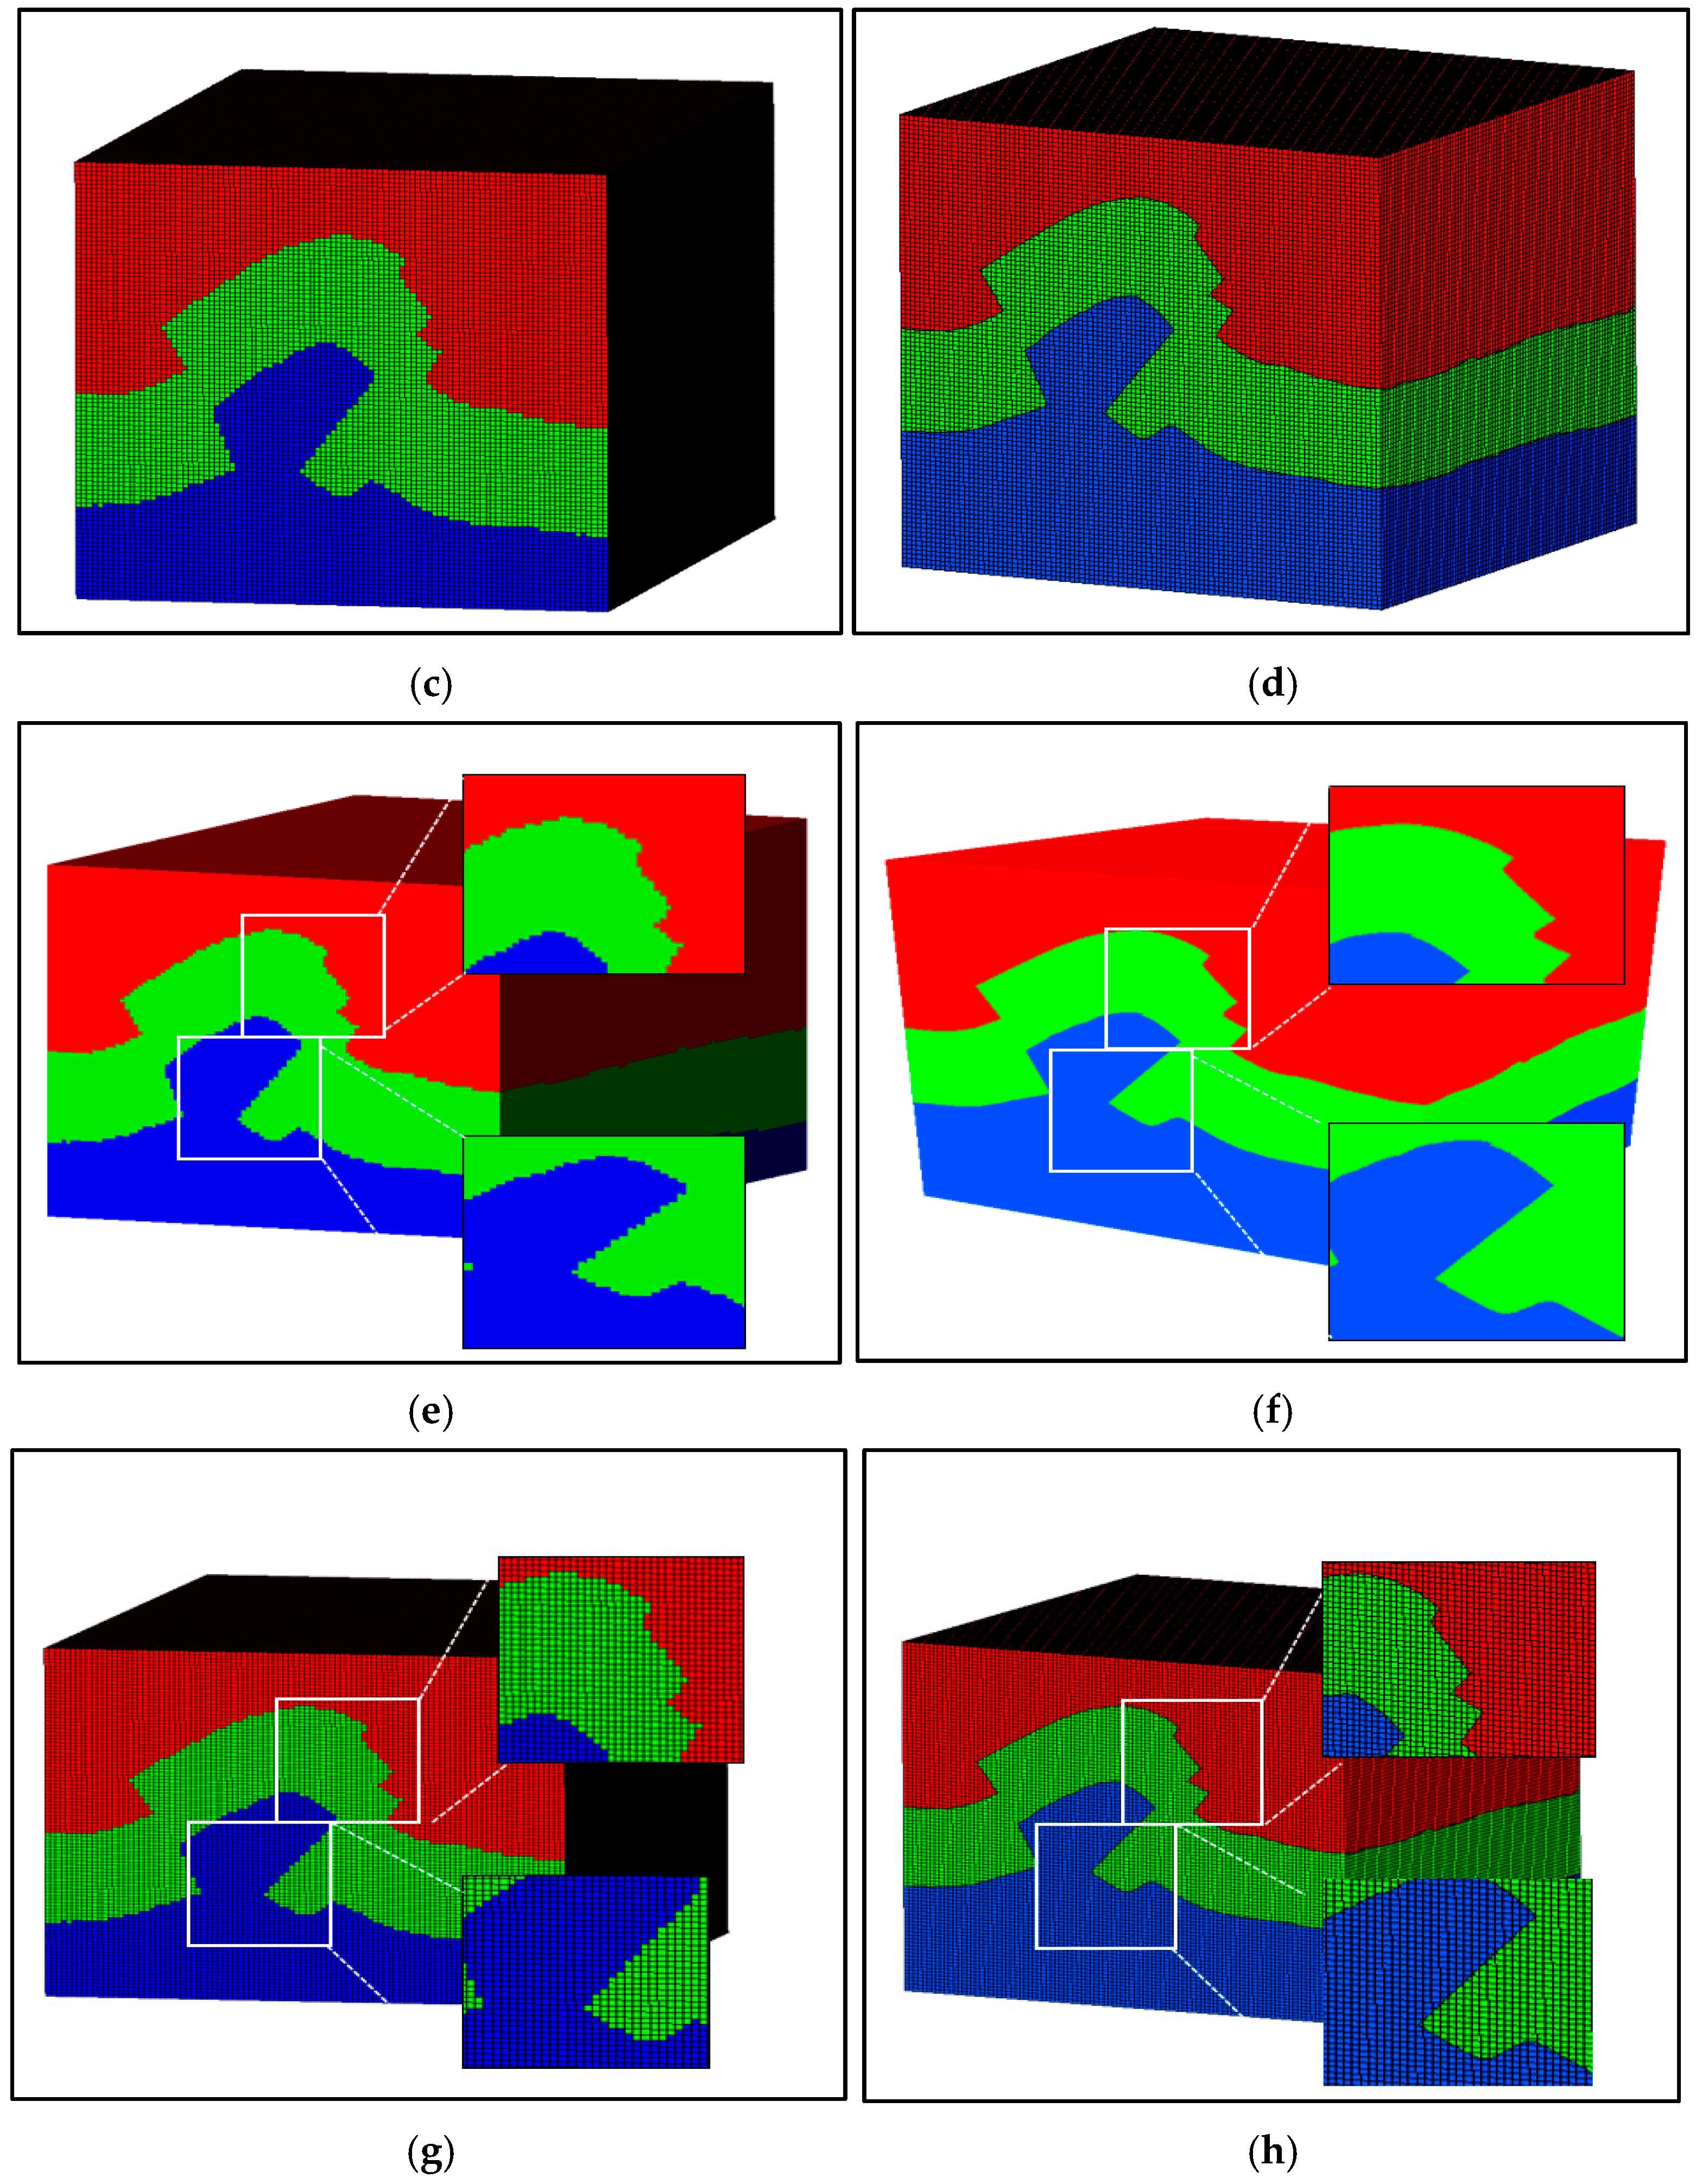
The system primarily applied the HAMR-APEE algorithm for adaptive mesh refinement. Figure 18 provides a comprehensive comparison of results before and after adaptive mesh refinement, demonstrating that the HAMR-APEE algorithm effectively eliminates the aliasing artefacts present in conventional uniform-mesh modelling.
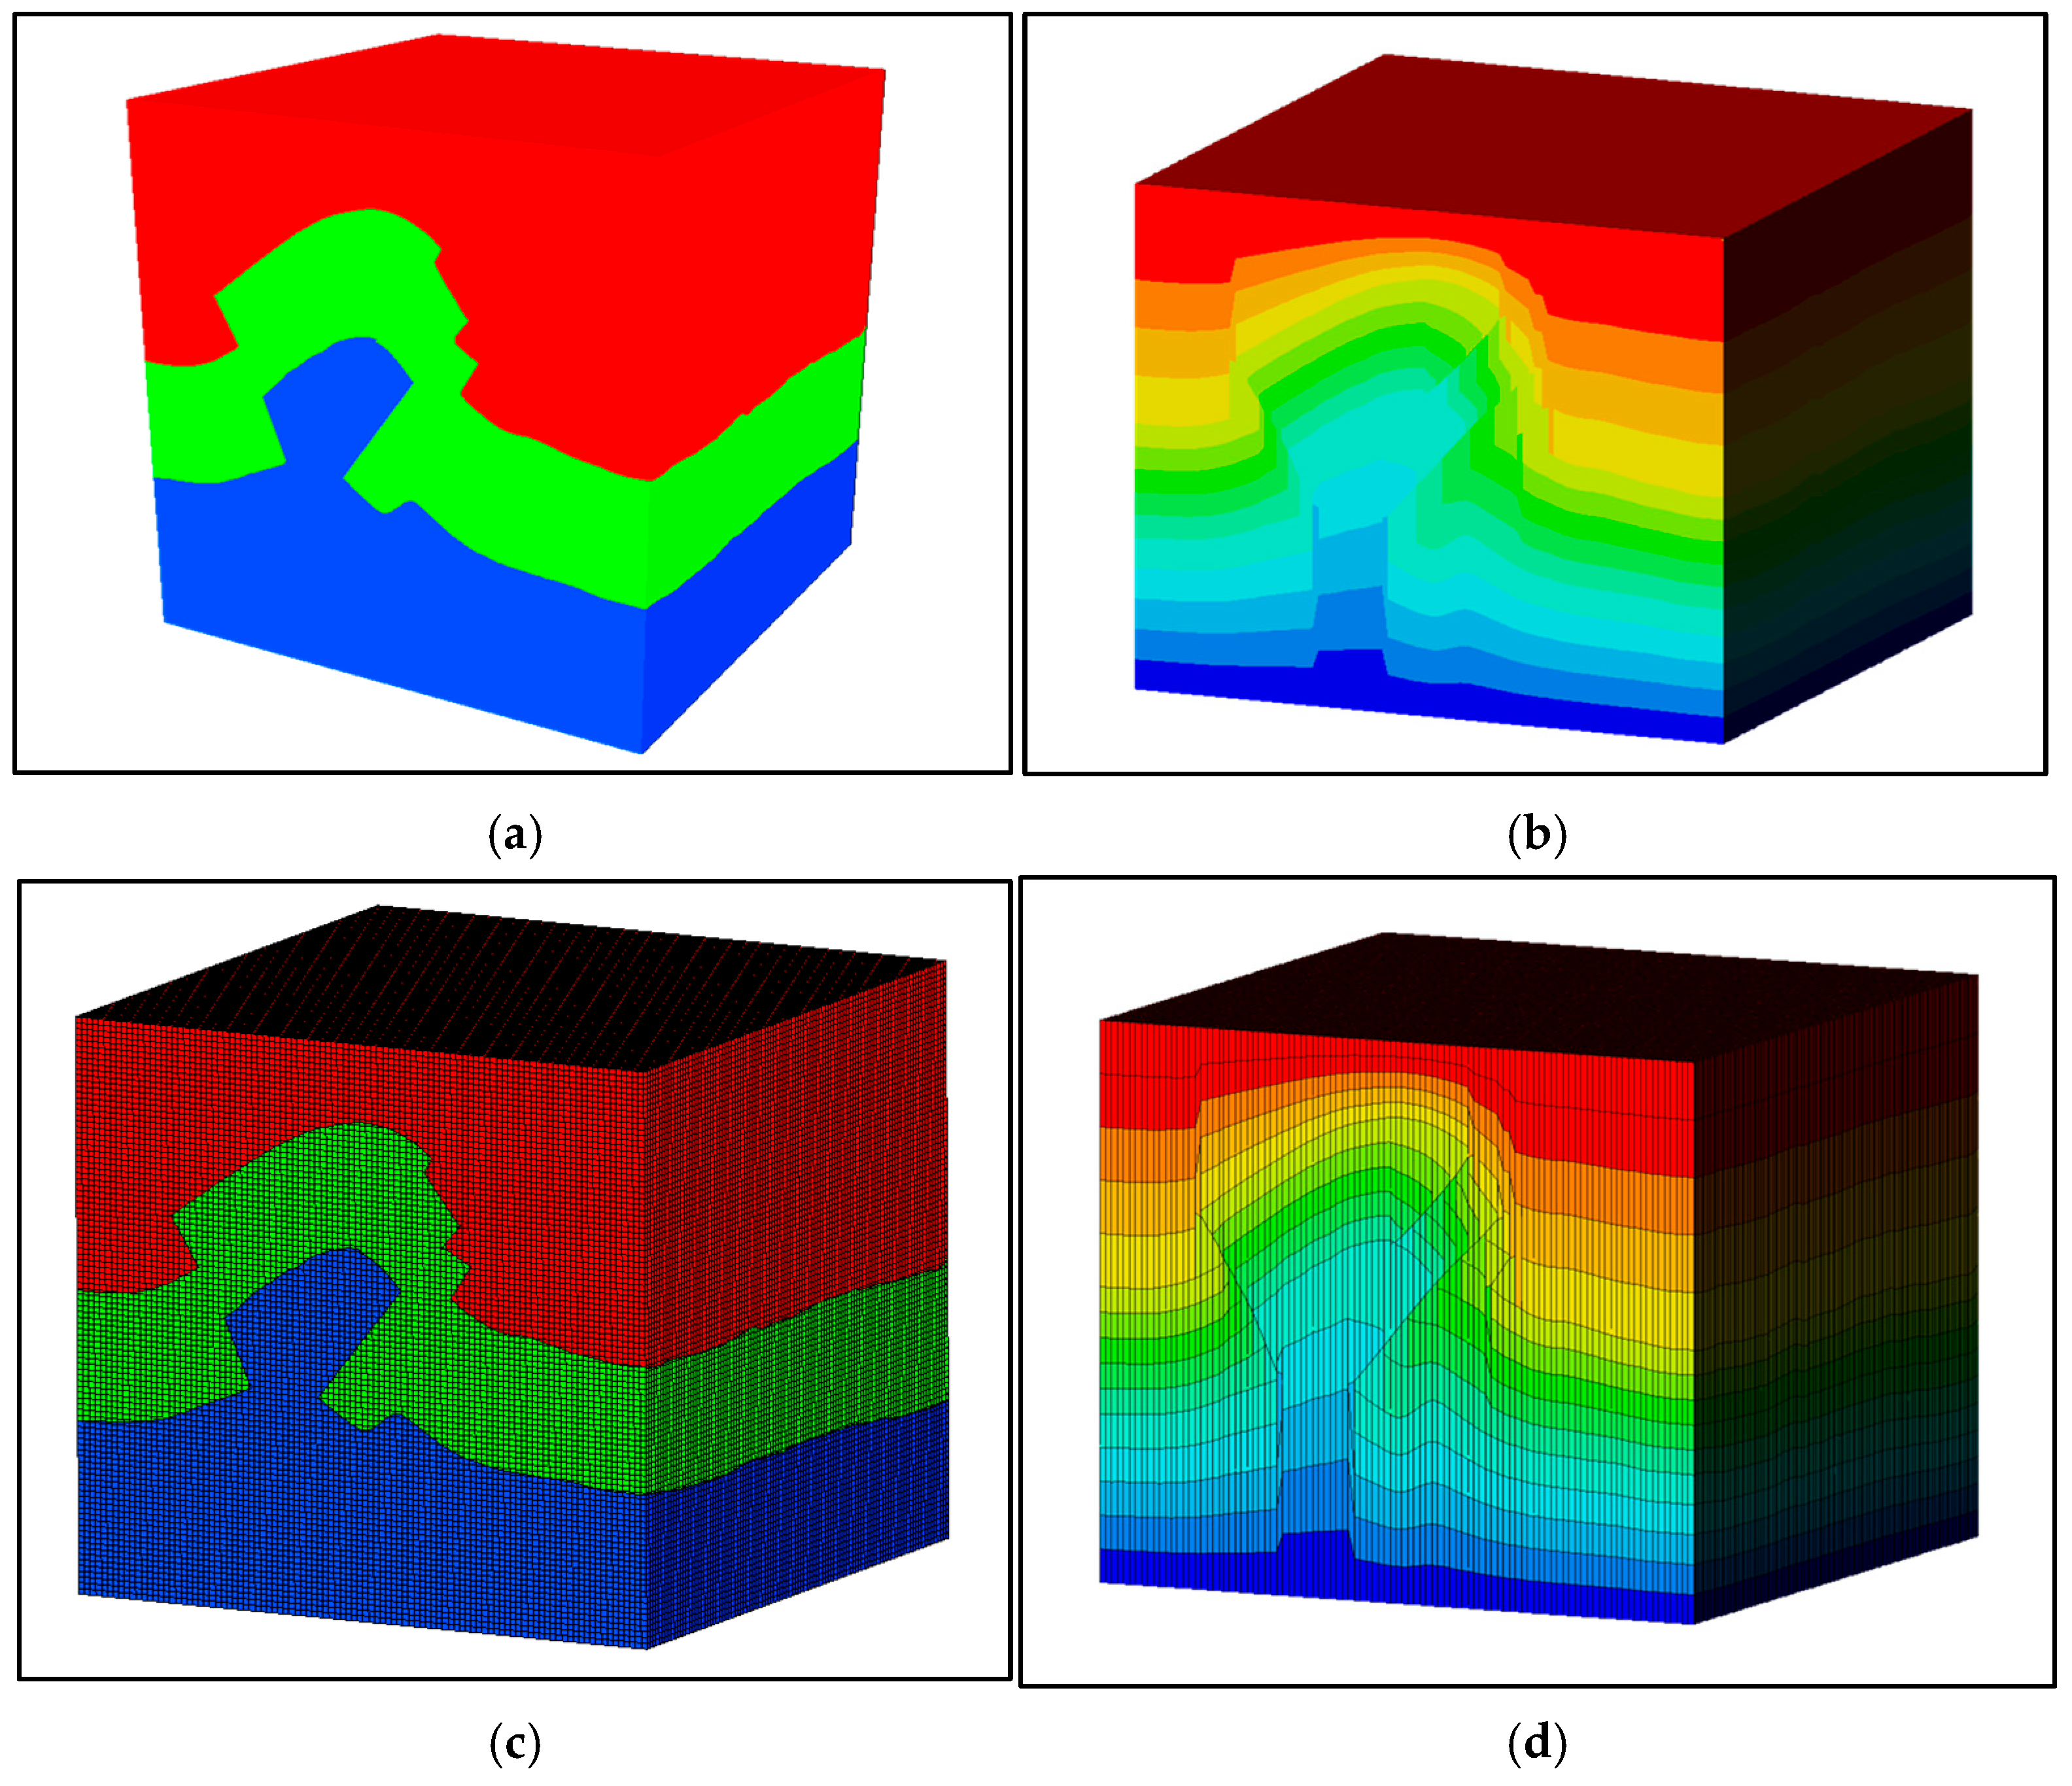
The sequence stratigraphic-constrained sublayer method was applied for refined stratigraphic modelling (Figure 19), demonstrating significant improvements in both the precision of stratigraphic unit subdivision and geological rationality.
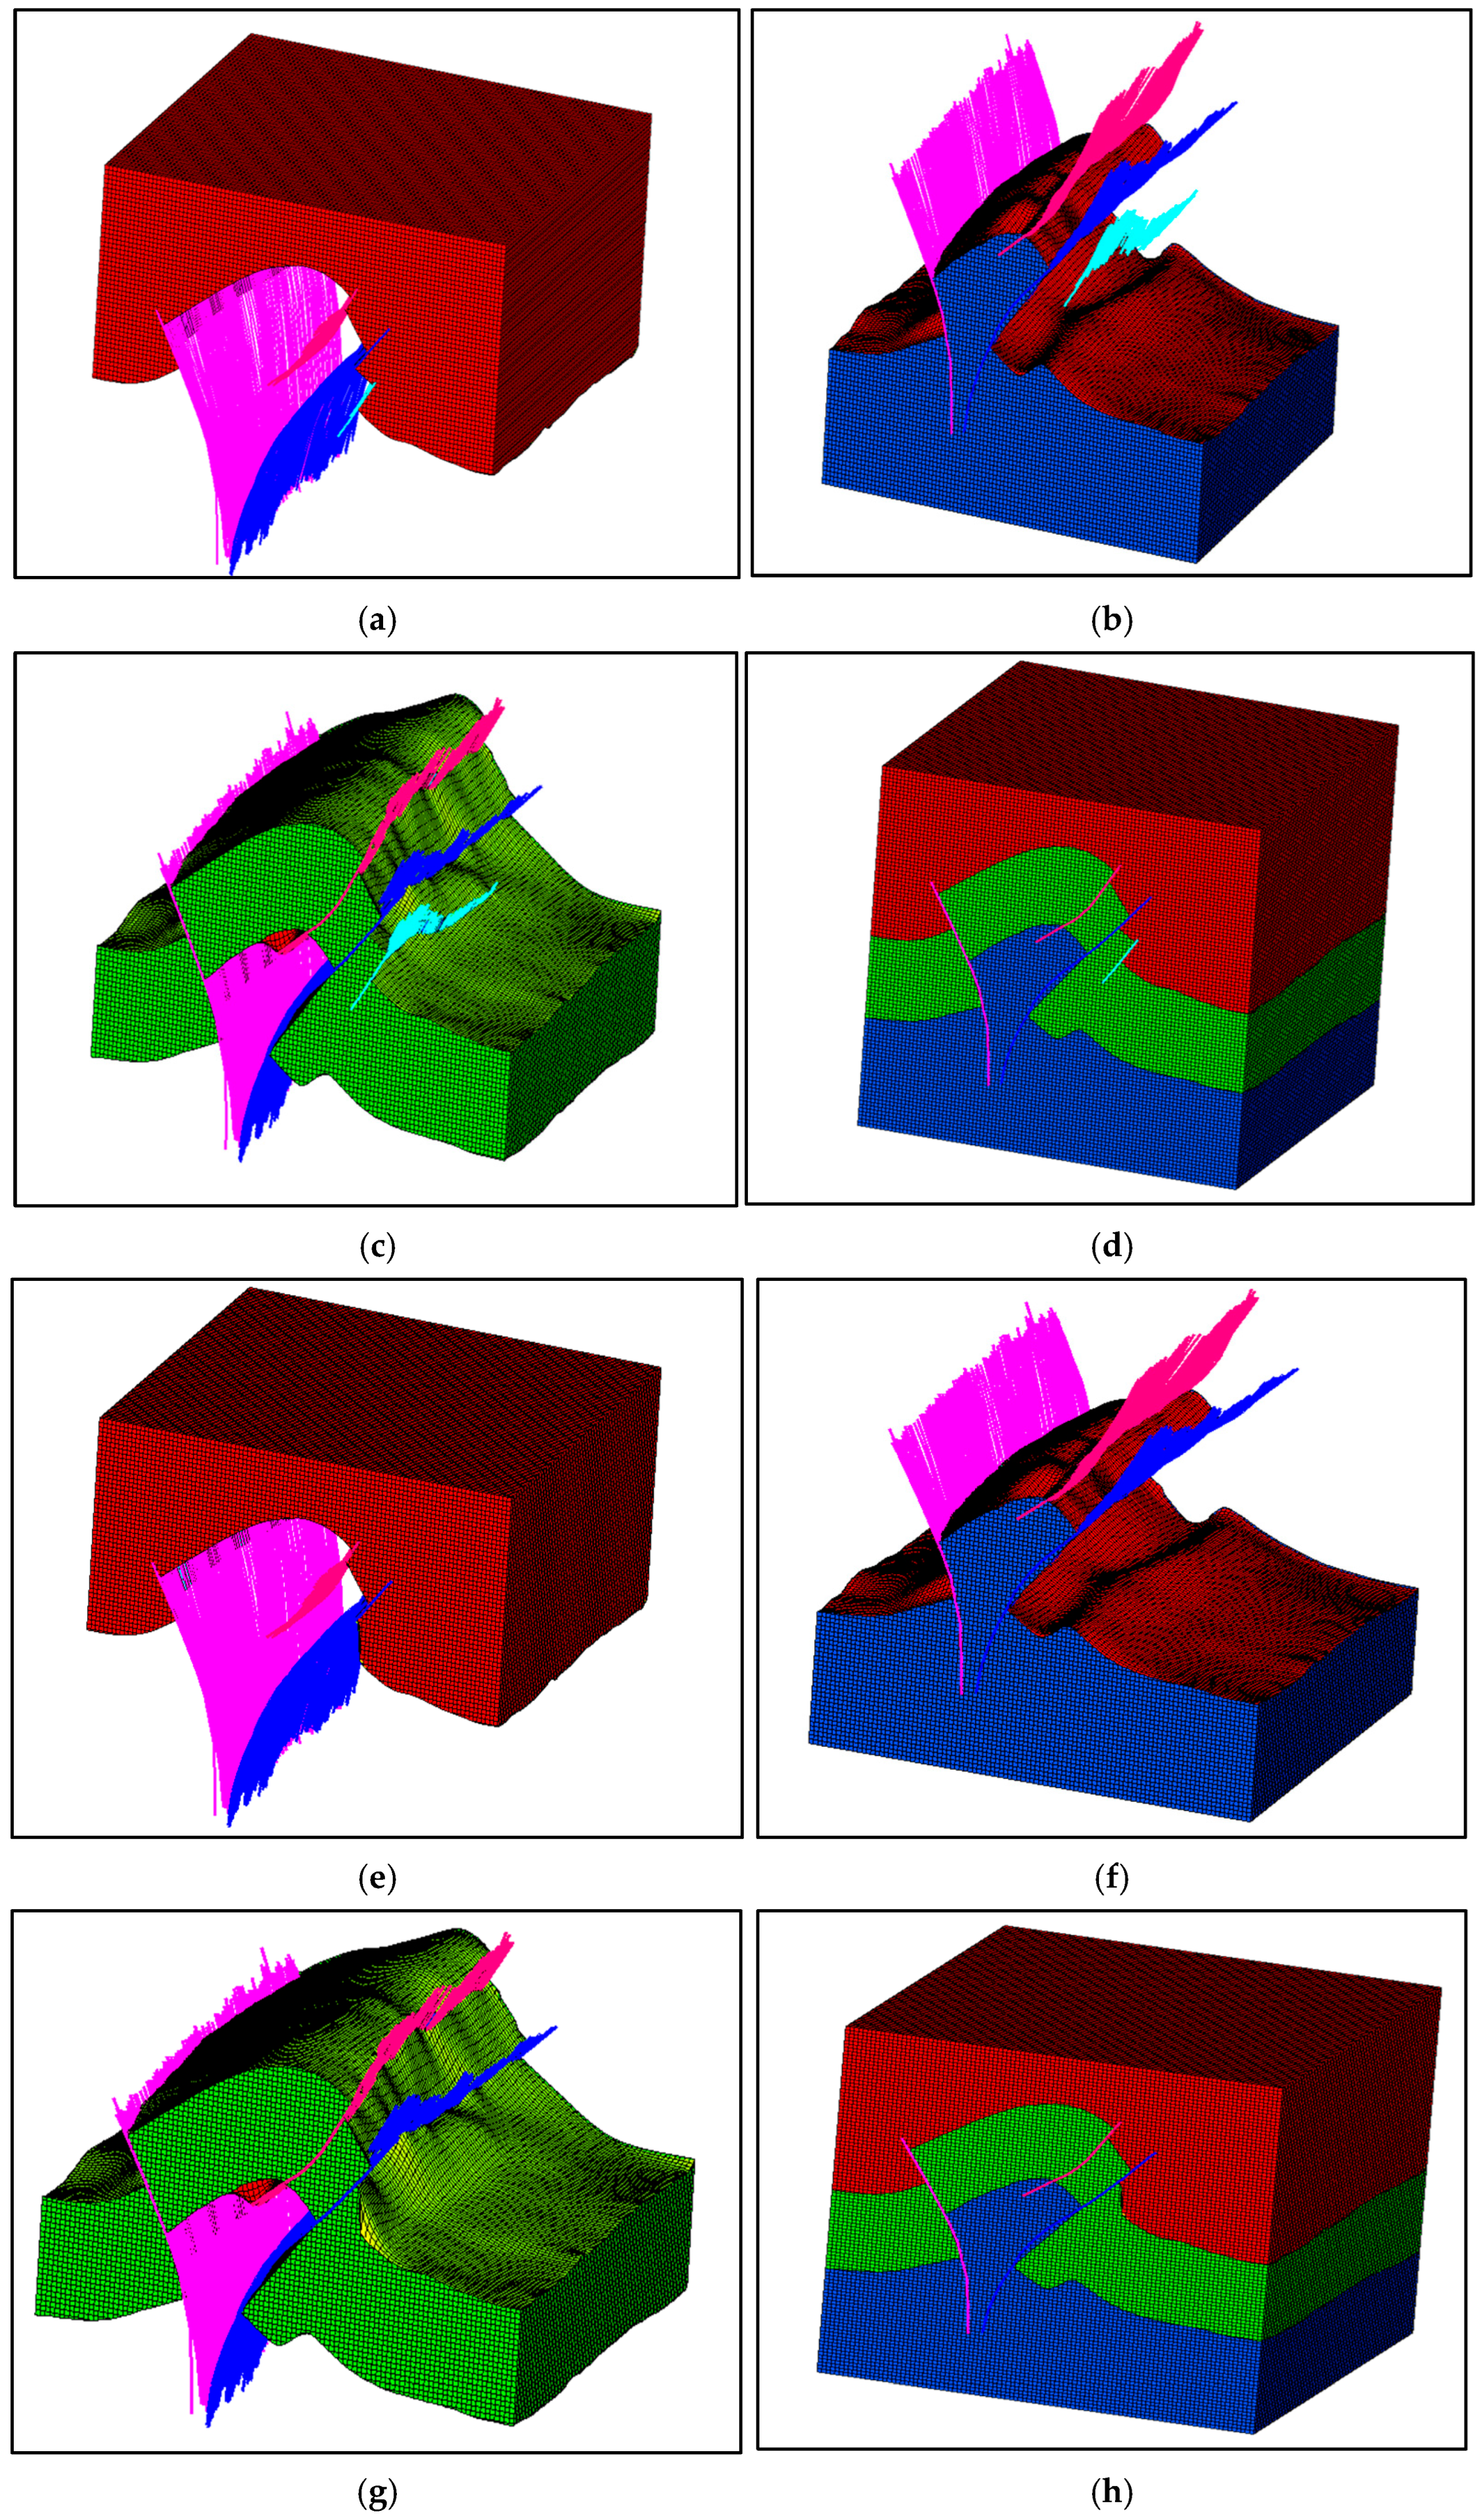
To validate the bidirectional linkage functionality, the system demonstrated real-time response to knowledge graph modifications. Figure 20 shows the knowledge graph before and after thrust-fault removal, while Figure 21 presents the corresponding changes across geological model sub-blocks and overall structural models.

3.5. Quantitative Comparison with Conventional Methods

To objectively evaluate the proposed method, parallel modelling experiments were conducted using the conventional surface-based modelling workflows commonly used in commercial geological modelling software for each study area. Two categories of metrics were assessed: (i) geometric accuracy (RMSE and maximum error computed from Equations (22) and (23) in Section 2.4) and (ii) geological reasonableness (constraint satisfaction ratio from Equation (25)). Table 5 presents the comparative results.
Across all three cases, the proposed method reduces RMSE by 53–69%, improves geological reasonableness by 9–13 percentage points, and shortens modelling cycles by 77–82%. The improvement is most pronounced in the Wangyaonan micro-amplitude case, where precise structural constraint integration proved critical for capturing subtle features.
To evaluate individual algorithmic contributions, ablation experiments were conducted on the Wangyaonan dataset by selectively disabling each component (Table 6).
The TKA knowledge architecture contributes the largest improvement in geological reasonableness (ΔR_geo = +10.6 percentage points). The KILGA provides the greatest reduction in modelling cycle length (Δcycle = −12 days). The HAMR-APEE algorithm primarily improves geometric accuracy (ΔRMSE = −2.9 m), while bidirectional linkage mainly reduces the iteration time during model updates.

4. Discussion

4.1. Analysis of Quantitative Results

The quantitative comparison in Table 5 reveals three notable patterns. First, the proposed method achieves consistent RMSE reduction across all three structural styles, with improvements of 69% (Wangyaonan), 62% (Ganchaigou), and 59% (Fengjiawan). This consistency across different geological settings—from gentle monoclines to complex thrust systems—suggests that the knowledge graph-guided approach provides robust improvement regardless of structural complexity.
Second, the improvement in geological reasonableness (R_geo increasing from 82–86% to 95–96%) is attributable primarily to the TKA knowledge architecture, as confirmed by the ablation study (Table 6). When TKA was disabled, R_geo dropped by 10.6 percentage points to 85.6%, approximating the performance level of conventional surface-based modelling workflows commonly used in commercial geological modelling software. This finding indicates that the systematic integration of expert knowledge through hierarchical reasoning, rather than individual algorithmic improvements, constitutes the primary driver of geological plausibility enhancement.
Third, the reduction in modelling cycle length (from 45–60 days to 8–12 days) stems from two complementary mechanisms: (i) KILGA-based automated intersection line generation eliminates approximately 60% of manual editing time, and (ii) the bidirectional linkage mechanism enables incremental updates rather than complete model reconstruction. As the ablation study shows, removing either component significantly increases the modelling cycle length (to 20 days without KILGA, 15 days without bidirectional linkage).
It is worth noting that the degree of improvement varies with structural complexity. The Wangyaonan case showed the largest RMSE reduction (69%) because micro-amplitude features (5–15 m) are easily over-smoothed by conventional interpolation but are effectively preserved by knowledge graph constraints that enforce the existence and geometry of subtle nose-like uplifts. In contrast, the Fengjiawan case showed relatively lower RMSE improvement (59%) but the most visually dramatic improvement in aliasing elimination (Figure 18), reflecting the dominant contribution of HAMR-APEE adaptive meshing in deep, structurally complex settings.

4.2. Comparative Analysis with Existing Methods

Table 7 compares the proposed method with existing approaches across multiple dimensions.
Compared with the implicit modelling method integrating fault potential fields [9], which achieved automatic handling of complex faults but lacked systematic expert knowledge integration, the proposed method explicitly embeds geological rules through TKA, resulting in measurably higher geological reasonableness (95–96% vs. approximately 85% reported for implicit methods). Compared with Ma et al. [14], who demonstrated knowledge graph construction for geoscientific data integration but did not couple it with three-dimensional modelling, the proposed method establishes a bidirectional linkage that propagates knowledge modifications to model geometry in real time.
Machine learning approaches by Bergen et al. [16] and Wu et al. [17] improved feature extraction efficiency, with structural recognition accuracy exceeding 90%, but they operate as black-box systems without explicit geological constraint enforcement. In contrast, the proposed knowledge graph approach provides interpretable reasoning chains that can be verified by domain experts, which is critical for geological decision-making where model transparency is required.
Recent geochemical and sedimentological studies have demonstrated that multi-source geological data integration—including organic geochemistry, mineralogy, and sedimentary facies analysis—can provide valuable constraints for sub-surface modelling [58,59]. The knowledge graph framework proposed here is inherently extensible to incorporate such multi-disciplinary data as additional entity types and constraint rules, potentially further improving model geological reasonableness.

4.3. Comparison with Global Analogues

To contextualise the three Chinese study areas within a broader geological framework, comparisons can be drawn with structurally analogous basins worldwide (Table 8).
The Wangyaonan micro-amplitude structures share fundamental modelling challenges with intracratonic basins such as the Williston Basin, where subtle stratigraphic and structural variations exert important controls on hydrocarbon accumulation [60]. The Ganchaigou thrust belt is structurally comparable to the Zagros fold-and-thrust belt, where complex imbricate thrust sheets and ramp–flat geometries create multi-valued surfaces that conventional single-valued horizon representations cannot accommodate [61]. The Fengjiawan deep buried structure shares characteristics with the Appalachian fold-and-thrust belt, where polyphase tectonic superimposition produces complex fault networks that challenge both seismic imaging and three-dimensional model construction [62].

4.4. Practical Application Value

The three application cases validate the method’s effectiveness across distinct structural styles. In the Wangyaonan Block, precise identification of micro-amplitude nose-like uplifts and structural ridges has optimised horizontal well trajectory design, with expected single-well production increases of 15–20%. In the Ganchaigou Structural Belt, accurate characterisation of thrust-fault geometry and spatial configuration provides reliable evidence for fault sealing evaluation and hydrocarbon migration pathway analysis. In the Fengjiawan buried structure, the HAMR-APEE algorithm effectively eliminates aliasing artefacts that previously compromised boundary representation in deep complex models.
The bidirectional linkage mechanism is particularly valuable during exploration phases, where multiple rounds of seismic interpretation iteration demand rapid model updating. Conventional workflows require near-complete reconstruction when interpretation data are revised; the proposed incremental update strategy reduces this from days to minutes for localised modifications, as demonstrated by the fault removal experiment in the Fengjiawan case (Figure 20 and Figure 21).

4.5. Limitations, Applicability Boundaries, and Future Directions

Several limitations warrant acknowledgement. First, the method depends on the quality of the input seismic interpretation data. Although the three-layer quality control system detects geometric, topological, and semantic anomalies, systematic errors in original interpretation data propagate through the knowledge graph and may compromise model accuracy, particularly in deep structural areas with poor seismic imaging quality.
Second, computational resource requirements remain substantial for ultra-large-scale models (grid numbers exceeding tens of millions). The error estimation and mesh refinement processes of the HAMR-APEE algorithm incur high computational costs under high-precision requirements, potentially limiting real-time interactivity.
Third, knowledge graph construction and maintenance require domain expert participation. Although visualised interactive interfaces have been provided, the definition and optimisation of structural reasoning rules still demand deep geological expertise. Reducing the knowledge acquisition threshold through automated methods remains an open challenge.
Fourth, the applicability of the proposed method is influenced by both structural setting and data quality. In terms of structural setting, the method is most effective for structurally controlled reservoirs where explicit geological rules (e.g., fault-cutting relationships, stratigraphic ordering, structural closure geometry) can be formalised as knowledge graph constraints. Purely stratigraphic or diagenetically controlled reservoirs, where structural constraints play a subordinate role, may benefit less from the knowledge graph framework. In terms of data conditions, the method’s performance may decline when: (i) seismic data quality is insufficient to reliably identify fault geometries and horizon positions (e.g., signal-to-noise ratio < 3 in target intervals); (ii) the number of interpreted horizons is too few (<3) to establish meaningful stratigraphic ordering constraints; or (iii) the geological setting is so poorly understood that reliable constraint rules cannot be formulated.
Fifth, transferring the knowledge graph rules from one basin to another presents specific challenges. While the TKA ontology structure (entity types, relationship categories, and inference rule formats) is designed to be basin-independent, the specific constraint parameter values (e.g., acceptable fault dip ranges, displacement thresholds, stratigraphic ordering rules) are inherently basin-specific and must be re-calibrated using local geological data and expert knowledge. In our experience, adapting the knowledge graph to a new basin typically requires: (i) the modification of 30–50% of the constraint parameter values; (ii) addition of basin-specific relationship types (e.g., salt-related structural rules for basins with evaporite sequences); and (iii) expert review and validation of the adapted rules, which takes approximately 2–4 weeks for a new structural domain. Future work should explore semi-automated rule adaptation using transfer learning techniques applied to knowledge graphs.
Future development directions include: (i) integrating graph neural networks and attention mechanisms to improve automatic geological feature identification, and exploring automatic geological knowledge extraction based on large language models [63,64]; (ii) expanding multi-scale, multi-physics coupled modelling capabilities by integrating geochemical, geophysical, and fluid dynamics information, with particular potential present in carbon storage and geothermal energy applications [65,66]; (iii) incorporating uncertainty quantification and information-entropy-based quality measures to provide probabilistic risk assessment for three-dimensional geological models [67]; and (iv) establishing industry standards and sharing mechanisms for geological knowledge graphs to promote cross-basin knowledge reuse. Additionally, coupling the knowledge graph framework with emerging multi-source geochemical and sedimentological data integration approaches [59] represents a promising direction for enhancing geological constraint fidelity in complex sedimentary systems.

5. Conclusions

This study develops a knowledge graph-guided intelligent geological structural modelling methodology and validates it through three representative application cases. The principal contributions and findings are summarised as follows:
(1)
Hierarchical knowledge representation. A three-tier knowledge architecture (TKA) has been constructed, comprising geological entity, relationship, and inference layers. This architecture supports multi-hop reasoning for complex geological queries, achieving over a 90% success rate for queries requiring three or more relationship traversals. The ablation study confirms that TKA contributes the largest improvement in geological reasonableness (ΔR_geo = +10.6 percentage points).
(2)
Knowledge-constrained modelling algorithms. Four core algorithms have been developed: KILGA for automated intersection line generation, HAMR-APEE for adaptive mesh refinement, STFMA for thrust-fault geometric modelling, and a sequence stratigraphic-constrained sublayer method. These algorithms systematically integrate geological knowledge constraints into computational processes, achieving automated identification of 66 fault–horizon intersection relationships in the Wangyaonan case and effective elimination of aliasing artefacts in the Fengjiawan case.
(3)
Bidirectional knowledge–model linkage. A publish–subscribe-based incremental update mechanism enables real-time model modification upon knowledge graph changes. This capability reduces iteration time from days (complete rebuilding) to minutes (local updating), as demonstrated by the thrust-fault removal experiment.
(4)
Quantitative performance improvement. Compared with conventional surface-based workflows across three study areas, the proposed method reduces RMSE from 15–20 m to 5–8 m (53–69% reduction), improves geological reasonableness from 82–86% to 95–96%, and shortens modelling cycles from 45–60 days to 8–12 days (77–82% reduction).
(5)
Cross-basin applicability. Successful application in three structurally distinct basins—the Ordos Basin (micro-amplitude structures), Qaidam Basin (thrust-nappe systems), and Sichuan Basin (deep buried structures)—demonstrates the method’s broad applicability across different geological conditions, providing technical support for resource evaluation and exploration decision-making in complex geological environments.

Supplementary Materials

The following supporting information can be downloaded at https://www.mdpi.com/article/10.3390/pr14111736/s1, Table S1: Complete 66-pair fault–horizon intersection line data from the Wangyaonan Block geological structural knowledge graph analysis.

Author Contributions

Conceptualization, X.X., K.Z. and W.Y.; methodology, X.X.; software, X.X.; validation, X.X., K.Z., W.W. and H.L.; formal analysis, X.X.; investigation, W.W.; resources, W.Y.; data curation, X.W.; writing—original draft preparation, X.X.; writing—review and editing, W.W.; visualisation, X.W.; supervision, W.Y.; project administration, W.Y. and X.Z.; funding acquisition, W.Y. and X.Z. All authors have read and agreed to the published version of the manuscript.

Funding

This research was funded by the China National Petroleum Corporation (CNPC), grant numbers 2021ZG03 “Research on Key New Technologies for Seismic Processing and Interpretation and Development of Intelligent Software”, 2023DJ84 “Research on Key Technologies of Artificial Intelligence for Oil and Gas Exploration and Development”, and 2024ZJ21 “Research on Key Technologies for Fracture Identification and Characterisation in Carbonate Reservoirs”. The APC was funded by the China National Petroleum Corporation (CNPC).

Data Availability Statement

The datasets presented in this study are not publicly available due to confidentiality restrictions. The geological and geophysical data used in this research, including seismic interpretation results, well logging data, and structural modelling datasets from the Wangyaonan Block (Ordos Basin), Ganchaigou structural belt (Qaidam Basin), and Fengjiawan buried structure (Sichuan Basin), are proprietary industrial data owned by the China National Petroleum Corporation (CNPC) and its affiliated companies. Access to such data is restricted to authorised personnel within the respective operating companies. Researchers interested in similar datasets may contact the corresponding author for guidance on potential collaboration opportunities.

Acknowledgments

The authors would like to thank the technical staff at the Research Institute of Petroleum Exploration and Development (RIPED), China National Petroleum Corporation, for providing the valuable geological and geophysical datasets used in this study. We acknowledge the computational support provided by the High-Performance Computing Center of RIPED for the intensive numerical simulations and knowledge graph processing. We also appreciate the technical discussions and suggestions from colleagues in the Intelligent Geological Modeling Laboratory. The authors acknowledge the use of various open-source software packages and libraries that contributed to the development of the algorithms presented in this work. The authors thank the anonymous reviewers for their constructive comments and suggestions, which have substantially improved the quality of this manuscript. We are also grateful to the journal editor for providing comprehensive guidance on manuscript organization, figure quality enhancement, and technical presentation, which greatly enhanced the overall coherence and readability of this work.

Conflicts of Interest

Authors Xin Xu, Wuyang Yang, Xinjian Wei, Weisheng Wang, Xiangyang Zhang and Haishan Li were employed by the Research Institute of Petroleum Exploration & Development -Northwest (NWGI), petrochina. The remaining authors declare that the research was conducted in the absence of any commercial or financial relationships that could be construed as a potential conflict of interest.

Abbreviations

The following abbreviations are used in this manuscript:
TKAThree-Tier Knowledge Architecture
KILGAKnowledge-Driven Intersection Line Generation Algorithm
HAMR-APEEHierarchical Adaptive Mesh Refinement Algorithm based on A Posteriori Error Estimation
STFMASpecialised Thrust-Fault Modelling Algorithm
RDFResource Description Framework
OWLWeb Ontology Language
XFEMExtended Finite Element Method
DCELDoubly Connected Edge List
CCSCarbon Capture and Storage
LLMLarge Language Model
MWDMeasurement While Drilling
LWDLogging While Drilling

References

  1. Turner, A.K.; Fookes, P.G. Geological modelling: Challenges and future directions. Eng. Geol. 2006, 84, 1–16. [Google Scholar]
  2. Wellmann, J.F.; Caumon, G. 3-D structural geological models: Concepts, methods, and uncertainties. Adv. Geophys. 2018, 59, 1–121. [Google Scholar] [CrossRef]
  3. Caumon, G.; Collon-Drouaillet, P.; Le Carlier de Veslud, C.; Viseur, S.; Sausse, J. Surface-based 3D geological modeling of geological structures. Math. Geosci. 2009, 41, 927–945. [Google Scholar] [CrossRef]
  4. Yang, H.; Fu, J.H.; Wei, X.S.; Liu, X.S. Sulige field in the Ordos Basin: Geological setting, field discovery and tight gas reservoirs. Mar. Pet. Geol. 2008, 25, 387–400. [Google Scholar] [CrossRef]
  5. Yin, A.; Dang, Y.Q.; Wang, L.C.; Jiang, W.M.; Zhou, S.P.; Chen, X.H.; Gehrels, G.E.; McRivette, M.W. Cenozoic tectonic evolution of Qaidam basin and its surrounding regions (Part 1): The Southern Qilian Shan–Nan Shan thrust belt and northern Qaidam basin. Geol. Soc. Am. Bull. 2008, 120, 813–846. [Google Scholar] [CrossRef]
  6. Chilès, J.-P.; Delfiner, P. Geostatistics: Modeling Spatial Uncertainty, 2nd ed.; Wiley: Hoboken, NJ, USA, 2012. [Google Scholar] [CrossRef]
  7. Fasshauer, G.E. Meshfree Approximation Methods with MATLAB; World Scientific: Singapore, 2007. [Google Scholar] [CrossRef]
  8. Shewchuk, J.R. Delaunay refinement algorithms for triangular mesh generation. Comput. Geom. 2002, 22, 21–74. [Google Scholar] [CrossRef]
  9. Lajaunie, C.; Courrioux, G.; Manuel, L. Foliation fields and 3D cartography in geology: Principles of a method based on potential interpolation. Math. Geol. 1997, 29, 571–584. [Google Scholar] [CrossRef]
  10. McInerney, P.; Guillen, A.; Courrioux, G.; Calcagno, P.; Lees, T. Building 3D Geological Models Directly from the Data: A New Approach Applied to Broken Hill, Australia. U.S. Geological Survey Open-File Report 2005-1428; 2005. Available online: https://pubs.usgs.gov/of/2005/1428/mcinerney/ (accessed on 1 May 2026).
  11. Grose, L.; Ailleres, L.; Laurent, G.; Armit, R.J.; Jessell, M.W. LoopStructural 1.0: Time-aware geological modelling. Geosci. Model Dev. 2021, 14, 3915–3937. [Google Scholar] [CrossRef]
  12. Hogan, A.; Blomqvist, E.; Cochez, M.; d’Amato, C.; de Melo, G.; Gutierrez, C.; Kirrane, S.; Gayo, J.E.L.; Navigli, R.; Neumaier, S.; et al. Knowledge graphs. ACM Comput. Surv. 2021, 54, 1–37. [Google Scholar] [CrossRef]
  13. Noy, N.; Gao, Y.; Jain, A.; Narayanan, A.; Patterson, A.; Taylor, J. Industry-scale knowledge graphs: Lessons and challenges. Commun. ACM 2019, 62, 36–43. [Google Scholar] [CrossRef]
  14. Ma, X. Knowledge graph construction and application in geosciences: A review. Comput. Geosci. 2022, 161, 105082. [Google Scholar] [CrossRef]
  15. Zuo, R.; Carranza, E.J.M. Support vector machine: A tool for mapping mineral prospectivity. Comput. Geosci. 2011, 37, 1967–1975. [Google Scholar] [CrossRef]
  16. Bergen, K.J.; Johnson, P.A.; de Hoop, M.V.; Beroza, G.C. Machine learning for data-driven discovery in solid Earth geoscience. Science 2019, 363, eaau0323. [Google Scholar] [CrossRef]
  17. Wu, J.; Zhang, X.; Luo, S.; Zhang, K. Deep learning for seismic structural interpretation: A review. Geophysics 2021, 86, WC1–WC23. [Google Scholar]
  18. Cyganiak, R.; Wood, D.; Lanthaler, M. (Eds.) RDF 1.1 Concepts and Abstract Syntax; W3C Recommendation; World Wide Web Consortium: Cambridge, MA, USA, 2014; Available online: https://www.w3.org/TR/rdf11-concepts/ (accessed on 3 April 2026).
  19. W3C OWL Working Group. OWL 2 Web Ontology Language Document Overview, 2nd ed.; W3C Recommendation; World Wide Web Consortium: Wakefield, MA, USA, 2012; Available online: https://www.w3.org/TR/owl2-overview/ (accessed on 3 April 2026).
  20. Robinson, I.; Webber, J.; Eifrem, E. Graph Databases: New Opportunities for Connected Data, 2nd ed.; O’Reilly Media: Sebastopol, CA, USA, 2015. [Google Scholar]
  21. Angles, R.; Gutierrez, C. Survey of graph database models. ACM Comput. Surv. 2008, 40, 1–39. [Google Scholar] [CrossRef]
  22. W3C. RDF 1.1 Turtle: Terse RDF Triple Language; W3C Recommendation; World Wide Web Consortium: Wakefield, MA, USA, 2014; Available online: https://www.w3.org/TR/turtle/ (accessed on 3 April 2026).
  23. Open Geospatial Consortium (OGC). OpenGIS Simple Features Implementation Specification for Geographic Infor-mation—Part 1: Common Architecture; OGC 06-103r4; Open Geospatial Consortium (OGC): Arlington, VA, USA, 2011; Available online: https://www.ogc.org/standards/sfa (accessed on 3 April 2026).
  24. Horrocks, I.; Patel-Schneider, P.F.; Boley, H.; Tabet, S.; Grosof, B.; Dean, M. SWRL: A Semantic Web Rule Language Combining OWL and RuleML; W3C Member Submission; World Wide Web Consortium: Wakefield, MA, USA, 2004; Available online: https://www.w3.org/Submission/SWRL/ (accessed on 3 April 2026).
  25. Ericson, C. Real-Time Collision Detection; Morgan Kaufmann Series in Interactive 3D Technology; Morgan Kaufmann: San Francisco, CA, USA, 2005; ISBN 978-1558607323. [Google Scholar]
  26. Möller, T.; Trumbore, B. Fast, minimum storage ray–triangle intersection. J. Graph. Tools 1997, 2, 21–28. [Google Scholar] [CrossRef]
  27. Liu, S.G.; Yang, Y.; Deng, B.; Zhong, Y.; Wen, L.; Sun, W.; Li, Z.; Jansa, L.; Li, J.; Song, J.; et al. Tectonic evolution of the Sichuan Basin, Southwest China. Earth-Sci. Rev. 2021, 213, 103470. [Google Scholar] [CrossRef]
  28. de Berg, M.; Cheong, O.; van Kreveld, M.; Overmars, M. Computational Geometry: Algorithms and Applications, 3rd ed.; Springer: Berlin, Germany, 2008. [Google Scholar] [CrossRef]
  29. Mäntylä, M. An Introduction to Solid Modeling; Computer Science Press: Rockville, MD, USA, 1988. [Google Scholar]
  30. Baader, F.; Calvanese, D.; McGuinness, D.L.; Nardi, D.; Patel-Schneider, P.F. (Eds.) The Description Logic Handbook: Theory, Implementation, and Applications; Cambridge University Press: Cambridge, UK, 2003; ISBN 0-521-78176-0. [Google Scholar]
  31. Snyder, J.P. Map Projections—A Working Manual; U.S. Geological Survey Professional Paper 1395; U.S. Government Printing Office: Washington, DC, USA, 1987; pp. ix, 385. [Google Scholar]
  32. Grubbs, F.E. Procedures for detecting outlying observations in samples. Technometrics 1969, 11, 1–21. [Google Scholar] [CrossRef]
  33. Beckmann, N.; Kriegel, H.-P.; Schneider, R.; Seeger, B. The R*-tree: An efficient and robust access method for points and rectangles. In Proceedings of the 1990 ACM SIGMOD International Conference on Management of Data, Atlantic City, NJ, USA, 23–25 May 1990; pp. 322–331. [Google Scholar] [CrossRef]
  34. Edelsbrunner, H. Geometry and Topology for Mesh Generation; Cambridge University Press: Cambridge, UK, 2001; pp. xii, 177. ISBN 0-521-79309-2. [Google Scholar]
  35. Zienkiewicz, O.C.; Zhu, J.Z. A simple error estimator and adaptive procedure for practical engineering analysis. Int. J. Numer. Methods Eng. 1987, 24, 337–357. [Google Scholar] [CrossRef]
  36. Samet, H. Foundations of Multidimensional and Metric Data Structures; Morgan Kaufmann: San Francisco, CA, USA, 2006; p. 1024. ISBN 0-12-369446-9. [Google Scholar]
  37. Bank, R.E.; Sherman, A.H.; Weiser, A. Some refinement algorithms and data structures for regular local mesh refinement. In Scientific Computing; North-Holland: Amsterdam, The Netherlands, 1983; pp. 3–17. [Google Scholar]
  38. Frey, P.J.; Alauzet, F. Anisotropic mesh adaptation for CFD computations. Comput. Methods Appl. Mech. Eng. 2005, 194, 5068–5082. [Google Scholar] [CrossRef]
  39. Allan, U.S. Model for hydrocarbon migration and entrapment within faulted structures. AAPG Bull. 1989, 73, 803–811. [Google Scholar] [CrossRef]
  40. de Boor, C. A Practical Guide to Splines, Revised ed.; Springer: New York, NY, USA, 2001. [Google Scholar]
  41. Suppe, J. Geometry and kinematics of fault-bend folding. Am. J. Sci. 1983, 283, 684–721. [Google Scholar] [CrossRef]
  42. Carr, J.C.; Beatson, R.K.; Cherrie, J.B.; Mitchell, T.J.; Fright, W.R.; McCallum, B.C.; Evans, T.R. Reconstruction and representation of 3D objects with radial basis functions. In Proceedings of the 28th Annual Conference on Computer Graphics and Interactive Techniques (SIGGRAPH’01), Los Angeles, CA, USA, 12–17 August 2001; pp. 67–76. [Google Scholar] [CrossRef]
  43. Belytschko, T.; Black, T. Elastic crack growth in finite elements with minimal remeshing. Int. J. Numer. Methods Eng. 1999, 45, 601–620. [Google Scholar] [CrossRef]
  44. Mallat, S. A Wavelet Tour of Signal Processing: The Sparse Way, 3rd ed.; Academic Press: Burlington, MA, USA, 2009; p. xxxii, 832. ISBN 978-0-12-374370-1. [Google Scholar]
  45. Milankovitch, M. Kanon der Erdbestrahlung und Seine Anwendung auf das Eiszeitenproblem; Royal Serbian Academy: Belgrade, Serbia, 1941; pp. 1–633. [Google Scholar]
  46. Sakoe, H.; Chiba, S. Dynamic Programming Algorithm Optimization for Spoken Word Recognition. IEEE Trans. Acoust. Speech Signal Process. 1978, 26, 43–49. [Google Scholar] [CrossRef]
  47. Gamma, E.; Helm, R.; Johnson, R.; Vlissides, J. Design Patterns: Elements of Reusable Object-Oriented Software; Addison-Wesley: Reading, MA, USA, 1994; pp. 1–395. [Google Scholar]
  48. de Berg, M.; van Kreveld, M.; Overmars, M.; Schwarzkopf, O. Computational Geometry: Algorithms and Applications, 2nd ed.; Springer: Berlin/Heidelberg, Germany, 2000; pp. 1–367. ISBN 3-540-65620-0, 978-3-540-65620-3. [Google Scholar]
  49. Fruchterman, T.M.J.; Reingold, E.M. Graph Drawing by Force-Directed Placement. Softw. Pract. Exp. 1991, 21, 1129–1164. [Google Scholar] [CrossRef]
  50. Blondel, V.D.; Guillaume, J.-L.; Lambiotte, R.; Lefebvre, E. Fast Unfolding of Communities in Large Networks. J. Stat. Mech. Theory Exp. 2008, 2008, P10008. [Google Scholar] [CrossRef]
  51. Khronos Group. WebGL 2.0 Specification. Available online: https://www.khronos.org/registry/webgl/specs/latest/2.0/ (accessed on 15 March 2024).
  52. Akenine-Möller, T.; Haines, E.; Hoffman, N. Real-Time Rendering, 4th ed.; CRC Press: Boca Raton, FL, USA, 2018; pp. 1–1198. ISBN 978-1-138-62700-0 / 1-138-62700-3. [Google Scholar]
  53. Eugster, P.T.; Felber, P.A.; Guerraoui, R.; Kermarrec, A.-M. The Many Faces of Publish/Subscribe. ACM Comput. Surv. 2003, 35, 114–131. [Google Scholar] [CrossRef]
  54. Bernstein, P.A.; Newcomer, E. Principles of Transaction Processing, 2nd ed.; Morgan Kaufmann: San Francisco, CA, USA, 2009; pp. 1–416. ISBN -10-1558606238. [Google Scholar]
  55. Gray, J.; Reuter, A. Transaction Processing: Concepts and Techniques; Morgan Kaufmann: San Francisco, CA, USA, 1992; pp. 1–1070. ISBN 1-55860-190-2. [Google Scholar]
  56. Glimm, B.; Horrocks, I.; Motik, B.; Stoilos, G.; Wang, Z. HermiT: An OWL 2 reasoner. J. Autom. Reason. 2014, 53, 245–269. [Google Scholar] [CrossRef]
  57. Schiex, T.; Fargier, H.; Verfaillie, G. Valued constraint satisfaction problems: Hard and easy problems. In Proceedings of the Fourteenth International Joint Conference on Artificial Intelligence, Montreal, QC, Canada, 20–25 August 1995; pp. 631–637. [Google Scholar]
  58. Straeten, C.A.V.; Brett, C.E.; Sageman, B.B. Mudrock sequence stratigraphy: A multi-proxy sedimentological, paleobiological and geochemical approach, Devonian Appalachian Basin. Palaeogeogr. Palaeoclimatol. Palaeoecol. 2011, 304, 54–73. [Google Scholar] [CrossRef]
  59. Liu, Q.; Shi, J.; Shen, Y.; Liang, X.; Jin, Z.; Li, P.; Zhang, X.; Zhu, D.; Meng, Q.; Xu, H.; et al. Volcanics-driven episodic events enhancing organic carbon accumulation in black shale during the Middle Eocene. Geochim. Cosmochim. Acta 2025, 413, 233–240. [Google Scholar] [CrossRef]
  60. LeFever, J.A.; Helms, L.D. Bakken Formation reserve estimates, Williston Basin, North Dakota; North Dakota Department of Mineral Resources: Bismarck, ND, USA, 2008; 16p. [Google Scholar]
  61. Blanc, E.J.-P.; Allen, M.B.; Inger, S.; Hassani, H. Structural styles in the Zagros simple folded zone, Iran. J. Geol. Soc. 2003, 160, 401–412. [Google Scholar] [CrossRef]
  62. Hatcher, R.D., Jr.; Thomas, W.A.; Viele, G.W. (Eds.) The Appalachian–Ouachita Orogen in the United States; Geological Society of America; F-2; The Geology of North America: Boulder, CO, USA, 1989. [Google Scholar]
  63. Qiu, Q.; Wang, B.; Ma, K.; Lü, H.; Tao, L.; Xie, Z. Attention mechanism-enhanced graph convolutional neural network for unbalanced lithology identification. Sci. Rep. 2024, 14, 17319. [Google Scholar] [CrossRef] [PubMed]
  64. Qiu, Q.; Wang, B.; Ma, K.; Lü, H.; Tao, L.; Xie, Z. A practical approach to constructing a geological knowledge graph: A case study of mineral exploration data. J. Earth Sci. 2023, 34, 1374–1389. [Google Scholar] [CrossRef]
  65. Rutqvist, J. The geomechanics of CO2 storage in deep sedimentary formations. Geotech. Geol. Eng. 2012, 30, 525–551. [Google Scholar] [CrossRef]
  66. O’Sullivan, M.J.; Pruess, K.; Lippmann, M.J. State of the art of geothermal reservoir simulation. Geothermics 2001, 30, 395–429. [Google Scholar] [CrossRef]
  67. Wellmann, J.F.; Regenauer-Lieb, K. Uncertainties have a meaning: Information entropy as a quality measure for 3-D geological models. Tectonophysics 2012, 526–529, 207–216. [Google Scholar] [CrossRef]
Figure 1. Comprehensive methodological workflow of the knowledge graph-guided intelligent geological structural modelling approach.
Processes 14 01736 g001
Figure 2. Methodological workflow comparison: commercial geological modelling software approach (left) versus proposed knowledge graph-guided methodology (right). Key improvements include automated standardisation, explicit geological knowledge integration, adaptive algorithms, and incremental model updating capabilities.
Processes 14 01736 g002
Figure 3. Workflow for calculating geological reasonableness (Rgeo) and expert constraint satisfaction index (CSI).
Processes 14 01736 g003
Figure 4. Regional geological setting and locations of the three study areas. (a) Map of the major petroliferous basins in China, with red boxes indicating the locations of the study areas; (b) tectonic subdivision of the Ordos Basin, indicating the Wangyaonan Block; (c) tectonic framework of the Qaidam Basin, indicating the Ganchaigou structural belt; and (d) tectonic subdivision of the Sichuan Basin, indicating the Fengjiawan buried structure.
Processes 14 01736 g004
Figure 5. Application data from the Wangyaonan Block, comprising 6 stratigraphic horizons and 15 strike–slip faults. (a) Spatial distribution of the 6 stratigraphic horizons; (b) spatial distribution of the 15 strike–slip faults.
Processes 14 01736 g005
Figure 6. Three-tier knowledge architecture visualisation for Wangyaonan Block. (a) Basic geological entity layer showing fundamental objects (faults, horizons, structural nodes) with their spatial relationships; (b) enhanced knowledge graph incorporating expert constraints and inference rules, demonstrating the complete three-layer hierarchy with an entity–relationship–reasoning structure.
Processes 14 01736 g006
Figure 7. Fault–horizon intersection relationships identified by the KILGA for the Wangyaonan Block. (a) Initially identified fault and stratigraphic intersection relationships, corresponding to the initial knowledge graph (Figure 6a); (b) fault–stratigraphic intersection relationships after applying expert knowledge constraints, corresponding to the refined knowledge graph (Figure 6b).
Processes 14 01736 g007
Figure 8. Comparison before and after removing the intersection relationship between fault 011 and the horizon C6112-1_Horizon. (a) Before removing the intersection relationship, fault 011 and horizon C6112-1_Horizon exhibit an intersecting relationship; (b) after removing the intersection relationship, fault 011 and horizon C6112-1_Horizon do not intersect, and no intersection line is generated between them.
Processes 14 01736 g008
Figure 9. Quality control of KILGA-generated intersection lines in the Wangyaonan Block. (a) Quality control of intersection lines between faults and horizons, where green dots represent hanging-wall quality control points and red dots represent footwall quality control points; (b) quality control of intersection lines between horizons and model boundaries, where blue dots represent horizon–boundary quality control points.
Processes 14 01736 g009
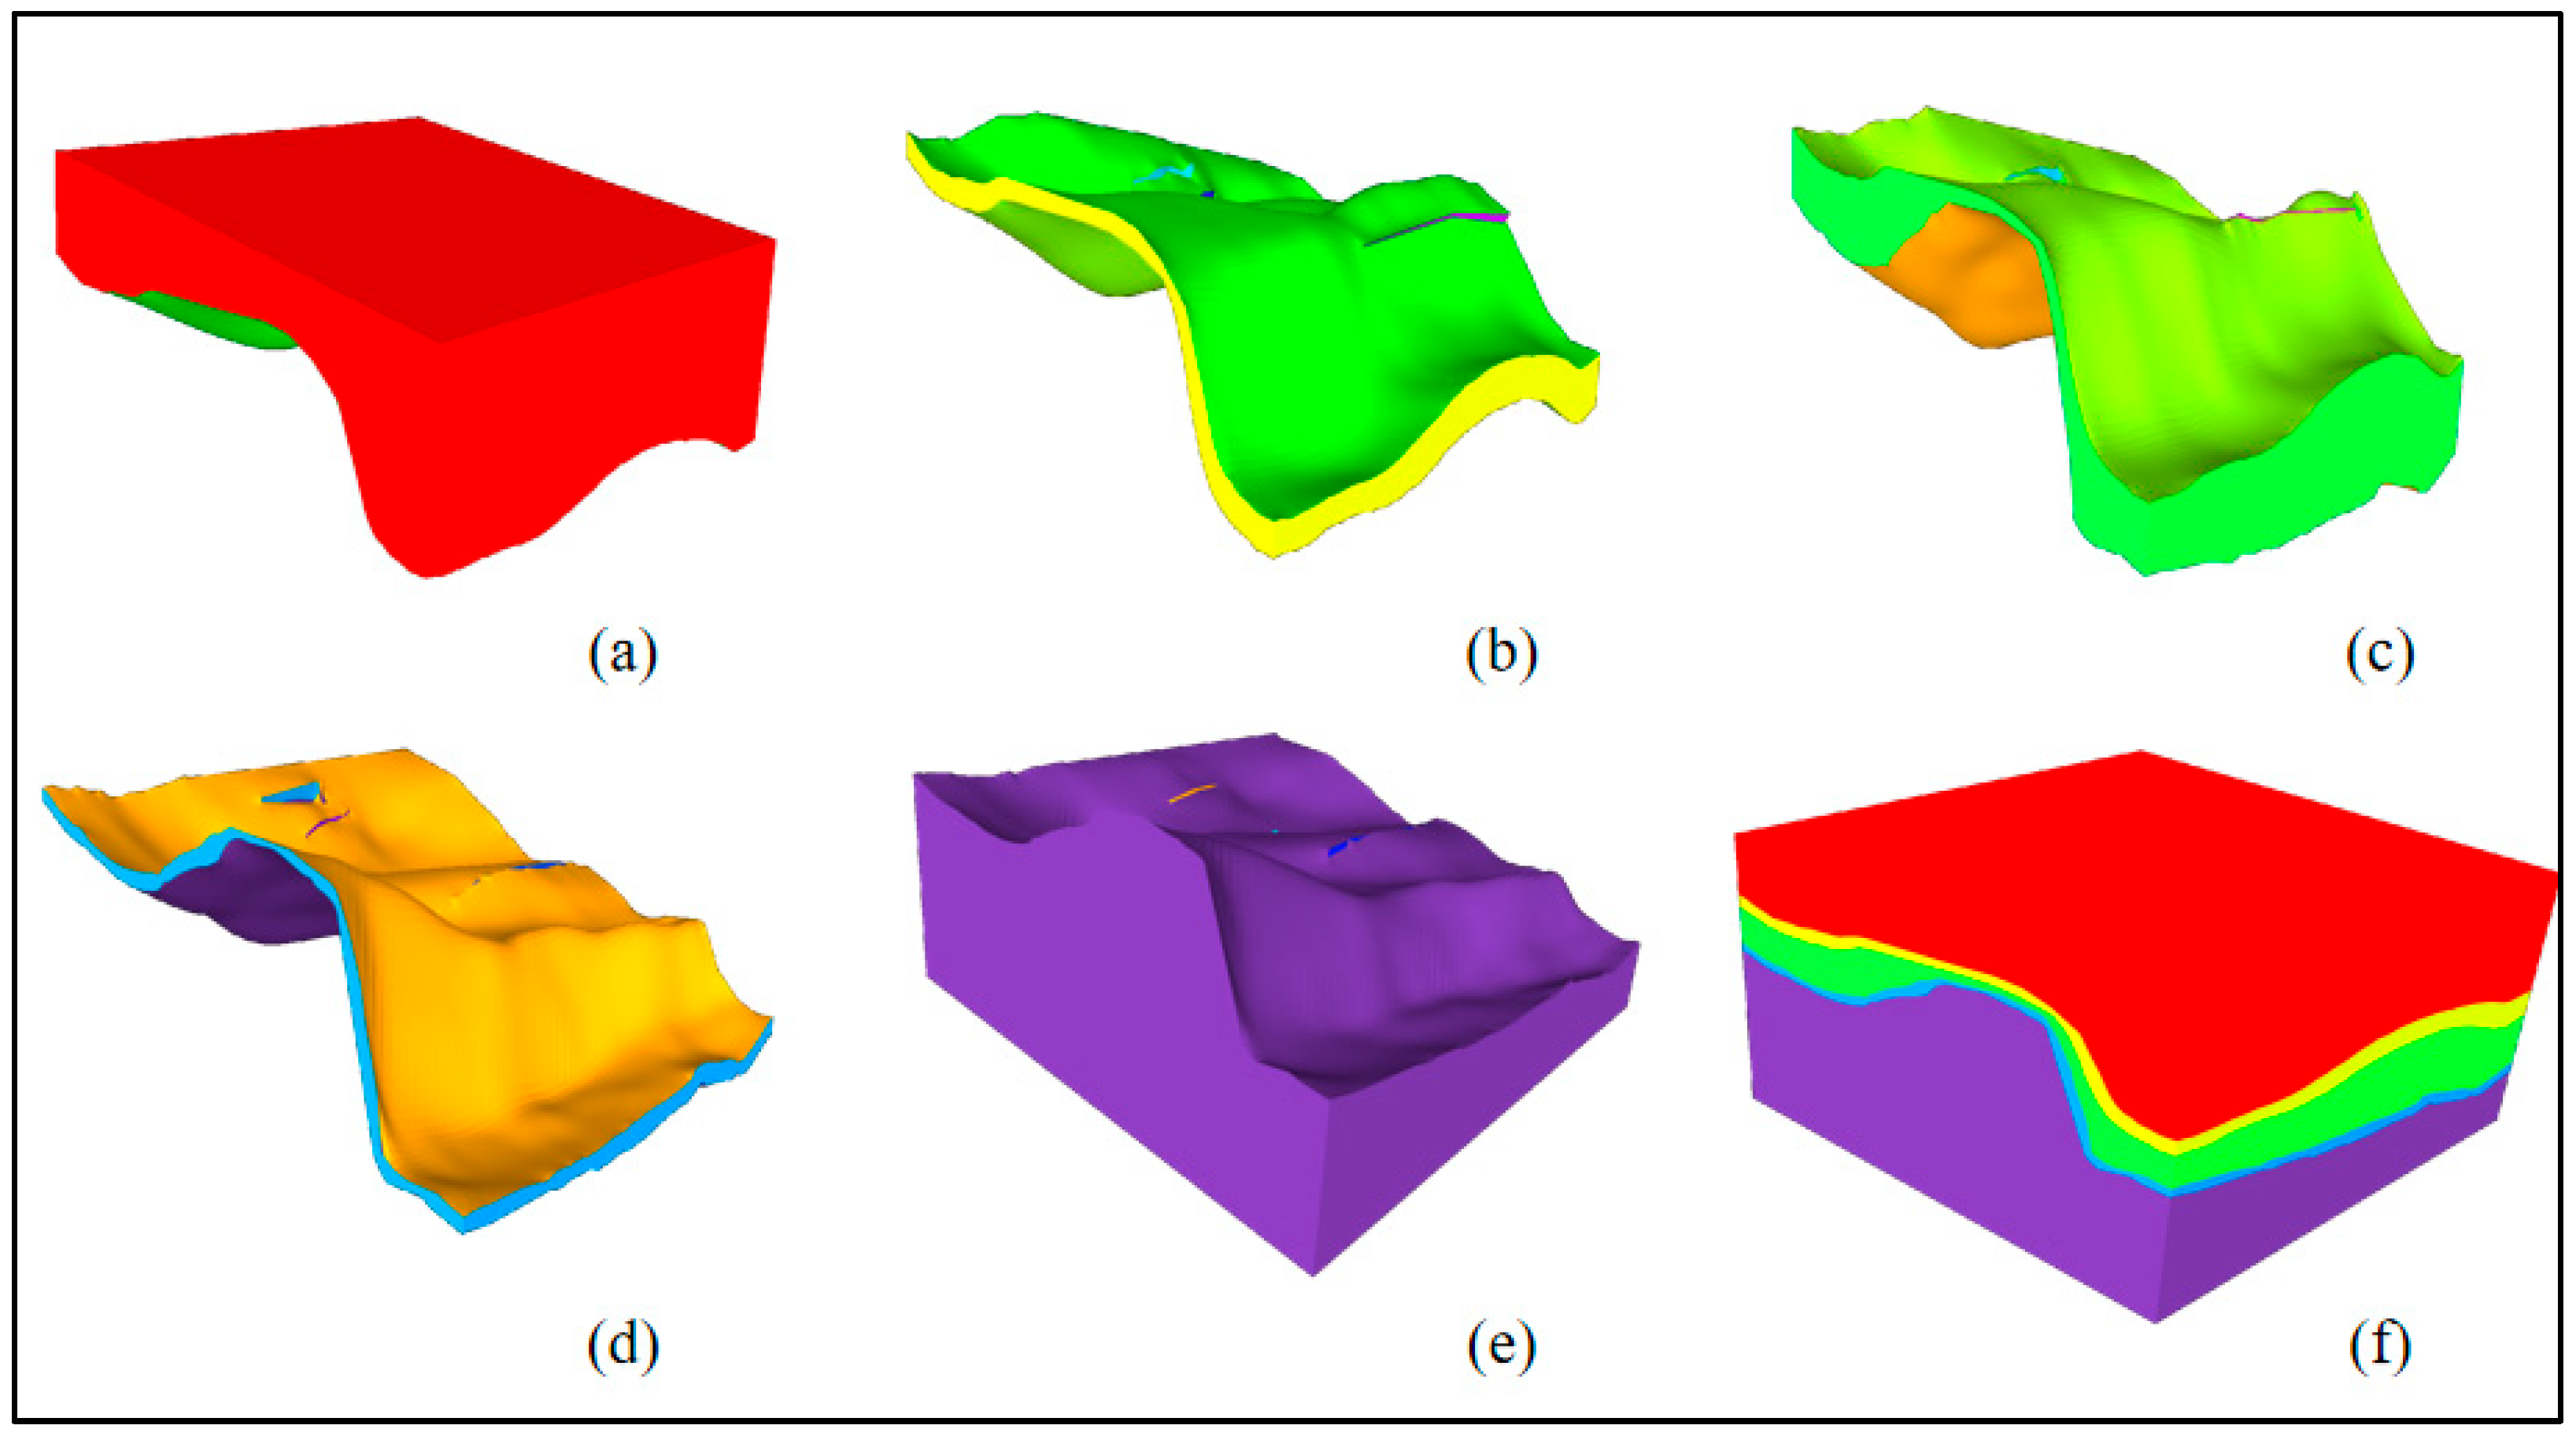
Figure 10. Geological structural sub-block modelling results. (a) Closed solid model sub-block formed by horizon C6113-2_Horizon and the model upper boundary; (b) closed solid model sub-block formed by horizon C6113-2_Horizon and horizon C6113-1_Horizon; (c) closed solid model sub-block formed by horizon C6113-1_Horizon and horizon C6112-4_Horizon; (d) closed solid model sub-block formed by horizon C6112-4_Horizon and horizon C6112-3_Horizon; (e) closed solid model sub-block formed by horizon C6112-3_Horizon and horizon C6112-2_Horizon; (f) closed solid model sub-block formed by horizon C6112-2_Horizon and horizon C6112-1_Horizon; (g) closed solid model sub-block formed by horizon C6112-1_Horizon and the model lower boundary.
Processes 14 01736 g010
Figure 11. Results after meshing the closed solid model of geological structural sub-blocks. (ag) correspond to the same sub-block intervals as Figure 10a–g, respectively.
Processes 14 01736 g011
Figure 12. Geological structural modelling results for the Wangyaonan Block. (a) Solid closed model; (b) geological structural model after meshing.
Processes 14 01736 g012
Figure 13. Application data from the Ganchaigou Block, comprising 4 stratigraphic horizons and 7 faults. (a) Spatial distribution of the 4 stratigraphic horizons; (b) spatial distribution of the 7 faults.
Processes 14 01736 g013
Figure 14. Geological structural knowledge graph for the Ganchaigou Block: (a) initial geological structural knowledge graph generated according to seismic interpretation data (faults and horizons); (b) geological structural knowledge graph with fault–horizon intersection relationships adjusted based on geological expert knowledge.
Processes 14 01736 g014
Figure 15. Based on the knowledge graph constraints, spatial topological reasoning identified key fault structures present within the geological body and automatically generated a total of 17 pairs of fault–horizon intersection lines.
Processes 14 01736 g015
Figure 16. Quality control of intersection line data based on expert knowledge. (a) Quality control of intersection lines generated between faults and hanging walls/footwalls of strata; (b) quality control of intersection lines generated between strata and model boundaries.
Processes 14 01736 g016
Figure 17. Geological structural sub-block modelling results for the Ganchaigou Block. (a) Closed solid model sub-block formed by horizon gcg_T1 and the model upper boundary; (b) closed solid model sub-block formed by horizon gcg_T1 and horizon gcg_T2; (c) closed solid model sub-block formed by horizon gcg_T2 and horizon gcg_T3; (d) closed solid model sub-block formed by horizon gcg_T3 and horizon gcg_T4; (e) closed solid model sub-block formed by horizon gcg_T4 and the model lower boundary; (f) final geological structural model obtained by integrating geological sub-block models according to stratigraphic chronology.
Processes 14 01736 g017
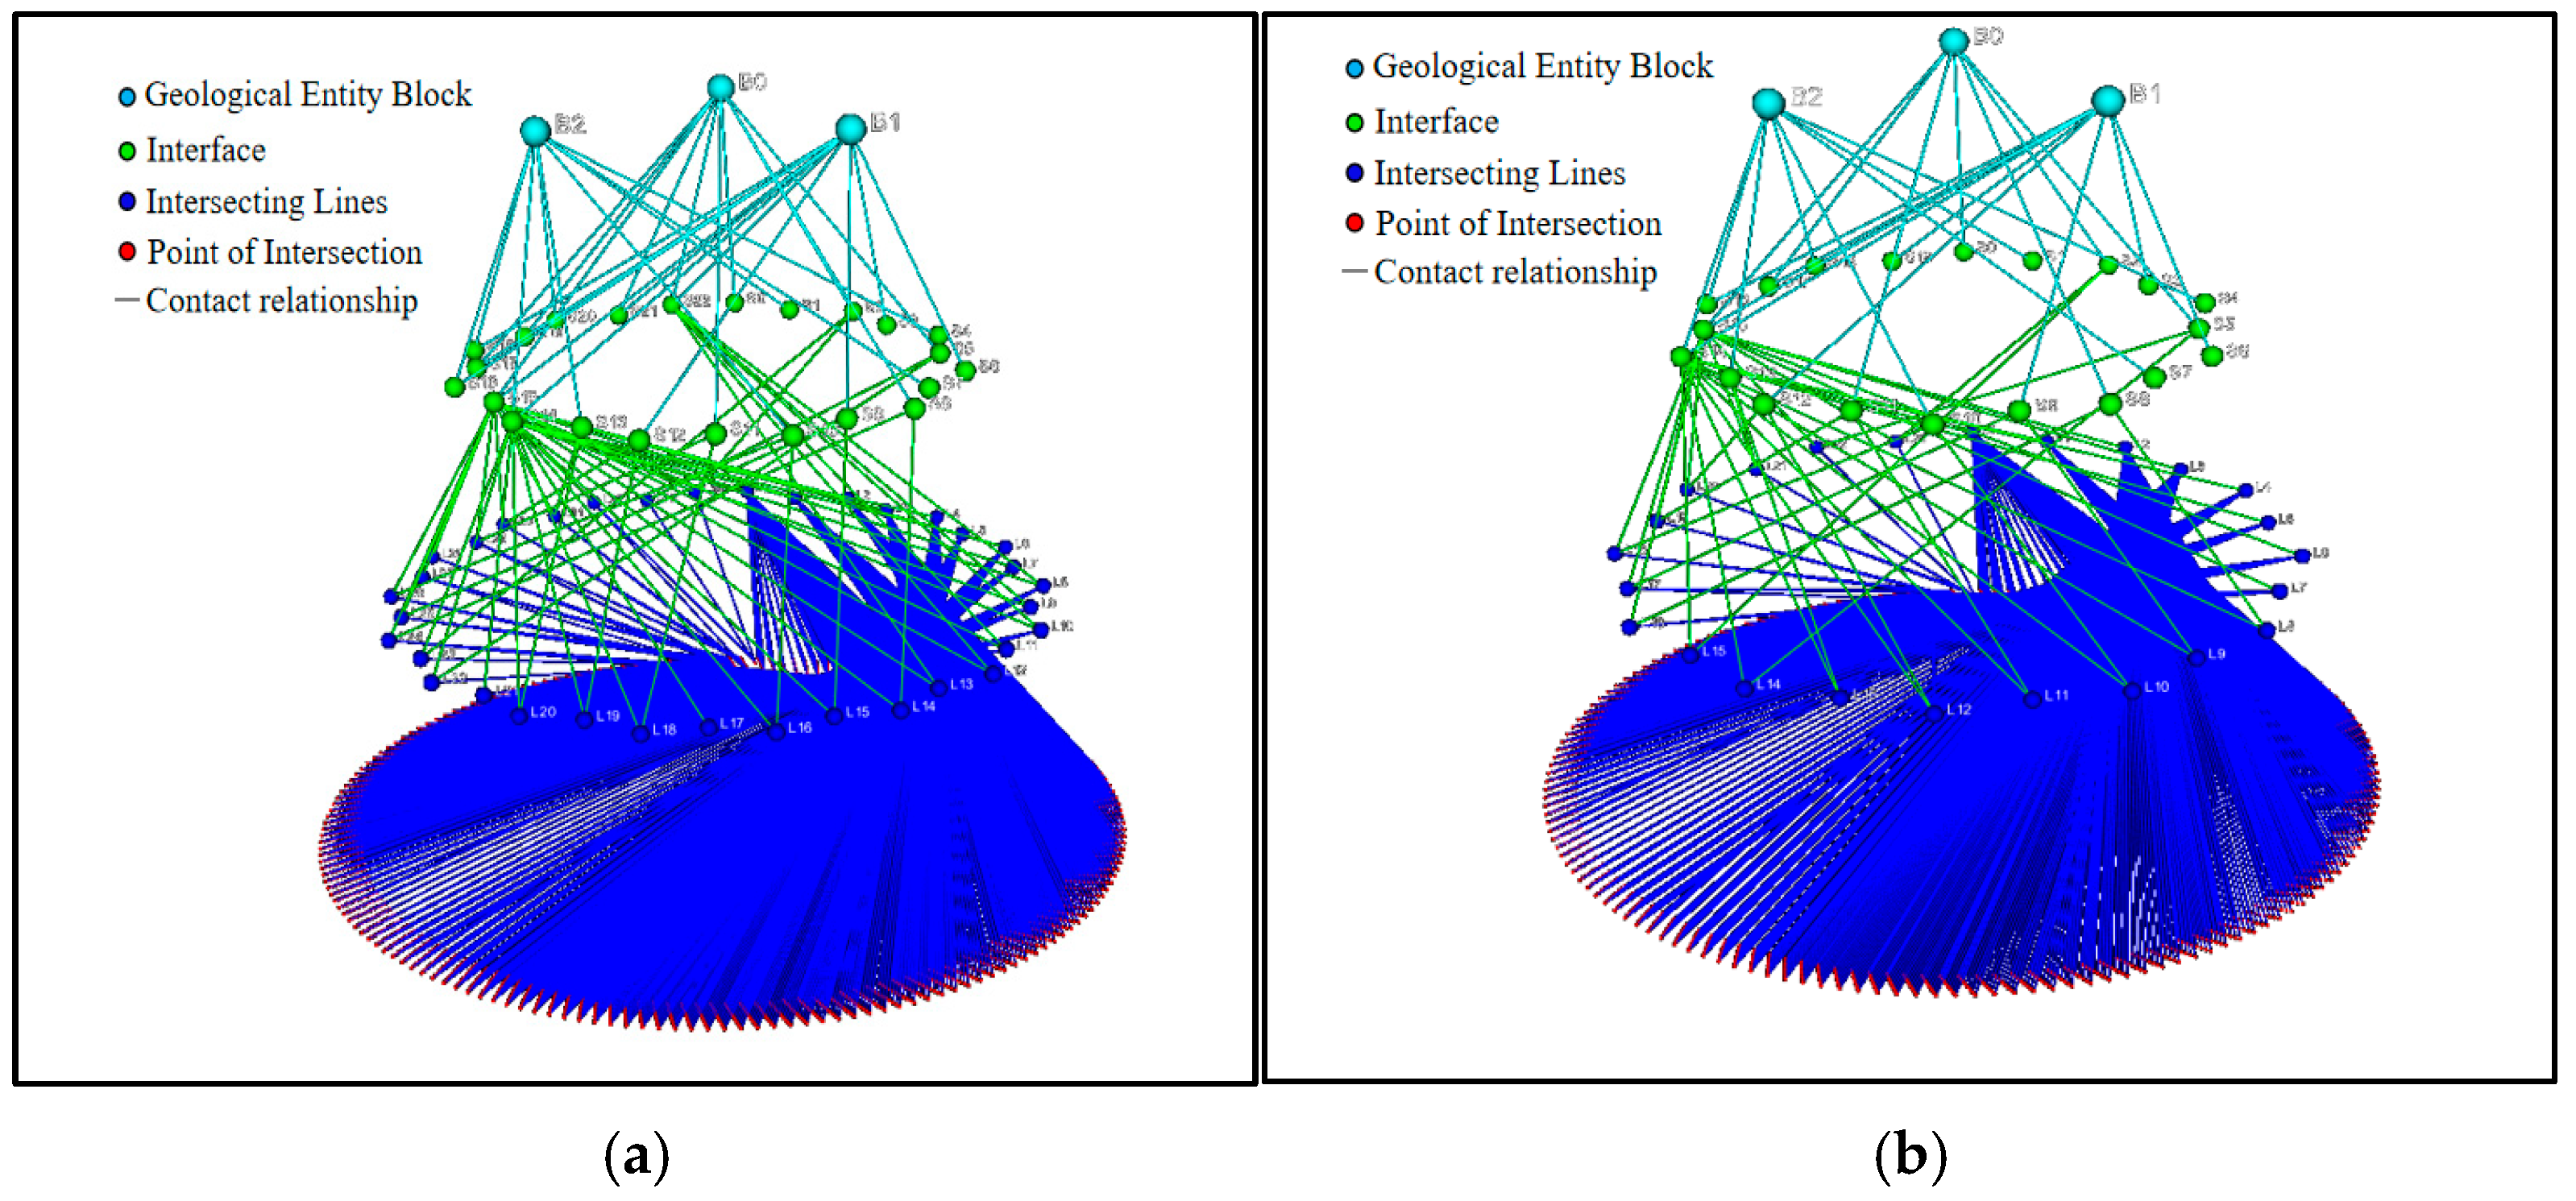
Figure 18. Effect of HAMR-APEE adaptive mesh refinement on the Fengjiawan structural model. (a) Structural model before refinement, showing aliasing artefacts at fault–horizon intersections; (b) structural model after adaptive refinement, with aliasing artefacts eliminated; (c) gridded model before refinement; (d) gridded model after refinement; (e) enlarged view of the boxed region in (a), highlighting staircase artefacts along the fault plane; (f) enlarged view of the corresponding region in (b), showing smooth fault–horizon contact after refinement; (g) enlarged view of the boxed region in (c), highlighting grid aliasing; (h) enlarged view of the corresponding region in (d), showing improved grid conformity.
Processes 14 01736 g018aProcesses 14 01736 g018b
Figure 19. Effect of sublayer subdivision on the Fengjiawan structural model. (a) Structural model without sublayer subdivision; (b) structural model with sublayer subdivision applied, showing refined stratigraphic layering; (c) gridded model without sublayer subdivision; (d) gridded model with sublayer subdivision, demonstrating improved stratigraphic resolution.
Processes 14 01736 g019
Figure 20. Corresponding changes in geological structure knowledge graphs before and after thrust fault removal. (a) Geological structure knowledge graph before thrust-fault removal; (b) geological structure knowledge graph after thrust-fault removal.
Processes 14 01736 g020
Figure 21. Comparison of different geological model sub-blocks and the overall geological structural model before and after removal of the reverse fault, shown in blue. (a) Sub-block A before removal of the reverse fault; (b) sub-block B before reverse fault removal; (c) sub-block C before reverse fault removal; (d) overall geological structural model before removal of the reverse fault; (e) sub-block A after removal of the reverse fault; (f) sub-block B after reverse fault removal; (g) sub-block C after reverse fault removal; (h) overall geological structural model after removal of the reverse fault.
Processes 14 01736 g021
Table 1. Key parameter settings for the three study areas.
ParameterSymbolWangyaonanGanchaigouFengjiawanBasis
Reference sampling densityρ050 pts/km240 pts/km245 pts/km2Average seismic point spacing
Curvature sensitivity coefficientα0.50.80.7Structural complexity
Initial error thresholdη_tol (initial)0.30.30.3Empirical
Final error thresholdη_tol (final)0.10.10.1Target precision
Refinement fractionθ0.50.50.5Standard practice
Convergence criterionΔη/η<2%<2%<2%Numerical stability
Maximum iterationsk_max888Computational budget
Actual convergence iterationsk_actual465Observed
Smoothing weightλ0.30.20.25Balance of smoothness vs. fidelity
Table 2. Summary of fault–horizon intersection relationships in the Wangyaonan Block.
ParameterValue
Total intersection pairs66
Horizons involved6 (C6113-2 through C6112-1)
Faults involved15 (fault 001–015, excluding 006, 008, 014)
Intersection typesNormal cutting 45%, strike–slip offset 32%, thrust cutting 23%
Mean intersection line length2.3 ± 0.8 km
Geometric validation pass rate100% topologically consistent
Expert validation pass rate94% geologically reasonable
Table 3. Summary of fault–horizon intersection relationships in the Ganchaigou Block.
Contact No.FaultHorizonContact No.FaultHorizon
1gcg_F1gcg_T110gcg_F6gcg_T2
2gcg_F2gcg_T111gcg_F2gcg_T3
3gcg_F3gcg_T112gcg_F3gcg_T3
4gcg_F4gcg_T113gcg_F4gcg_T3
5gcg_F5gcg_T114gcg_F6gcg_T3
6gcg_F1gcg_T215gcg_F2gcg_T4
7gcg_F2gcg_T216gcg_F3gcg_T4
8gcg_F4gcg_T217gcg_F6gcg_T4
9gcg_F5gcg_T2
Table 4. Summary of fault–horizon intersection relationships in the Fengjiawan buried structure.
ParameterValue
Total intersection pairs28
Horizons involved5
Faults involved8 (3 reverse, 5 normal)
Intersection typesNormal cutting 54%, thrust cutting 36%, strike–slip offset 10%
Mean intersection line length3.1 ± 1.2 km
Geometric validation pass rate100% topologically consistent
Expert validation pass rate92% geologically reasonable
Table 5. Quantitative comparison between the proposed method and commercial geological modelling software workflow.
MetricWangyaonan (Proposed/Commercial Geological Modelling Software)Ganchaigou (Proposed/Commercial Geological Modelling Software)Fengjiawan (Proposed/Commercial Geological Modelling Software)
RMSE (m)5.2/16.87.1/18.56.3/15.2
Maximum error (m)12.1/38.518.3/52.715.6/41.2
Geological reasonableness
Rgeo (%)
96.2/84.594.8/82.195.5/86.3
Modelling cycle (days)8/4512/6010/52
Manual intervention (hours)6/12010/1808/150
Fault intersection accuracy (%)97.0/78.593.5/71.295.2/75.8
Table 6. Ablation study results for the Wangyaonan Block.
ConfigurationRMSE
(m)
Geological Reasonableness
(%)
Cycle
(Days)
Full method (TKA + KILGA + HAMR-APEE + STFMA)5.296.28
Without TKA (no knowledge constraints)9.885.612
Without KILGA (manual intersection lines)7.590.120
Without HAMR-APEE (uniform mesh)8.188.37
Without bidirectional linkage5.495.815
Table 7. Comparative analysis with existing geological modelling approaches.
CapabilityTraditional Software (Commercial Geological Modelling Software)ML-Based Methods
[16,17]
Existing Geological KG [14]Proposed Method
Knowledge integrationManual, implicitFeature-learnedFlat relationalHierarchical, formalised
Multi-hop reasoning
(≥3 hops)
Not supportedNot supportedLimited (78.3% success)Supported (>90% success)
Fault intersection automationSemi-manualNot addressedNot addressedFully automated (KILGA)
Adaptive mesh refinementUniform meshingNot applicableNot applicableAnisotropic HAMR-APEE
Thrust-fault modellingSurface intersections frequentLimited training dataNot addressedSTFMA with XFEM
Dynamic model updatingFull rebuild requiredRetraining requiredQuery-level onlyIncremental, real-time
Average RMSE (m)15–2010–15 (reported)Not reported5–8
Table 8. Comparison of the three study areas with global structural analogues.
Study AreaStructural StyleGlobal Analogue(s)Shared ChallengesRelevance to Proposed Method
Wangyaonan, Ordos BasinIntracratonic micro-amplitude structuresWilliston Basin (USA/Canada); Illinois Basin (USA); Paris Basin (France)Subtle structural closures (<20 m); gentle dips; conventional methods over-smooth featuresTKA knowledge constraints preserve micro-amplitude features that interpolation-based methods tend to eliminate
Ganchaigou, Qaidam BasinCompressional thrust-nappe systemZagros fold-and-thrust belt (Iran/Iraq); Sub-Andean thrust belt (Bolivia/Argentina); Potwar Plateau (Pakistan)Imbricate thrust sheets; ramp–flat fault geometries; listric faults; hanging-wall repetitionSTFMA with RBF and XFEM explicitly handles multi-valued fault surfaces and displacement discontinuities
Fengjiawan, Sichuan BasinDeep buried structures in superimposed basinsAppalachian fold-and-thrust belt (USA); Taranaki Basin (New Zealand); Cooper Basin (Australia)Deep burial (>4000 m); polyphase deformation; complex fault generations; poor seismic imaging at depthHAMR-APEE adaptive meshing eliminates aliasing artefacts that are particularly severe in deep, multi-faulted settings
Disclaimer/Publisher’s Note: The statements, opinions and data contained in all publications are solely those of the individual author(s) and contributor(s) and not of MDPI and/or the editor(s). MDPI and/or the editor(s) disclaim responsibility for any injury to people or property resulting from any ideas, methods, instructions or products referred to in the content.