Article

Practical Approach for Formation Damage Control in CO2 Gas Flooding in Asphaltenic Crude Systems

Department of Petroleum Engineering, University of Louisiana, Lafayette, LA 70503, USA
*
Authors to whom correspondence should be addressed.
Processes 2025, 13(9), 2740; https://doi.org/10.3390/pr13092740
Submission received: 9 July 2025 / Revised: 16 August 2025 / Accepted: 19 August 2025 / Published: 27 August 2025

Abstract

CO2 flooding has become a strategic tool for enhanced oil recovery and reservoir management in mature fields. This technique, however, is rarely utilized in asphaltenic crude oil systems, due to the likely occurrence of high asphaltene precipitation. The effect of asphaltene concentrations and CO2 injection pressures has mostly been the focus of studies in determining asphaltene precipitation rates. However, asphaltene precipitation is not the only direct factor to be considered in predicting the extent of damage in an asphaltenic crude oil system. In this study, a compositional reservoir simulation was conducted using Eclipse 300 to investigate the injection pressure at which asphaltene-induced formation damage can be avoided during both miscible and immiscible CO2 flooding in an asphaltenic crude system. Simulation results indicate that asphaltene-induced permeability reduction exceeded 35% in most affected zones, with a corresponding drop in injectivity of 28%. Cumulative oil recovery improved by 19% compared to base cases without CO2 injection, achieving peak recovery after approximately 4200 days of simulation time. As CO2 was injected below the Minimum Miscibility Pressure (MMP) of 2079.2 psi, a significantly lower asphaltene precipitation was observed near the injector. This could be attributed to the stripping of lighter hydrocarbon components (C2–C7+) occurring in the transition zone at the gas–oil interface. Injecting CO2 at pressures above the MMP resulted in precipitation occurring throughout the entire reservoir at 3200 psia and 1000 bbl/day injection rates. An increase in the injection rate at pressures above the MMP increased the rate of precipitation. However, a further increase in the injection rate from 1000 bbl/day to 4200 bbl/day resulted in a decrease in asphaltene deposition. The pressure drop in the water phase caused by pore throat increase demonstrated that water injection was effective in removing asphaltene deposits and restoring permeability. This work provides critical insights into optimizing CO2 injection strategies to enhance oil recovery while minimizing asphaltene-induced formation damage in heavy oil reservoirs.

1. Background

Global energy consumption in 2024 surpassed the average pace, as the usage of fossil fuel rose around the world, primarily driven by aviation and shipping, especially in developing economies [1]. This trend has been a key factor motivating research into more cost-effective oil production methods to ensure the financial sustainability of service companies in the industry [2].
With the rising discovery of tight oil formations, an increasing number of wells are producing from low-permeability reservoirs [3]. These reservoirs are susceptible to formation damage due to poor pore connectivity and high sensitivity to water saturation. Even minimal damage can drastically lower production to unprofitable levels, potentially resulting in well abandonment if remediation is not feasible [4].
The oil recovery process can be broken into three stages: primary, secondary and tertiary recovery. When the source of natural energy is depleted, secondary recovery, in which artificial sources of energy are used to further recover a fraction of the estimated original oil in place in the reservoir, is used. The well-known mechanisms used in the stage of secondary recovery include thermal flooding and water flooding mechanisms [5]. Enhanced/Tertiary Oil Recovery (EOR/TOR) is an important technique to boost oil production by extracting additional oil that exists after primary and secondary recovery methods have become less effective [6].
Carbon dioxide (CO2) has been widely used in the oil recovery process as a swelling agent to decrease the viscosity of the oil to overcome flow resistances, especially at low oil saturation when the oil blobs become immobile [7]. Beyond its application in miscible displacement, CO2 has recently gained attention as a fracturing and reservoir stimulation agent, particularly in unconventional and tight formations. Its low viscosity and high compressibility enhance its mobility and injectivity, offering improved proppant transport and fracture penetration. CO2 fracturing also presents potential environmental advantages, including reduced water usage and CO2 sequestration opportunities.
Recent studies have demonstrated the complex behavior associated with CO2-based stimulation fluids, including kaolinite settling mechanisms and sediment destabilization under hydrate-bearing conditions, which impact formation integrity and recovery efficiency [8]. These findings highlight the evolving role of CO2 beyond EOR, reinforcing the importance of understanding formation damage mechanisms in CO2-influenced systems.
However, the injection of CO2 into asphaltene-rich crude systems leads to asphaltene precipitation, which may result in formation damage. There are two types of formation damage that can be caused by asphaltene deposition, and they comprise wettability change and clogging effects. Wettability change involves the alteration of a water-wet surface to an oil-wet rock surface. Asphaltene deposits lead to the clogging of pore throats, which reduces the effective permeability of the rock [9].
The injection conditions that lead to formation damage must be well understood and avoided to optimize oil recovery in a CO2 flooding process. The development of an injection practice, which avoids formation damage, requires a detailed comprehension of the dynamics of the asphaltene phase behavior in terms of the reservoir condition, as well as the understanding of the mechanism of the asphaltene-induced formation damage [10]. This paper discusses a computer simulation of asphaltene-induced formation damage during both immiscible and miscible CO2 flooding in an asphaltenic crude system.

Research Contribution and Novelty

This study presents a novel integration of asphaltene precipitation modeling into a compositional reservoir simulation framework for CO2-enhanced oil recovery (EOR) using the Eclipse simulator. Unlike previous studies that typically treat asphaltene formation in isolation, this work links fluid instability to reservoir deliverability metrics, such as injectivity decline and permeability loss. The novelty of this paper is demonstrated through the quantitative evaluation of permeability and injectivity impairment due to asphaltene deposition, showing up to 35% permeability loss in critical flow zones. Additionally, this study deploys the use of a compositional simulator (Eclipse 300) to track fluid-phase behavior and validate operational consequences of CO2 injection in asphaltenic systems. The findings of this study provide practical insights for designing CO2 injection strategies in reservoirs prone to solid-phase deposition.

2. Literature Review

2.1. Asphaltene

Asphaltene was first identified in 1837 by J.B Boussingault who defined it as a residue of the distillation of bitumen, soluble in turpentine but insoluble in alcohol [11]. Asphaltenes are poly-aromatic hydrocarbons composed of fused rings of aromatic molecules such as benzene and, in many cases, attached to heteroatoms such as nitrogen, sulfur, nickel, oxygen, and vanadium [12], as depicted in Figure 1. The density of asphaltene is within the range of 1.16 to 1.25 g/cm3 [13].
Asphaltene of a petroleum hydrocarbon can be defined as the weight fraction of wax-free material that is insoluble in n-heptane but soluble in benzene [12].
Asphaltene remains in solution as a colloidal suspension under the initial reservoir temperature and pressure conditions. Asphaltene deposits on surfaces appear as dark colored material. Asphaltene behavior in petroleum systems differs from source to source due to the variation in the composition of petroleum systems from different sources. Asphaltene is well known to be insoluble in n-alkanes such as n-pentane and n-heptane and soluble in aromatic solvents. However, it can precipitate out of the mixture as the mole fraction of normal heptane or pentane increases. Numerous studies of asphaltene behavior in a toluene solvent have agreed that at concentrations lower than 100 g/L, asphaltene molecules are dispersed in toluene solvent [14]. As the concentration increases up to 100 g/L, a stable suspension of nanoaggregate fines formed by a few molecules occurs. At a concentration near 5 g/L, nanoaggregates form clusters. As the concentration reaches 50 g/L, flocculation occurs. The deposition of flocculates is dependent upon other factors such as shear stress, fluid velocity, and the rate of dissociation of formed flocs [15].
There are a variety of approaches that can be used to describe the behavior of asphaltene in the hydrocarbon mixtures. The generalized Einstein model is used in this study to model asphaltene behavior. Asphaltene modeling involves the modeling of seven processes: precipitation, flocculation, dissociation, adsorption, entrainment, deposition, and formation damage due to deposition [16].
Precipitations only occur when the amount of asphaltene in the oil is greater than the total amount of asphaltene that can be dissolved in the oil. Flocculation is the result of the interaction forces between asphaltene particles. These forces are mainly due to hydrogen bonding and Van der Waals forces. For a system where the dissociation rate is too low compared to the flocculation rate, the size of the aggregates can increase rapidly to the critical size, leading to deposition. Under certain conditions of shear stress, pressure, and temperature, asphaltene flocs can dissociate into small fines. In the dissociation process, the flocculation components are dissociated into smaller fines. The adsorption rate of asphaltene by the rock surface depends on fluid velocity and rock properties. Entrainment can be explained as the process where flocs are returned to the oil phase because of high local fluid velocity [17].

2.2. Mechanisms of CO2 Miscible Flooding in Enhanced Oil Recovery

The mechanism by which CO2 enhances oil recovery can broadly be categorized based on the pressure conditions under which the gas is injected. Depending on whether the pressure exceeds the MMP, the system can transition from a two-phase to a single-phase flow, facilitating miscibility between CO2 and reservoir oil. Miscible flooding mitigates challenges such as capillary entrapment, viscous fingering, and gravity segregation, which are common in immiscible displacement [18].

2.3. Multi-Contact Miscibility

Real-world reservoir conditions seldom permit first-contact miscibility due to the high pressures required and the associated economic implications. However, the more prevalent multi-contact miscibility is the most practical. This process involves continuous diffusion of intermediate hydrocarbons from oil to the CO2 phase, gradually altering the properties of both phases until they become indistinguishable. The rate of diffusion and miscibility is influenced by viscosity contrasts and reservoir heterogeneity. Higher viscosity contrasts necessitate greater CO2 injection pressures to accelerate contact with oil and promote faster miscibility [19].
There are two dominant mechanisms used to describe multi-contact miscibility. They include Condensing Gas Drive Miscibility and Vaporizing Gas Drive Miscibility. In the Condensing Gas Drive Miscibility process, enriched gases transfer intermediate components to the oil, resulting in viscosity and density reduction until miscibility is reached. Vaporizing Gas Drive Miscibility takes place when lean gases like CO2 extract intermediate components from the oil, enriching the gas until it achieves miscibility or reaches a steady state with no further enrichment. A combined condensing/vaporizing mechanism is considered the most realistic, acknowledging the bi-directional nature of mass transfer under varying thermodynamic conditions [20].

3. Methodology

3.1. System Model and Simulation

The task of simulating an oil reservoir can be broken down into three subtasks: hydrocarbon fluid modeling, reservoir modeling, and simulation of the system [21]. Hydrocarbon fluid modeling involves developing mathematical models to predict fluid properties and phase behavior under varying conditions. Equations of state, relating to the temperature, pressure, and volume of a system are used to provide estimates of key fluid properties such as saturation pressure, molar volume, and density [22].
The pseudo-components or plus fractions are used to group heavy hydrocarbons (typically C6+) from lighter hydrocarbon mixtures, reducing the number of variables while maintaining acceptable accuracy. This characterization technique to estimate properties like critical temperature and pressure of the grouped components is carried out using correlations [23]. To validate hydrocarbon fluid models, laboratory data, bubble point tests, and separator test results are compared against simulation outputs. The adjustments are typically made to the pseudo-component properties, or the plus fraction may be further split using Single Carbon Number (SCN) groups based on boiling points. Ensuring monotonic behavior in properties (e.g., boiling point, density) across the carbon number spectrum is crucial during regression [24].
The CO2 flooding simulations were performed using the compositional simulator Eclipse 300, which inherently accounts for phase behavior between gas and liquid phases through an Equation of State (EOS) formulation. The model was constructed under the assumption of isothermal conditions (constant reservoir temperature), which is standard for deep formations where geothermal gradients are small over the modeled timescale.

3.1.1. Governing Equations and Model Assumptions

The reservoir simulation follows the general conservation of mass principle for each component, expressed as
t φ ρ i S i + ( ρ i S i ) = q i
where φ is the porosity, ρi is the phase density, Si is the saturation, vi is the Darcy velocity, and qi is the source/sink term.
The Darcy velocity is calculated using
v i = k k r i μ i P
The boundary conditions applied in the model are no-flow (Neumann) at the outer edges of the reservoir, with specified pressure at the production well. Constant temperature was assumed throughout the reservoir (isothermal conditions). The simulator automatically handled phase equilibrium and flash calculations at each grid block using the compositional EOS approach. While the simulation inputs were calibrated based on laboratory PVT and rock property data, formal Uncertainty Quantification (UQ) was not conducted in this study.

3.1.2. Application of the Generalized Einstein Model in Simulations

The generalized Einstein model was implemented within Eclipse 300 through the ASHP and ASHDEP keyword modules to simulate the coupled precipitation deposition behavior of asphaltene. In this framework, the base oil viscosity is modified according to the classical Einstein equation for suspensions:
μ = μ0 (1 + kφ)
where:
-
μ = apparent viscosity of the crude oil containing precipitated asphaltenes,
-
μ0 = viscosity of the clean base oil,
-
k = intrinsic viscosity factor (dimensionless, tuned during calibration),
-
φ = local volumetric fraction of precipitated asphaltenes in the pore space.
In the model, φ evolves dynamically at each grid block according to precipitation and deposition kinetics:
dφ/dt = rₚ − rd
where rₚ is the precipitation rate and rd is the deposition rate.
Precipitation rate (rₚ) was modeled as a function of pressure drop below the asphaltene onset pressure (AOP) and CO2 mole fraction in the oil phase. This was implemented through Eclipse’s ASHPRC block, using experimental swelling test data to anchor the AOP and laboratory depletion/miscible injection tests to fit the rate constants. The deposition rate (rd) was modeled using a shear-limited sticking coefficient in the ASHDEP block. Laboratory corefloods and literature trends guided the choice of shear-dependence exponent and maximum deposition capacity per grid block. The viscosity modification computed from the Einstein equation fed directly into the simulator’s momentum balance, impacting relative permeability curves and thus production/injection rates.
Key reservoir parameters (intrinsic viscosity k, precipitation and deposition constants, shear exponent, maximum deposition capacity) were tuned in a manner that allows the simulated viscosity–precipitate fraction relationship to match laboratory rheology measurements.

3.1.3. Model Calibration and Validation

The Eclipse 300 compositional model was calibrated against laboratory PVT and miscibility data and validated for asphaltene behavior using experiment-derived trends and independent literature coreflood results. The multi-contact miscibility test indicated MMP of 2079.2 psi. The tuned EOS predicted MMP within ±2% using tie-line shrinkage and key-tie-line enrichment criteria. The oil–water kro, krw, and permeability curves were selected from core analysis and adjusted within laboratory uncertainty to reproduce base-case water breakthrough and post-breakthrough behavior.
The Asphaltene model was generated within the generalized Einstein flocculation–deposition model. The parameters were calibrated to match onset near the bubble point during depletion, increased precipitation above MMP, and shear-limited deposition at high rates. CO2 injection trends were simulated near the bubble point. Widespread precipitation above the MMP, and a reduction in net deposition as the injection rate increases (shear dominance) are consistent with experimental studies.

3.2. Reservoir Model

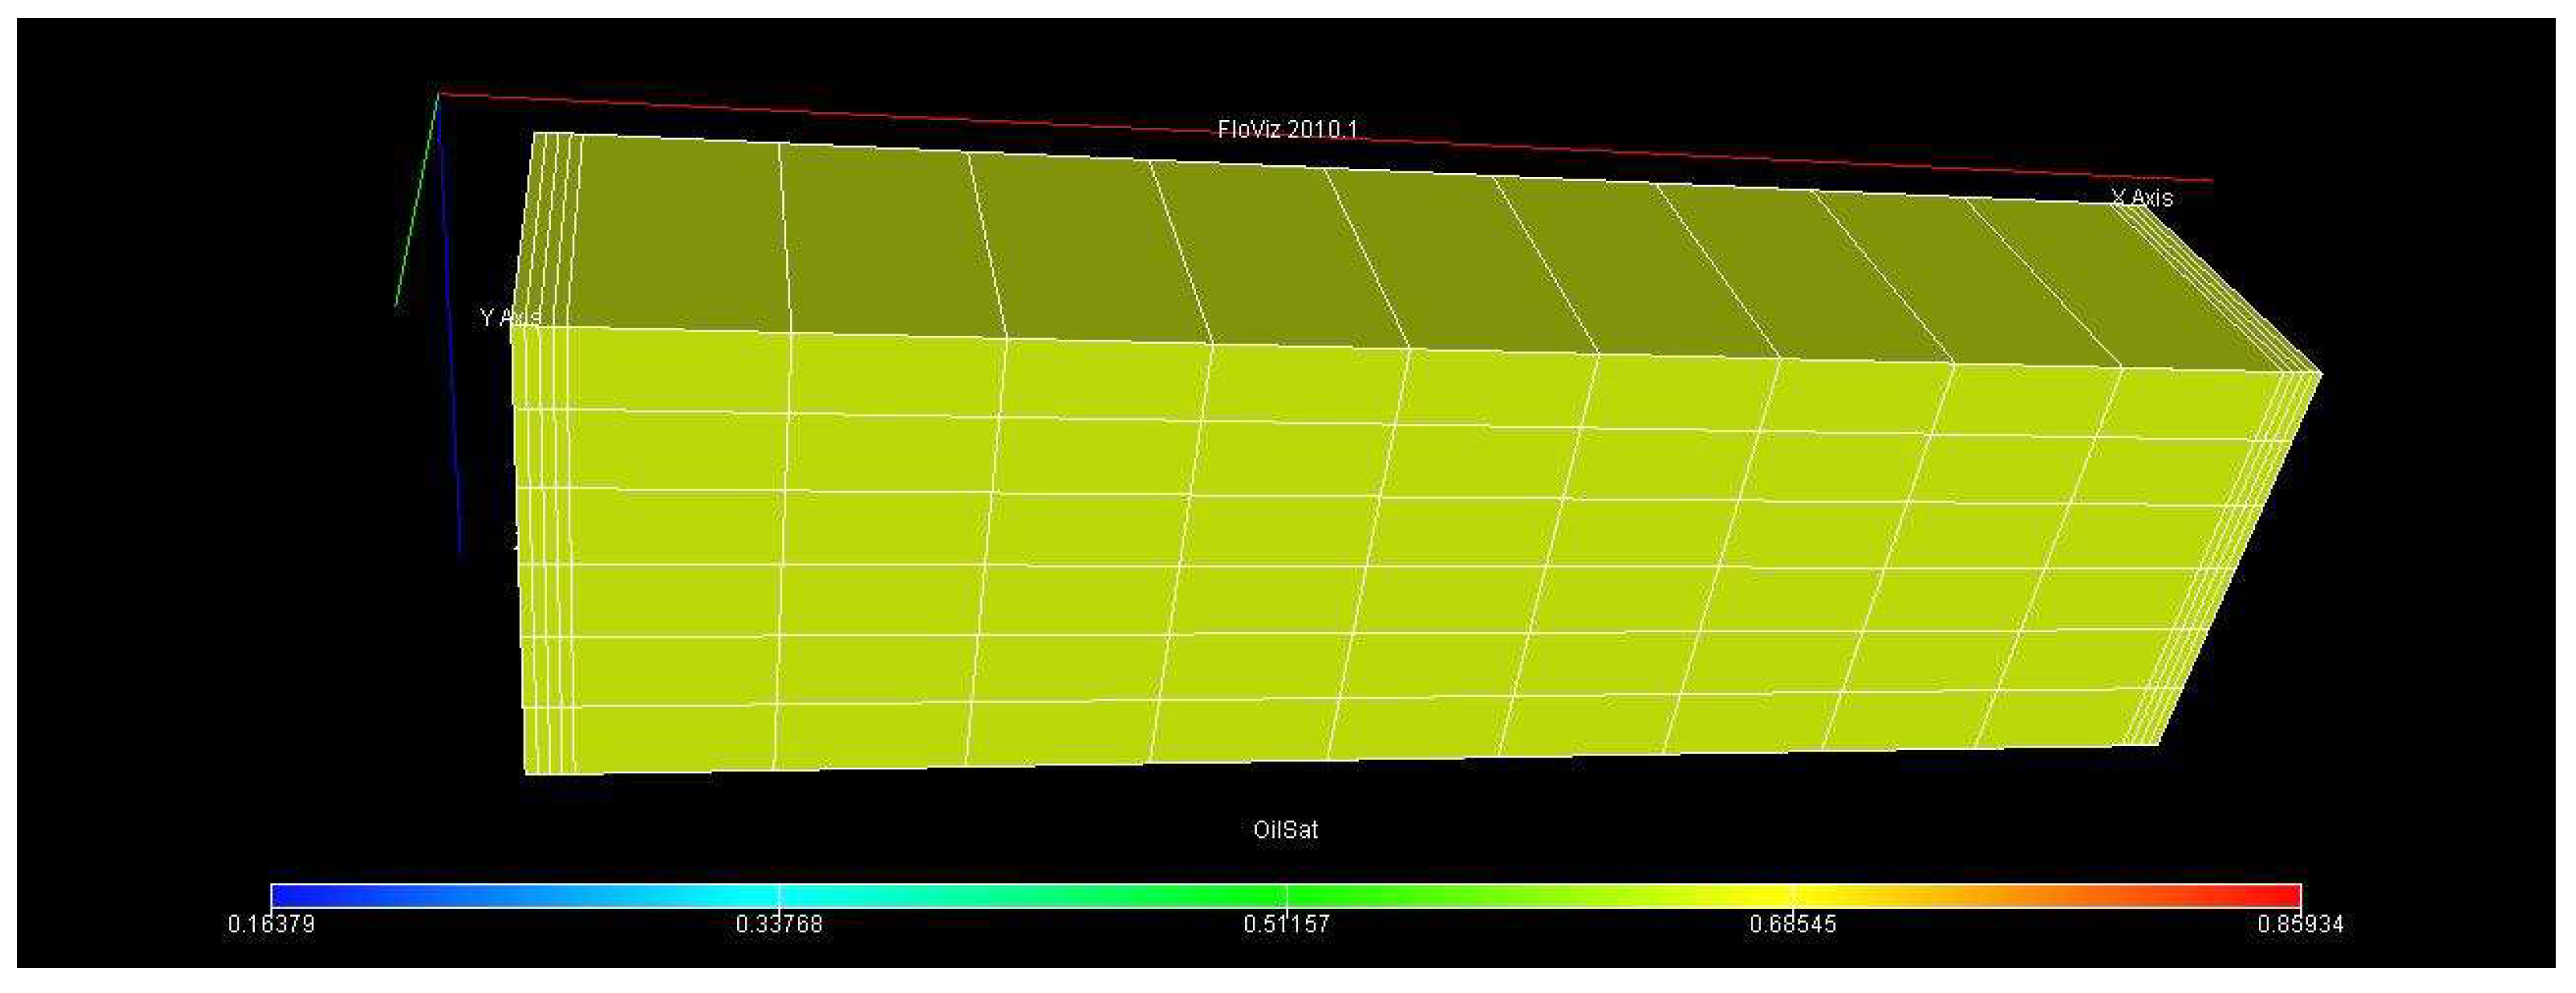
The dimensions of the reservoir used in this study are 4740 ft., 1000 ft., and 30 ft. for the length, width, and thickness, respectively. The top of the reservoir is located at a depth of 4000 ft. The formation gas–oil contact is at a depth of 2000 ft. Oil–water contact is located at a depth of 4050 ft. The reservoir is divided into 17 × 1 × 6 grid blocks along the X, Y, and Z axes, respectively. The first and last four blocks are shortened to 30 feet in length, while intermediate blocks are set to 500 feet. The selected mesh resolution represents a balance between computational efficiency and numerical stability, particularly under compositional flow and phase behavior modeling. This configuration ensured stable convergence without excessive simulation time. In order to handle pressure discontinuities from open wells and maintain grid block pressures close to wellbore pressure, the simulator uses average block pressure.

Reservoir Properties and Visualization Enhancements

The physical properties of the reservoir used in this simulation included an average porosity of 0.18 and a horizontal permeability of 80 mD. The rock was assumed to be homogeneous and isotropic for modeling purposes. Elastic modulus was not included as geomechanical effects were not modeled in Eclipse. Figure 2 depicts the grid block size distribution of the reservoir, with Figure 3 showing the reservoir model with a color gradient legend.
The permeability in the X, Y, and Z directions is 400, 400, and 250 mD, respectively. The average reservoir porosity is 0.15. The initial oil saturation in the reservoir is 0.77. The reservoir temperature is 150 °F, and the formation temperature remains almost constant during the production life of the reservoir. The geothermal gradient effect causes the fluid that flows through the vertical well to the surface to cool [25]. Surface equipment plugging may result from asphaltene precipitation in the well, but this is outside the purview of this investigation.
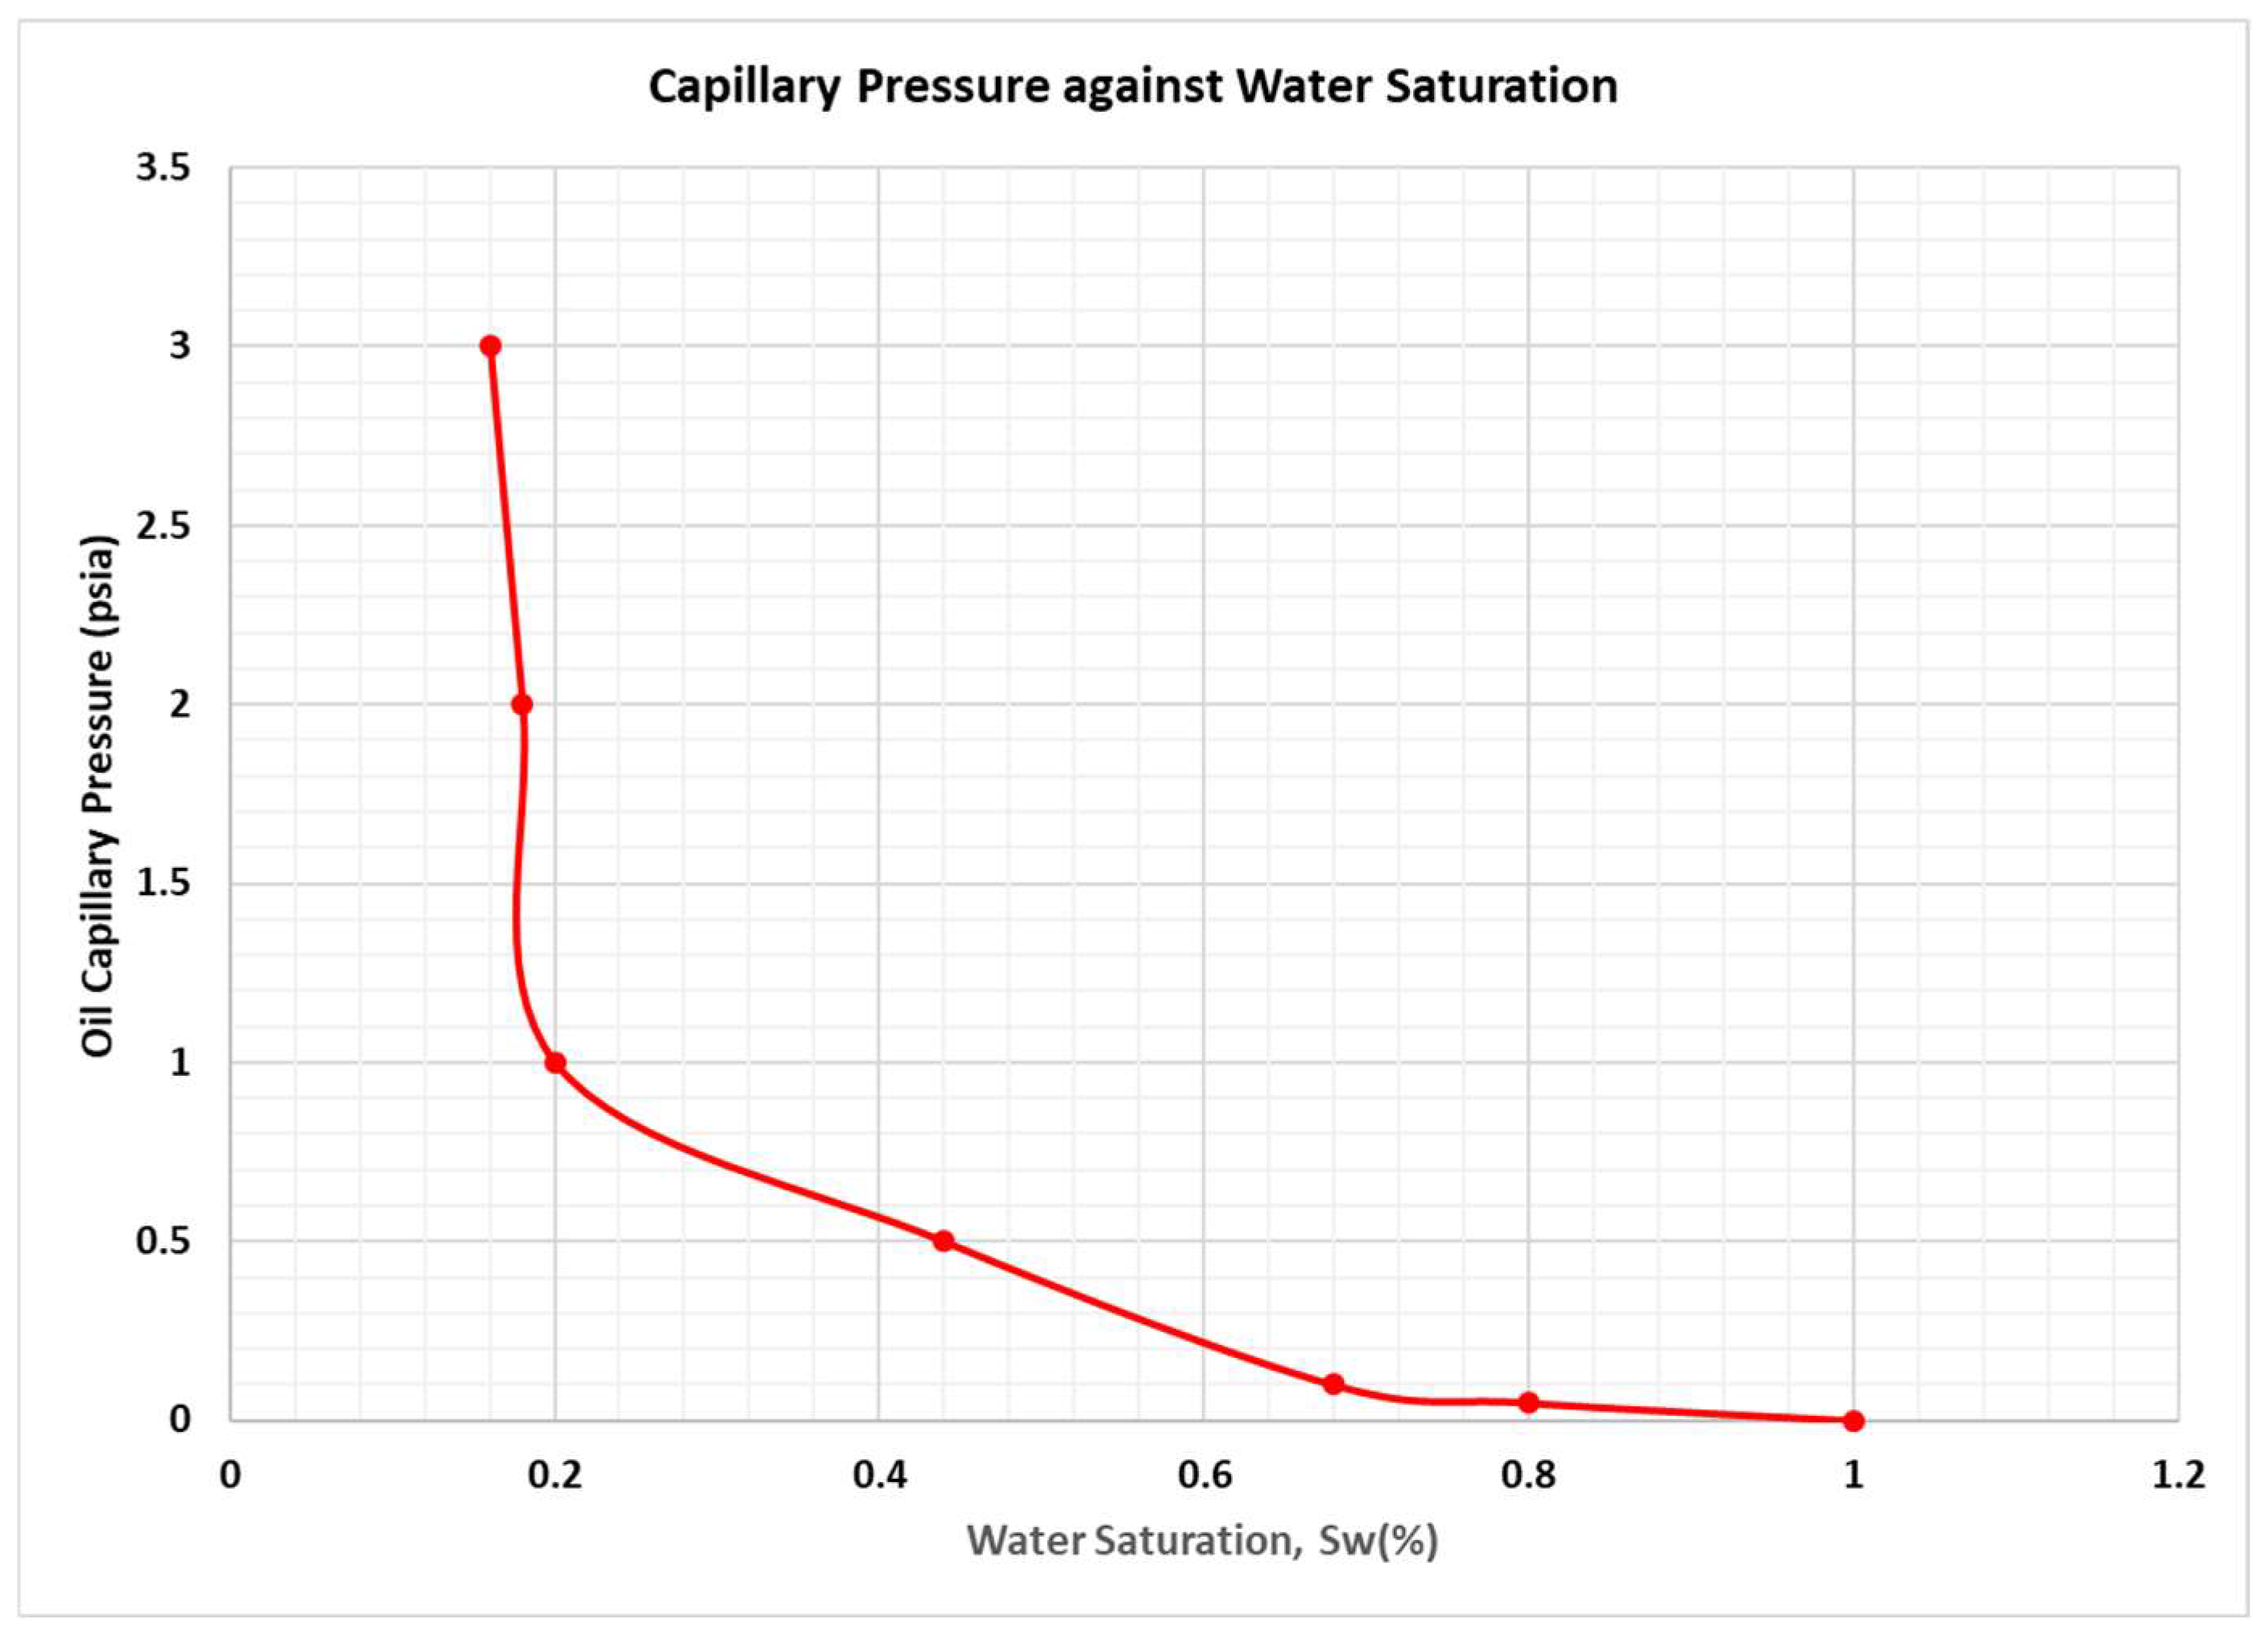
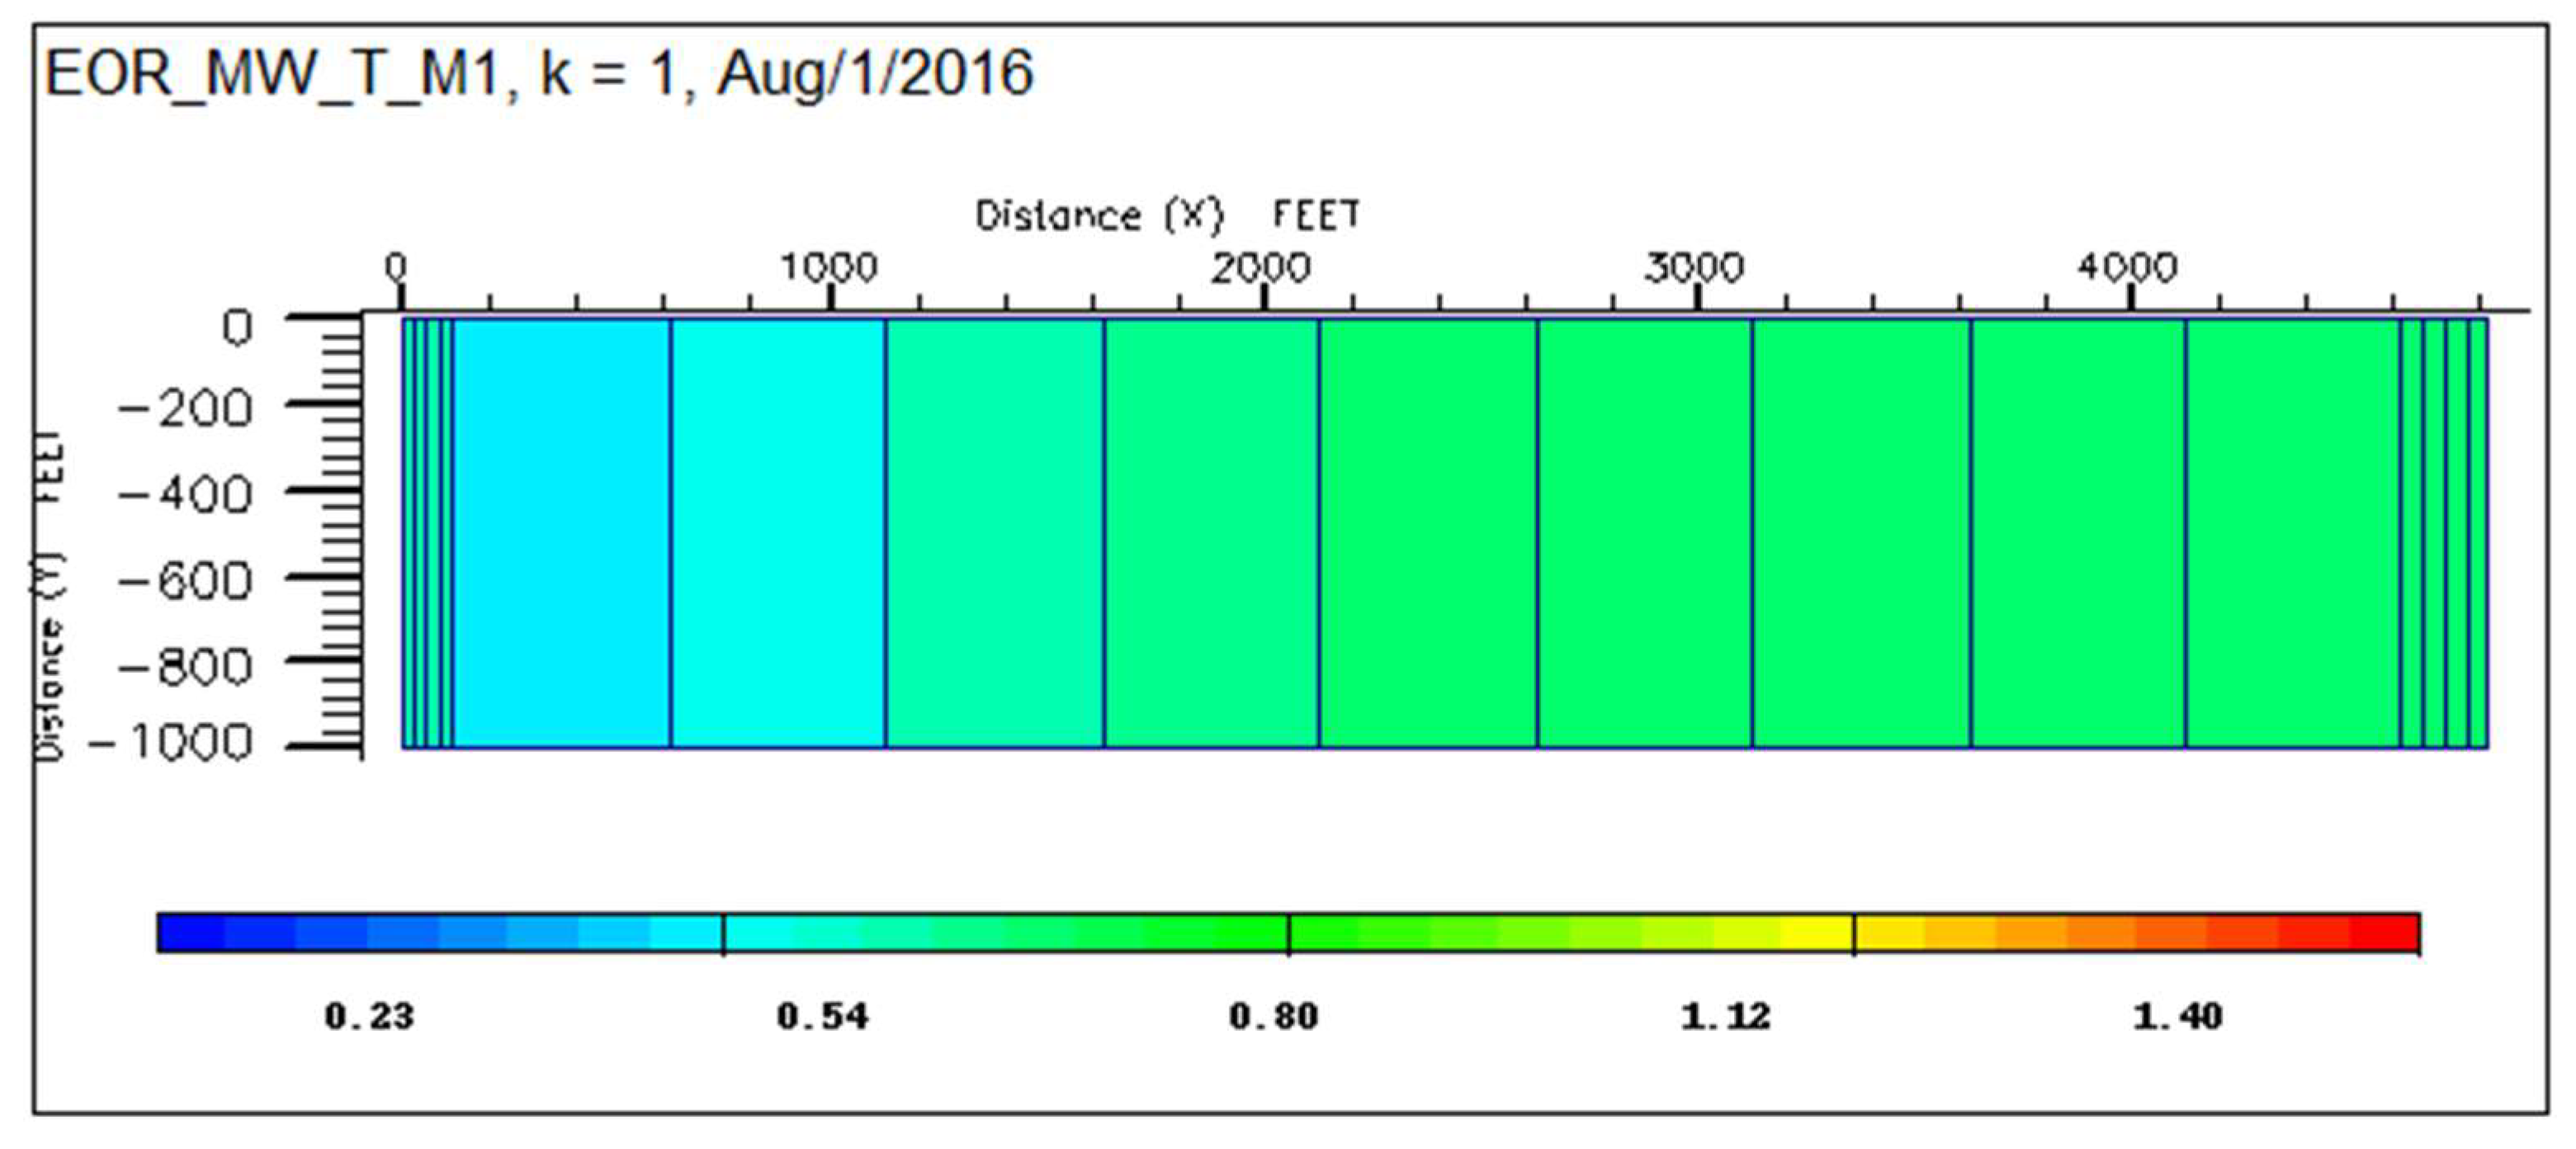
The oil water relative permeability curves are shown in Figure 4. It should be noted that Figure 4 and Figure 5 represent baseline oil characterization data. From Figure 4, the oil–water relative permeability curve intersects at a water saturation of 0.54. The reservoir can thus be described as water-wet. From Figure 5, the residual oil saturation and irreducible water saturation was calibrated to capture the behavior of asphaltenic crude systems under CO2 flooding.

3.3. Mesh Sensitivity Analysis

In numerical reservoir simulation, mesh sensitivity analysis is a critical step in ensuring that the simulation results are independent of grid resolution. The purpose of this analysis is to verify that the predicted physical phenomena such as asphaltene deposition and oil recovery are not artifacts of grid discretization but rather reflect the true behavior of the modeled reservoir system. To assess mesh sensitivity, three different grid systems were tested.
  • Coarse Grid: 17 × 1 × 3 blocks.
  • Medium Grid: 34 × 1 × 6 blocks (base case used in simulation).
  • Fine Grid: 68 × 1 × 12 blocks.
These grids were tested under identical fluid and reservoir conditions, with CO2 injection at a pressure of 3200 psia and a rate of 4200 bbl/day, above the MMP. The deposition and oil recovery behavior for each case was recorded over a simulation time of 30 days.
The comparison as observed in Table 1 indicates that refining the mesh from coarse to medium resulted in noticeable differences in oil recovery and asphaltene deposition patterns. However, the difference between the medium and fine grids was marginal, with less than 0.3% difference in cumulative oil production and <0.1% in maximum deposition. These results confirm grid convergence. The medium grid was thus selected as the optimal compromise between computational cost and simulation accuracy. The spatial deposition profiles for each mesh size revealed the same qualitative trends:
  • Highest deposition near the production well due to low-pressure zones.
  • Moderate deposition in the mid-reservoir due to gravitational segregation.
  • Minimal deposition near the injection well due to higher shear stress.
Each mesh refinement maintained the deposition peak at the same core length, confirming the spatial consistency of the results. The mesh sensitivity analysis validates the numerical stability of the simulation model. The medium grid resolution of 34 × 1 × 6 was used for all subsequent simulations, as it provides a reliable and computationally efficient representation of the reservoir system under CO2 flooding.

4. Results and Discussion

4.1. Simulation Results

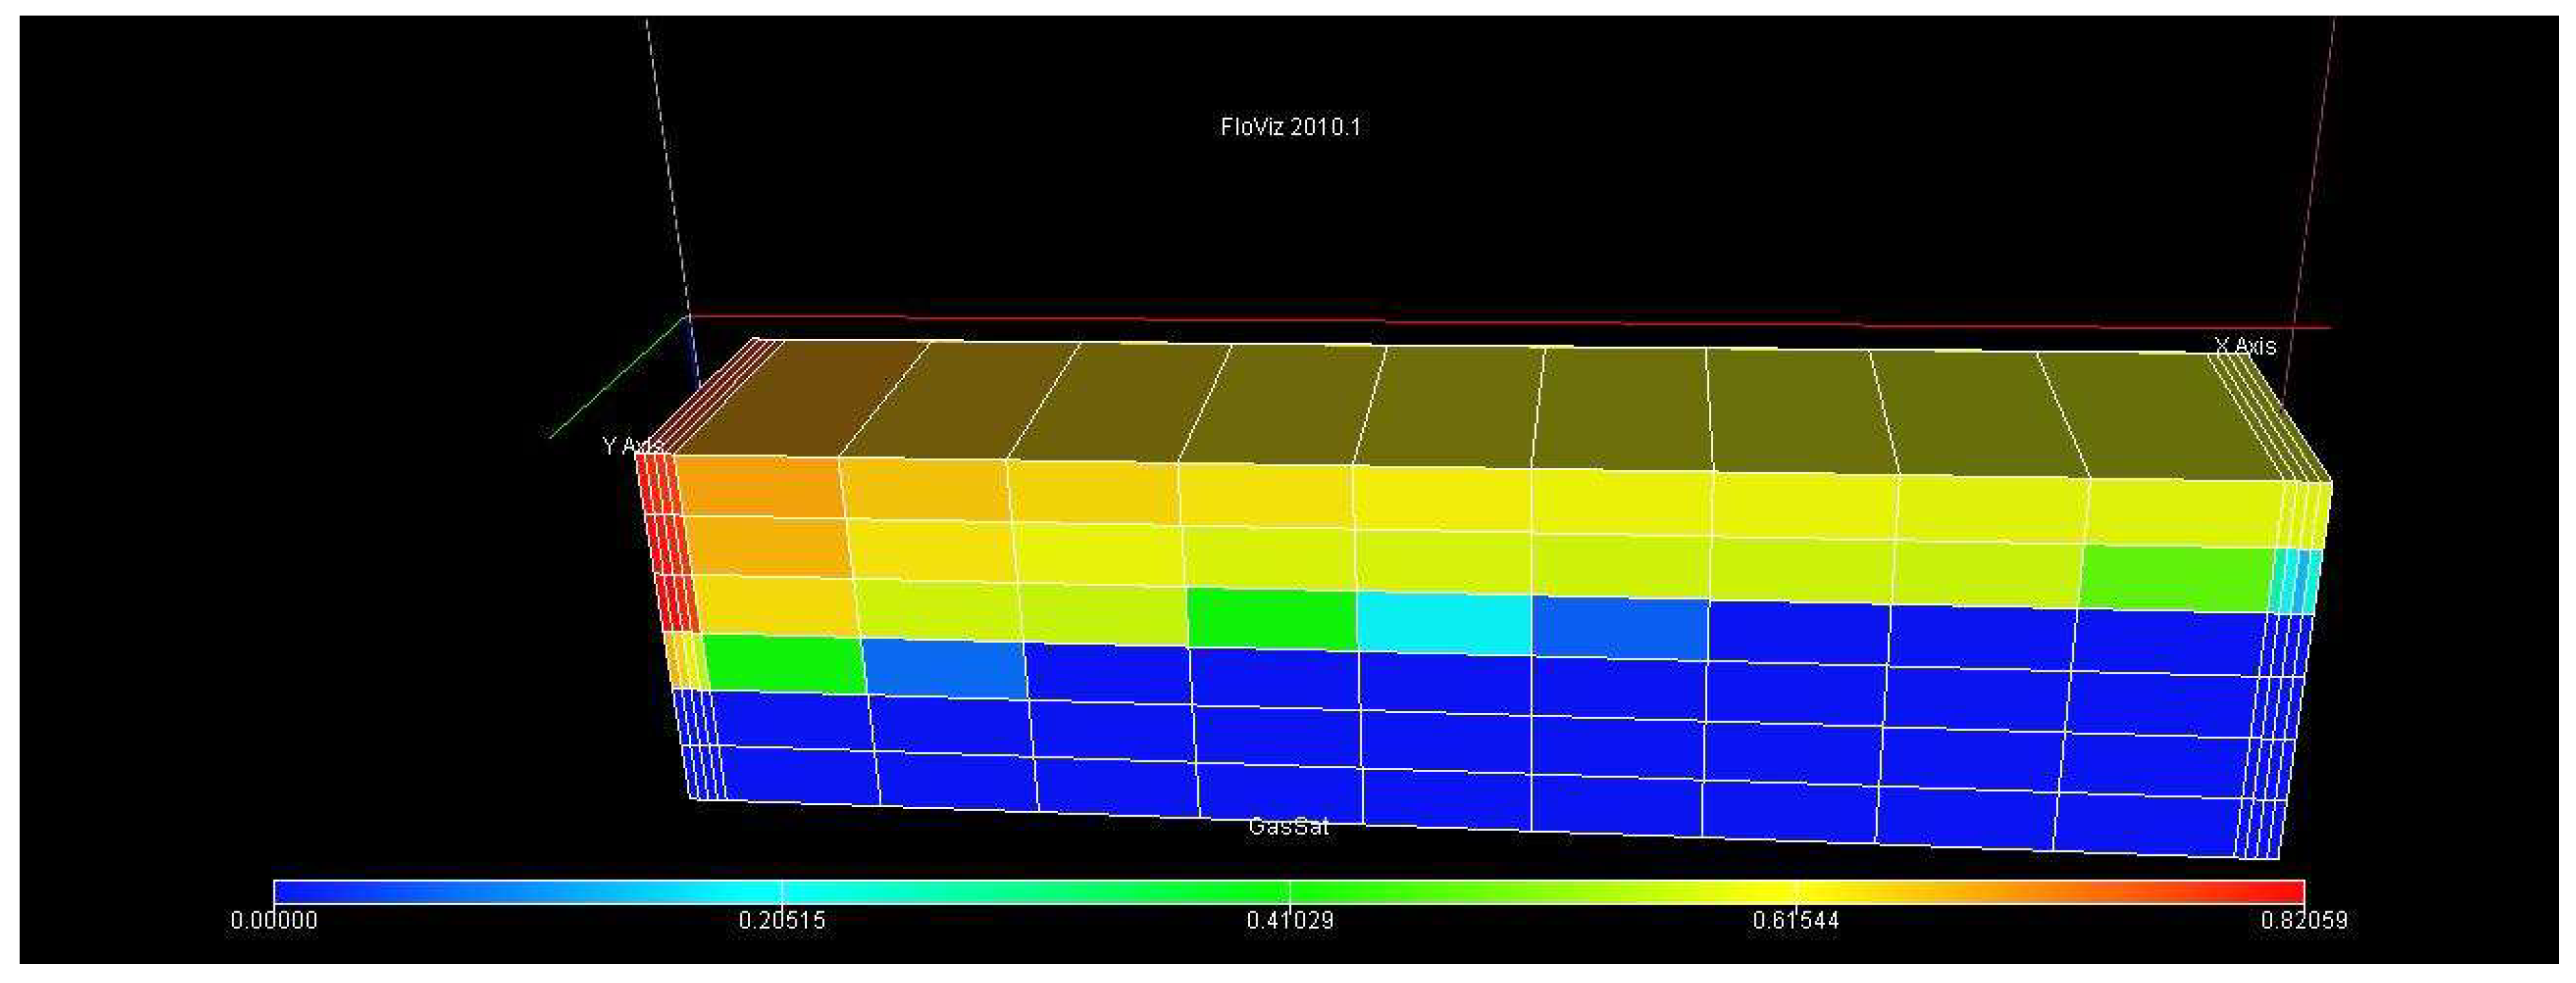
As illustrated in Figure 6, gravitational segregation caused the injected CO2, which is less dense than water and oil, to flow through the upper reservoir layers while water occupied the lower layers and oil concentrated in the center.
The top layers of the reservoir had less residual oil saturation than the bottom layers. Following water breakthrough, water flooding efficiency decreased, and oil phase pressure decreased as oil saturation decreased, leading to phase discontinuity and trapping oil blobs. CO2 flooding proved extremely effective by lowering oil viscosity, especially in miscible conditions, whereas water flooding was ineffective at recovering oil blobs.
Injection of CO2 resulted in a single-phase or two-phase system, depending on the injection pressure. The MMP, which takes into consideration the solubility of CO2 in water, was found to be 2079.2 psi through a multi-contact miscibility test.

4.2. CO2 Injection at Pressure Below the MMP

The injection of CO2 at pressures below the MMP resulted in a three-phase reservoir fluid system, which is depicted in Figure 7 by the sharp transition from gas to oil phase, and from oil to water phase.

4.3. CO2 Injection at Pressure Above the Minimum Miscibility Pressure

Conversely, when injecting CO2 at pressure above the minimum miscibility pressure, a smooth phase transition from the hydrocarbon phase to CO2 phase was observed in the middle layers of the reservoir. The water saturation remained relatively high in the bottom layers of the reservoir due to gravitation segregation effects. Both vaporizing and condensing drive miscibility occurred gradually as CO2 was injected, especially in the middle layers, as shown in Figure 8.

4.4. Production Outputs for CO2 Injection

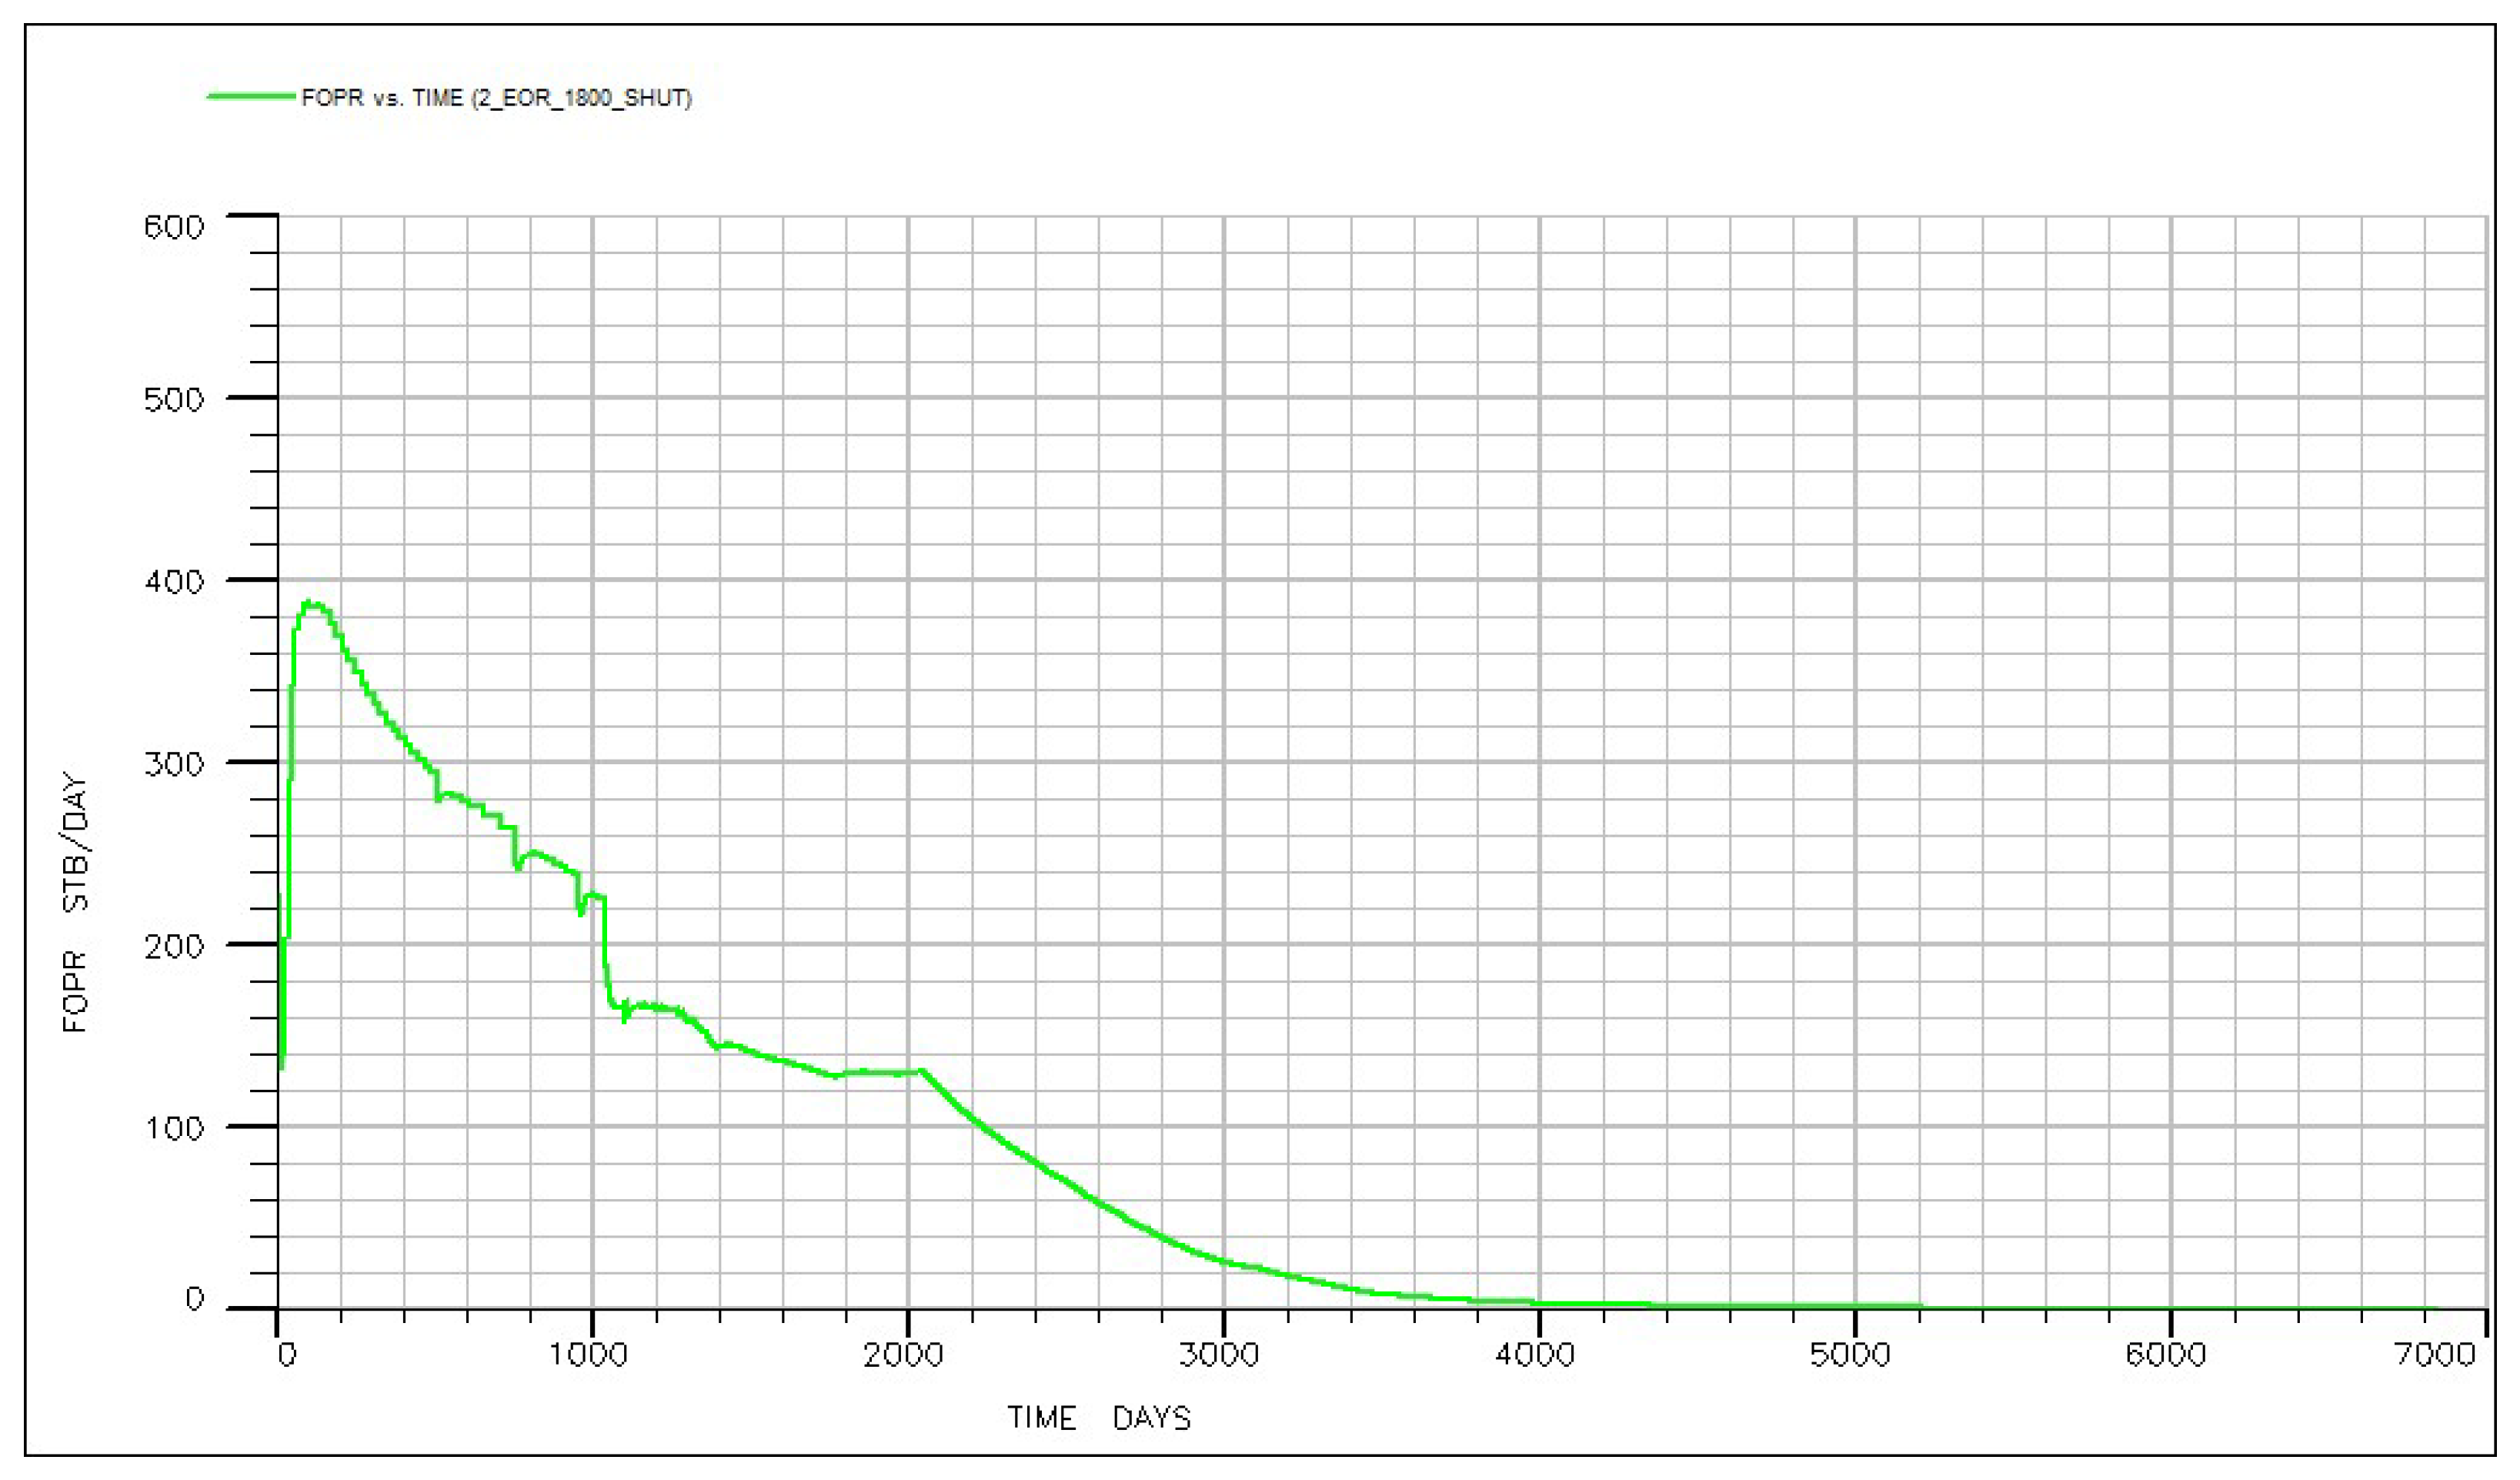
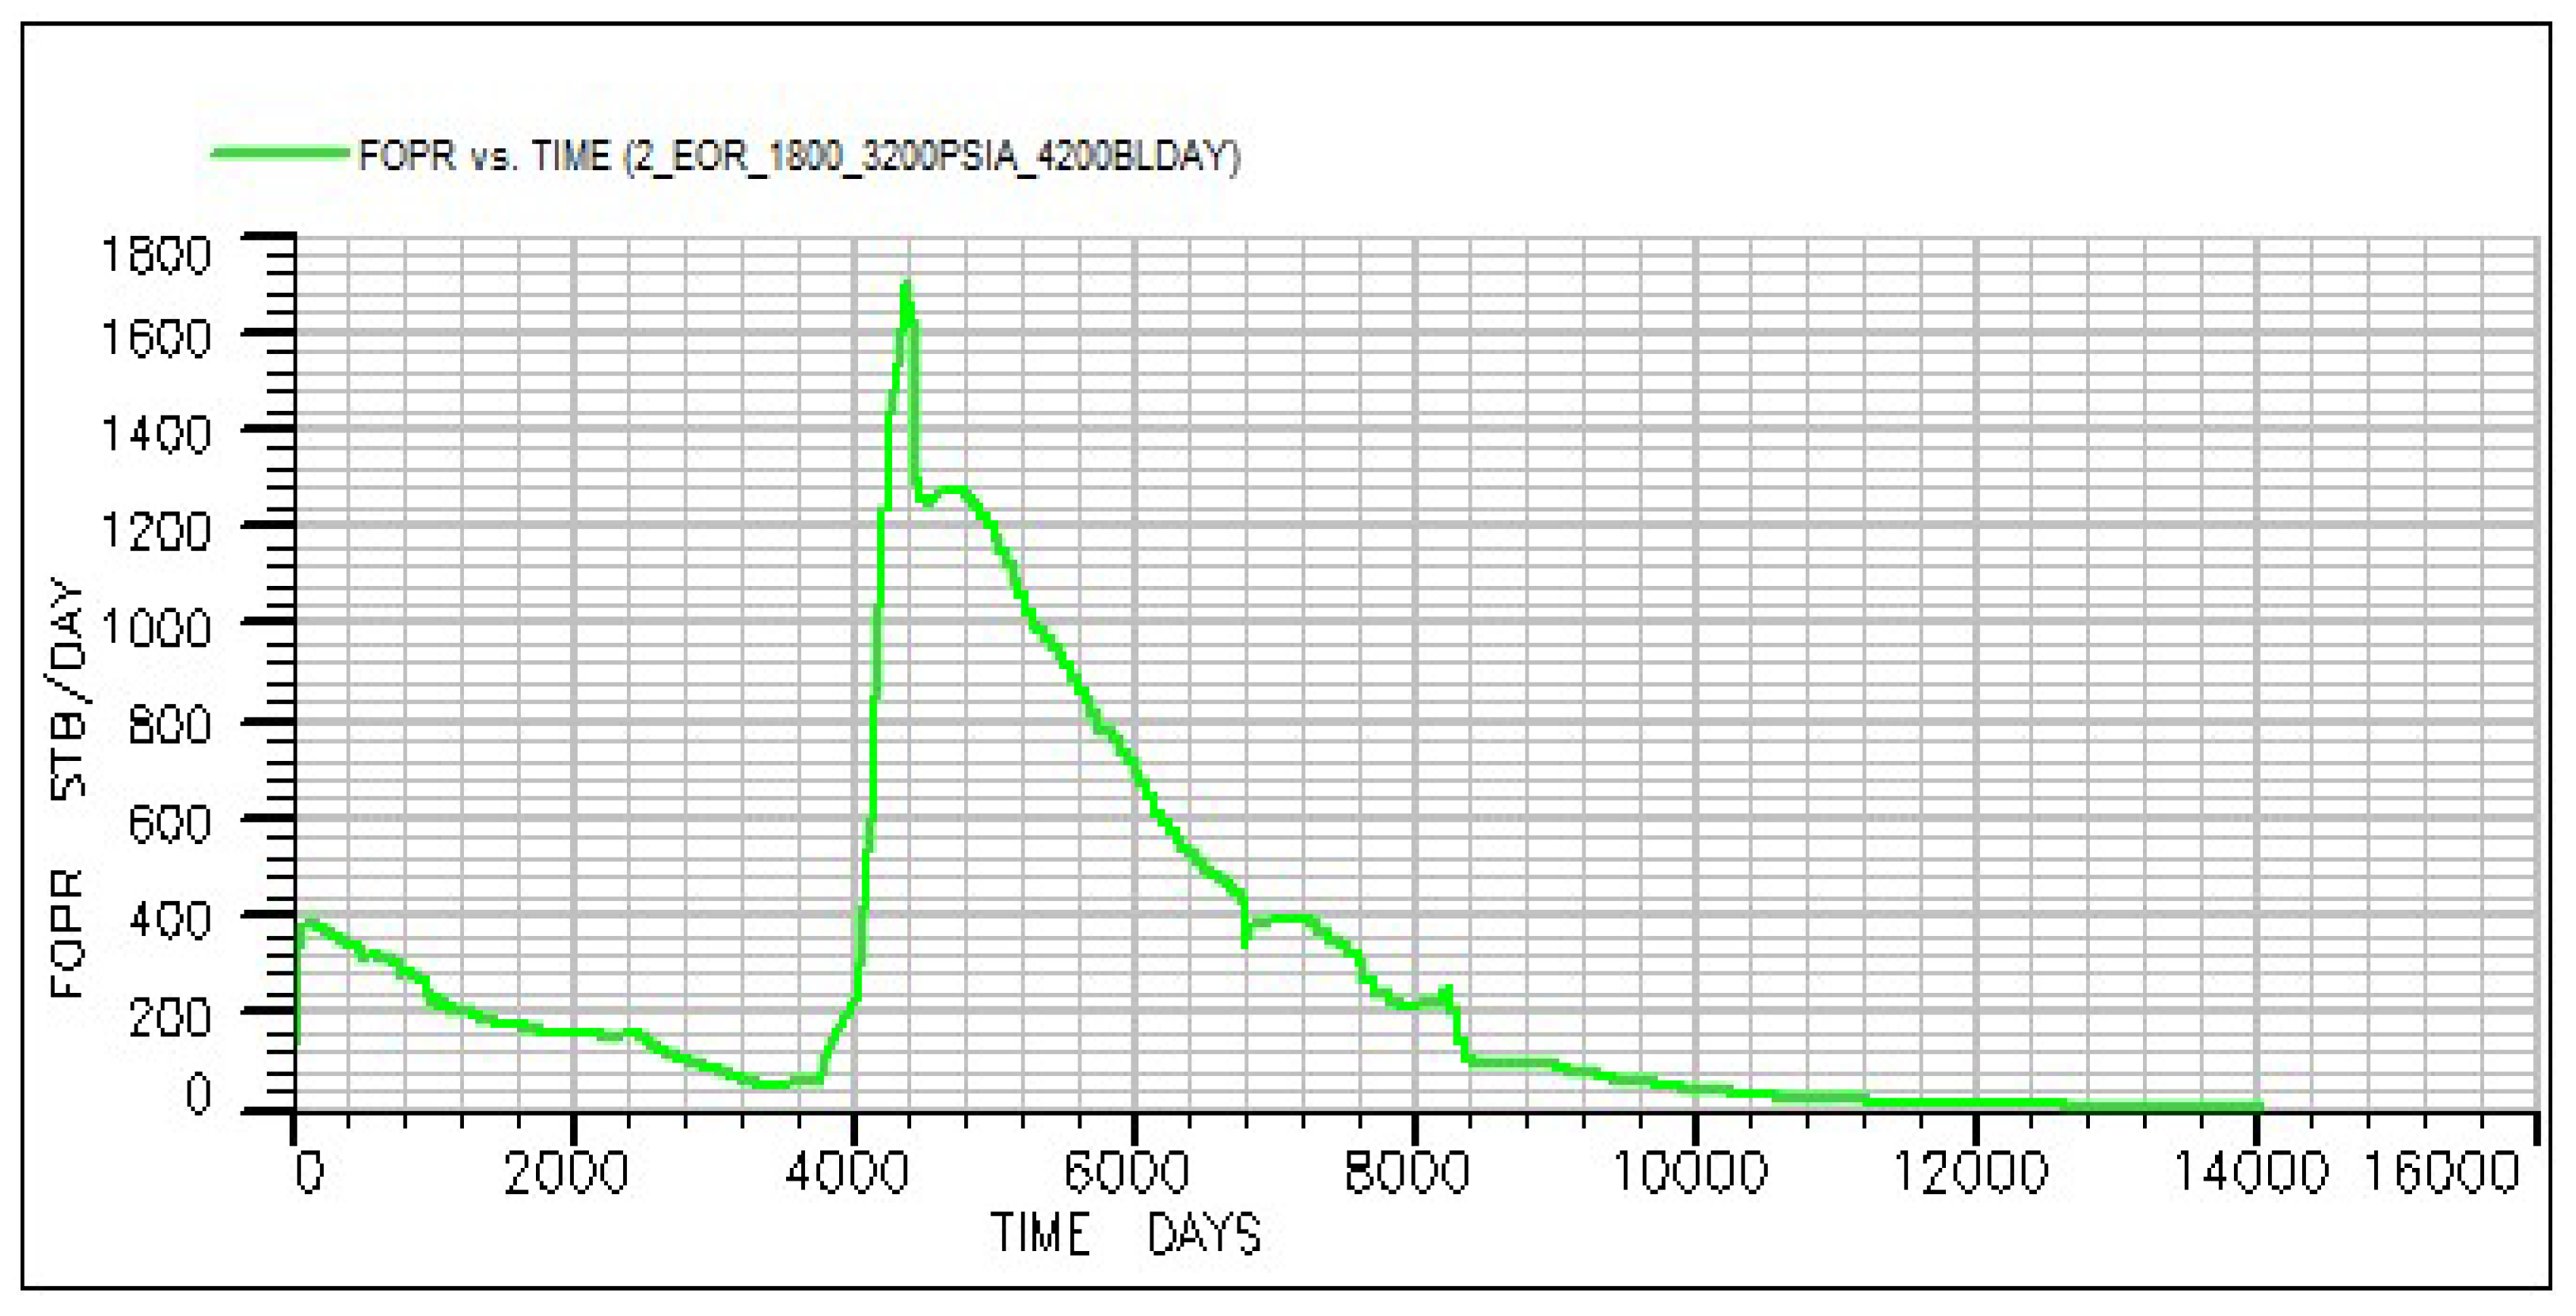
The reservoir produced naturally without fluid injections until the production rate declined to its economic limit on day 4000 on the simulation scale, as shown in Figure 9. This stage represents the primary recovery.
The initial sharp rise observed in Figure 9 represents the early-stage high productivity typical of CO2 miscible displacement, where mobility ratio improvements lead to the efficient displacement of oil in the swept zones. By contrast, the delayed surge after 4000 days in Figure 10 corresponds to the breakthrough of CO2 into previously unswept or low-permeability zones, causing a renewed increase in recovery. This late-stage production acceleration is consistent with reservoir heterogeneity and delayed asphaltene re-dissolution effects.
The CO2 injection is marked on the plot of the field production rate vs. time by a shift in the slope of the production rate, as shown in the following Figure 10.
The optimum increase in the oil production rate was observed when CO2 was injected above the MMP and followed by water injection, as shown in Figure 10. The optimum overall oil recovery factor was attained when CO2 was continually injected at a pressure above the minimum miscibility pressure. Under miscibility conditions, the adverse effects of the capillary trappings and relative permeability due to surface tensions and wettability are eliminated [22]. Low residual oil saturation was attained in the reservoir, as depicted in Figure 11. Although a distinct change in oil saturation is observed at approximately 1000 days, this transition is not visibly reflected in the overall production rate due to spatial averaging across the entire reservoir grid. Localized effects are thus masked by the field-wide cumulative trends.
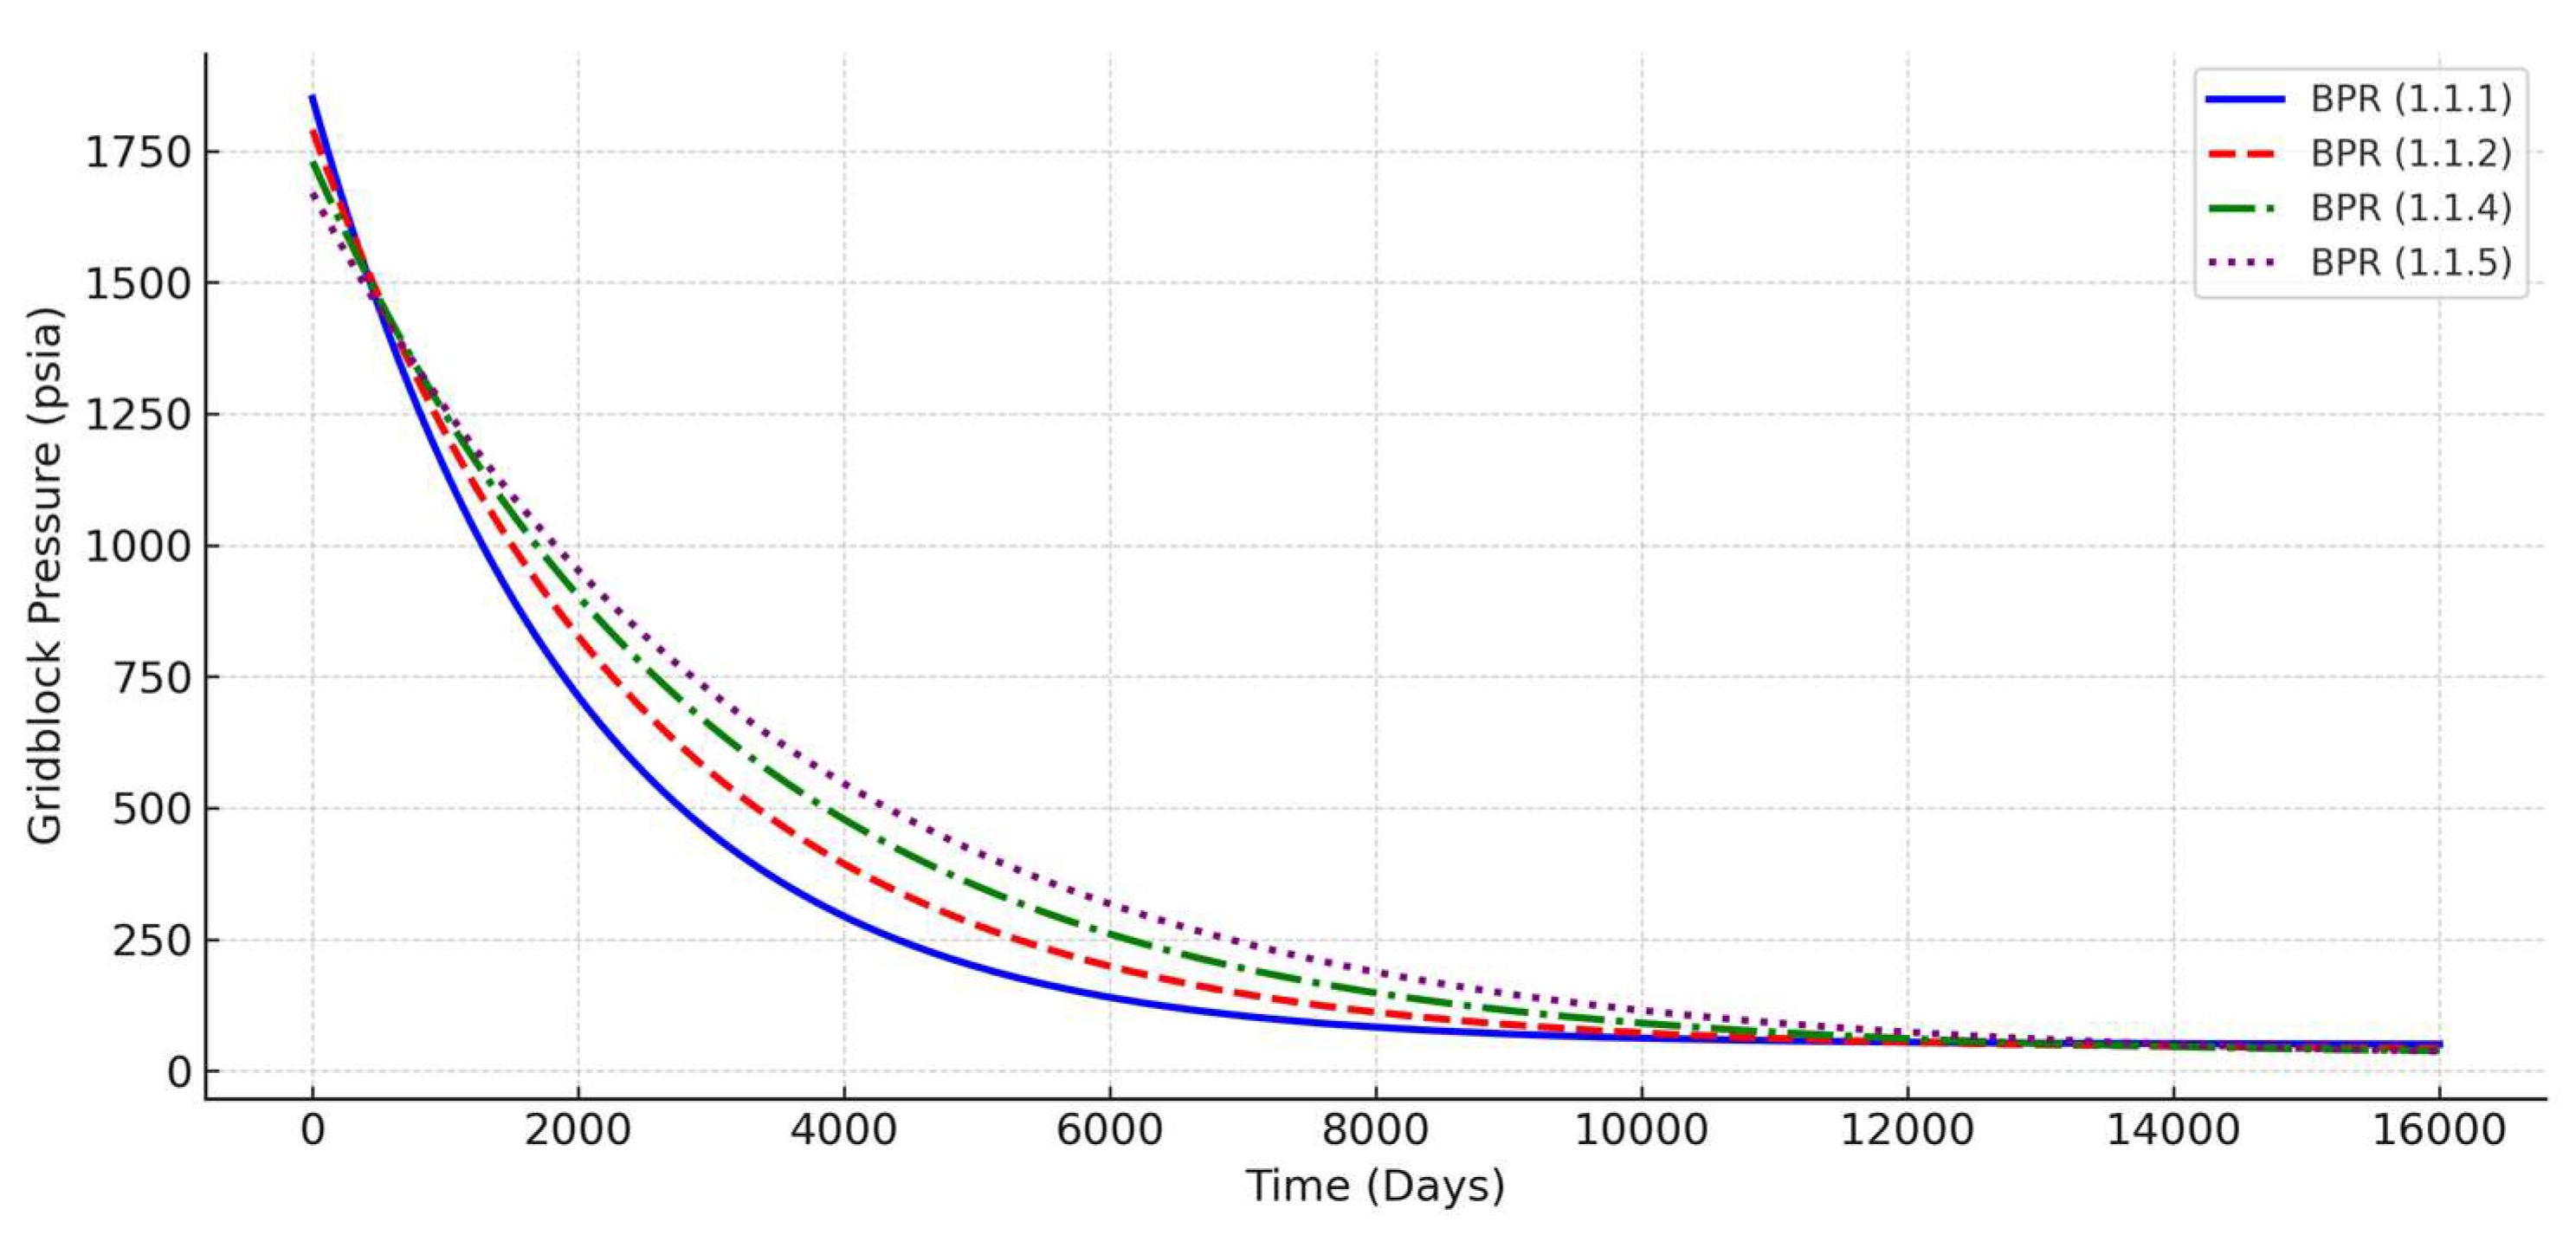
Figure 12 depicts the reservoir grid block pressure as it depletes in the primary recovery stage. The horizontal portion of the curves, which starts roughly on day 4000, marks the point where the reservoir under its primary recovery drive mechanism has reached its economic limits of production rate. At this stage, the reservoir pressure remains almost constant because the oil is no longer being removed from the reservoir at a significant rate.
At reservoir pressure above the bubble point, the hydrocarbon composition remained constant, equal to the initial composition from the equilibrium state, before the production process had started. Under this condition, the asphaltene molecules are uniformly dispersed in solution.
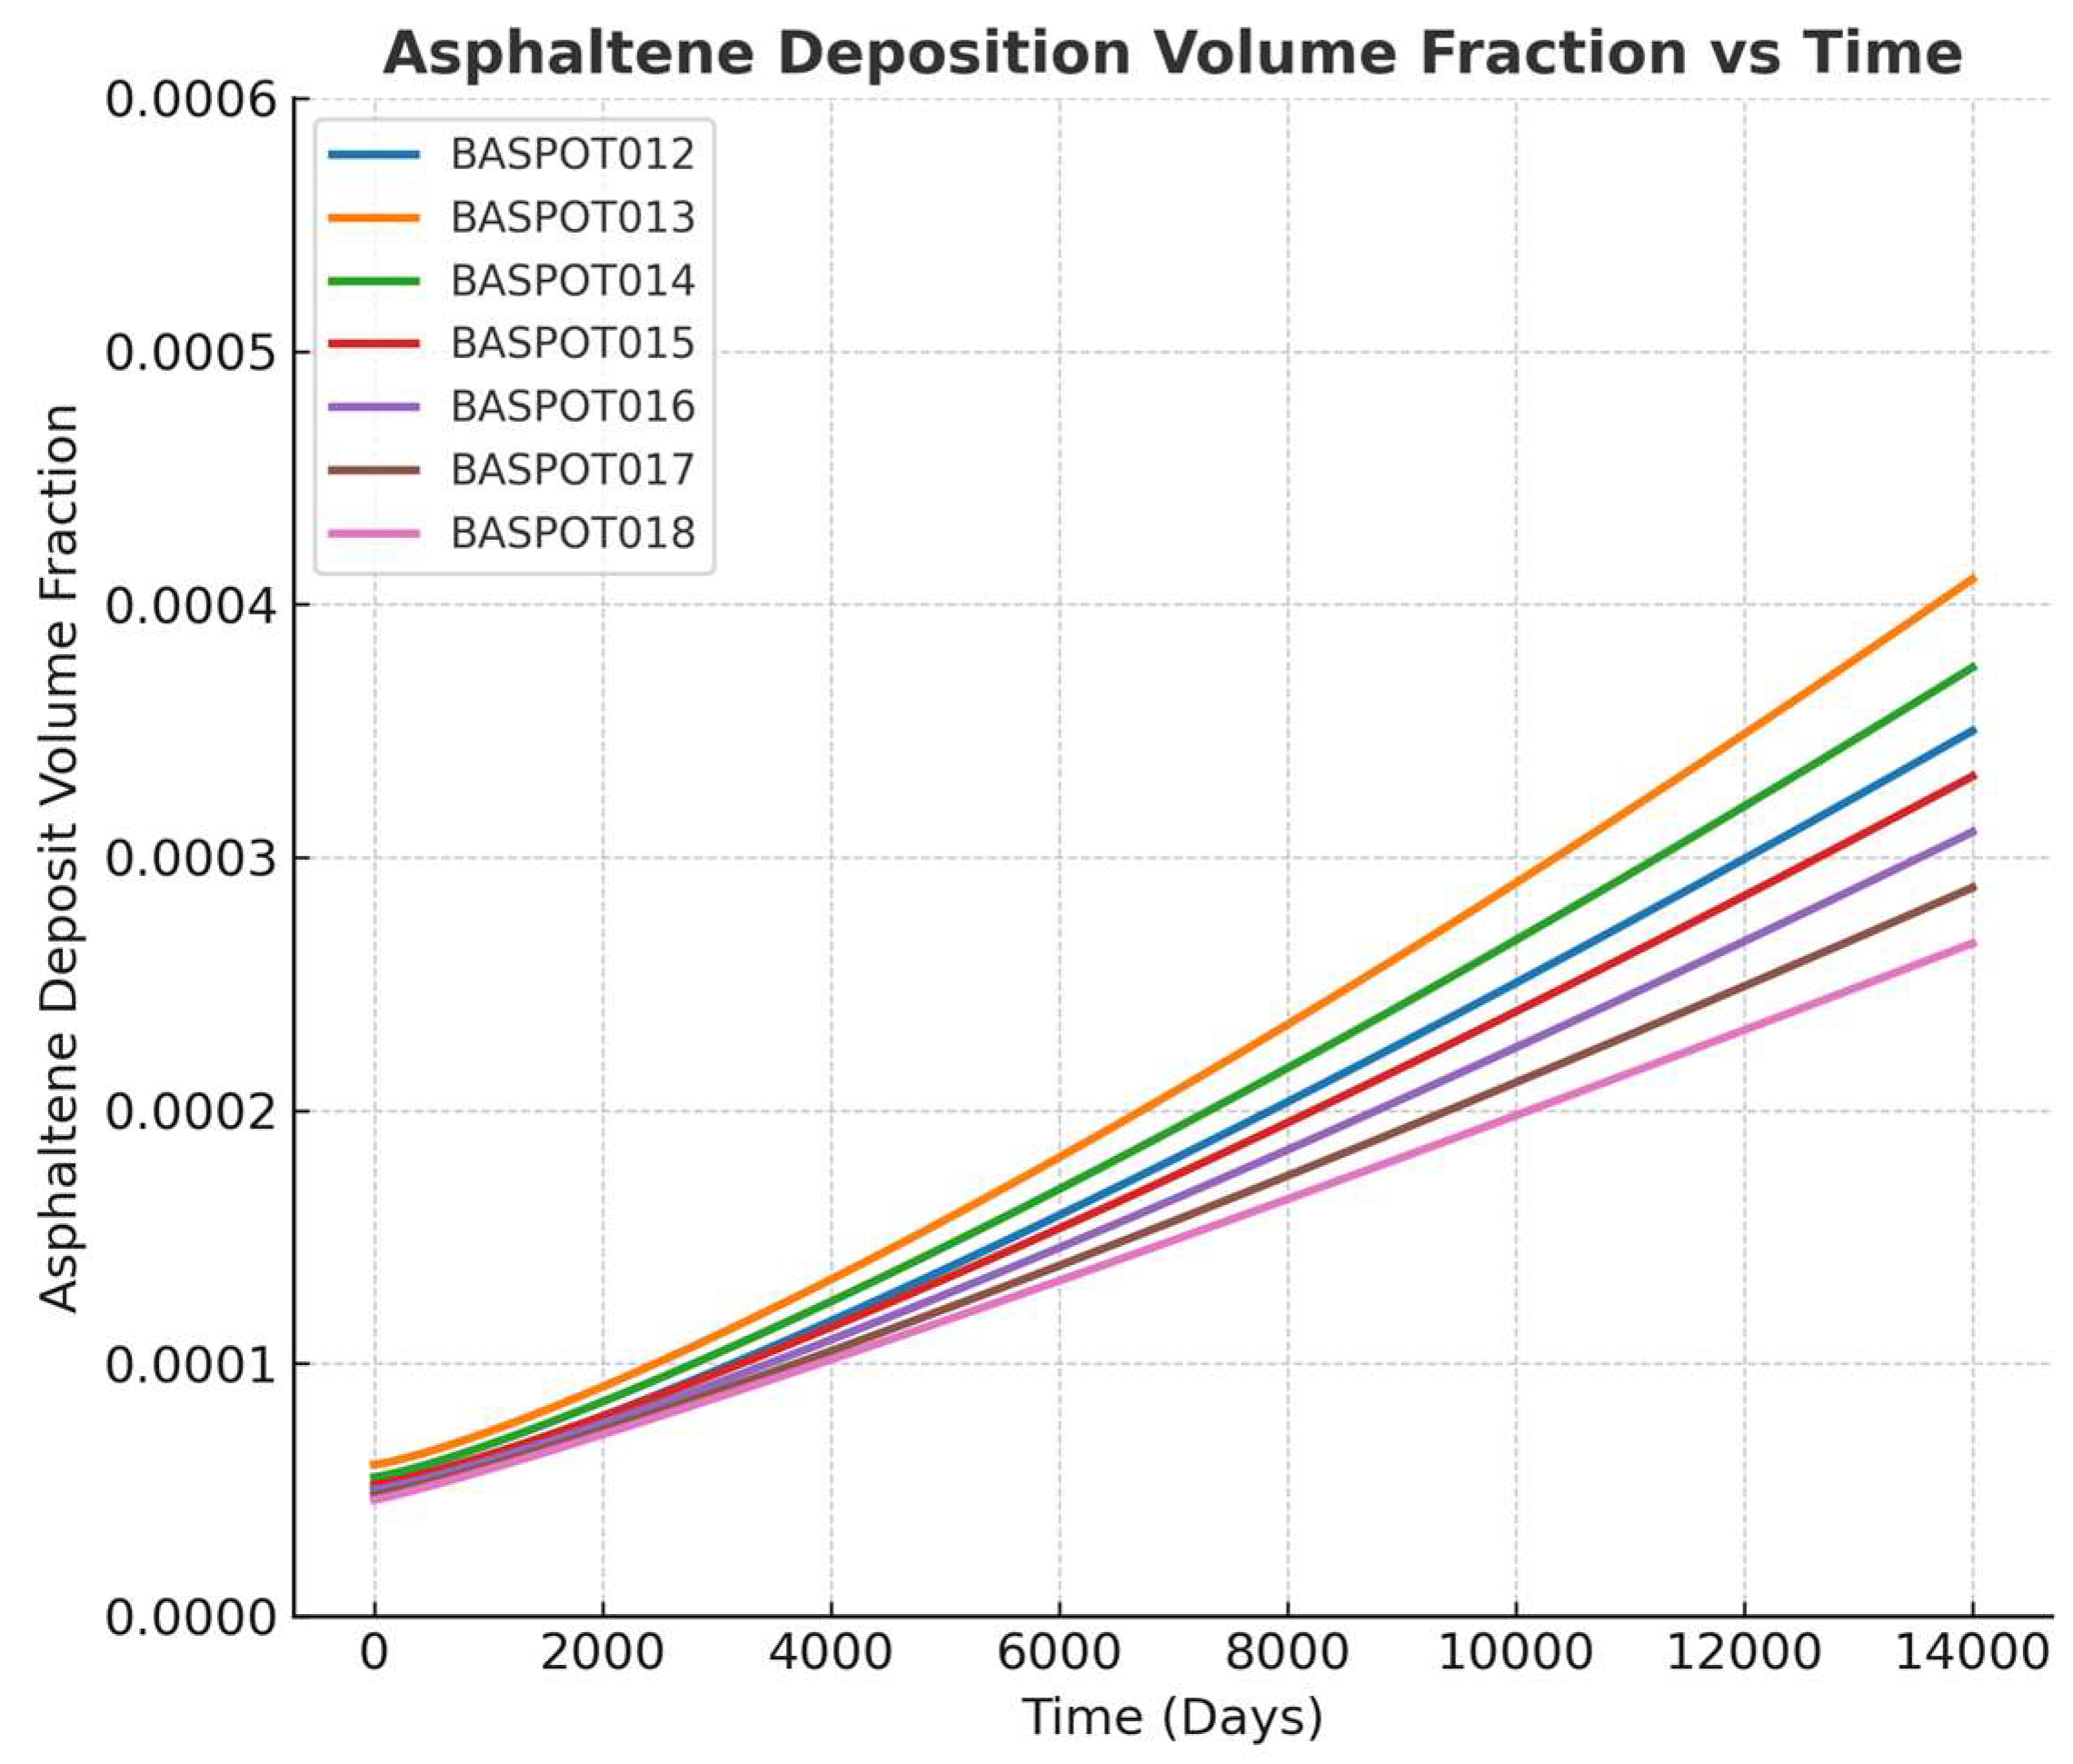
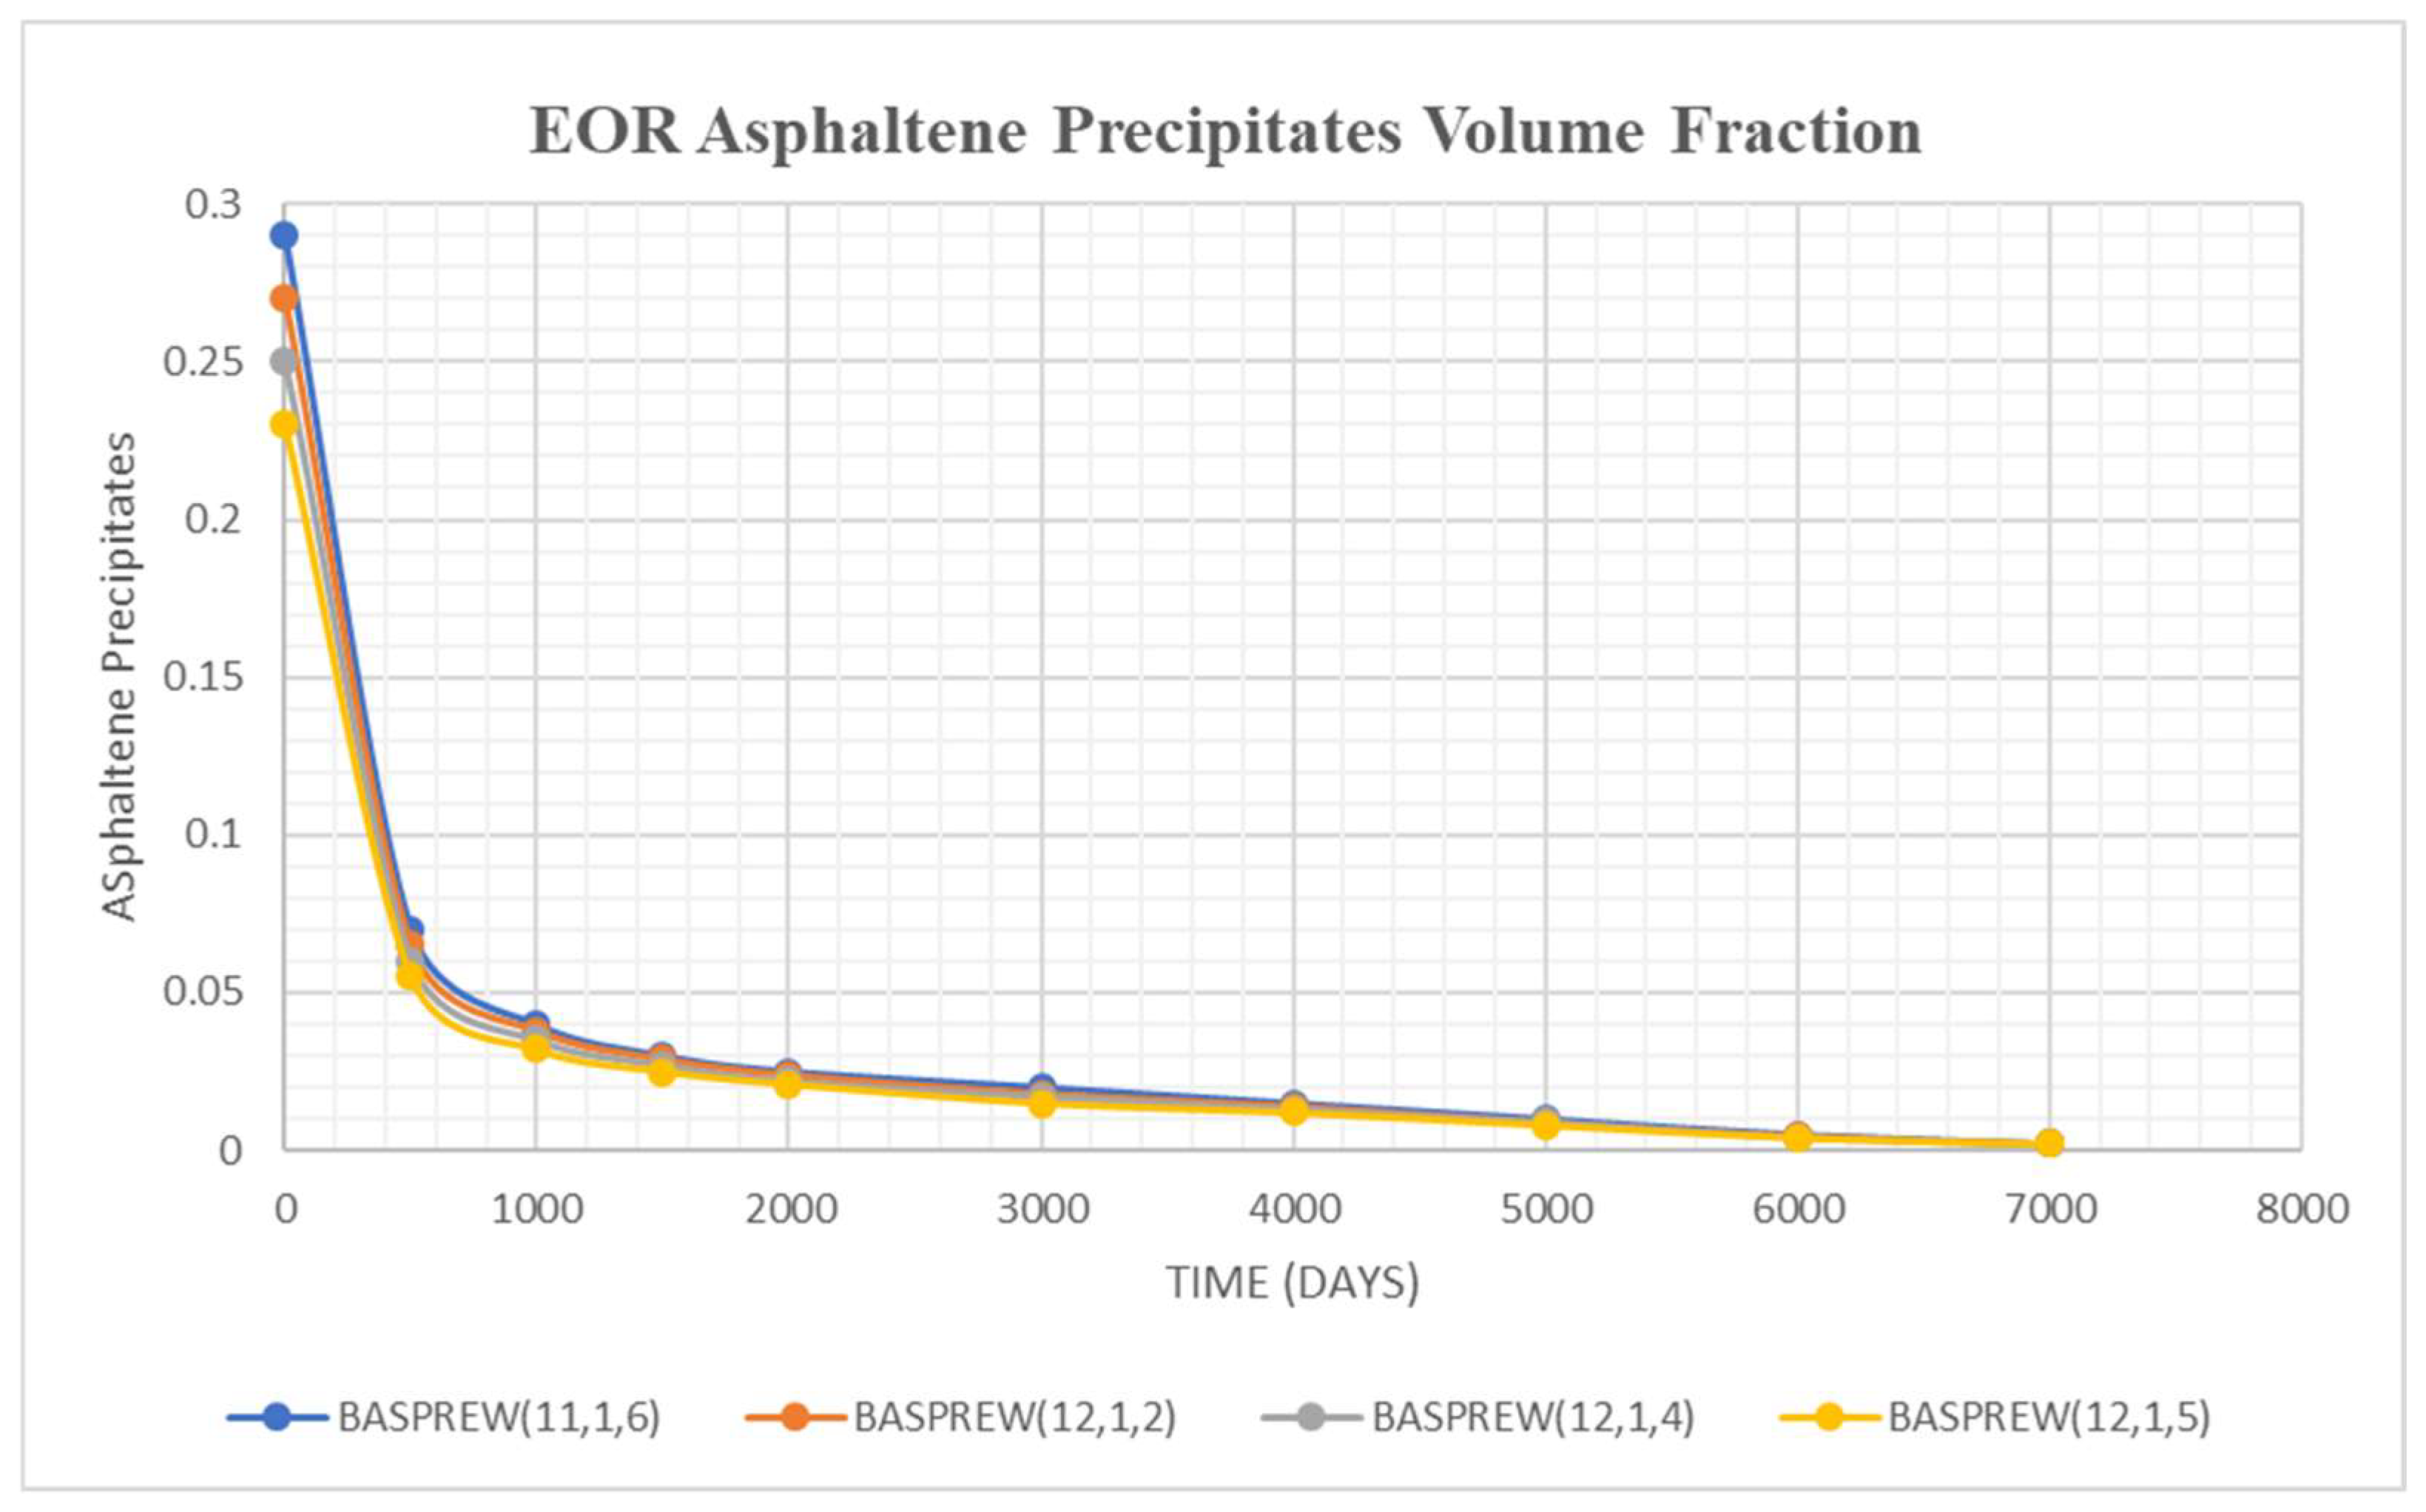
The solubility of asphaltene in the reservoir fluid system is a function of concentration of the intermediate hydrocarbon components. Hence, as the reservoir pressure approached the bubble point, the concentration of the intermediate hydrocarbon components in the solution started decreasing due to vaporization, which created instability in the solubility of asphaltene. Initial asphaltene precipitation was observed at pressure near the bubble point. It was noted that the decrease in asphaltene solubility during the vaporization process was only a temporary phenomenon. The asphaltene solubility in the hydrocarbon system increased after most of the intermediate hydrocarbon components were removed from the liquid phase. The reason for this fact is that the density and the viscosity of the oil increased significantly as most of the intermediate hydrocarbon components were removed from the oil phase. Figure 13 shows asphaltene precipitates in volume fraction as the reservoir depletes. Figure 14 provides a pictorial view of the reservoir depicting the effect of water injection on asphaltene deposition.
Depending on the grain and pore size distribution, asphaltene precipitation may not lead to formation damage if the deposition does not occur. For reservoir systems in which the pores are large enough and the shear stress in the flow is sufficiently high to keep the precipitates in suspension, the probability of occurrence of formation damage is insignificant [26]. As CO2 was injected, the asphaltene deposition process was shown to be controlled by the balance between the shear forces and the gravitational forces, influenced by the size of aggregates of asphaltene. As the size of aggregates increased, the gravitational forces became dominant, which resulted in deposition.

4.5. Asphaltene Behavior Under No Water Injection Conditions

Without water injections, the deposition is relatively high at the bottom layers due to the tendency of heavy hydrocarbon components to migrate to the bottom part of the formation. The deposition rate increased near the producing well due to low pressure. The spatial variation in the volume fraction of asphaltene deposits is shown in Figure 15.
The use of the time varying lines is one of the most effective approaches to help detect small changes in the deposition as the reservoir system responds to the change in injection condition. A very small change in the deposition rate within the reservoir will result in a significant distortion of the pattern of the time-varying lines.
The average asphaltene deposit volume fraction is shown in Figure 16. The observed permeability reduction due to asphaltene deposition was mainly caused by the partial blockage of pore communications. This blockage increased the flow resistance across the reservoir. Under this condition, the bottom-hole pressure needed to be further decreased to keep the well producing at an economical flow rate.

4.6. Asphaltene Behavior Under Water Injection Conditions (Washout Effects)

As water is injected into the reservoir, it is said to influence pressure maintenance. However, from a microscopic point of view, due to the tortuosity associated with the porous media and the spatial variation in the flow resistance caused by the grain size distribution, the injection of water into the reservoir had a pressure restoration effect rather than pressure maintenance. This means that, for a fixed point in space, fluctuations in pressure occurred, which resulted in a slight asphaltene precipitation. Volume fraction of asphaltene precipitates is shown in Figure 17.
The injection of water into the reservoir had the effect of increasing the shear rate in the flow. The shear force was noted to be responsible for keeping the asphaltene particles in suspension in the fluid. If the shear force in the flow is high enough, the asphaltene particles can then be produced and handled at the surface. A delay in asphaltene deposition was caused by water injection. The curve depicting deposition when water was injected is shown in Figure 18.
The effect of water injection into the reservoir in which asphaltene deposit is present is the washout effects. The asphaltene deposits, which are blocking the pore communication, can be removed by a high-pressure water flux. This would result in the restoration of the pore communication. The permeability damage was noted to be proportional to the volume of the asphaltene deposits that partially blocked the pore communications. The delay in the deposition caused by water injection was reflected in the permeability damage as shown in Figure 19.

4.7. Asphaltene Behavior Under CO2 Injection Rate of 1000 bbl and Pressure of 1000 psia

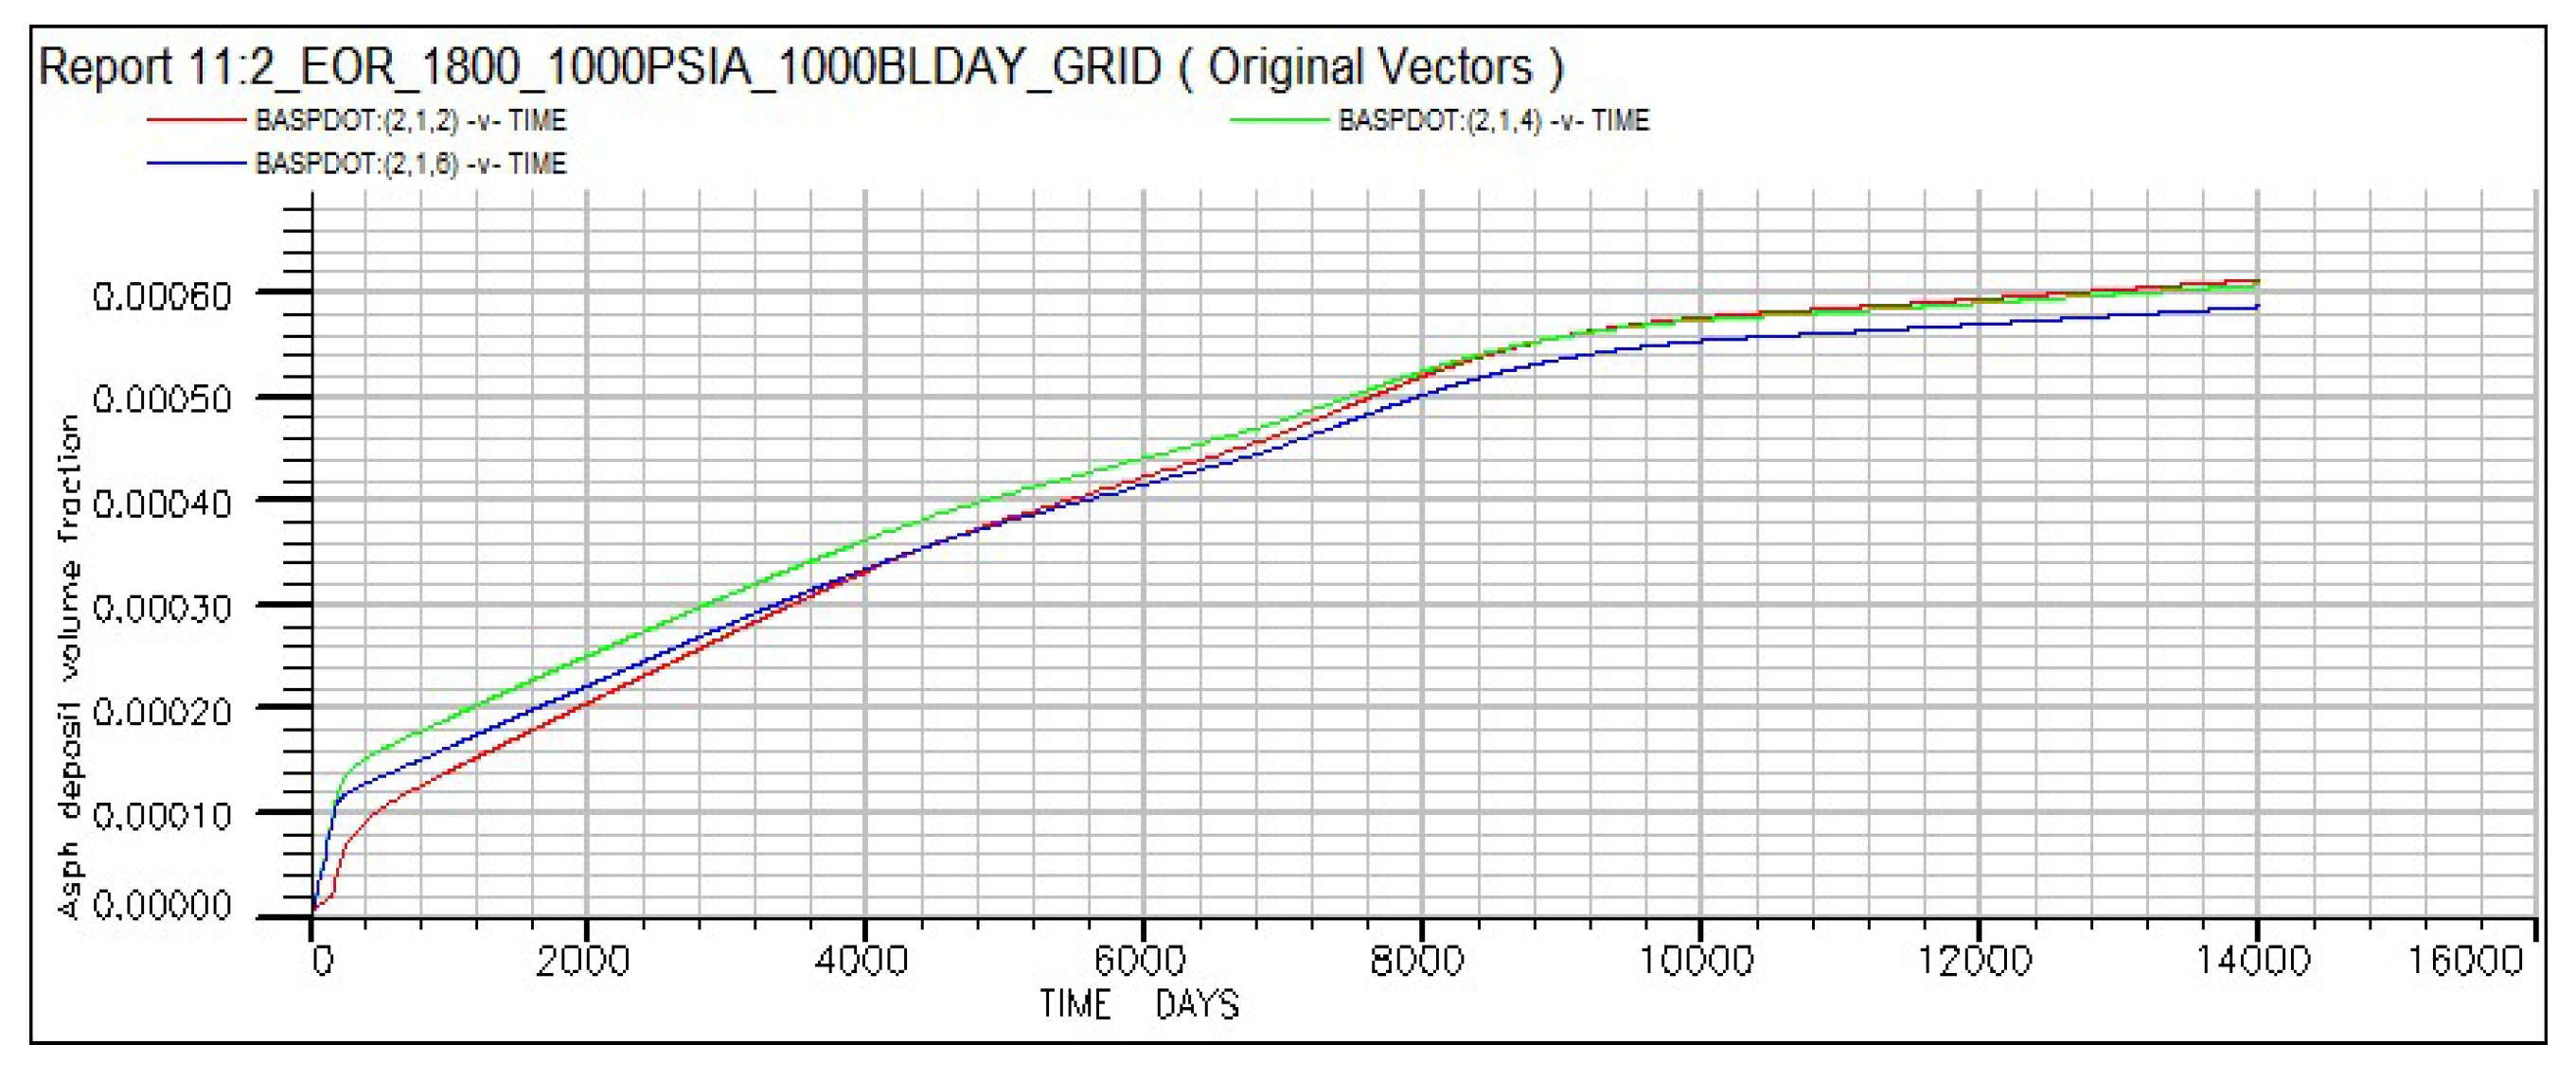
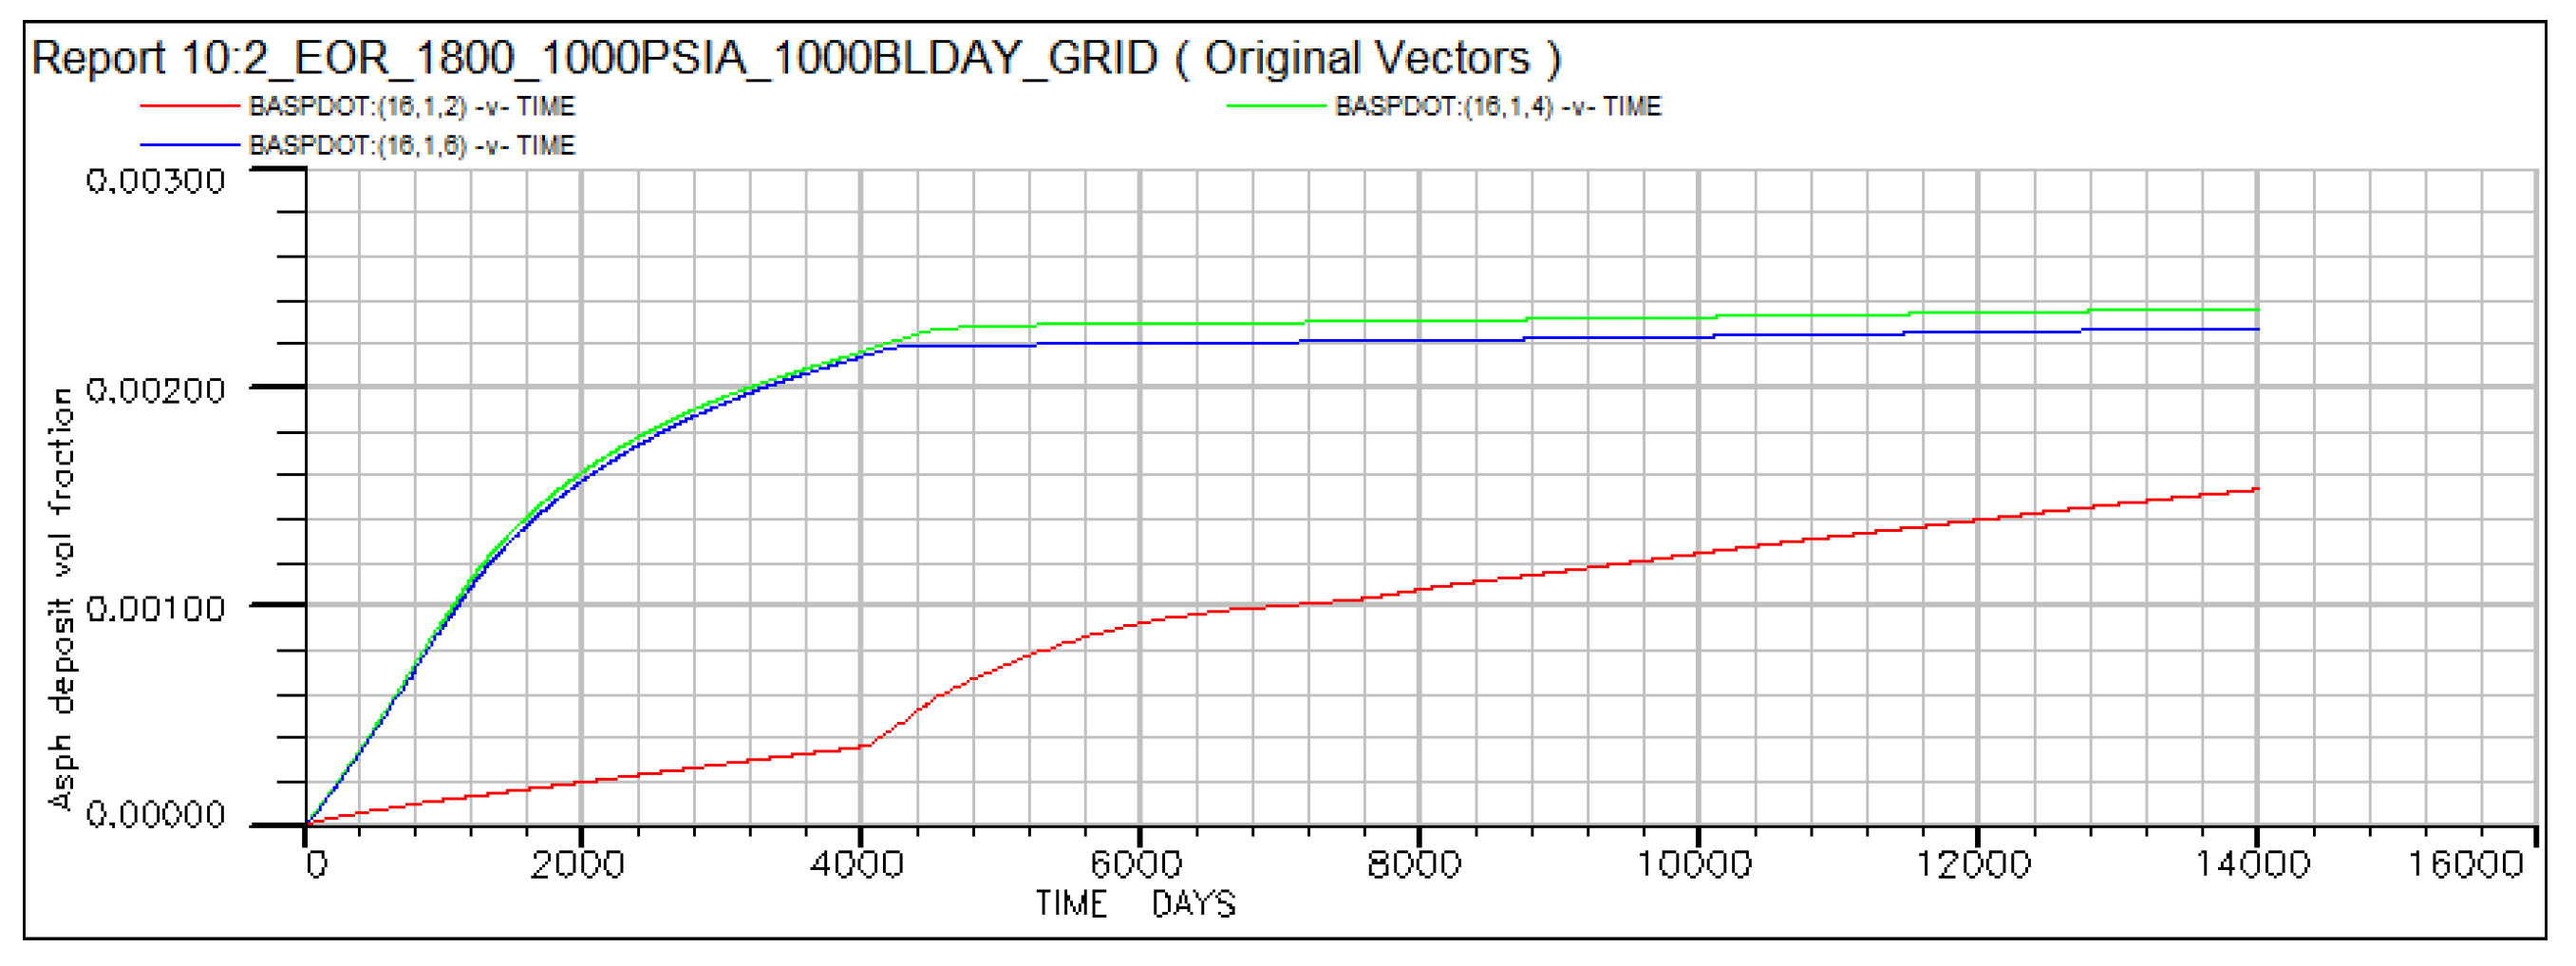
The MMP was computed as 2079.2 psia. It is important to investigate the details associated with the mechanism of asphaltene-induced formation damage under both immiscible and miscible conditions. The average asphaltene deposition volume fraction at an injection pressure of 1000 psia and a flow rate of 1000 bbl/day is depicted in Figure 20.
Near the injection well, the deposition is relatively low and almost constant in the vertical direction, as depicted in Figure 21:
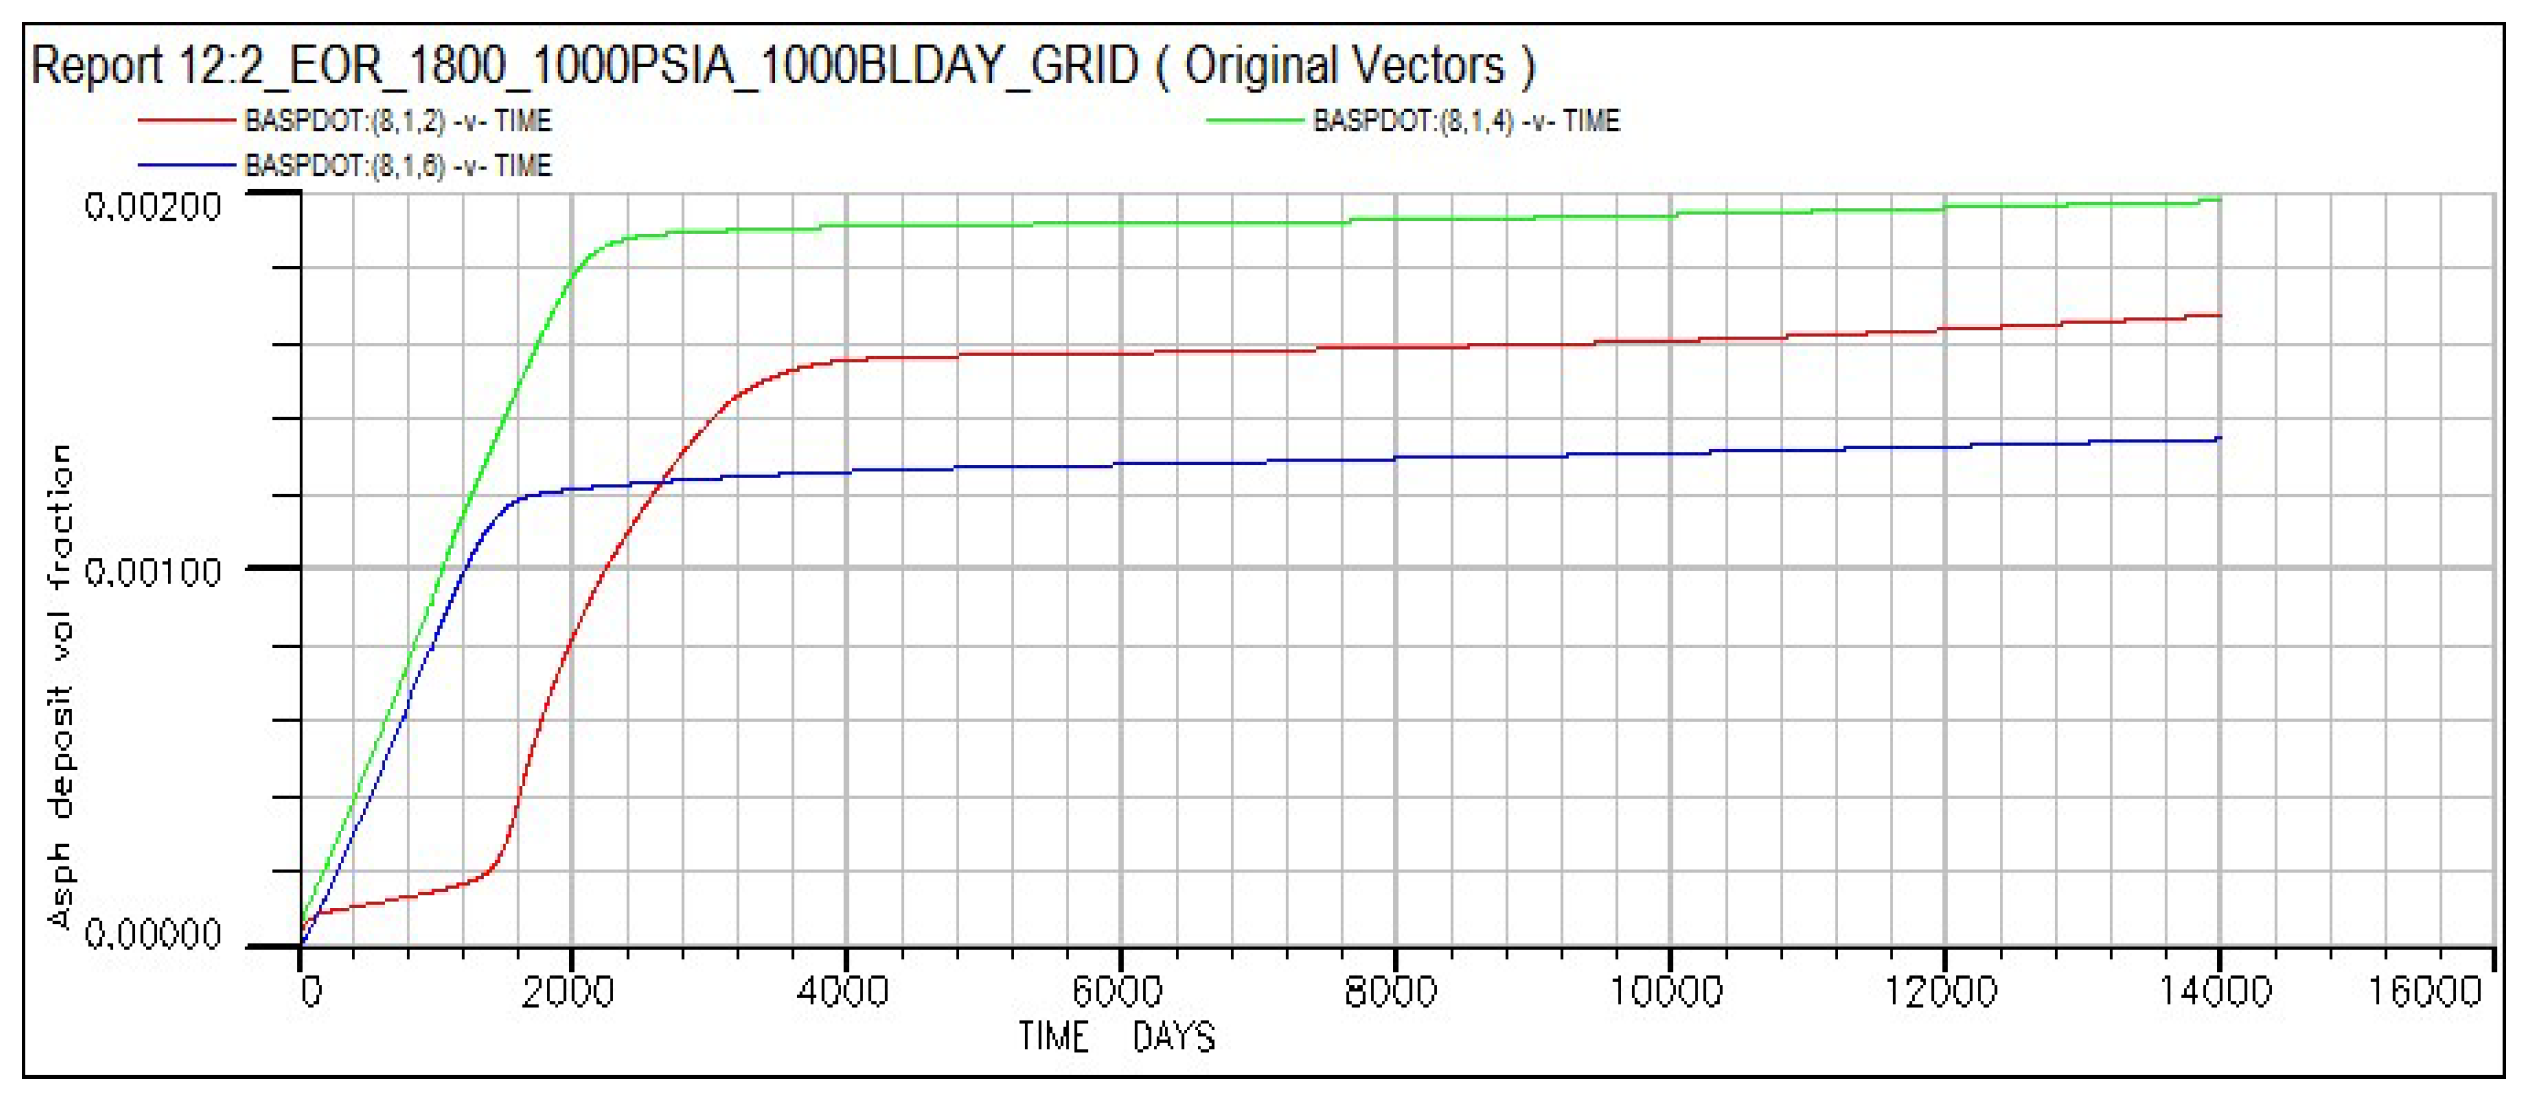
As the multiphase fluid system moves from the high-pressure zone near the injector to the low-pressure zone near the producing well, gravitational segregation occurs within the reservoir. The relatively higher oil saturation in the middle layer of the reservoir leads to high deposition. The crossover between the curve depicting the deposition at the top layer and the curve depicting the deposition at the bottom layer is caused by the saturation gradient, as shown in Figure 22. The oil recovery efficiency is higher at the top layer than at the bottom layer due to high gas saturation at the top.
The deposition rate is relatively high near the producing well due to low pressure. As the multiphase fluid system flows from the injector, the slow migration of the hydrocarbon components takes place at the gas–oil interface due to the concentration gradients. Near the producing well, the deposition rate in the top and the middle layers is almost the same because of high fluid velocity and low concentration gradients at the gas–oil interface, as shown in Figure 23.

4.8. Asphaltene Behavior Under CO2 Injection Rate of 2200 bbl and Pressure of 4200 psia

At an injection pressure of 2200 psia and an injection rate of 4200 bbl/day, relatively low permeability damage was observed near the injection well, as depicted in Figure 24.
The asphaltene precipitation mechanism in a two-phase system is different from that of a single phase. In a two-phase flow, asphaltene precipitation occurs in the transition zone at the interface due to the microscopic diffusion caused by the fluctuation in the concentration gradient of hydrocarbon components. Upon the attainment of a single-phase flow condition, the macroscopic diffusion of the hydrocarbon components leads to the miscible condition alteration of the hydrocarbon composition throughout the reservoir, which results in asphaltene precipitation across the reservoir.

4.9. Asphaltene Behavior Under CO2 Injection Rate of 1000 bbl and Pressure of 3200 psia

To test the effect of the injection rates at pressures above the minimum miscibility pressure, the pressure was fixed at 3200 psia. Starting from an injection rate of 1000 per day, the injection rate was increased, and the effects on the precipitation rate were recorded. Figure 25 depicts precipitations at an injection rate of 1000 bbl/day.
Precipitation is observed to be maximum at the injection point as the injected CO2 contacts the reservoir oil at high pressure and turbulence, as depicted in Figure 26. The viscosity and density of oil increase as the molar fraction of light and intermediate hydrocarbon components decrease. The decrease in the precipitation near the producing well is explained by the increase in the viscosity, which is caused by the vaporization of intermediate hydrocarbon components due to the low-pressure zone at the producing well, as depicted in Figure 26.
The asphaltene precipitation rate was shown to be a non-monotonic function of the oil viscosity. The precipitation rate increased as the oil viscosity increased to a limiting value. Further increase in oil viscosity resulted in a decrease in the asphaltene precipitation rate. Depending on the reservoir pressure distribution, when the pressure at a particular point in the space in the reservoir was near or below the pressure corresponding to the critical oil viscosity, a significant local decrease in the precipitation rate occurred.

4.10. Asphaltene Behavior Under CO2 Injection Rate of 1200 bbl and Pressure of 3200 psia

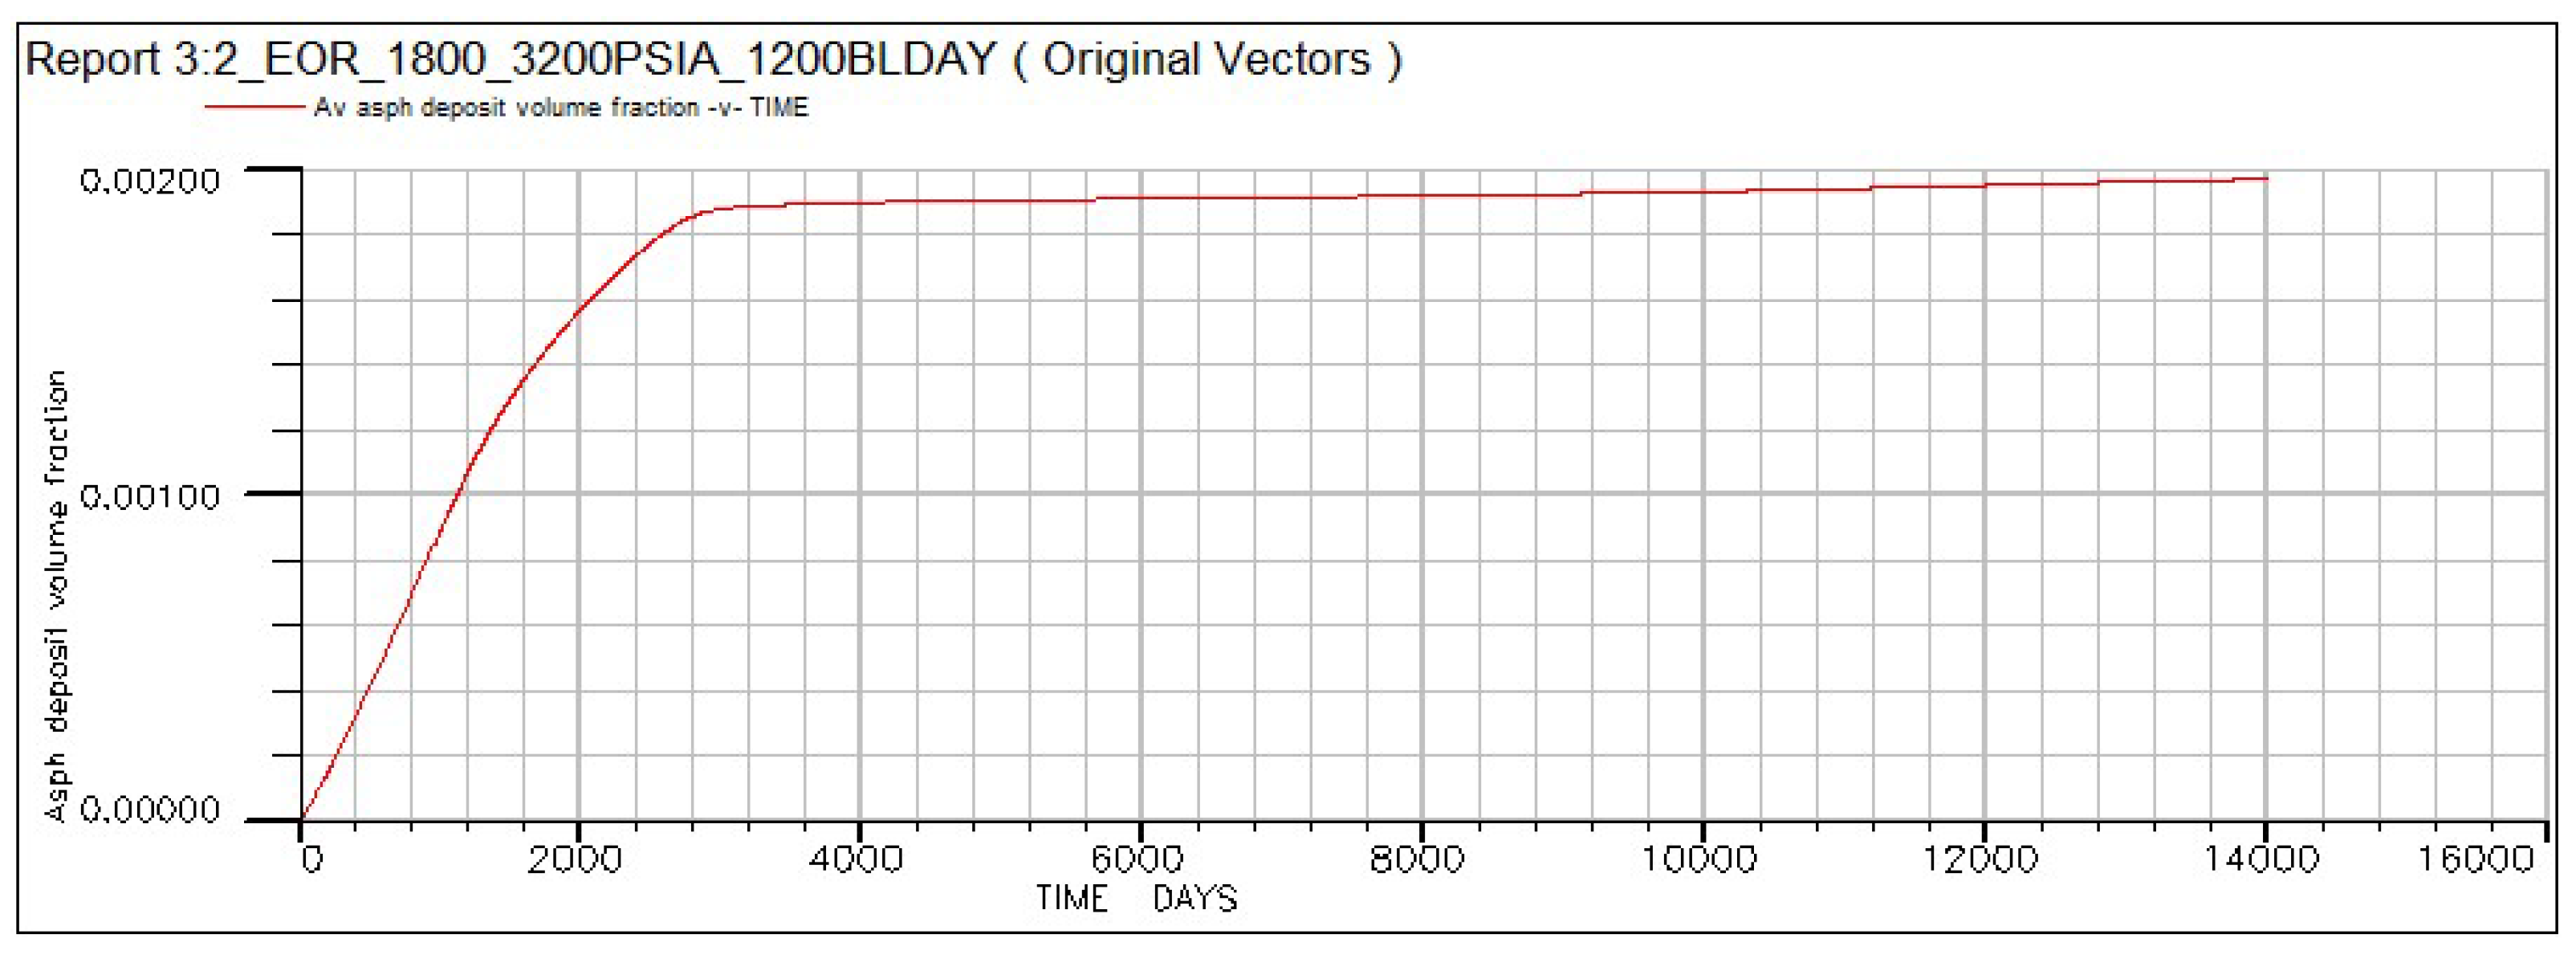
As the injection rate increased to 1200 bbl/day, a slight change in precipitation occurred, as shown in Figure 27. Additionally, with the increased injection rate, minimal increase change in deposition was observed, as revealed in Figure 28.

4.11. Asphaltene Behavior Under CO2 Injection Rate of 4200 bbl and Pressure of 3200 psia

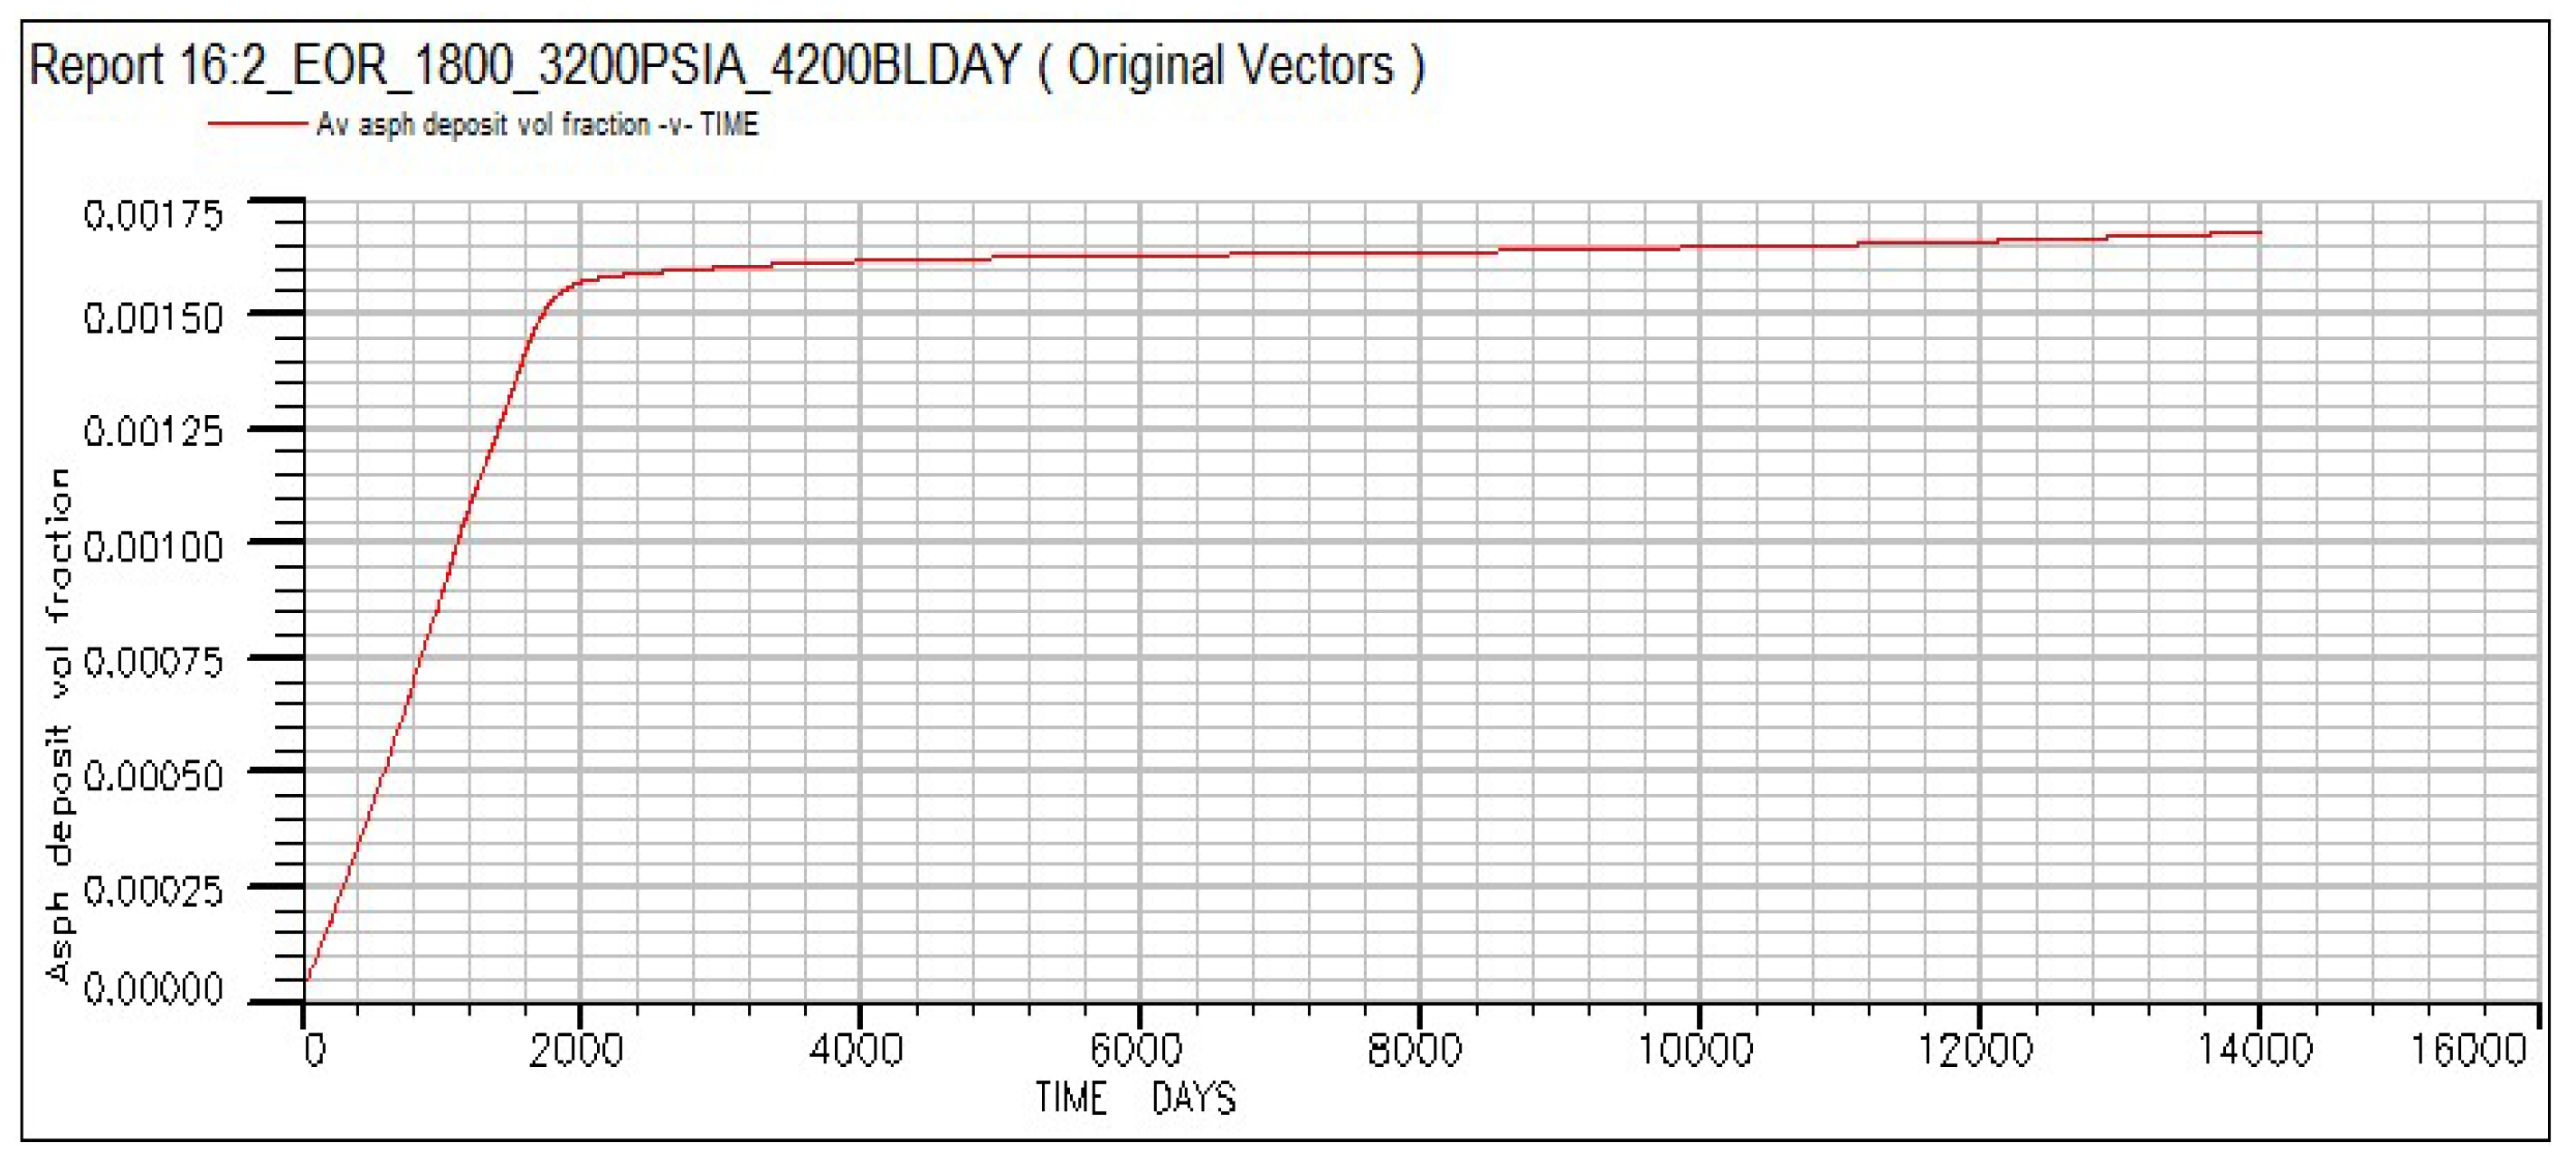
As the injection rate was increased to 4200 bbl/day, a small decrease in the deposition was observed, as depicted in Figure 29. The deposition rate is expected to increase, as the injection rate has increased to 4200 bbl/day. However, Figure 29 shows otherwise. The deposition rate is affected by the balance between the gravitational forces and the shear forces in the flow. The gravitational forces acting on an asphaltene floc depended on the floc size and the buoyance force, while the shear force acting on an asphaltene floc in suspension increased with injection rate. However, there is an injection rate above which the shear forces became dominant, which avoids a further increase in the deposition rate.
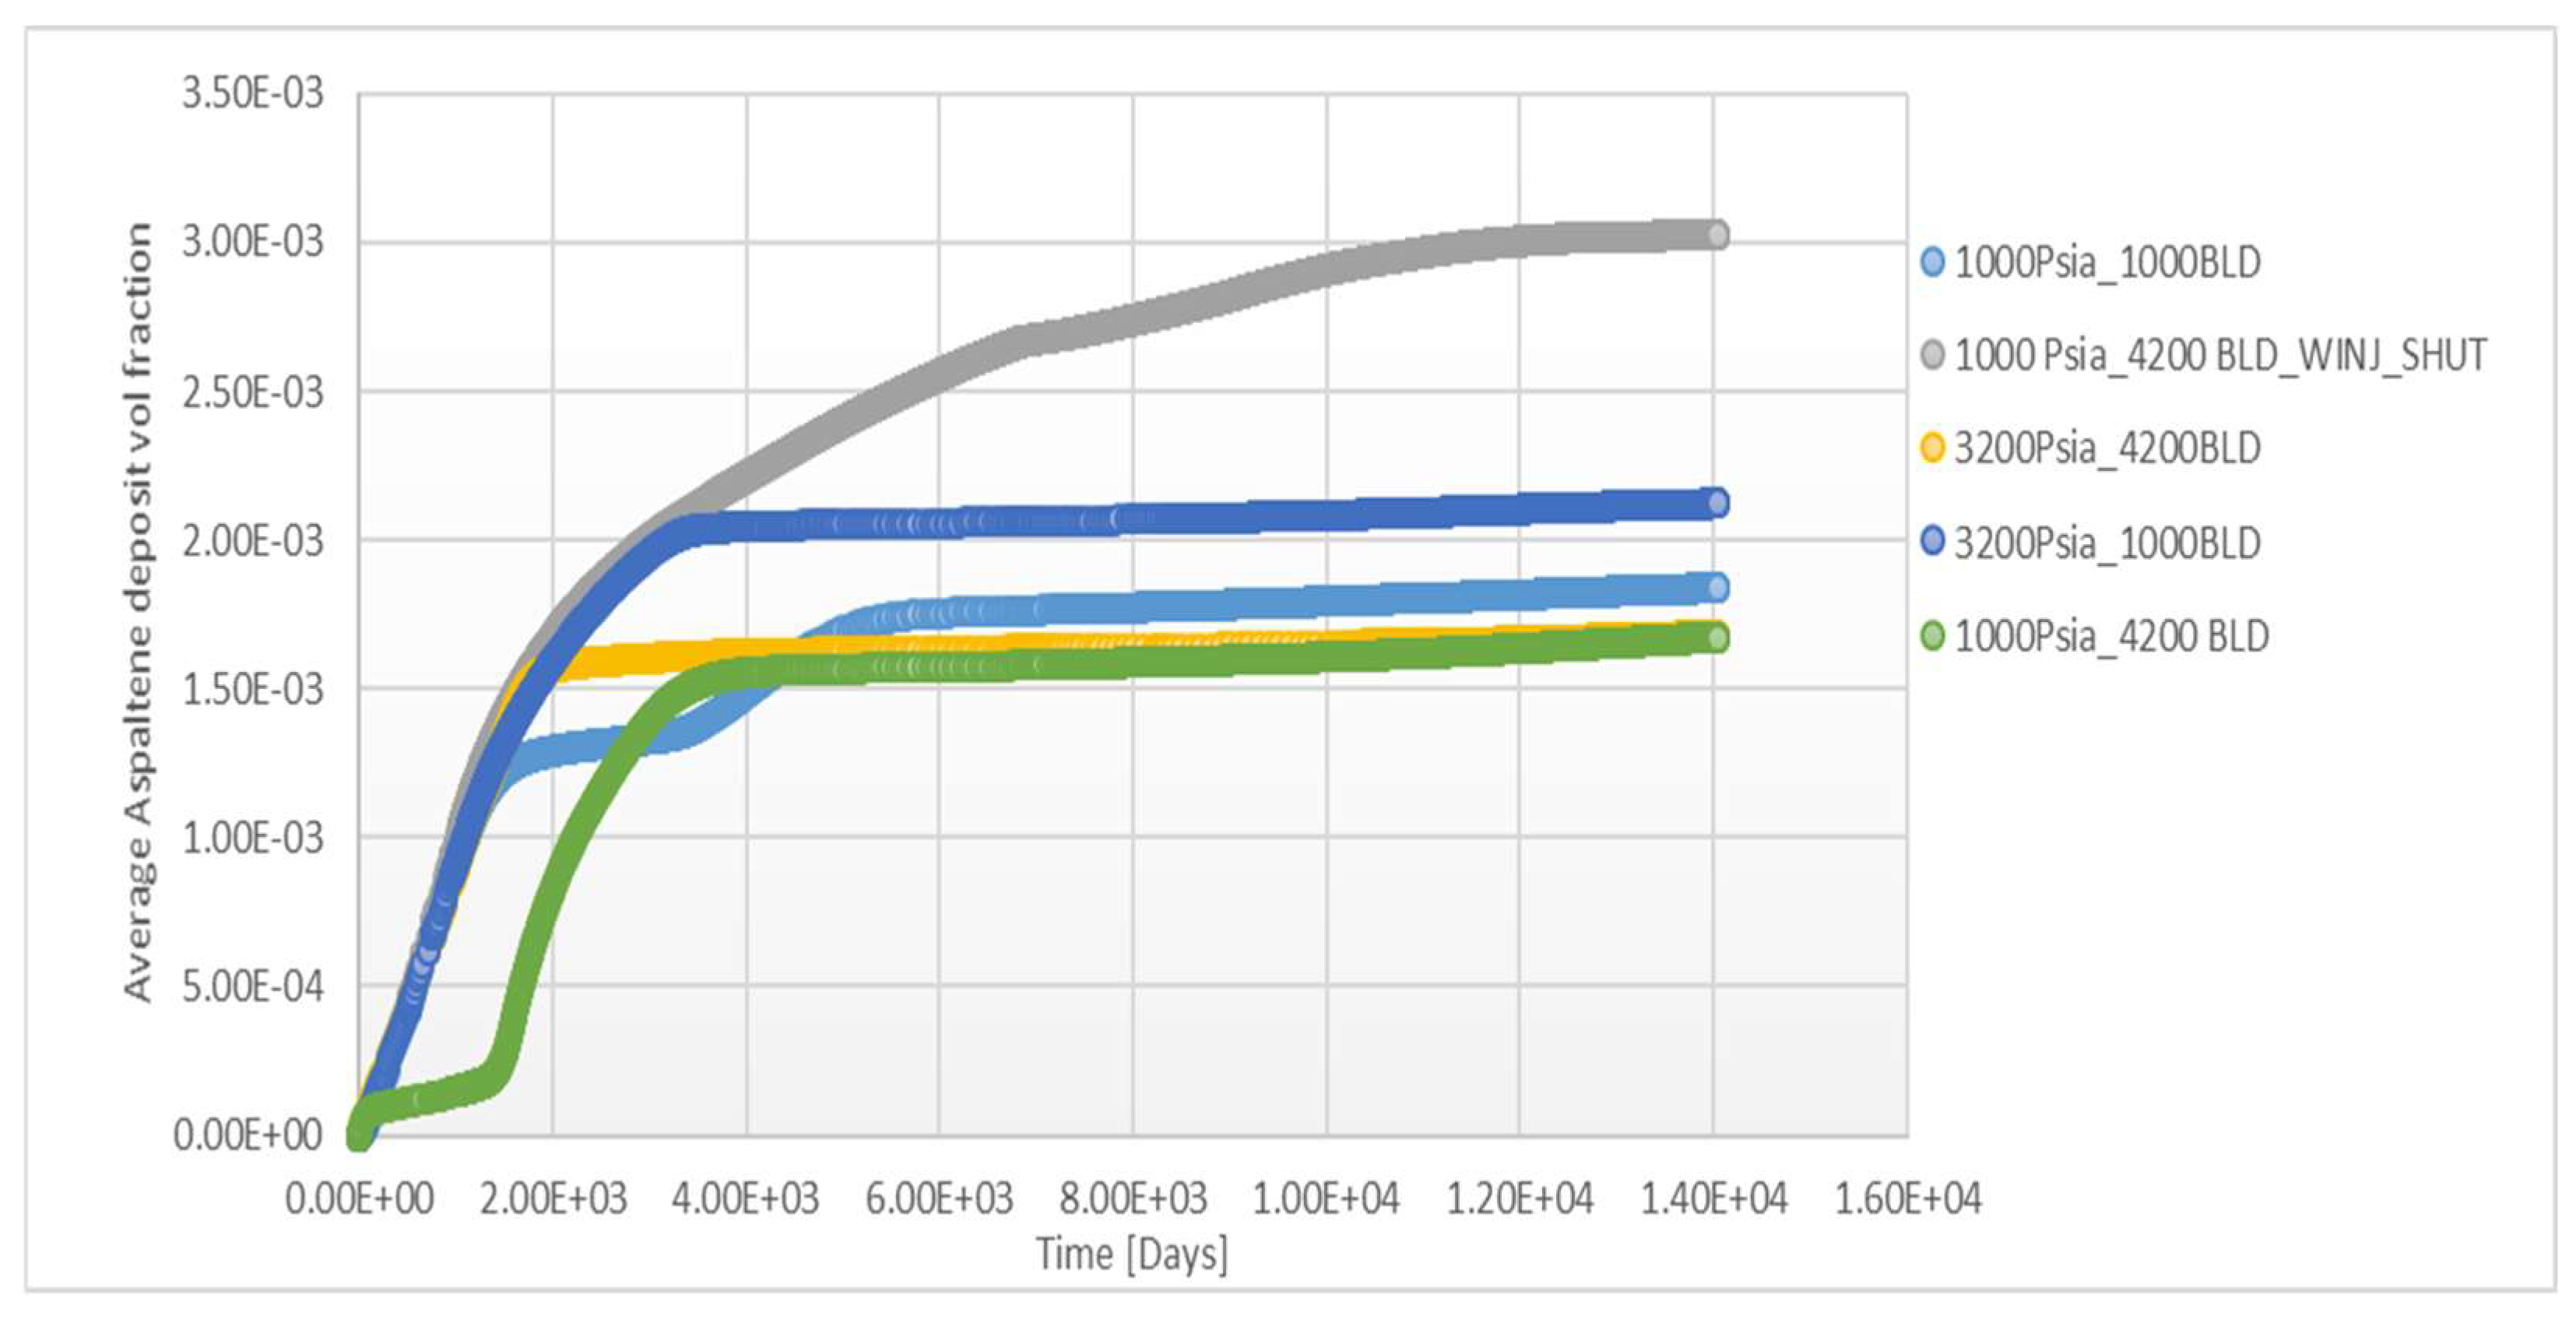
Figure 30 depicts the deposit volume fraction curves for various combinations of pressure and injection rate, as discussed above. At an injection pressure of 3200 psia, the deposition rate decreased as the injection rate increased from 1000 bbls to 4200 bbl/day. At an injection rate of 1000 bbl/day, the deposition rate increased as the injection pressure increased from 1000 psia to 3200 psia.
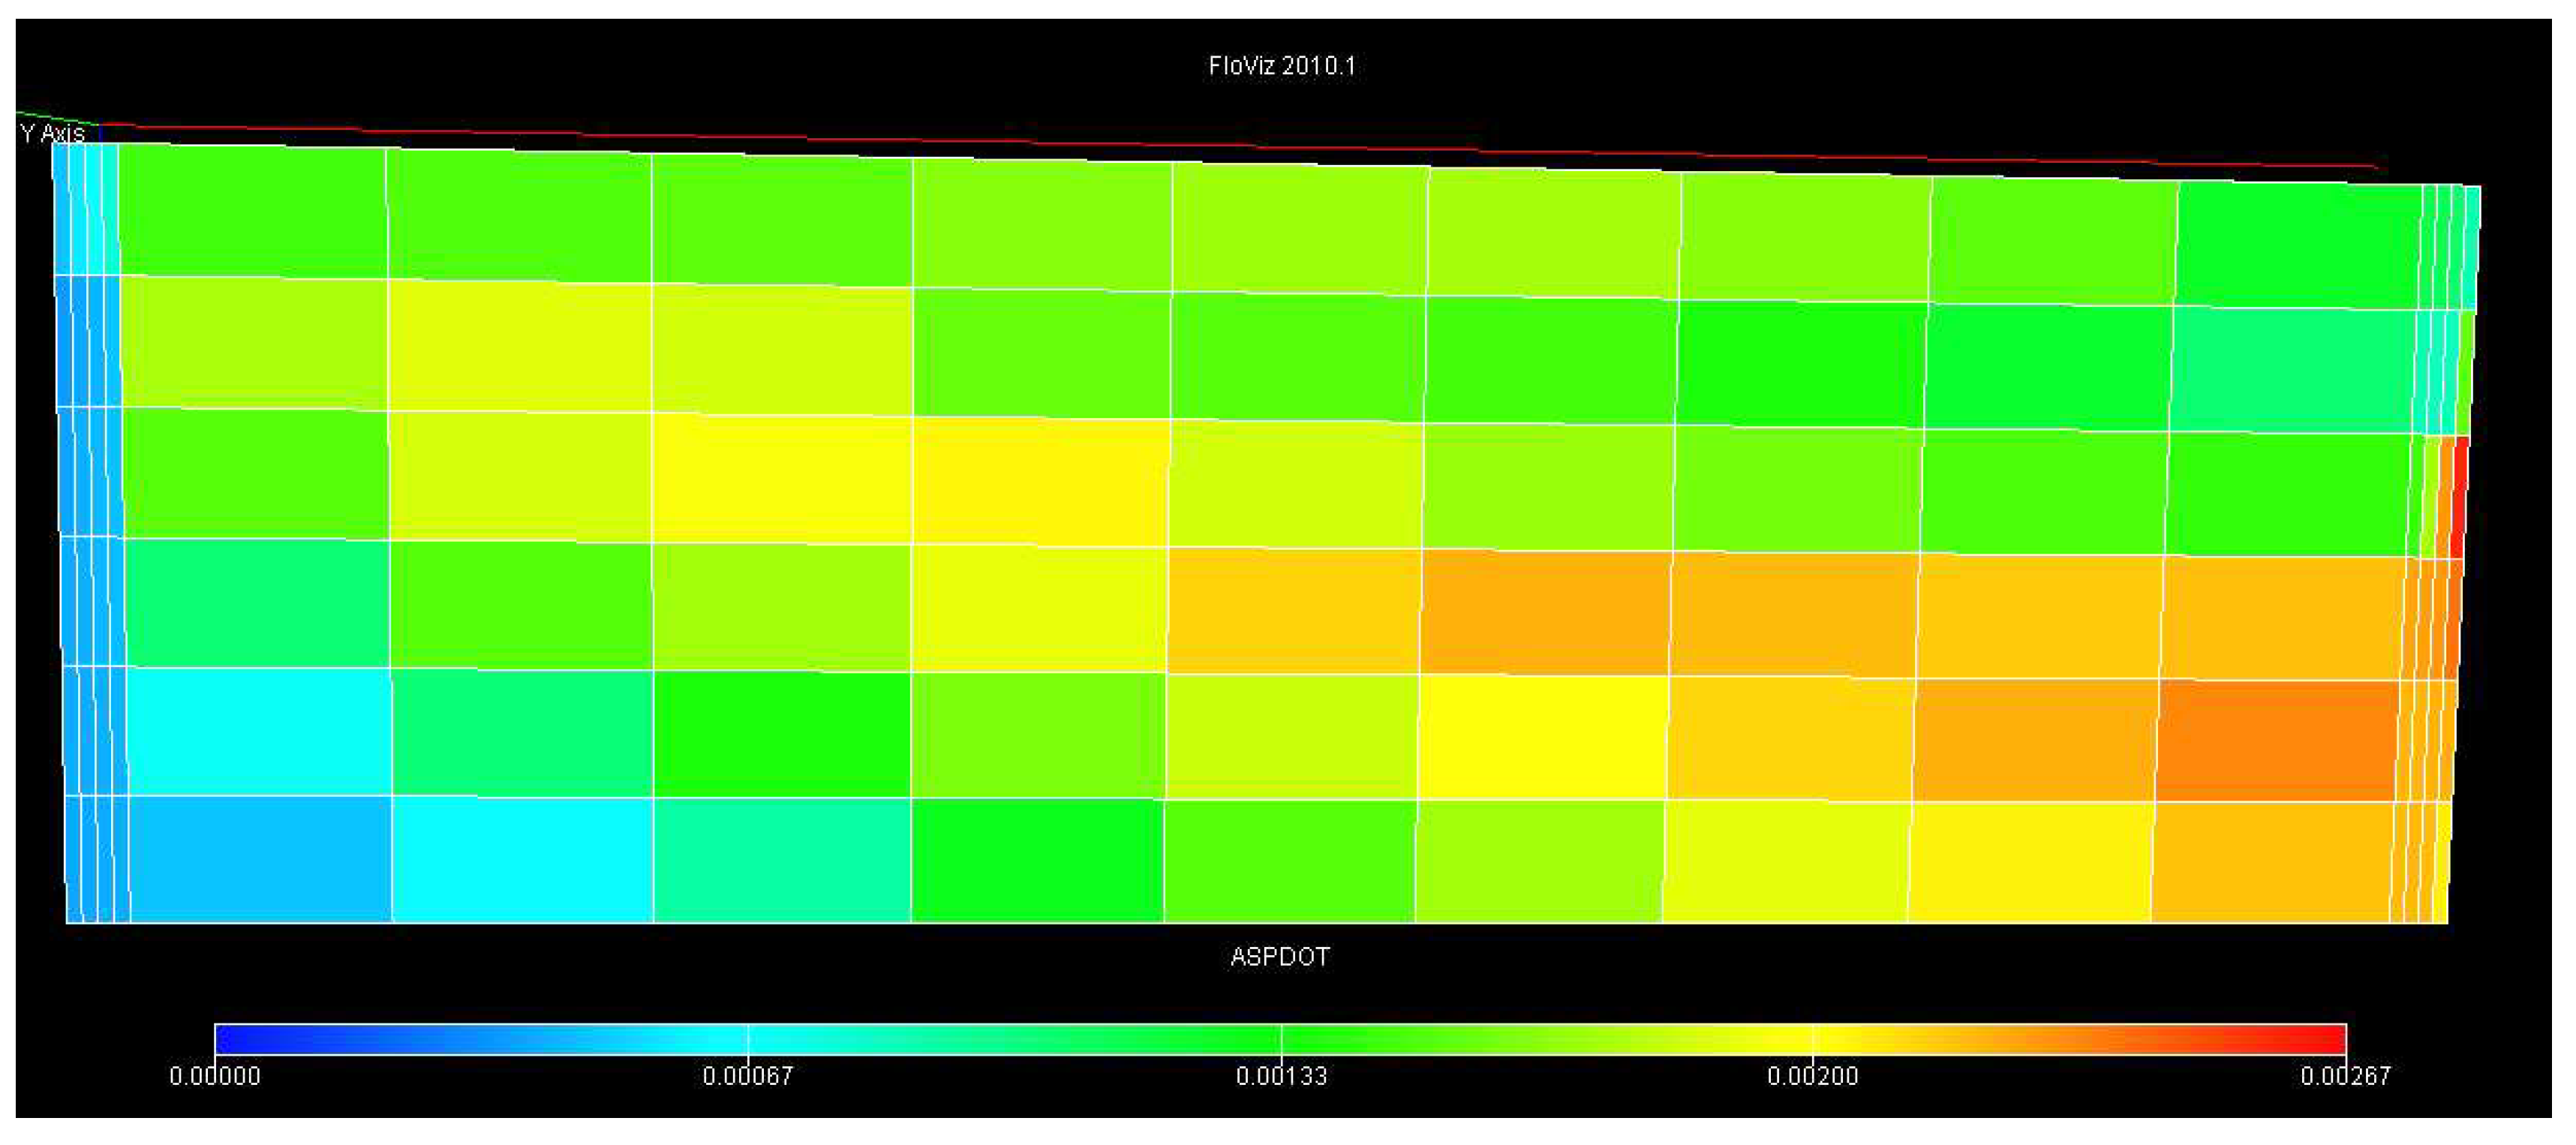
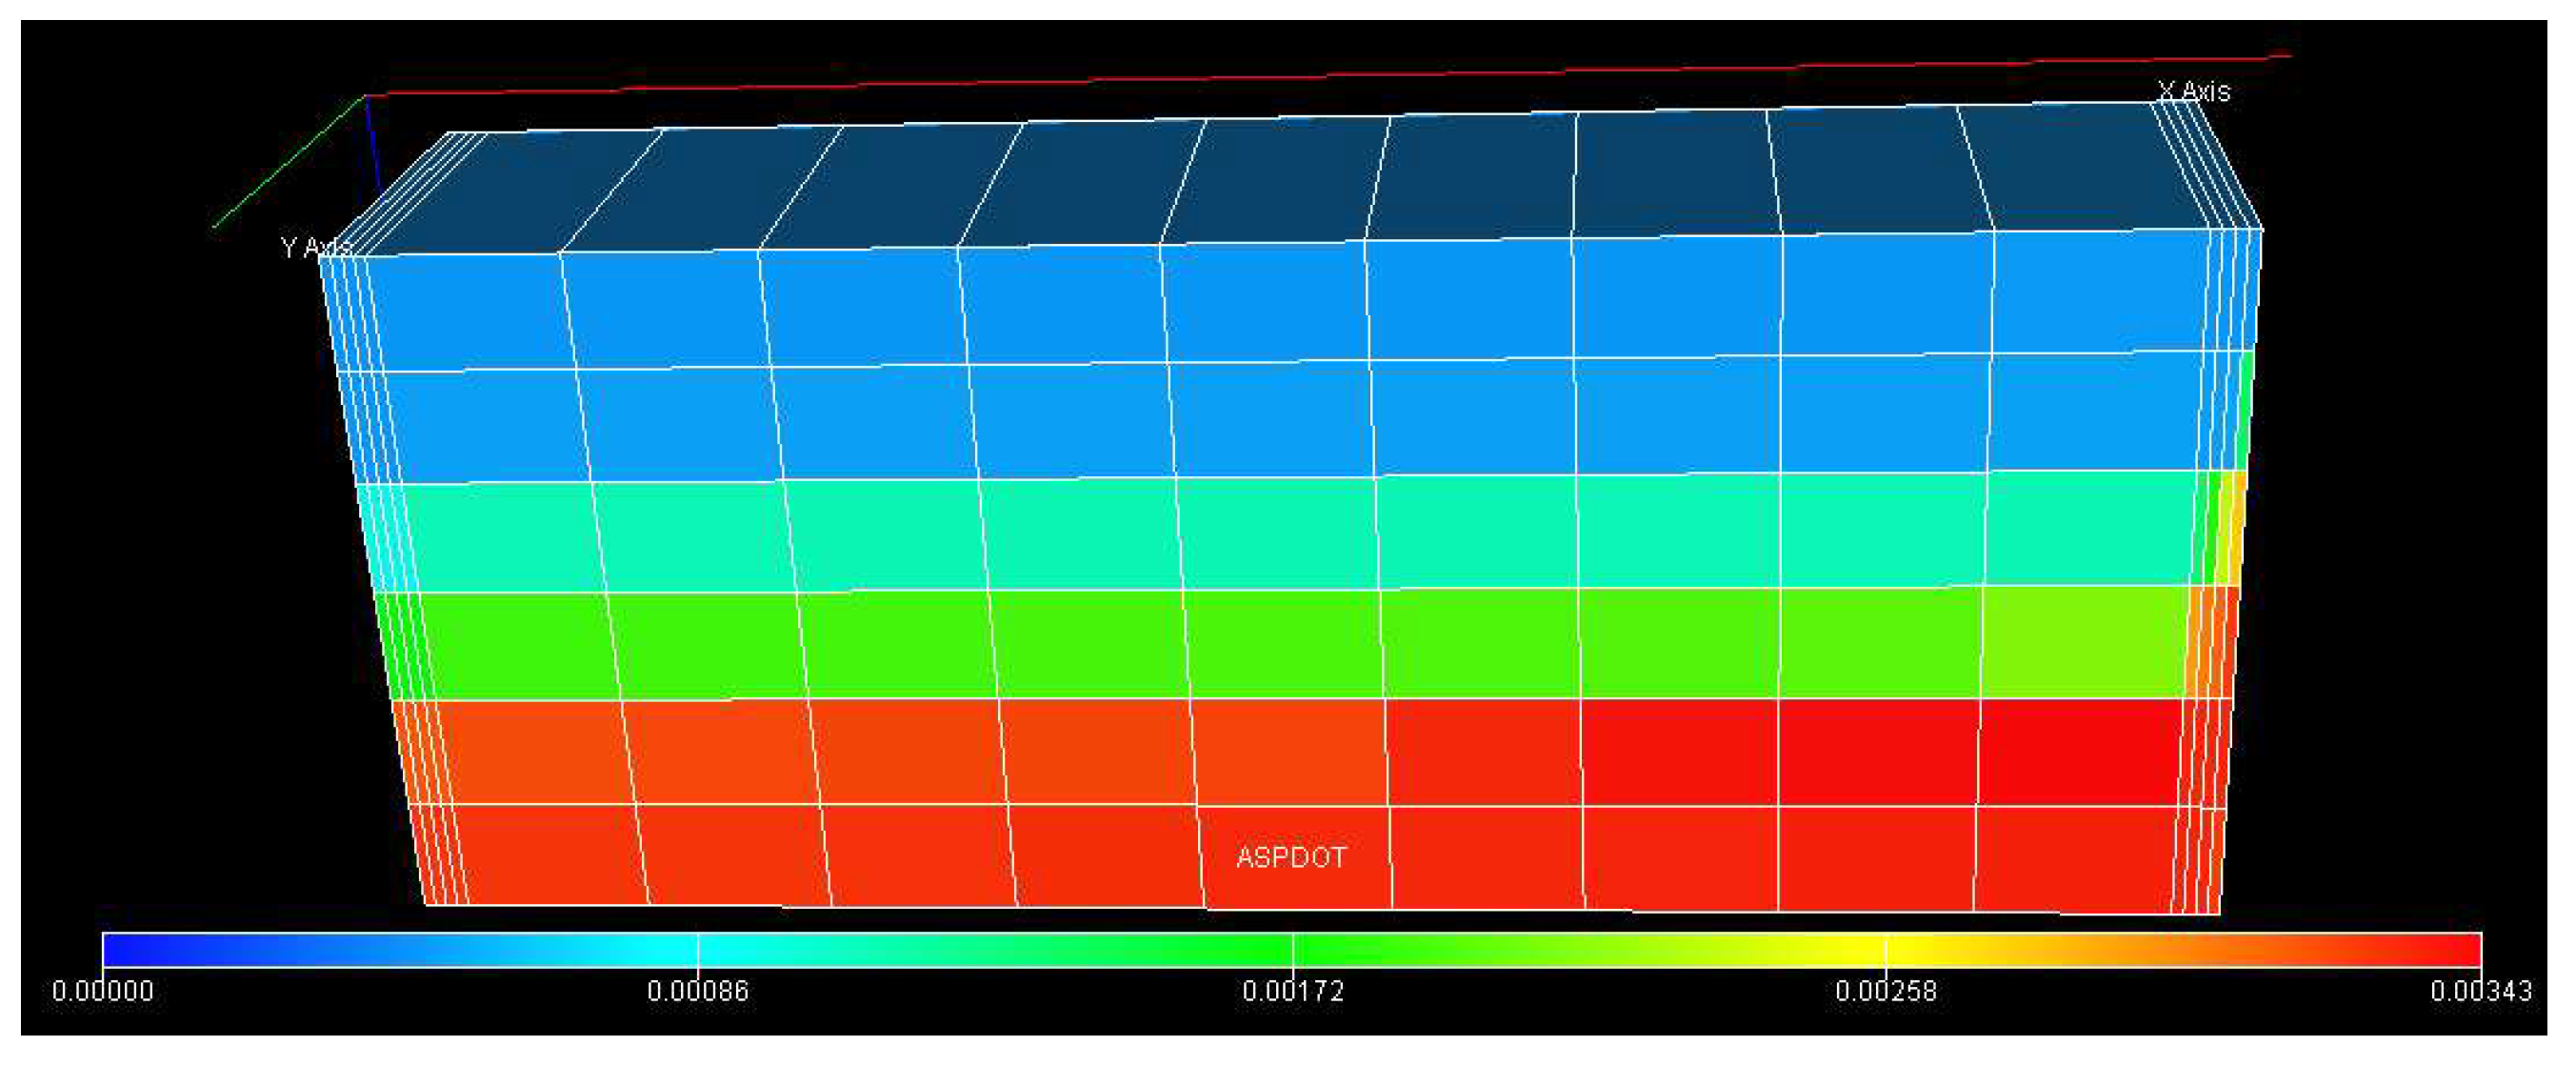
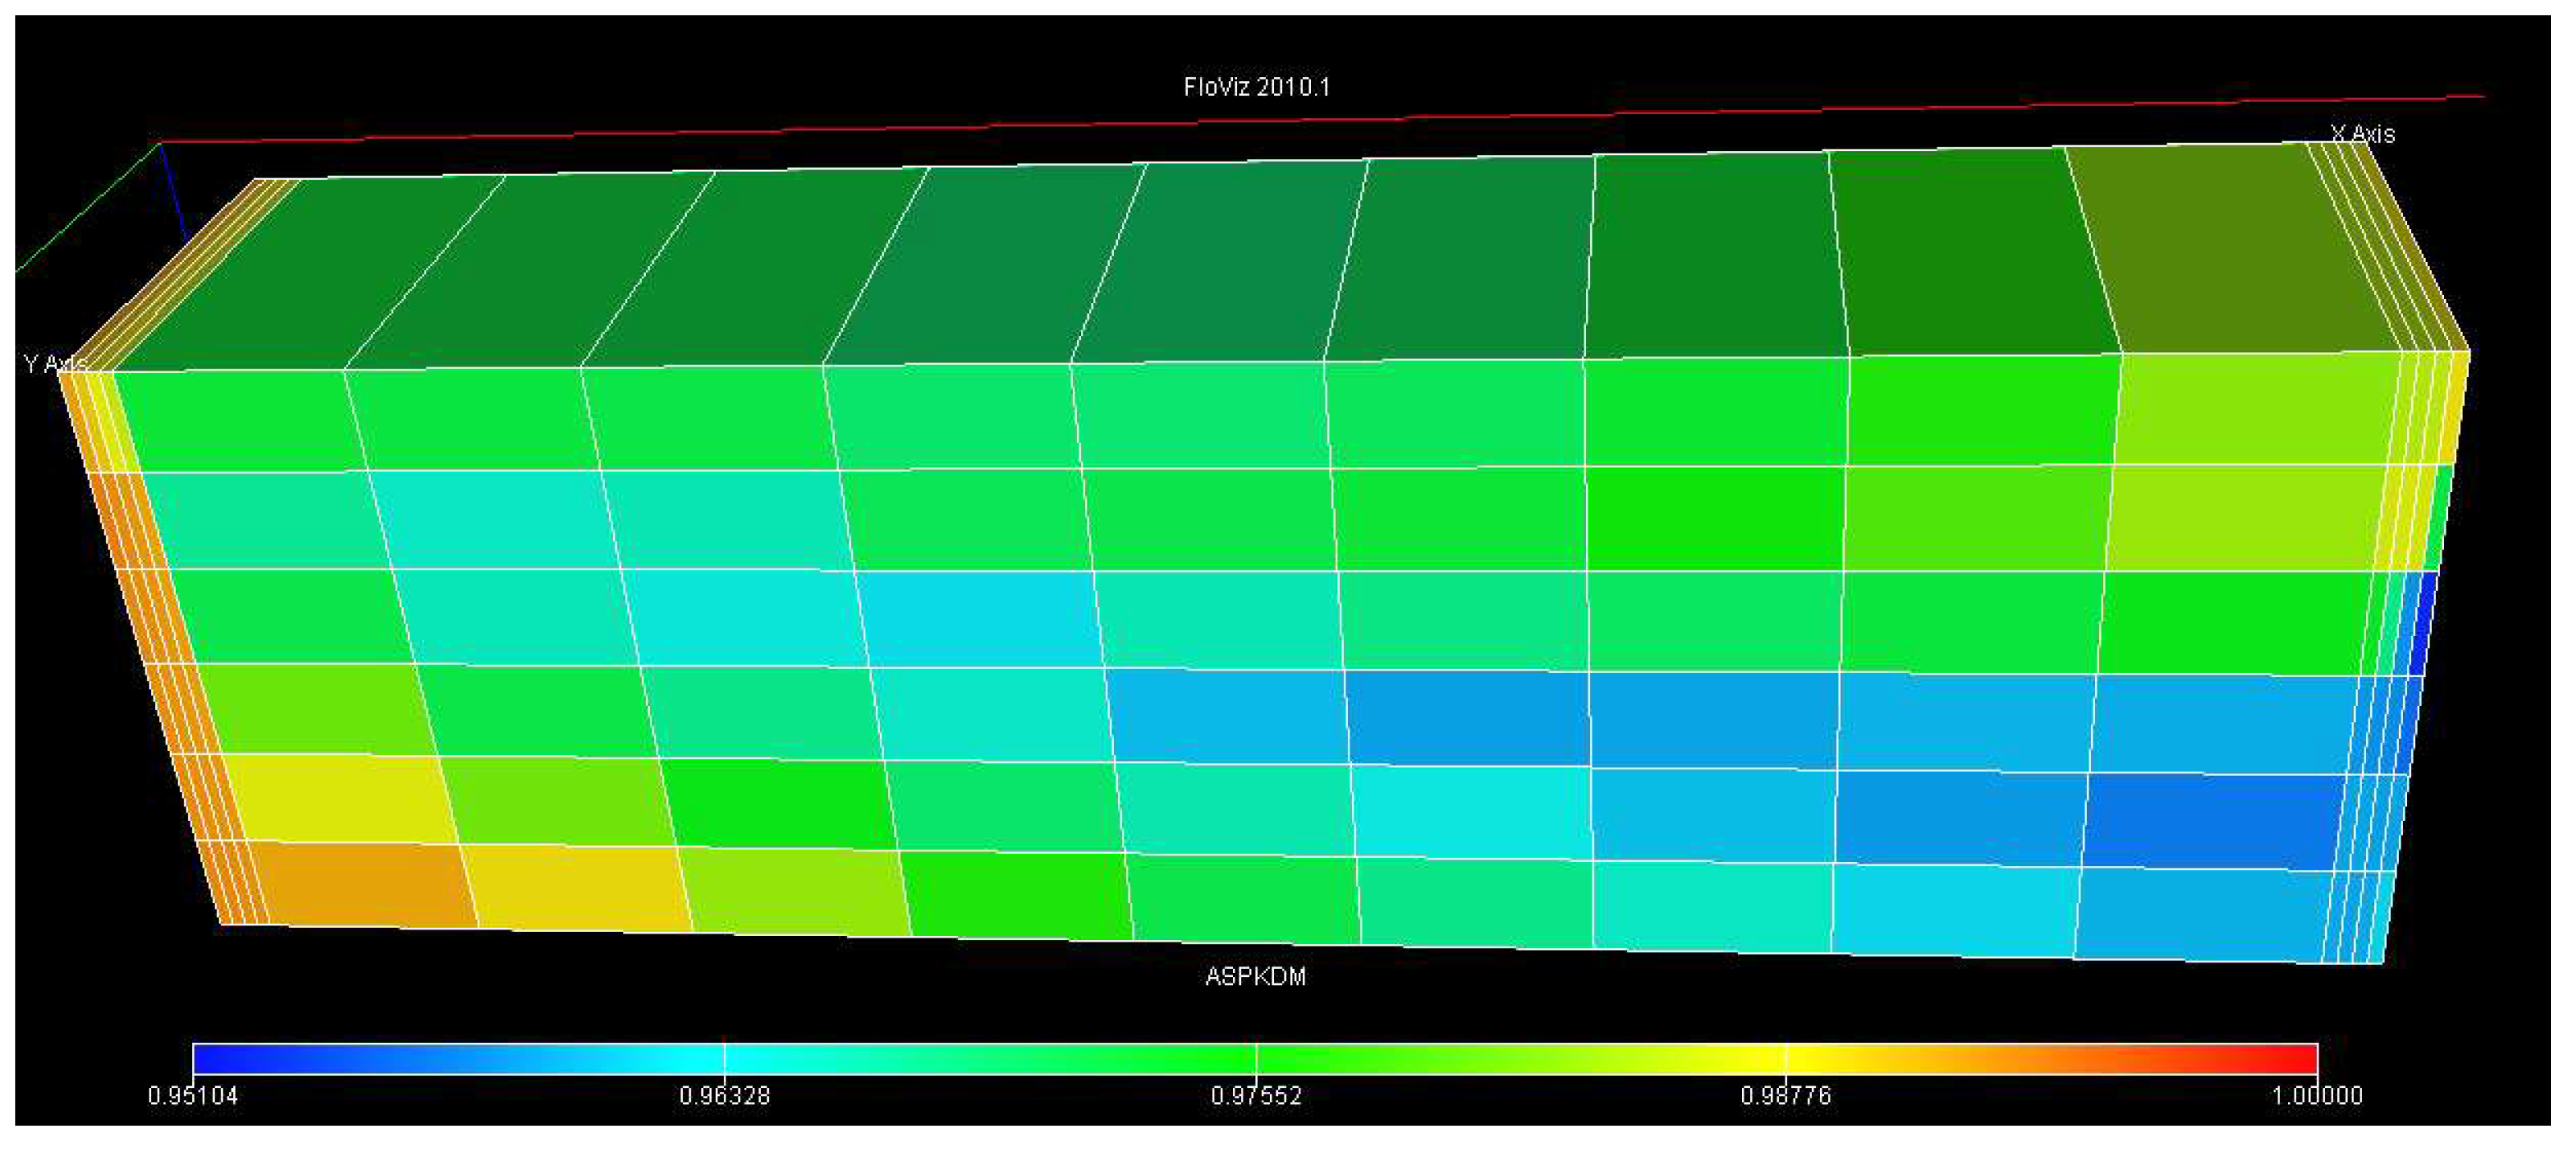
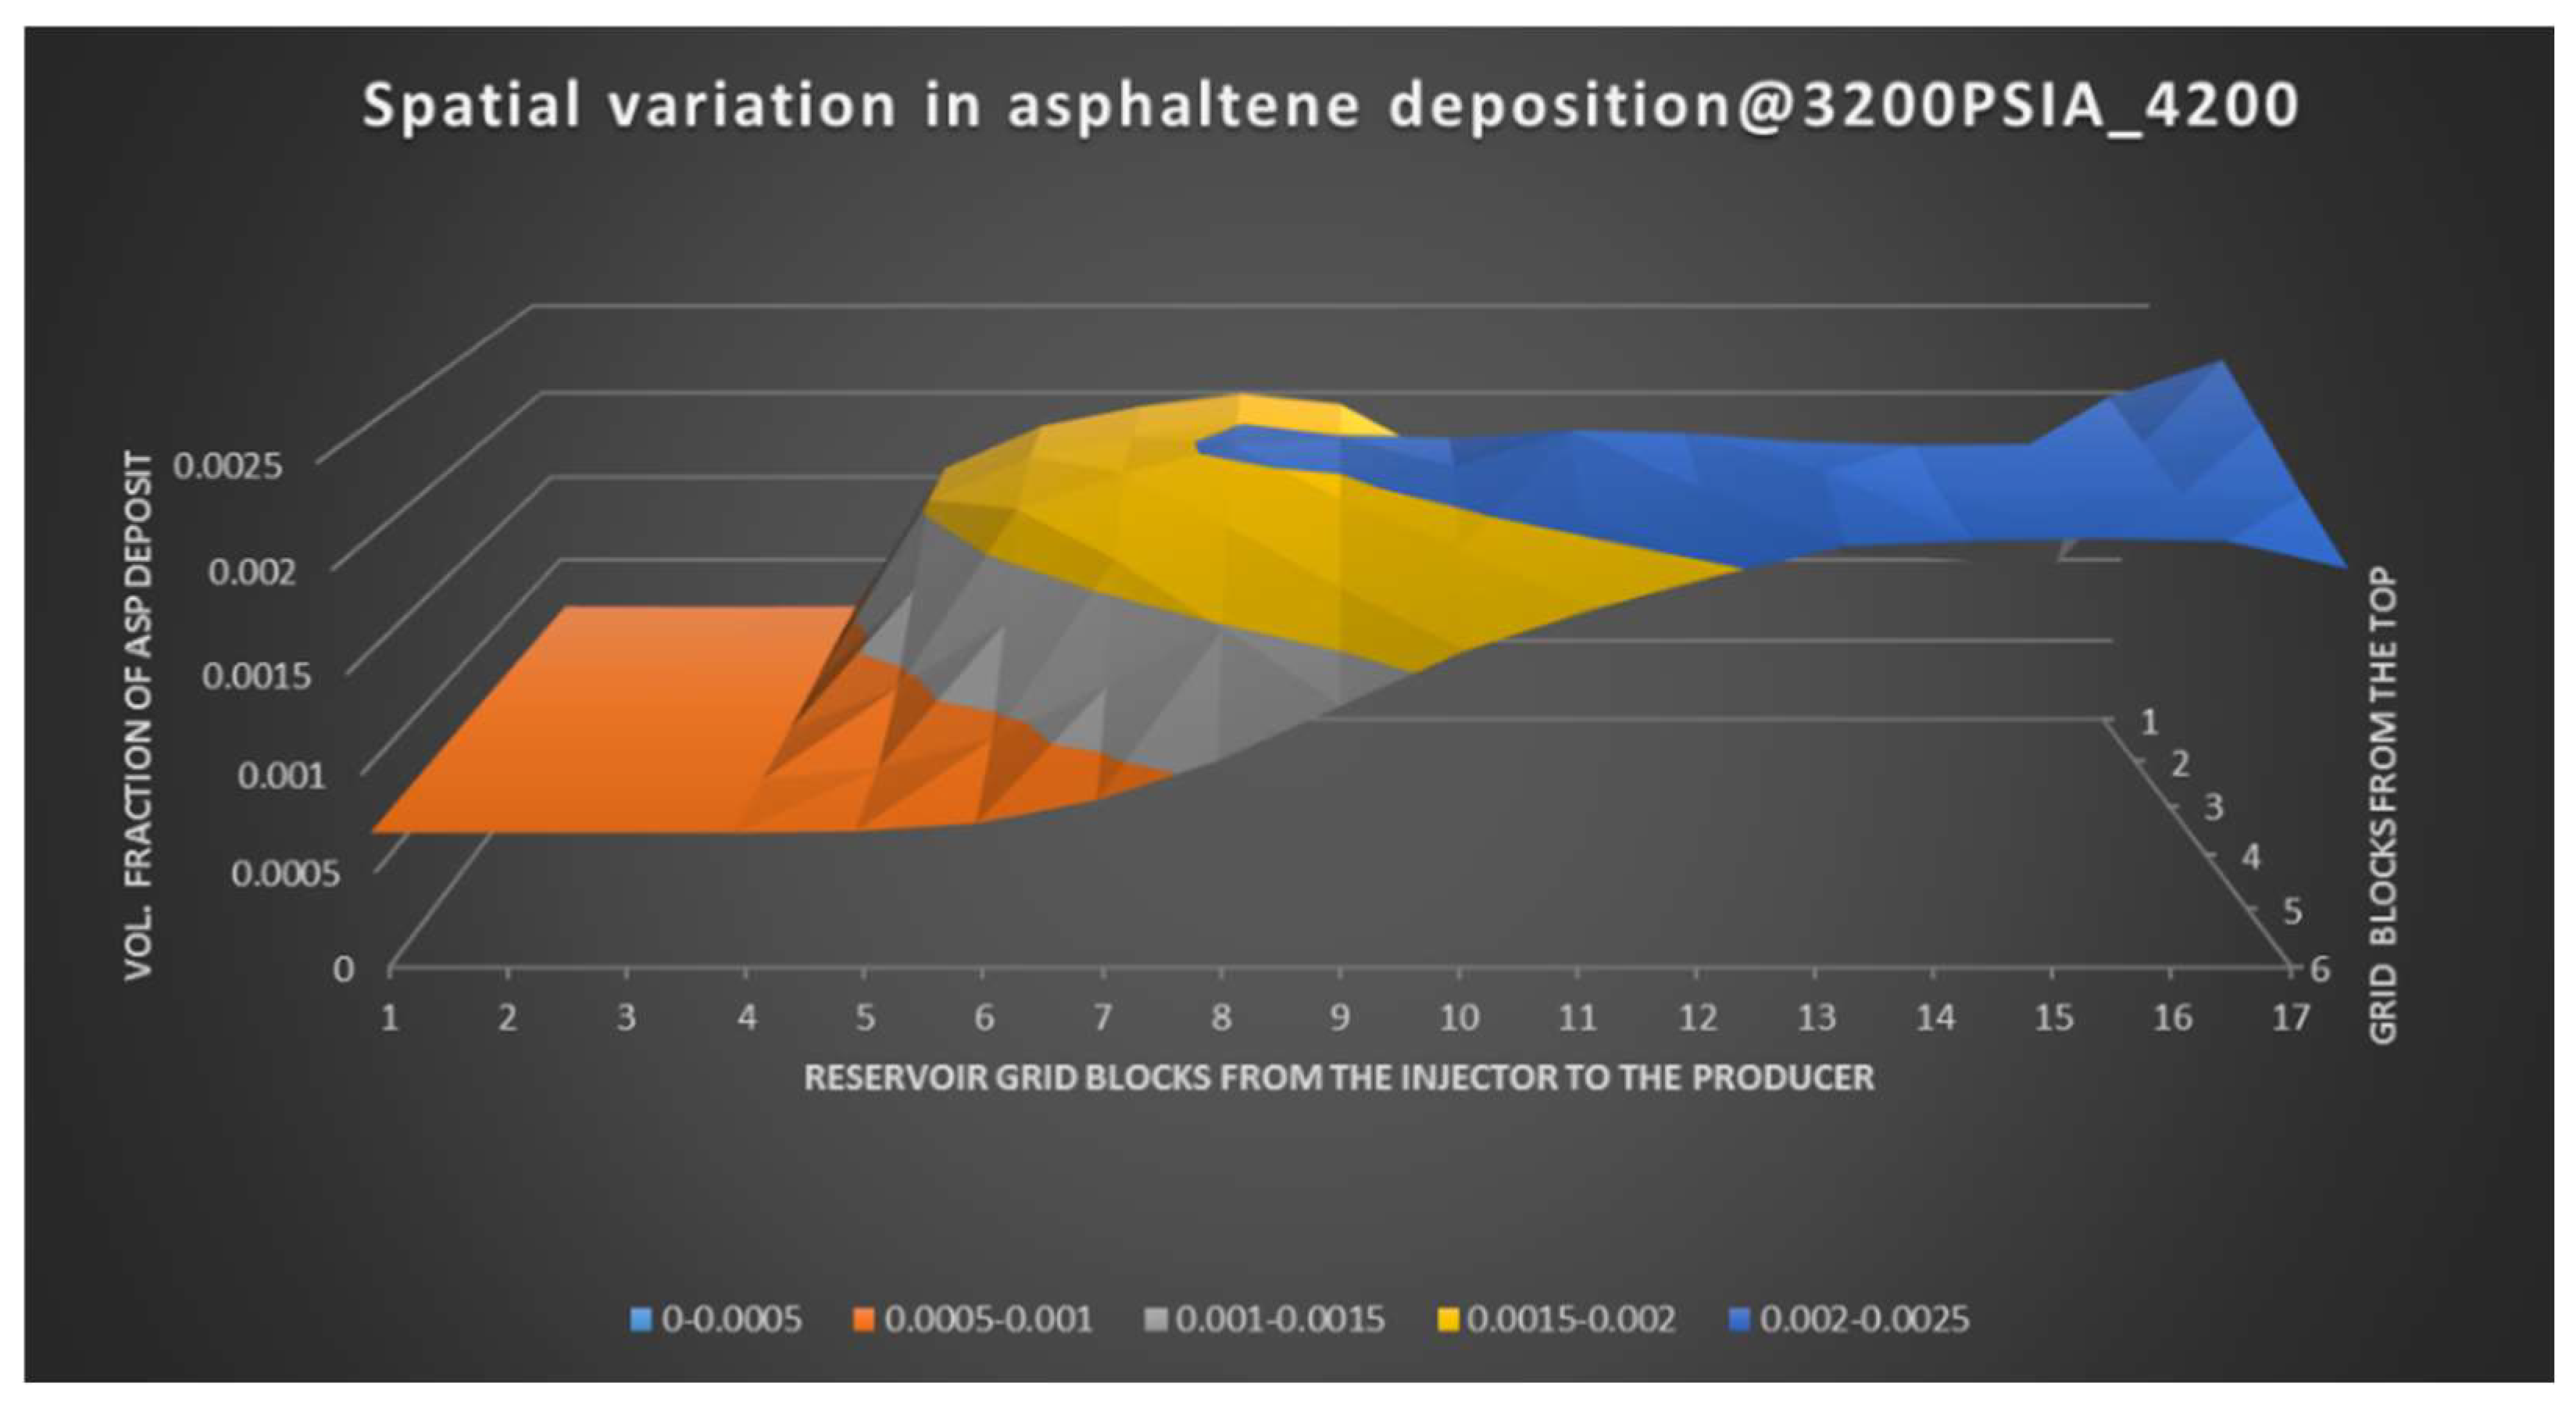
Figure 31 shows a spatial variant in asphaltene deposition at an injection pressure of 3200 psia and an injection rate of 4200 bbl/day. The colour scale at the bottom quantifies asphaltene deposition fractions. Relatively low deposition is observed at the formation near the injector due to high pressure and shear force, which are generated by the fluid injection. The deposition increases with distance from the injector. The changes in the deposition in the vertical direction in the formation around the middle of the reservoir are due to the phase saturation gradient, which is caused by the gravitational segregation effects. The oil saturation is maximum at the middle formation in the vertical direction. The V-shaped surface illustrates the tendency for the occurrence of deposition in the middle formation at relatively high shear force.

4.12. Oil Production

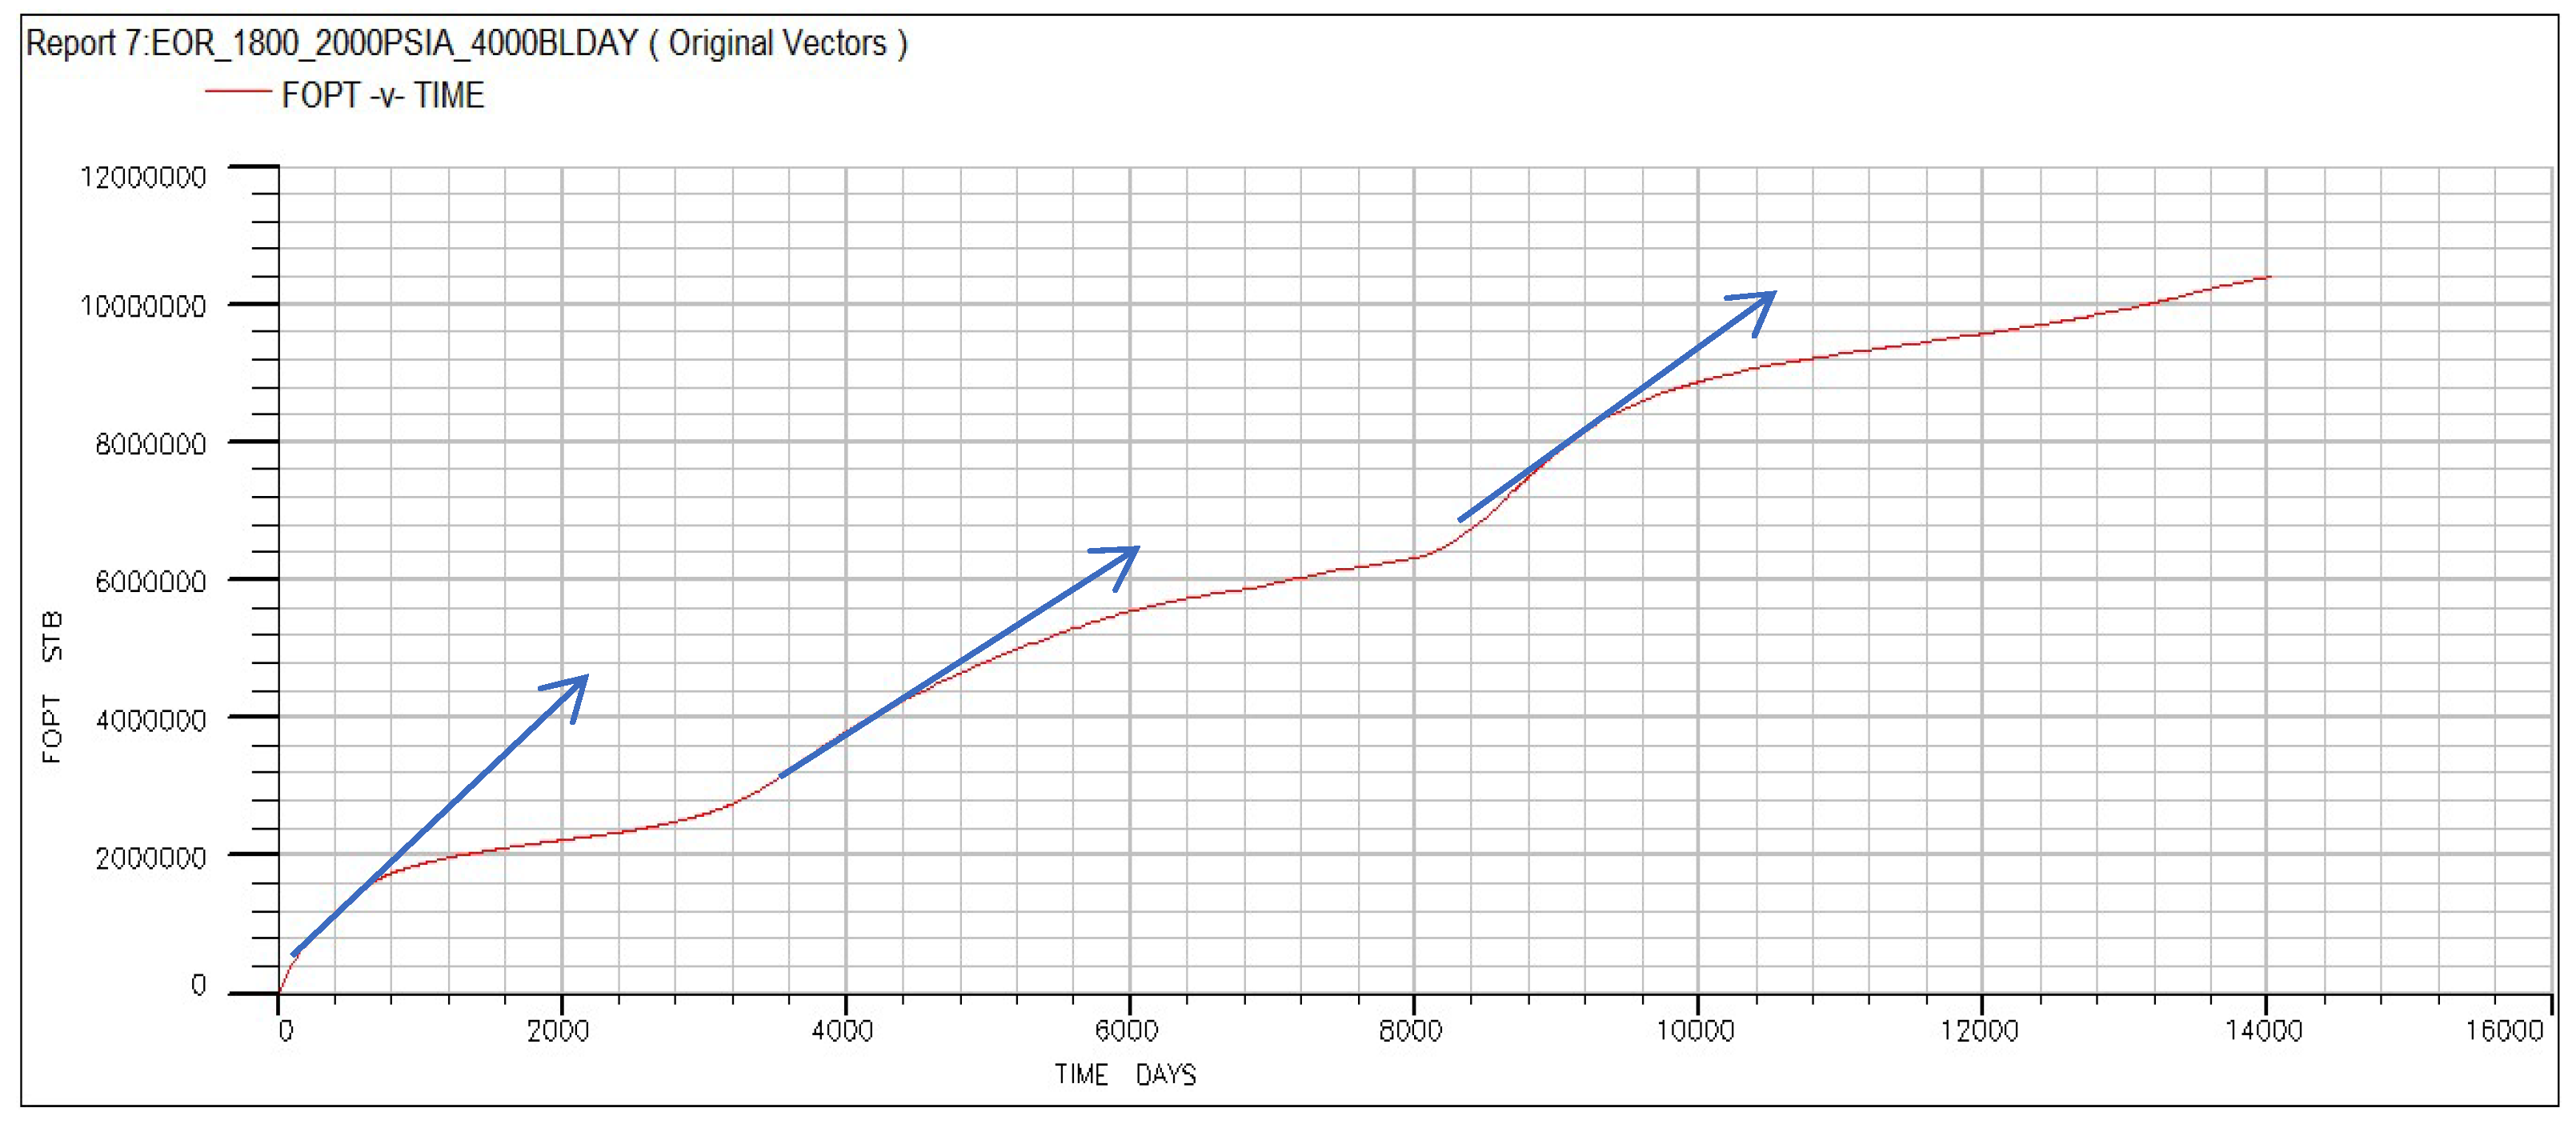
After further adjustment in injection methods, oil recovery was improved, as shown in Figure 32. The blue arrowed line reveals that the slope of oil production total increased with adjustment on injection techniques.

4.13. Alternative Asphaltene Deposition Control Methods

In addition to operational parameter optimization, asphaltene deposition in CO2 flooding can be mitigated using chemical inhibitors. These inhibitors, which include dispersants, solvents, and stabilizing polymers, act primarily by modifying particle–particle and particle–surface interactions to delay flocculation and reduce deposition [27]. Polymeric stabilizers, such as alkylphenol resin blends, adsorb onto asphaltene surfaces to create steric barriers against further aggregation [28].
Field applications have demonstrated that continuous injection of 100–500 ppm of chemical inhibitor can reduce deposition rates by up to 60% in high-asphaltene crudes [29]. Compared with operational strategies such as lowering injection pressure below the MMP or using water slugs, chemical inhibitors offer rapid deployment flexibility but require ongoing chemical supply and compatibility testing with reservoir fluids. In the context of the current study, the CO2 injection strategy achieved up to 28% improvement without chemical additives. However, a hybrid approach combining optimized injection pressure control with periodic chemical inhibition could potentially provide more robust mitigation against precipitation and deposition across a wider range of reservoir conditions.

5. Conclusions

CO2 flooding is an effective enhanced oil recovery method, but in asphaltenic crude systems, it can trigger asphaltene precipitation, especially near the bubble point or under miscible conditions. Simulations showed that precipitation depends on fluid composition, pressure, and injection conditions. Below the MMP, precipitation is minor and localized, while above MMP, widespread vaporization of volatile components causes significant precipitation.
However, high shear rates at elevated injection rates can limit asphaltene deposition by keeping particles suspended. Pore size influences whether clogging occurs, and water slugs can effectively clear blockages. Wettability alteration is mainly governed by the strength of asphaltene–rock interactions, which are influenced by electrostatic forces and flow conditions. Optimizing CO2 injection parameters is critical for minimizing formation damage and maximizing recovery. The theoretical framework developed in this study can significantly enhance oil recovery by preventing wettability alteration and pore blockage caused by asphaltene precipitation, two major contributors to reduced recovery in asphaltenic crude systems. These issues are especially severe in fine-grained formations and can incur high remediation costs.

Author Contributions

Conceptualization, D.S. and F.B.; methodology, H.G.; software, R.T.; validation, H.T.; formal analysis, D.A.O.; writing—original draft preparation, D.A.O.; writing—review and editing, F.D.N.; visualization, F.B.; supervision, F.B.; All authors have read and agreed to the published version of the manuscript.

Funding

This research received no external funding.

Data Availability Statement

The original contributions presented in this study are included in the article. Further inquiries can be directed to the corresponding authors.

Conflicts of Interest

The authors declare no conflict of interest.

Abbreviations

bblBarell
SCNSingle Carbon Number
CO2Carbon dioxide
EOREnhanced Oil Recovery
MMPMinimum Miscibility Pressure

References

  1. International Energy Agency (IEA). Global Energy Review 2025; IEA: Paris, France, 2025; Available online: https://www.iea.org/reports/global-energy-review-2025 (accessed on 18 August 2025).
  2. Kant, S.; Beintema, K.; Bell, M.; Al-Khulaifi, K. The Smarter Path to Energy Security and Profitability? Optimizing Production. Boston Consulting Group (BCG). Available online: https://www.bcg.com/publications/2025/optimizing-production-for-energy-profit-security (accessed on 18 August 2025).
  3. Mahdavi, S.; Jalilian, M.; Dolati, S. Review and perspectives on CO2 induced asphaltene instability: Fundamentals and implications for phase behaviour, flow assurance, and formation damage in oil reservoirs. Fuel 2024, 368, 131574. [Google Scholar] [CrossRef]
  4. Halim, M.C.; Hamidi, H.; Akisanya, A.R. Minimizing Formation Damage in Drilling Operations: A Critical Point for Optimizing Productivity in Sandstone Reservoirs Intercalated with Clay. Energies 2022, 15, 162. [Google Scholar] [CrossRef]
  5. Ahmadi, M.A.; Galedarzadeh, M.; Shadizadeh, S.R. Low parameter model to monitor bottom hole pressure in vertical multiphase flow in oil production wells. Petroleum 2015, 2, 258–266. [Google Scholar] [CrossRef]
  6. Lake, L.; Johns, R.T.; Rossen, W.R.; Pope, G.A. Fundamentals of Enhanced oil Recovery; Society of Petroleum Engineers: Richardson, TX, USA, 2014. [Google Scholar] [CrossRef]
  7. Singh, A. Technology Focus: Formation Damage (March 2023). J. Pet. Technol. 2023, 75, 83–84. [Google Scholar] [CrossRef]
  8. Li, Q.; Li, Q.; Wang, F.; Xu, N.; Wang, Y.; Bai, B. Settling Behavior and Mechanism Analysis of Kaolinite as a Fracture Proppant of Hydrocarbon Reservoirs in CO2 Fracturing Fluid. Colloids Surf. A 2025, 724, 137463. [Google Scholar] [CrossRef]
  9. Elrahmani, A.; Al-Raoush, R.I. Spatial Dependency of Clogged Throats in Porous Media: A Microscale Investigation. SPE J. 2025, 30, 712–728. [Google Scholar] [CrossRef]
  10. Yin, D.; Li, Q.; Zhao, D. Investigating Asphaltene Precipitation and Deposition in Ultra-Low Permeability Reservoirs during CO2-Enhanced Oil Recovery. Sustainability 2024, 16, 4303. [Google Scholar] [CrossRef]
  11. Sadeghtabaghi, Z.; Alhreez, M.; Wen, D. A Review on Asphaltenes Characterization by X-ray Diffraction: Fundamentals, Challenges, and Tips. J. Mol. Struct. 2021, 1238, 130425. [Google Scholar] [CrossRef]
  12. Ghadimi, M.; Ghaedi, M.; Malayeri, M.R.; Amani, M.J. A new approach to model asphaltene induced permeability damage with emphasis on pore blocking mechanism. J. Pet. Sci. Eng. 2020, 184, 106512. [Google Scholar] [CrossRef]
  13. Elkahky, S.; Lagat, C.; Sarmadivaleh, M.; Barifcani, A. A comparative study of density estimation of asphaltene structures using group contribution methods and molecular dynamic simulations for an Australian oil field. J. Pet. Explor. Prod. Technol. 2019, 9, 2699–2708. [Google Scholar] [CrossRef]
  14. Svalova, A.; Walshaw, D.; Lee, C.; Demyanov, V.; Parker, N.G.; Povey, M.J.; Abbott, G.D. Estimating the Asphaltene Critical Nano aggregation Concentration Region Using Ultrasonic Velocity Measurements. Sci. Rep. 2021, 11, 6698. [Google Scholar] [CrossRef] [PubMed]
  15. Fajardo-Rojas, F.; Alvarez Solano, O.A.; Samaniuk, J.R.; Pradilla, D. Deviation from Equilibrium Thermodynamics of an Asphaltene Model Compound during Compression–Expansion Experiments at Fluid–Fluid Interfaces. Langmuir 2021, 37, 1799–1810. [Google Scholar] [CrossRef]
  16. Mohammed, I.; Mahmoud, M.; Shehri, D.A.; El-Husseiny, A.; Alade, O. Asphaltene precipitation and deposition: A critical review. J. Pet. Sci. Eng. 2020, 197, 107956. [Google Scholar] [CrossRef]
  17. Yonebayashi, H.; Iwama, H.; Takabayashi, K.; Miyagawa, Y.; Watanabe, T. Uneven distribution of asphaltene deposits in CO2 flooding path: Interpretation by combining thermodynamic and Micro-CT 3D geological porous models. Energy Fuels 2020, 35, 329–340. [Google Scholar] [CrossRef]
  18. Kumar, N.; Sampaio, M.A.; Ojha, K.; Hoteit, H.; Mandal, A. Fundamental aspects, mechanisms and emerging possibilities of CO2 miscible flooding in enhanced oil recovery: A review. Fuel 2022, 330, 125633. [Google Scholar] [CrossRef]
  19. Ebaid, H.; Gasser, M.; Yehia, T.; Okoroafor, E.R. Enhancing Oil Recovery in Heterogeneous Reservoirs with CO2 Flooding: A Simulation Study. In Proceedings of the SPE/AAPG/SEG Carbon, Capture, Utilization, and Storage Conference and Exhibition, Houston, TX, USA, 11–13 March 2024; Available online: https://onepetro.org/ccusce/proceedings-abstract/24JCUS/3-24JCUS/D031S017R001/543723 (accessed on 10 May 2025).
  20. Zhu, D.; Li, B.; Chen, L.; Zhang, C.; Zheng, L.; Chen, W.; Li, Z. Experimental investigation of CO2 foam flooding-enhanced oil recovery in fractured low-permeability reservoirs: Core-scale to pore-scale. Fuel 2024, 362, 130792. [Google Scholar] [CrossRef]
  21. Khalili, Y.; Ahmadi, M.; Amirkabir University of Technology. Reservoir Modeling & Simulation: Advancements, challenges, and future Perspectives. J. Chem. Pet. Eng. 2023, 57, 343–364. [Google Scholar] [CrossRef]
  22. Young, L.C. Compositional Reservoir simulation: A review. SPE J. 2022, 27, 2746–2792. [Google Scholar] [CrossRef]
  23. AlHammadi, A.A.; Abutaqiya, M.I.L. Predictive Modeling of Phase Behavior of Reservoir Fluids under Miscible Gas Injection Using the Peng–Robinson Equation of State and the Aromatic Ring Index. ACS Omega 2023, 8, 3270–3277. [Google Scholar] [CrossRef]
  24. Liu, H.; Wang, J.; Zhao, H.; Wang, B.; Nan, R.; An, C. Quantitative Evaluation of C7+ Splitting and EOS Tuning for SCN-Based Pseudo-Component Models in Reservoir Fluid Phase Behavior. Processes 2024, 12, 2066. [Google Scholar] [CrossRef]
  25. Nasiri, A.; Zhang, Y.; Zendehboudi, S.; Bahadori, A. Thermal effects on fluid flow and production performance in vertical oil wells. J. Pet. Sci. Eng. 2022, 213, 110620. [Google Scholar] [CrossRef]
  26. Alvarez, J.; Ayala, R.; Hascakir, B. Experimental evaluation of asphaltene precipitation, deposition, and mitigation in high-permeability sandstone cores. J. Pet. Sci. Eng. 2022, 210, 110112. [Google Scholar] [CrossRef]
  27. Smith, J.L.; Haskett, C.; Leontaritis, K. Advances in chemical inhibition of asphaltene deposition. In Proceedings of the SPE International Oilfield Scale Conference, Aberdeen, UK, 18–19 June 2018. [Google Scholar] [CrossRef]
  28. Zvereva, A.E.; Ershov, M.A.; Savelenko, V.D.; Lobashova, M.M.; Rogova, M.Y.; Makhova, U.A.; Tikhomirova, E.O.; Burov, N.O.; Aleksanyan, D.R.; Kapustin, V.M.; et al. Use of Asphaltene Stabilizers for the Production of Very Low-Sulfur Fuel Oil: Experimental Evaluation of Alkylphenol-Formaldehyde Resin Stabilizers. Energies 2023, 16, 7649. [Google Scholar] [CrossRef]
  29. Rahmani, O.; Dabir, B.; Jafari Behbahani, T. Experimental and modeling study of asphaltene deposition control by chemical inhibitors during CO2 flooding. Fuel 2021, 293, 120465. [Google Scholar] [CrossRef]
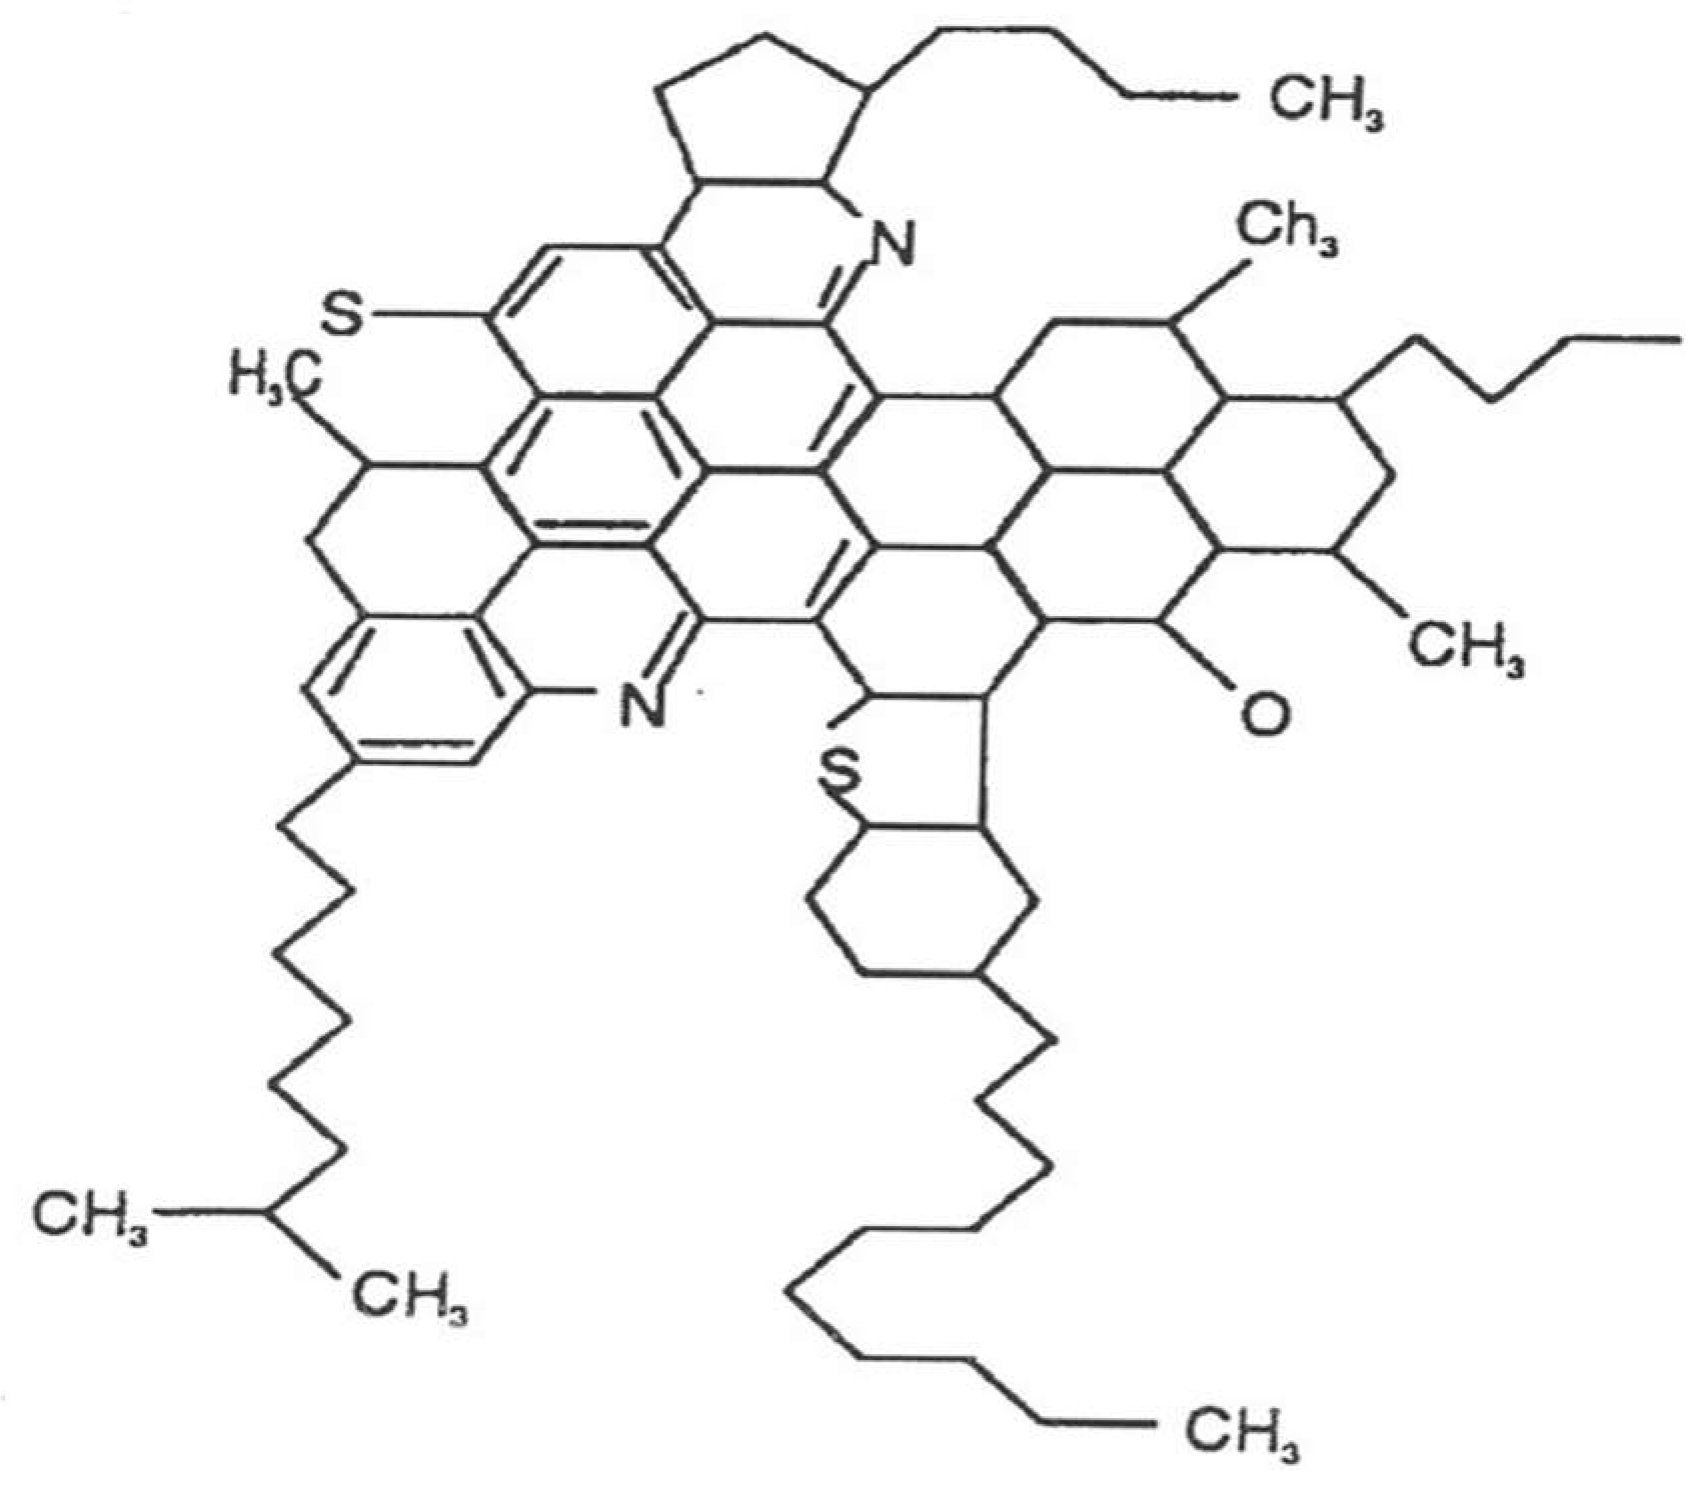
Figure 1. Asphaltene model molecule structure [12].
Processes 13 02740 g001
Figure 2. Grid block size distribution.
Processes 13 02740 g002
Figure 3. Reservoir model.
Processes 13 02740 g003
Figure 4. Oil-Water Relative Permeability Curves against Water Saturation.
Processes 13 02740 g004
Figure 5. Oil Capillary Pressure vs. Water Saturation.
Processes 13 02740 g005
Figure 6. Reservoir view depicting a relatively high gas saturation at the top layer of the reservoir.
Processes 13 02740 g006
Figure 7. Reservoir depicting sharp phase transition and gravitational segregation at injection pressure below the minimum miscibility pressure.
Processes 13 02740 g007
Figure 8. Reservoir depicting a smooth phase transition at injection pressure above the minimum miscibility pressure.
Processes 13 02740 g008
Figure 9. Oil production rate vs. time under no injection.
Processes 13 02740 g009
Figure 10. Oil production rate vs. time under CO2 gas flooding.
Processes 13 02740 g010
Figure 11. Reservoir oil saturation vs. time.
Processes 13 02740 g011
Figure 12. Grid blocks pressure under no-injection condition vs. time.
Processes 13 02740 g012
Figure 13. Asphaltene precipitate net deposit volume fraction under no-injection condition vs. time.
Processes 13 02740 g013
Figure 14. Reservoir view depicting the effect of water injection on asphaltene deposition.
Processes 13 02740 g014
Figure 15. A reservoir view depicting a spatial variation in asphaltene deposition under no water injection conditions.
Processes 13 02740 g015
Figure 16. Average asphaltene net deposit volume fraction under no-water injection condition vs. time.
Processes 13 02740 g016
Figure 17. Volume fraction of asphaltene precipitates under water injection vs. time.
Processes 13 02740 g017
Figure 18. Average asphaltene deposit volume fraction under water injection vs. time.
Processes 13 02740 g018
Figure 19. Permeability damage under water injection conditions.
Processes 13 02740 g019
Figure 20. Average asphaltene deposition volume fraction at injection pressure of 1000 psia and flow rate of 1000 bbl/day.
Processes 13 02740 g020
Figure 21. Asphaltene deposition volume fraction near the injector at an injection pressure of 1000 psia and a flow rate of 1000 bbl/day.
Processes 13 02740 g021
Figure 22. Asphaltene deposition volume fraction at the center of the reservoir in the horizontal direction at an injection pressure of 1000 psia and a flow rate of 1000 bbls.
Processes 13 02740 g022
Figure 23. Asphaltene deposition volume fraction near the producing well at an injection pressure of 1000 psia and a flow rate of 1000 bbl/day.
Processes 13 02740 g023
Figure 24. Reservoir depicting permeability damage at 2200 psia and 4200 bbl/day.
Processes 13 02740 g024
Figure 25. Asphaltene precipitate in volume fraction at 3200 psia and 1000 bbl/day.
Processes 13 02740 g025
Figure 26. Reservoir view depicting the spatial variation in oil viscosity.
Processes 13 02740 g026
Figure 27. Asphaltene precipitate in volume fraction at 3200 Psi and 1200 bbl/day.
Processes 13 02740 g027
Figure 28. Average asphaltene deposit volume fraction at 3200 psia and 1200 bbl/day vs. time.
Processes 13 02740 g028
Figure 29. Average asphaltene deposit volume fraction at 3200 psia and 4200 bbl/day vs. time.
Processes 13 02740 g029
Figure 30. Average asphaltene deposit volume fraction at various injection conditions.
Processes 13 02740 g030
Figure 31. Surface plot of asphaltene deposit volume fraction at residual oil saturation.
Processes 13 02740 g031
Figure 32. Cumulative oil production vs. time.
Processes 13 02740 g032
Table 1. Mesh sensitivity results.
Mesh SizeCumulative Oil Produced (STB)Peak Oil Rate (STB/Day)Max Asphaltene Deposition (%)
Coarse (17 × 1 × 3)13,9007856.2
Medium (34 × 1 × 6)14,3807705.4
Fine (68 × 1 × 12)14,4207685.3
Disclaimer/Publisher’s Note: The statements, opinions and data contained in all publications are solely those of the individual author(s) and contributor(s) and not of MDPI and/or the editor(s). MDPI and/or the editor(s) disclaim responsibility for any injury to people or property resulting from any ideas, methods, instructions or products referred to in the content.