Abstract
Scale deposition during waterflooding, driven by the incompatibility between injected seawater and formation of water, poses significant challenges to reservoir performance. This study examines the mechanisms of inorganic scale formation and assesses its impact on productivity index, permeability, and pressure dynamics using the ECLIPSE simulator. A five-layered reservoir model with one injector and one producer (spaced 700 feet apart) was simulated under varying seawater injection rates of 1000, 3000, and 5000 stock tank barrels per day (stb/day). The results revealed rapid water breakthrough and escalating water cuts (34–38%) across scenarios, with scale deposition concentrated in layers 3 and 4, reducing permeability by up to 47% and productivity index by 50%. Layer 3 exhibited a threefold higher scaling due to the intense mixing of seawater and the formation of water. The study highlights the necessity of sulfate removal, alternative water sources, well repositioning, and preemptive scale inhibition to minimize reservoir damage caused by scale-induced permeability impairment.
1. Background
Waterflooding remains a widely adopted secondary oil recovery method, enhancing hydrocarbon displacement by maintaining reservoir pressure [1]. However, the injection of incompatible water sources, such as seawater, often triggers inorganic scale deposition, compromising productivity and reservoir integrity [2]. Scale is precipitated due to the chemical disequilibrium between reservoir and injected fluids, especially for sulfate-rich seawater and the reservoir water containing barium, calcium, and strontium ions [3,4]. Seawater, which is usually used as a cheap and easily available injection fluid, contains high anion concentrations such as chlorides (Cl−), sulfates (SO42−), and carbonates (CO32−), whereas the formation water contains a significant number of cations such as Ba2+, Ca2+, and Sr2+ [5]. The injected brine dissolves calcium carbonate, but the free calcium ions in the aqueous phase could react with the sulfate and magnesium ions and form dolomite and anhydrite as inorganic scales. The mixing of seawater with formation water can disrupt the ionic equilibrium, leading to supersaturation and the precipitation of mineral scales such as barium sulfate, calcium carbonate, and strontium sulfate. Therefore, selecting an appropriate injection water is critical, as differences in ionic composition between the injected seawater and the in situ formation water can result in the formation of insoluble scales [6]. These precipitations are problematic in the oil and gas industry, as they can clog reservoir pores and accumulate in surface and subsurface equipment, leading to flow restrictions, increased pressure drops, and corrosion of metallic components. Such issues significantly reduce productivity and can necessitate costly remediation.
2. Literature Review
Scaling tendencies are driven by numerous factors, including fluid supersaturation, pressure and temperature variations, and the extent of water mixing in the reservoir. Ref. [7] demonstrated that permeability declines of 30–60% are typical in carbonate reservoirs due to sulfate scales. Scale inhibitors, as proposed by [8], offer mitigation but require precise application timing and dosage. Ref. [9] proposed two models based on barium concentration to estimate permeability reduction in pores during scale deposition. He found that the volume of the injected water has the greatest impact on permeability reduction. Also, porosity drops significantly from 0.2 to nearly 0.07 due to scale deposition. A study by [10] investigated permeability reduction due to scale deposition and examined how parameters such as temperature, pressure drop, and ion concentration affect the prediction accuracy. In the petroleum industry, scale prediction is essential for efficient waterflooding operations. Using dynamic tube-blocking tests under varying injection conditions and temperatures, there is a need to understand the dependence of scale precipitation on production parameters before deploying scale inhibitors [11]. Ref. [12] used Polycarbonate optical fiber Bragg grating sensors to detect fluid flow movement in porous media, offering a real-time reservoir monitoring method. OLI ScaleChem was used to predict mineral scaling potentials for various oil and gas wells and processing facilities [13]. Ref. [14] proposed an intelligent dual-energy radiation-based system for metering scale layer thickness in oil pipelines containing an annular regime of three-phase flow, offering a non-invasive approach for determining mineral scale layer thickness. Ref. [15] developed machine learning-based models to predict permeability impairment due to scale deposition, highlighting the impact of deposited scales on reducing effective permeability. Shabani et al. [16] presented a reactive transport approach for modeling scale formation and deposition in water injection wells, noting that pressure and temperature changes along the well column cause scale formation. Ref. [17] emphasized the need for a sophisticated scale deposition model, considering thermodynamic factors and flow conditions with or without scale inhibitors. Ref. [18] introduced a scale sensor using fiber optics for rapid monitoring of scale deposition in geothermal systems, demonstrating its capability to assess the effect of various scale suppression methods. Ref. [19] highlighted the need for downhole scale inspection tools for real-time and in situ monitoring, addressing the limitations of traditional methods. Ref. [11] proposed a new method using phosphonated polyetheramine-coated superparamagnetic iron oxide nanoparticles for oilfield scale inhibition, leveraging the properties of magnetic nanoparticles for targeted scale management. Porous media in both natural and engineered systems exhibit significant heterogeneity primarily due to sedimentological processes, along with interactions between the solid matrix and interstitial fluids. These processes occur across various spatial and temporal scales, including the pore scale, representative elementary volume (REV) scale, and continuum scale. The REV is particularly important as it balances statistical heterogeneity with localized interactions, enabling the development of models that connect microscale and macroscale processes. However, challenges persist in accurately capturing complex phenomena such as wettability, molecular diffusion, and interactions between pores, fluids, and solids when using single-scale models [20]. Ref. [21] proposed an integrated numerical method to model the whole pore-clogging phenomenon by including the effects of tortuosity on permeability and surface area on reactivity during the Fe (II) oxidative precipitation in a porous medium.
Despite advancements in chemical treatments, field-scale predictive modeling remains limited, particularly in heterogeneous reservoirs [4]. Reservoir simulation tools like ECLIPSE enable dynamic modeling of scaling effects, yet few studies integrate geochemical reactions with flow dynamics [16]. ECLIPSE reservoir simulator provides a robust framework for modeling such phenomena by utilizing user-defined scaling and damage tables [22]. Ref. [23] highlighted the importance of coupling scale models with reservoir simulators to predict productivity losses. Recent works further quantified permeability reduction using Darcy-derived adjustments, while [18] emphasized temperature and ionic contrasts as key drivers of supersaturation. However, gaps persist in understanding the distribution of spatial scales and the long-term impacts on injectivity. Recent studies have highlighted that water injection scenarios with higher rates often intensify mixing near the production well, which exacerbates scale deposition and accelerates productivity loss. Furthermore, reductions in permeability due to scale plugging have been calculated using Darcy’s Law to quantify formation damage in practical settings.
This study addresses these gaps by employing the ECLIPSE scale deposition model to evaluate seawater injection scenarios in a five-layer reservoir. The research quantifies scale deposition rates under varying injection rates, correlates scale mass with productivity index decline, and proposes mitigation strategies. By integrating field data with simulations, this work provides actionable insights for optimizing waterflooding in scale-prone reservoirs. The description of the waterflooding process can be seen in Figure 1.
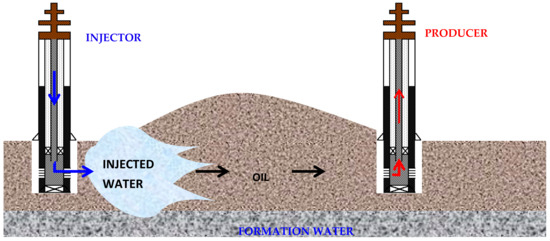
Figure 1.
Description of a waterflooding process.
3. Methodology and Results
3.1. Methodology
In this study, the effect of scale deposition on reservoir performance is modeled using the ECLIPSE simulator suite (ECLIPSE 2008.1, Schlumberger, Houston, TX, USA) and analyzed on FloViz as a function of time. The simulation model consists of five layers, one injection well, and one producing well spaced 700 feet apart. The simulated reservoir is a sandstone type with no gas cap and is supported by a water aquifer, and the production and injection wells are completed in layers four (2, 2, 4) and three (2, 3, 3), respectively, of the grid. Below is the workflow we used:
- Set up a 5-layer reservoir model with oil and water zones.
- Add one injector and one producer spaced 700 ft apart.
- Use field data to assign porosity (0.2), permeability (500 mD), and fluid densities.
- Run simulations at three different seawater injection rates.
- Track water flow, scale deposition, pressure, and PI using Eclipse.
- Analyze how scale affects performance over time using graphs and tables.
The model defines the rate of scale deposition per unit water flow rate as a function of the fraction of seawater flowing into a well connection. The scale damage in this model is defined as the rate at which the current amount of scale deposited alters the productivity index of a well connection. This indicates the deterioration of the productivity index as the mass of scale deposited increases.
The calculation of scale damage effects on a well is performed explicitly. Therefore, at the end of each step, the mass of scale deposited around each connection increases based on the water flow during that period and the current seawater concentration. This results in a PI reduction factor for each connection, which is used during the following time step. It is important to note that the scale deposition model used in this work neither attempts to model the kinetics nor the thermodynamics of the chemical reactions occurring during the mixing of seawater and formation of water in the reservoir. It also does not predict the scaling tendencies of a specific type of scale. In this model, it is assumed that the produced water at a well connection is a mixture of seawater and formation water and that the fraction of seawater flowing through a well connection contains certain impurities that account for scale deposition in the perforations of the production tubing and in the near-wellbore region.
To effectively demonstrate the rate of scale deposition during waterflooding and the effects of scale deposition on reservoir performance, the simulation is run with different water injection scenarios. To isolate the effects of scale deposition during seawater injection, the reservoir model assumes uniform porosity and permeability across oil-bearing layers, consistent with literature-based simplifications. Additional assumptions include the mixing of formation and injection water, the presence of seawater fractions containing dissolved solids at production wells, and scale deposition driven by injection rate. While the model does not resolve chemical reactions directly, the use of seawater fraction and scale deposition tables based on field data provides a valid and sufficient framework for simulating the impact of scaling on reservoir performance.
The simulation model includes five layers, one injection well, and one production well spaced 700 feet apart, as shown in Figure 2 and Figure 3. There is no initial gas cap. The production and injection wells are completed in layers four (2, 2, 4) and (2, 3, 3), respectively. Reservoir properties are listed in Table 1.
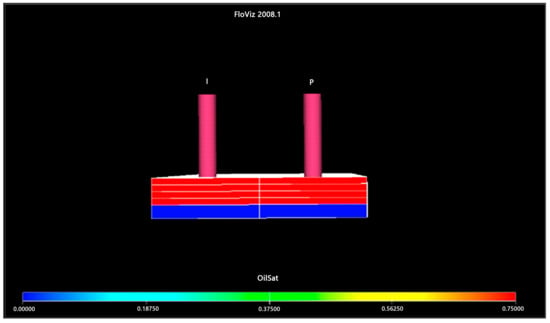
Figure 2.
Pictorial representation of an injection and a production well.
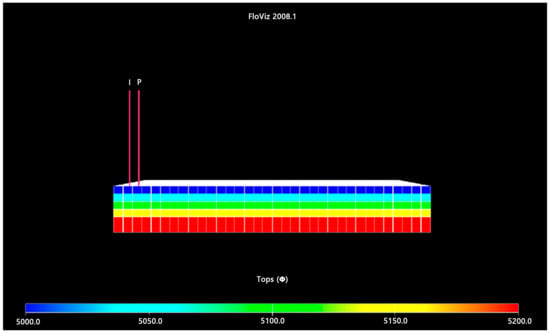
Figure 3.
Pictorial representation of the entire grid showing the different layers.

Table 1.
Simulation data input.
3.2. Results
3.2.1. Water Cut
The study shows early water breakthroughs during waterflooding at 1000 stb/day (Figure 4). Water cuts rose rapidly in the first 100 days (about 3 and a half months) and remained constant over the next 1300 days (about 3 and a half years), peaking at 34%. Similar trends are observed at 3000 stb/day (Figure 5). At 3000 stb/day, water cut plateaus around day 51 with a peak of 36%. At 5000 stb/day, it plateaus around day 37 with a peak of 38% (Figure 6).
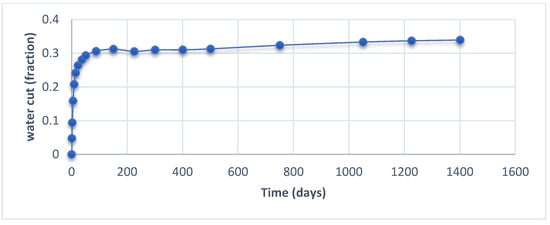
Figure 4.
Field water cut profile at 1000 stb/day.
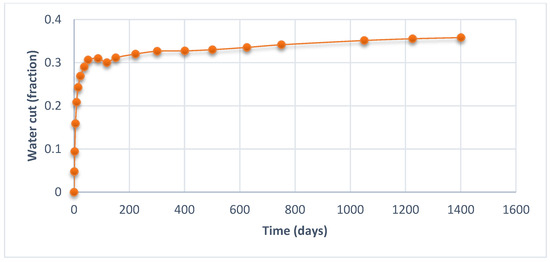
Figure 5.
Field water cut profile at 3000 stb/day.
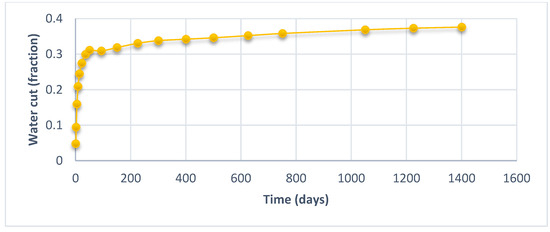
Figure 6.
Field water cut profile at 5000 stb/day.
3.2.2. Field Liquid Production Rate and Oil Production Rate
The liquid production rate declined at all injection rates, as shown in Figure 7. At 1000 stb/day, the total liquid production begins to plateau after 226 days, whereas it begins to plateau at 119 days and 94 days for 3000 stb/day and 5000 stb/day, respectively. In all the cases, total liquid and oil production declined by 72% and 81%, respectively.
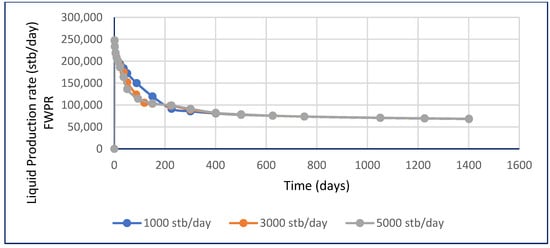
Figure 7.
Total liquid production rate at varying injection rates.
3.2.3. Injected Water Fraction
The water cut profile discussed earlier is a mixture of injected seawater and the formation water measured at the production well. The fraction of seawater present in a water cut sample flowing through a well connection is obtained from each grid block at the production and injection wells. This will show the amount of injected water that has traveled from the injector to the producer.
Figure 7 shows the total liquid production rate over time at three injection rates: 1000 stb/day, 3000 stb/day, and 5000 stb/day. The production rate declined significantly for all cases, with a plateau observed at approximately 226 days (1000 stb/day), 119 days (3000 stb/day), and 94 days (5000 stb/day). The total liquid production declined by approximately 72% in all cases.
At the producer, a similar trend is also observed. Figure 8 shows the injected seawater fraction at the injection well across five reservoir layers at an injection rate of 1000 stb/day. Layers 3 and 4 show increasing seawater fraction over time, with layer 3 approaching 100% and layer 4 reaching approximately 35%. Layers 1, 2, and 5 show negligible or no seawater breakthrough.
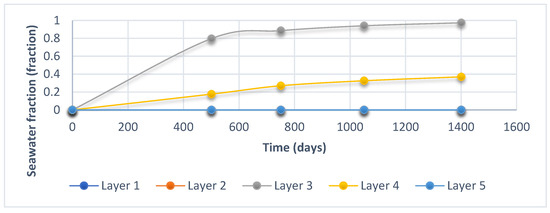
Figure 8.
Seawater fraction at the injection well at a water injection rate of 1000 stb/day.
From Figure 9, only layer 3 shows a significant seawater breakthrough (~35%), while layer 4 reaches a maximum of about 2%. Layers 1, 2, and 5 remain unaffected.
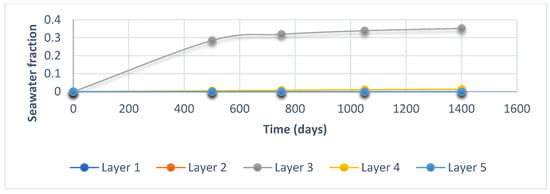
Figure 9.
Seawater fraction at the producing well at a water injection rate of 1000 stb/day.
Furthermore, layers 3 and 4 both approach seawater fractions close to 100%, while the other layers show no significant seawater presence, as shown in Figure 10.
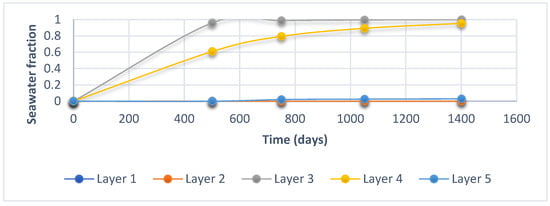
Figure 10.
Seawater fraction at the injection well at a water injection rate of 3000 stb/day.
Figure 11 reveals that the seawater largely resides in layer 3, in which the seawater fraction continues to rise to near 0.65 before reaching a plateau. Layers 1 and 5 are hardly affected, with no discernible seawater fraction at the end of the simulation. Layers 2 and 4 only see modest rises, with end fractions of 0.05. This pattern reveals dominant horizontal flow through Layer 3 and negligible vertical communication. Graph 3 appears to represent a case where injection was halted or reversed. Seawater accumulates quickly in layer 3, peaking near 0.75, but then slowly declines over time. Layer 2 initially increases to about 0.35 but later drops, likely due to backflow or pressure dissipation. Layers 1, 4, and 5 remain mostly unaffected, with negligible seawater fractions throughout. The results imply a termination or reversal of injection that restricts further vertical and lateral seawater movement at the boundaries.

Figure 11.
Seawater fraction at the producing well at a water injection rate of 3000 stb/day.
Figure 12 depicts a condition of high vertical communication for all the layers. The layers 3 and 4 rapidly reach seawater fractions of over 0.9, suggesting early and vigorous seawater breakthrough. The cumulative of the layer 2 also suggests a steady rise, reaching roughly 0.7 at the termination of the simulation, whereas the layers 1 and 5 show slow but notable rises. This suggests high vertical permeability, through which the seawater can readily move up and down.

Figure 12.
Seawater fraction at the injection well at a water injection rate of 5000 stb/day.
Figure 13 appears to represent a case where injection was halted or reversed. Seawater accumulates quickly in layer 3, peaking near 0.75, but then slowly declines over time. Layer 2 initially increases to about 0.35 but later drops, likely due to backflow or pressure dissipation. Layers 1, 4, and 5 remain mostly unaffected, with negligible seawater fractions throughout. The results imply a termination or reversal of injection that restricts further vertical and lateral seawater movement.

Figure 13.
Seawater fraction at the producing well at a water injection rate of 5000 stb/day.
3.2.4. Scale Deposition
The following charts show the amount of scale deposition because of the fraction of seawater flowing into a well connection. Figure 14, Figure 15 and Figure 16 show the scale deposition per unit perforation at water injection rates of 1000, 3000, and 5000 stb/day.
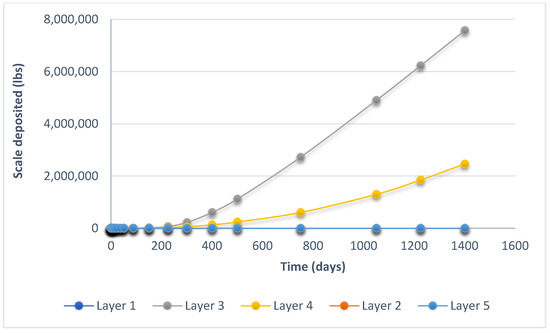
Figure 14.
Scale depositions at an injection rate of 1000 stb/day.
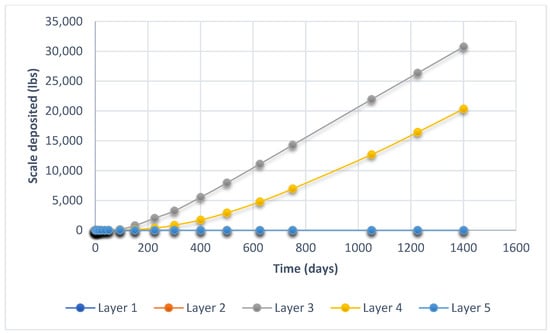
Figure 15.
Scale deposition at an injection rate of 3000 stb/day.
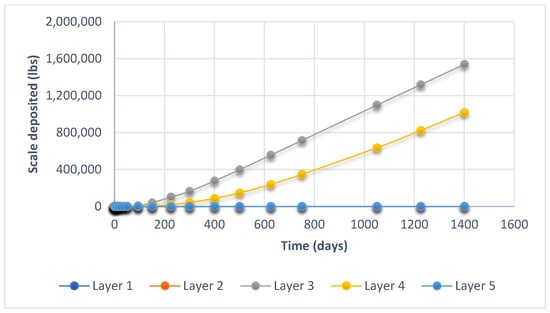
Figure 16.
Scale deposition at an injection rate of 5000 stb/day.
Scale was deposited only in layers 3 and 4 close to the producer. More scales were deposited in layer 3 at all injection rates. This corresponds to the higher injected water fraction at the producer. Also, at higher water injection rates, more scales were deposited.
The total scale deposition (Ibs) at an injection rate of 1000 stb/day plateaus at 226 days, 3000 stb/day plateaus at 119 days, and 5000 stb/day plateaus at 94 days. This corresponds to a total scale of 3432 Ibs at 1000 stb/day, 7953 Ibs at 3000 stb/day, and 7661 Ibs at 5000 stb/day.
3.2.5. Productivity Index Reduction
The next charts (Figure 17, Figure 18 and Figure 19) show PI deterioration from scale damage in layers 3 and 4 at 1000, 3000, and 5000 stb/day. PI plateaus at 0.5 stb/day/psi. The time of plateau decreases with an increase in injection rate.
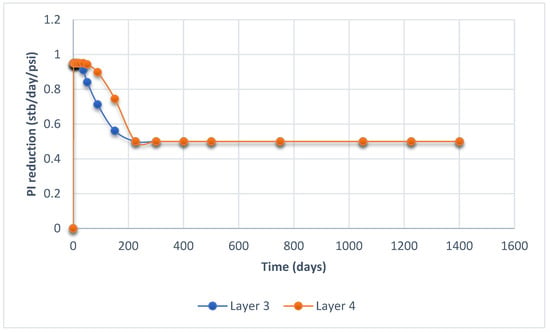
Figure 17.
PI reduction profile at a water injection rate of 1000 stb/day.
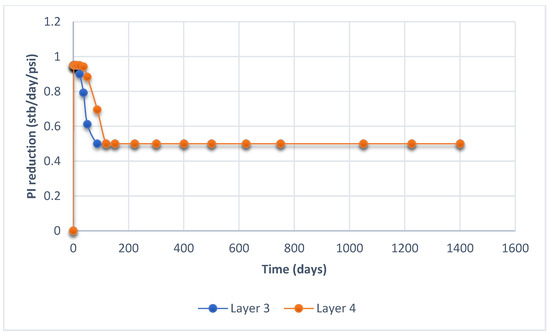
Figure 18.
PI reduction profile at a water injection rate of 3000 stb/day.
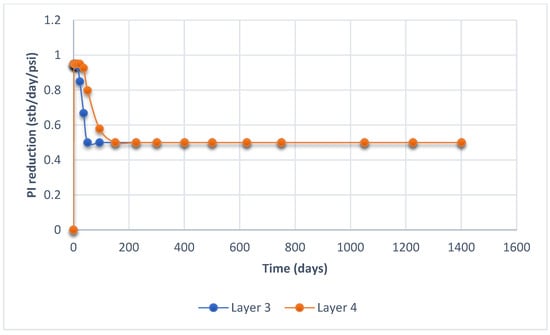
Figure 19.
PI reduction profile at a water injection rate of 5000 stb/day.
3.2.6. Permeability Reduction
Eclipse does not output the permeability change at different layers. Therefore, to study the reduction in permeability, Darcy’s equation for radial flow is used to back calculate permeability in layers 3 and 4.
A factor called PI multiplier is an output from Eclipse that shows the reduction in the productivity index due to scale formation. Using this factor, the productivity index and permeability at various time steps were computed and presented in Table 2.

Table 2.
Permeability reduction due to scale deposition.
Figure 20 shows the effect of scale deposition on permeability. The reservoir permeability was reduced from its initial value by approximately 47% before it stabilized.
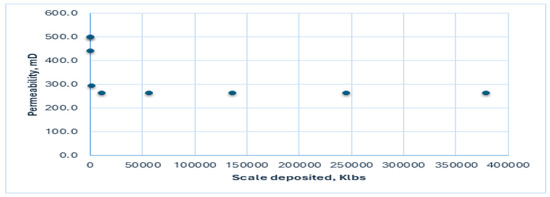
Figure 20.
Permeability declines with scale deposition in layer 3 at 1000 stb/day.
Figure 21 shows oil production rate decreased sharply with increasing scale deposition. Initial production values exceeded 15,000 stb/day at low scale levels. Beyond 50,000 Klbs of scale, production dropped below 3000 stb/day. Production rates stabilized despite further scale accumulation.
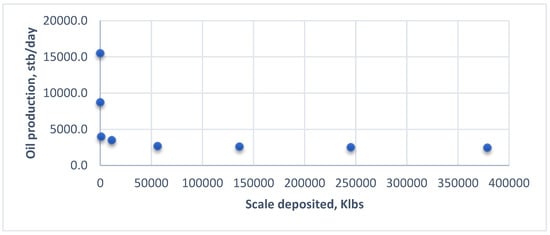
Figure 21.
Drop-in oil production rate with scale deposition in layer 3 at 1000stb/day.
4. Discussion
The results of this study emphasize the significant effects of scale deposition on reservoir performance during seawater injection and provide vital understanding of the interrelationships between fluid incompatibility, injection rates, and spatial scale distribution. The simulation findings point out that upon the injection of seawater rich in sulfate into a barium, calcium, and strontium saturated formation, major geochemical reactions take place, leading to the precipitation of scaling minerals, i.e., barium sulfate, strontium sulfate, and calcium carbonate. This precipitation directly impacts flow characteristics within the reservoir, most notably in the productivity index (PI) and permeability degradation.
A key observation was the rapid water breakthrough in all injection scenarios. At a rate of 1000 stb/day, water cut plateaued around day 100, whereas at 3000 and 5000 stb/day, the plateau occurred even earlier—around days 51 and 37, respectively. These results demonstrate that increasing injection rates expedite waterfront advancement toward the production well. Scale deposition occurred in layers 3 and 4, aligning with the zones of injection and production well completion. Notably, layer 3 consistently recorded approximately three times the mass of scale compared to layer 4, regardless of injection rate. This intense mixing promoted supersaturation and scale precipitation, leading to severe permeability impairment and productivity loss. The localized damage in layer 3 agrees with reservoir flow behavior where injection fluids converge, thereby accelerating scale formation near the producer. The finding supports earlier observations by [7] who linked permeability decline directly to ion mixing intensity in carbonate formations. Layers 1, 2, and 5 exhibited no measurable response to seawater injection, as they were not connected to the active well completion and did not receive injected water flow. Layer 4, though completed at the producer, received only a small fraction of the injected seawater (~2%), resulting in limited scale deposition. Most of the seawater traveled through layer 3, where intense mixing and scale precipitation occurred. The intense mixing in layer three is due to dual well completions (both injector and producer) in this layer. The closer spatial proximity of opposing flows increases interaction and promotes local supersaturation. Layer 3 experienced enhanced mixing due to the co-location of injection and production well completions, which promotes converging flows and increases the probability of incompatible fluid interaction, a key factor in local supersaturation and subsequent scale precipitation.
Moreover, scale accumulation increased with the injection rate. At 1000 stb/day, total scale mass was approximately 3432 × 103 lbs, escalating to 7953 × 103 lbs at 3000 stb/day and 7661 × 103 lbs at 5000 stb/day. While the total scale mass at 5000 stb/day was slightly lower than at 3000 stb/day, the overall trend indicates that higher water throughput exacerbates scale precipitation due to the increased volume of mixing. The productivity index declined dramatically across all scenarios, with the plateau value reaching as low as 0.5 stb/day/psi. The time required to reach this plateau decreased with increasing injection rates, indicating a rapid decline in well deliverability when scaling is intensified. Further analysis using Darcy’s equation revealed a reservoir permeability decline of approximately 47%, confirming that inorganic scales severely impair the ability of reservoir rocks to transmit fluids. This loss of permeability directly contributes to reduced oil recovery efficiency and highlights the long-term consequences of unchecked scale formation. The spatial trend of scaling centered in layers 3 and 4 indicates direct correlation with the completion of zones. This suggests that selective zone management or layer-specific inhibitor treatments could mitigate productivity losses. Additionally, the faster decline in PI at higher injection rates confirms that increasing flow velocity accelerates mixing and supersaturation. This aligns with the findings of Moghadasi [7] who showed higher scaling rates at high flow and temperature contrasts.
5. Conclusions and Recommendations
This simulation study highlights several key findings regarding scale deposition during seawater injection into a reservoir containing formation water. It confirms that injecting seawater into such reservoirs presents a significant risk for scale formation. The results demonstrate that scale deposition negatively impacts reservoir performance by reducing the productivity index, causing pressure drops, and lowering permeability.
Among the various water injection scenarios examined, scale deposition was observed exclusively in layers three and four, with the quantity in layer three nearly three times higher than in layer four. This suggests that layer three experienced more intense mixing between injected seawater and formation water, triggering higher scale precipitation.
To minimize scale deposition during waterflooding, several measures should be undertaken, considering the findings of the study as follows:
- Produced water or fresh water is preferable for injection. If seawater must be used, sulfate ions should be removed, as their elimination would significantly reduce the potential for scale formation.
- Repositioning the injection well farther from the production well can help reduce scale. While it may not prevent scaling entirely, it shifts the mixing zone deeper into the reservoir, away from the wellbore. Scale inhibition treatments should be applied before initiating waterflooding. These treatments help prevent scale buildup both within the reservoir and around the wellbore.
- For the reservoir studied, milling and jetting are recommended to remove existing scale deposits. Following removal, scale inhibitor treatments should be applied to prevent recurrence.
Author Contributions
Conceptualization, A.B.I.; Methodology, V.N.B.A.; Software, H.T.; Validation, V.N.B.A.; Formal analysis, D.A.; Investigation, B.A.I.; Data curation, R.T.; Writing—original draft, A.B.I.; Writing—review and editing, D.A.; Visualization, B.A.I.; Supervision, F.B. All authors have read and agreed to the published version of the manuscript.
Funding
This research received no external funding.
Data Availability Statement
The original contributions presented in this study are included in the article. Further inquiries can be directed to the corresponding author.
Conflicts of Interest
The authors declare no conflict of interest.
References
- Green, D.W.; Willhite, G.P. Enhanced Oil Recovery; Society of Petroleum Engineers: Richardson, TX, USA, 1998. [Google Scholar]
- Al-Samhan, M.; Alanezi, K.; Al-Fadhli, J.; Al-Attar, F.; Mukadam, S.; George, J. Evaluating scale deposition and scale tendency of effluent water mix with seawater for compatible injection water. J. Pet. Explor. Prod. Technol. 2020, 10, 2105–2111. [Google Scholar] [CrossRef]
- Santos, R.G.; Loh, W.; Bannwart, A.C.; Trevisan, O.V. An overview of heavy oil properties and its recovery and transportation methods. Braz. J. Chem. Eng. 2014, 31, 571–590. [Google Scholar] [CrossRef]
- Khan, H.; Khan, I.; Binh, T.T. The heterogeneity of renewable energy consumption, carbon emission and financial development in the globe: A panel quantile regression approach. Energy Rep. 2020, 6, 859–867. [Google Scholar] [CrossRef]
- Reginato, L.F.; Pedroni, L.G.; Compan, A.L.M.; Skinner, R.; Sampaio, M.A. Optimization of ionic concentrations in engineered water injection in carbonate reservoir through ANN and FGA. Oil Gas Sci. Technol. Rev. D’IFP Energ. Nouv. 2021, 76, 13. [Google Scholar] [CrossRef]
- Valadbeygian, V.; Hajipour, M.; Behnood, M. Static and dynamic evaluation of formation damage due to barium sulfate scale during water injection in carbonate reservoirs. J. Pet. Explor. Prod. Technol. 2023, 13, 1819–1831. [Google Scholar] [CrossRef]
- Moghadasi, J.; Müller-Steinhagen, H.; Jamialahmadi, M.; Sharif, A. Theoretical and experimental study of particle movement and deposition in porous media during water injection. J. Pet. Sci. Eng. 2004, 43, 163–181. [Google Scholar] [CrossRef]
- Sørensen, L.; McCormack, P.; Altin, D.; Robson, W.J.; Booth, A.M.; Faksness, L.; Rowland, S.J.; Størseth, T.R. Establishing a link between composition and toxicity of offshore produced waters using comprehensive analysis techniques—A way forward for discharge monitoring? Sci. Total Environ. 2019, 694, 133682. [Google Scholar] [CrossRef] [PubMed]
- Shojaee, A.; Kord, S.; Miri, R.; Mohammadzadeh, O. Reactive transport modeling of scale precipitation and deposition during incompatible water injection in carbonate reservoirs. J. Pet. Explor. Prod. Technol. 2023, 14, 515–534. [Google Scholar] [CrossRef]
- Khodabakhshi, M.J.; Bijani, M. Predicting scale deposition in oil reservoirs using machine learning optimization algorithms. Results Eng. 2024, 22, 102263. [Google Scholar] [CrossRef]
- Khormali, A.; Koochi, M.R.; Varfolomeev, M.A.; Ahmadi, S. Experimental study of the low salinity water injection process in the presence of scale inhibitor and various nanoparticles. J. Pet. Explor. Prod. Technol. 2022, 13, 903–916. [Google Scholar] [CrossRef]
- Liao, S.; Akbariyeh, S.; Chen, X.; Klevan, C.; Greenley, C.; Johnston, K.P.; Abriola, L.M.; Pennell, K.D. Evaluation of polyelectrolyte complex nanoparticles for prolonged scale inhibitor release in porous media. Energy Fuels 2023, 37, 4515–4523. [Google Scholar] [CrossRef]
- Amiri, M.; Moghadasi, J. The effect of temperature on calcium carbonate scale formation in Iranian oil reservoirs using OLI ScaleChem software. Pet. Sci. Technol. 2012, 30, 453–466. [Google Scholar] [CrossRef]
- Chen, T.; Iliyasu, A.M.; Alizadeh, S.M.; Salama, A.S.; Eftekhari-Zadeh, E.; Hirota, K. The use of artificial intelligence and time characteristics in the optimization of the structure of the volumetric percentage detection system independent of the scale value inside the pipe. Appl. Artif. Intell. 2023, 37, 2166225. [Google Scholar] [CrossRef]
- Karimi-Mamaghan, M.; Mohammadi, M.; Meyer, P.; Karimi-Mamaghan, A.M.; Talbi, E. Machine learning at the service of meta-heuristics for solving combinatorial optimization problems: A state-of-the-art. Eur. J. Oper. Res. 2021, 296, 393–422. [Google Scholar] [CrossRef]
- Krupka, K.M.; Cantrell, K.J.; McGrail, B.P. Thermodynamic Data for Geochemical Modeling of Carbonate Reactions Associated with CO2 Sequestration—Literature Review; Pacific Northwest National Laboratory: Richland, WA, USA, 2010. [Google Scholar]
- Evrard, O.; Chartin, C.; Laceby, J.P.; Onda, Y.; Wakiyama, Y.; Nakao, A.; Cerdan, O.; Lepage, H.; Jaegler, H.; Vandromme, R.; et al. Radionuclide contamination in flood sediment deposits in the coastal rivers draining the main radioactive pollution plume of Fukushima Prefecture, Japan (2011–2020). Earth Syst. Sci. Data 2021, 13, 2555–2560. [Google Scholar] [CrossRef]
- Kumar, S.; Gopi, T.; Harikeerthana, N.; Gupta, M.K.; Gaur, V.; Krolczyk, G.M.; Wu, C. Machine learning techniques in additive manufacturing: A state-of-the-art review on design, processes, and production control. J. Intell. Manuf. 2022, 34, 21–55. [Google Scholar] [CrossRef]
- He, Y.; Jiang, G.; Dong, T.; Wang, G.; He, J.; Dou, H.; Du, M. Research progress and development tendency of polymer drilling fluid technology for unconventional gas drilling. Front. Energy Res. 2023, 10, 1058412. [Google Scholar] [CrossRef]
- Bear, J. Dynamics of Fluids in Porous Media; American Elsevier Publishing Company: New York, NY, USA, 1972. [Google Scholar]
- Cao, W.; Yan, G.; Hofmann, H.; Scheuermann, A. A Novel Permeability–Tortuosity–Porosity Model for Evolving Pore Space and Mineral-Induced Clogging in Porous Medium. Geotechnics 2025, 5, 2. [Google Scholar] [CrossRef]
- Nguyen, T.H.; Cho, K.; Grishman, R. Joint event extraction via recurrent neural networks. In Proceedings of the 2022 Conference of the North American Chapter of the Association for Computational Linguistics: Human Language Technologies, Online, 10–15 July 2022. [Google Scholar] [CrossRef]
- Ahmad, A.; Hussein, H. An Experimental and Numerical Approach for the Best Enhanced Oil Recovery Strategy in Capillary—Dominant Reservoirs. 2022. Available online: https://repository.kaust.edu.sa/bitstream/10754/675893/1/otc-31602-ms.pdf (accessed on 15 May 2025).
Disclaimer/Publisher’s Note: The statements, opinions and data contained in all publications are solely those of the individual author(s) and contributor(s) and not of MDPI and/or the editor(s). MDPI and/or the editor(s) disclaim responsibility for any injury to people or property resulting from any ideas, methods, instructions or products referred to in the content. |
© 2025 by the authors. Licensee MDPI, Basel, Switzerland. This article is an open access article distributed under the terms and conditions of the Creative Commons Attribution (CC BY) license (https://creativecommons.org/licenses/by/4.0/).