Abstract
This study presents a novel switchable multi-inlet Building integrated photovoltaic/thermal (BIPV/T) curtain wall system designed to enhance solar energy utilization in commercial buildings. The system integrates controllable air inlets and motorized dampers that dynamically adjust airflow patterns in response to real-time environmental conditions such as solar irradiance, ambient air temperature, and PV panel temperature. A steady-state energy balance model, developed using a thermal network analogy and implemented in Python, was used to simulate winter operation in Montréal, Canada. Three operating modes with different air inlet configurations were assessed to evaluate system performance across variable air velocities and solar conditions. Results indicate that the switchable system improves combined thermal and electrical generation by 2% to 25% compared to fixed one- or two-inlet systems. Under low irradiance and air velocity, one-inlet operation is dominant, while higher solar gain and airflow favor two-inlet configurations. The system demonstrates effective temperature control and enhanced energy yield through optimized airflow management. This work highlights the potential of integrated control strategies and modular façade design in improving the efficiency of solar building envelope systems and offers practical implications for scalable deployment in energy-efficient, heating-dominated climates.
1. Introduction
Solar energy can generally be divided into solar thermal and electrical energy generation through PV panels. Solar thermal energy provides useful heating through solar [1], typically using solar absorbers (SAs). Building-applied photovoltaic (BAPV) [2] and building-integrated photovoltaic (BIPV) [3] are two types of PV panel installations on buildings. The primary difference between BIPV and BAPV is the level of integration between the photovoltaic system and the building [4]. BAPV systems are mounted on the building envelope over the existing structure, whereas BIPV systems integrate photovoltaic technologies into buildings while also serving as part of the building envelope.
To determine whether a PV installation should follow the BAPV or BIPV path, the effectiveness of the PV system in terms of energy, durability, and aesthetics must be evaluated. BIPV and BAPV can both be installed on similar parts of a building, but BIPV should act as a prominent part of the building envelope structurally and functionally, while BAPV can be more easily added to an existing building structure. For conventional commercial silicon PV modules, the efficiency typically ranges between 15 and 24% [5], with further improvements being limited by the material’s intrinsic properties. The remainder of the incident solar energy in both technologies is lost through reflection and as heat, highlighting ongoing research efforts to enhance overall performance. In BAPV, and even in some BIPV, installations, there is a space between the photovoltaic modules and building skin. This is a key determinant of system performance, as it allows for better ventilation of the PV, decreasing the risk of PV overheat [4]. PV/thermal systems [5] typically pass air (open loop) or water/glycol behind the PV panels, which can then be used for the building’s thermal needs, such as domestic hot water heating or preheated ventilation air. Integrating solar thermal and PV modules by defining the PV panel as a solar absorber (SA) could reduce the overheating of PV and improve system efficiency by generating more energy per square meter using heated air on demand and electricity generation [6,7]. PV/T systems can be divided into open systems, in which air is used, and closed systems, in which liquid decreases the PV temperature and increases the system’s efficiency. However, an open system is primarily used in PV/T systems because it offers a lower cost, easier integration with building and mechanical systems, and no freezing issues compared to a closed system. Hot air from the PV/T system can be used for HVAC preheating, water heating, drying processes, or thermal storage. For example, heated air can pass through a ventilated concrete slab to decrease heating consumption to store thermal energy, which can be used during peak demand.
PV/T systems with curtain wall construction represent a significant advancement in architectural design and energy efficiency, addressing current limitations such as functionality, safety, and wiring issues. While traditional curtain walls, employed in high-rise commercial buildings, have improved energy performance, they often suffer from poor thermal insulation and high solar heat gain due to their large glazing areas and sensitivity to environmental conditions. This study proposes a novel approach by incorporating PV/T systems into curtain wall designs, offering a standardized and modular solution that enhances energy efficiency and simplifies installation. This method addresses existing challenges and sets the stage for wider adoption of PV/T technology, overcoming the limitations of previous designs and optimizing performance through innovative construction techniques.
In existing one-inlet PV/T curtain wall systems, overheating of the PV panel occurs in some seasons because these systems have a single air inlet and single air outlet. A common issue with current PV/T system design is that the design flexibility of the PV/T system is limited to one air inlet or multiple air inlets. One-inlet and two-inlet PV/T systems can be utilized under different conditions based on environmental conditions and user demands. In some environmental conditions and operating scenarios, a one-inlet PV/T system performs better than those with two inlets in energy generation. In others, two-inlet PV/T systems have higher efficiency in terms of energy generation. With higher flexibility in the design and operation of PV/T systems, the power generation of the system can be optimized by customizing the operating scenario for different building types and environmental conditions.
Previous studies have considered various BIPV/T system configurations and operating scenarios to develop thermofluid models and examine their performance [6,7,8,9,10]. However, none of them have investigated a switchable BIPV/T curtain wall construction system considering the maximum generation and a higher level of integration. This study develops a novel BIPV/T design with controllable automated air inlets and dampers to obtain an optimum energy generation system under different environmental conditions and operating scenarios. The BIPV/T system proposed in this study can be used as a programmable multi-inlet system based on the PV temperature, thermal energy generation, and building energy demand. While previous studies have developed thermofluid models for fixed or dual-inlet BIPV/T systems, they primarily focus on numerical heat transfer performance under static configurations. This study advances prior work by proposing a modular BIPV/T curtain wall system specifically designed for façade integration in commercial buildings. The proposed system introduces an automated multi-inlet configuration with motorized dampers and a decision-making algorithm that dynamically selects the optimal operating mode based on environmental conditions and energy demand. This integration of real-time control logic with prefabricated curtain wall architecture represents a significant advancement in system adaptability and practical building application, offering both energy and construction benefits not addressed in earlier fixed-mode systems.
2. Research Background
There are several studies on different ways to generate thermal energy from PV systems to meet building energy demands and increase the efficiency of PV [11,12,13]. However, several challenges related to system design, operation, and performance remain. This paper addresses two key research areas that have received significant attention in recent years: BIPV/T system design and operation and circulated air scenarios in BIPV/T systems. The following subsections provide an overview of the current state of research in these areas and identify the key challenges that need to be addressed to improve the efficiency and performance of BIPV/T systems.
2.1. Air-Based BIPV/T System Design and Operation
An air-based PV/T curtain wall system consists of a PV panel, air channel, insulation, frame, and absorbing plate with or without glass covers or a transparent material placed over it [14]. Different designs aimed at enhancing the energy performance of air-based PV/T systems are shown in Figure 1. Type 1 is a conventional air-based PV/T system or a known back-pass air-based PV/T system, in which an air inlet is sucked into the back cavity naturally or mechanically and, after heating up, can be sent to the HVAC system [15]. Because the PV panel is in direct contact with the environment, the PV temperature and thus efficiency of the system depend more directly on the exterior environmental conditions. In type 2, semitransparent PV (STPV) panels are used to allow some portion of solar radiation to reach the back sheet in order to have two heat transfer sources to improve thermal generation. This model can improve thermal generation by 7.6% compared to opaque PV [16]. The PV panel’s transparency and packing factor are related to climate, system design, thermal, and electricity energy value in each region [17]. The semitransparent photovoltaic (STPV) types used in the system can be categorized into three main groups: mixed-based, process-induced, and intrinsic STPV. Mixed-based STPV refers to a combination of different materials or technologies integrated to achieve semitransparency while maintaining photovoltaic performance, often using a blend of organic and inorganic materials. Process-induced STPV involves creating semitransparency through manufacturing techniques, such as laser scribing or patterned designs, that selectively remove parts of the opaque layer or adjust its thickness to allow light to pass through. Intrinsic STPV, on the other hand, refers to materials that are naturally semitransparent due to their inherent properties, such as certain organic photovoltaic materials or perovskites, which are engineered to absorb specific wavelengths of light while allowing others to transmit. Each of these types plays a crucial role in optimizing energy conversion while enabling the desired level of transparency for building-integrated applications [18]. Another way to enhance PV/T system performance is by suspending a thin aluminum sheet in the middle of the air channel (type 3) [19]. The suspended thin aluminum sheet decreases the hydraulic diameter of air channels and increases heat transfer in the air channel, thus improving electricity and thermal generation. However, adding a suspended absorber or fins in the air channel may cause a pressure drop, increase fan consumption, and increase complexity in PV/T integration [13,20]. Moreover, in this type, the PV can be semitransparent to allow suspended aluminum to be a heat transfer source in the middle of the cavity.
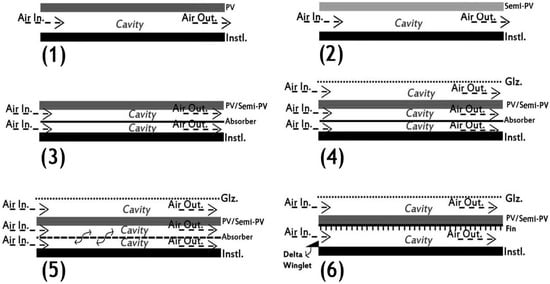
Figure 1.
Design configurations of air-based PV/T systems.
In cold climates, to decrease energy lost from the system to the environment, a glazing sheet can be placed over the PV panel, which can increase energy generation and avoid freezing (type 4). This technique, however, can cause PV overheating and lead to decreased electricity production [17,18].
By adding a perforated aluminum sheet [21,22,23] (type 5) and/or fins [20] (type 6) in the air channel, electricity/thermal generation can be improved by raising convective heat transfer and increasing heat transfer surfaces in the air channel. Another component to boost the thermal performance of open-loop solar air heating systems is a vortex generator or delta winglet (type 6) [24], which work by increasing velocity and turbulent airflow.
2.2. Air Circulation Scenarios in Air-Based BIPV/T System
The air circulation scenario in the air channel is one of the critical factors in the efficiency of BIPV/T systems. The selection of the most suitable scenario depends on geographical location, season, system design and function, and integration method [25]. The air circulation in the air channel of the PV/T is be categorized into five types, as seen in Figure 2. Type 1 is a back-pass air-based PV/T system. Type 2 is a single-pass parallel PV/T system in which a glazing layer is added over the PV panel creating a second cavity to improve the thermal efficiency of the system [10]. A possible application of this design can be the integration of PV/T with a Double-Skin Façade (DSF) [8,9]. When PV modules are installed in the middle of the cavity, air flows on both sides, increasing the PV section’s overall (thermal–electric) efficiency by about 25% but lowering electricity generation by 21% [13]. The single-pass parallel PV/T system can improve the convective heat transfer coefficient (CHTC) by increasing mass flow and airflow on both sides of the PV panel [26]. In this system model, the electricity generation may decrease because of the lower percentage of solar radiation that reaches the PV after passing through the glazing and the increased PV temperature. However, the system’s thermal efficiency will be increased by raising the temperature within the cavity and the CHTC. Type 3 is a double-pass with inlet air from outdoors [12], while type 4 inlet air is from indoors. The outlet air temperature in type 4 is more than that in type 3 because the indoor air temperature is higher than the outdoor air temperature. On the other hand, the electricity/thermal generation in type 4 may be lower than in type 3. When the temperature difference between the air in the cavity and the PV panel is low, heat transfer is not enough to extract heat from surfaces [27]. One way to increase or keep the efficiency of a PV/T system when a large-scale PV/T installation is needed to cover the envelope surface is designing a PV/T system with two or more inlets [17] (type 5). Using a semitransparent PV and a second air inlet in half of the system can achieve approximately 5% higher thermal efficiency and improve electricity generation [17]. With this method, the CHTC can be improved by raising the heat absorption capacity of the air in the cavity and increasing turbulence in the second inlet to extract more heat from PV panels. The second inlet can be placed halfway along an air path, but the exact place should be calculated based on the environmental condition, the material property of layers, and system design to reach maximum efficiency [27].
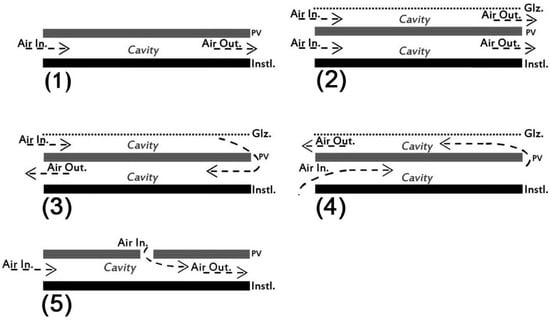
Figure 2.
Design configurations for air circulation in air-based PV/T system.
2.3. Problem Statement
BIPV/T systems are an emerging technology that combines solar energy production with building construction. While there has been significant research on the performance and benefits of BIPV/T systems, there are still some research gaps in their design and operation. Some of the key research gaps in BIPV/T system design include the following.
Optimization of System Configuration: Further optimization of the design and configuration of BIPV/T curtain wall systems is essential to maximize energy generation while preventing overheating. The dynamic behavior of BIPV/T curtain wall systems under various operating conditions and climates remains an active area of research, presenting numerous opportunities for improvement. The performance of BIPV/T curtain wall systems is heavily influenced by weather conditions, which can vary significantly over time and across different locations [28]. This variability makes it difficult to accurately predict the system’s dynamic behavior. Optimal control strategies for BIPV/T curtain wall systems are not well developed, and their effectiveness under various operating conditions is not well understood, necessitating further research. This is particularly crucial for dynamic operation, where the system may need to switch between different modes based on changing weather conditions and user demand. Research is needed to explore various configurations of BIPV/T curtain wall systems and to identify the optimal design parameters [29].
Integration with building design: There is a need to integrate BIPV/T curtain wall systems more effectively with building design to enhance their functionality and aesthetics. The integration of BIPV/T curtain wall systems with architectural design remains a significant challenge in both research and practice. Although recent advancements in BIPV have introduced a variety of colors, seamlessly incorporating BIPV/T systems into the overall architectural style of buildings continues to be a challenge [30]. Additionally, balancing the competing design objectives of energy efficiency, comfort, and aesthetics is challenging. Air-based BIPV/T curtain wall systems must be designed and integrated to maintain the building’s thermal performance, indoor comfort, and water penetration resistance while also ensuring visual appeal and cost-effectiveness. Constructability of the system is also an important parameter. Modular and easy-to-construct BIPV/T curtain wall systems can offer significant advantages such as simplifying the installation process, reducing construction time, and enhancing adaptability, making them a more attractive option for a wider range of building projects.
Optimal control strategies for BIPV/T curtain wall: The air flow rate, air flow patterns and temperature of the air in BIPV/T curtain wall systems can significantly affect the operating conditions and thus the energy generation and thermal efficiency of the system [20]. In colder outdoor temperatures and small air-based BIPV/T curtain wall installations, a one-inlet BIPV/T curtain wall system may perform better than a two-inlet system due to its ability to generate hot air for the building using a single air stream. The single-inlet configuration is advantageous in winter because it maintains higher air temperatures in the channel during cold seasons. On the other hand, in summer outdoor temperatures and large BIPV/T curtain wall installations, a two-inlet system may perform better as it can independently control the airflow rates and temperatures of PV/T curtain wall components [31]. However, there is limited research on the impact of airflow patterns on the performance of BIPV/T curtain wall systems. It is necessary to investigate how different airflow patterns affect the thermal and electrical energy generation efficiency of BIPV/T curtain wall systems under various operating conditions and climates. Additionally, new techniques and methodologies must be developed to optimize the control of air-based BIPV/T curtain wall systems to achieve maximum thermal and electrical efficiency. Further research in this area will enable the development of more efficient and reliable BIPV/T curtain wall systems, which can be seamlessly integrated into building designs for sustainable energy generation.
Unlike conventional fixed-design BIPV/T systems, this study introduces a dynamic approach in which air inlet locations, air velocity, and system configurations are adjusted in real time based on outdoor temperature, solar radiation, and PV panel temperature. The proposed system features automated air inlets and motorized dampers that enable seamless switching between one-inlet and two-inlet modes to optimize PV panel temperature control and enhance both thermal and electrical energy generation. A simulation model, developed using an energy balance method and thermal network analogy in Python 3.10, provides a robust framework for evaluating system performance and identifying optimal operational strategies.
While multi-inlet adaptive BIPV/T systems have been explored in previous research—including dual-inlet or passively adjusted systems integrated into roofs or generic façades [2,21]—these studies do not address the architectural and practical constraints of curtain wall assemblies. The system presented here is purpose-built for prefabricated curtain wall integration, a non-load-bearing façade type commonly used in commercial high-rise buildings. This context imposes unique demands, such as modular unit sizing, structural suspension, streamlined installation, and includes occupant-facing features such as view sections and operable windows. Moreover, previous studies generally lack integrated control logic capable of real-time mode switching within a complete building envelope system. This work advances the field by combining dynamic multi-inlet airflow control with sensor-based operation and curtain wall modularity, offering a deployable solution aligned with modern construction practices.
3. Proposed Design and Control Approach
The proposed BIPV/T curtain wall system is a switchable multi-inlet design that can operate in one-inlet and two-inlet modes. It incorporates a 5 cm air cavity at the back of the PV panel, allowing for air circulation to generate heated air and lower the temperature of the PV panel. The system consists of three sections. Sections 1 and 2 include STPV, an air channel, and an opaque spandrel on the interior side. Section 3, situated between Sections 1 and 2, features glass and opaque PV blinds. This section allows building occupants to have views to the outside while also providing daylighting. The design incorporates four air inlets and two dampers to manage the BIPV/T curtain wall operation system under varying environmental conditions and usage scenarios. This system can operate in both heating and cooling seasons to generate electricity, supply heated air, and enhance building envelope energy performance by reducing heat transfer between the indoor and outdoor environments. Different operating modes are defined to control the position of the air inlets and dampers to automate the BIPV/T operation system. Figure 3 illustrates a 3D representation of the system, the locations of the air inlets and dampers, as well as three operating modes of the proposed switchable BIPV/T curtain wall. Five scenarios were defined for an automotive operation in a disclosed structure to control the position of air inlets/outlets and dampers to meet users’ energy demands in different seasons. The operation scenario for this system is not limited to five scenarios. It may have any scenario needed by opening and closing valves on air inlets/outlets and dampers in different arrangements. The criteria to select an optimum operating mode in a specific condition can be lower PV panel temperature and higher thermal and electricity generation to meet energy demand. Mode 1 uses a one-inlet system, while mode 2 utilizes a two-inlet system with the second inlet open. Mode 3 uses a two-inlet system with the third inlet open. The first three modes are defined for cold seasons when heating or energy generation is the priority of the system operation. In heating mode, dampers 1 and 2 (Figure 3) are opened to allow air circulation in the cavity to extract heat from inside surfaces (heat transfer sources). Mode 4 is employed when the system is not in heating mode, and users from indoors prefer to open internal and external windows to provide natural ventilation. In this operating mode, dampers 1 and 2 (Figure 3) should be closed so they do not direct heated air to the indoor space. The dampers are designed to operate in summer, when PV panel temperatures are higher. To regulate the temperature of the PV panel during this season, dampers one and two are required to be closed, which ceases the circulation of heated air between PV/T sections 1 and 2, as well as the viewing section. Simultaneously, all inlets are opened, while the air outlet port from indoors remains closed. This configuration enables the first and second inlets to function as the air inlet and outlet for PV/T section 1. Additionally, in PV/T section 2, the third and fourth inlets are defined as the air inlet and outlet, respectively. This configuration allows each PV/T section to circulate air independently, effectively reducing the PV panel temperature without affecting the viewing section—even when the window is opened during summer. The fifth operating mode is for when there is no solar radiation (nighttime), in which all dampers 1 and 2 and all air inlets/outlets should be closed to stop air circulation in the air cavity. In this mode, the system performs as a thermal buffer to decrease heat transfer between the inside and outside of the building. Table 1 lists the status of each inlet and damper depending on the selected operating mode.
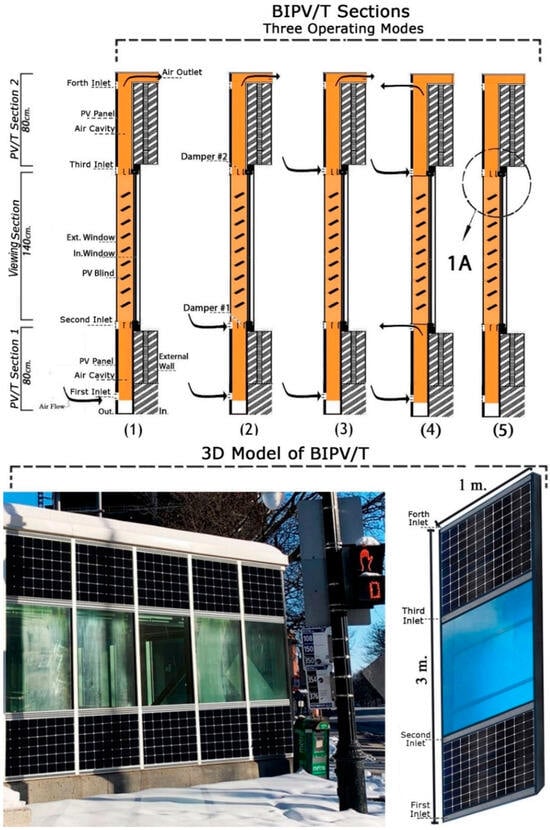
Figure 3.
Schematic representation of the proposed adaptive multimode BIPV/T curtain wall system in five operating modes. These images are entirely conceptual and have been developed for illustration purposes only using Photoshop 2025. They do not depict a physical prototype or tested installation but are used to show the airflow routing logic and operational sequence under simulated conditions (see Figure 4 for detail 1A).

Table 1.
Status of air inlets and dampers in each BIPV/T curtain wall operating mode.
Detail 1A in Figure 3 is a part shown in Figure 4. Figure 4 illustrates a detailed section of the system’s parts to show dampers (No. 8) in the second inlet. The internal window glass 2 and its frame 5 and the exterior window glass 3 and frame 6 allow the view from inside to outside to be kept and solar radiation to reach indoors in winter. The interior window and its frame are installed on the exterior building wall or insulation panel (No. 1). If the system is installed in the under-construction phase of a building, the insulation panel can be a part of the modular curtain wall system. In contrast, if the system is retrofitted on a constructed building, the insulation panel may be the exterior wall of the building. Figure 4 illustrates the mechanisms for opening and closing the air inlets. In the zoomed-in view of Figure 4 shown in 1A, the air inlet has two movable valves (No. 8) with gears (No. 9) in the middle of each valve, and it has micro-motor (No. 12) to open and close valves (No. 8). The gears on the valves and the motor are connected through belts (No. 10). Belts go around gears to motors, which, along with the motors, can open and/or close each valve of the air inlets. These belts are positioned inside the main frame, and the motor is inside box (No. 11). The opening and closing mechanisms for all air inlets/outlets are similar. The damper (No. 13) has tiny motor (No. 7), which opens and closes the damper mechanism in different operating modes (Figure 3). By closing damper(s) (No. 13), the air movement and circulation in air cavity (No. 4) are stopped. The system includes actuators coupled with a controller that controls the open and closed positions in different operating modes. The system can also include sensors configured to measure inside environmental conditions in the interior space of the building, air inlet temperature, PV panel temperature, and air outlet temperature. By this sensor, the control system can decide when each opening should be opened and how much air each opening should inject into the air cavity. The valves in each opening are controllable and adjustable to control the amount of air injected into the system. Although categorized as a semi-passive system, the integration of motorized dampers and environmental sensors enables air velocity modulation through pre-programmed or sensor-responsive control logic. This is achievable via internal fans or external HVAC linkages.
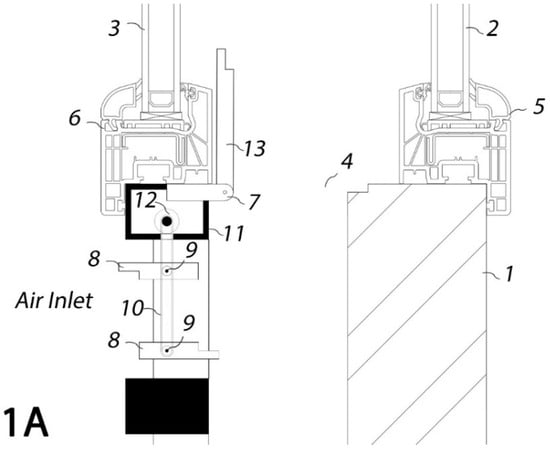
Figure 4.
Detail 1A: a detailed section of the BIPV/T curtain wall system’s parts.
In one aspect of the present application, the controller is configured to operate remotely, e.g., via Bluetooth, wireless communication, etc., or through the keypad installed on the controller. In addition, the controller may be connected and integrated with the building energy management system. In another aspect, the controller can be turned off, and different operating modes can operate manually.
3.1. BIPV/T Curtain Wall Construction System
The present study proposes a switchable multi-inlet BIPV/T curtain wall system integrated with a curtain wall construction system that can be installed on building envelopes. Although Figure 5 includes glazing and horizontal framing that may resemble a window wall configuration, the system is designed and classified as a curtain wall. It is a non-load-bearing envelope system installed on the exterior of the building frame, spanning multiple floors if required and structurally supported by the main building skeleton. The modular units shown in the figure are preassembled with PV panels, integrated air channels, mullions, and framing components, all of which are suspended from the building structure rather than floor-slab-mounted. This configuration aligns with standard curtain wall practices used in commercial buildings. By adopting a modular and prefabricated approach, the system significantly reduces construction time and minimizes on-site construction activities [32]. The proposed BIPV/T curtain wall system includes glass or operable windows, mullions, transoms, frame panels, PV panels, dampers, and automated air inlet ports with operable valves, which can be assembled in a factory to minimize on-site construction. This streamlined process ensures high-quality manufacturing and allows for efficient installation on both new and existing buildings.
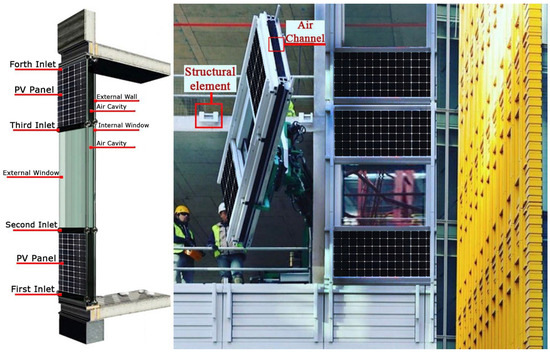
Figure 5.
Conceptual rendering of the proposed switchable multi-inlet BIPV/T curtain wall system (non-load-bearing, prefabricated façade unit). The left-side schematic shows the modular design. The right-side image is a digitally created visual composed using Adobe Photoshop, based on a photograph of a typical building in Montréal. It does not represent an actual implementation of the proposed system but is used to demonstrate potential façade integration.
Figure 5 illustrates the installation of the proposed system on newly constructed and/or existing buildings. The installation process involves six simple steps: (1) picking up one unit of the system, (2) moving the unit to the appropriate location in the installation area, (3) rotating the unit to set it vertically on the building, (4) delivering the system to the installation point and carrying out the installation process, and (5) setting the curtain wall precisely and completing the installation. The installation process for the proposed BIPV/T curtain wall systems closely mirrors conventional curtain wall installation practices, which typically involve prefabricating panels, transporting them to the site, and using cranes for placement and securing. This similarity is beneficial as it leverages the existing skills and tools of construction teams, minimizing the need for specialized training and reducing both installation time and costs. Familiar installation techniques facilitate easier adoption, enhancing cost efficiency and accelerating deployment, which can lead to broader acceptance and integration of sustainable BIPV/T technologies in the construction industry.
3.2. Simulation Model
In this study, a simulation model was developed to analyze the energy performance of the proposed BIPV/T curtain wall system. This enables the effects of critical design and operational parameters to be analyzed [32]. Mathematical models have been developed to study the detailed parameters and their effects on system energy performance, especially for novel BIPV/T curtain wall configurations under specific flow and heat transfer conditions [2,33,34]. To evaluate the energy performance of the proposed BIPV/T curtain wall system, custom models were developed, and energy simulations were conducted in Python for BIPV/T curtain wall operating modes 1, 2, and 3 (Table 2). The selection of operating modes 1, 2 and 3 for simulation in this study is strategically aligned with the research’s focus on winter and periods of high heating demand, which are critical for energy management in Québec’s commercial buildings. Operating modes four and five, which are designed primarily for summer cooling and nighttime operations, respectively, fall outside the scope of this study. This exclusion is intentional as these modes do not contribute to the understanding of the system’s performance during the peak heating requirements of the winter months. The mathematical model of the proposed BIPV/T curtain wall is described in the following paragraph. An analytical, two-dimensional steady-state model was employed using an energy balance approach and a thermal network analogy to calculate the impact of variable and fixed parameters on the system [32,35]. Each BIPV/T curtain wall component was represented as a control volume, and a set of equations was obtained for each node of the RC thermal network. A schematic of the thermal network for a control volume (CV) of both the opaque and transparent sections is illustrated in Figure 6.

Table 2.
Conditions for the automation control system to select an operating mode.
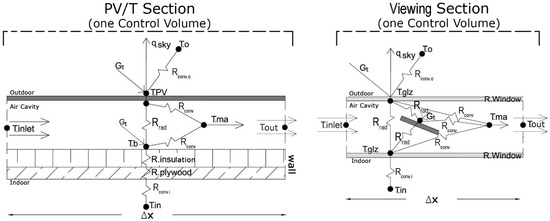
Figure 6.
Lumped parameter thermal network for two sections of BIPV/T study model (one control volume).
The proposed BIPV/T curtain wall unit has a continuous air cavity that is 3 m long, which runs at the back of the PV panels and in the viewing section, connected in series in the vertical direction. The system performance on thermal and electrical generation during winter was evaluated using the above-described numerical model, which predicted the air temperature in the cavity as well as the temperature of the PV, blinds, and glass components. By using this method, the energy performance of the proposed BIPV/T curtain wall system in different modes of operation, namely, 1, 2, and 3, was evaluated.
To calculate the air temperature gradient within the air cavity of the proposed BIPV/T curtain wall, the system components (PV, air cavity, back layer, and glazing sheets) were divided into discrete control volumes (CVs) along the vertical direction, subdividing the cavity into “n” uniform sections. These sections were modeled as thermal nodes, each representing a segment of the system where thermal energy transfer and temperature gradients could be calculated [32]. In the vertical direction of the building, indoor and outdoor air temperature gradients were neglected. However, the nodal temperatures in the thermal network model of the system were connected horizontally to the indoor temperature node (Tin), which was set as constant during the day at 20 °C, and the outdoor temperature node (To), which represents the hourly outdoor temperature from the Energy Plus Weather data file for Montréal, Canada. The air outlet of each CV (Tout) serves as the air inlet (Tinlet) for the subsequent CV. Determining the number of CVs along the airstream in the cavity is an indispensable aspect of numerical PV/T modeling.
Equation (1) is defined to determine the temperature of each component. The energy balance equation represents each CV in the proposed system, resulting in a system of equations that determines the temperature of each CV component. For instance, the energy balance equation for the nth PV node in the PV/T section is expressed as follows:
The temperature of various system elements is denoted by T, while Tma represents the mean air temperature within the air cavity. Gt represents the incident solar radiation on the nth node, hc is the convective heat transfer coefficient, hr is the radiative heat transfer coefficient, and PF is the packing factor, which in this case is 70%. This means that PV occupies 70% of the panel, and 30% of the PV panel is filled with clear PVF to allow some of the solar radiation to pass through to the wall (Tb) [17].
Theoretical studies have shown that the temperature profile within an air cavity should be exponential [35,36]. Tma is determined through differential analysis, which finds the air temperature as a function of vertical distance (x). It is assumed that the air velocity is constant, and the BIPV/T curtain wall system draws in air through a fan in the HVAC system for fresh air intake [2]. To determine the Tma of each CV within the air cavity, Equation (2) is used [32].
To calculate the CHTC in the air cavity, which is a significant factor affecting the thermal and electrical efficiency, the Nusselt correlation is calculated. The Nusselt number (Nu) is the ratio of convection to conduction heat transfer in an air layer [37], and it increases with an increase in velocity. For the same hydraulic diameter (D), when air velocity increases, Nu increases as convection becomes more dominant than conduction heat transfer. In an air cavity, heat transfer by conduction involves the direct transfer of kinetic energy between air molecules along a temperature gradient, which is also influenced by the air flow pattern in the cavity. For instance, in the regime of laminar flow, characterized by the orderly movement of air in parallel layers, conduction emerges as the predominant mechanism governing heat transfer. Conversely, turbulent flow, distinguished by its chaotic and irregular air motion, elevates the prominence of convective heat transfer.
The Nu correlations of convective heat transfer between the photovoltaic panel and air were developed based on an experimental study conducted by Yang et al. [17] as a function of the Reynolds number (Re) and Prandtl number (Pr) (Equations (3) and (4)). For the first section of a two-inlet BIPV/T curtain wall (PV/T section 1), Equation (3) can be used where Re ranges from 1453 to 14,322. For the second section of the two-inlet system (PV/T section 2), Equation (4) with Re between 3600 and 19,034 can be employed. However, Equation (3) can also be applied to the entire air cavity of a one-inlet BIPV/T curtain wall to determine Nu. Using the developed Nusselt correlation, the heat transfer coefficient value can be determined in Equation (5). Table 3 presents the key assumptions utilized in the modeling of the BIPV/T curtain wall system.

Table 3.
Assumptions used in BIPV/T modeling.
Equations (3) and (4) describe empirical relationships for the Nusselt number as a function of the Reynolds number (Re), representing the ratio of inertial forces to viscous forces, and the Prandtl number (Pr), representing the ratio of momentum diffusivity to thermal diffusivity. Equation (5) gives the convective heat transfer coefficient h as a function of the Nusselt number Nu, the thermal conductivity K of the fluid, and the characteristic length D of the system. Although the convective heat transfer coefficients in this study are derived from Nusselt number correlations originally presented by Yang et al. [17], their application within this work differs significantly. The correlations are embedded in a dynamically switchable multi-inlet system, where thermal behavior varies across distinct airflow paths and operational modes. Each operating mode involves different inlet configurations and flow conditions, requiring recalculation of local Reynolds and Nusselt numbers for accurate heat transfer modeling. The integration of these correlations into a multi-scenario control-driven simulation framework, tailored to a façade-integrated curtain wall system, reflects a novel application beyond traditional static or fixed-inlet models.
In Table 3, the symbols represent various thermal and material properties relevant to photovoltaic systems: ε.PV (0.9) and ε.back (0.9) denote the longwave emissivity of the PV and back surfaces, indicating their efficiency in emitting thermal radiation, while ε.glass (0.1) represents the emissivity of the glass surface. R.PV (0.001 m2·°C/Watt), Rback (3 m2·°C/Watt), and Rwindow (0.34 m2·°C/Watt) describe the thermal resistance of the PV, back, and window surfaces, respectively, indicating their resistance to heat flow. The m (velocity depth width) represents the mass flow rate, and ρb (0.05) refers to the density of the back surface material. hc.out (14 Watt/m2·°C) is the convective heat transfer coefficient on the outside surface, determining the rate of heat transfer due to convection. τPVF (0.9) indicates the transmittance of the photovoltaic film, and αmetal (0.95) describes the absorptivity of the metal surface, reflecting its ability to absorb incident radiation.
The BIPV/T surface and the sky exchange longwave infrared radiative heat (q.sky) as the final external building surface [38]. The sky temperature is calculated based on the outdoor temperature (To), using the following equation [38]:
An important source of energy loss from the proposed BIPV/T curtain wall system to the outdoors is wind-driven convection (hc.o). There are several correlations available for predicting wind-driven CHTC. In this study, the wind-driven CHTC equation developed by Palyvos [39] was employed, as it provided the best fit correlation between the simulated and measured results of an experimental BIPV/T study by Rounis et al. [20]. It was assumed that the proposed BIPV/T curtain wall system was located on the windward side of the building façade.
The air temperature in the BIPV/T section 2 cavity was a result of mixing between the air from the BIPV/T curtain wall section 1 cavity and the air injected from the second inlet (as shown in Figure 3). Equation (8) was derived to calculate the air temperature in the cavity after mixing with the second or third air inlets. Each inlet of the proposed BIPV/T curtain wall system is equipped with a valve to regulate the air volumetric flow rate under different environmental conditions and usage scenarios.
The air temperature in the first BIPV/T section (Tma) and the air temperature of the second or third inlet (Tsec.Inlet) along with the air volumetric flow rate in BIPV/T section 1 (mcavity) and the air volumetric flow rate in the second or third inlet (msec.inlet) were used to determine the air temperature in the cavity after mixing. The outdoor air temperature was assumed to be equal to the air inlet temperature from the second or third inlet, and the air volumetric flow rate of the second or third inlet was assumed to be 25% of the air volumetric flow rate of the first inlet.
Equation (9) describes the thermal–electrical energy generation in a BIPV/T curtain wall system, accounting for factors such as PV temperature, solar irradiation, and air mass flow rate. It incorporates the effect of PV temperature on electrical efficiency. The equation is based on the principle of energy balance and includes air density and the specific heat of air as well as air outlet temperature from the BIPV/T curtain wall system. In the calculation, mρc (Tout − Tin), represents the thermal energy gained or lost by the fluid as it changes temperature from inlet (Tin) to outlet (Tout). The second part adjusts the standard efficiency (eff_stand) of the PV module by accounting for the effect of temperature difference between the PV module (Tpv) and a reference temperature (TRef), multiplied by the PV area (APV) and solar irradiance (G). it was assumed that the standard efficiency of panels (eff_stand) is 20% and the reference temperature (T.Ref) at which the electrical efficiency of the PV cells is defined is 25 °C.
3.3. Model Validation
The simulation results for air outlet temperature in operating mode 3 were compared with the findings documented by T. Yang et al. [17]. This validation process was carried out due to the similarity of these two systems (multiple inlet systems). The developed PV/T system was set to operate under the same environmental conditions as in Yang’s study, with an incident solar flux of 1040 W/m2, average ambient temperature of 20 °C, and average wind speed of 2.1 m/s. While the foundational numerical model aligns with the governing equations and validation framework proposed by Yang et al. [17], the current study significantly advances the modeling approach by integrating a dynamic decision-making algorithm, multi-inlet airflow configurations, and curtain wall-specific architectural features. These elements enable real-time switching between operating modes based on environmental inputs and energy demand. Table 4 presents a direct comparison of the core features of the present study and the original work by Yang et al., highlighting the key innovations introduced.

Table 4.
Comparison between this study and Yang et al. [17].
This study is part of an early-stage design investigation intended to evaluate the feasibility and theoretical performance of a novel adaptive BIPV/T curtain wall system under cold-climate conditions. While no full-scale experimental testing of the proposed system has yet been conducted, the underlying thermal modeling framework was benchmarked against experimental data from Yang and Athienitis [17]. This reference case involved a comparable BIPV/T façade configuration and boundary conditions (solar irradiance, inlet air temperature, and material properties), enabling us to verify the model’s predictive accuracy. The RMSD between simulation and experimental outlet air temperature was found to be less than 1%, confirming the reliability of the thermal model for early-stage performance prediction. However, we emphasize that validation is limited to thermal behavior under steady-state conditions and does not extend to the new switching mechanism. Experimental verification of the complete adaptive control strategy and dynamic airflow system is planned in future research phases. In the study by T. Yang et al. [17], the solar collector in the experimental setup was characterized as a single pass, two-inlet PV/T air collector with a packing factor of 80% for the semitransparent PV panel. This parallel setup adds further relevance to the comparison, as it aligns closely with the configuration of the presented PV/T system.
In order to validate the developed model, the root-mean-square deviation (RMSD) [40] was used as a quantitative measure to assess the agreement between the predicted and observed outlet air temperatures from the PV/T system. Equation (10) calculates RMSD between predicted outlet air temperature (Simn) and observed outlet air temperature (Expn) data points. It measures the average percentage deviation between the simulated and experimental values, normalized by the simulated value. The equation takes the squared difference between the simulated and experimental data, scales it by 100 to express it as a percentage, sums these squared deviations over all data points (N), and then divides by the number of data points before taking the square root. RMSD provides a single value that quantifies the overall accuracy of the simulation relative to the experimental data, with lower values indicating better agreement.
The evaluation of the model’s simulation results and their alignment with experimental data from reference [21] is depicted graphically in Figure 7. This visual comparison offers valuable insights into the concordance between our modeling predictions and the empirically observed outcomes. The RMSD for the outlet air temperature of the PV/T system was calculated to be 0.32%. The relatively low RMSD value signifies a good degree of agreement between our model’s predictions and the experimental data. This agreement demonstrates the effectiveness of the developed model in capturing the behavior of the PV/T system.
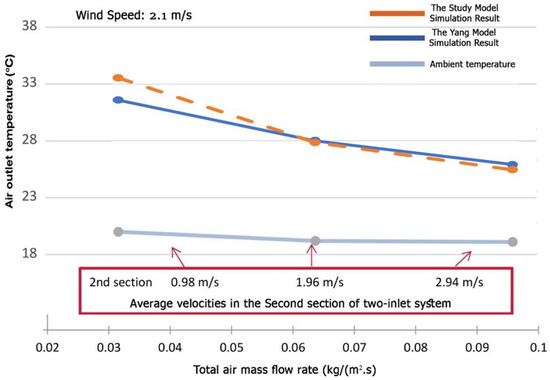
Figure 7.
Simulation results and T. Yang’s experimental data in the second section of the two-inlet PV/T system.
The simulation model was validated against the study by Yang et al. [17] due to the similarity in airflow configuration, system scale, and environmental conditions, providing a reliable baseline for benchmarking core thermal behaviors. However, we acknowledge that this comparison does not fully capture the added complexity introduced by the dynamic switching logic, real-time control algorithms, and multi-inlet configurations specific to the proposed system. These novel features extend beyond the capabilities of Yang’s fixed-mode experimental setup. To address this, the model was augmented with scenario-based airflow switching and recalculated local heat transfer parameters for each operating mode. While this hybrid approach allows for a rigorous parametric evaluation of the system’s potential, future work will involve experimental testing of a full-scale prototype to validate the integrated switching mechanisms, control responses, and real-time performance under variable boundary conditions.
4. Results and Discussion
This study consists of three main steps: (1) design development of a switchable multi-inlet BIPV/T curtain wall system, (2) development and validation of a BIPV/T curtain wall energy model, and (3) assessment of the proposed BIPV/T curtain wall system performance under different operational strategies. The primary goal of the third part of this study is to investigate the system’s performance under different operating conditions, with a focus on managing the PV panel temperature and thermal–electrical energy generation.
The study period set in this study was three months (1 January to 1 April 2020) in Montréal, Canada, representative of the heating season. The numerical simulation was performed in three different operating modes, and the results were analyzed to evaluate the proposed BIPV/T curtain wall system’s thermal and electrical energy generation performance. The outdoor air temperature and global horizontal irradiance data between sunrise and sunset were obtained from an Energy Plus Weather file for Montréal. Figure 8 shows the outdoor temperature and global horizontal irradiance obtained from the Energy Plus Weather file between sunrise and sunset. For detailed observation and evaluation, one week in February with high fluctuation in outdoor air temperature and irradiance was selected.
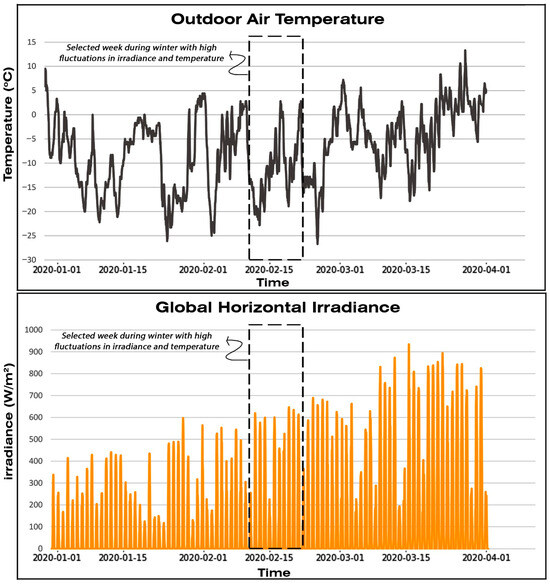
Figure 8.
Outdoor air temperature (1 January to 1 April), Montréal, Canada.
Figure 9 shows the flowchart providing a visual representation of the dynamic operational processes and decision-making pathways within the proposed BIPV/T curtain wall system. It outlines the sequence of actions and conditions that dictate the system’s operating mode and airflow management.
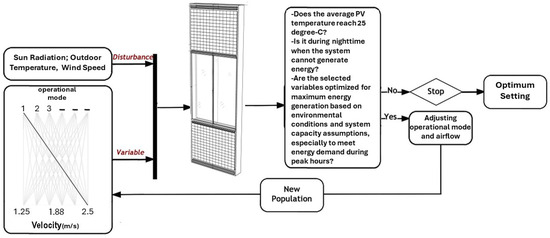
Figure 9.
Flowchart illustrating the operational decision-making process and airflow management in the BIPV/T curtain wall system.
At the outset, the flowchart begins with the assessment of variable and disturbance parameters [41,42], which determines the subsequent actions. Depending on the mode, specific steps are taken to adjust the airflow and configuration of the BIPV/T curtain wall system to optimize energy generation and thermal management.
Key decision points include considerations of seasonal variations, environmental conditions, PV panel temperature, and user preferences. For instance, during winter conditions, the system may prioritize heating, while in summer, cooling mechanisms are activated to maintain optimal temperature levels. Additionally, manual overrides and adjustments based on energy demand and building usage scenarios are incorporated into the decision-making process.
Energy performance analysis of the switchable BIPV/T curtain wall with three operating modes in a curtain wall construction system was conducted using numerical two-dimensional models and the finite control volume approach.
The developed simulation model calculated the hourly thermal and electrical energy generation and PV panel temperature. The proposed system was evaluated under three different air cavity velocities (1.25 m/s, 1.88 m/s, and 2.5 m/s). The selected air velocities were the typical air velocity ranges used in BIPV/T curtain wall studies [37]. The selected air velocities represent realistic airflow rates for BIPV/T, facilitate comparison with existing studies, and allow for comprehensive analysis of the system’s performance under varying ventilation conditions. In the two-inlet operating modes (modes 2 and 3), the air velocity in PV/T section 2 is 25% more than that in PV/T section 1 because of air injection through the second or third inlet. However, in the one-inlet operating mode (mode 1), the air velocity was constant between PV/T sections 1 and 2.
A representative week in February with significant temperature and irradiance variation was selected for detailed analysis. Additionally, this study analyzes the PV panel temperature during a one-hour period on a winter sample day, with specific conditions of total incident solar radiation on a vertical surface of 800 Watt/m2 and an outdoor temperature of −10 °C. By conducting a one-hour analysis, we can intricately compare PV panel temperatures under different air velocities and operating modes within a precise time interval. While longer time periods offer insights into overall system performance, a shorter timeframe allows for a focused examination of the impact of air velocity on PV panel temperature. This approach aids in understanding the rapid response of the PV panel temperature to changes in air velocity and operating modes. Such detailed analysis enables us to assess the immediate effects of varying air velocities and operating modes on PV panel temperature, providing valuable insights into the dynamic behavior of the system. Among the five operating modes designed for the proposed system, we specifically focused on operating modes 1, 2, and 3 (heating modes) for simulation.
4.1. Surface Temperatures Analysis
The analysis of PV panel temperature is an essential aspect of investigating the impact of the operating modes on the energy performance of the proposed BIPV/T curtain wall system. The temperatures of the PV panel and the back surface of the channel directly influence the system’s electricity and thermal generation capabilities, as well as indoor comfort levels. Figure 10 presents the PV panel and back surface temperatures during a one-hour period at noon. This section focuses on the effects of operating modes and air velocities. Solar radiation and outdoor air temperature were kept constant during the hour for comparison.
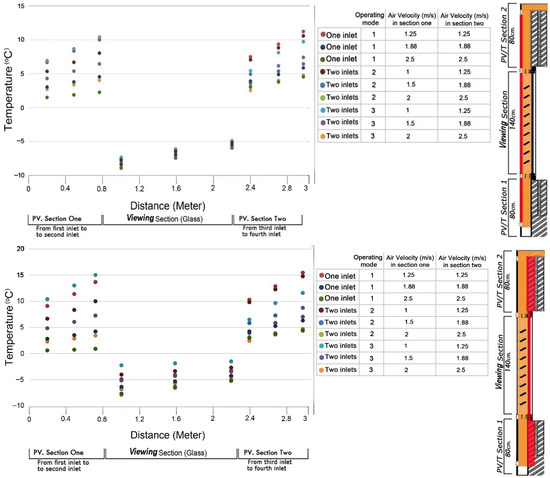
Figure 10.
PV panel temperature (UP) and wall temperature (DOWN) for three operating modes and three air velocities.
Figure 10 provides valuable insights into the PV panel temperature variations in the two opaque PV/T sections and the glass temperature of the viewing section and back wall temperature over a one-hour period on a winter sample day, considering three distinct operating modes. The results indicate that the lowest air outlet velocity (1.25 m/s) in operating mode 1 (one-inlet system model) resulted in the highest PV panel temperature (11 °C). This outcome can be attributed to the insufficient heat dissipation capacity of the Nusselt number and the CHTC at lower air velocities within the air channel. In contrast, the two-inlet modes (modes 2 and 3) exhibited lower PV panel temperatures due to an increased Nusselt number and air thermal capacity, enabling enhanced heat extraction from the PV panel.
Operating mode 1 in PV/T section 1 recorded the lowest PV panel temperature (2 °C) when the air outlet velocity was 2.5 m/s. Additionally, the highest temperatures were observed in both the PV/T section and the viewing section when the system operated in mode 3. Figure 10 also illustrates the wall surface and interior glass temperature, which represents the back of the BIPV/T curtain wall channel in two sections of the system, namely, above and below the viewing section. This surface operates as an indispensable interface separating the BIPV/T curtain wall system from the indoor zone, thereby assuming a pivotal role in influencing indoor comfort and governing the dynamics of heat transfer. The temperature of the wall surface is a key factor in determining the direction and magnitude of heat transfer between the BIPV/T air cavity and the indoor space.
When the wall surface temperature exceeds the temperature of the interior layer connected to the indoor space, heat transfer is positive, indicating that heat is directly transferred from the BIPV/T air cavity to the indoor environment. Conversely, when the temperature of the interior layer surpasses that of the exterior layer connected to the BIPV/T air cavity, heat transfer becomes negative, signifying heat transfer from the indoor space to the BIPV/T curtain wall system.
The trends observed in the exterior layer of the wall temperature align with those of the PV panel temperature, with the lowest air outlet velocity (1.25 m/s) in operating mode 1 yielding the highest exterior wall temperature (15.5 °C) in PV/T section 2. In section 1, the highest exterior wall temperature, as well as the temperature of the interior glass in the viewing section, was recorded at an air velocity of 1 m/s in operating mode 3.
In order to achieve optimal operation of a PV/T system, it is important to reduce the temperature of the system surfaces. Lower surface temperatures not only facilitate higher heat extraction but also enhance system energy generation efficiency and prolong the lifespan of system materials. The performance of each operating mode in the proposed system varied across the three selected air velocities. When the air outlet velocity was set at 2.5 m/s, operating modes 1 and 3 exhibited the lowest average temperatures for the system components. Similarly, when the average air outlet velocity was 1.88 m/s, operating modes 1 and 2 resulted in the lowest temperatures for the system components. At the lowest air outlet velocity of 1.25 m/s, both operating modes 2 and 1 demonstrated the lowest temperatures for the system components.
These findings emphasize the importance of carefully selecting the appropriate operating mode and air velocity to effectively control the temperature of PV/T system components. By considering these temperature variations, system operators and designers can optimize system performance, improve energy generation efficiency, and ensure the longevity of system materials.
4.2. Thermal Energy Generation
The thermal energy generation of the proposed BIPV/T curtain wall system was investigated under the different air velocities and operating modes. A comparison was made between the one-inlet and two-inlet modes over a three-month period during winter from 1 January to 1 April. Furthermore, for a detailed evaluation, the hourly thermal energy generation between 12 February and 20 February in Montréal was more closely examined.
Figure 11 illustrates the thermal energy generation and air outlet temperature for the optimum operating multimode and the reference mode (mode 1) when the air outlet velocity is set at 1.25 m/s with an air outlet volumetric flow rate of 0.063 m3/s. The optimum operating multimode refers to the mode selected by the control system on a 15 min basis to achieve higher thermal and electrical generation and lower surface temperatures. The figure reveals that under an air outlet velocity of 1.25 m/s, the optimal operating modes are mode 1 (80% of the time) and mode 2 (20% of the time). The control system switches from mode 1 to mode 2 when there is an increase in solar radiation and outdoor temperature, resulting in higher thermal generation and air outlet temperatures.
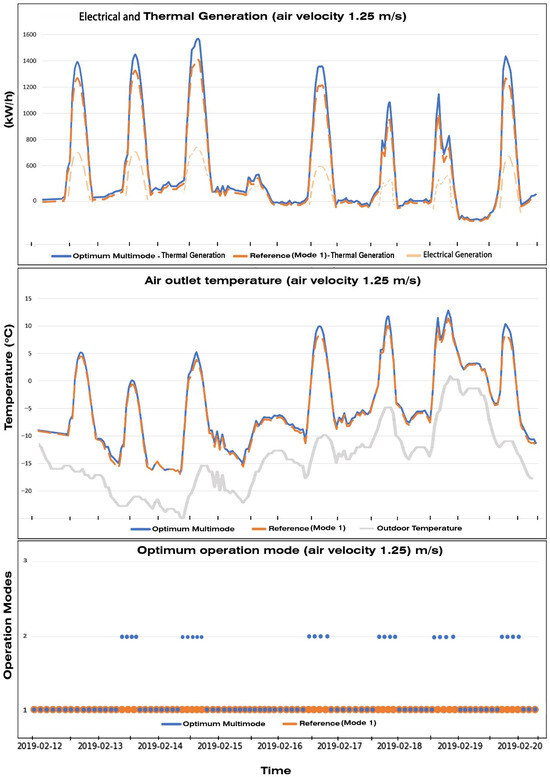
Figure 11.
Comparison of air outlet temperature, thermal generation, and operating modes for optimum multimode system and reference system (mode 1) from 12 February to 20 February at an air velocity of 1.25 m/s.
Figure 12 illustrates that at an air velocity of 1.88 m/s (air outlet volumetric flow rate 0.094 m3/s), the control system dynamically switches from operating mode 2 to operating mode 1 during periods of heightened solar radiation to maximize thermal and electrical generation. The multimode operating system primarily operates in mode 2, constituting 85% of the time, while mode 1 is activated for 15% of the time. This selection aims to achieve higher thermal and electrical generation while maintaining lower surface temperatures within the system.
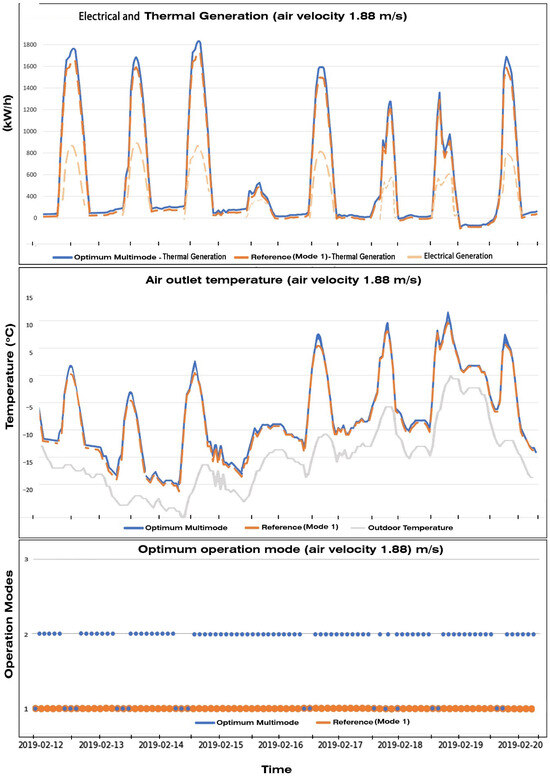
Figure 12.
Comparison of air outlet temperature, thermal generation, and operating modes for optimum multimode system and reference system (mode 1) from 12 February to 20 February at an air velocity of 1.88 m/s.
Furthermore, Figure 13 presents the hourly thermal energy generation of the proposed system at an air velocity of 2.5 m/s (air outlet volumetric flow rate 0.125 m3/s). As the air velocity increases, the control system transitions to operating mode 3. The control system transitions from mode 3 to mode 1 when solar radiation and outdoor temperature rise, leading to increased thermal production and higher air outlet temperatures. In this air velocity range, operating mode 3 dominates, accounting for nearly 85% of the system’s operating time, while mode 1 is active for 15% of the time.
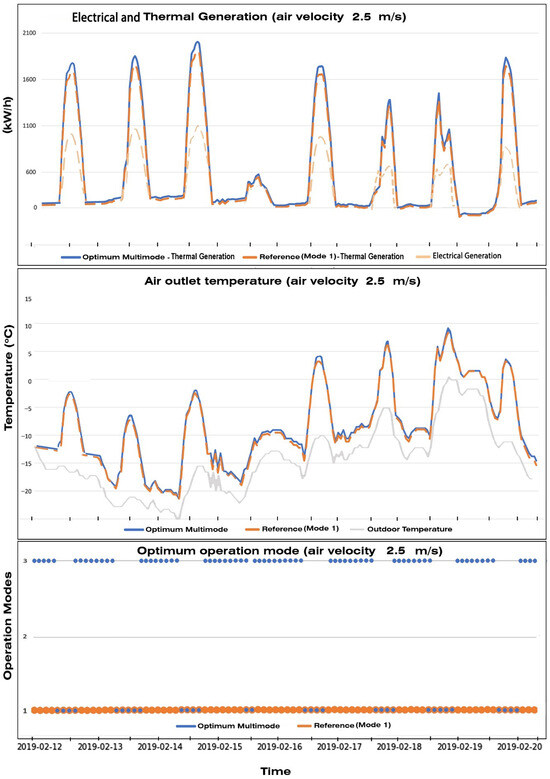
Figure 13.
Comparison of air outlet temperature, thermal generation, and operating modes for optimum multimode system and reference system (mode 1) from 12 February to 20 February at an air velocity of 2.5 m/s.
The electrical generation remains consistent across all three air velocity conditions, as the PV panel temperature remains below 25 °C in each scenario. This observation underscores the robustness of the system’s performance, indicating that variations in air velocity do not significantly impact the electrical output of the BIPV/T curtain wall system during wintertime.
At an air velocity of 1.25 m/s, the system predominantly operates in mode 1, accounting for approximately 80% of the operating time, while mode 2 is active for 20%, as shown in the one-week operational analysis (Figure 14). In the seasonal performance comparison (Figure 15), the multimode BIPV/T curtain wall system achieves a 2% increase in thermal energy generation compared to a one-inlet system (mode 1), a 15% increase compared to a system limited to mode 2, and a 25% increase compared to mode 3. The operating mode distribution during the winter period confirms that the system runs in mode 1 87% of the time and in mode 2 13%, demonstrating adaptability under lower air velocity conditions.
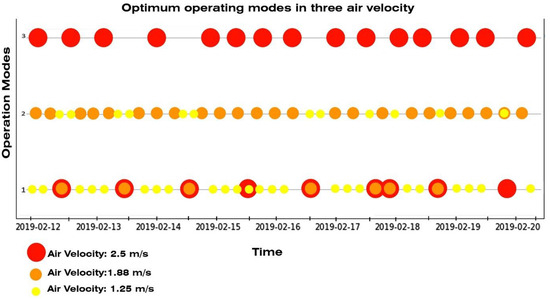
Figure 14.
Distribution of optimum operating modes for three air velocities (1.25, 1.88, and 2.5 m/s) over a 1-week period in February. Each circle represents the optimal mode selected at a given time and air velocity. The figure demonstrates the system’s responsiveness to environmental conditions through dynamic mode switching.
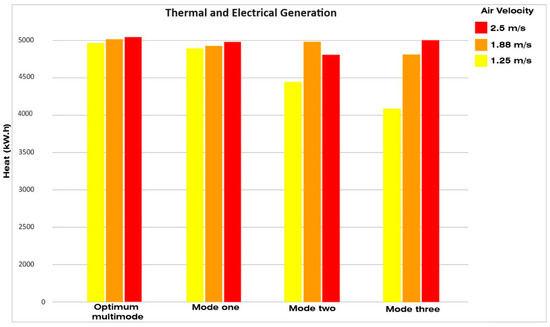
Figure 15.
Total thermal and electrical generation analysis for all operating modes and optimum multimode system across three air velocities between 1 January and 1 April.
At an air velocity of 1.88 m/s, the system primarily operates in mode 2, representing 85% of the operational time, with mode 1 active for the remaining 15% (Figure 14). Over the full winter period (Figure 15), the switchable system delivers a 2.5% increase in thermal generation compared to mode 1, a 1.5% increase over mode 2 alone, and a 5% increase over mode 3. Correspondingly, the seasonal operating distribution shows 88% usage of mode 2 and 12% of mode 1, reinforcing the effectiveness of adaptive mode selection.
Similarly, at an air velocity of 2.5 m/s, the system primarily utilizes mode 3, accounting for 85% of the operation, while mode 1 is selected 15% of the time (Figure 14). In the winter analysis (Figure 15), the switchable system achieves a 1.5% increase in thermal energy generation compared to mode 1, a 6% increase compared to mode 2, and a 1% improvement over mode 3. The seasonal data confirms that mode 3 is active 85% of the time, with mode 1 used for 15%, indicating that higher velocities favor deeper inlet operation for thermal optimization.
Overall, these results highlight the thermal performance advantage of the switchable BIPV/T curtain wall system across varying air velocities. By dynamically selecting the most effective operating mode, the system consistently outperforms fixed-mode configurations, enhancing energy efficiency and system effectiveness. Additionally, the performance gap between the switchable and fixed systems is more pronounced at lower air velocities, underscoring the value of real-time adaptability in variable environmental conditions.
The switchable multi-inlet BIPV/T curtain wall system is equipped with a real-time control strategy that dynamically adjusts airflow paths through dampers and operable vents based on outdoor temperature, solar gain, and indoor HVAC demand. This allows the system to switch between heating, cooling, recirculation, and bypass modes. The modular design supports vertical zoning, allowing independent control of different floors or units in a high-rise structure. Simulation results indicate that this adaptability enhances thermal and electrical efficiency, with potential gains in overall energy output ranging from 2% to 25% depending on seasonal climate conditions. The integration of PV cooling improves electrical yield, while heat recovery during the winter reduces building heating loads. These features make the system particularly attractive for envelope retrofitting or as a façade-integrated HVAC supplement in cold-climate urban environments.
This economic assessment compares the incremental costs and benefits of three façade configurations: a base curtain wall without PV integration, a fixed BIPV/T curtain wall, and a switchable multi-inlet BIPV/T system. The base curtain wall is considered a standard construction element and is excluded from cost considerations. For the fixed system, fully embedded polycrystalline photovoltaic modules are assumed, which offer a cost-effective integration solution. Under current Québec market conditions in 2025 for a single-story commercial building (maximum 4 m in height), the estimated incremental cost of the fixed BIPV/T system is CAD 400–600 per m2, totaling CAD 12,000–18,000 for a 30 m2 curtain wall.
The switchable multi-inlet BIPV/T system, incorporating automated dampers, sensors, and control systems, increases the incremental cost to CAD 450–650 per m2 (or CAD 13,500–19,500 total). Assuming a consistent 25% improvement in energy performance based on simulation results, the switchable system produces approximately 3750–5625 kWh/year, compared to 3000–4500 kWh/year from the fixed system. At current Québec energy prices (CAD 0.09/kWh for electricity and CAD 0.045/kWh for thermal energy), the annual energy cost savings are CAD 405–607 for the fixed configuration and CAD 506–759 for the switchable system. These yield payback periods of 20–30 years for the fixed system and 18–26 years for the switchable system, which can be further shortened through available incentives such as the Canada Greener Homes Loan, Rénoclimat, and Hydro-Québec’s LogisVert program. Given these conditions, the switchable system presents a financially viable enhancement for energy-efficient curtain wall applications, particularly in heating-dominated climates. A future cost sensitivity analysis is recommended to evaluate the impact of variables such as energy price fluctuations, system scaling, and varying installation contexts on the financial viability of the switchable BIPV/T system.
A multimode operating BIPV/T curtain wall system outperforms a fixed operating system due to the following reasons:
- Adaptability to varying environmental conditions: Multimode systems can switch between different operating modes based on real-time inputs, allowing them to optimize performance in response to changing solar radiation intensity, ambient temperature, and wind speed. By adjusting parameters like air velocity and inlet locations, they can effectively manage PV panel temperature and increase energy generation efficiency.
- Enhanced energy generation and system efficiency: Multimode systems optimize energy production and overall efficiency by adaptively switching modes in response to environmental conditions. In colder temperatures, such as during winter when PV panel temperatures remain consistently below 25 °C, the system emphasizes thermal energy generation by increasing heat transfer air flow rates and temperatures. In contrast, in warmer conditions, the focus shifts to reducing PV panel temperatures to maximize both electrical and thermal energy generation. By dynamically managing operating parameters such as air velocity and inlet locations, multimode systems effectively control PV panel temperatures, reducing thermal losses and improving electrical energy generation efficiency. This adaptable approach ensures peak operational efficiency, maximizing the system’s energy output and making multimode BIPV/T curtain wall systems more sustainable and economically viable.
- Improved system reliability and durability: Unlike fixed systems with specific operating parameters, multimode systems adapt to diverse conditions, enhancing reliability and durability. By intelligently adjusting operating modes, they can mitigate issues like overheating, component degradation, and inefficiencies, prolonging the system’s lifespan and reducing maintenance requirements.
This study is primarily focused on the numerical evaluation of the thermal and electrical performance of a novel switchable multi-inlet BIPV/T curtain wall system. Accordingly, several limitations are acknowledged that reflect the deliberate scope of this initial research phase. First, this study evaluates system performance under winter conditions in Montréal using steady-state numerical simulations; experimental validation and year-round performance analysis were beyond the intended scope but are planned for future research. Second, simplifications such as ideal material properties, constant air velocities, and neglect of long-term degradation effects (e.g., dust accumulation, mechanical wear) were necessary to isolate and understand the thermodynamic behavior of the system.
These limitations are not oversights but reflect a purposeful narrowing of focus to allow for detailed exploration of system dynamics and control strategies under specific conditions. This research serves as an early-stage, simulation-based design study to assess the viability of an adaptive multimode BIPV/T curtain wall. While the modeling framework is grounded in validated methods, no physical prototype has yet been fabricated or tested. The results are intended to inform the next phase of development, which will include full-scale experimental implementation and real-time control evaluation. At this early stage of development, it is crucial to validate the system’s theoretical potential and operational principles before extending the study to broader, more variable, and cost-sensitive real-world contexts. Establishing this foundation is a critical step toward optimizing the design, informing prototyping, and supporting the development of integrated economic and lifecycle analyses in future phases of the research.
5. Conclusions
The present study introduces an innovative multi-inlet building-integrated photovoltaic/thermal (BIPV/T) system, designed to operate in either one- or two-inlet modes for enhanced adaptability. This system incorporates four air inlets and two dampers, allowing for dynamic adjustments based on environmental conditions and usage scenarios. The research is structured into two major components: the design and construction approach, and the control strategies with simulation analysis. The first part focuses on the system’s construction, integrating it into a modular, prefabricated curtain wall system that simplifies installation. The second part involves a detailed simulation study conducted from 1 January to 1 April, examining the system’s performance during the winter season. An energy model was developed to simulate the BIPV/T curtain wall system’s operation across three distinct modes, evaluating various air outlet velocities, inlet locations, and environmental conditions. The results offer a thorough assessment of the system’s thermal and electrical energy generation, providing insights into its efficiency and operational flexibility in different scenarios. The findings indicate that the switchable multi-inlet BIPV/T curtain wall system can achieve a thermal–electrical generation increase ranging from 2% to 25% compared to one- or two-inlet systems. The one-inlet system performs better at lower air cavity velocity and solar incidence in winter, while the two-inlet system with different air inlet locations exhibits higher thermal energy generation under higher solar incidence and air cavity velocity. In comparison to fixed operating systems, the multimode operating BIPV/T curtain wall system outperforms due to its adaptability to varying environmental conditions, enhanced energy generation, improved system reliability and durability, and increased overall system efficiency. The ability to switch between different operating modes enables real-time optimization, ensuring maximum energy generation and system effectiveness. The ability to switch operating modes can also be utilized to optimize the connection of the system to the HVAC and modes depending on the connected equipment requirements (heat pump, ERV, or other).
The proposed BIPV/T system offers significant benefits, including enhanced energy generation, an adjustable control system, reduced construction time, a lightweight structure, versatile applications, and simplified installation. These features make it an appealing option for architects, building owners, and developers, encouraging the broader adoption of BIPV/T curtain wall technology in the construction industry. This study establishes a foundation for a novel switchable multi-inlet BIPV/T curtain wall system, demonstrating its superior thermal generation capabilities compared to fixed systems. An economic comparison indicates that the switchable BIPV/T system, while incurring a higher incremental cost than fixed systems, offers improved energy performance and a potentially acceptable payback period, particularly when financial incentives are applied.
This paper presents a simulation-driven investigation into the feasibility of a novel adaptive BIPV/T curtain wall system. As an early-stage design study, it aims to evaluate the theoretical performance and inform the development of a full-scale prototype. The findings offer insights into thermal–electric behavior and airflow control strategies, serving as a foundational step toward experimental implementation. This study is limited to simulation-based analysis of the system’s performance during the winter season (January to April), focused on heating-dominated climatic conditions in Montréal. These steady-state simulations under idealized assumptions were deliberately chosen to isolate key thermodynamic behaviors and evaluate the effectiveness of the proposed control strategies during periods of high heating demand. While the results clearly demonstrate the operational benefits of the switchable multi-inlet BIPV/T curtain wall system in cold weather, a comprehensive evaluation of real-world performance requires accounting for the dynamic nature of thermal systems. Future work will therefore include transient simulations to capture real-time system responsiveness, thermal inertia effects, and control logic performance under fluctuating environmental conditions. In addition, year-round simulations—including summer cooling scenarios—are necessary to assess the system’s full annual energy contribution and adaptability across seasons. Although the numerical model was validated using boundary conditions consistent with prior studies, experimental testing of a physical prototype under real-world conditions will be essential to confirm the system’s dynamic behavior, automation reliability, and long-term operational stability. These aspects will be addressed through the development of a full-scale prototype, extended seasonal simulations, and empirical performance testing in a controlled façade testbed environment.
Future work will involve developing and testing a prototype, conducting a year-long simulation, and integrating the system with energy solutions such as heat pumps or ERVs. These efforts aim to optimize and advance the system’s performance within the framework of sustainable building design and energy efficiency.
Author Contributions
Methodology, M.V. and A.-M.S.; Software, M.V.; Validation, A.-M.S.; Formal analysis, M.V.; Resources, A.B.; Data curation, M.V.; Writing—review & editing, M.V. and A.-M.S.; Supervision, A.K.A. and A.B.; Project administration, A.K.A. and A.B.; Funding acquisition, A.K.A. and A.B. All authors have read and agreed to the published version of the manuscript.
Funding
Concordia University: bursary number N00111.
Data Availability Statement
The data are in excel files, available if you request [simulation data] [https://drive.google.com/drive/folders/1EUYbkveuZ4382ubmj7PchD-faw82R444?usp=sharing].
Conflicts of Interest
The authors declare no conflict of interest.
Nomenclature
| A | Area [m2] |
| BAPV | Building-applied photovoltaic |
| BIPV | Building-integrated photovoltaic |
| BAPV/T | Building-applied photovoltaic/thermal |
| BIPV/T | Building-integrated photovoltaic/thermal |
| CHTC | Convective heat transfer coefficient |
| CV | Control volume |
| C | Specific heat of air [J/kg. °C] |
| D | Hydraulic diameter |
| G.t | Incident solar radiation [W/m2] |
| hc | Convective heat transfer [watt/m2·°C] |
| hr | Radiative heat transfer [watt/m2·°C] |
| HVAC | Heating, ventilation, and air conditioning |
| K | Conductivity of air [watt/m·°C] |
| m | Mass flow rate [m3/s] |
| Nu | Nusselt number |
| Pr | Prandtl |
| PF | Packing factor |
| PVF | Polyvinyl fluoride |
| q | Energy transmitted [W] |
| R | Resistance [°C/W] |
| RC | Resistance–capacitance |
| Re | Reynold number [–] |
| SA | Solar absorber |
| T | Temperature [°C] |
| UTC | Unglazed transpired collector |
| U | Conductive heat transfer [W/m2·K] |
| W | Width [m] |
| T_out | Air outlet temperature from the BIPV/T system [°C] |
| T_ma | Air temperature in the PV/T channel [°C] |
| Tsec. Inlet | Air temperature of the second or third inlet [°C] |
| msec.inlet | Air volumetric flow rate in the second or third inlet [m3/s] |
| T_PV | Temperature of the PV cells [°C] |
| T_Ref | Reference temperature for electrical efficiency [25 °C] |
| Greek symbols | |
| Δ | Variation |
| μ | Dynamic viscosity [Pa s] |
| ρ | Density [kg/m3] |
| ε | Emissivity |
| τ | Transmittance |
| α | Absorbance |
| R | Reflectance |
| η | Efficiency [–] |
| σ | Stefan Boltzmann constant [W·m−2·K −4] |
| Subscripts/superscripts | |
| b | Back layer (wall) |
| i | Indoor |
| In. | Internal |
| ma | Mean air temperature |
| o | Outdoor |
References
- Thirugnanasambandam, M.; Iniyan, S.; Goic, R. A review of solar thermal technologies. Renew. Sustain. Energy Rev. 2010, 14, 312–322. [Google Scholar] [CrossRef]
- Yang, T.; Athienitis, A.K. A study of design options for a building integrated photovoltaic/thermal (BIPV/T) system with glazed air collector and multiple inlets. Sol. Energy 2014, 104, 82–89. [Google Scholar] [CrossRef]
- Yang, S.; Cannavale, A.; Di Carlo, A.; Prasad, D.; Sproul, A.; Fiorito, F. Performance assessment of BIPV/T double-skin façade for various climate zones in Australia: Effects on energy consumption. Sol. Energy 2020, 199, 377–399. [Google Scholar] [CrossRef]
- Peng, C.; Huang, Y.; Wu, Z. Building-integrated photovoltaics (BIPV) in architectural design in China. Energy Build. 2011, 43, 3592–3598. [Google Scholar] [CrossRef]
- Verberne, G.; Bonomo, P.; Frontini, F.; Van Den Donker, M.N.; Chatzipanagi, A.; Sinapis, K.; Folkerts, W. BIPV Products for Façades and Roofs: A Market Analysis. In Proceedings of the 29th EU-PVSEC, Amsterdam, The Netherlands, 22–26 September 2014; pp. 3630–3636. [Google Scholar]
- Nagano, K.; Mochida, T.; Shimakura, K.; Murashita, K.; Takeda, S. Development of thermal-photovoltaic hybrid exterior wallboards incorporating PV cells in and their winter performances. Sol. Energy Mater. Sol. Cells 2003, 77, 265–282. [Google Scholar] [CrossRef]
- Assoa, Y.; Ménézo, C. Dynamic study of a new concept of photovoltaic–thermal hybrid collector. Sol. Energy 2014, 107, 637–652. [Google Scholar] [CrossRef]
- Amori, K.E.; Abd-AlRaheem, M.A. Field study of various air based photovoltaic/thermal hybrid solar collectors. Renew. Energy 2014, 63, 402–414. [Google Scholar] [CrossRef]
- Hegazy, A.A. Comparative study of the performances of four photovoltaic/thermal solar air collectors. Energy Convers. Manag. 2000, 41, 861–881. [Google Scholar] [CrossRef]
- Bandaru, S.H.; Becerra, V.; Khanna, S.; Radulovic, J.; Hutchinson, D.; Khusainov, R. A Review of Photovoltaic Thermal (PVT) Technology for Residential Applications: Performance Indicators, Progress, and Opportunities. Energies 2021, 14, 3853. [Google Scholar] [CrossRef]
- Rad, H.M.; Ameri, M. Energy and exergy study of unglazed transpired collector-2stage. Sol. Energy 2016, 132, 570–586. [Google Scholar] [CrossRef]
- Rukman, N.S.B.; Fudholi, A.; Taslim, I.; Indrianti, M.A.; Manyoe, I.N.; Lestari, U.; Sopian, K. Electrical and thermal efficiency of air-based photovoltaic thermal (PVT) systems: An overview. Indones. J. Electr. Eng. Comput. Sci. 2019, 14, 1134–1140. [Google Scholar] [CrossRef]
- Charron, R.; Athienitis, A.K. Optimization of the performance of double-façades with integrated photovoltaic panels and motorized blinds. Sol. Energy 2006, 80, 482–491. [Google Scholar] [CrossRef]
- Kargaran, M.; Goshayeshi, H.R.; Pourpasha, H.; Chaer, I.; Heris, S.Z. An extensive review on the latest developments of using oscillating heat pipe on cooling of photovoltaic thermal system. Therm. Sci. Eng. Prog. 2022, 36, 101489. [Google Scholar] [CrossRef]
- Yang, H.; Liu, X.; Wang, C.; Shen, C.; Han, R.; Kalogirou, S.A.; Wang, J. Investigation on the heating performance of a BIPV/T façade coupled with direct-expansion heat pump system in severe cold region. Renew. Energy 2024, 232, 121065. [Google Scholar] [CrossRef]
- Khudadad, A.K.; Saleh, F.A.; Kasim, N.K. Photovoltaic/Thermal (PV/T) System Direct Contact Type: A Review. J. Eng. Sustain. Dev. 2022, 26, 53–67. [Google Scholar] [CrossRef]
- Yang, T.; Athienitis, A.K. Experimental investigation of a two-inlet air-based building integrated photovoltaic/thermal (BIPV/T) system. Appl. Energy 2015, 159, 70–79. [Google Scholar] [CrossRef]
- Chen, Z.; Utaberta, N.; Seghier, T.E. Optimal Semi-Transparent Photovoltaic (STPV) window based on energy performance, daylighting quality, and occupant satisfaction—A case study of private office in Chengdu China. Energy Build. 2024, 319, 114502. [Google Scholar] [CrossRef]
- Shahsavar, A.; Ameri, M. Experimental investigation and modeling of a direct-coupled PV/T air collector. Sol. Energy 2010, 84, 1938–1958. [Google Scholar] [CrossRef]
- Rounis, E.D.; Athienitis, A.; Stathopoulos, T. Review of air-based PV/T and BIPV/T systems—Performance and modelling. Renew. Energy 2021, 163, 1729–1753. [Google Scholar] [CrossRef]
- El-Sebaii, A.; Aboul-Enein, S.; Ramadan, M.; Shalaby, S.; Moharram, B. Thermal performance investigation of double pass-finned plate solar air heater. Appl. Energy 2011, 88, 1727–1739. [Google Scholar] [CrossRef]
- Omojaro, A.; Aldabbagh, L. Experimental performance of single and double pass solar air heater with fins and steel wire mesh as absorber. Appl. Energy 2010, 87, 3759–3765. [Google Scholar] [CrossRef]
- Dhiman, P.; Thakur, N.; Kumar, A.; Singh, S. An analytical model to predict the thermal performance of a novel parallel flow packed bed solar air heater. Appl. Energy 2011, 88, 2157–2167. [Google Scholar] [CrossRef]
- Promvonge, P.; Khanoknaiyakarn, C.; Kwankaomeng, S.; Thianpong, C. Thermal behavior in solar air heater channel fitted with combined rib and delta-winglet. Int. Commun. Heat Mass Transf. 2011, 38, 749–756. [Google Scholar] [CrossRef]
- Tonui, J.; Tripanagnostopoulos, Y. Performance improvement of PV/T solar collectors with natural air flow operation. Sol. Energy 2008, 82, 1–12. [Google Scholar] [CrossRef]
- Wanjiku Mugo, S. Performance Analysis of Single Pass PV/T Air System. Master’s Thesis, School of Chemical and Process Engineering, University of Leeds, Leeds, UK, 2018. [Google Scholar]
- Kang, Z.; Lu, Z.; Song, G.; Yao, Q. A Numerical Study of Dual-Inlet Air-Cooled PV/T Solar Collectors with Various Airflow Channel Configurations. Sustainability 2022, 14, 9897. [Google Scholar] [CrossRef]
- Herrando, M.; Ramos, A. Photovoltaic-Thermal (PV-T) Systems for Combined Cooling, Heating and Power in Buildings: A Review. Energies 2022, 15, 3021. [Google Scholar] [CrossRef]
- Syafaruddin; Sari, Y.A.; Said, S.M. A Review of Building Integrated Photovoltaic-Thermal (BIPV/T) Systems: Current and Potential Technology Development. J. Eng. Sci. Technol. Rev. 2021, 14, 197–206. [Google Scholar] [CrossRef]
- Haghighi, Z.; Dehnavi, M.A.; Konstantinou, T.; Dobbelsteen, A.v.D.; Klein, T. Architectural Photovoltaic Applications: Lessons Learnt and Perceptions from Architects. Buildings 2021, 11, 62. [Google Scholar] [CrossRef]
- Rounis, E.D.; Athienitis, A.K.; Stathopoulos, T. Multiple-inlet Building Integrated Photovoltaic/Thermal system modelling under varying wind and temperature conditions. Sol. Energy 2016, 139, 157–170. [Google Scholar] [CrossRef]
- Athienitis, A.K.; Barone, G.; Buonomano, A.; Palombo, A. Assessing active and passive effects of façade building integrated photovoltaics/thermal systems: Dynamic modelling and simulation. Appl. Energy 2018, 209, 355–382. [Google Scholar] [CrossRef]
- Corbin, C.D.; Zhai, Z.J. Experimental and numerical investigation on thermal and electrical performance of a building integrated photovoltaic–thermal collector system. Energy Build. 2010, 42, 76–82. [Google Scholar] [CrossRef]
- Tiwari, G.; Saini, H.; Tiwari, A.; Deo, A.; Gupta, N.; Saini, P.S. Periodic theory of building integrated photovoltaic thermal (BiPVT) system. Sol. Energy 2016, 125, 373–380. [Google Scholar] [CrossRef]
- Menon, E.S. Transmission Pipeline Calculations and Simulations Manual; Gulf Professional Publishing: Waltham, MA, USA, 2015; ISBN 978-1-85617-830-3. [Google Scholar]
- Saelens, D. Energy Performance Assessment of Single Storey Multiple-Skin Facades. 2002. Available online: https://api.semanticscholar.org/CorpusID:113919479 (accessed on 5 August 2025).
- Rounis, E.D.; Ioannidis, Z.; Sigounis, A.-M.; Athienitis, A.; Stathopoulos, T. A novel approach for the modelling of convective phenomena for building integrated photovoltaic thermal (BIPV/T) systems. Sol. Energy 2022, 232, 328–343. [Google Scholar] [CrossRef]
- Anderson, T.; Duke, M.; Morrison, G.; Carson, J. Performance of a building integrated photovoltaic/thermal (BIPVT) solar collector. Sol. Energy 2009, 83, 445–455. [Google Scholar] [CrossRef]
- Palyvos, J. A survey of wind convection coefficient correlations for building envelope energy systems’ modeling. Appl. Therm. Eng. 2008, 28, 801–808. [Google Scholar] [CrossRef]
- Ahmed-Dahmane, M.; Malek, A.; Zitoun, T. Design and analysis of a BIPV/T system with two applications controlled by an air handling unit. Energy Convers. Manag. 2018, 175, 49–66. [Google Scholar] [CrossRef]
- Liu, X. Exploration of Intelligent HVAC Operation Strategies for Office Buildings. 2020. Available online: https://api.semanticscholar.org/CorpusID:234552863 (accessed on 5 August 2025).
- Candanedo, J.; Dehkord, V.R. Simulation of Model-based Predictive Control Applied to a Solar assisted Cold Climate Heat Pump System. In Proceedings of the International High Performance Buildings Conference, West Lafayette, IN, USA, 14–17 July 2014; p. 149. [Google Scholar]
Disclaimer/Publisher’s Note: The statements, opinions and data contained in all publications are solely those of the individual author(s) and contributor(s) and not of MDPI and/or the editor(s). MDPI and/or the editor(s) disclaim responsibility for any injury to people or property resulting from any ideas, methods, instructions or products referred to in the content. |
© 2025 by the authors. Licensee MDPI, Basel, Switzerland. This article is an open access article distributed under the terms and conditions of the Creative Commons Attribution (CC BY) license (https://creativecommons.org/licenses/by/4.0/).