Abstract
This study presents a comprehensive evaluation of miscible gas injection (MGI) strategies for enhanced oil recovery (EOR) in high-salinity reservoirs, with a focus on the Raleigh Oil Field. Using a calibrated Equation of State (EOS) model in CMG WinProp™, eight gas injection scenarios were simulated to assess phase behavior, miscibility, and swelling factors. The results indicate that carbon dioxide (CO2) and enriched separator gas offer the most technically and economically viable options, with CO2 demonstrating superior swelling performance and lower miscibility pressure requirements. The findings underscore the potential of CO2-EOR as a sustainable and effective recovery method in pressure-depleted, high-salinity environments.
1. Introduction
The global energy landscape continues to rely heavily on hydrocarbon resources, necessitating the development of advanced recovery techniques to extract remaining oil from mature and challenging reservoirs. Among tertiary recovery methods, miscible gas injection (MGI) has emerged as a highly effective Enhanced Oil Recovery (EOR) strategy, particularly in light and medium oil reservoirs. MGI involves injecting gases such as carbon dioxide (CO2), nitrogen (N2), or hydrocarbon-rich gases into the reservoir at pressures exceeding the minimum miscibility pressure (MMP), enabling the gas and oil to mix into a single phase. This miscibility eliminates interfacial tension and significantly enhances oil displacement efficiency [1,2].
The determination of MMP is essential for optimizing EOR processes. According to Song et al. [3], MMP can be determined through two primary approaches: experimental and theoretical methods. Experimental techniques such as the slim tube test (STT), rising bubble apparatus (RBA), and vanishing interfacial tension (VIT) are widely used in laboratory settings [4]. Among them, STT is considered the most accurate and reliable, though it is time-consuming and costly. RBA and VIT offer faster and more economical alternatives but are more susceptible to human error and experimental limitations [5,6].
Theoretical calculation methods are increasingly favored for their cost-effectiveness and ability to estimate MMP dynamically during reservoir development. These include empirical correlations, artificial intelligence algorithms, and the Equation of State (EOS) approach. EOS methods are particularly valued in the oil industry for their ability to simulate phase behavior in complex multicomponent systems. Models such as the van der Waals, Redlich–Kwong (RK), Soave–Redlich–Kwong (SRK), and Peng–Robinson (PR) equations are based on thermodynamic principles and phase equilibrium theory [3]. They classify crude oil components into light (C1), intermediate (C2–C6), and heavy (C7+) fractions and use parameters like temperature, pressure, and molecular interactions to predict MMP [7].
Among these, the Peng–Robinson EOS (PR-EOS) is particularly noted for its improved accuracy in predicting fluid densities and phase behavior in systems with polar components. While EOS models offer a practical and relatively accurate alternative to experimental methods, they require iterative computation and may be less sensitive to variations in crude oil composition and reservoir conditions. Despite these limitations, EOS-based approaches remain a cornerstone in MMP prediction due to their balance of accuracy, flexibility, and computational efficiency [8].
MMP is a critical parameter in MGI for EOR processes. While MGI has been extensively applied in conventional reservoirs, its application in high-salinity reservoirs presents both challenges and opportunities. High-salinity environments, characterized by elevated concentrations of dissolved salts in formation water, can adversely affect rock wettability, fluid flow, and chemical interactions. These conditions often reduce the effectiveness of water-based EOR methods, such as polymer or surfactant flooding, due to issues like polymer degradation and surfactant precipitation. In contrast, gas-based methods like MGI are less sensitive to salinity, making them a promising alternative [9].
Recent studies have demonstrated the potential of MGI in high-salinity settings. Davarpanah et al. [1] found that rich gas injection outperformed lean gas and CO2 in a naturally fractured, high-salinity reservoir, achieving the highest oil recovery due to superior miscibility and delayed gas breakthrough. Pourhadi and Fath [10] showed that CO2 injection achieved full miscibility across a compositionally graded reservoir, with water-alternating-gas (WAG) injection further enhancing sweep efficiency. Wei et al. [11] observed that while CO2 injection improved sweep efficiency in carbonate reservoirs, it also triggered asphaltene instability, necessitating careful monitoring and chemical treatment. Based on recent advances in micro-nano bubble science have revealed that salinity plays a critical role in modulating gas–liquid interfacial behavior, Jia et al. [12] demonstrated that salt ions influence CO2 dissolution, bubble stability, and interfacial tension through complex ion–interface interactions. These effects are particularly pronounced in high-salinity environments, where ionic strength alters the zeta potential and rheological properties of the gas–liquid interface.
The choice of gas and injection strategy plays a critical role in determining the success of MGI. CO2 is widely favored due to its high solubility in oil, ability to swell the oil phase, and relatively low MMP requirements [13]. However, other gases such as methane, nitrogen, and hydrocarbon mixtures have also been explored. Masalmeh et al. [14] highlighted that CO2 and rich gas injections were more effective than lean gas in heterogeneous carbonate reservoirs, particularly under high-salinity conditions. Al-Bayati et al. [15] confirmed that miscible CO2 injection consistently outperformed immiscible scenarios in sandstone formations with varying salinity levels.
To optimize MGI performance, advanced modeling and predictive tools have been developed. Chen et al. [16] introduced a machine learning model that accurately predicts MMP by incorporating variables such as salinity, temperature, and oil composition. This enables more precise design and implementation of gas injection projects. Masalmeh et al. [14] and Ebadati et al. [17] emphasized the effectiveness of rich gas and WAG injection strategies in improving sweep efficiency and delaying gas breakthroughs in high-salinity carbonate and fractured reservoirs.
Recent advances in confined fluid phase behavior have highlighted the effect of different parameters on MGI. Chen et al. [18] developed a three-phase equilibrium algorithm that incorporates capillary pressure and critical point shifts, demonstrating that confinement suppresses phase regions and alters miscibility conditions in shale reservoirs. Similarly, Yang et al. [19] extended the Peng–Robinson equation of state to account for molecule-wall interactions and capillary effects, showing significant deviations in bubble-point pressures and phase envelopes for unconventional fluids. These studies provide a microscopic theoretical foundation for optimizing MGI strategies in high-salinity porous reservoirs.
MGI represents a viable and adaptable EOR strategy for high-salinity reservoirs. Its ability to overcome the limitations of water-based methods and adapt to complex reservoir conditions makes it a focal point of current research and field development. This paper aims to explore various MGI scenarios, evaluate their effectiveness in high-salinity reservoir located in Raleigh Field, and identify best practices for maximizing oil recovery while mitigating associated risks. The Raleigh Field, located in Smith County, Mississippi—approximately 50 miles southeast of Jackson—was discovered in January 1957 by the California Company and commenced production in March 1958. Oil is produced from a sandstone reservoir at an average depth of 12,600 feet. The field covers an area of approximately 40 acres, with an average porosity of 12% and permeability of 34 millidarcies.
At the onset of production, the reservoir exhibited an initial pressure of 5783 psig and a temperature of 258 °F, supported by a weak natural water drive. The initial water saturation was calculated at 42.3%, with a water density of 77.38 lb/ft3 and a salinity of 283,700 ppm. The reservoir’s saturation pressure was determined to be 3250 psi. Within just 1.5 years of production, reservoir pressure declined sharply from 5783 psig to below 3500 psig [20].
Conventional water flooding, typically employed for pressure maintenance, was deemed unsuitable for the Raleigh Field due to the high formation water salinity, which posed a significant risk of scaling. As a result, CO2 injection emerged as a more promising alternative. This study presents a simulation-based evaluation of the CO2-EOR method for the Raleigh Field, focusing on its potential to stabilize reservoir pressure and enhance oil recovery.
2. Methodology
This study presents a numerical investigation of eight gas injection scenarios for EOR using an Equation of State (EOS) model developed in CMG WinProp™. The simulations evaluate phase behavior under varying pressure conditions to assess the performance of different injection gases. The scenarios include the injection of methane (CH4), nitrogen (N2), liquefied petroleum gas (LPG), CO2-propane mixtures, methane-propane blends, and separator-produced (enriched) gas, with carbon dioxide (CO2) serving as the baseline for comparison.
The modeling approach enables a comprehensive analysis of phase behavior, miscibility, and swelling factors associated with each gas type when injected into the Raleigh reservoir. The methodology involves constructing a fluid model, determining saturation pressures, and performing miscibility and swelling factor calculations at multiple pressure levels (1000, 1500, 2000, and 2500 psi) to identify optimal injection conditions relative to CO2.
CMG WinProp™ is employed to develop and calibrate the PVT model for the Raleigh field, using available experimental data such as Constant Composition Expansion, Differential Liberation (DL), and separator tests, along with the fluid composition and C7+ properties (as detailed in Table 1). Following regression analysis and EOS model tuning, updated component properties are used to conduct two-phase flash calculations at reservoir pressures ranging from the saturation pressure of 3250 psia down to 1000 psi.

Table 1.
Composition of reservoir fluid with C7+ properties.
The eight gas injection scenarios evaluated in this study are:
- Pure Carbon Dioxide (CO2);
- 50% CO2/50% Propane (C3H8);
- Pure Methane (CH4);
- Pure Nitrogen (N2);
- Liquefied Petroleum Gas (LPG: 40% C3H8, 60% C4H10);
- Methane–Propane Blend (80/20);
- Methane–Propane Blend (60/40);
- Separator Produced Gas (Enriched Gas).
For each scenario, the updated EOS model in CMG WinProp™ is used to calculate the MMP and swelling factors at the specified pressures. A comparative analysis is then conducted to evaluate the effectiveness of each gas relative to CO2, highlighting the potential of CO2 injection for EOR in the Raleigh oil field.
3. Results and Discussion
The dataset utilized in this study comprises experimental results from Constant Composition Expansion tests (Table 2), Differential Liberation tests (Table 3), and separator tests (Table 4). An EOS model was developed using CMG WinProp™, incorporating the aforementioned experimental data. The saturation pressure for the Raleigh field was determined to be 3250 psia. A regression process was conducted to align the EOS model with the experimental observations, following the methodology outlined in the CMG WinProp™ User’s Guide [21].
Table 2.
Constant composition Expansion values of reservoir fluid sample from Raleigh Oil Field.
Table 3.
Differential liberation data for reservoir fluid sample from Raleigh Oil Field.
Table 4.
Separator tests of reservoir fluid sample from Raleigh Oil Field.
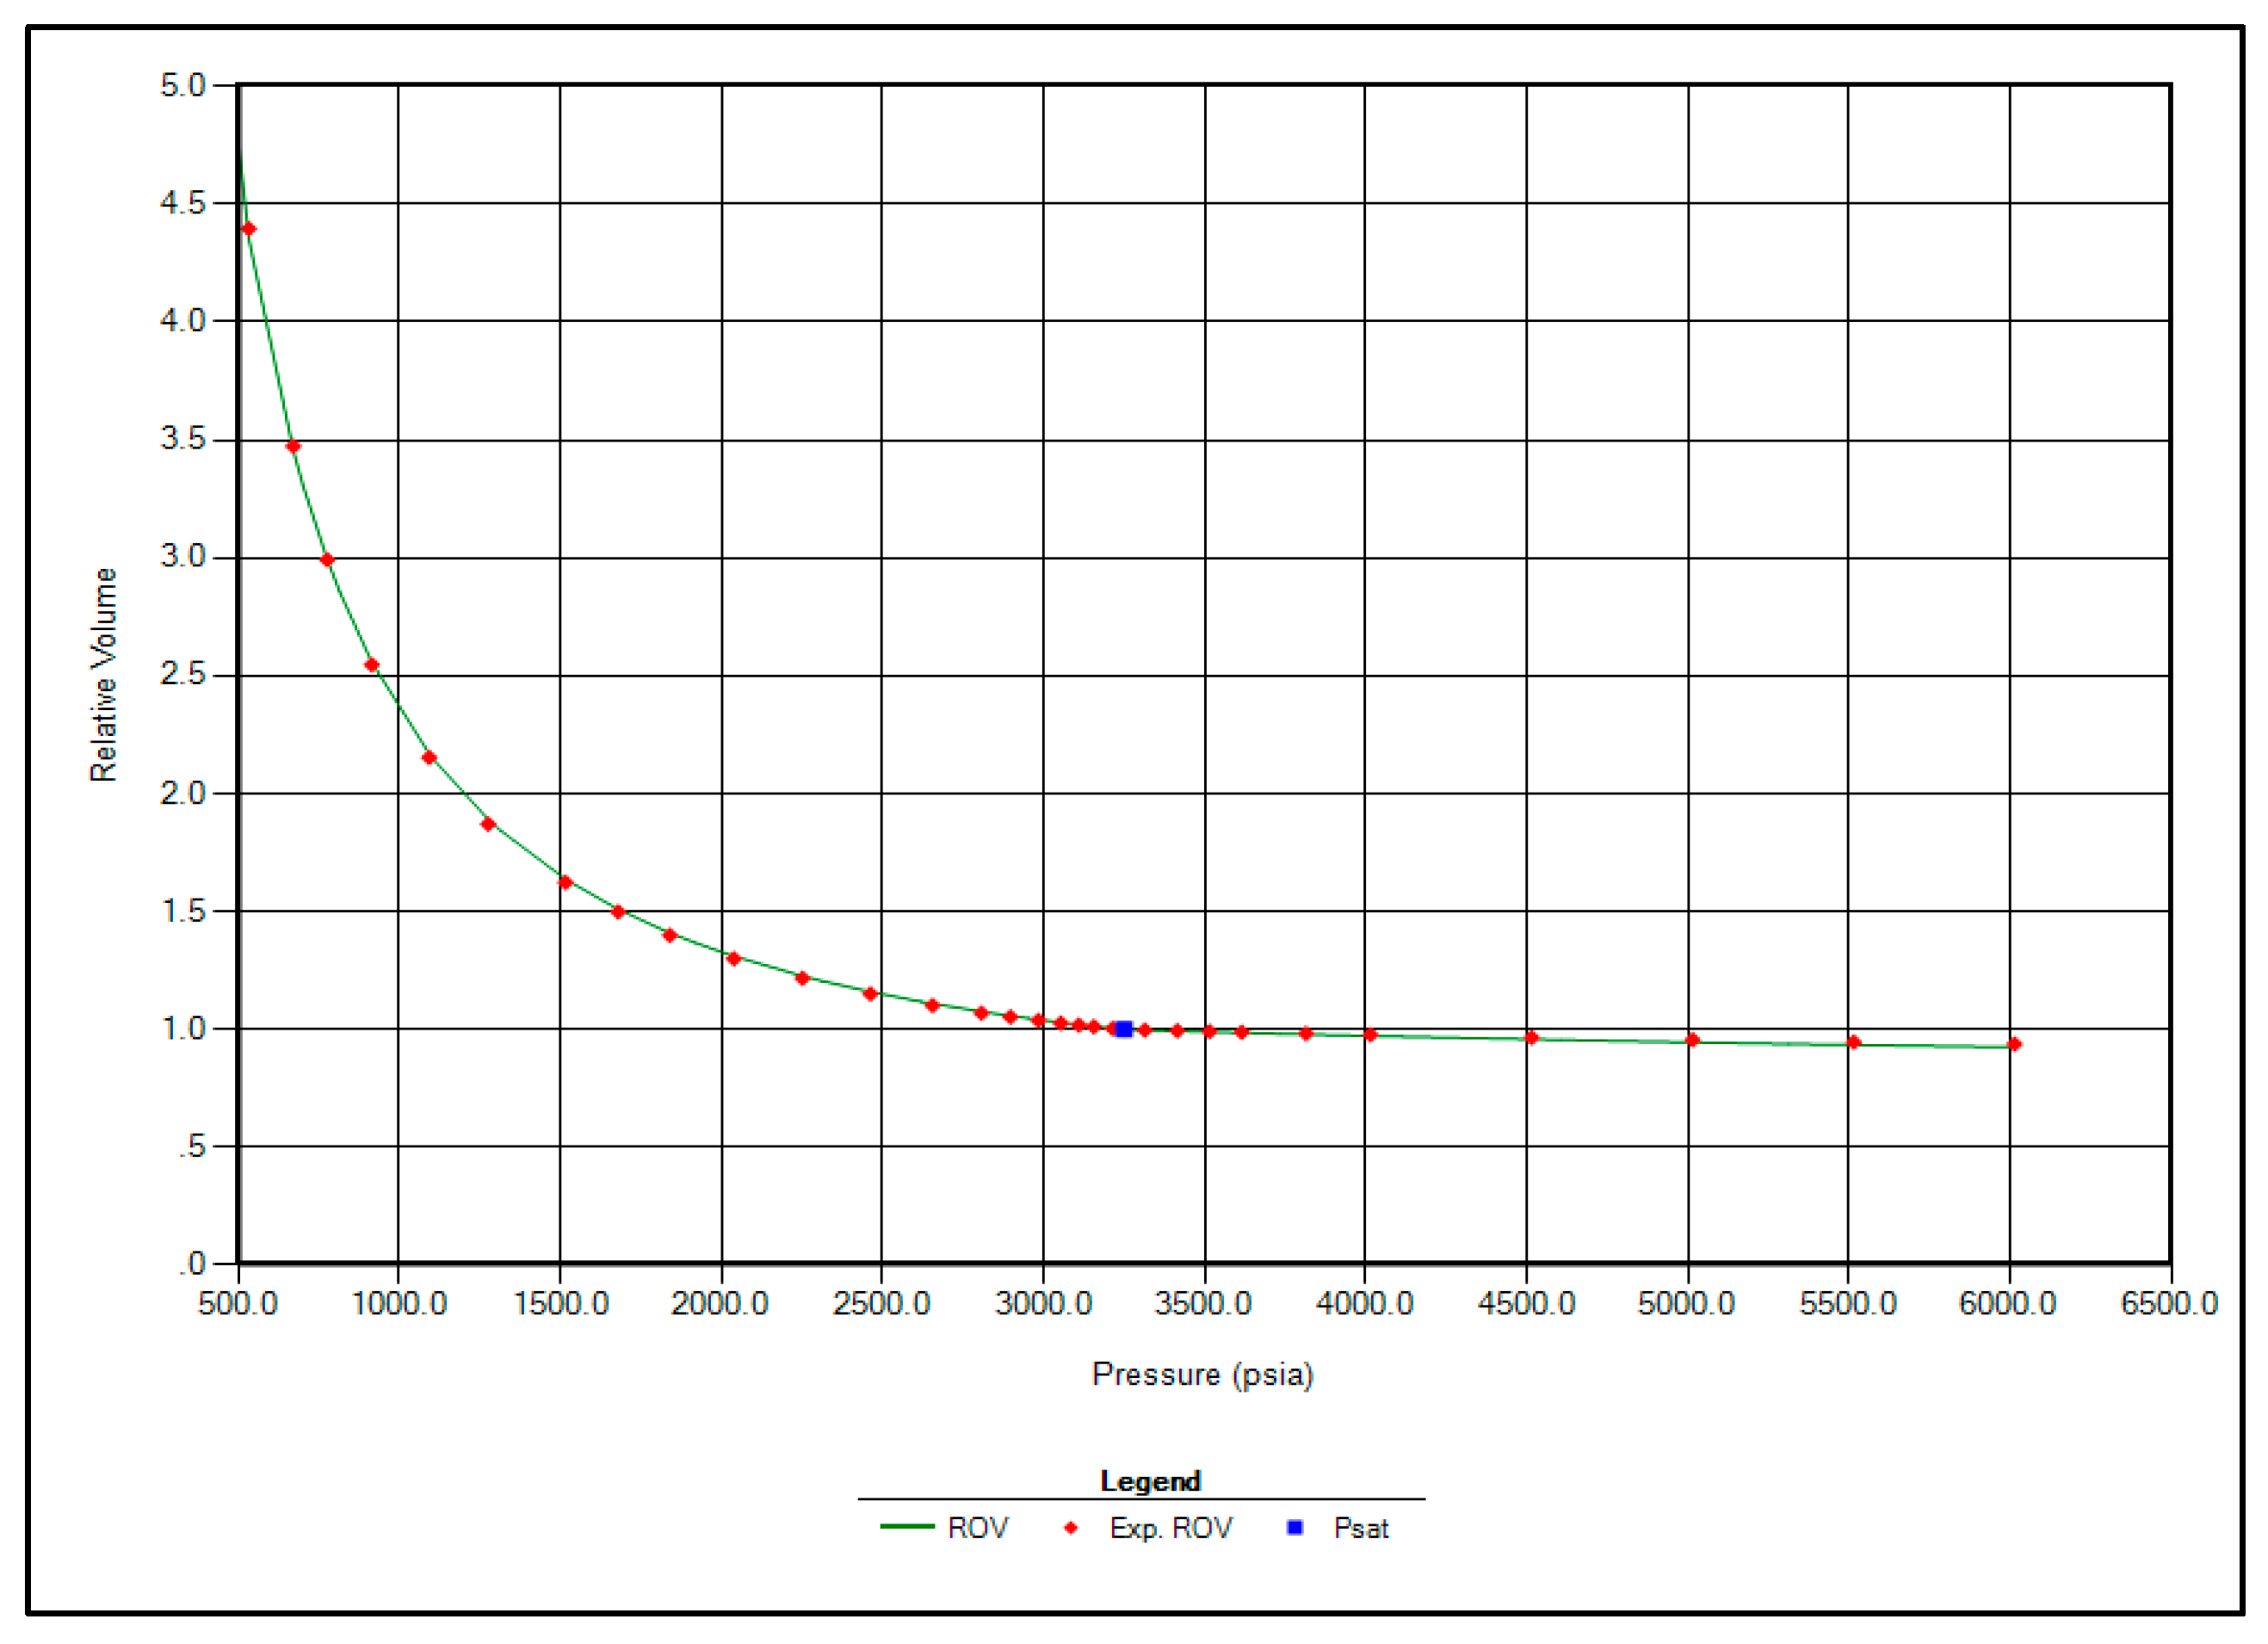
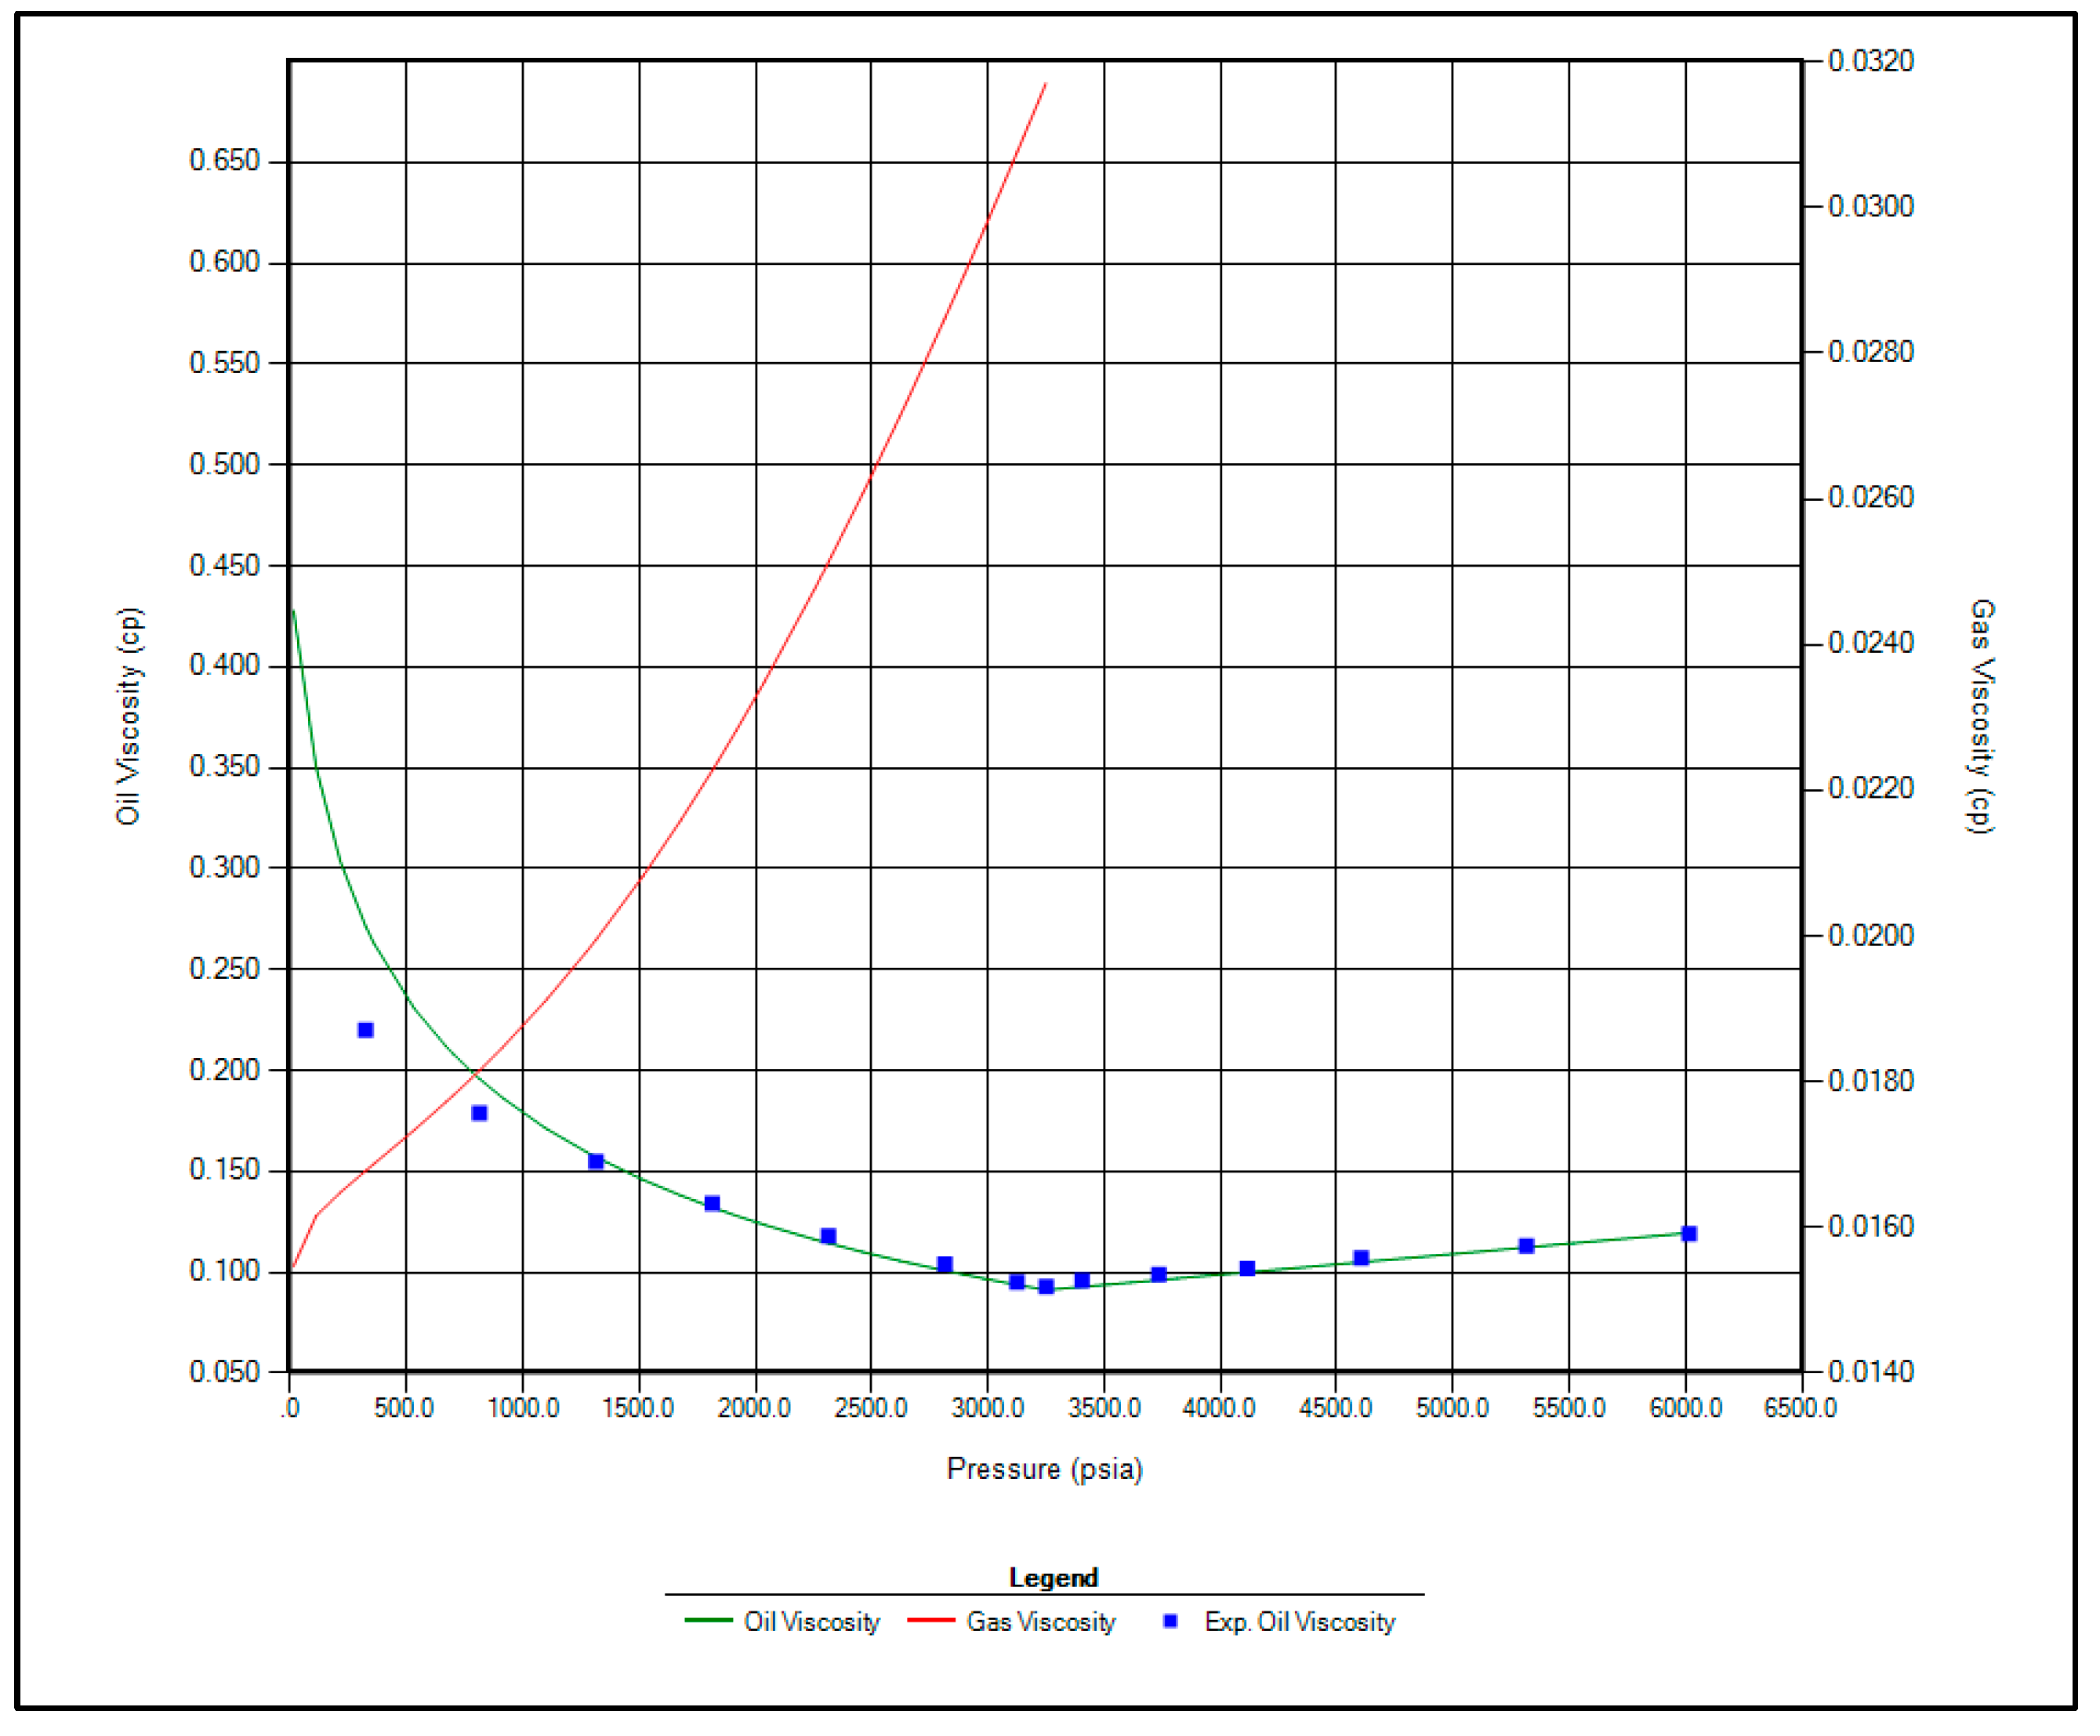
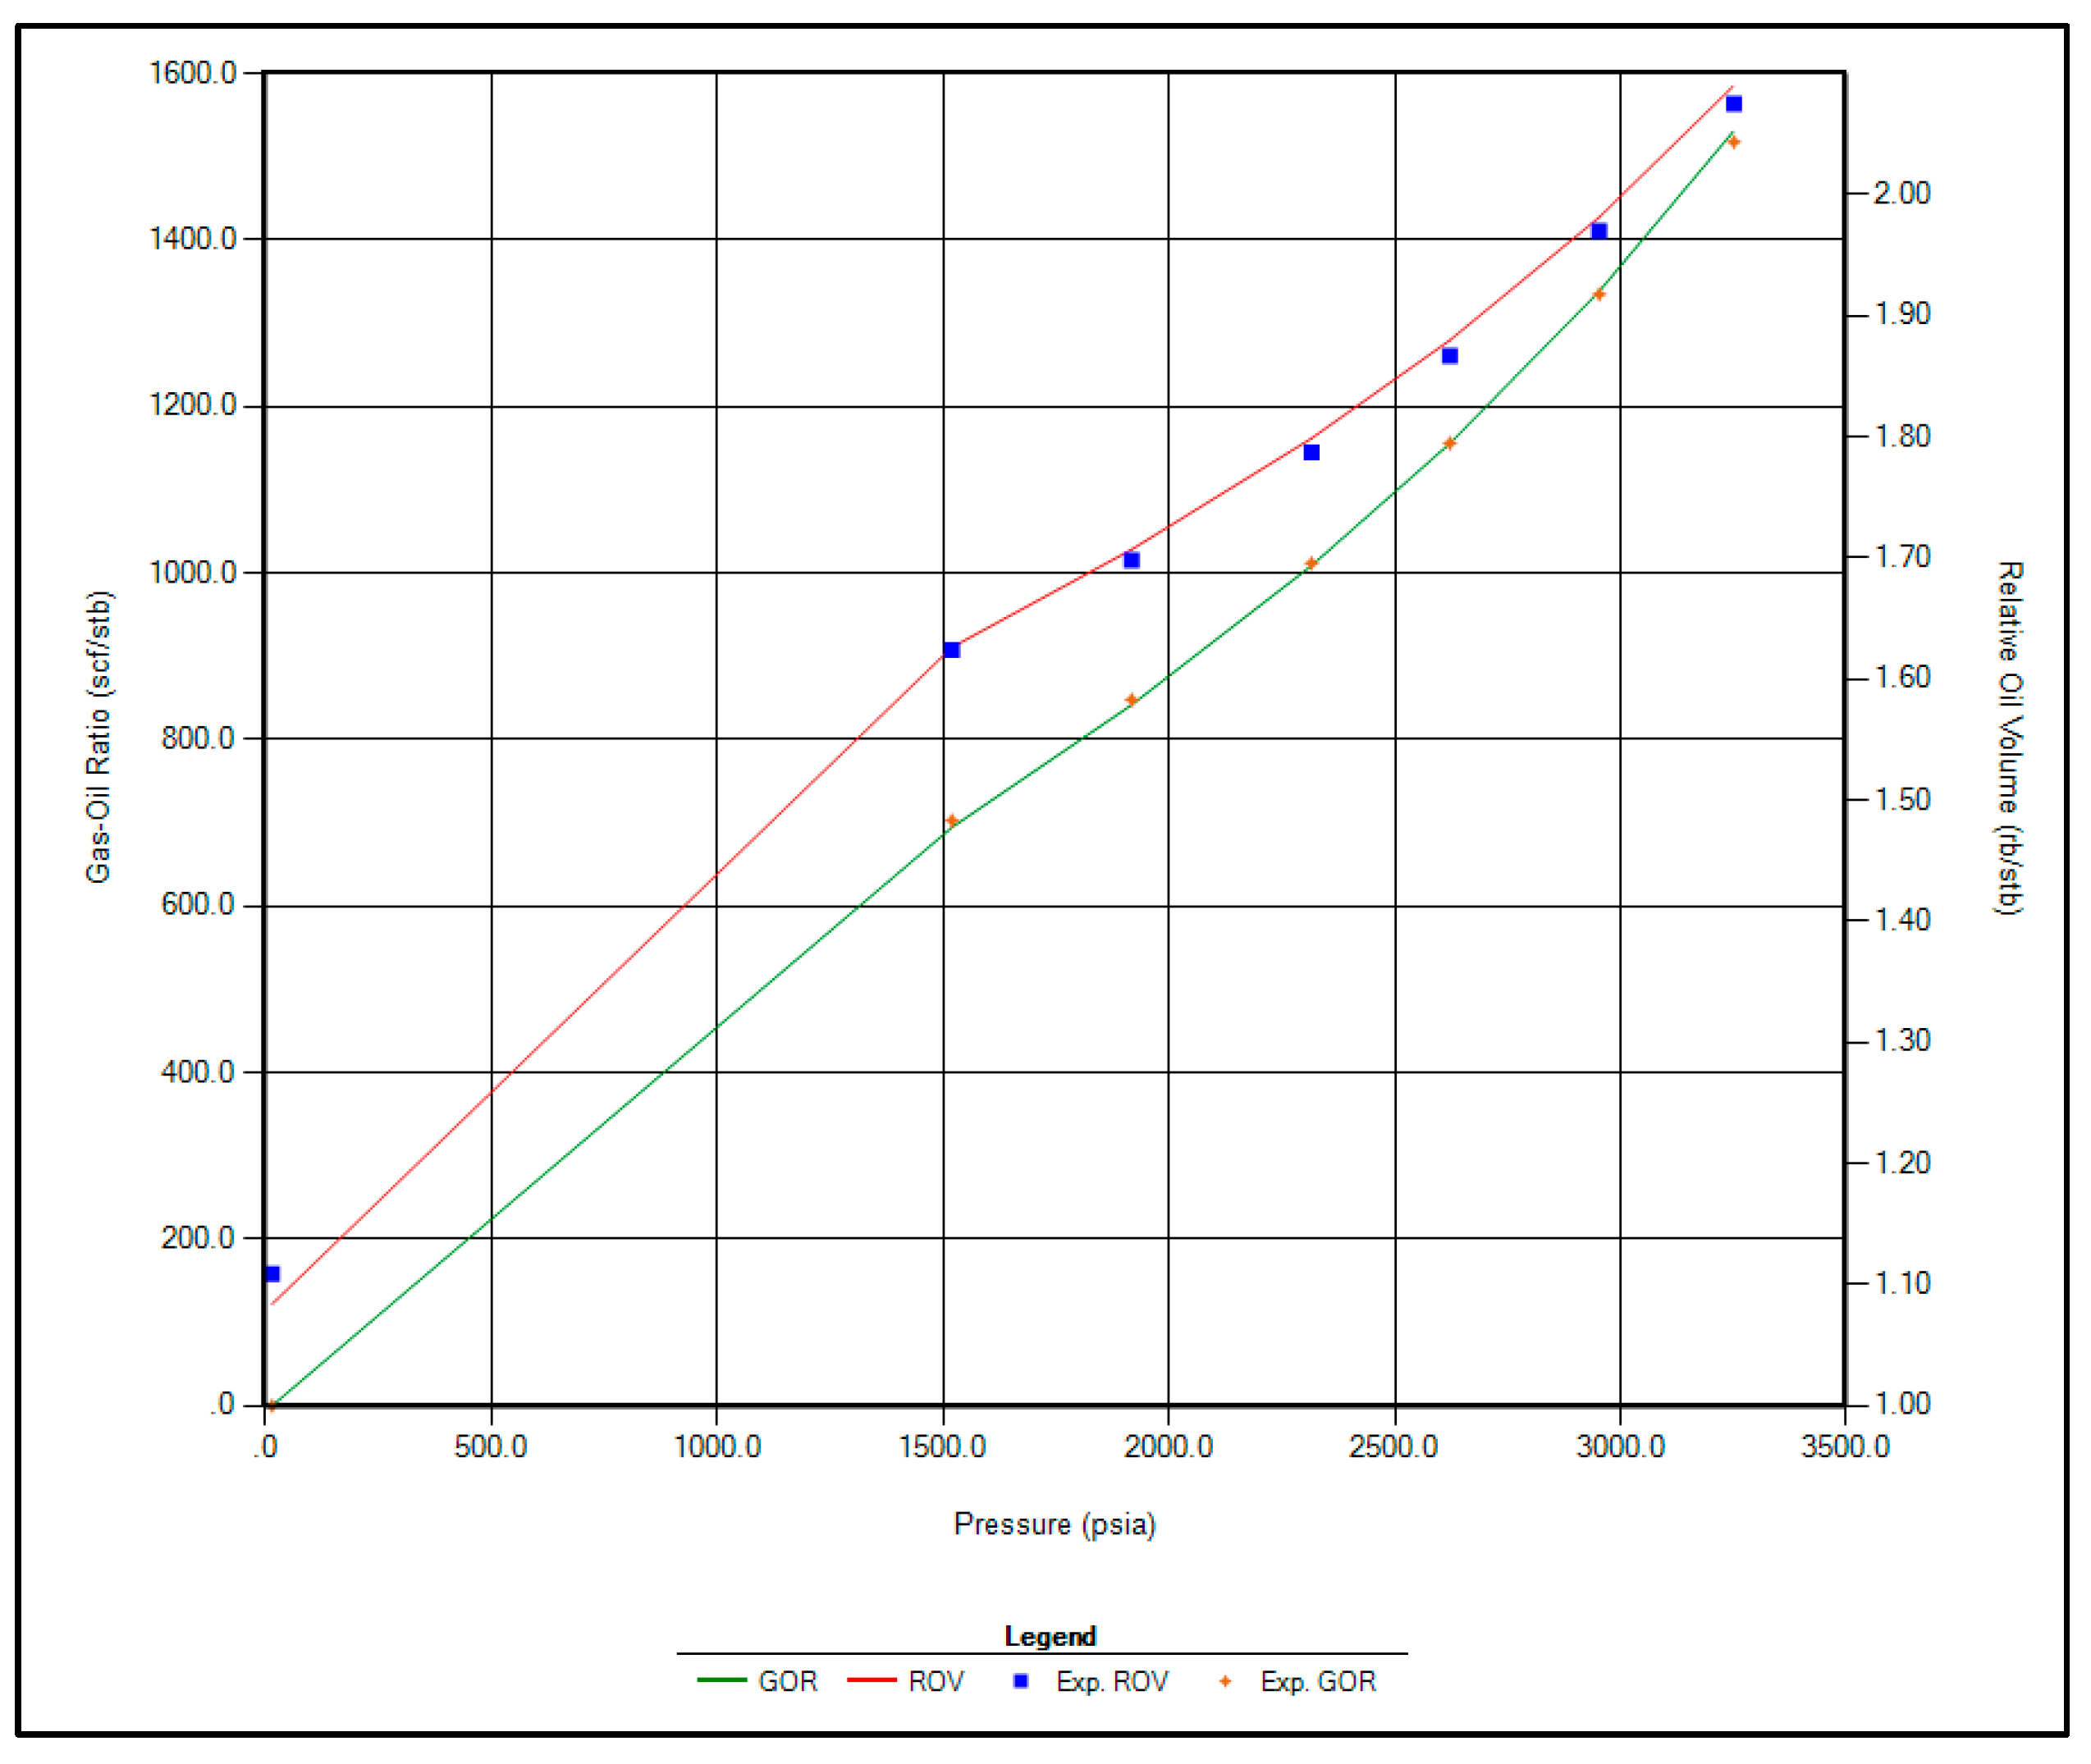
The regression parameters adjusted in this study include the critical pressure, critical temperature, acentric factor, and molecular weight of the C7+ fraction. Additionally, the omega A and omega B parameters for methane, as well as volume shift coefficients for CO2, N2, and CH4, were tuned. All available options for viscosity regression were also activated to enhance model accuracy. Figure 1, Figure 2, Figure 3 and Figure 4 illustrate a strong correlation between the predictions of the Peng–Robinson EOS and the experimental field data, demonstrating the robustness and reliability of the developed model.
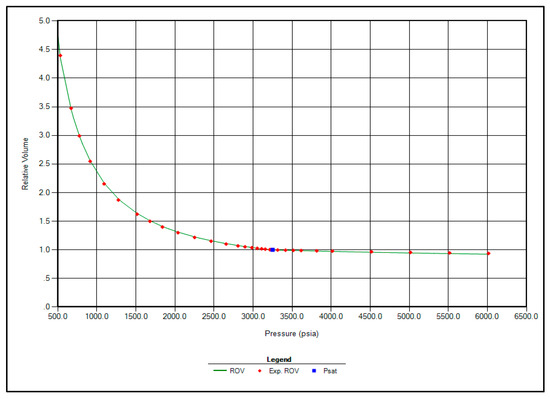
Figure 1.
Matching between actual date and EOS modeling for Relative Volume.
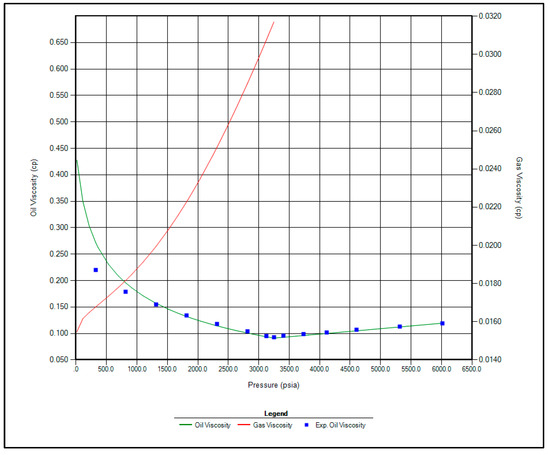
Figure 2.
Matching between actual date and EOS modeling for Oil Viscosity.
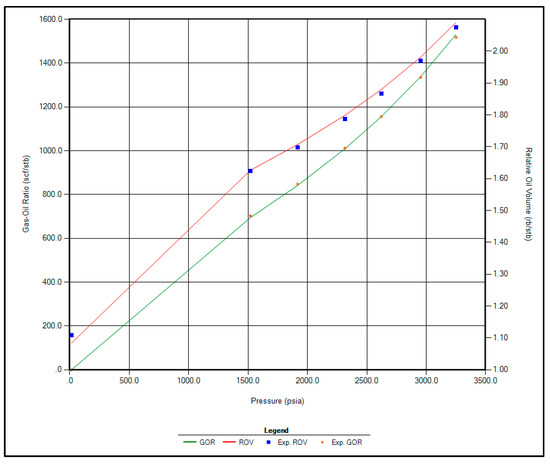
Figure 3.
Matching between actual date and EOS modeling for GOR and Relative Oil Volume.
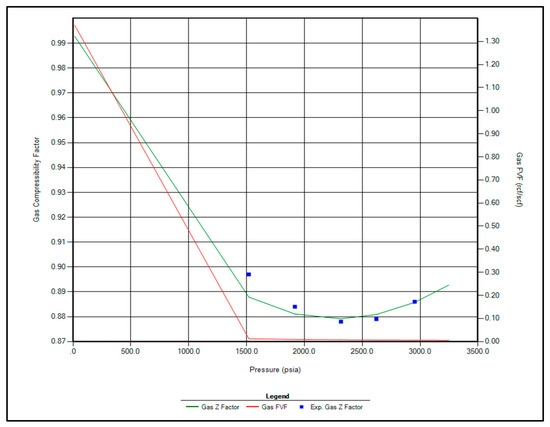
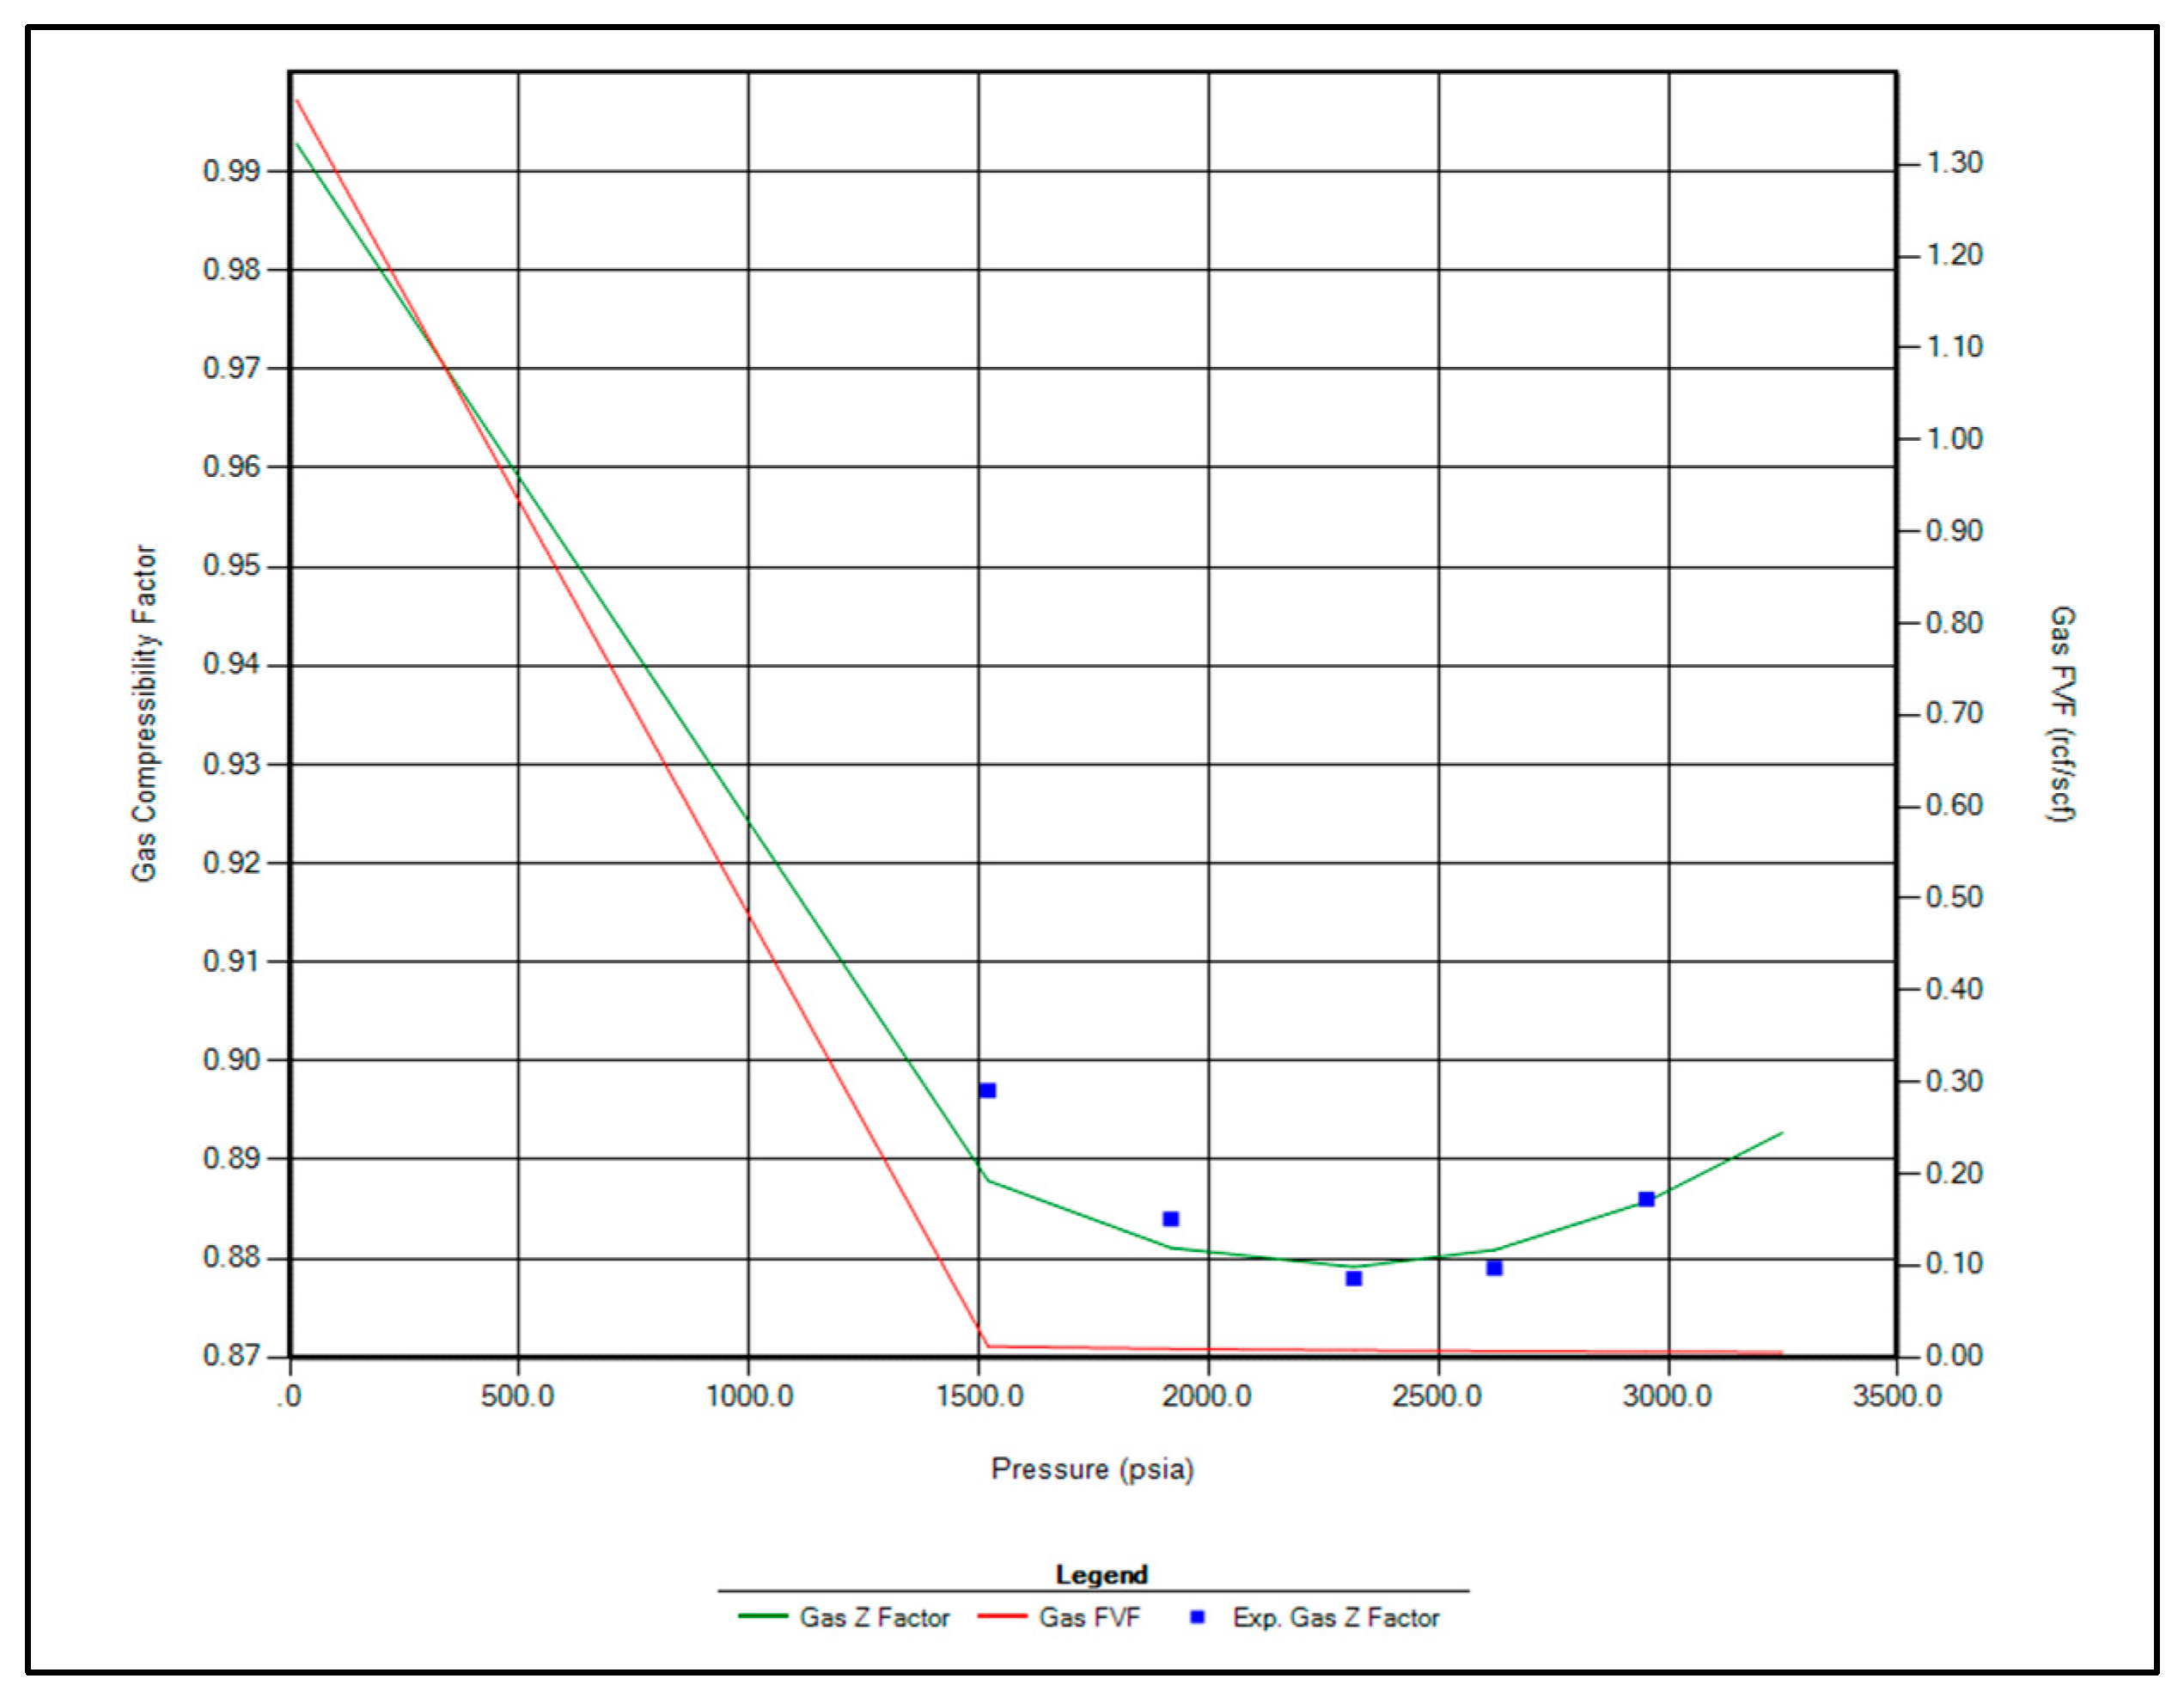
Figure 4.
Matching between actual date and EOS modeling for Z factor.
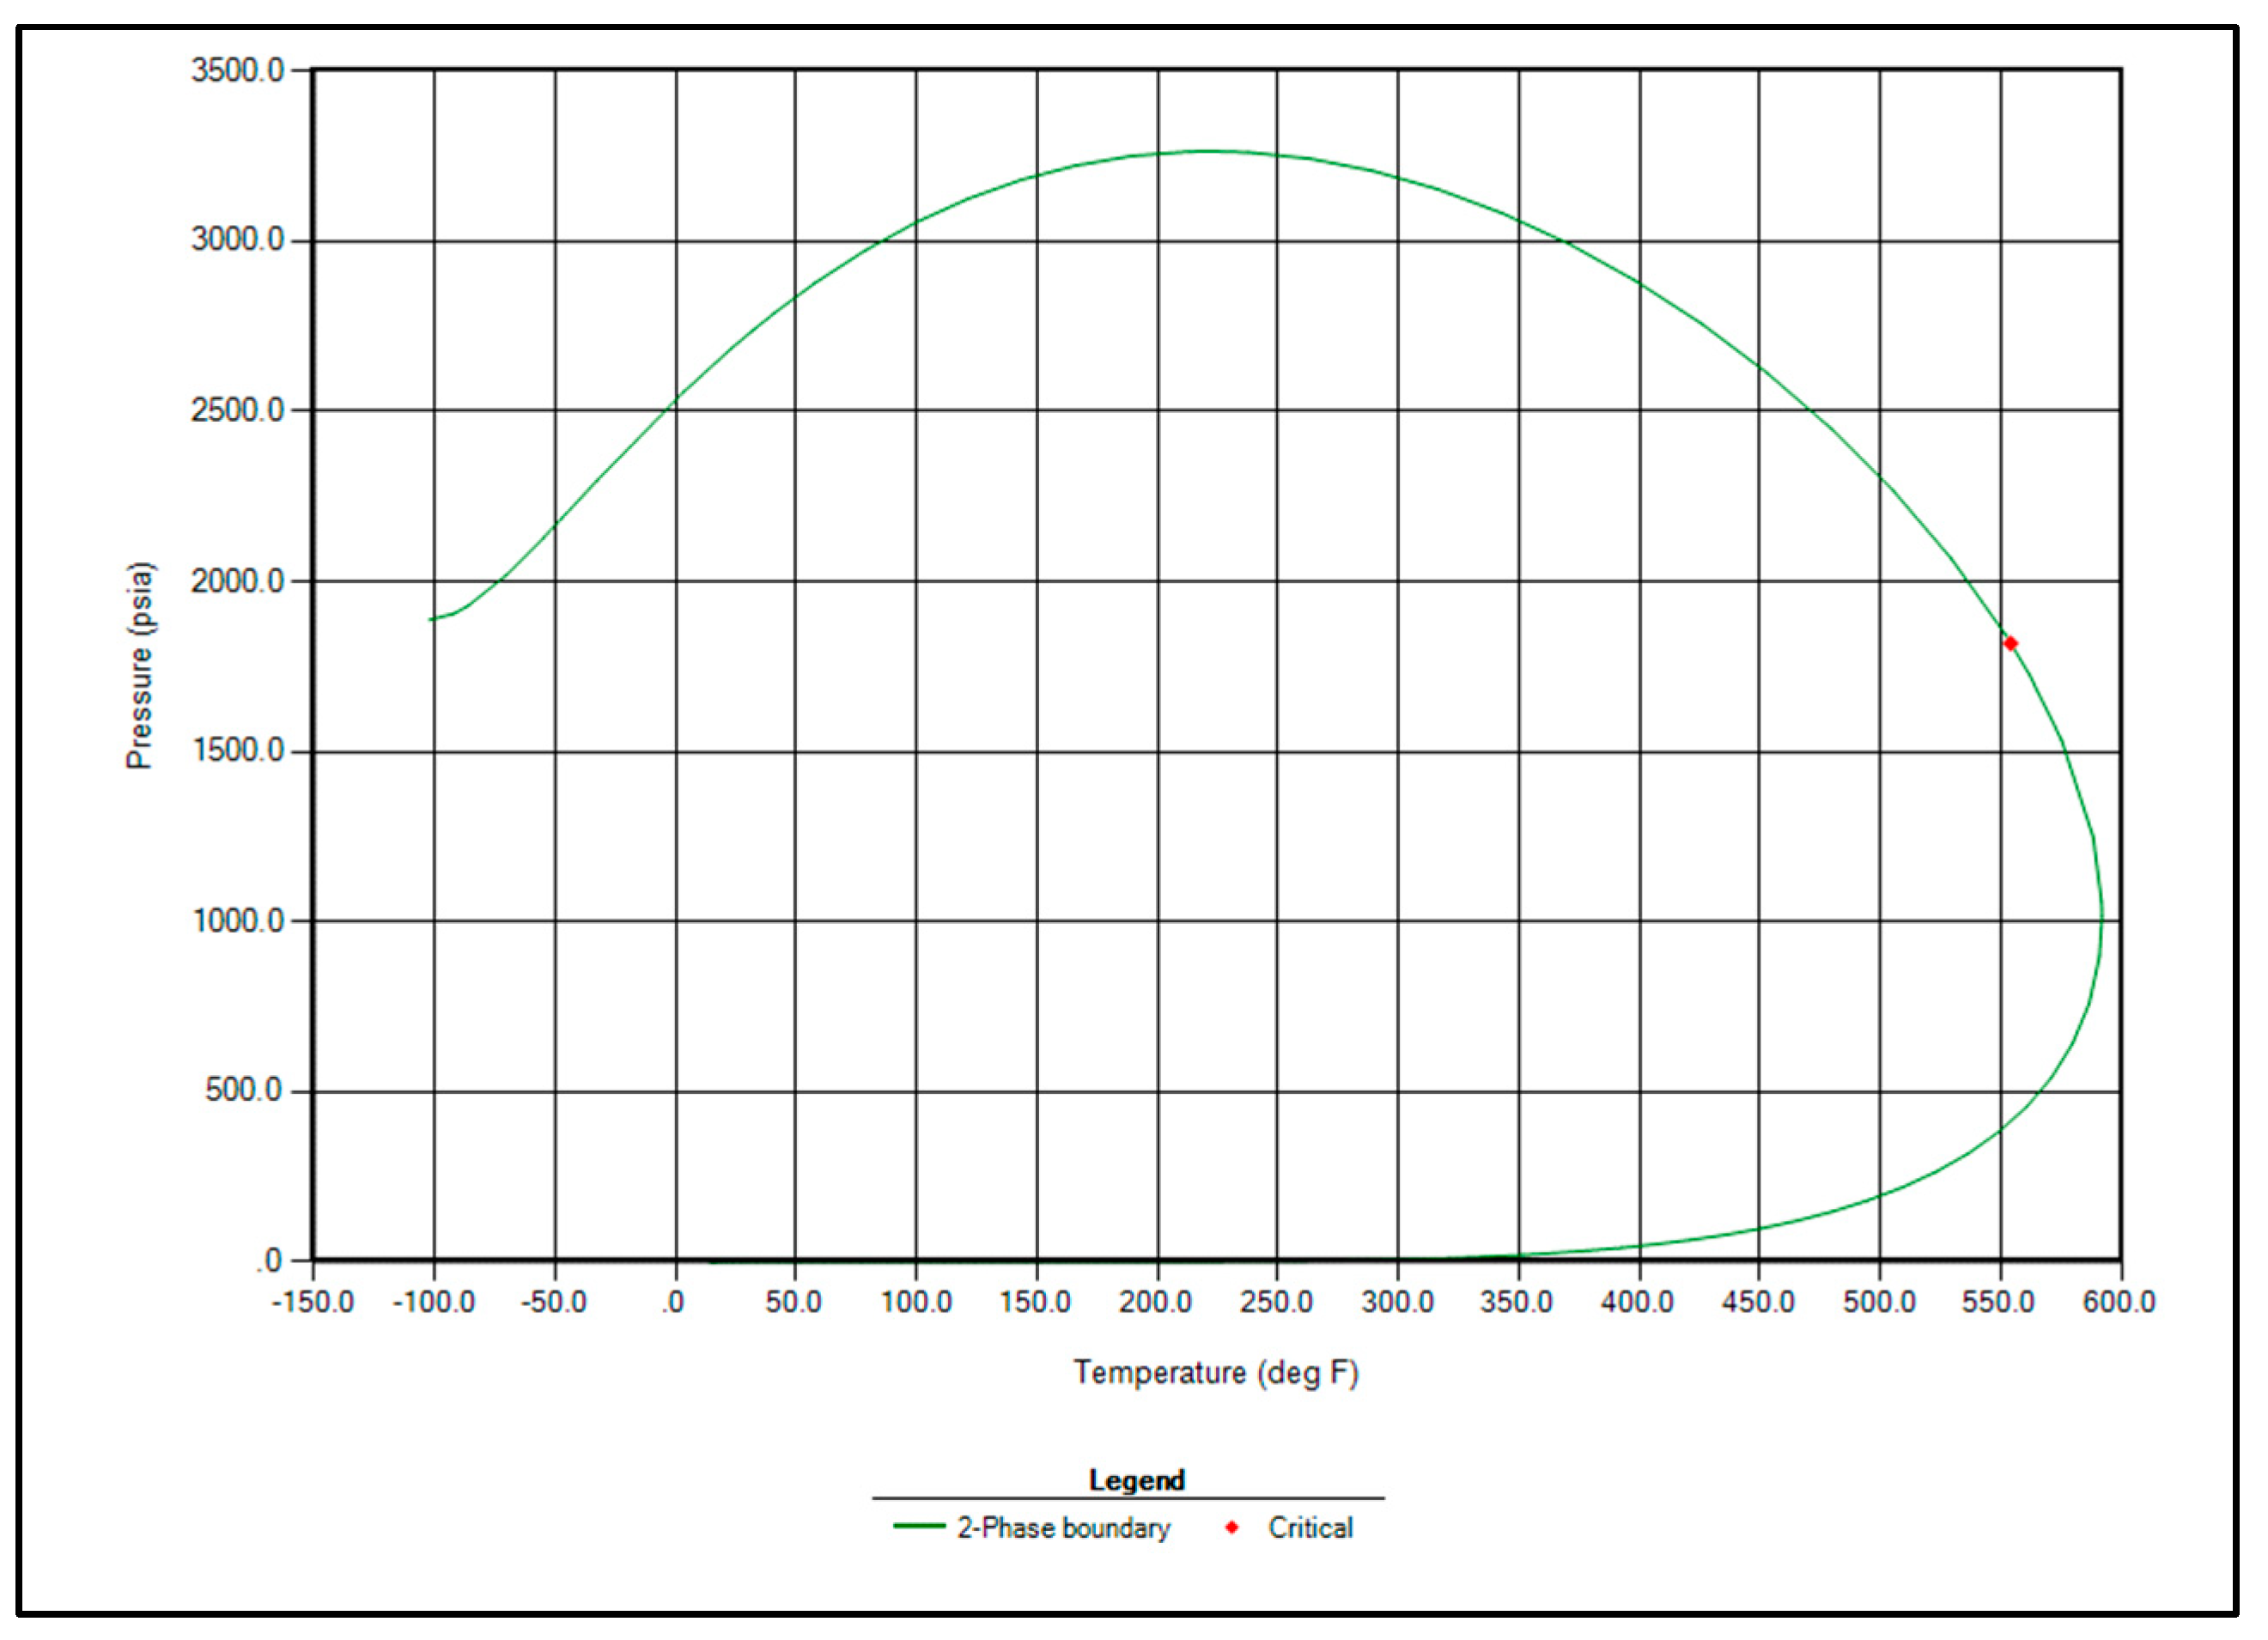
Based on the successful match, the properties of the hydrocarbon components were updated using the optimized regression parameters. The two-phase envelope corresponding to the given fluid composition is shown in Figure 5. This phase diagram confirms that the fluid exhibits black oil behavior, with a critical point identified at 550 °F and 1800 psia.
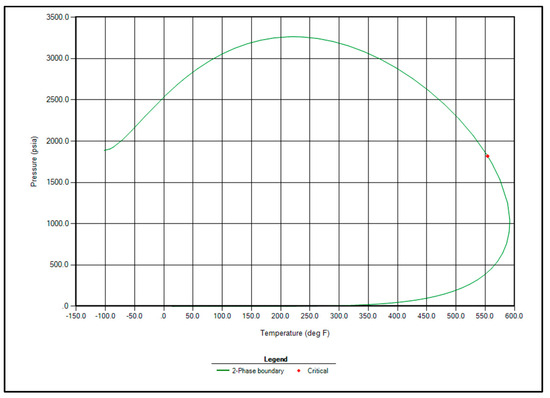
Figure 5.
Two phase envelope of Raleigh Field fluid.
As production increases in the Raleigh Oil Field, reservoir pressure is expected to decline. Therefore, understanding the variation in oil composition at pressures below the initial reservoir pressure of 5783 psig is essential. To evaluate this, two-phase flash calculations were performed in CMG WinProp™ at pressures of 2500, 2000, 1500, and 1000 psia. The results, summarized in Table 5, illustrate the behavior of oil and gas compositions under varying pressure conditions.
Table 5.
Oil and gas composition at 2500, 2000, 1500, and 1000 psi.
The analysis reveals that the concentration of heavier hydrocarbon components (e.g., C6, C7+) in the liquid phase increases as pressure decreases. Conversely, the gas phase remains dominated by lighter components (e.g., CO2, N2, CH4), although their relative concentrations slightly decline with decreasing pressure.
The miscibility module in CMG WinProp™ was employed to calculate both First Contact Miscibility (FCM) and Multiple Contact Miscibility (FCM) for each gas injection scenario. A cell-to-cell simulation approach was used to model the miscibility behavior between the injected gas and reservoir oil. Additionally, the swelling pressure function in CMG WinProp™ was utilized to determine the swelling factor for each scenario. All simulations were conducted at a constant reservoir temperature of 258 °F.
A sensitivity analysis was performed based on the calculated contact miscibility and swelling factors. The swelling factor was computed using the following equation. The results, corresponding to various reservoir pressures, are summarized in Table 6, Table 7, Table 8 and Table 9.
Table 6.
FCM, MCM, and swelling factor calculation at reservoir pressure 2500 psi.
Table 7.
FCM, MCM, and swelling factor calculation at reservoir pressure 2000 psi.
Table 8.
FCM, MCM, and swelling factor calculation at reservoir pressure 1500 psi.
Table 9.
FCM, MCM, and swelling factor calculation at reservoir pressure 1000 psi.
The results presented in Table 6, Table 7, Table 8 and Table 9 indicate that the calculated values for FCM and MCM remain unchanged at pressures of 2000 psi and below. A MMP of 2750 psi is required for both LPG injection and the 50% CO2/50% C3H8 mixture. This value increases slightly when pure CO2 is used, also yielding an MMP of 2750 psi. For separator gas injection, the MMP rises to 3000 psi—250 psi higher than that of pure CO2. The highest MMP values are observed in scenarios involving CH4 and N2 injection. Methane–propane mixtures, regardless of their composition, also result in elevated MMP values.
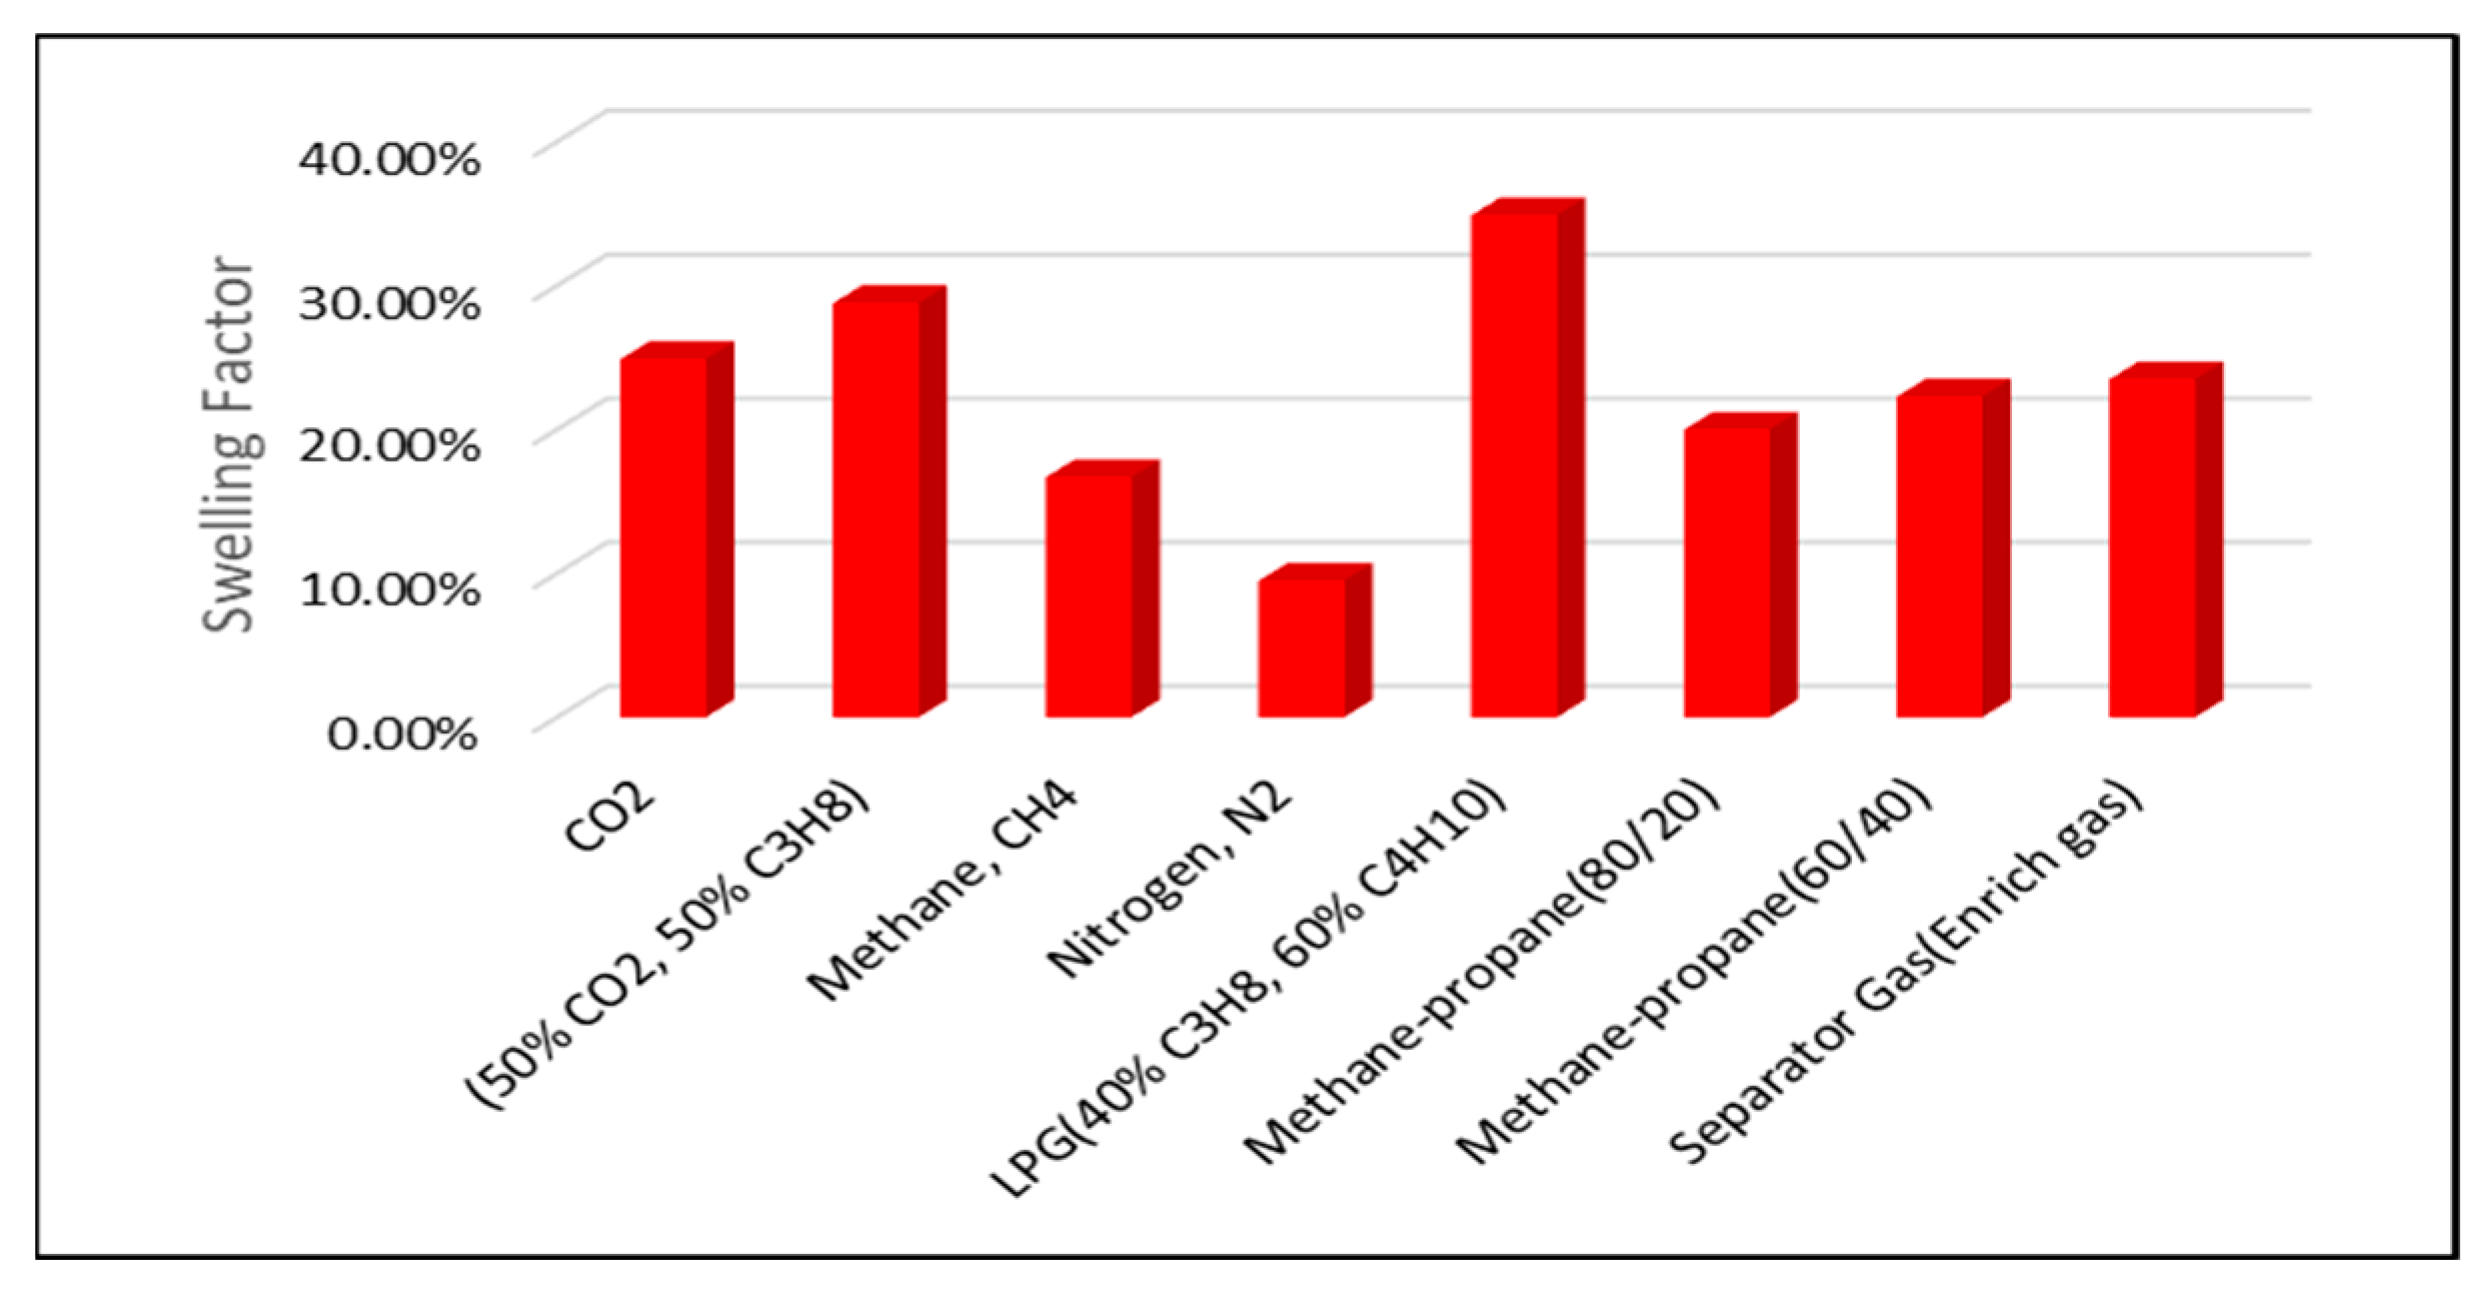
The highest swelling factors are observed at a reservoir pressure of 2500 psi. Across all pressure conditions, the greatest swelling is achieved with LPG, the 50% CO2/50% C3H8 mixture, pure CO2, and separator (enriched) gas injection. In contrast, lower swelling factors are associated with methane–propane blends, CH4, and N2 injection, as illustrated in Figure 6 and Figure 7.
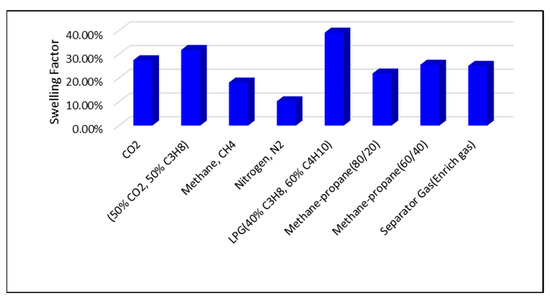
Figure 6.
Swelling Factor at reservoir pressure of 2500 psi.
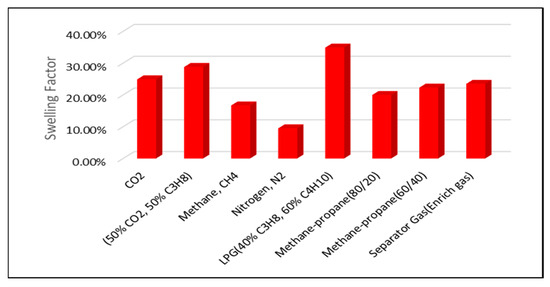
Figure 7.
Swelling Factor at reservoir pressure of 2000 psi.
Based on the analysis of lower MMP values and higher swelling factors, the most technically favorable gas injection options for EOR in the Raleigh Oil Field are:
- LPG (40% C3H8, 60% C4H10);
- 50% CO2/50% C3H8;
- Pure Carbon Dioxide (CO2);
- Separator-Produced Gas (Enriched Gas).
While LPG offers excellent miscibility and swelling characteristics, its economic feasibility is limited due to its significantly higher market value compared to CO2. According to industry data, the average cost of CO2 for EOR operations—particularly when sourced from industrial emissions—ranges between USD 10 and USD 20 per metric ton [22]. In contrast, LPG, being a refined hydrocarbon product, can exceed USD $500 per metric ton depending on market conditions and regional availability [23]. This substantial cost differential, when scaled to the volumes required for field-scale injection, results in a markedly higher unit injection cost for LPG. Although a full net present value analysis was beyond the scope of this study, the relative cost disparity supports the conclusion that CO2 and enriched separator gas are more economically viable options for the Raleigh Field, especially under current reservoir pressure and economic constraints.
As previously discussed, the Raleigh Oil Field is experiencing a rapid decline in reservoir pressure—from 5783 psig to below 3500 psig—along with reduced productivity. This pressure drop may lead to the cessation of oil production and result in high residual oil saturation. To mitigate this, it is critical to implement strategies that enhance oil recovery and maintain reservoir pressure.
Two potential approaches include water injection and immiscible gas injection. However, the high salinity of the formation water poses a significant risk of incompatibility with injected water, potentially leading to scaling and formation damage. Consequently, immiscible gas injection is recommended for this field.
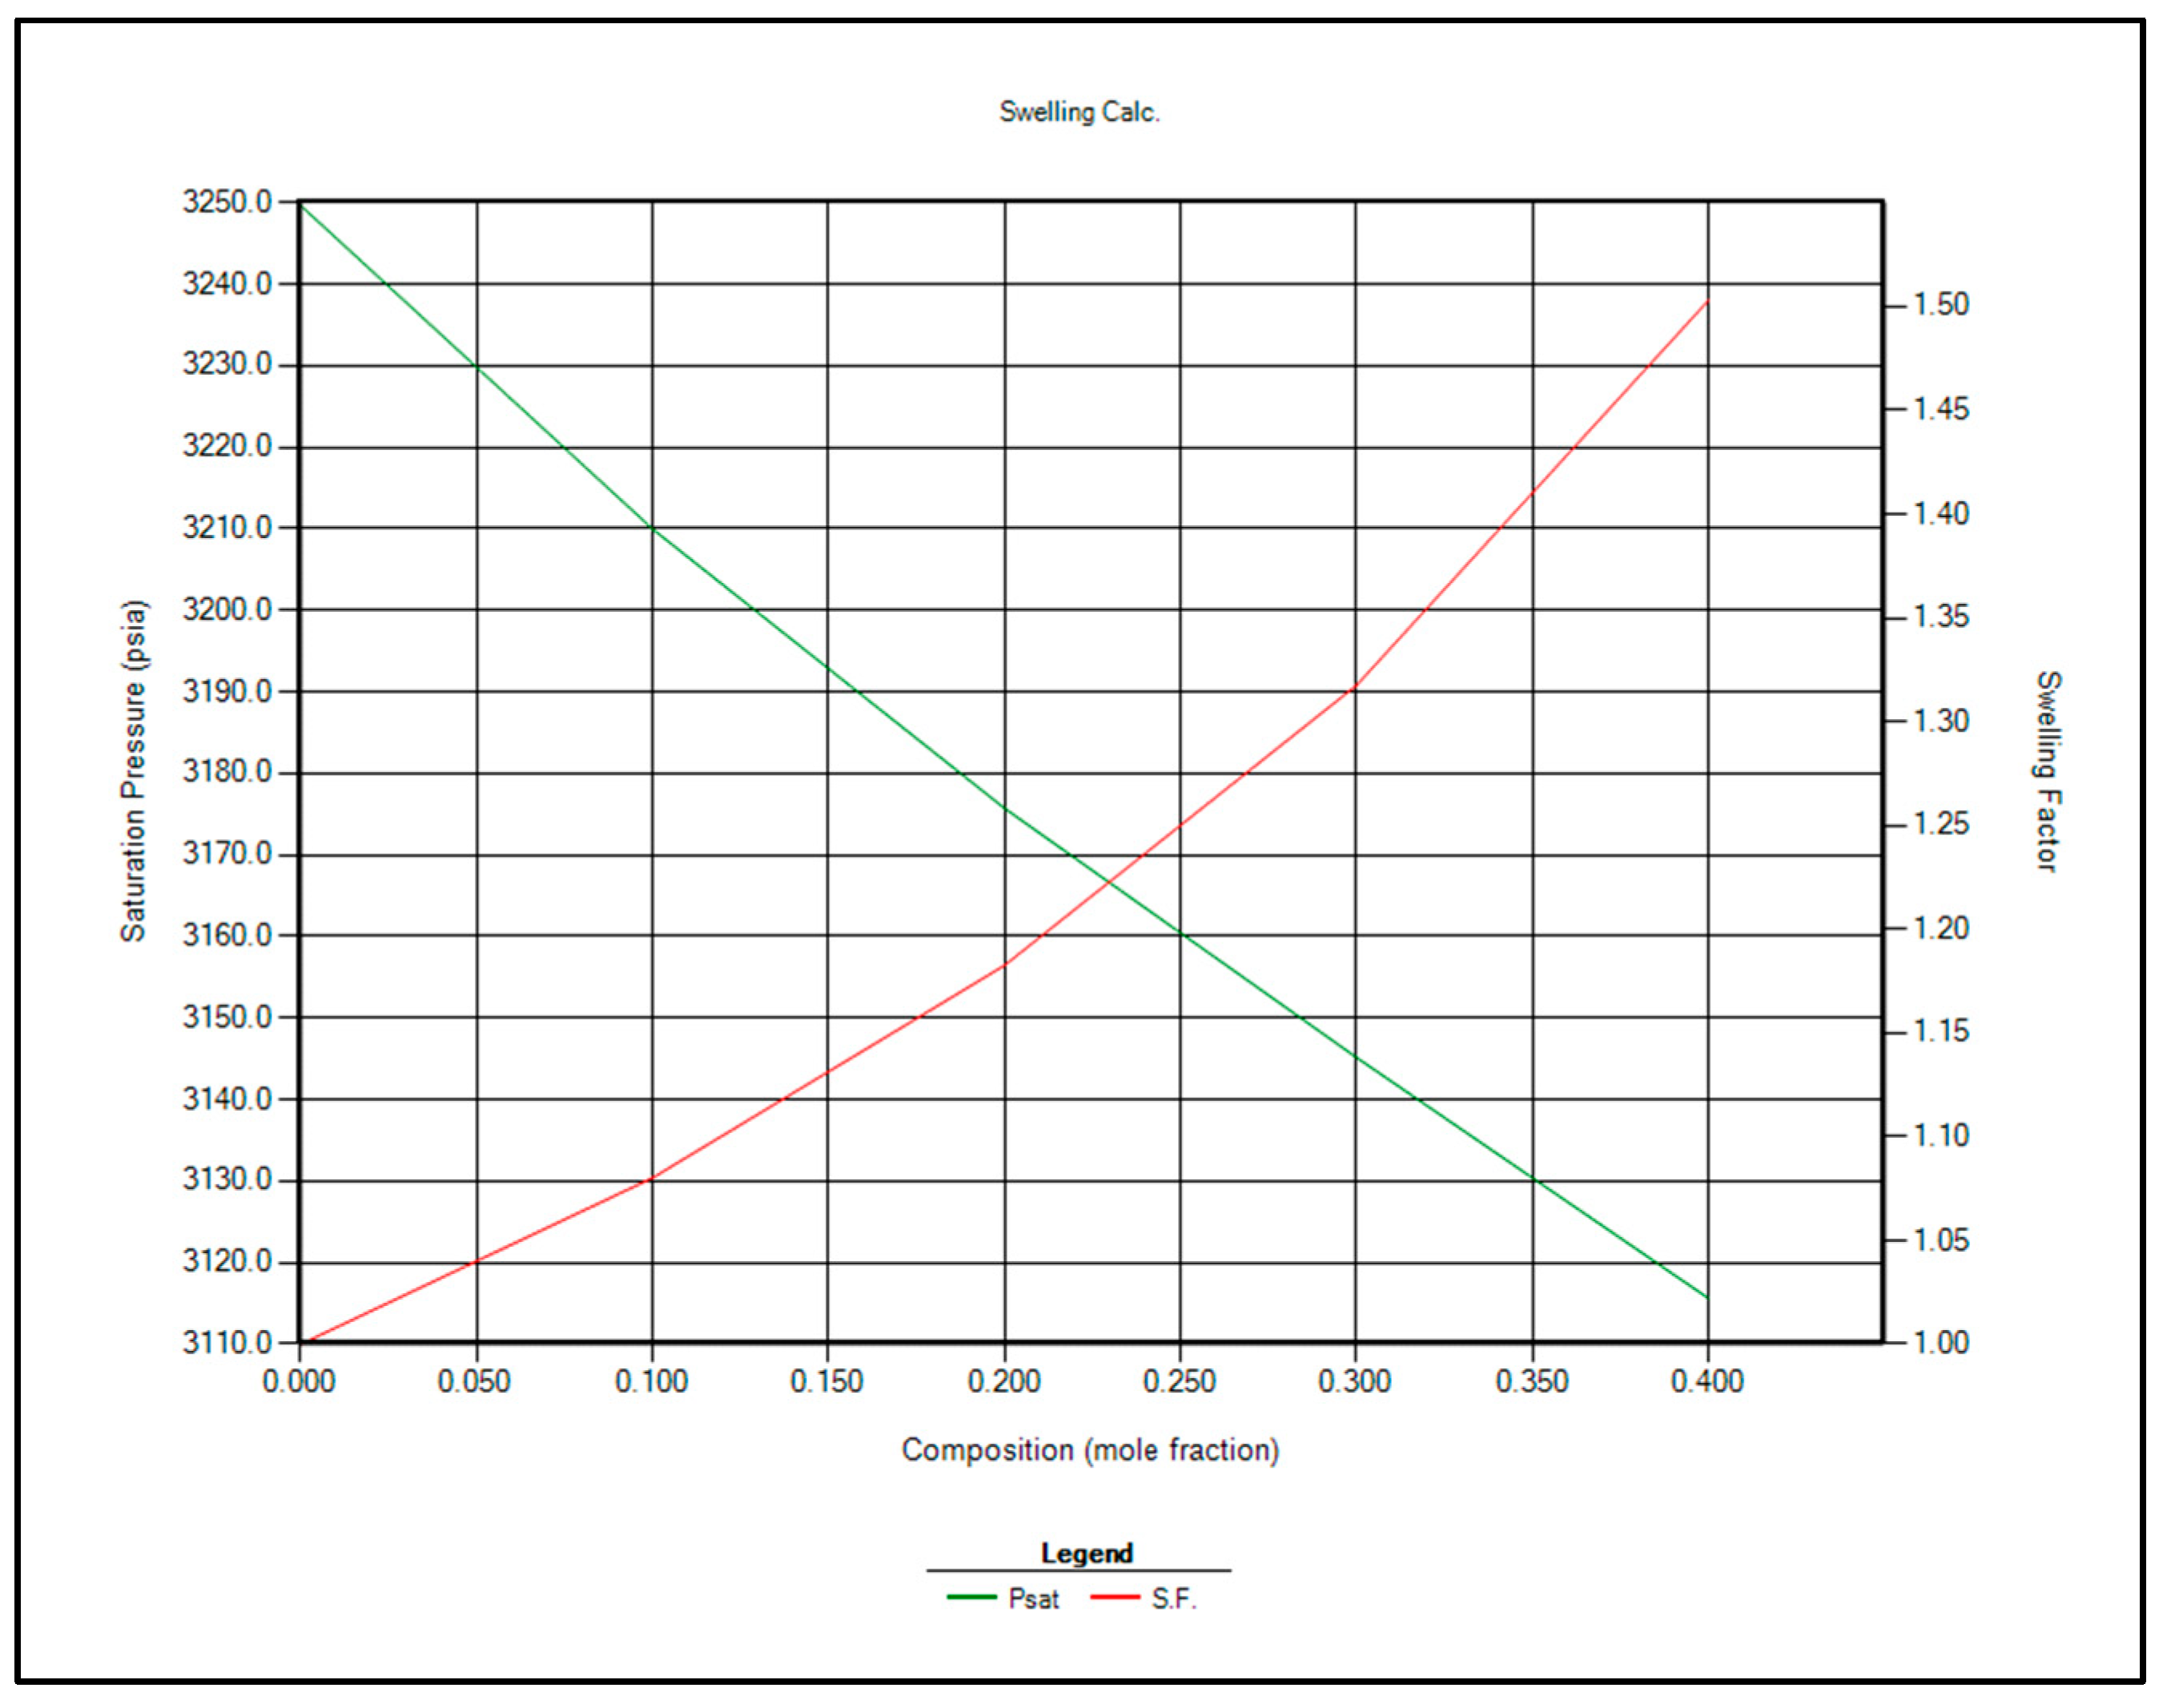
The two most feasible gas injection options for EOR are CO2 and enriched separator gas. Immiscible gas injection is planned to commence once the reservoir pressure reaches the bubble point of 3250 psi. At that stage, contact miscibility and swelling factor calculations will be repeated using CMG WinProp™ at 3250 psi. The updated results are presented in Table 10 and Figure 8 and Figure 9.
Table 10.
FCM, MCM, and swelling factor calculation at 3250 psi (bubble point pressure).
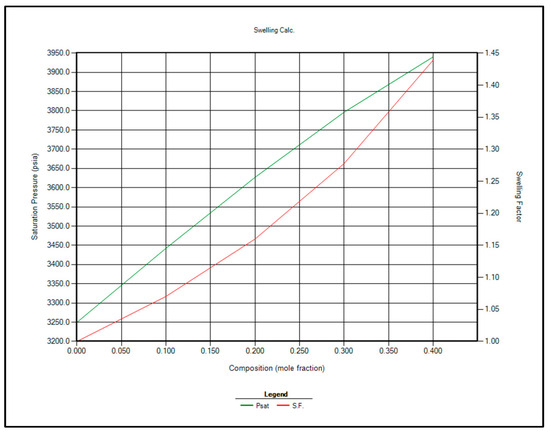
Figure 8.
Saturation pressure and swelling factor in case of injection separator produced gas for EOR.
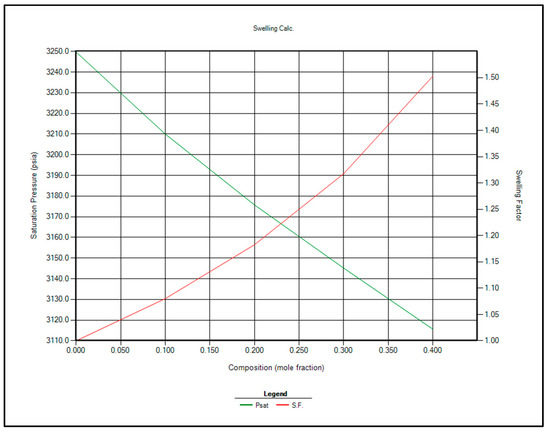
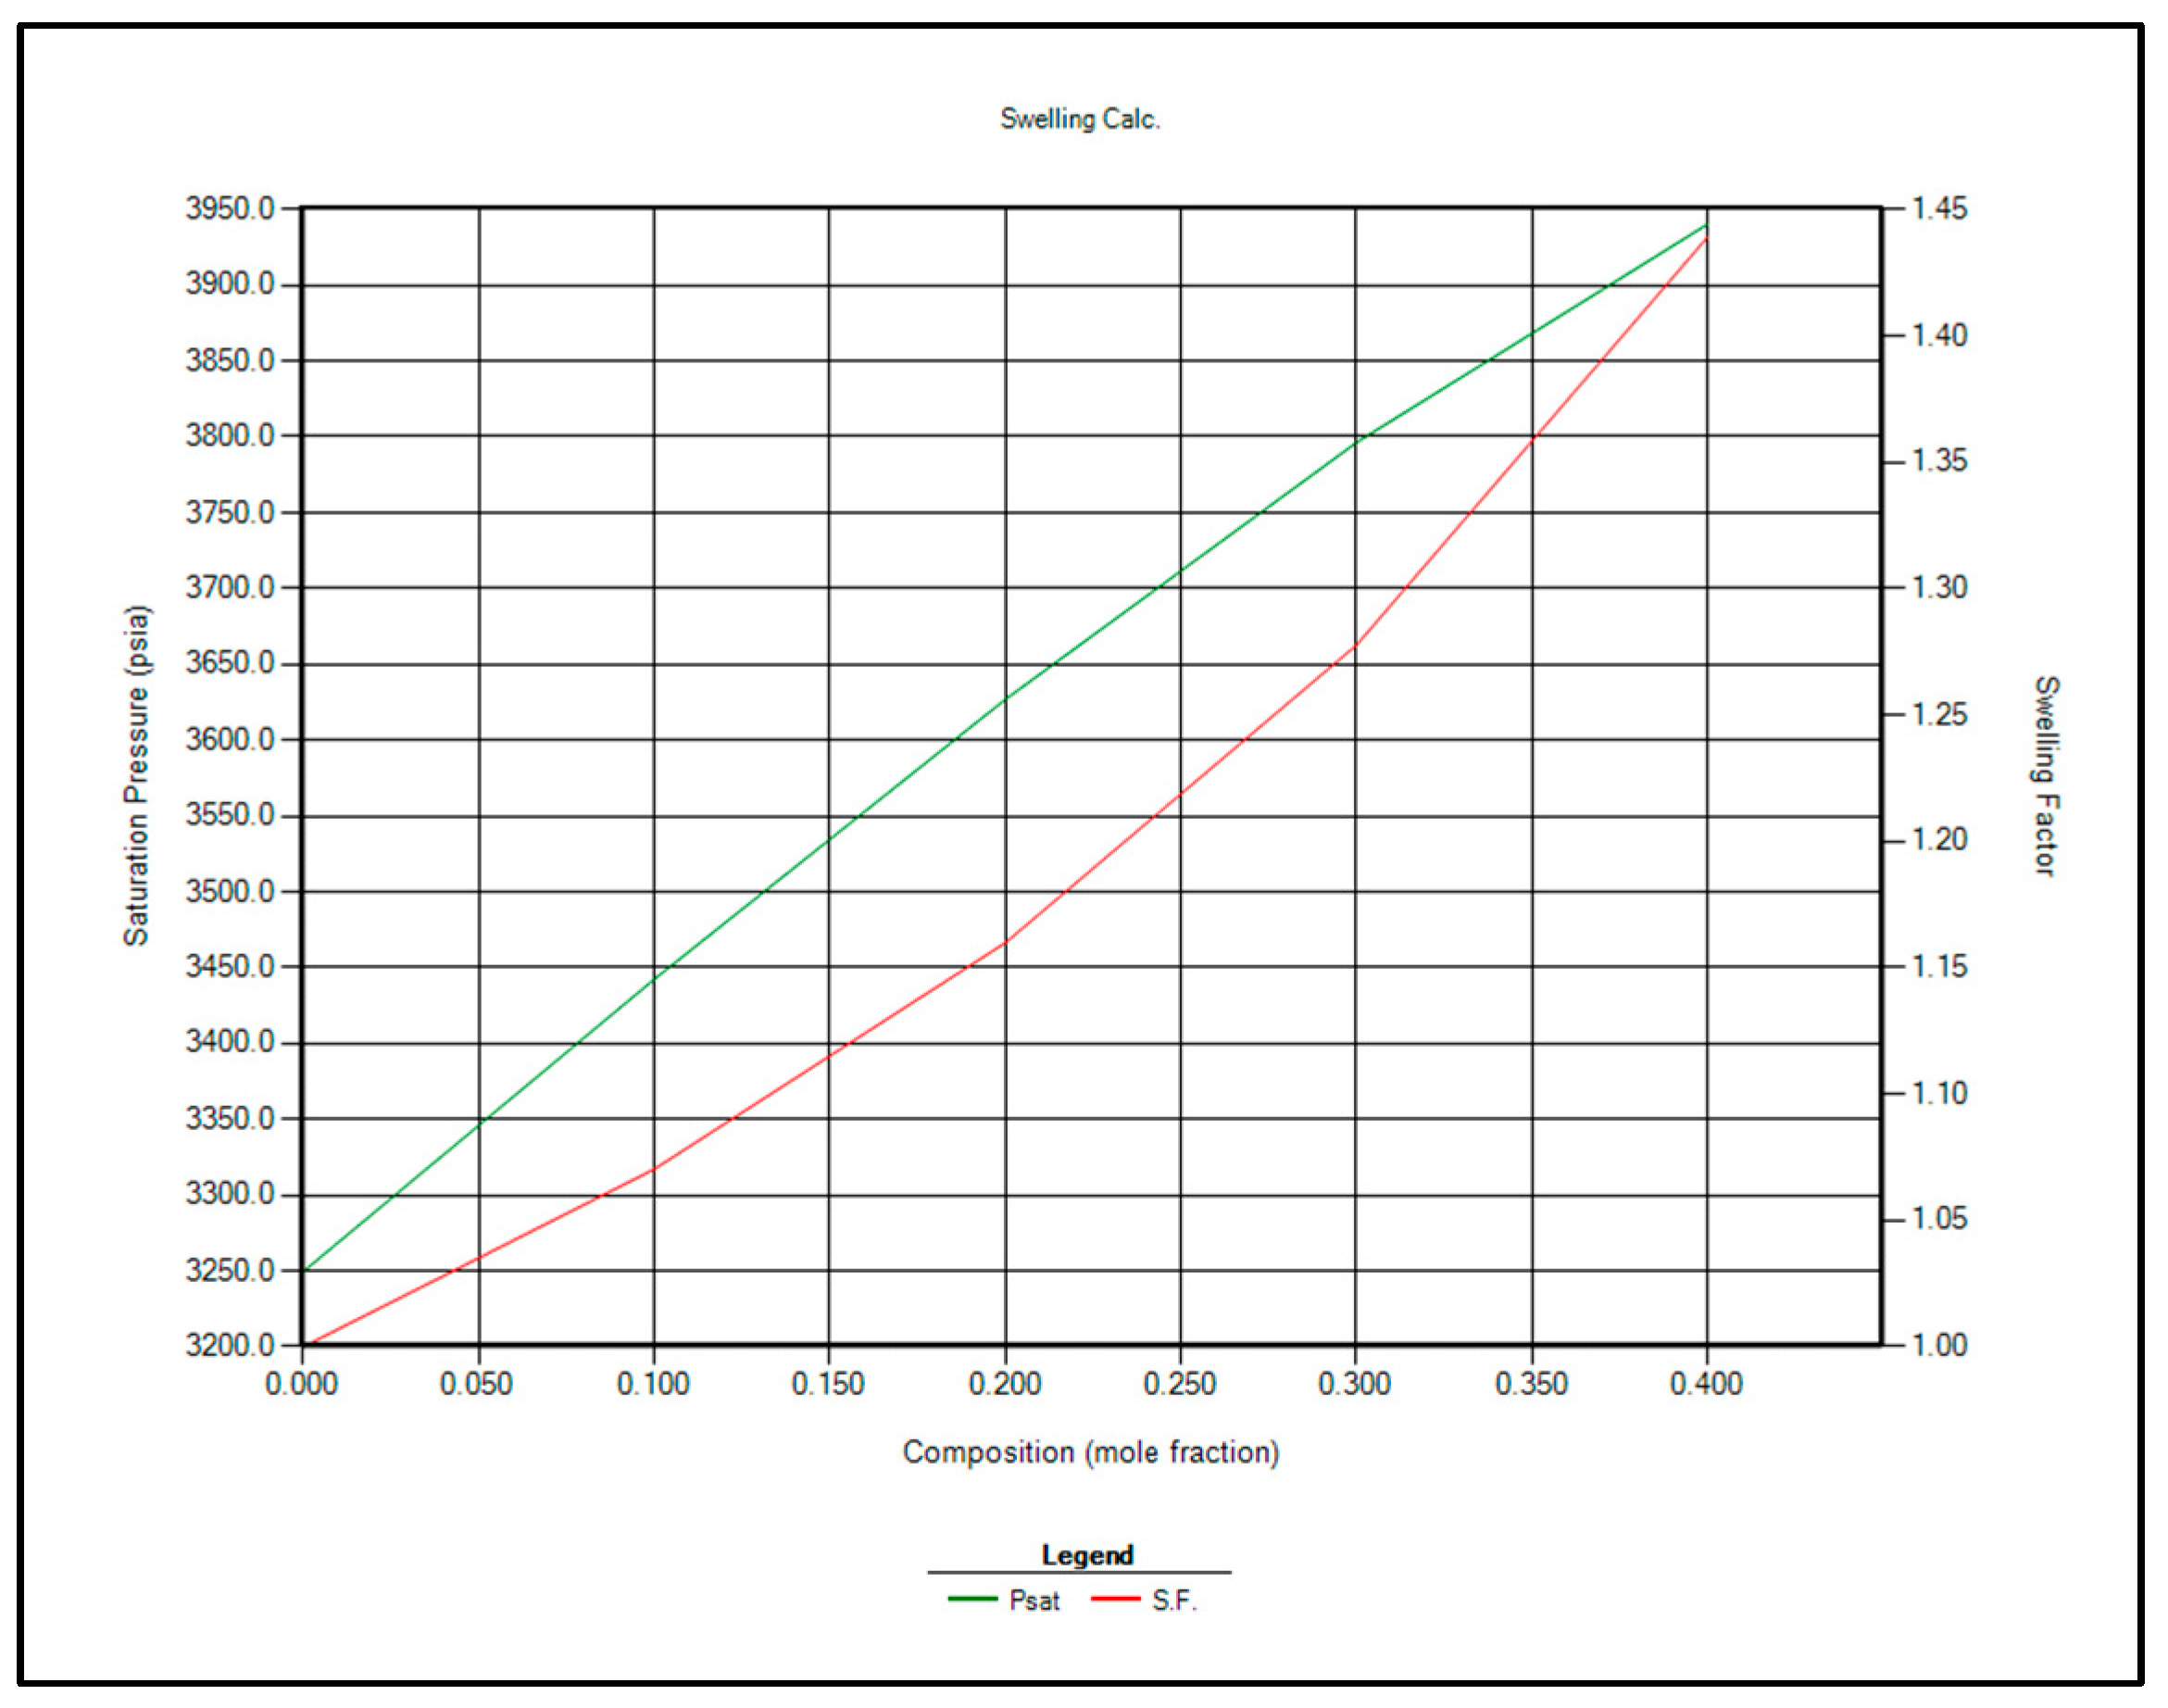
Figure 9.
Saturation pressure and swelling factor in case of injection CO2 for EOR.
Based on the analysis of Table 10 and Figure 8 and Figure 9, CO2 injection is recommended over separator gas for EOR in the Raleigh Oil Field, for the following key reasons:
- Higher Swelling Factor: CO2 demonstrates a greater swelling factor than separator gas, which enhances oil expansion and improves displacement efficiency, ultimately leading to increased oil recovery.
- Lower Miscibility Pressure Requirement: CO2 achieves miscibility with reservoir oil at lower pressures compared to separator gas, making it more suitable under the current reservoir pressure conditions.
- Enhanced Performance with Pressure Decline: As reservoir pressure declines, the swelling factor associated with CO2 injection increases, maintaining its effectiveness even at lower pressures.
- Environmental Advantages: Utilizing CO2 captured from industrial emissions for EOR not only supports hydrocarbon recovery but also contributes to carbon sequestration efforts, reducing atmospheric CO2 levels and mitigating climate change.
Given these technical and environmental benefits, CO2 injection presents a more effective and sustainable EOR strategy for the Raleigh Oil Field.
4. Conclusions
In this study, the EOS model was developed using CMG WinProp™ to evaluate and identify the most suitable gas injection strategy for EOR in the Raleigh Oil Field, located in Smith County, Mississippi. The model was calibrated using experimental data and validated through regression analysis, with a particular focus on CO2 injection performance. Based on simulation results and available production data, the following conclusions were drawn:
- Among the eight gas injection scenarios evaluated, CO2 and enriched separator gas were identified as the most viable options for enhancing oil recovery.
- Under CO2 injection conditions, the MMP was determined to be 3250 psi, with a corresponding swelling factor of approximately 31%.
- For enriched separator gas injection, the MMP was found to be 4125 psi, with a swelling factor of approximately 28%.
- Due to the rapid decline in reservoir pressure—from 5783 psig to below 3500 psig within 1.5 years of production—CO2 injection is the most appropriate strategy for maintaining reservoir pressure and improving the recovery factor.
- It is recommended that CO2-EOR operations commence once the reservoir pressure reaches the saturation pressure of 3250 psia.
This study highlights the technical and environmental advantages of CO2 injection and provides a robust framework for implementing EOR strategies in pressure-depleted reservoirs.
Author Contributions
Conceptualization, M.M.; methodology, M.M.; software, M.M.; validation, M.M. and E.G., formal analysis, M.M.; investigation, M.M. and E.G., resources, M.M.; data curation, M.M. and E.G., writing—original draft preparation, M.M.; writing—review and editing, M.M. and E.G., visualization, M.M.; supervision, M.M.; project administration, M.M. All authors have read and agreed to the published version of the manuscript.
Funding
This research received no external funding.
Data Availability Statement
The data presented in this study are available on request from the corresponding author. The data are not publicly available due to restrictions of privacy.
Conflicts of Interest
The authors declare no conflicts of interest.
Abbreviations
The following abbreviations are used in this manuscript:
| EOR | Enhanced Oil Recovery |
| EOS | Equation of State |
| MGI | Miscible Gas Injection |
| MMP | Minimum Miscible pressure |
| CMG | Computer Modeling Group |
| LPG | Liquefied Petroleum Gas |
| Vob | Oil Volume at bubble point |
References
- Davarpanah, A.; Mirshekari, B.; Razmjoo, A.A. A simulation study of water injection and gas injectivity scenarios in a fractured carbonate reservoir: A comparative study. Petrol. Res. 2019, 4, 250–256. [Google Scholar] [CrossRef]
- Metwally, M. CO2 Utilization for Enhanced Oil Recovery in High-Salinity Reservoirs: A Sustainable Pressure and Production Optimization Solution for the Raleigh Oil Field. In Proceedings of the 59th US Rock Mechanics/Geomechanics Symposium, Santa Fe, NM, USA, 8–11 June 2025. [Google Scholar]
- Song, G.; Meng, Y.; Zhang, C.; Zhao, Z.; Yang, Q. Comprehensive review of the determination and reduction of the minimum miscibility pressure during CO2 flooding. ACS Omega 2024, 9, 14747–14765. [Google Scholar] [CrossRef] [PubMed]
- Safaei, A.; Kazemzadeh, Y.; Riazi, M. Mini review of miscible condition evaluation and experimental methods of gas miscible injection in conventional and fractured reservoirs. Energy Fuels 2021, 35, 7340–7363. [Google Scholar] [CrossRef]
- Zhou, D.; Orr, F.M. Analysis of rising-bubble experiments to determine minimum miscibility pressures. SPE J. 1998, 3, 19–25. [Google Scholar] [CrossRef]
- Ibrahim, A.F.; Abdelgawad, K.Z.; Al-Anazi, A.; Hamad, J.S.A. Effect of crude oil properties on the interfacial tension of crude oil/CO2 under HPHT conditions. Arab. J. Sci. Eng. 2022, 48, 9269–9286. [Google Scholar] [CrossRef]
- Yurkiw, F.J.; Flock, D.L. A comparative investigation of minimum miscibility pressure correlations for enhanced oil recovery. J. Can. Pet. Technol. 1994, PETSOC-94-08-04. [Google Scholar] [CrossRef]
- Chen, G.; Gao, H.; Fu, K.; Zhang, H.; Liang, Z.; Tontiwachwuthikul, P. An improved correlation to determine minimum miscibility pressure of CO2-oil system. Green Energy Environ. 2020, 5, 97–104. [Google Scholar] [CrossRef]
- Shaddel, S.; Tabatabae-Nejad, S.A.; Fathi, S.J. Low-Salinity Water Flooding: Evaluating the Effect of Salinity on Oil and Water Relative Permeability, Wettability, and Oil Recovery. Spec. Top. Rev. Porous Media 2014, 5, 133–143. [Google Scholar] [CrossRef]
- Pourhadi, S.; Fath, A.H. Performance of the injection of different gases for enhanced oil recovery in a compositionally grading oil reservoir. J. Petrol. Explor. Prod. Technol. 2019, 10, 641–661. [Google Scholar] [CrossRef]
- Wei, J.; Cheng, K.; Wang, S.; Yuan, M.; E, X.; Cen, C. CO2-Controlled Water Injection in Carbonate Gas Reservoirs: An Effective approach to improve production. ACS Omega 2024, 9, 26900–26910. [Google Scholar] [CrossRef] [PubMed]
- Jia, J.; Zhu, Z.; Chen, H.; Pan, H.; Jiang, L.; Su, W.-H.; Chen, Q.; Tang, Y.; Pan, J.; Yu, K. Full life circle of micro-nano bubbles: Generation, characterization and applications. Chem. Eng. J. 2023, 471, 144621. [Google Scholar] [CrossRef]
- Ozowe, N.W.; Daramola, N.G.O.; Ekemezie, N.I.O. Recent advances and challenges in gas injection techniques for enhanced oil recovery. Magna Sci. Adv. Res. Rev. 2023, 9, 168–178. [Google Scholar] [CrossRef]
- Masalmeh, S.K.; Wei, L.; Blom, C.; Jing, X.D. EOR options for heterogeneous carbonate reservoirs currently under waterflooding. In Proceedings of the Abu Dhabi International Petroleum Exhibition and Conference, Abu Dhabi, United Arab Emirates, 10–13 November 2014. [Google Scholar] [CrossRef]
- Al-Bayati, D.; Al-Khdheeawi, E.; Saeedi, A.; Myers, M.; Xie, Q. Investigations of miscible water alternating gas injection efficiency in layered sandstone porous media. Iraqi J. Oil Gas Res. 2022, 2, 31–44. [Google Scholar] [CrossRef]
- Chen, H.; Zhang, C.; Jia, N.; Duncan, I.; Yang, S.; Yang, Y. A machine learning model for predicting the minimum miscibility pressure of CO2 and crude oil system based on a support vector machine algorithm approach. Fuel 2020, 290, 120048. [Google Scholar] [CrossRef]
- Ebadati, A.; Akbari, E.; Davarpanah, A. An experimental study of alternative hot water alternating gas injection in a fractured model. Energy Explor. Exploit. 2018, 37, 945–959. [Google Scholar] [CrossRef]
- Chen, Z.; Li, R.; Du, Y.; Ma, S.; Zhang, X.; Shi, J. Effect of confinement on the vapor-liquid-liquid three-phase equilibrium during CO2 utilization and sequestration in shale reservoirs. Adv. Geo-Energy Res. 2025, 16, 199–210. [Google Scholar] [CrossRef]
- Yang, G.; Fan, Z.; Li, X. Determination of confined fluid phase behavior using extended Peng–Robinson equation of state. Chem. Eng. J. 2019, 378, 122032. [Google Scholar] [CrossRef]
- Meltzer, B. An efficient gas displacement project Raleigh Field, Mississippi. J. Petrol. Technol. 1965, 17, 509–514. [Google Scholar] [CrossRef]
- CMG WinProp™ User’s Guide, Computer Modeling Group Ltd.: Calgary, AB, Canada, 2013.
- National Energy Technology Laboratory. Cost of Capturing CO2 from Industrial Sources. 2022. Available online: https://www.netl.doe.gov/projects/files/CostofCapturingCO2fromIndustrialSources_071522.pdf (accessed on 15 July 2022).
- Drews, A.; Johansen, N. Chapter 1 Analysis of C. ASTM International eBooks; ASTM: West Conshohocken, PA, USA, 1998; pp. 15–30. [Google Scholar] [CrossRef]

Disclaimer/Publisher’s Note: The statements, opinions and data contained in all publications are solely those of the individual author(s) and contributor(s) and not of MDPI and/or the editor(s). MDPI and/or the editor(s) disclaim responsibility for any injury to people or property resulting from any ideas, methods, instructions or products referred to in the content. |
© 2025 by the authors. Licensee MDPI, Basel, Switzerland. This article is an open access article distributed under the terms and conditions of the Creative Commons Attribution (CC BY) license (https://creativecommons.org/licenses/by/4.0/).