Abstract
Cyclic Solvent Injection (CSI) is a method for enhanced heavy oil recovery, offering a reduced environmental impact. CSI processes typically involve fluid flow through both wormholes and the surrounding porous media in reservoirs. Therefore, understanding how foamy oil behavior differs between bulk phases and porous media is crucial for optimizing CSI operations. However, despite CSI’s advantages, limited research has explained why foamy oil, a key mechanism in CSI, displays weaker strength and stability in bulk phases than in porous media. To address this gap, three advanced visual micromodels were employed to monitor bubble behavior from nucleation through collapse under varying porosity with a constant pressure reduction. A sandpack depletion test in a large cylindrical model further validated the non-equilibrium bubble-reaction kinetics observed in the micromodels. Experiments showed that, under equivalent operating conditions, bubble nucleation in porous media required less energy and initiated more rapidly than in a bulk phase. Micromodels with lower porosity demonstrated up to a 2.5-fold increase in foamy oil volume expansion and higher bubble stability. Moreover, oil production in the sandpack declined sharply at pressures below 1800 kPa, indicating the onset of critical gas saturation, and yielded a maximum recovery of 37% of the original oil in place. These findings suggest that maintaining reservoir pressure above critical gas saturation pressure enhances oil recovery performance during CSI operations.
1. Introduction
Cyclic Solvent Injection (CSI) has gained significant attention as a viable and environmentally friendly enhanced oil recovery (EOR) method, particularly for dead heavy oil reservoirs. Its energy efficiency and capacity to improve oil quality while reducing greenhouse gas emissions make it an attractive alternative to traditional thermal processes. To fully harness its potential, a detailed understanding of CSI’s controlling parameters and core mechanisms are necessary. Among these mechanisms, the foamy oil process, initiated by gas exsolution during pressure reduction, plays a crucial role in enhancing oil recovery. While previous studies have explored various aspects of CSI, the role of porosity and pore structure in foamy oil dynamics has often been underemphasized.
Numerous researchers have investigated the factors influencing foamy oil formation. Maini [1] studied depletion rates and found that slower depletion reduced oil recovery, which clearly advocates for optimal pressure decline strategies. Kumar et al. [2] and Bayon et al. [3] emphasized the effect of pressure drop rate on gas mobility and oil production. Du et al. [4] further refined this understanding using sandpack models, identifying distinct production phases and recommending variable depletion strategies to optimize oil recovery. Studies by Chen et al. [5,6] using NMR and multi-solvent CSI tests underscored the importance of solvent composition and pressure decline rates in enhancing foamy oil behavior. Sawatzky et al. [7] reported that pressure reduction leads to the generation of small, trapped bubbles, which, with continued production, evolve into clusters and interconnected networks, eventually allowing only gas to flow through the porous media. Bennion et al. [8] demonstrated through pressure depletion tests that oil recovery can exceed 30%, and they noted a decline in oil production rate at the critical gas saturation pressure. It was noted that good production management can improve oil recovery.
CO2 has frequently been used as a solvent in CSI due to its miscibility and environmental benefits. Torabi and Asghari [9] showed that higher injection pressures improve miscibility and oil recovery. Other studies [10,11,12] highlighted CO2’s effectiveness in reducing oil viscosity and enhancing gas drive efficiency. However, the performance varies with pressure, temperature, and the type of solvent used. Abedini and Torabi [13,14] and Pu et al. [15] examined solvent miscibility and diffusion effects, confirming that solvent interactions with oil phases are complex and critical to CSI success.
Alternative solvents such as methane, propane, and butane have been explored due to CO2 limitations (cost, corrosion, miscibility). Studies by Luo et al. [16], Li et al. [17], and Qazvini and Torabi [18] provided comparative data on solvent effectiveness. They revealed that hydrocarbon-based solvents often perform better in reducing oil viscosity and generating foamy oil. Similarly, Jia et al. [19] demonstrated enhanced oil recovery using pressure pulsing combined with propane.
Surfactant-assisted CSI has been proposed to improve bubble stability and foamy oil lifetime. Sun et al. [20,21] used visual models to show that surfactants reduce bubble size, increase bubble density, and enhance foamy oil expansion. Sabeti et al. [22] incorporated non-equilibrium reaction models to capture the kinetics of bubble generation and rupture, identifying solvent type, surfactant concentration, and pressure decline rate as key parameters. Through numerical analysis, two non-equilibrium reactions were developed to represent bubble generation and bubble rupture kinetics in the foamy oil process. Equation (1) describes the kinetics of dissolved gas converting into bubbles, while Equation (2) details the kinetics of bubbles converting into free gas [22].
where ‘rdb’ represents the rate of bubble generation from dissolved gas, ‘dp/dt’ is the rate of pressure reduction, ‘E’ stands for activation energy, ‘R’ denotes the universal gas constant, ‘T’ represents temperature, ‘C’ signifies the concentration of dissolved gas, and ‘C*’ is the concentration of dissolved gas in equilibrium conditions.
where ‘rgb’ represents the rate of bubble rupture to free gas, ‘Wv’ is surfactant concentration, ‘C’ signifies the concentration of bubbles, and ‘C*’ is the concentration of bubbles in equilibrium conditions. The results were derived from design of experiment analysis and optimization, which are discussed in detail in another study [23].
Despite these advancements, only a few studies have directly examined how porosity or pore structure influences foamy oil behavior. Li et al. [17] observed that foamy oil expands more at lower porosity levels. Their experiments used three distinct model beds of glass beads to evaluate bubble lifetimes and expansion heights in porous media, ultimately developing a correlation for foamy oil stability based on pore size. It was found that the presence of sand grains results in a heterogeneous foam texture and enhances foam stability compared to a bulk system [24]. Romero and Kantzas [25] investigated foam dynamics in etched-glass micromodels, demonstrating that both bubble size and behavior are strongly influenced by porous media geometry. In one study, George et al. [26] explored the coalescence time of two bubbles in a channel perpendicular to the flow direction. Based on a quasi-static shape assumption, their model found a direct relationship between bubble coalescence and pore-channel radius, implicitly underscoring how formation-bed characteristics affect bubble evolution in the foamy oil process. Du et al. [27] carried out CSI experiments on sandpack models of three different scales to examine how wormhole characteristics and sandpack properties influence process performance. Although wormholes were their main focus, they developed an analytical relationship showing that increased porosity leads to higher oil production rates. Bertin et al. [28] conducted a numerical study of foam–flow bubble dynamics, concluding that key formation properties such as porosity and permeability affect bubble populations and, in turn, fluid viscosity. From the available works of Yu and Kanj [29], it is understood that when bubble sizes remain smaller than the pore openings, the bubbles behave similarly to those in a bulk-phase system. However, as the bubbles grow within a porous medium, the walls can impede their expansion, and snap-off effects gradually reduce bubble size. Conversely, other studies [30,31] explain that porous media lower the energy barrier for nucleation, thereby promoting greater bubble generation during a foamy oil process. Wang et al. [32] conducted experiments under non-equilibrium conditions to examine bubble growth in both the bulk phase and porous media. They observed that bubbles in the bulk phase expanded rapidly under sharp pressure reductions; however, the study did not address the differences in bubble patterns between the bulk phase and porous media.
Given the complexity of the real reservoir, microfluidic systems are employed as a controllable and versatile experimental setup. This setup enables rapid, detailed, and comprehensive investigation of various EOR techniques, as well as identification of their most effective operating conditions. Based on previous research, this study aims to bridge the identified research gap by focusing on how porosity affects bubble nucleation, growth, rupture, and overall foamy oil stability during CSI. A comprehensive analysis of bubble dynamics across different porous structures is achieved through visual micromodel experiments, sandpack tests, and numerical simulations. A set of new kinetic models applicable to porous media is introduced. The analysis achieved in this study provides valuable insights for optimizing CSI operations. Results of this study will guide operating companies toward a better pilot test screening based upon the multiphase interactions (non-equilibrium dissolution and exsolution kinetics with presence of sand) of gas–oil–solid phase systems.
2. Material and Setup
This work expands upon prior research on the foamy oil process under similar operating conditions. Because the same oil sample, solvents and surfactants were used in both the previous bulk-phase study and the current porous media experiments, the basic experimental procedures are not repeated here, such as the constant composition expansion (CCE) and differential liberation (DL) tests used to determine oil properties. Readers can refer to Sabeti et al. [22] for additional setup details.
2.1. Sample Live Oil
A heavy oil sample with a viscosity of 1600 cP from Plover Lake, Canada, was mixed with sufficient CO2 solvent at 3600 kPa and 21 °C to prepare it as live oil for the foamy oil process in porous media by depleting the system’s pressure [22]. Later the live oil was mixed by a bio-soft non-ionic surfactant used to generate more stable bubbles. It is a general belief that the use of surfactant leads to higher bubble stability and controlling gas mobility in EOR processes [33,34]. The surfactant used in this work was pre-diluted and manufactured by Stepan Company.
2.2. Microfluidic Models Construction
The microfluidic models used in this study consist of two glass pieces, each 10–12 mm thick, fused together in a high-temperature furnace. AutoCAD 2019.1.3 was initially used to design three porous medium patterns, which were then processed by LaserCAD V8.17.13 to prepare them for engraving using a Boss Laser® machine (Boss Laser, LLC, Sanford, FL, USA) in our laboratory. Due to the properties of the glass and the available connections, the maximum pressure the system can withstand is approximately 2000 kPa.
After engraving, the second glass piece was drilled at predefined points corresponding to the locations of the injection/production wells and the end saturation points marked on the first piece. These drilled holes provide access points for permeability tests, heavy oil saturation, and foamy oil testing. The two glass pieces were aligned and heated in the furnace, gradually reaching 690 °C in 10 stages before cooling to room temperature, allowing for safe removal of the fused pieces. For this study, three pairs of microfluidic models with different porosities were constructed, with dimensions and physical properties listed in Table 1.

Table 1.
The dimension and physical properties of the etched micromodels.
Once drilled, 1/8 inch OD Swagelok straight connections were inserted into the holes, secured with adhesive, and left to dry for 24 h in preparation for a pressure leakage test. CO2 gas at 1500 kPa was used for this test, based on the operational requirements of the planned foamy oil experiments.
Each microfluidic model features two ports for accessing the porous media to measure saturation, permeability, and direct porosity, as well as for gas removal and cleaning. In the Supplementary Materials, a sample fluidic micromodel used in this study before and after the installation of the input/output connections is shown.
2.3. Microfluidic Setup
The setup for observing the foamy oil phenomenon includes a microfluidic cell with three stainless steel cylinders featuring movable pistons, a variety of digital and analog pressure meters and three ISCO pumps. A schematic of this setup is shown in Figure 1.
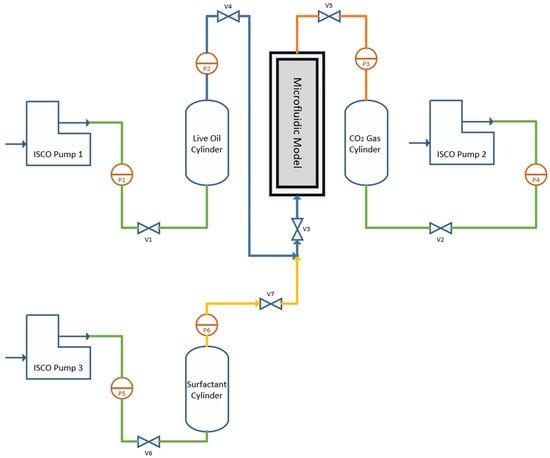
Figure 1.
Microfluidic foamy oil setup.
The stored CO2 gas in the Gas Cylinder was gradually transferred to the microfluidic cell at the beginning of each experiment. The pressure in the cylinder and microfluidic cell was then increased to 1500 kPa using ISCO pump 2, avoiding higher pressures to prevent damage to the sensitive microfluidic glass. Live oil from the Oil Cylinder and a non-ionic surfactant from the Surfactant Cylinder were introduced from below, regulated by ISCO pumps 1 and 3, respectively. During this phase, the pressure in the microfluidic cell was closely monitored and maintained slightly above 1500 kPa. After ensuring an adequate volume of heavy oil in the cell, the input valves from the Oil Cylinder and Surfactant Cylinder were closed. The initial oil height in the cell was recorded, and the pressure was gradually reduced from 1500 kPa to 250 kPa using pump 2 at a predefined rate. Over a period of 4 h, foamy oil height changes were documented with photographs at each stage.
This procedure was consistently applied across three distinct porous microfluidic models, each under a pressure reduction rate of 356 kPa/h and a surfactant volume concentration of 0.75% [22].
Prior to commencing the microfluidic tests, the pressure in the Live Oil Cylinder—containing a portion of the live oil sample—was carefully reduced to 1500 kPa. This pressure reduction, from an initial 3600 kPa to 1500 kPa, was carried out gradually over the course of a week to ensure equilibrium conditions. This allowed the CO2 gas within the live oil to migrate and accumulate at the top of the cylinder. The resulting cap gas was then carefully vented into the surroundings through a nozzle, regulated by a back-pressure regulator set at 1500 kPa. The entire procedure was performed with precision to prevent the pressure from falling below the target value of 1500 kPa.
2.4. Sandpack Setup
The methodology used in the microfluidic tests was also applied to a sandpack system with slight modifications. This setup included a packed cylinder measuring 2.4 cm in diameter and 28.1 cm in length, along with four transfer cylinders for injecting solvent, brine, surfactant, and live oil. The system was equipped with digital and analog pressure meters, a back-pressure regulator (BPR), a gas bubbler, and it was supported by four ISCO pumps.
The cylinder was filled with Ottawa sand (60–80 mesh) from one end while the other end was sealed. To eliminate any gaps and achieve the target porosity, careful attention was given to compacting the sand within the cylinder. Following this, a leakage test was performed using N2 gas, and measurements for porosity and permeability were completed to confirm the model’s integrity.
The sandpack setup was designed to closely resemble the microfluidic system used for observing bubble generation and foamy oil expansion, with a primary difference in the pressure reduction techniques employed. In the microfluidic setup, pressure reduction was achieved through a transfer cylinder directly connected to the glass, whereas in the sandpack model, a BPR controlled the pressure within the holder as shown in Figure 2. This distinction allowed the sandpack model to focus on monitoring oil recovery over time, whereas the microfluidic model concentrated on bubble evolution.
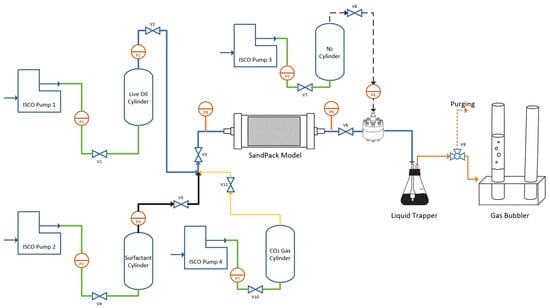
Figure 2.
Sandpack foamy oil setup.
To saturate the sandpack with live oil, valves V10, V11, V3, V6, V7, V8, and V9 were opened, allowing CO2 to saturate the model. Pump 3 maintained a pressure of 3600 kPa, while pump 4 injected gas into the sandpack holder at a pressure slightly above 3600 kPa. Once pressure readings at P9 indicated a level exceeding 3600 kPa, the BPR was slightly opened to vent gas through the three-way valve V9. After the completion of the gas saturation, pump 4 was turned off, and valves V10 and V11 were closed. Subsequently, valves V1, V2, V4, and V5 were opened, allowing live oil and surfactant to flow into the sandpack model, with pump 1 and pump 2 managing the flow rates of 0.1 mL/min for live oil and 0.0075 mL/min for surfactant. Approximately two pore volumes of oil were injected to ensure complete saturation with live oil. During this injection process, V9 remained slightly open to allow for the purging of gas, ensuring no free gas entered the gas bubbler prior to the start of the pressure depletion process.
With the sandpack fully saturated with oil, all valves except V6, V8, V7, and V9 were closed, and pumps 1 and 2 were deactivated. The BPR was set to reduce pressure at a rate of 356 kPa/h, gradually decreasing the pressure within the sandpack over an 11 h period until it reached atmospheric levels. As pressure decreased, foamy oil was generated through gas exsolution, with gas separating from the oil in the liquid trapper. The gas was directed to the gas bubbler, while dead oil was collected in the liquid trapper. Throughout the process, oil flow rates were measured by monitoring the liquid trapper’s level, and gas volumes evolved from the live oil were recorded in the gas bubbler.
3. Numerical Setup and Assumption
3.1. Numerical Micromodel Setup
The microfluidic cell used for conducting experiments was modeled in the STARS module of the CMG 2021.10 software. As shown in a figure in Supplementary Materials, the Cartesian coordinate system was employed for simulating the foamy oil in the microfluidic model. The geometry was considered two-dimensional, and the thickness of the model was represented by a single grid as the thickness of the physical microfluidic models is 0.1 mm. The grid distribution along the vertical and horizontal axes ranged from coarse to fine. Production occurred at the top of the geometry. The initial condition was set such that the lower portion of the model was saturated with live oil up to a specific level, above which CO2 gas was saturated. Upon initiating the pressure depletion process, the oil level rose due to the exsolution of the CO2 gas. The physical properties of the oil and CO2, such as oil viscosity, equilibrium conditions, density and molecular weight, measured in CCE and DL tests, were applied in the STARS module. Two main reactions were defined in the simulator: one related to the generation of bubbles and the other related to the collapse of bubbles in foamy oil. These two reactions represent the non-equilibrium reactions occurring in the simulations conducted in this work. The formulas applied for these reactions are shown in Equations (3) and (4) [22]:
where ∅ represents the porosity and ‘d1’ is the unknown coefficient that was tuned.
where ‘d2’ is the unknown coefficient that was tuned.
Equations (3) and (4) suggest that the rates of bubble generation and disappearance are also influenced by the porosity of the system. The appropriate values of d1 and d2 can accurately determine both the rate of foamy oil volume expansion and its viscosity. Through simulation and adjustment of the unknown coefficients in the bulk-phase model, the other constant values in Equations (1) and (2) were found [22]. The coefficients ‘d1’ and ‘d2’ were tuned using the CMG module CMOST. The optimization process for tuning the coefficients was based on Equation (5).
The default nonlinear solution technique employed in STARS (https://www.cmgl.ca/solutions/software/stars/, accessed on 25 August 2025) (which is the fully implicit method and solves all primary variables such as pressure and saturation simultaneously at each timestep) was applied in the simulation process. To achieve convergence for each simulation, the timestep and minimum pressure size were finely adjusted, although this resulted in increased simulation time and data storage requirements. Additionally, three different grid sizes were used to examine the solution’s dependency on mesh sizes. Enough grid numbers were considered to obtain robust and grid-size independent results in the simulation.
The influence of relative permeability, an important factor in these simulations, was analyzed using CMOST (https://www.cmgl.ca/solutions/software/cmost/, accessed on 25 August 2025) by defining saturation endpoints and maximum relative permeabilities for each phase. Following finding the endpoints and the maximum relative permeabilities, CMG software was then employed to draw relative permeability for each phase using Equations (6)–(9) [35]. The equations are independent of the model size and model geometry.
where
Krocw: Oil relative permeability at connate water.
Krwiro: Water relative permeability at irreducible oil.
Swcrit: Critical water saturation.
Sorw: Residual oil saturation.
Krgcl: Gas relative permeability at connate liquid.
Krogcg: Oil relative permeability at connate gas.
Slrg: Residual oil saturation.
Sgcrit: Critical gas saturation.
3.2. Numerical Sandpack Setup
The same numerical modeling approach used for the microfluidic models was also applied to the sandpack model. However, since the sandpack holder is stainless steel and more pressure-resistant, the operating pressure was set at 3600 kPa. The absolute permeability was determined through experiment, while the relative permeability was assumed to be the same as that of the microfluidic models. The geometry defined in the simulation for the sandpack model is cylindrical with the same dimensions as the physical sandpack model oriented horizontally. It was simulated with coarse, medium, and fine grid sizes in radial coordinates. The coarse grid sample is shown in Supplementary Materials. The production well was positioned at the far-right side of the model, and the system’s pressure was gradually reduced at a constant rate to extract oil from the well. Additionally, mesh independence was analyzed, similar to the previous model, to ensure that the results are not dependent on grid sizes.
In CMG (STARS or GEM), the cylindrical coordinate system is primarily intended for radial and axisymmetric flows. However, since the foamy oil flow in the present sandpack model aligns with the cylindrical axis—flowing along the length of the cylinder rather than radially—the most suitable method for simulation would involve 3D Cartesian geometry, which was not utilized in this work. Instead, a cylindrical model was employed to represent the geometry of the sandpack holder.
4. Results and Discussion
4.1. Live Oil Properties
By using differential liberation and constant composition expansion tests, the physical properties of the live oil were determined [22]. These properties included viscosities, solvent solubilities, and live oil densities, each measured at four different saturation pressures. The results are shown in Table 2. As observed from the table, as the pressure decreased from 3600 kPa to 400 kPa under equilibrium conditions, the solubility of CO2 in the heavy oil decreased, resulting in a lower mole fraction of dissolved gas. This reduction in dissolved gas was accompanied by an increase in oil density and viscosity, as well as a decrease in the swelling factor.
Table 2.
Live oil sample with the solvent gas CO2.
4.2. Foamy Oil in the Microfluidic Models
The next step of the work is to understand the effect of porosity on bubble generation, growth and the foamy oil process. For this purpose, with the pressure reduction rate of 356 kPa/h, the gas depletion process was started on the microfluidic model in the microfluidic setup (Figure 1). The system’s pressure was reduced to the ultimate pressure of 250 kPa. Note that three different microfluidic systems with porosities of 31%, 35%, and 40% were utilized for the experimental work.
Figure 3a depicts one of the microfluidic environments initially saturated with oil, where a section of the porous microfluidic media is filled with live oil without any bubbles present. As the system’s pressure decreases, the first bubbles emerge within the media, as illustrated in Figure 3b, with one bubble specifically highlighted by a hollow circle. This bubble is very small, making it challenging to observe with the naked eye. Over time, this bubble grows and elongates, as documented from Figure 3c–f, which trace the bubble’s expansion. By Figure 3g, the bubble merges with a neighboring bubble, and as it continues to grow, it finds a pathway to ascend. Figure 3h captures the bubble leaving its original location, moving upwards towards the gas–oil interface. Ultimately, Figure 3i demonstrates the bubble combining with other bubbles to form a single large bubble, which then rises at an increased speed. There are two main factors contributing to the generation of stable bubbles in both the bulk phase and porous media. First, the dispersion of CO2 molecules in the oil phase due to pressure reduction, which eventually leads to the liberation of CO2 gas, as shown in Table 2 and discussed in the previous section. Second, the increase in oil viscosity resulting from pressure reduction—which decreases the mobility of the generated bubbles and increases their retention time—allows them to remain in place for a longer period.
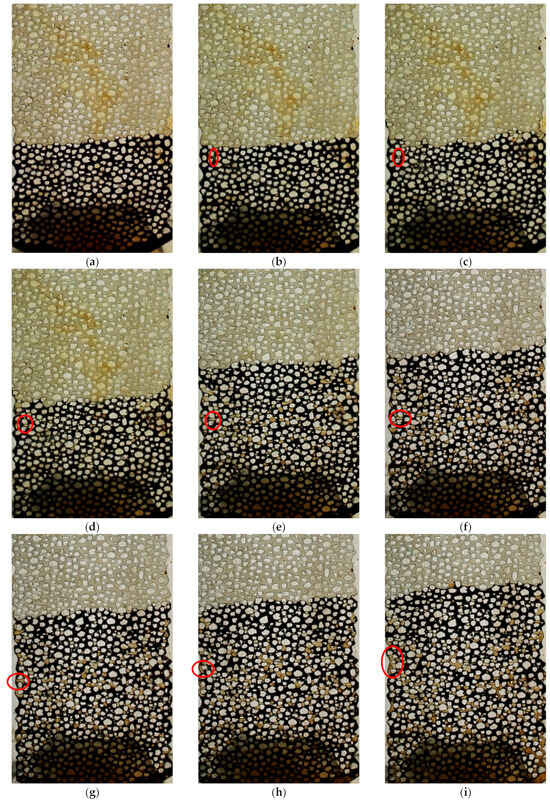
Figure 3.
The progression bubble formation in a foamy oil process in a porous media: (a) the beginning of the process, (b) bubble nucleation by reducing the system’s pressure at t = 5 min and P = 1470 kPa, (c–g) growths of the bubble from 7 to 40 min and pressure reduction from 1460 kPa to 1260 kPa, (h) rising the bubble to the interface at t = 52 min and P = 1190 kPa, (i) the bubbles coalesce with the other bubbles at t = 65 min and P = 1115 kPa.
There are two notable differences in bubble dynamics between the porous media and bulk phase that was investigated in the previous work [22]. In the bulk phase, bubbles typically assume a nearly semispherical shape, whereas in porous media, they become elongated, influenced by the system’s porosity. In the bulk phase, bubbles tend to be spherical due to surface tension, which acts uniformly around the bubble. The sphere has the smallest possible surface area for a given volume, making it the shape that minimizes energy for a single bubble in a homogeneous medium. This natural tendency towards energy minimization results in spherical bubbles. In porous media, the physical constraints and irregular pathways within the matrix influence bubble shape. The pores and throat spaces between grains of the media impose physical boundaries that can elongate bubbles as they navigate through these constricted pathways. The elongation is a response to the uneven distribution of forces and the need to adapt to the available space within the porous structure. Moreover, unlike in the bulk phase where bubbles begin ascending towards the oil–gas interface immediately upon formation, bubbles in porous media initially remain stationary. In porous media, the movement of bubbles is significantly influenced by viscous drag and the resistance created by the porosity of the media. The intricate network of pores, grains, and throats presents a physical barrier to bubble movement, increasing resistance and reducing the speed at which bubbles can rise. This resistance acts like a frictional force, slowing down the ascent of bubbles. This suggests that porosity introduces a form of resistance, preventing bubbles from rising easily; they must reach a sufficient size to overcome this resistance and ascend.
The experiments conducted in the models primarily measured the volume expansion of foamy oil over time for each test. Figure 4 presents the outcomes of these experimental tests. Although the tests extended beyond 250 min at their ultimate pressure of 250 kPa, the volume expansion changes were minimal beyond this point, hence the results are displayed for durations shorter than 250 mi. The curves on the figure illustrate the foamy oil volume over the micromodel’s pore volume on the y-axis, based on the assumption of consistent porosity across the micromodels. As pressure within the micromodels decreased, expansion of foamy oil was observed. The figure reveals that oil volume expansion in models with 31% porosity exhibits a more pronounced volume increase compared to the other scenarios. A key observation is that the surfaces within the microfluidic models serve as active sites, facilitating bubble nucleation. Consequently, porous media offer greater opportunities for bubble formation, leading to increased foamy oil volume expansion. The phenomenon of greater expansion with lower porosity was noted in the work of Liu et al. [36].
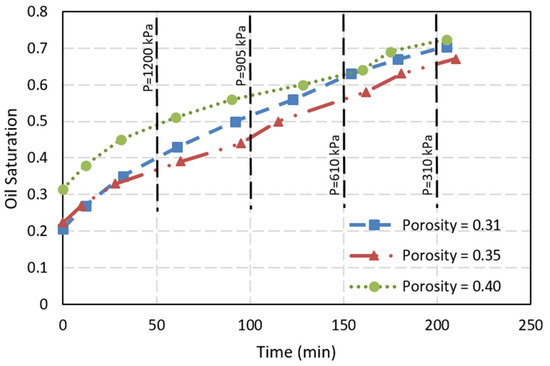
Figure 4.
Oil volume expansion during pressure reduction in three microfluidic systems with porosity of 31%, 35% and 40%.
The commencement and end of Test 1 with a porosity of 31%, Test 2 with a porosity of 35%, and Test 3 with a porosity of 40% are shown in Supplementary Materials. Compared to bulk-phase foamy oil [22], the foamy oil in porous media exhibits greater volume expansion. For the same input parameters of 100% pure CO2, a 0.75% surfactant volume fraction, and a pressure reduction rate of 356 kPa/h, the maximum expansion ratio in the bulk phase is about two [22]. However, in the microfluidic tests, the peak expansion ratio exceeds two and a half times their initial heights. Additionally, it was noted that while a rapid volume decrease occurred in the bulk-phase test, the expanded volume in the micromodels did not immediately revert after maintaining a constant pressure of 250 kPa for 6 h. This is attributed to the porous media’s impedance of the free movement of the oil, bubble, and gas mixture. Consequently, the separation of oil from collapsed bubbles (or free gas) is not as promptly facilitated.
There are several insights regarding bubble movement in porous media that highlight how porosity influences their mobility, coalescence and ascent. In media with high porosity, bubbles have greater freedom of movement due to reduced flow resistance, alongside numerous pathways and broader channels for movement and merging. Additionally, the surrounding fluid can flow more freely, decreasing the viscous drag on the bubbles. For these reasons, bubbles in highly porous media can navigate through channels more easily, combine, and rise. This phenomenon is depicted in Figure 5a–c. Figure 5 illustrates the state of foamy oil in three microfluidic systems 45 min after initiating the pressure reduction process. The porosity in the sample shown in Figure 5a is the lowest, while it is the highest in Figure 5c. In the low porosity media, as seen in Figure 5a, the bubble sizes are smaller and uniformly distributed. In contrast, in high porosity media, as illustrated in Figure 5c, the bubbles are larger and form a gas network within the matrix. Figure 5b captures an intermediate state with medium porosity, bridging the two extremes.
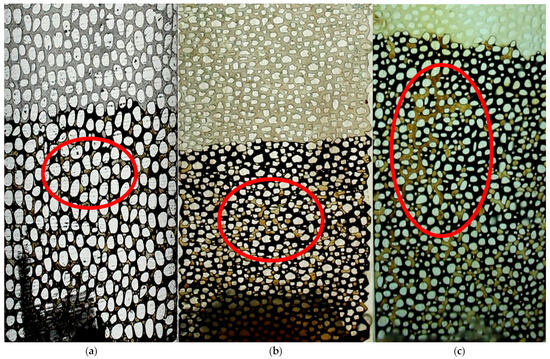
Figure 5.
Coalescence of bubbles and their escape from the porous media with a porosity of (a) 31%, (b) 35%, (c) 40% at t = 45 min and P = 1220 kPa.
An additional noteworthy point is that in the bulk phase, bubbles typically originate at the boundaries or surfaces which serve as nucleation sites. These sites effectively reduce the energy barrier for bubble formation, facilitating the initiation of bubbles at these boundaries. Conversely, porous media offer loads of nucleation sites throughout their structure, attributed to the natural irregularities and extensive surface area of the porous matrix. This abundance of nucleation sites in porous media enables bubble formation not only at the boundaries but also across the entire medium. The bubble distribution in the foamy oil within a Hele-Shaw cell is illustrated in Supplementary Materials. Observations from the figure reveal that bubbles accumulate on two sides of the model, indicating that bubbles nucleate along the edges and, as they grow, are pulled towards the model’s center where lower shear viscosity allows them to ascend more readily. Conversely, the bubbles within the porous microfluidic system nucleate uniformly throughout the matrix, with their numbers exceeding those in the bulk system under the same pressure reduction conditions of 356 kPa/h. The rapid nucleation of bubbles on a solid, non-smooth surface aligns with the observations reported by Wang et al. [32] during their foamy oil experiments on abraded surfaces.
Figure 6 illustrates the texture of the live oil before and after reaching the critical supersaturation pressure which is higher than P = 1450 kPa in the micromodel with 40% porosity. Prior to reaching the critical supersaturation pressure, as shown in Figure 6a, no bubbles are generated. However, as the oil becomes supersaturated and on the verge of bubbling, several bubbles begin to form almost simultaneously on the solid surfaces of the matrix. Figure 6b depicts the nucleation and distribution of these bubbles post critical supersaturation pressure. Bubbles that are near or attached to solid sites are highlighted with red circles, while those farther from surface sites are marked with blue circles. It was observed that bubbles initially form on surfaces and then detach, moving towards the pore spaces within the micromodel’s matrix.
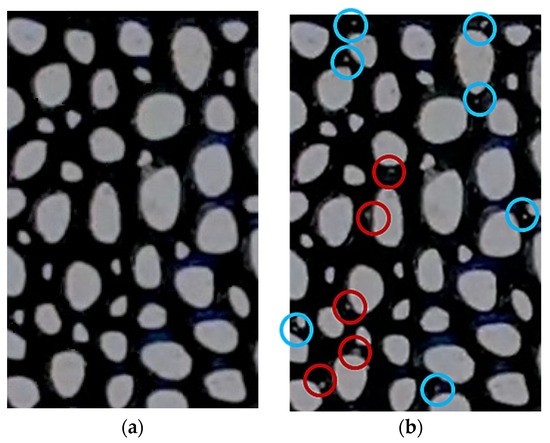
Figure 6.
Live oil (a) before true-bubble pressure without bubbles and (b) after true-bubble pressure with nucleated bubbles.
In the microscopic image shown in Figure 7, the mechanism of bubble nucleation on a surface and their subsequent detachment is evident. The bubble nucleation shown in the figure was recorded approximately 15 min after the pressure depletion process began in the microfluidic model with 40% porosity, when the pressure was around 1400 kPa. The bubble departure was observed within just two minutes, at a pressure of approximately 1386 kPa. Sangwal [30], applying the concept of chemical potential and the Van der Waals equation of state, demonstrated that the work required for nucleation on a solid surface is less than that in the bulk liquid phase. The work required in the bulk phase and on the solid surface is presented in Equations (10) and (11), respectively:
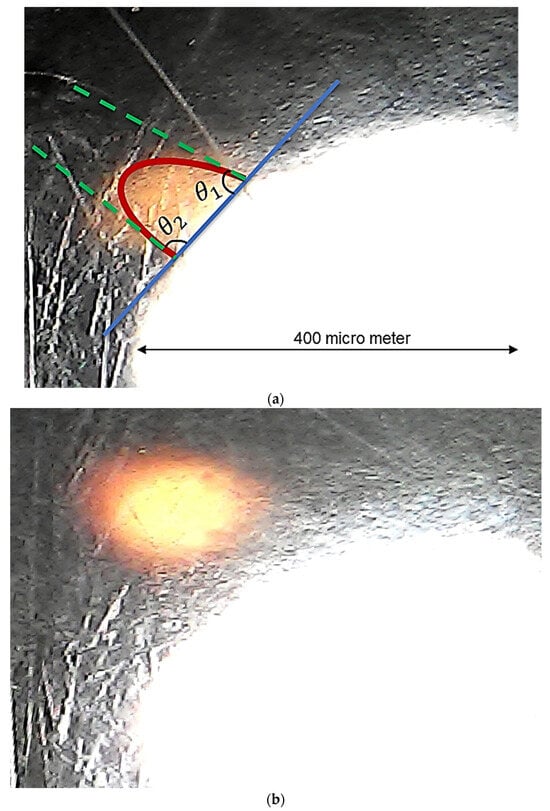
Figure 7.
Bubble generation dynamic: (a) nucleation on surface; (b) departure from the surface.
Here, Wb and Wp represent the work (energy needed) in the bulk phase and on the solid surface, respectively. is the interfacial tension between the bubble gas and oil. denotes the pressure gradient between the bubble and the oil, and is a factor dependent on the wetting angle, which can be estimated using Ψ-figure shown in Supplementary Materials.
The wetting angles for the tiny bubble in Figure 7a are 78° and 86°. Consequently, based on the factor in Equation (11), the energy required for formation is at most half of what would be needed in the pore space. Due to this lower energy consumption, bubbles predominantly nucleate on the surface. Subsequently, as shown in Figure 7b, the bubbles detach from the solid surface and migrate to the pore spaces.
One of the primary mechanisms in foamy oil is the coalescence of bubbles, as depicted in Figure 8. This process begins when two bubbles move toward each other, often driven by the pressure gradient within the pore space. As they come into contact, the oil film separating them gradually thins out due to drainage, leading eventually to their merger into a single larger bubble.
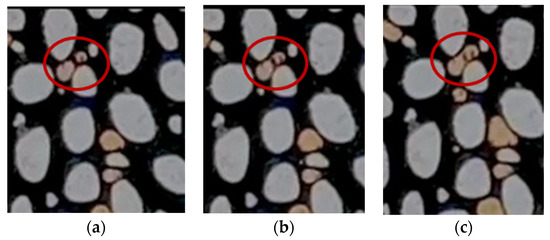
Figure 8.
The mechanism of bubble coalesces in the micromodel (a) two bubbles are far from each other, (b) one bubble moves toward the other, and (c) two bubbles are merged.
Researchers, including George et al. [26], have studied the coalescence mechanism and attempted to model the required time for this process mathematically. They detailed each step of the mechanism, as illustrated in the Supplementary Materials. Their findings suggest that initially, two bubbles within a narrow throat approach each other. Subsequently, the shared oil lens between them begins to drain, eventually leading to the merging of the two bubbles. The oil between the bubbles, referred to as the oil lens, is pushed out and escapes through the corners of the throat, as depicted in the figure in the Supplementary Materials.
Although the mechanism introduced by George et al. [26] is promising and useful for mathematical modeling, it overlooks the expansion of the bubbles during the coalescence process. The actual timing for coalescence is shorter than their reported values because, as depicted in Figure 8, the bubbles expand due to gas diffusion and pressure reduction, and the thickness of the oil lens decreases more rapidly. Moreover, the merged bubble in the revised mechanism presented here is larger than that reported in George et al.’s study [26].
Apart from this, the merging process is more common in porous media than in the bulk phase, as throats and solid surfaces in porous media control the departure of bubbles. Consequently, bubbles are more likely to halt and merge, especially in narrow throats which limit bubble movement. In bulk-phase systems, after forming at the edges, bubbles can freely move to the center and rise, leaving little time for them to merge. In the Hele-Shaw cell, the primary zone for bubble combination is at the gas–oil interface, where bubbles tend to accumulate and stop. Thus, it can be argued that coalescence is not the predominant mechanism in foamy oil processes within the bulk-phase system.
The breakup of bubbles frequently occurs in porous media, particularly where there is a high pore aspect ratio in the matrix. The process of tip-splitting is illustrated in Figure 9. The highlighted bubble is in motion; a small portion of the bubble traverses the throat, while the main body cannot pass through readily. Subsequently, the neck of the bubble begins to constrict until the tip is separated from its main body. This tip-splitting or snap-off mechanism is more pronounced in areas of lower porosity in the present study, as lower porosity correlates with a greater aspect ratio. Therefore, the micromodel with the lowest porosity has the higher foamy oil volume expansion (see Figure 4) and smaller bubbles (see Figure 5).
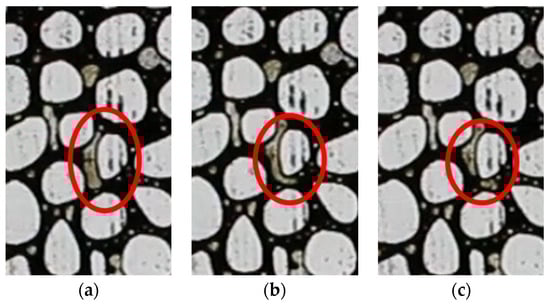
Figure 9.
Tip-splitting mechanism: (a) the beginning of the process, (b) the middle of the process, and (c) the end of the process.
4.3. Foamy Oil in the Sandpack Model
The experimental setup depicted in Figure 2 was utilized for operating the foamy oil process and collecting data in a large-scale model in this work. This phase is crucial because the findings of this study can be applied in estimating oil recovery at a pilot scale. Employing the experimental techniques, it was measured that the porosity of the sandpack is 35 percent, and the permeability of the sandpack is 5.5 Darcy. The same operational conditions were applied to the sandpack model.
During the test, the accumulated oil and gas production were monitored, and they are displayed in Figure 10. As observed from the figures, oil production increased over time with pressure depletion. The oil entered the liquid trapper (as shown in Figure 2), which provided sufficient residence time at atmospheric pressure for the dissolved gas to evolve, bubbles to break, and the gas to be routed to the gas bubbler. The oil production rate during the first 60 min was initially slow, as production was primarily driven by oil expansion resulting from pressure reduction. Although the pressure dropped rapidly within the first few minutes, only a small amount of gas was generated. This is because bubble nucleation in high-viscosity heavy oil occurs slowly and requires a certain level of supersaturation to initiate. The nucleated bubbles were small and did not generate a significant driving force for production. Over time, as the pressure continued to decline, the nucleated gas bubbles grew larger, occupying more space and leading to an increase in the oil production rate. From 280 min onward, oil production ceased as the remaining oil stayed in the sandpack even through the pressure reduction, but gas production continued due to further pressure reductions causing more gas to evolve from the live oil. Additionally, when comparing the gas–oil ratio results with those from the differential liberation test, a good agreement was confirmed. The observation that the production rate declines to a complete halt during the depletion process has been documented by other researchers too [37,38,39].
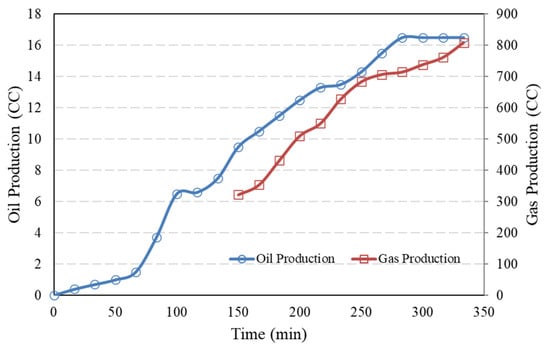
Figure 10.
Accumulated oil and gas production for the sandpack model with porosity 35%.
4.4. Simulation
4.4.1. Micromodel Simulation Results
Note that a numerical uncertainty analysis in the simulation process was initially conducted to ensure that any differences observed were justified and not due to improper comparability by varying the mesh density. In fact, errors can be minimized through uncertainty analysis. The Grid Convergence Index (GCI) [40], which offers a standardized measure of convergence for grid refinement, was the method applied in this study. In this way, three different mesh sizes were employed to examine the simulation results, as depicted in Supplementary Materials. The mesh distributions were 19 grids × 5 grids × 1 grid, representing a coarse mesh; 38 grids × 10 grids × 1 grid, representing a medium mesh; and 76 grids × 20 grids × 1 grid, representing a fine mesh. It is evident that the ratio of increase in mesh size from coarse to fine grids is two. This factor will be useful later for further analysis of mesh independence in the simulation results. With the increase in the number of meshes in the STARS module, both the running time and the output data size increased exponentially. This increase is due to the simulator needing to solve more partial differential equations for each grid and requiring more drive space to accommodate the larger volume of data.
The grid refinement technique used in this study was based on Roache’s theory [40]. Richardson extrapolation for the problem is defined as
f refers to the grid solution (f represents the final oil volume saturation in this study), is the ratio of grid spacing on the two grids, and is the order of the convergence rate and it is
The range of can be a value between 0.5 and 3 based on the implemented numerical method.
Note that in this study, f1, f2, and f3 indicate the grid solution for fine, medium, and coarse grids, respectively. In this work, f represents the ultimate oil saturation value.
where
means monotonic convergence.
means oscillatory convergence.
represents divergence.
The GCI for the fine grid solution, then, can be written as
while Fs is a safety factor and it was 1.25 in the present work.
As listed in Table 3, there is a reduction GCI value for the successive grid refinements (GCI2 < GCI3) in the current foamy oil simulation results. The GCI for the finer grid (GCI2) is relatively low if one compares GCI2 to the coarser grid GCI3. It means the finer mesh successfully reaches the spatial convergence of the CMG simulations.
Table 3.
Grid convergence variables and order of accuracy for coarse, medium, and fine grids.
There are three typical GCI ranges in the simulation. The small GCI (less than 5%) represents that the numerical solution is near to the exact value, and its result is independent of the grid numbers. The moderate GCI (between 5 and 10%) shows acceptable results but there is a grid dependency somewhat for the simulation. The last case is when the GCI is large (higher than 10%) and there is significant grid dependency, and there should be more refinement for the grids.
By examining Table 3, it is clear that the error value, is less than , indicating that refining the mesh to create finer grids successfully reduced the simulation error. Additionally, the R value is 0.375, suggesting that the simulator achieved monotonic convergence, demonstrating uniform improvement with finer meshes. Moreover, GCI2 is smaller than GCI3 and stands at 4%, indicating that the numerical solution is close to the exact value. Combining these three factors, it can be inferred that the 76 grids × 20 grids × 1 grid configuration, as the finest grid used in this work, is suitable for simulation, providing reliable and mesh-independent results.
As detailed in Section 3, the saturation endpoints and porosity exponent coefficients in foamy oil reactions were input as variables into CMOST, which conducted several simulations to align closely with the experimental data. The history matching output included oil saturation distribution across the micromodel and the simulation grids. The optimal oil–gas relative permeability values, identified through the history matching process in CMOST, are displayed in Supplementary Materials. These relative permeability curves, determined for the medium-porosity micromodel, were applied to tests involving the other two porous micromodels.
The primary goal of this section is to understand the dynamics of non-equilibrium reactions that drive bubble formation and dissolution in porous media, considering the found relative permeability curves. These reactions, originating from dissolved gas, and their associated creation and rupture mechanisms were previously detailed in Equations (3) and (4). Two adjustable coefficients were identified, in addition to the saturation endpoints discussed earlier, that significantly affect how porosity influences bubble dynamics. Table 4 lists the average values of the coefficients suggested by CMOST. Subsequent results and figures will utilize these coefficients from Table 4. The two kinetic equations that describe bubble evolution in foamy oil can be used later to estimate the oil production rate and GOR under the same oil and rock properties and the same EOR process in large-scale CSI applications.
Table 4.
The tuned coefficients of Equations (3) and (4) generated with CMOST.
To gain deeper insights into the simulation results, the models’ geometry was divided into three sections, and oil saturation in these sections was determined through simulation. The results were then compared with experimental data. A figure in the Supplementary Materials illustrates the volume expansion of foamy oil, along with its spatial subdivisions. Each of the three images in the figure is divided into three equal sections. This segmentation facilitates more detailed monitoring of foamy oil flow and oil saturation across the model over time during the pressure depletion process. In this study, f in Equation (15) represents the ultimate oil saturation value in Section 2 of one of the microfluidic model tests shown in the figure in Supplementary Materials. Section 2 was chosen because it best represents the average oil saturation in the microfluidic model during the foamy oil test.
To determine the oil saturation in each of the three sections at various recorded times during the foamy oil tests, the image processing technique using MATLAB v2015 b was employed. It is observed that over time, as the dissolved gas evolves from the oil, some of the gas finds a path to escape from the oily phase while other portions remain trapped below the oil–gas interface in the porous media, unable to find a way out. Some of these trapped gases form bubbles that are beneficial for foamy oil. In fact, gas that escapes does not contribute to foamy oil expansion. Conversely, oil that retains trapped gas or contains bubbles will benefit the foamy oil process.
The analysis of the work continued by comparing the oil saturation of the three sections both experimentally and numerically over time, from the start to the end of the foamy oil depletion process. Figure 11 presents the experimental data and simulation curves of oil saturations for the micromodel with 31% porosity. The root mean square error (RMSE) between the experimental and numerical results is 0.09. As seen in the figure, in Section 1 of the micromodel, oil saturation shows a decreasing trend to 60%. However, in the middle and upper sections, the oil saturation initially starts at zero but increases over time as the foamy oil expands and reaches the upper boundaries, rising to 55%. With an RMSE of 0.09 relative to the range of experimental values, the simulation can be considered to have good accuracy.
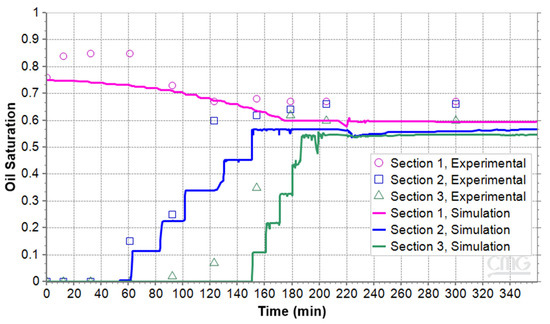
Figure 11.
Oil saturation during pressure reduction in the microfluidic system with porosity of 31%.
When comparing the experimental and numerical results, some discrepancies are evident, especially at the beginning of the process; however, the trend of the simulation results aligns with the test results.
The oil saturations in the three sections for the two other micromodels with the porosity of 35% and 40% are shown in Figure 12 and Figure 13. Their RMSE values are 0.05 and 0.16, respectively. With an RMSE of 0.16 relative to the range of experimental values, the simulation can be considered to have moderate accuracy. The figures illustrate that oil saturation in Section 1 decreases continuously. In contrast, the oil saturation in the middle and upper sections begins at zero and gradually increases as the foamy oil ascends and reaches the top. While there are noticeable differences between the experimental and numerical data, particularly at the start, the overall trend in the simulation results is consistent with the experimental findings. When the results of the three micromodels were compared, it was observed that higher porosity led to higher permeability and less foamy oil. The processed images showed that the number of gas channels or bubble clusters was greater than that of microbubbles in the lower porosity micromodel. As a result, the expansion of foamy oil as well as average of oil saturation in the 40% porosity model was less than in the 31% porosity model.
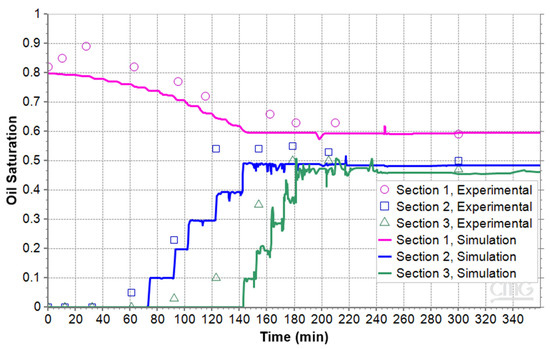
Figure 12.
Oil saturation during pressure reduction in the microfluidic system with porosity of 35%.
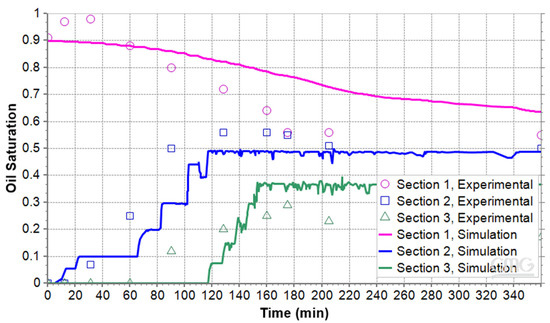
Figure 13.
Oil saturation during pressure reduction in the microfluidic system with porosity of 40%.
4.4.2. Sandpack Simulation Results
All experimental data from the microfluidic model tests, especially the relative permeability found in the micromodel analyses, were incorporated into the STARS numerical simulator for the sandpack. The Grid Convergence Index technique was again employed to ensure mesh independence in the sandpack simulation results. Therefore, the simulator was set to fine grids of 20 × 1 × 112 for the cylindrical model.
The simulation results indicate a correspondence between the simulated and experimental data for accumulated oil production, as depicted in Figure 14. Although there is a maximum error of 22% in the simulation’s estimations, the trend aligns well with the experimental oil recovery data. Both numerical and experimental results indicate that oil production nears zero after 280 min and the pressure depletion process helps no longer. In fact, the oil production ceased when the pressure drops below 1800 kPa. The trend of the oil production rate is also illustrated in the figure, showing a high rate up to 220 min into production, after which it sharply declines as pressure continues to decrease. The total oil recovery came to 37% of the initial oil in the place.
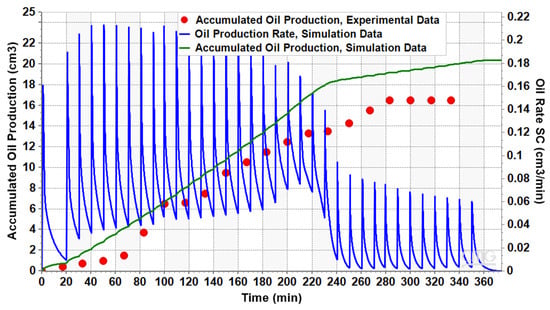
Figure 14.
The numerical and experimental oil production results for the sandpack model.
The simulation results also show an agreement between the trend of the simulated and experimental data for accumulated gas production, as illustrated in Figure 15. Both numerical and experimental results reveal that gas production continued as system pressure decreased, allowing gas to evolve more easily from the oil and exit the sandpack holder due to its higher mobility. Notably, gas production rate increased after 220 min in production period, suggesting a transition of gas bubbles to free gas beyond this point [7,8]. The trend of the gas production rate, depicted in the figure, shows a low rate up to 220 min, after which it increased as the pressure further decreases. It confirms the optimal shut-in pressure during the CSI process is not atmospheric pressure. For example, given the fluid and operational characteristics in this study, the best shut-in pressure was determined to be approximately 1800 kPa. The shut-in pressure is important in field operations, as production operators need to determine the optimum time to terminate production from the well and initiate another solvent injection cycle, in order to maximize oil recovery while minimizing energy consumption.
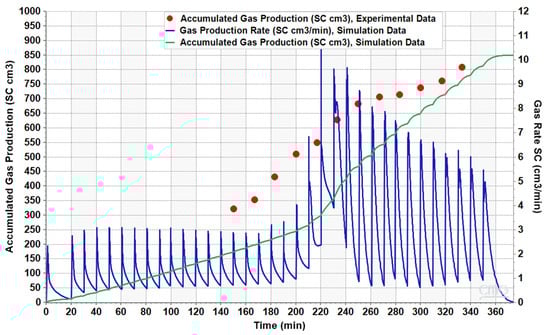
Figure 15.
The numerical and experimental gas production results for the sandpack model.
By comparing simulation results with experimental data, it is evident that while the simulation overestimates oil production, it underestimates total gas production compared to the experimental data. This discrepancy might be attributed to the presence of gas channels in the three-dimensional pattern that were not captured in the two-dimensional micromodels. In reality, flow within the cylinder was not perfectly uniform, and numerous micro gas channels likely formed around the axis of the sandpack, aligned towards the production port. When bubbles moved towards them, they burst into free gas and escaped from the sandpack. Indeed, gas trapping by the oil phase in the sandpack did not mimic that in the micromodel exactly. Consequently, gas bubbles converted to free gas more quickly and escaped from the sandpack, resulting in higher gas production and lower oil production than initially anticipated. The other reason may be the high relative permeability for gas which was found based on the micromodels’ analyses.
The results of this work, which demonstrate the kinetics of bubble generation and collapse, can be further applied to predict flow behavior and production rates in a pilot test when the same dead oil is used. Although the kinetics may not remain accurate under different operating conditions or with oils of varying properties, the methodology itself remains valid for determining the appropriate kinetics under new conditions.
It should be noted that other matrix properties of porous media, such as surface heterogeneity and wettability, also influence bubble evolution during the foamy oil process. Although these factors are important for understanding the underlying mechanisms of oil production during primary recovery in the field, they were not addressed in this study.
5. Conclusions
This research involved an in-depth examination of the influence of porosity on bubble dynamics in the foamy oil process. To obtain the results, two types of experiments were conducted using micromodels and sandpack. In addition, CMG simulations were performed to complement the experimental findings. The main results are summarized below.
- Unlike the nearly hemispherical shape of bubbles in the bulk phase, bubbles in porous media are elongated. The shape of bubbles in porous media is affected by physical constraints and the matrix’s irregular pathways.
- Contrary to the immediate ascent of bubbles towards the oil–gas interface in the bulk phase, bubbles in porous media initially remain stationary. Their movement is significantly influenced by viscous drag and the resistance offered by the media’s porosity.
- Data indicated that models with 31% porosity showed a more notable volume increase compared to other cases. The peak expansion ratio in the microfluidic model surpassed 2.5 times its initial height. The expansion value for the model with 40% porosity was found to be 2.3.
- True-bubble point pressure decreased with increasing porosity and occurred approximately 50 kPa after the saturation pressure in the porous microfluidic media.
- Unlike the bulk-phase test where rapid volume reduction occurred once pressure reduction halted, the expanded volume in micromodels did not immediately revert. This phenomenon is attributed to the impedance of free movement by the porous media for the mixture of oil, bubble, and gas.
- Bubbles often form at the boundaries of the geometrical model in the bulk phase, which act as nucleation sites. In contrast, porous media provide numerous nucleation sites distributed across their internal surface area.
- Two equations of non-equilibrium reactions affected by the porosity were derived based on the micromodels and validated in the larger scale sandpack model.
- The maximum oil recovery achieved through sandpack model using the optimum operating conditions was 37% of the initial oil in place.
- Both the simulation and experimental results confirmed that once the pressure dropped below 1800 kPa, the critical gas saturation pressure, the oil production became negligible.
Supplementary Materials
The following supporting information can be downloaded at https://www.mdpi.com/article/10.3390/pr13103067/s1, Figure S1. The microfluidic glass (a) perforated and fused together (b) with inserted input/output connection; Figure S2. The initial stage of foamy oil process in a microfluidic cell applied in the STARS simulator; Figure S3. The initial stage of foamy oil process in the sand pack model; Figure S4. Microfluidic system under studying with porosity of 31%; Figure S5. Microfluidic system under studying with porosity of 35%; Figure S6. Microfluidic system under studying with porosity of 40%; Figure S7. The distribution of bubbles in (a) the bulk phase and (b) porous medium; Figure S8. Dependence of ψ factor to the wetting angle (Kashchiev 2000 [30]); Figure S9. Bubble coalescence dynamic introduced by George et al. (2005) [26]; Figure S10. New bubble coalescence mechanism; Figure S11. The mesh distribution over one sample of the microfluidic models; Figure S12. The tunned oil-gas relative permeability graphs used for the present study; Figure S13. Division of model’s area into three parts in a microfluidic system with porosity of 31%; Figure S14. The MATLAB processed images depict oil saturation for 31% porosity; Figure S15. The numerical results depict oil saturation for 31% porosity.
Author Contributions
Conceptualization, M.S.; methodology, M.S.; software, M.S.; validation, M.S.; formal analysis, A.C.; investigation, M.S.; resources, M.S.; data curation, A.C. and M.S.; writing—original draft preparation, M.S.; writing—review and editing, F.T.; visualization, F.T.; supervision, F.T.; project administration, F.T.; funding acquisition, F.T. All authors have read and agreed to the published version of the manuscript.
Funding
This research received no external funding.
Data Availability Statement
Data available on request from the authors.
Acknowledgments
This study was performed at the University of Regina and its laboratories and devices were used to conduct the experimental and numerical tests.
Conflicts of Interest
The authors declare that they have no conflicts of interest.
Nomenclatures
| Latin Letters | ||
| Symbol | Unit | Definition |
| () | Concentration of bubbles | |
| () | Concentration of bubbles in equilibrium condition | |
| () | Concentration of dissolved gas | |
| () | Concentration of dissolved gas in equilibrium condition | |
| () | Activation energy | |
| Krgcl | Gas relative permeability at connate liquid | |
| Krogcg | Oil relative permeability at connate gas | |
| Krocw | Oil relative permeability at connate water | |
| Krwiro | Water relative permeability at irreducible oil | |
| Relative permeability exponent for gas | ||
| Relative permeability exponent for oil–gas | ||
| Relative permeability exponent for oil–water | ||
| Relative permeability exponent for water | ||
| () | The universal gas constant | |
| Sgcrit | Critical gas saturation | |
| Slrg | Residual oil saturation | |
| Sorw | Residual oil saturation | |
| Swcrit | Critical water saturation | |
| Temperature | ||
| Results of experiments | ||
| Results of simulations | ||
| Bubble generation energy in bulk phase | ||
| Bubble generation energy on the solid surface (porous media) | ||
| Surfactant concentration | ||
| Porosity exponent in bubble generation rate | ||
| Porosity exponent in bubble rupture rate | ||
| Rate of pressure reduction | ||
| f | Calculation result in a specific grid number | |
| Order of the convergence rate | ||
| Ratio of grid spacing | ||
| Rate of bubble generation from dissolved gas | ||
| Rate of bubble rupture to free gas | ||
| Greek Letters | ||
| Symbol | Unit | Definition |
| Wetting angle factor | ||
| Wetting angle | ||
| Solution error | ||
| Interfacial tension | ||
| Porosity | ||
| List of Acronyms | ||
| BPR | Back-Pressure Regulator | |
| CCE | Constant Composition Expansion | |
| CMG | Computer Modeling Group | |
| CSI | Cyclic Solvent Injection | |
| DL | Differential Liberation | |
| EOR | Enhanced Oil Recovery | |
| GCI | Grid Convergence Index | |
| NMR | Nuclear Magnetic Resonance | |
| OD | Outer Diameter | |
| RMSE | Root Mean Square Error | |
References
- Maini, B.B. Effect of Depletion Rate on Performance of Solution Gas Drive in Heavy Oil Systems. In Proceedings of the SPE Latin American and Caribbean Petroleum Engineering Conference, Port-of-Spain, Trinidad and Tobago, 27–30 April 2003. [Google Scholar]
- Kumar, R.; Pooladi-Darvish, M.; Okazawa, T. Effect of Depletion Rate on Gas Mobility and Solution Gas Drive in Heavy Oil. SPE J. 2002, 7, 213–220. [Google Scholar] [CrossRef]
- Bayon, Y.; Coates, R.; Lillico, D.; Cordelier, P.R.; Sawatzky, R. Application and comparison of two models of foamy oil behavior of long core depletion experiments. In Proceedings of the SPE International Thermal Operations and Heavy Oil Symposium, Calgary, AB, Canada, 4–7 November 2002; p. SPE–78961-MS. [Google Scholar]
- Du, Z.; Zeng, F.; Peng, X.; Chan, C. Optimizing the pressure decline rate on the cyclic solvent injection process for enhanced heavy oil recovery. J. Pet. Sci. Eng. 2016, 145, 629–639. [Google Scholar] [CrossRef]
- Bryan, J.; Butron, J.; Nickel, E.; Kantzas, A. Measurement of Non-Equilibrium Solvent Release from Heavy Oil during Pressure Depletion. In Proceedings of the SPE Canada Heavy Oil Technical Conference, Calgary, AB, Canada, 13–14 March 2018. [Google Scholar]
- Chen, T.; Leung, J.Y.; Bryan, J.L.; Kantzas, A. Analysis of non-equilibrium foamy oil flow in cyclic solvent injection processes. J. Pet. Sci. Eng. 2020, 195, 107857. [Google Scholar] [CrossRef]
- Sawatzky, R.P.; Lillico, D.A.; London, M.J.; Tremblay, B.R.; Coates, R.M. Tracking Cold Production Footprints. In Proceedings of the Canadian International Petroleum Conference, Calgary, AB, Canada, 11–13 June 2002. [Google Scholar]
- Bennion, D.B.; Mastmann, M.; Moustakis, M.L. A Case Study of Foamy Oil Recovery in the Patos-Marinza Reservoir, Driza Sand, Albania. J. Can. Pet. Technol. 2003, 42, PETSOC-03-03-01. [Google Scholar] [CrossRef]
- Torabi, F.; Asghari, K. Effect of Connate-Water Saturation, Oil Viscosity, and Matrix Permeability on Rate of Gravity Drainage during Immiscible and Miscible Displacement Tests in Matrix-Fracture Experimental Model. In Proceedings of the Canadian International Petroleum Conference, Calgary, AB, Canada, 16–18 June 2009. [Google Scholar]
- Chung, F.; Jones, R.; Burchfield, T. Recovery of viscous oil under high pressure by CO2 displacement: A laboratory study. In Proceedings of the SPE International Oil and Gas Conference and Exhibition in China, Tianjin, China, 1–4 November 1988; p. SPE–17588-MS. [Google Scholar]
- Sayegh, S.; Maini, B. Laboratory evaluation of the CO2 huff-n-puff process for heavy oil reservoirs. J. Can. Pet. Technol. 1984, 23, PETSOC-84-03-02. [Google Scholar] [CrossRef]
- Wolcott, J.; Schenewerk, P.; Berzins, T.; Karim, F. A parametric investigation of the cyclic CO2 injection process. J. Pet. Sci. Eng. 1995, 14, 35–44. [Google Scholar] [CrossRef]
- Abedini, A. Mechanisms of Oil Recovery During Cyclic CO2 Injection Process: Impact of Fluid Interactions, Operating Parameters, and Porous Medium. Ph.D. Thesis, University of Regina, Regina, SK, Canada, 2014. [Google Scholar]
- Abedini, A.; Torabi, F. Oil recovery performance of immiscible and miscible CO2 huff-and-puff processes. Energy Fuels 2014, 28, 774–784. [Google Scholar] [CrossRef]
- Pu, W.; Wei, B.; Jin, F.; Li, Y.; Jia, H.; Liu, P.; Tang, Z. Experimental investigation of CO2 huff-n-puff process for enhancing oil recovery in tight reservoirs. Chem. Eng. Res. Des. 2016, 111, 269–276. [Google Scholar] [CrossRef]
- Luo, P.; Zhang, Y.; Wang, X.; Huang, S. Propane-enriched CO2 immiscible flooding for improved heavy oil recovery. Energy Fuels 2012, 26, 2124–2135. [Google Scholar] [CrossRef]
- Li, H.; Zheng, S.; Yang, D. Enhanced Swelling Effect and Viscosity Reduction of Solvent(s)/CO2/Heavy-Oil Systems. SPE J. 2013, 18, 695–707. [Google Scholar] [CrossRef]
- Qazvini Firouz, A.; Torabi, F. Feasibility Study of Solvent-Based Huff-n-Puff Method (Cyclic Solvent Injection) to Enhance Heavy Oil Recovery. In Proceedings of the SPE Heavy Oil Conference Canada, Calgary, AB, Canada, 12–14 June 2012. [Google Scholar]
- Jia, X.; Zeng, F.; Gu, Y. Pressure Pulsing Cyclic Solvent Injection (PP-CSI): A New Way to Enhance the Recovery of Heavy Oil through Solvent-Based Enhanced Oil Recovery Techniques. In Proceedings of the SPE Annual Technical Conference and Exhibition, New Orleans, LA, USA, 30 September–2 October 2013. [Google Scholar]
- Sun, X.; Zhang, Y.; Fang, X.; Wu, S.; Chen, G.; Jules, B.; Chen, F. A novel methodology for investigating foamy oil stability by an oil-based analogue model. J. Dispers. Sci. Technol. 2018, 39, 275–286. [Google Scholar] [CrossRef]
- Sun, X.; Zhao, H.; Zhang, Y.; Liu, Y.; Chen, G.; Wang, W. An experimental study on the oil-soluble surfactant-assisted cyclic mixed solvent injection process for heavy oil recovery after primary production. Fuel 2019, 254, 115656. [Google Scholar] [CrossRef]
- Sabeti, M.; Torabi, F.; Cheperli, A. Effects of pressure depletion rate, solvent, and surfactant on non-equilibrium reactions in foamy oil. Can. J. Chem. Eng. 2024, 103, 2688–2707. [Google Scholar] [CrossRef]
- Ahmadi, S.; Khormali, A.; Kazemzadeh, Y.; Razmjooie, A. Enhancing dehydration/desalting efficiency of crude oil emulsions through experimental and computational insights. Results Eng. 2024, 24, 103094. [Google Scholar] [CrossRef]
- Hadian Nasr, N.; Mahmood, S.M.; Akbari, S.; Hematpur, H. A comparison of foam stability at varying salinities and surfactant concentrations using bulk foam tests and sandpack flooding. J. Pet. Explor. Prod. Technol. 2020, 10, 271–282. [Google Scholar] [CrossRef]
- Romero-Zerón, L.; Kantzas, A. The Effect of Wettability and Pore Geometry on Foamed-Gel-Blockage Performance. SPE Reserv. Eval. Eng. 2007, 10, 150–163. [Google Scholar] [CrossRef]
- George, D.; Hayat, O.; Kovscek, A. A microvisual study of solution-gas-drive mechanisms in viscous oils. J. Pet. Sci. Eng. 2005, 46, 101–119. [Google Scholar] [CrossRef]
- Du, Z.; Zeng, F.; Chan, C. An Experimental Study of the Post-CHOPS Cyclic Solvent Injection Process. J. Energy Resour. Technol. 2013, 137, 042901. [Google Scholar] [CrossRef]
- Bertin, H.J.; Quintard, M.Y.; Castanier, L.M. Development of a Bubble-Population Correlation for Foam-Flow Modeling in Porous Media. SPE J. 1998, 3, 356–362. [Google Scholar] [CrossRef]
- Yu, W.; Kanj, M.Y. Review of foam stability in porous media: The effect of coarsening. J. Pet. Sci. Eng. 2022, 208, 109698. [Google Scholar] [CrossRef]
- Kashchiev, D. Nucleation; Elsevier: Amsterdam, The Netherlands, 2000. [Google Scholar]
- Shahabi-Nejad, K.; Danesh, A.; Cordelier, P.; Hamon, G. Pore-Level Investigation of Heavy-Oil Depressurisation. In Proceedings of the SPE International Thermal Operations and Heavy Oil Symposium, Calgary, AB, Canada, 1–3 November 2005. [Google Scholar]
- Wang, H.; Torabi, F.; Zeng, F. Investigation of non-equilibrium solvent exsolution dynamics and bubble formation and growth of a CO2/C3H8/heavy-oil system by micro-optical visualizations: Experimental and continuum-scale numerical studies. Fuel 2023, 332, 126188. [Google Scholar] [CrossRef]
- Zhao, J.; Torabi, F.; Yang, J. The synergistic role of silica nanoparticle and anionic surfactant on the static and dynamic CO2 foam stability for enhanced heavy oil recovery: An experimental study. Fuel 2021, 287, 119443. [Google Scholar] [CrossRef]
- Memon, M.K.; Shuker, M.T.; Elraies, K.A. Study of blended surfactants to generate stable foam in presence of crude oil for gas mobility control. J. Pet. Explor. Prod. Technol. 2017, 7, 77–85. [Google Scholar] [CrossRef]
- Blunt, M.J. Relative Permeability. In Multiphase Flow in Permeable Media: A Pore-Scale Perspective; Cambridge University Press: Cambridge, UK, 2017; pp. 315–353. [Google Scholar]
- Liu, P.; Wu, Y.; Li, X. Experimental study on the stability of the foamy oil in developing heavy oil reservoirs. Fuel 2013, 111, 12–19. [Google Scholar] [CrossRef]
- Du, Z.; Peng, X.; Zeng, F. Comparison analyses between the linear and non-linear pressure-decline methods in cyclic solvent injection (CSI) process for heavy oil recovery. Fuel 2018, 224, 442–450. [Google Scholar] [CrossRef]
- Li, Y.; Du, Z.; Wang, B.; Ding, J.; Zeng, F. An Ethane-Based CSI Process and Two Types of Flooding Process as a Hybrid Method for Enhancing Heavy Oil Recovery. Energies 2024, 17, 1457. [Google Scholar] [CrossRef]
- Hong, S.Y.; Zeng, F.; Du, Z. Characterization of gas-oil flow in Cyclic Solvent Injection (CSI) for heavy oil recovery. J. Pet. Sci. Eng. 2017, 152, 639–652. [Google Scholar] [CrossRef][Green Version]
- Freitas, C.J. The issue of numerical uncertainty. Appl. Math. Model. 2002, 26, 237–248. [Google Scholar] [CrossRef]


Disclaimer/Publisher’s Note: The statements, opinions and data contained in all publications are solely those of the individual author(s) and contributor(s) and not of MDPI and/or the editor(s). MDPI and/or the editor(s) disclaim responsibility for any injury to people or property resulting from any ideas, methods, instructions or products referred to in the content. |
© 2025 by the authors. Licensee MDPI, Basel, Switzerland. This article is an open access article distributed under the terms and conditions of the Creative Commons Attribution (CC BY) license (https://creativecommons.org/licenses/by/4.0/).