Article

Oxidative Degradation of Anthocyanins in Red Wine: Kinetic Characterization Under Accelerated Aging Conditions

by
Khulood Fahad Saud Alabbosh
1,
Violeta Jevtovic
2,
Jelena Mitić
3,
Zoran Pržić
4,
Vesna Stankov Jovanović
5,
Reem Ali Alyami
2,
Maha Raghyan Alshammari
2,
Badriah Alshammari
2 and
Milan Mitić
5,*
1
Biology Department, College of Science, University of Ha’il, Ha’il 81451, Saudi Arabia
2
Chemistry Department, College of Science, University of Ha’il, Ha’il 81451, Saudi Arabia
3
The Institute for Artificial Intelligence Research and Development of Serbia, Fruškogorska 1, 21000 Novi Sad, Serbia
4
Institute of Horticulture, Faculty of Agriculture, University of Belgrade, 11080 Belgrade, Serbia
5
Department of Chemistry, Faculty of Science and Mathematics, University of Niš, 18000 Niš, Serbia
*
Author to whom correspondence should be addressed.
Processes 2025, 13(7), 2245; https://doi.org/10.3390/pr13072245
Submission received: 1 June 2025 / Revised: 8 July 2025 / Accepted: 11 July 2025 / Published: 14 July 2025
(This article belongs to the Special Issue Processes in Agri-Food Technology)

Abstract

The oxidative degradation of anthocyanins in red wine was investigated under controlled conditions using hydroxyl radicals generated in the presence of Cu (II) as a catalyst. A full factorial experimental design with 23 replicates was used to evaluate the effects of hydrogen peroxide concentration, catalyst dosage, and reaction temperature on anthocyanin degradation over a fixed time. Statistical analysis (ANOVA and multiple regression) showed that all three variables and the main interactions significantly affected anthocyanin loss, with temperature identified as the most influential factor. The combined effects were described by a first-order polynomial model. The activation energies for degradation ranged from 56.62 kJ/mol (cyanidin-3-O-glucoside) to 40.58 kJ/mol (peonidin-3-O-glucoside acetate). Increasing the temperature from 30 °C to 40 °C accelerated the degradation kinetics, almost doubled the rate constants and shortened the half-life of the pigments. At 40 °C, the half-lives ranged from 62.3 min to 154.0 min, depending on the anthocyanin structure. These results contribute to a deeper understanding of the stability of anthocyanins in red wine under oxidative stress and provide insights into the chemical behavior of derived pigments. The results are of practical importance for both oenology and viticulture and support efforts to improve the color stability of wine and extend the shelf life of grape-based products.

1. Introduction

Anthocyanins (Greek: anthos (άνθος) = flower and kianeos (κυανός) = blue) belong to the group of flavonoids among the polyphenols, which are responsible for the red and blue color of grape berries and wine [1]. The dominant anthocyanins are derivatives of malvidin—malvidin-3-O-glucoside (Mvgl) and malvidin-3,5-O-diglucoside. Malvidin-3,5-O-diglucoside is characteristic of some hybrid grape varieties and young wines from Eurasian cultivated vines (Vitis vinifera L.). In red wine, the most important are glycosides of five anthocyanidins: delphinidin-3-O-glucoside (Dpgl), cyanidin-3-O-glucoside (Cygl), petunidin-3-O-glucoside (Ptgl), peonidin-3-O-glucoside (Pngl), and malvidin-3-O-glucoside, while pelargonidin-3-O-glucoside is absent or present only in trace amounts [2,3]. Anthocyanin compounds are responsible for certain organoleptic characteristics such as color, bitterness, and astringency of wine. Since the color of wine is a common quality criterion, the analysis of these pigments has attracted considerable attention [4,5].
Anthocyanins are water-soluble pigments from the phenol group that occur as secondary metabolic products in plants. They contribute to the coloring of flowers and fruits, help with pollination and seed dispersal, and play a role in plant development. Due to their broad color spectrum—from red to violet to blue—they are often used as natural dyes in various industries. Anthocyanins also have useful biological properties, including antioxidant and antimicrobial activity. However, their practical use is limited by their low stability, which is affected by factors such as pH, light, temperature, oxygen, enzymes, ascorbic acid, sulphites, and co-pigments [6].
Due to their unsaturated chemical structure, anthocyanins are very susceptible to oxidation through reactions with molecular oxygen. Oxygen is therefore a crucial factor influencing their stability, as its presence can accelerate the degradation of anthocyanins. In red wine, oxidative processes occur throughout production—during fermentation, aging in the barrel, and storage in the bottle—which influence both the chemical composition and the sensory properties of the final product. These reactions have a significant influence on the color of the wine [7,8] and its organoleptic properties [9].
Throughout the winemaking process, the wine is exposed to different amounts of oxygen, each of which influences its chemical evolution. Due to the complex interplay between the composition of the wine and its oxidative reactivity, it is still difficult to predict the exact effects of a given oxygen dose. Nevertheless, the results presented in this study provide practical insights that can help predict the behavior of anthocyanins and overall wine stability under defined oxidative conditions.
Oxygen is a key factor in wine production, especially in the post-fermentation stages. The highest oxygen exposure typically occurs during bottling, where the dissolved oxygen content can reach about 3.0–4.1 mg/L under controlled saturation conditions [10,11]. During the subsequent oxidative reactions, molecular oxygen (O2) is gradually reduced to water via a series of steps, producing reactive intermediates such as hydrogen peroxide (H2O2) and hydroxyl radicals (HO•). These reactive oxygen species can initiate the oxidation of various wine components and thus influence the composition and stability of the wine [12,13,14].
Transition metals such as iron and copper are frequently present in wine and originate from various sources such as vineyard soils, pesticide treatments against Plasmopara viticola disease, winemaking equipment, and environmental influences. These metals can catalyse oxidative reactions by activating molecular oxygen and thus influence the stability and quality of wine [15]. Globally, iron concentrations in wine range from 0.061 to 50 mg/L, while copper concentrations range from undetectable to around 6.8 mg/L. Iron is primarily taken up by the grapevine from the soil and transferred to the wine during processing, while copper is often introduced using copper-based fungicides in viticulture [15].
The simultaneous presence of hydrogen peroxide and transition metals such as iron and copper in wine can lead to the formation of Fenton’s reagent, a highly reactive oxidizing system. While limited data are available on the combined effects of H2O2, Cu (II), and temperature on anthocyanin stability in red wine, this study fills this gap by investigating their effects on anthocyanin degradation in Serbian ‘Merlot’ cv. wine. The degradation kinetics are analyzed using a thermodynamic framework that incorporates the following main activation parameters: Gibbs free energy (ΔG*), enthalpy (ΔH*), entropy (ΔS*), and activation energy (Ea). These parameters enable a deeper understanding of the thermal stability and degradation behavior of anthocyanins in complex food matrices such as wine. Although the oxidative degradation of anthocyanins has previously been studied in systems involving Fe (II) and other transition metals [16,17], there is a lack of data specifically addressing Cu (II)-catalyzed degradation under realistic wine conditions, which represents the novelty of our approach.
Therefore, the present study aims to characterize the anthocyanin composition of red wine from the ‘Merlot’ variety and to determine the oxidative degradation of individual anthocyanins through a controlled process of accelerated aging using hydroxyl radicals generated in the presence of Cu (II) as a catalyst. The research provides a better understanding of the stability of the anthocyanin compounds in ‘Merlot’ wine and the associated changes in oenological potential during the aging process under oxidative conditions.

2. Materials and Methods

2.1. Wine Sample Origin and Storage Conditions

The red wine used was a commercial Merlot (Vitis vinifera L.), produced using standard vinification procedures including alcoholic and malolactic fermentation. Sulfur dioxide (SO2) was added at 50 mg/L. The wine was aged in stainless steel tanks for 12 months and bottled in dark glass bottles with screw caps under inert conditions.
Before the experiment, the wine was stored for 3 months in the dark at 15 ± 1 °C to minimize further oxidation. Although dissolved oxygen was not quantified, all degradation experiments were conducted in sealed Budarin-type reaction vessels to ensure that oxidative conditions were controlled. The wine matrix was characterized by pH 3.4, ethanol content 13.5%, and typical phenolic composition.

2.2. Chemicals and Reagents

All reagents were of analytical grade. Copper (II) chloride dihydrate (CuCl2•2H2O, ≥99%), hydrogen peroxide (30% w/w, p.a.), acetonitrile (≥99.9%, HPLC grade), formic acid (≥98%) and anthocyanin glucoside standards (purity ≥ 95%) were purchased from Merck (Darmstadt, Germany) and Sigma-Aldrich (St. Louis, MO, USA). The solutions were prepared using deionized water from a MicroMed high-purity water system (TKA Wasseraufbereitungssysteme GmbH, Niederelbert, Germany).
A Cu (II) stock solution (1.0 × 10⁻³ mol/L) was prepared by dissolving CuCl2•2H2O in deionized water. The hydrogen peroxide solution (0.979 mol/L) was freshly prepared from a commercial 30% stock solution immediately before use to ensure stability.

2.3. High-Performance Liquid Chromatography (HPLC-DAD) Analysis

Anthocyanin compounds were quantified by reversed-phase high-performance liquid chromatography (RP-HPLC) with diode array detection. The analysis was performed using an Agilent 1200 Series HPLC system (Agilent Technologies, Singapore) equipped with a UV–Vis diode array detector (DAD) for simultaneous monitoring of multiple wavelengths.
Sample injections of 5 µL were made onto an Eclipse XDB C18 column (4.6 × 150 mm, Agilent) maintained at 25 °C. Gradient elution was performed with two mobile phases: Solvent A (2% formic acid in water) and Solvent B (a mixture of 80% acetonitrile, 2% formic acid, and water). The elution profile was programmed as follows: 0–10 min, 0% B; 10–28 min, linear gradient from 0% to 25% B; 28–30 min, 25% B; 30–35 min, 25% to 50% B; 35–40 min, 50% to 80% B; and 40–45 min, re-equilibration back to 0% B.
Anthocyanins were identified by comparing both retention times (Dpgl- 22.04; Cygl- 22.60; Pngl- 25.32; Mvgl- 26.85 min.) and UV–Vis spectra with those of authentic standards. The quantification was based on an external calibration. The analytical parameters, such as calibration curves, coefficients of determination (R2), limits of detection (LOD), and limits of quantification (LOQ), are listed in Table 1. The results are expressed in mg/L of red wine.
The concentrations of the individual anthocyanins were determined using calibration curves generated from authentic standards. For compounds for which no specific standard exists, quantification was performed using calibration data from structurally related analogues. For example, peonidin-3-O-glucoside was used as a reference for petunidin-3-O-glucoside. Similarly, delphinidin-3-O-glucoside, cyanidin-3-O-glucoside, peonidin-3-O-glucoside, and malvidin-3-O-glucoside were used to estimate the concentrations of their corresponding acetylated and p-coumaroylated derivatives. All measurements were performed in triplicate to ensure the reproducibility and reliability of results.

2.4. Reaction Conditions

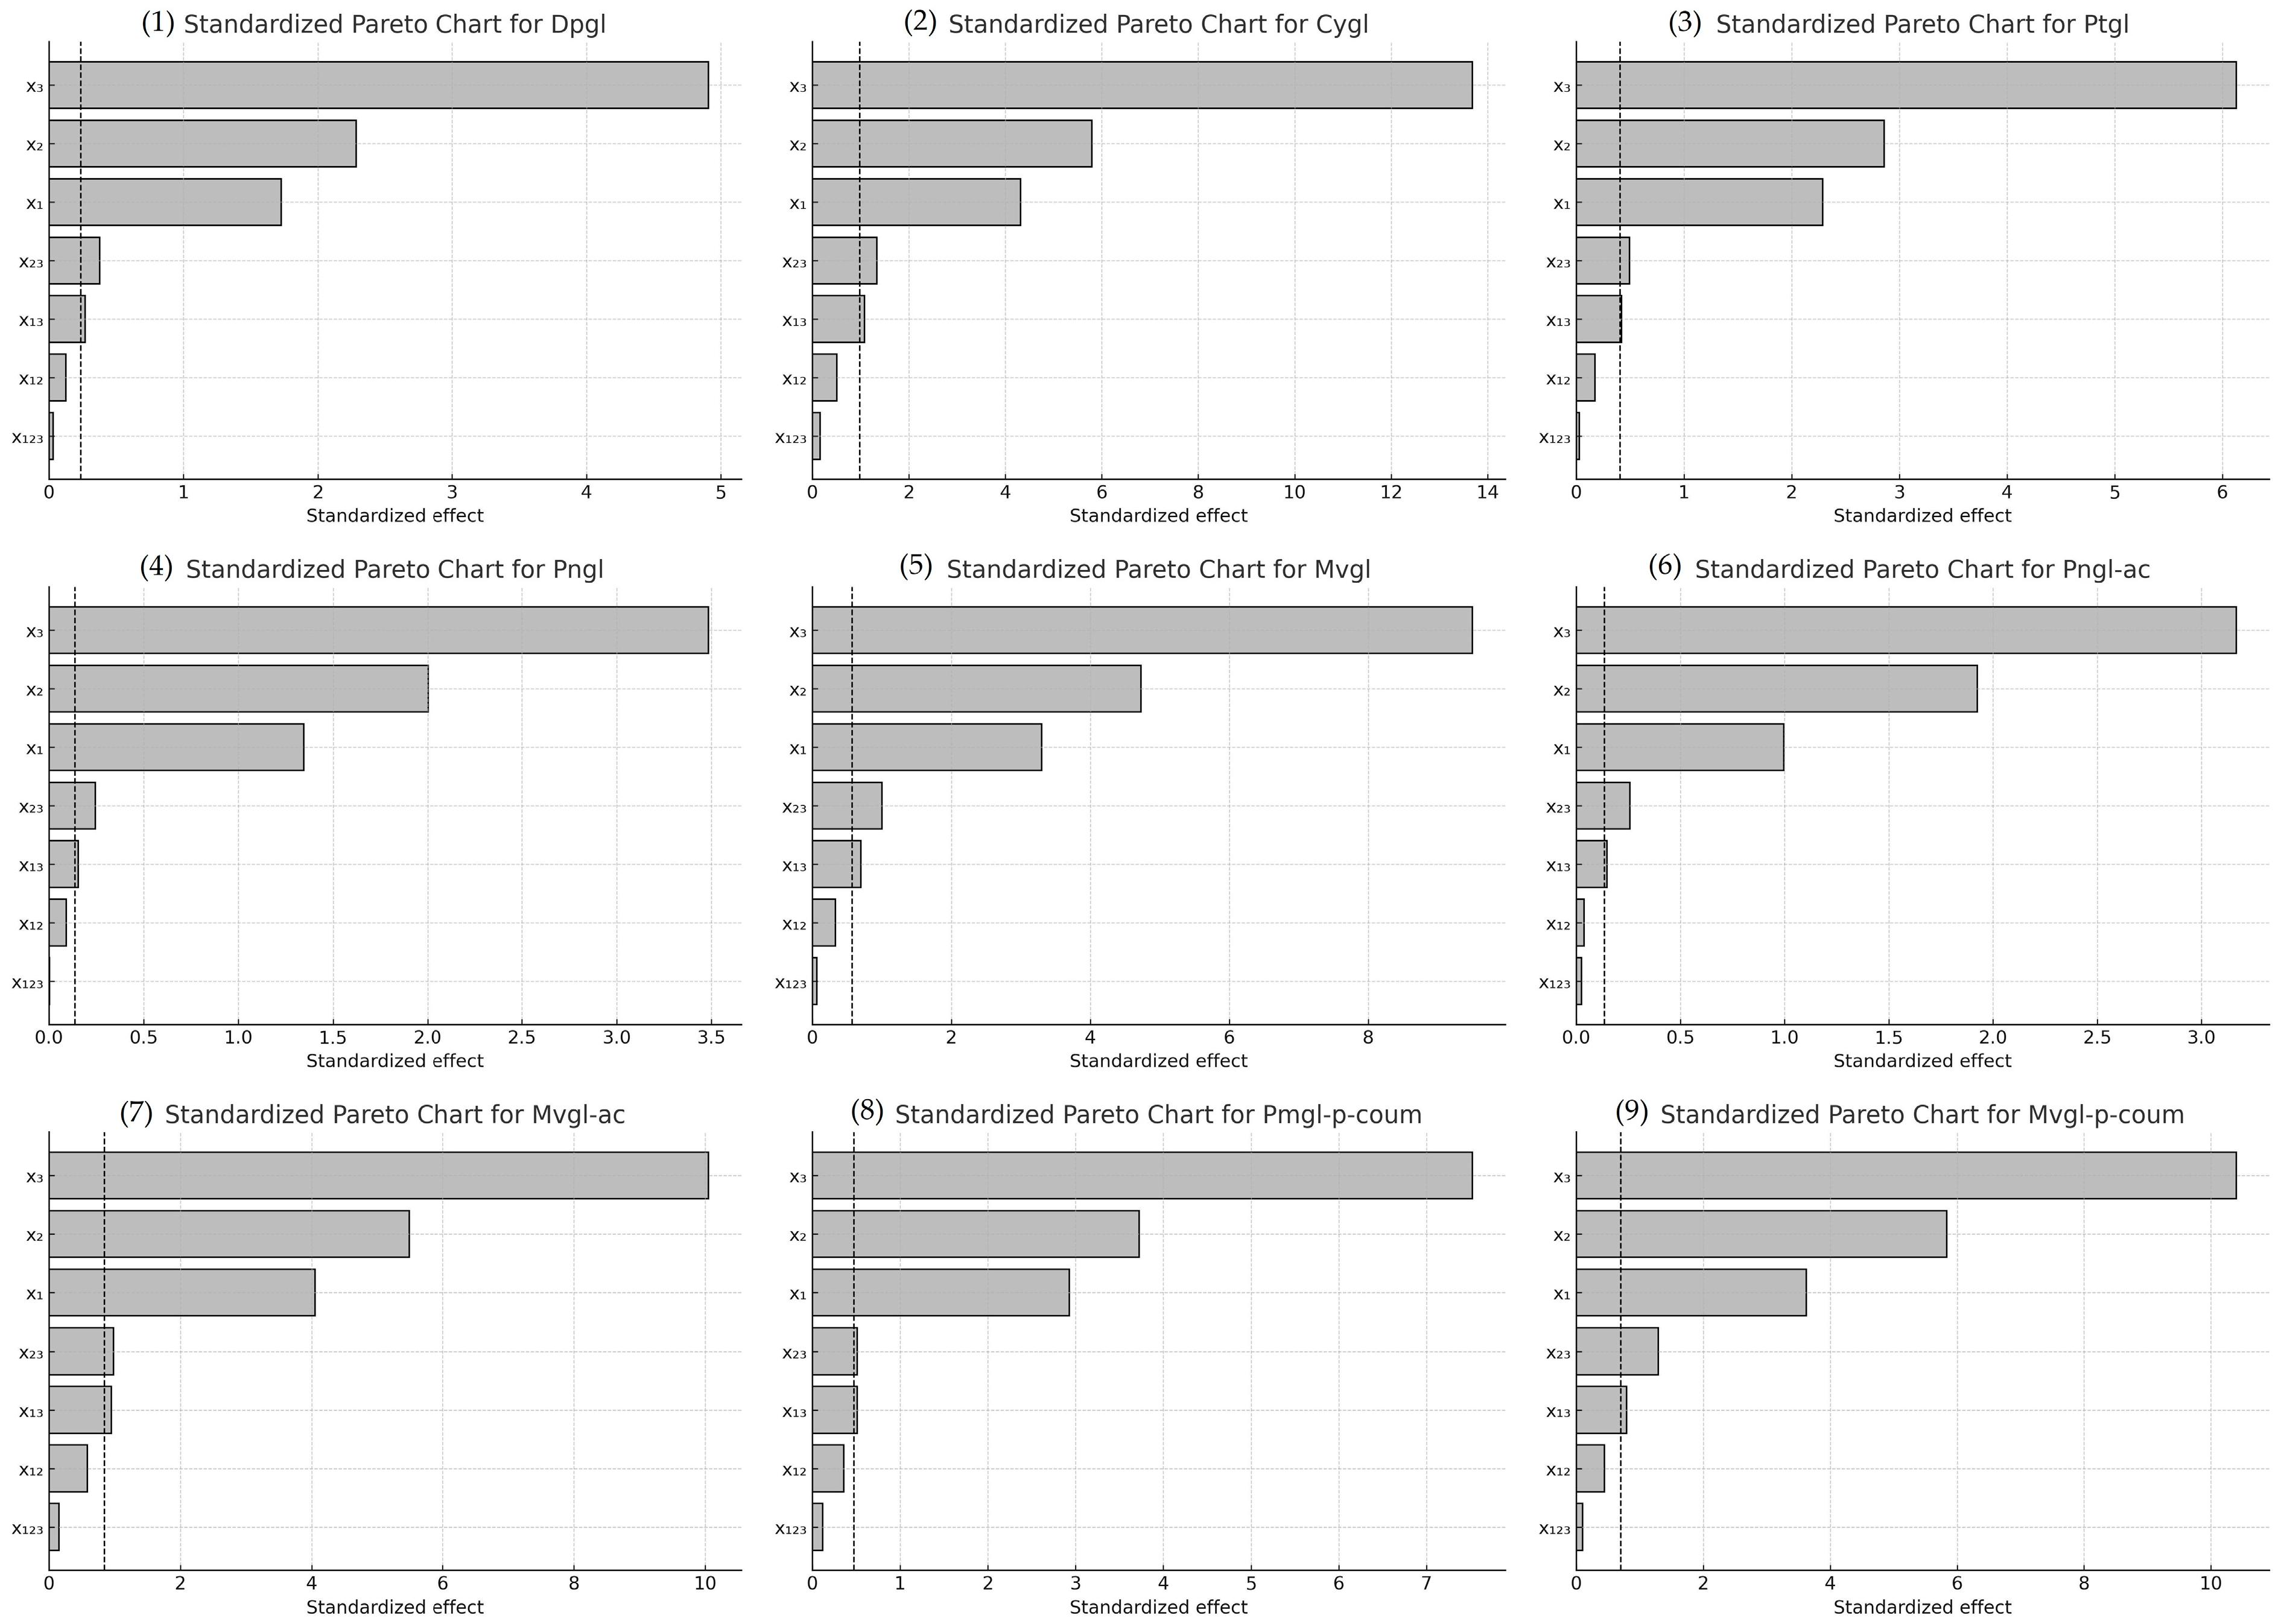
A full factorial design (23) with replication was used to investigate the influence of three variables on the degradation of anthocyanins in red wine. Two concentration levels of hydrogen peroxide (10 and 20 mmol/L), two levels of Cu (II) (0.01 and 0.02 mmol/L), and two reaction temperatures (30 °C and 40 °C) were investigated. Based on preliminary investigations, the factor levels were selected to ensure that the reaction time would allow for chromatographic measurements at five different time points. The three factors—H2O2 concentration (x1), Cu (II) concentration (x2) and reaction temperature (x3)—and their respective maximum and minimum values are summarized in Table 2, Table 3 and Table 4, where the coded values (−1) and (+1) represent the lower and upper levels, respectively.
The degradation of each anthocyanin was monitored over an oxidation period of 70 min oxidation period (adjusting the system from the start of the reaction to account for the retention time of each peak), and the response variable was defined as the percentage of anthocyanin reduction (PAR). The experimental matrix with the corresponding PAR values for each treatment combination is shown in Table 2, Table 3 and Table 4.

2.5. Anthocyanin Kinetic Degradation in the Presence of Hydroxyl Radicals

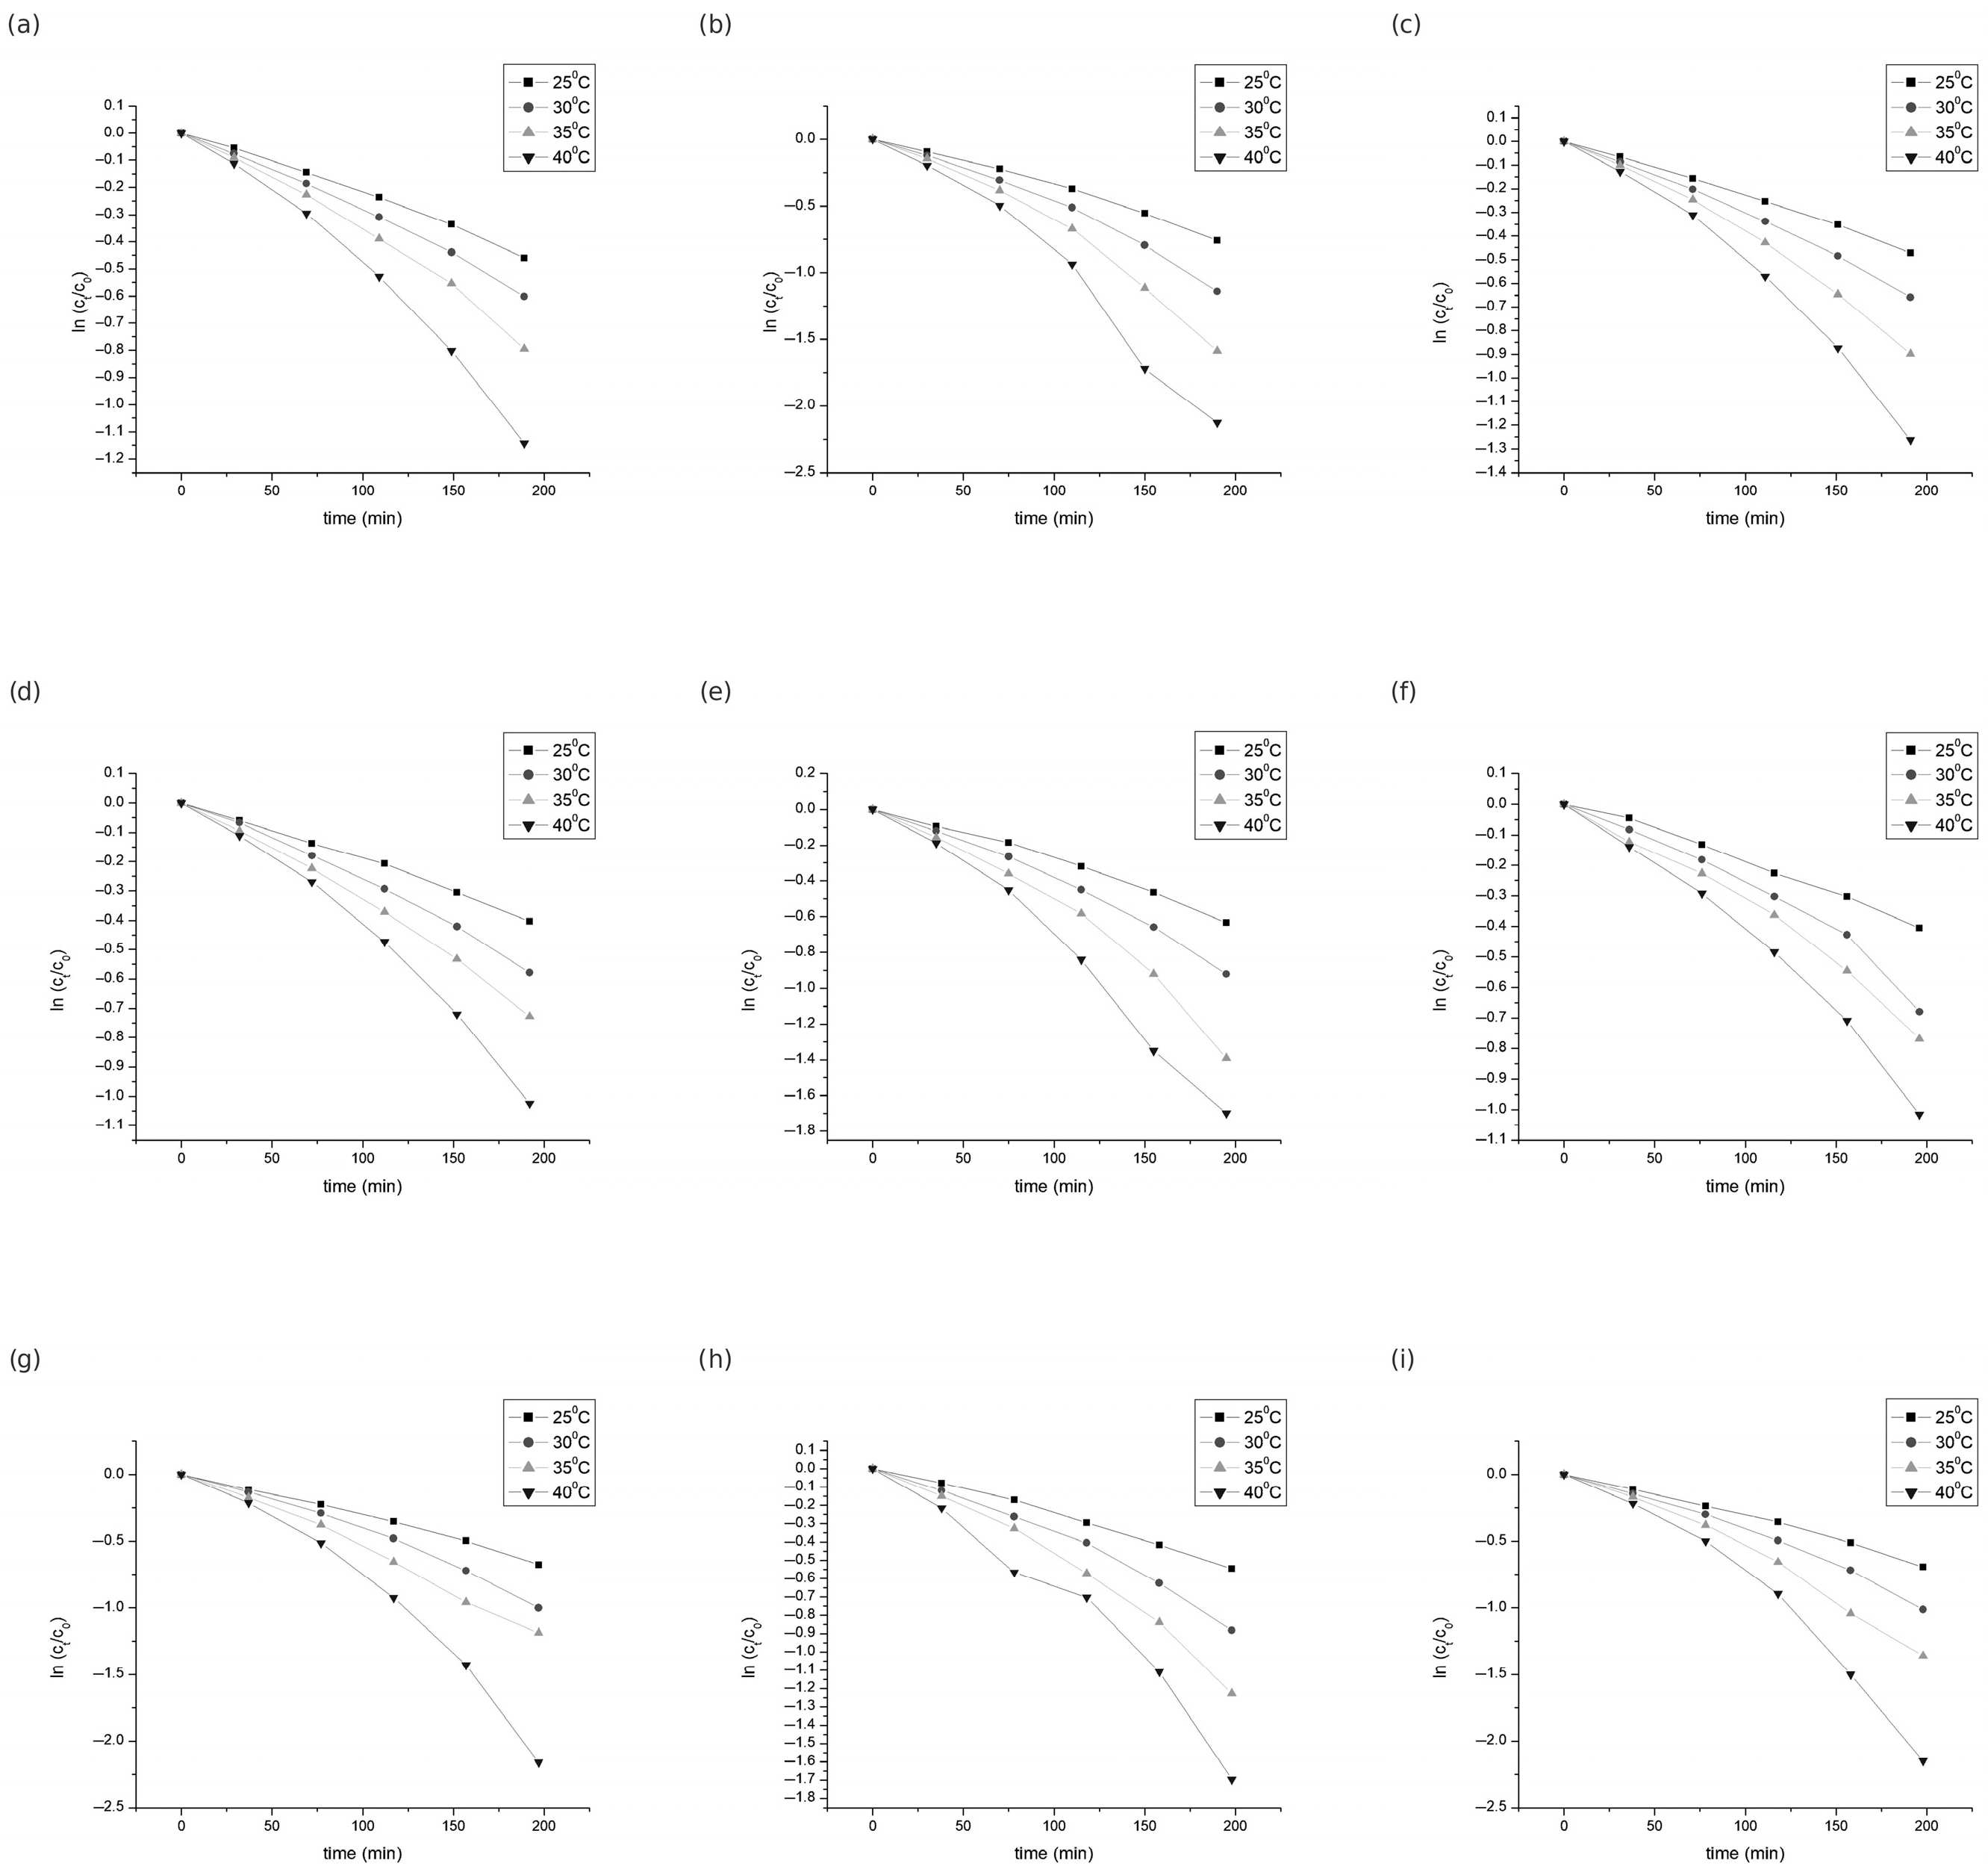
The kinetic degradation of red wine anthocyanins in the presence of hydroxyl radicals—generated by a Fenton-like system involving Cu (II) and H2O2—was studied at four different temperatures: 25, 30, 35, and 40 °C. The experiment was carried out in a Budarin vessel with four chambers. The Budarin vessel enabled separate thermostating of each component and precise timing of the reaction start. Cu (II) solution was added to one chamber, hydrogen peroxide to the second, red wine to the third, and a mixture of buffer solution (tartaric acid, pH 3.5) and deionized water (total volume: 2 mL) to the fourth. Prior to analysis, the wine sample was filtered through a 0.45 μm membrane filter. The vessel was thermostatted at the selected temperature (±0.1 °C) for 5 min. All reagents were freshly prepared and handled under subdued light to prevent photo-induced degradation. After equilibration, the contents of all four chambers were combined and stirred for 60 s. The resulting solution was immediately transferred to the chromatography cell, and the change in peak area was measured at 520 nm as a function of reaction time. All measurements were performed in triplicate to ensure analytical reliability and reproducibility.

2.6. Determination of Kinetic Parameters

In accordance with previous studies, anthocyanins follow first-order degradation kinetics (at constant H2O2 and Cu (II) concentration):
c = c o e x p k t
where t is the time (min), k is the pseudo first order kinetic rate constant (min−1), and c o and c are the anthocyanin content (mg/L) at time zero and t, respectively.
The decimal reduction time (D-value), which is the time needed for a tenfold reduction in the initial concentration at a given temperature, is related to k-values according to Equation (2):
D = l n 10 k
The half-life (t1/2) value of degradation is given by Equation (3):
t 1 / 2 = l n 2 k

2.7. Thermodynamic Analysis

The temperature and degradation constant are related according to the Arrhenius equation:
k = A · e E a / R T
where k is the rate constant of the degradation reaction, A denotes the pre-exponential (Arrhenius) factor, Ea is the apparent activation energy, R represents the universal gas constant, and T is the absolute temperature. By applying the natural logarithm to both sides of the Arrhenius equation,
l n k = l n A E a R T
Equation (4) is obtained. When the natural logarithm of the degradation constant compared with the inverse of the absolute temperature is plotted according to Equation (4), the Ea value from the slope and the lnA value from the ordinate intercept are obtained. Thus, the thermodynamic parameters change in enthalpy (ΔH*), entropy (ΔS*), and free energy of activation (ΔG*) are obtained using the following equations:
H * = E a R T
G * = R T l n k · h k B · T
where h (6.6262 1034 J s) is Planck’s constant and kB (1.3806 1023 J K1) is Boltzmann’s constant. From Equations (6) and (7), it is possible to calculate the activation entropy ( S * ):
S * = H * G * T

2.8. Statistical Analysis

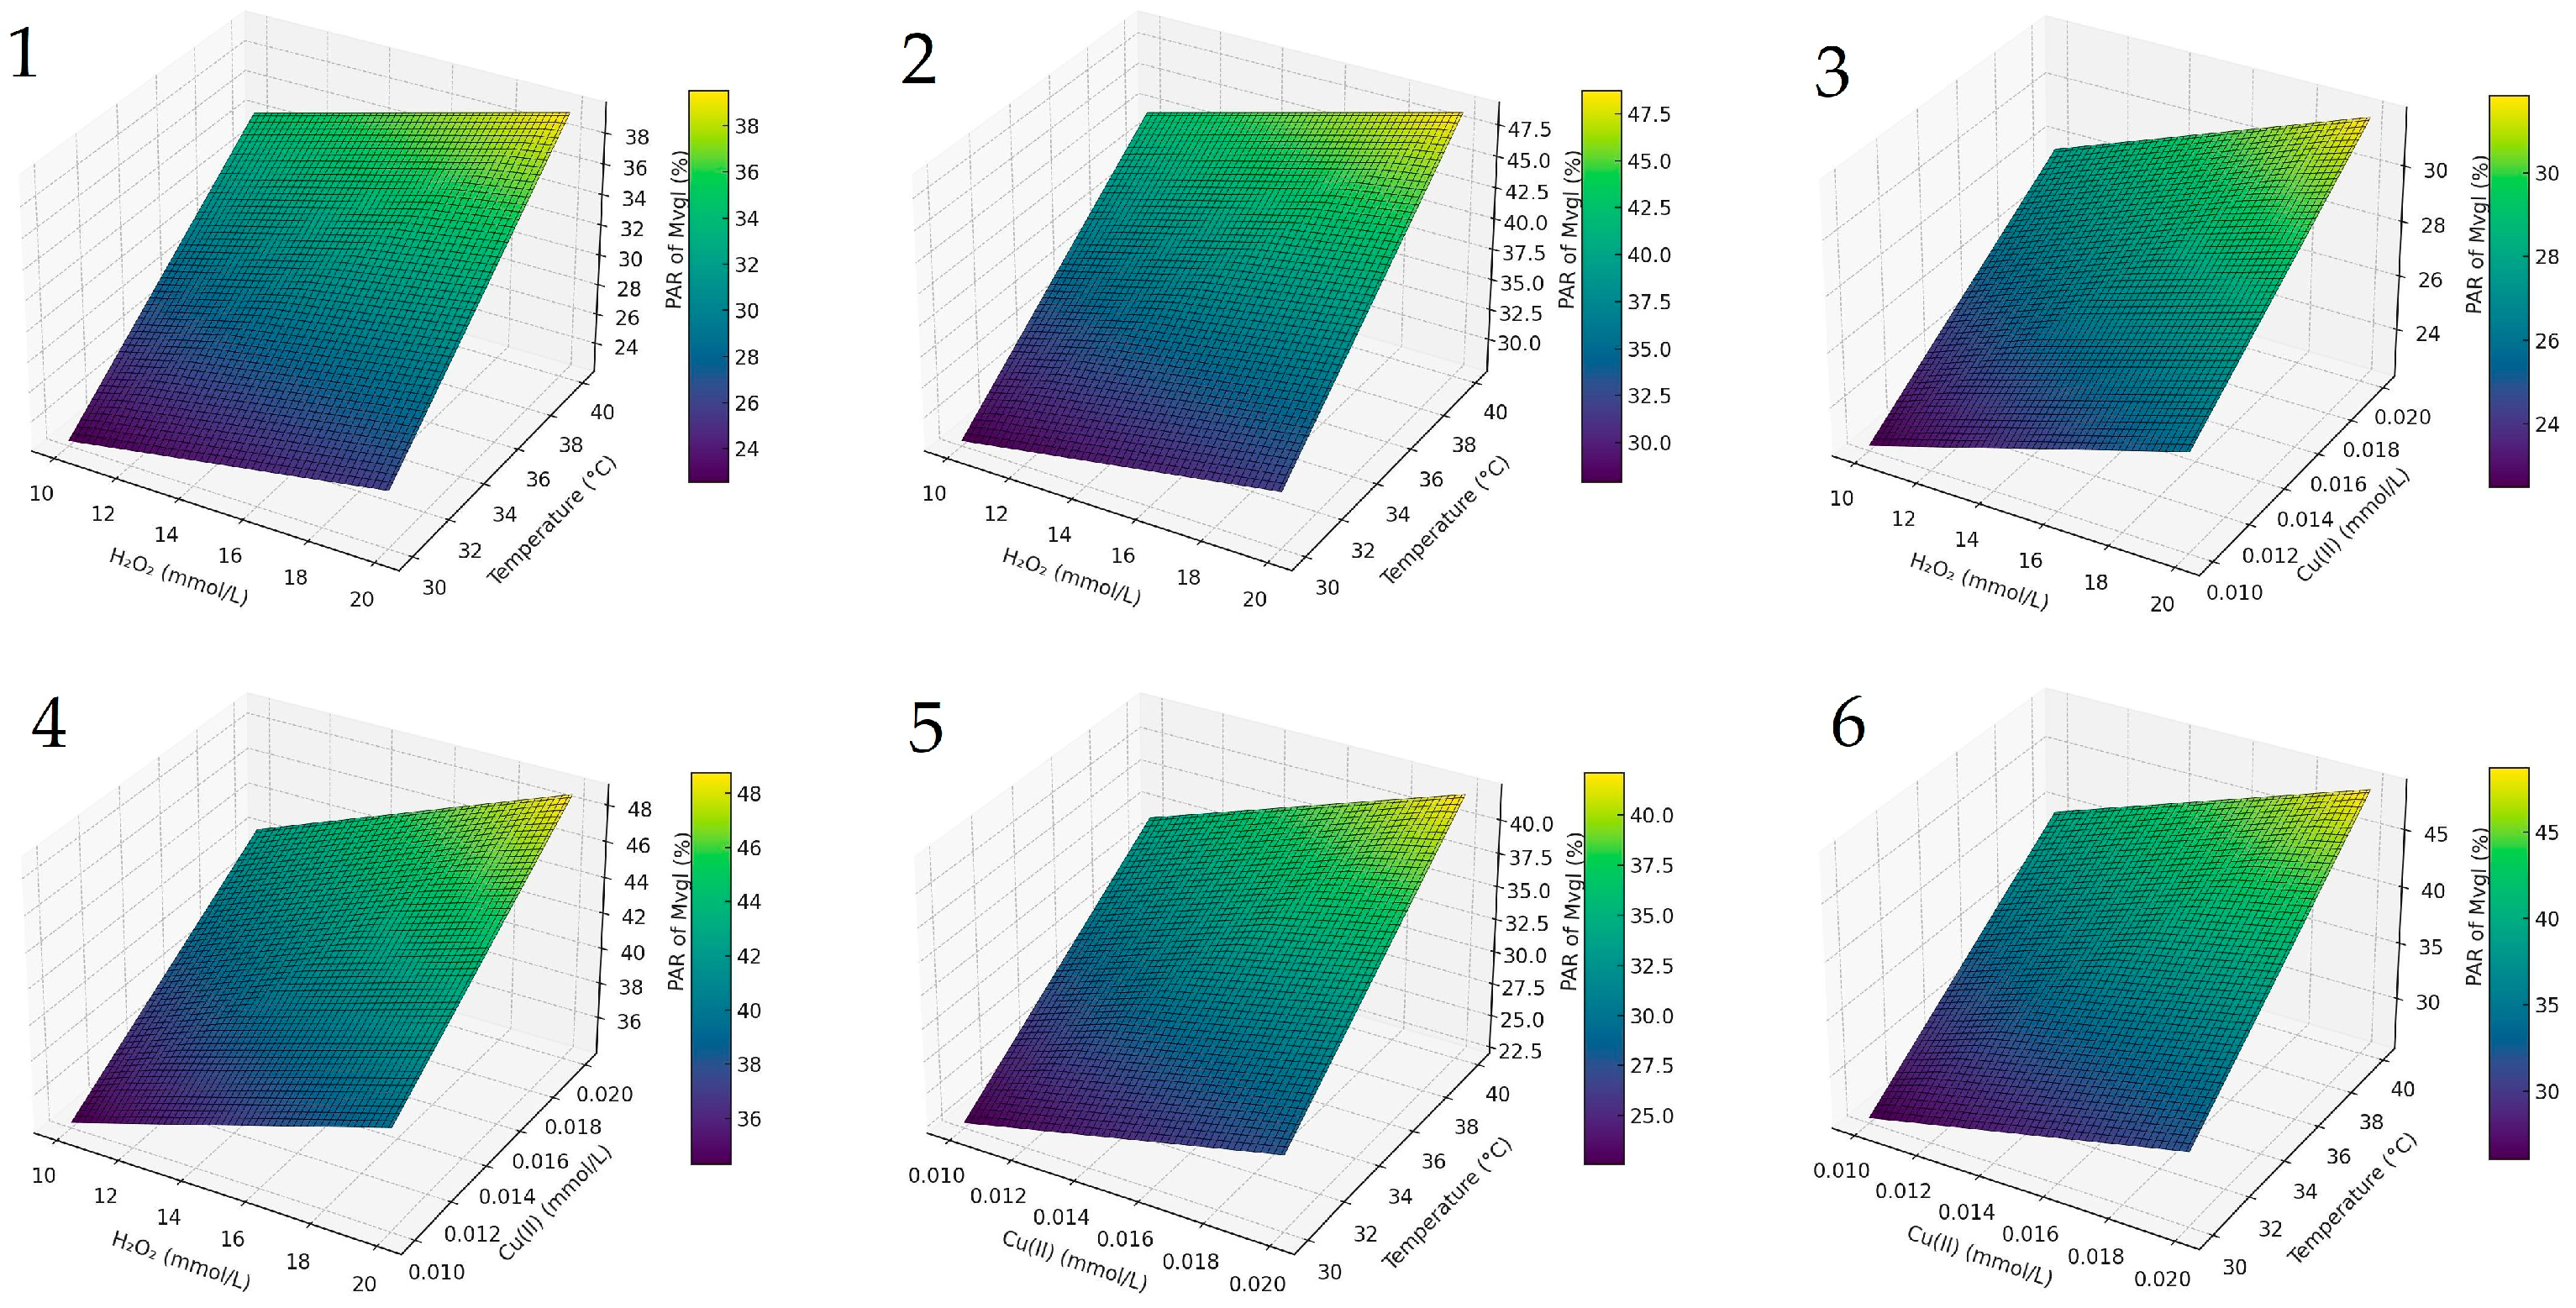
The experimental data were statistically analyzed using Design-Expert® software (Stat-Ease, Inc., Minneapolis, MN, USA). A full factorial experimental design (23) with replication was used to evaluate the influence of three factors—hydrogen peroxide concentration, Cu (II) concentration, and reaction temperature—on the percentage of anthocyanin reduction (PAR). The significance of each factor and its interactions was evaluated using analysis of variance (ANOVA). In addition, first-order linear regression models were developed to describe the relationship between PAR and the experimental factors, including their interaction terms.

3. Results and Discussions

3.1. Wine Anthocyanin Characterization

The concentrations of the individual anthocyanins—Dpgl, Cygl, Ptgl, Pngl, Mvgl—and their respective acylated derivatives (esters of acetic and p-coumaric acid) in ‘Merlot’ cv. wine are listed in Table 5. The total anthocyanin content, calculated as the sum of the individual compounds, was 99.792 mg/L. Among the identified pigments, Mvgl was the most abundant, accounting for 50.25% of the total anthocyanin content, which is consistent with its predominance in most grape varieties and red wines. Acetylated derivatives accounted for between 0.82% and 8.70% of total anthocyanins, while p-coumaroylated anthocyanins ranged from 0.59% and 7.72%.

3.2. Effects of Kinetic Reactions

The influence of hydrogen peroxide concentration, Cu (II) concentration and reaction temperature on the percentage of anthocyanin reduction (PAR) in red wine was evaluated after a 70 min reaction time. The factors were selected based on preliminary screening results and practical limitations. For temperature, the upper limit was set at 40 °C, as higher temperatures led to too rapid degradation and HPLC analysis was not feasible. A 23-factorial experimental design was created to determine the statistical significance of the selected variables. The experimental matrix comprised eight unique treatment combinations, each performed in duplicate to ensure reproducibility.
The results obtained show a significant change in the concentration of anthocyanin 3-O-glucosides during the first 70 min of the reaction. Ivanova-Petropulos et al. (2015) [16] also reported that the concentration of total and free anthocyanins—compounds responsible for the red-purple color of young red wines—decreases significantly during maturation and aging of 1–2 years, by up to 88%. Although a decrease in the concentration of free anthocyanins was observed during the degradation process induced by hydroxyl radicals, it is important to emphasize that remarkable differences in the degradation dynamics of these compounds were observed. In particular, significant differences in the stability of the individual free anthocyanins were observed depending on the conditions of oxidative degradation (Table 2, Table 3 and Table 4).
Among individual anthocyanins, Mvgl showed the highest initial concentration (50.252 mg/L), decreasing by nearly 49% under the most oxidative conditions. Its predominance and well-documented role in polymer pigment formation reinforce its central contribution to wine aging and color stability, and Mvgl exhibits high structural stability and a strong tendency to form polymeric pigments that preserve color and resist oxidative degradation during aging [17,18].
In contrast, the lowest concentrations were found for Cygl, which decreased from 2.356 mg/L before the degradation process to 0.877 mg/L after 70 min of reaction at 40 °C under H2O2 and Cu (II) concentrations of 20 mmol/L and 0.02 mmol/L, respectively. Cygl also showed the strongest reduction compared to its initial value, with a decrease in concentration of 62.75% after 70 min (Table 2, Table 3 and Table 4). Pngl, on the other hand, showed the highest stability with the lowest decrease in concentration—only 26.72%—under the same reaction conditions.
As for the acylated derivatives, Pngl acetate was present in low concentrations (Table 5). Interestingly, this compound also showed the highest stability to chemical changes during degradation by hydroxyl radicals. The enhanced stability of peonidin-based anthocyanins may be attributed to their methoxy substitution on the B-ring, which confers greater resistance to oxidative cleavage compared to hydroxylated analogs such as cyanidin [19]. In particular, during the first 70 min of the reaction, its concentration decreased by only 25.35%, from 1.380 mg/L to 0.350 mg/L (Table 2). In contrast, Mvgl acetate showed a much stronger reduction, with a decrease in concentration of almost 54% after 70 min of reaction time.
A similar pattern was observed for p-coumaroylated forms, with malvidin-based derivatives showing greater degradation than peonidin-based ones. The degradation of p-coumaroylated pigments during bottle aging is also supported by the study of Blanco-Vega et al. (2014) [20], where a reduction of nearly 50% was reported after several years of storage. The same authors reported that anthocyanin content reduction depends on grape varieties and the aging period.

3.2.1. Linear Regression Modeling

Table 2, Table 3 and Table 4 show the coded and actual values of the experimental factors as well as the corresponding reaction values, i.e., the percentage reduction in the individual anthocyanins: Dpgl, Cygl, Ptgl, Pngl, Mvgl, Pngl-ac, Mvgl-ac, Pngl-p-coum, and Mvgl-p-coum. A first-order linear regression model was applied to analyze the experimental data for percentage anthocyanin reduction (PAR). The general form of the regression equation used in this analysis is as follows:
y = b o + b 1 x 1 + b 2 x 2 + b 3 x 3 + b 12 x 1 x 2 + b 13 x 1 x 3 + b 23 x 2 x 3 + b 123 x 1 x 2 x 3
In the regression model, the variables x1, x2, and x3 represent the H2O2 concentration, Cu (II) concentration, and reaction temperature, respectively. Interaction terms such as x1 x2, x1 x3, and x2 x3 describe the combined effects of two independent variables, while x1 x2 x3 considers the interaction between all three factors. The coefficient b0 denotes the intercept, bi represents the linear regression coefficients, and bij and bijk correspond to the coefficients for the two-factor and three-factor interactions, respectively.
The influence of these independent variables (x1, x2, x3) on the percentage s degradation of the individual analyzed anthocyanins was assessed.

3.2.2. Analysis of Variance (ANOVA)

ANOVA results for the percentage reduction in anthocyanins are summarized in Table 6. The statistical relevance of the main factors and their two- and three-way interactions was assessed using the corresponding F and p values. A higher F-value indicates a more significant contribution to the model, with p-values below 0.05 indicating statistical significance.
To streamline the regression model, any factor or interaction term found to be statistically non-significant (p ≥ 0.05) was excluded. The resulting simplified regression equations are shown in Table 7. The predicted values generated by the model are compared with the experimentally observed data in Table 2, Table 3 and Table 4 and show a strong agreement between the predicted and actual responses. This agreement indicates that the polynomial regression models are effective for predicting anthocyanin degradation behaviour under the oxidative conditions tested.
As noted by Aklilu et al. (2021) [21], positive coefficients in the regression model indicate synergistic effects that increase the percentage of anthocyanin reduction, while negative coefficients reflect antagonistic interactions.
The analysis showed that all linear terms had strong statistical relevance, with F-values ranging from 93.0 to 2986.5 for factors x1, x2, and x3, confirming their significant influence on anthocyanin reduction (PAR).
The Pareto charts shown in Figure 1 illustrate the relative influence of each factor on PAR. The length of each horizontal bar reflects the absolute value of the estimated effect, while the dashed line marks the threshold for statistical significance at a 95% confidence level.
Among the factors analyzed, reaction temperature (x3) had the greatest influence on anthocyanin degradation, followed by Cu (II) concentration (x2). In the two-factor interactions, the combinations of Cu (II) concentration and temperature (x2 x3) and H2O2 concentration and temperature (x1 x3) were found to significantly influence all reaction variables. In contrast, the three-way interaction (x1 x2 x3) and the interaction between H2O2 and Cu (II) concentrations (x1 x2) did not show statistical significance (p > 0.05).
To further illustrate the interaction effects between the key variables, a composite response-surface visualization is provided in Figure 2. These 3D plots confirm that temperature and Cu (II) concentration jointly exert the most pronounced effect on anthocyanin degradation, whereas H2O2 concentration plays a secondary role within the tested range. The response surfaces are derived from the full factorial design and reflect trends observed for Mvgl, selected as the most abundant and representative anthocyanin in the studied wine matrix.

3.2.3. Model Fitting and Adequacy

To ensure that the developed regression models (Table 7) accurately reflect the behavior of the real system, the model fit was evaluated using regression analysis and ANOVA. The coefficient of determination (R2) was calculated together with the adjusted R2 (R2adj) and the coefficient of variation (CV) to assess the appropriateness of the model (Table 6).
The R2 value represents the proportion of variability in the response that can be explained by the model and not by random error. In general, a well-fitted model should have an R2 of at least 80%. However, as R2 can increase with the inclusion of additional predictors regardless of their significance, R2adj is a more reliable indicator of model quality. R2adj takes into account the number of predictors and should ideally be above 90% for a robust model.
The coefficient of variation (CV) reflects the relative dispersion of the data; values below 10% usually indicate acceptable precision and consistency of the experimental results [22,23].
In this study, R2 values ranged from 99.20% to 99.82%, demonstrating excellent model fit. The adjusted R2 values were above 98% for all responses, and the CV values remained below 10%, confirming the reliability, precision, and overall suitability of the fitted models.

3.3. Reaction Kinetics

The degradation kinetics of the individual anthocyanins were analyzed at four reaction temperatures—25, 30, 35, and 40 °C—over a period of up to 200 min (Figure 3). The kinetic parameters, including the rate constant (k), decimal reduction time (D-value), half-life (t1/2), and activation energy (Ea), are summarized in Table 2, Table 3 and Table 4.
The concentration decay profiles of all analyzed anthocyanins over time were well described by a first-order kinetic model (Equation (3)). The model provided an excellent fit for all temperature conditions, with coefficients of determination (R2) above 0.96 for each compound, confirming a strong linear relationship between the logarithmic decrease in anthocyanin concentration and reaction time (Figure 3).
A similar degradation behavior was observed for Cygl and other anthocyanins in different fruit juice systems subjected to oxidative or thermal treatments. Although complete degradation is rarely reported, studies on juices such as blackberry, strawberry, sour cherry, and pomegranate generally describe first-order kinetics for the loss of individual or all anthocyanins. This degradation pattern is often influenced by the juice matrix, storage conditions, and processing parameters. These results support the application of first-order kinetic modeling in the description of anthocyanin stability during oxidation and thermal stress in complex food systems [24,25,26,27,28].
Reaction temperature had a pronounced effect on anthocyanin degradation, as illustrated in Figure 1. At 25 °C, the degradation rates were relatively low (k = 0.00197–0.00369 min−1), while at 40 °C, a significant acceleration was observed (k = 0.00470–0.01113 min−1), as shown in Table 2. Each anthocyanin exhibited a different degradation rate and sensitivity to temperature changes. Among the compounds analyzed, (Cygl) and (Mvgl-p-coum) were the most thermally sensitive with activation energies (Ea) of 56.62 kJ/mol and 55.33 kJ/mol, respectively. Interestingly, the activation energy obtained for Mvgl in this study is comparable to that previously reported in our work on Vranac red wine under similar oxidative conditions, where an Ea value of 57.70 kJ/mol was observed [29]. This consistency reinforces the thermal sensitivity of this anthocyanin across different grape varieties.
The activation energy reflects the minimum energy required for a reaction to take place and is usually derived using the Arrhenius equation. In this context, lower Ea values indicate reduced temperature sensitivity, which means that compounds with lower activation energies are more thermally stable during the degradation process [30].
The half-life values (t1/2) of anthocyanins decreased with rising temperature, indicating thermal sensitivity across all compounds (Table 2). Peonidin-based forms generally exhibited higher stability compared to cyanidin and malvidin derivatives.
These results are consistent with previous studies on ‘Ruby’ and ‘Merlot’ grape juice, where elevated temperatures significantly accelerated the degradation of Mvgl, Dpgl, Ptgl, Pngl, and Cygl [31]. The observed differences in stability between the anthocyanins can be attributed to structural differences that influence their resistance to oxidation.
In addition, Table 8 shows the decimal reduction time (D value) for each condition. This parameter, which indicates the time required to reduce the anthocyanin concentration by one logarithmic cycle, decreased with increasing temperature. At 25 °C, D values ranged from 623.85 to 1168.53 min (Cygl to Pngl), while at 40 °C, they dropped to 206.34–511.55 min (Cygl to Pngl-ac), indicating faster degradation under thermal stress.
The evaluation of the thermodynamic parameters provides further insight into the kinetics of the thermal degradation of anthocyanins in the presence of a Fenton-like reagent. Table 4 summarizes the calculated values for Gibbs free energy of activation (ΔG*), enthalpy of activation (ΔH*), and entropy of activation (ΔS*) for all temperatures tested.
The values of ΔG*, which reflect the energy difference between the activated complex and the reactants [32], ranged from 86.78 to 92.55 kJ/mol. The positive ΔG* values indicate that the degradation of anthocyanins under these conditions is a non-spontaneous process.
The ΔH*, which represents the energy barrier associated with bond breaking and formation during the transition to the activated state (Vikram et al., 2005) [33], was relatively consistent under all conditions, ranging from 38.13 to 54.18 kJ/mol. The positive sign confirms that the degradation process is endothermic and requires energy input.
The activation entropy (ΔS*), which indicates the degree of molecular disorder in the transition state, was negative in all cases. These negative values indicate that the transition state is more ordered than the initial reactants, implying restricted molecular motion during the degradation process.
These thermodynamic trends are consistent with findings from other studies on anthocyanin degradation in non-wine matrices, such as fruit juices and plant extracts [34,35,36,37]. This similarity supports the broader relevance of the observed degradation behavior across different food systems.

4. Conclusions

The degradation of anthocyanins in Serbian ‘Merlot’ red wine under oxidative conditions followed first-order kinetics, with rate constants ranging from 0.00197 to 0.01113 min−1, depending on temperature and anthocyanin structure. The activation energy (Ea) values varied between 40.58 and 56.62 kJ/mol, indicating moderate thermal sensitivity. Reaction temperature had the strongest influence on degradation rates, with Cygl being the most susceptible to oxidation. In contrast, Pngl and its derivatives demonstrated higher thermal and oxidative stability. Among the acylated anthocyanins, Mvgl-ac showed lower stability compared to Pngl-ac. A similar pattern was observed for their p-coumaroylated forms, with malvidin-based derivatives degrading more rapidly.
These findings highlight the role of anthocyanin structure in determining oxidative stability. From a practical standpoint, controlling oxygen exposure and metal ion content—particularly copper—during both vineyard management and winemaking is essential for preserving anthocyanin integrity and ensuring color stability in red wines. Reducing excessive copper residues—e.g., by managing pesticide inputs—and optimizing micro-oxygenation during fermentation and aging could help maintain anthocyanin composition and support the production of high-quality wines. These findings provide guidance for winemakers aiming to enhance shelf life, color stability, and overall market competitiveness.

Author Contributions

Conceptualization, V.J., M.M. and V.S.J.; methodology, M.R.A.; software, B.A., R.A.A. and J.M.; validation and formal analysis, K.F.S.A.; resources, V.J. and J.M.; data curation M.M. and V.S.J.; writing—original draft preparation, M.M., Z.P., K.F.S.A.; project administration, V.J.; funding acquisition, V.J. All authors have read and agreed to the published version of the manuscript.

Funding

The authors are thankful to the University of Ha’il, Kingdom of Saudi Arabia. This research has been funded by the Scientific Research Deanship at the University of Ha’il—Saudi Arabia, through project number RG-24159.

Data Availability Statement

The original contributions presented in the study are included in the article; further inquiries can be directed to the corresponding author.

Acknowledgments

The authors would like to thank the University of Ha’il, Kingdom of Saudi Arabia, for their support. This research was funded by the Scientific Research Deanship through project RG-24159.

Conflicts of Interest

The authors declare no conflicts of interest.

References

  1. Harborne, J.B. The Flavonoids: Advances in Research Since 1986; Routledge: New York, NY, USA, 1994; Chapter 1; pp. 1–22. [Google Scholar] [CrossRef]
  2. Horbowicz, M.; Kosson, R.; Grzesiuk, A.; Dębski, H. Anthocyanins of Fruits and Vegetables-Their Occurrence, Analysis and Role in Human Nutrition. Veg. Crops Res. Bull. 2008, 68, 5–22. [Google Scholar] [CrossRef]
  3. Bubola, M.; Rossi, S.; Váczy, K.Z.; Hegyi, Á.I.; Persic, M.; Zdunic, G.; Bestulic, E.; Orbanic, F.; Zsofi, Z.; Radeka, S. Modification of Cv. Merlot Berry Composition and Wine Sensory Characteristics by Different Leaf Area to Fruit Ratios. Appl. Sci. 2023, 13, 5465. [Google Scholar] [CrossRef]
  4. Waterhouse, A.L. Wine phenolics. Ann. New York Acad. Sci. 2002, 957, 21–36. [Google Scholar] [CrossRef] [PubMed]
  5. Zhang, H.-L.; Xia, N.-Y.; Yao, X.-C.; Duan, C.-Q.; Pan, Q.-H. Effects of Phenolic Evolution on Color Characteristics of Single-Cultivar Vitis vinifera L. Marselan and Merlot Wines during Vinification and Aging. Foods 2024, 13, 494. [Google Scholar] [CrossRef] [PubMed]
  6. Enaru, B.; Dretcanu, G.; Pop, T.D.; Stanila, A.; Diaconeasa, Z. Anthocyanins: Factors Affecting Their Stability and Degradation. Antioxidants 2021, 10, 1967. [Google Scholar] [CrossRef]
  7. Ugliano, M. Oxygen contribution to wine aroma evolution during bottle aging. J. Agric. Food Chem. 2013, 61, 6125–6136. [Google Scholar] [CrossRef]
  8. Ferreira, V.; Bueno, M.; Franco-Luesma, E.; Culleré, L.; FernándezZurbano, P. Key changes in wine aroma active compounds during bottle storage of spanish red wines under different oxygen levels. J. Agric. Food Chem. 2014, 62, 10015–10027. [Google Scholar] [CrossRef]
  9. De Beer, D.; Joubert, E.; Marais, J.; Van Schalkwyk, D.; Manley, M. Climatic region and vine structure: Effect on Pinotage wine phenolic composition, total antioxidant capacity and color. S. Afr. J. Enol. Vitic. 2006, 27, 151–166. [Google Scholar] [CrossRef]
  10. Kulhankova, M.; Prusova, B.; Licek, J.; Kumsta, M.; Baron, M. Impact of technological operations on oxygen consumption during wine production. Acta Aliment. 2023, 52, 281–293. [Google Scholar] [CrossRef]
  11. Petrozziello, M.; Torchio, F.; Piano, F.; Giacosa, S.; Ugliano, M.; Bosso, A.; Rolle, L. Impact of increasing levels of oxygen consumption on the evolution of color, phenolic, and volatile compounds of Nebbiolo wines. Front. Chem. 2018, 6, 137. [Google Scholar] [CrossRef]
  12. Elias, R.J.; Waterhouse, A.L. Controlling the fenton reaction in wine. J. Agric. Food Chem. 2010, 58, 1699–1707. [Google Scholar] [CrossRef]
  13. Waterhouse, A.L.; Laurie, V.F. Oxidation of wine phenolics: A critical evaluation and hypotheses. Am. J. Enol. Vitic. 2006, 57, 306–313. [Google Scholar] [CrossRef]
  14. Guanghao, W.; Yogesh, K. Mechanism of the initial stage of non-enzymatic oxidation of wine: A mini review. J. Food Sci. 2024, 89, 2530. [Google Scholar] [CrossRef] [PubMed]
  15. Tariba, B. Metals in wine—Impact on wine quality and health outcomes. Biol. Trace. Elem. Res. 2011, 144, 143–156. [Google Scholar] [CrossRef] [PubMed]
  16. Ivanova-Petropulos, V.; Hermosín-Gutierrez, I.; Boros, B.; Stefova, M.; Stafilov, T.; Vojnoski, B.; Dornyei, A.; Kilar, F. Phenolic compounds and antioxidant activity of Macedonian red wines. J. Food Compos. Anal. 2015, 41, 1–14. [Google Scholar] [CrossRef]
  17. Kőrösi, L.; Molnár, S.; Teszlák, P.; Dörnyei, Á.; Maul, E.; Töpfer, R.; Marosvölgyi, T.; Szabó, É.; Röckel, F. Comparative Study on Grape Berry Anthocyanins of Various Teinturier Varieties. Foods 2022, 11, 3668. [Google Scholar] [CrossRef]
  18. Jordão, A.M.; Correia, A.C.; Martins, B.; Romão, A.; Oliveira, B. General Physicochemical Parameters, Phenolic Composition, and Varietal Aromatic Potential of Three Red Vitis vinifera Varieties (“Merlot”, Syrah”, and “Saborinho”) Cultivated on Pico Island—Azores Archipelago. Int. J. Plant Biol. 2024, 15, 1369–1390. [Google Scholar] [CrossRef]
  19. Liu, Y.; Tikunov, Y.; Schouten, R.E.; Marcelis, L.F.M.; Visser, R.G.F.; Bovy, A. Anthocyanin Biosynthesis and Degradation Mechanisms in Solanaceous Vegetables: A Review. Front. Plant Sci. 2018, 9, 1370. [Google Scholar] [CrossRef]
  20. Blanco-Vega, D.; Gomez-Alonso, S.; Hermosín-Gutierrez, I. Identification, content and distribution of anthocyanins and low molecular weight anthocyanin-derived pigments in Spanish commercial red wines. Food Chem. 2014, 158, 449–458. [Google Scholar] [CrossRef]
  21. Aklilu, E.G.; Adem, A.; Kasirajan, R.; Ahmed, Y. Artificial neural network and response surface methodology for modeling and optimization of activation of lactoperoxidase system. S. Afr. J. Chem. Eng. 2021, 37, 12–22. [Google Scholar] [CrossRef]
  22. Koocheki, A.; Taherian, A.R.; Razavi, S.; Bostan, A. Response surface methodology for optimization of extraction yield, viscosity, and hue and emulsion stability of mucilage extracted from Lepidium perfoliatum seeds. Food Hydrocoll. 2009, 23, 2369–2379. [Google Scholar] [CrossRef]
  23. Che Sulaiman, I.S.; Basri, M.; Fard Masoumi, H.R.; Chee, W.J.; Ashari, S.E.; Ismail, M. Effects of temperature, time, and solvent ratio on the extraction of phenolic compounds and the anti-radical activity of Clinacanthus nutans Lindau leaves by response surface methodology. Chem. Cent. J. 2017, 11, 54. [Google Scholar] [CrossRef] [PubMed]
  24. Murray, H.; Stipkovits, F.; Wühl, J.; Halbwirth, H.; Gössinger, M. Strawberry Post-Harvest Anthocyanin Development to Improve the Colour Stability of Strawberry Nectars. Beverages 2024, 10, 36. [Google Scholar] [CrossRef]
  25. Modesto, E.N., Jr.; Martins, M.G.; Pereira, G.A.; Chisté, R.C.; Pena, R. Stability Kinetics of Anthocyanins of Grumixama Berries (Eugenia brasiliensis Lam.) during Thermal and Light Treatments. Foods 2023, 12, 565. [Google Scholar] [CrossRef]
  26. Stübler, A.-S.; Böhmker, L.; Juadjur, A.; Heinz, V.; Rauh, C.; Shpigelman, A.; Aganovic, K. Matrixand Technology-Dependent Stability and Bioaccessibility of Strawberry Anthocyanins during Storage. Antioxidants 2021, 10, 30. [Google Scholar] [CrossRef]
  27. Yu, Y.; Shiau, S.; Pan, W.; Yang, Y. Extraction of Bioactive Phenolics from Various AnthocyaninRich Plant Materials and Comparison of Their Heat Stability. Molecules 2024, 29, 5256. [Google Scholar] [CrossRef]
  28. Micó-Vicent, B.; Ramos, M.; Viqueira, V.; Luzi, F.; Dominici, F.; Terenzi, A.; Maron, E.; Hamzaoui, M.; Kohnen, S.; Torre, L. Anthocyanin Hybrid Nanopigments from Pomegranate Waste: Colour, Thermomechanical Stability and Environmental Impact of Polyester-Based Bionano composites. Polymers 2021, 13, 1966. [Google Scholar] [CrossRef]
  29. Mitić, M.; Mitić, J. Unveiling the Dynamics of “Vranac” Wine Anthocyanins Oxidation: Insights from Accelerated Chemical Testing. Chem. Naiss. 2024, 6, 46–69. [Google Scholar] [CrossRef]
  30. Martynenko, A.; Chen, Y. Degradation kinetics of total anthocyanins and formation of polymeric color in blueberry hydrothermodynamic (HTD) processing. J. Food Eng. 2016, 171, 44–51. [Google Scholar] [CrossRef]
  31. Muche, B.M.; Speers, R.A.; Rupasinghe, H.P.V. Storage Temperature Impacts on Anthocyanins Degradation, Color Changes and Haze Development in Juice of “Merlot” and “Ruby” Grapes (Vitis vinifera). Front. Nutr. 2018, 5, 100. [Google Scholar] [CrossRef]
  32. Al-Zubaidy, M.M.I.; Khalil, R.A. Kinetic and prediction studies of ascorbic acid degradation in normal and concentrate local lemon juice during storage. Food Chem. 2007, 101, 254–259. [Google Scholar] [CrossRef]
  33. Vikram, V.B.; Ramesh, M.N.; Prapulla, S.G. Thermal degradation kinetics of nutrients in orange juice heated by electromagnetic and conventional methods. J. Food Eng. 2009, 69, 31–40. [Google Scholar] [CrossRef]
  34. Sinela, A.; Rawat, N.; Mertz, C.; Achir, N.; Fulcrand, H.; Dornier, M. Anthocyanins degradation during storage of Hibiscus sabdariffa extract and evolution of its degradation products. Food Chem. 2017, 214, 234–241. [Google Scholar] [CrossRef] [PubMed]
  35. Kuasnei, M.; Benvenutti, L.; Fernando dos Santos, D.; Ferreira, S.R.S.; Pinto, V.Z.; Ferreira Zielinski, A.A. Efficient Anthocyanin Recovery from Black Bean Hulls Using Eutectic Mixtures: A Sustainable Approach for Natural Dye Development. Foods 2024, 13, 1374. [Google Scholar] [CrossRef] [PubMed]
  36. Oancea, S. A Review of the Current Knowledge of Thermal Stability of Anthocyanins and Approaches to Their Stabilization to Heat. Antioxidants 2021, 10, 1337. [Google Scholar] [CrossRef]
  37. Slavu (Ursu), M.; Aprodu, I.; Milea, Ș.A.; Enachi, E.; Râpeanu, G.; Bahrim, G.E.; Stănciuc, N. Thermal Degradation Kinetics of Anthocyanins Extracted from Purple Maize Flour Extract and the Effect of Heating on Selected Biological Functionality. Foods 2020, 9, 1593. [Google Scholar] [CrossRef]
Figure 1. Pareto charts of factors influence on PAR of different anthocyanins: (1) Dpgl; (2) Cygl; (3) Ptgl; (4) Pngl; (5) Mvgl; (6) Pngl-ac; (7) Mvgl-ac; (8) Pngl-p-coum; (9) Mvgl-p-coum; factor codes: x1, H2O2 concentration; x2, Cu (II) concentration; x3, reaction temperature.
Processes 13 02245 g001
Figure 2. Response-surface plots for malvidin-3-O-glucoside degradation: (1,2) influence of H2O2 and temperature at Cu = 0.01 and 0.02 mmol L−1; (3,4) influence of H2O2 and Cu (II) at 30 °C and 40 °C; (5,6) influence of Cu (II) and temperature at H2O2 = 10 and 20 mmol L−1. Surfaces are based on the 23 full-factorial design; intermediate values are linearly interpolated.
Processes 13 02245 g002
Figure 3. Degradation of the individual anthocyanins during heating: (a) dpgl, (b) cygl, (c) ptgl, (d) pngl, (e) mvgl, (f) pngl-ac, (g) mvgl-ac, (h) pngl-p-coum, (i) mvgl-p-coum.
Processes 13 02245 g003
Table 1. Analytical parameters for anthocyanins used for HPLC-DAD analysis.
CompoundCalibration Curve(R2)Range (mg/L)LOD 1 (mg/L)LOQ 2 (mg/L)
Dpgl y = 3.602 x 0.10 0.99960.50–20.000.030.10
Cygl y = 5.738 x + 0.22 0.99940.50–20.000.020.07
Pngl y = 4.093 x + 0.43 0.99980.50–20.000.030.10
Mvgl y = 5.038 x + 0.36 0.99982.00–50.000.120.39
1 LOD—limit of detection; 2 LOQ—limit of determination; Dpgl—delphinidin-3-O-glucoside; Cygl—cyanidin-3-O-glucoside; Pngl—peonidin-3-O-glucoside; Mvgl—malvidin-3-O-glucoside.
Table 2. Experimental values and coded levels of the independent variables used for the Experimental design with the observed response values for Dpgl, Cygl, and Ptgl.
NoDesign MatrixDpglCyglPtgl
x1 (mmolL−1)x2 (mmolL−1)x3 (°C)PARex 1PARpre 2PARexPARprePARexPARpre
110 (−1)0.01 (−1)30 (−1)16.94 ± 0.30 a16.8726.81 ± 0.4926.5518.53 ± 0.1818.42
220 (+1)0.01 (−1)30 (−1)18.99 ± 0.2219.0631.15 ± 0.4431.4121.12 ± 0.1721.23
310 (−1)0.02 (+1)30 (−1)19.66 ± 0.4519.7332.97 ± 0.3633.2321.86 ± 0.2421.96
420 (+1)0.02 (+1)30 (−1)21.99 ± 0.5221.9238.35 ± 0.2338.0924.88 ± 0.3224.77
510 (−1)0.01 (−1)40 (+1)23.38 ± 0.4823.2643.96 ± 0.2843.4626.40 ± 0.2626.25
620 (+1)0.01 (−1)40 (+1)26.14 ± 0.3626.2651.04 ± 0.6051.5530.16 ± 0.3530.31
710 (−1)0.02 (+1)40 (+1)27.14 ± 0.3327.2653.64 ± 0.5554.1531.13 ± 0.2631.28
820 (+1)0.02 (+1)40 (+1)30.37 ± 0.6230.2562.75 ± 0.5862.2535.50 ± 0.4235.35
x1—H2O2 concentration; x2—Cu (II) concentration; x3—temperature; Dpgl—delphinidin-3-O-glucoside; Cygl—cyanidin-3-O-glucoside; Ptgl—petunidin-3-O-glucoside; a Mean values (n = 3) ± standard deviation; 1 Experimental results; 2 Predicted results.
Table 3. Experimental values and coded levels of the independent variables used for the Experimental design with the observed response values for Pngl, Mvgl, and Pngl-ac.
NoDesign MatrixPnglMvglPngl-ac
x1 (mmolL−1)x2 (mmolL−1)x3 (°C)PARex 1PARpre 2PARexPARprePARexPARpre
110 (−1)0.01 (−1)30 (−1)16.47 ± 0.44 a16.422.42 ± 0.5921.1516.16 ± 0.3216.18
220 (+1)0.01 (−1)30 (−1)18.12 ± 0.3418.1925.88 ± 0.3926.117.45 ± 0.1817.44
310 (−1)0.02 (+1)30 (−1)18.97 ± 0.2219.0427.73 ± 0.5327.818.68 ± 0.1218.67
420 (+1)0.02 (+1)30 (−1)20.89 ± 0.3620.8231.89 ± 0.2931.719.93 ± 0.2319.94
510 (−1)0.02 (−1)40 (+1)21.10 ± 0.5221.0334.20 ± 0.3533.920.36 ± 0.2920.31
620 (+1)0.01 (−1)40 (+1)23.21 ± 0.4823.2839.61 ± 0.4339.921.98 ± 0.1622.03
710 (−1)0.02 (+1)40 (+1)24.33 ± 0.3624.442.22 ± 0.5042.523.54 ± 0.2723.59
820 (+1)0.02 (+1)40 (+1)26.72 ± 0.5026.6548.83 ± 0.3848.525.35 ± 0.3225.3
Pngl—peonidin-3-O-glucoside; Mvgl—malvidin-3-O-glucoside; Pngl—ac-peonidin-3-O-(6′-acetyl)-glucoside; a Mean values (n = 3) ± standard deviation; 1 Experimental results; 2 Predicted results.
Table 4. Experimental values and coded levels of the independent variables used for the Experimental design with the observed response values for Mvgl-ac, Pngl-p-coum, and Mvgl-p-coum.
NoDesign MatrixMvgl-acPngl-p-coumMvgl-p-coum
x1 (mmolL−1)x2 (mmolL−1)x3 (°C)PARex 1PARpre 2PARexPARprePARexPARpre
110 (−1)0.01 (−1)30 (−1)24.41 ± 0.50 a24.0719.41 ± 0.2819.0522.58 ± 0.2222.33
220 (+1)0.01 (−1)30 (−1)28.40 ± 0.1828.7222.32 ± 0.3222.6726.31 ± 0.3426.58
310 (−1)0.02 (+1)30 (−1)30.48 ± 0.2430.8223.29 ± 0.2023.8728.90 ± 0.4529.15
420 (+1)0.02 (+1)30 (−1)35.82 ± 0.4835.4728.08 ± 0.2628.2633.67 ± 0.4833.4
510 (−1)0.01 (−1)40 (+1)36.80 ± 0.4436.2529.21 ± 0.4228.835.22 ± 0.3634.8
620 (+1)0.01 (−1)40 (+1)43.23 ± 0.5843.7533.55 ± 0.3533.1841.04 ± 0.3341.43
710 (−1)0.02 (+1)40 (+1)45.37 ± 0.6045.9634.98 ± 0.3035.1645.08 ± 0.4745.5
820 (+1)0.02 (+1)40 (+1)54.00 ± 0.5553.4540.50 ± 0.5240.3252.52 ± 0.5052.13
Mvgl-ac—malvidin-3-O-(6′-acetyl)-glucoside; Pngl-p-coum—Peonidin-3-O-(6′-p-coumaroyl)-glucosid); Mvgl-p-coum—Malvidin-3-O-(6′-p-coumaroyl)-glucoside; a Mean values (n = 3) ± standard deviation; 1 Experimental results; 2 Predicted results.
Table 5. Anthocyanin composition in Serbian red wine ‘Merlot’, (mg/L).
Anthocyaninmg/LAnthocyaninmg/LAnthocyaninmg/L
Dpgl6.022 ± 0.102Dpgl-ac0.824 ± 0.023Dpgl-p-coum-
Cygl2.356 ± 0.045Cygl-ac-Cygl-p-coum-
Ptgl9.821 ± 0.110Ptgl-ac1.036 ± 0.018Ptgl-p-coum0.587 ± 0.017
Pngl8.380 ± 0.092Pngl-ac1.380 ± 0.026Pngl-p-coum2.732 ± 0.032
Mvgl50.252 ± 0.128Mvgl-ac8.681 ± 0.104Mvgl-p-coum7.721 ± 0.081
Σ76.831 11.921 11.040
Dpgl-ac—Delphinidin-3-glucoside-acetate; Cygl-ac—Cyanidin/3/glucoside-acetate; Dpgl-ac—delphinidin-3-O-(6′-acetyl)-glucoside; Cygl-ac—cyanidin-3-O-(6′-acetyl)-glucoside; Ptgl-ac—petunidin-3-O-(6′-acetyl)-glucoside; Dpgl-p-coum—delphinidin-3-O-(6′-p-coumaroyl)-glucoside); Cygp-p-coum—cyaniding-3-O-(6′-p-coumaroyl)-glucoside); Ptgl-p-coum—petunidin-3-O-(6′-p-coumaroyl)-glucoside).
Table 6. ANOVA of the first order polynomial model for the response variables (actual values).
SOVx1x2x3x1x2x1x3x2x3x1x2x3ErrorTotal
DpglSS 113.44223.495108.410.07030.3240.64410.00450.4298146.82
Df 21111111814
MS 313.44223.495108.410.07030.3240.64410.00450.05373146.82
F250.17437.282017.71.30846.0311.9870.0837
p<0.00001 4<0.00001<0.000010.28575 10.039580.008540.77970 1
CyglSS83.916150.94842.751.2095.23268.06010.11287.21741099.4
Df1111111815
MS83.916150.94842.751.2095.23268.06010.11280.902273.296
F93.012167.9934.111.345.79988.93380.125
p<0.00001<0.00001<0.000010.28042 10.042620.017360.21465 1
PtglSS23.59836.808169.280.13520.79381.11010.0041.0944232.8223
Df1111111815
MS23.59836.808169.280.13520.79381.11010.0040.136815.5215
F172.5269.061237.40.98835.80268.11470.0292
p<0.00001<0.00001<0.000010.34927 10.042580.021520.86856 1
PnglSS9.461218.0354.6530.03780.10810.27010.000010.146482.7071
Df1111111815
MS9.461218.0354.6530.03780.10810.27010.000010.01835.5138
F517985.242986.52.06555.907114.7590.0006
p<0.00001<0.00001<0.000010.18860 10.041170.004930.98105 1
MvglSS49.005100.82406.1250.52.2054.50.023.0947566.269
Df1111111815
MS49.005100.82406.1250.52.2054.50.020.386837.7513
F126.69260.651049.91.29266.476211.6330.0517
p<0.00001<0.00001<0.000010.288475 10.034450.092130.825834 1
Pngl-acSS4.455116.675345.1720.00280.0990.30030.00660.136866.848
Df1111111815
MS4.455116.675345.1720.00280.0990.30030.00660.01714.4565
F260.53975.162641.60.16375.789413.5610.3859
p<0.00001<0.00001<0.000010.696370.042760.030350.55174
Mvgl-acSS73.811135.3454.511.53124.06124.35120.10125.4149679.08
DF1111111815
MD73.811135.3454.511.53124.06124.35120.10120.676845.272
F109.05199.91671.552.26246.00066.42910.1495
p<0.00001<0.00001<0.000010.170960.039960.034950.70909
Pngl-p-coumSS38.54462.496254.70.58321.17041.18580.06121.6424360.38
Df1111111815
MS38.54462.496254.70.58321.17041.18580.06120.205324.025
F187.74304.411240.62.84075.70095.77590.2981
p<0.00001<0.00001<0.000010.130390.044010.042950.59996
Mvgl-p-coumSS59.187153.3486.720.88442.83227.52720.0423.776714.26
Df1111111815
MS59.187153.3486.720.88440.83227.52720.0420.47247.617
F125.39324.781031.11.87376.000415.94740.0889
p<0.00001<0.00001<0.000010.208250.039960.003980.77317
H2O2 concentration (x1), Cu (II) concentration (x2) and reaction temperature (x3). SOV-Source of variation; 1 Sum of squares; 2 Degree of freedom; 3 Mean of square; 4 <0.00001 highly significant.
Table 7. Regression equations.
R2Radj2CV(%)
Dpgl y = 23.076 + 1.296 x 1 + 1.714 x 2 + 3.681 x 3 + 0.201 x 1 x 3 + 0.284 x 2 x 3 0.99700.99451.00
Cygl y = 42.588 + 3.238 x 1 + 4.344 x 2 + 10.264 x 3 + 0.808 x 1 x 3 + 1.004 x 2 x 3 0.99340.98772.23
Ptgl y = 26.197 + 1.717 x 1 + 2.145 x 2 + 4.600 x 3 + 0.315 x 1 x 3 + 0.372 x 2 x 3 0.99530.99111.41
Pngl y = 21.226 + 1.009 x 1 + 1.55001 + 2.614 x 3 + 0.116 x 1 x 3 + 0.184 x 2 x 3 0.99820.99660.64
Mvgl y = 34.075 + 2.475 x 1 + 3.550 x 2 + 7.125 x 3 + 0.525 x 1 x 3 + 0.750 x 2 x 3 0.99450.98971.82
Pngl-ac y = 20.431 + 0.746 x 1 + 1.444 x 2 + 2.376 x 3 + 0.111 x 1 x 3 + 0.194 x 2 x 3 0.99790.99620.64
Mvgl-ac y = 37.312 + 3.037 x 1 + 4.112 x 2 + 7.537 x 3 + 0.712 x 1 x 3 + 0.737 x 2 x 3 0.99200.98502.20
Pngl-p-coum y = 28.917 + 2.195 x 1 + 2.795 x 2 + 5.642 x 3 + 0.382 x 1 x 3 + 0.385 x 2 x 3 0.99540.99141.56
Mvgl-p-coum y = 35.665 + 2.720 x 1 + 4.377 x 2 + 7.800 x 3 + 0.595 x 1 x 3 + 0.970 x 2 x 3 0.99470.99011.92
Table 8. Thermodynamic parameters of degradion processes.
AnthocyaninsTkDt1/2EaΔH*ΔS*ΔG*
°Cmin−1minminkJmol−1kJmol−1Jmol−1K−1kJmol−1
Dpgl250.002271014.10305.2843.7341.28−156.7187.98
300.00294782.99235.71 41.21−157.4288.91
350.00373617.16185.79 41.17−157.9189.81
400.00536429.48129.29 41.13−157.3090.37
Cygl250.00369623.85187.8156.6254.18−109.4086.78
300.00523440.15132.51 54.11−110.0887.46
350.00730315.3494.93 54.06−110.4888.09
400.01113206.8362.26 54.02−110.0488.46
Ptgl250.00235979.57294.8946.0843.63−148.5487.90
300.00320719.37216.56 43.56−148.9688.70
350.00425541.65163.06 43.52−149.2190.18
400.00576399.65120.31 43.48−149.2092.55
Pngl250.001971168.53351.7743.6141.16−158.3088.17
300.00279825.09248.39 41.09−158.2689.04
350.00350657.71198.00 41.05−158.8589.97
400.00470489.79147.45 41.01−158.7990.71
Mvgl250.00296777.70234.1254.7552.27−117.6287.32
300.00423544.21163.83 52.23−118.0287.99
350.00583394.85118.87 52.19−118.2588.61
400.00863266.7480.30 52.15−118.1489.12
Pngl-ac250.002011145.27344.7840.5838.13−168.2988.28
300.00272840.15252.92 38.06−168.4089.09
350.00340677.06203.82 38.02−168.9290.05
400.00450511.55154.00 37.98−168.8390.82
Mvgl-ac250.00314733.12220.7053.7651.29−120.4387.18
300.00455505.93152.31 51.25−120.66787.81
350.00609377.99113.79 51.21−120.2688.43
400.00908253.5276.32 51.16−120.8688.99
Pngl-p-coum250.00265868.68261.5146.2143.76−147.1287.60
300.00388593.30178.61 43.69−146.9488.21
350.00531433.52130.51 43.64−146.9588.91
400.00648355.25101.32 43.6−147.3789.73
Mvgl-p-coum250.00319721.63217.2455.3352.88−114.9787.14
300.0045511.55154.00 52.81−115.6187.84
350.00647355.79107.11 52.76−115.6988.4
400.00925248.8674.92 52.72−115.7388.95
Disclaimer/Publisher’s Note: The statements, opinions and data contained in all publications are solely those of the individual author(s) and contributor(s) and not of MDPI and/or the editor(s). MDPI and/or the editor(s) disclaim responsibility for any injury to people or property resulting from any ideas, methods, instructions or products referred to in the content.

