Article

Deciphering the Time-Dependent Deformation and Failure Mechanism of the Large Underground Powerhouse in Baihetan Hydropower Station

Mining College, Guizhou University, Guiyang 550025, China
*
Author to whom correspondence should be addressed.
Processes 2025, 13(7), 2244; https://doi.org/10.3390/pr13072244 (registering DOI)
Submission received: 11 June 2025 / Revised: 7 July 2025 / Accepted: 8 July 2025 / Published: 14 July 2025
(This article belongs to the Section AI-Enabled Process Engineering)

Abstract

During the excavation of the underground cavern at the Baihetan hydropower station, significant time-dependent deformation of the surrounding rock was observed, posing a serious challenge to the long-term stability control of the caverns. In this study, numerical models of the layered excavation for typical monitoring sections in the main and auxiliary powerhouses on both banks of the Baihetan hydropower station were established using a viscoplastic damage model. The time-dependent deformation responses of the surrounding rock during the entire underground cavern excavation process were successfully simulated, and the deformation and failure mechanisms of the surrounding rock during layered excavation were analyzed in combination with field monitoring data. The results demonstrate that the maximum stress trajectories at the right-bank powerhouse under higher stress conditions exceeded those at the left-bank powerhouse by 6 MPa after the powerhouse excavation. A larger stress difference caused stress trajectories to move closer to the rock strength surface, therefore making creep failure more likely to occur in the right bank. Targeted reinforcement in high-disturbance zones of the right-bank powerhouse reduced the damage progression rate at borehole openings from 0.295 per month to 0.0015 per month, effectively suppressing abrupt deformations caused by cumulative damage. These findings provide a basis for optimizing the excavation design of deep underground caverns.

1. Introduction

Accelerating global energy transitions and surging clean electricity demand are propelling the construction of large hydropower stations into deep-seated, geologically complex settings [1,2,3]. The Baihetan hydropower station, currently the world’s second largest in terms of installed capacity, is situated in the tectonically active mountainous canyon region of western Sichuan. This area has developed complex geological structures and a high in situ stress field due to intense crustal compression, shearing, and uplift [4,5,6,7,8]. These geomechanical conditions have induced significant surrounding rock deformation and failure during cavern excavation, manifesting as spalling, rockfalls, substantial wall displacement, and support system failures [1,9,10,11,12,13,14,15]. Although existing studies have investigated the deformation and failure mechanisms of the underground powerhouse at the Baihetan hydropower station from aspects such as in situ stress fields, structural plane distributions, and cavern spatial configurations, current analyses remain incomplete regarding spalling damage depth and scope during the staged excavation of the underground powerhouse, as well as persistent deep deformations and fracturing phenomena in surrounding rock through examining stress trajectories and damage evolution trends.
To evaluate the rock deformation and failure mechanisms during the underground excavation of the Baihetan hydropower station, scholars have employed a multidisciplinary approach incorporating field monitoring, numerical modeling, and physical model tests, yielding significant research advancements [1,10,16,17,18,19,20,21]. For instance, Shi et al. [17] conducted 3DEC numerical simulations of the underground powerhouses of the Baihetan hydropower station and systematically analyzed both stress-controlled and structure-controlled failure modes of the surrounding rock. Wang et al. [18] employed in situ monitoring to investigate large deformation evolution in excavations of multiple free faces, revealing more intense stress redistribution and denser fracture networks that ultimately lead to amplified spatial deformations in large caverns. Dai et al. [19] established a correlation between microseismic activity and construction based on microseismic monitoring, identified three damage areas in the surrounding rock during excavation, and found that microseismic clusters predominantly occurred in the stress concentration areas of underground cavities. Nevertheless, the underlying mechanical mechanisms governing persistent deformation and fracturing phenomena in large underground caverns have yet to be fully elucidated.
In recent years, various theoretical models for predicting time-dependent rock deformation have been proposed. For instance, Li et al. [22] considered the influence of geometric parameters such as initial microcrack length and orientation at the microscale, enabling an accurate prediction of creep failure times and crack distribution patterns under various stress conditions. Fu et al. [23] established a grain-based model (GBM) incorporating subcritical crack growth theory and chemical reaction kinetics using 3DEC software, successfully reproducing the creep mechanical properties of sandstone under different saturation conditions. Moreover, a fundamental relationship between local damage induced by microcrack propagation and macroscopic time-dependent deformation was revealed by Yu et al. [24] through the integration of subcritical crack growth theory with the numerical manifold method (NMM). However, prevailing creep constitutive models largely overlook the intrinsic links between macroscopic creep mechanics and micromechanical mechanisms in rocks.
More recently, a novel bounding surface viscoplastic damage (BS-VPD) model has been proposed by Lu et al. [25] within the framework of irreversible thermodynamics. The BS-VPD model establishes a mechanical link between macroscopic creep behavior and subcritical crack propagation at the microscale in rocks, capturing both transient and protracted mechanical responses. Its intuitive framework and simplified parametric calibration underpin our adoption for simulating time-dependent deformations in the surrounding rock of large hydropower caverns under excavation unloading.
In this study, the BS-VPD model was employed to simulate the time-dependent rock deformation during the excavation of the underground cavern on both banks of the Baihetan hydropower station. The numerical simulation was carried out through the commercial software platform COMSOL Multiphysics 6.2. COMSOL Multiphysics exhibits a distinct advantage over alternative finite element software through its flexible weak-form PDE interfaces, enabling the direct implementation of user-defined constitutive laws and algorithms. Meanwhile, combined with theoretical analysis and on-site monitoring data, the time-dependent deformation mechanism of the surrounding rock under unloading conditions is elucidated. The flowchart of the key modeling stage of this study is shown in Figure 1. The research findings can provide theoretical support for optimizing the construction and excavation design of deeply buried underground caverns and contribute to the long-term safety and stability of the surrounding rock.

2. Project Background
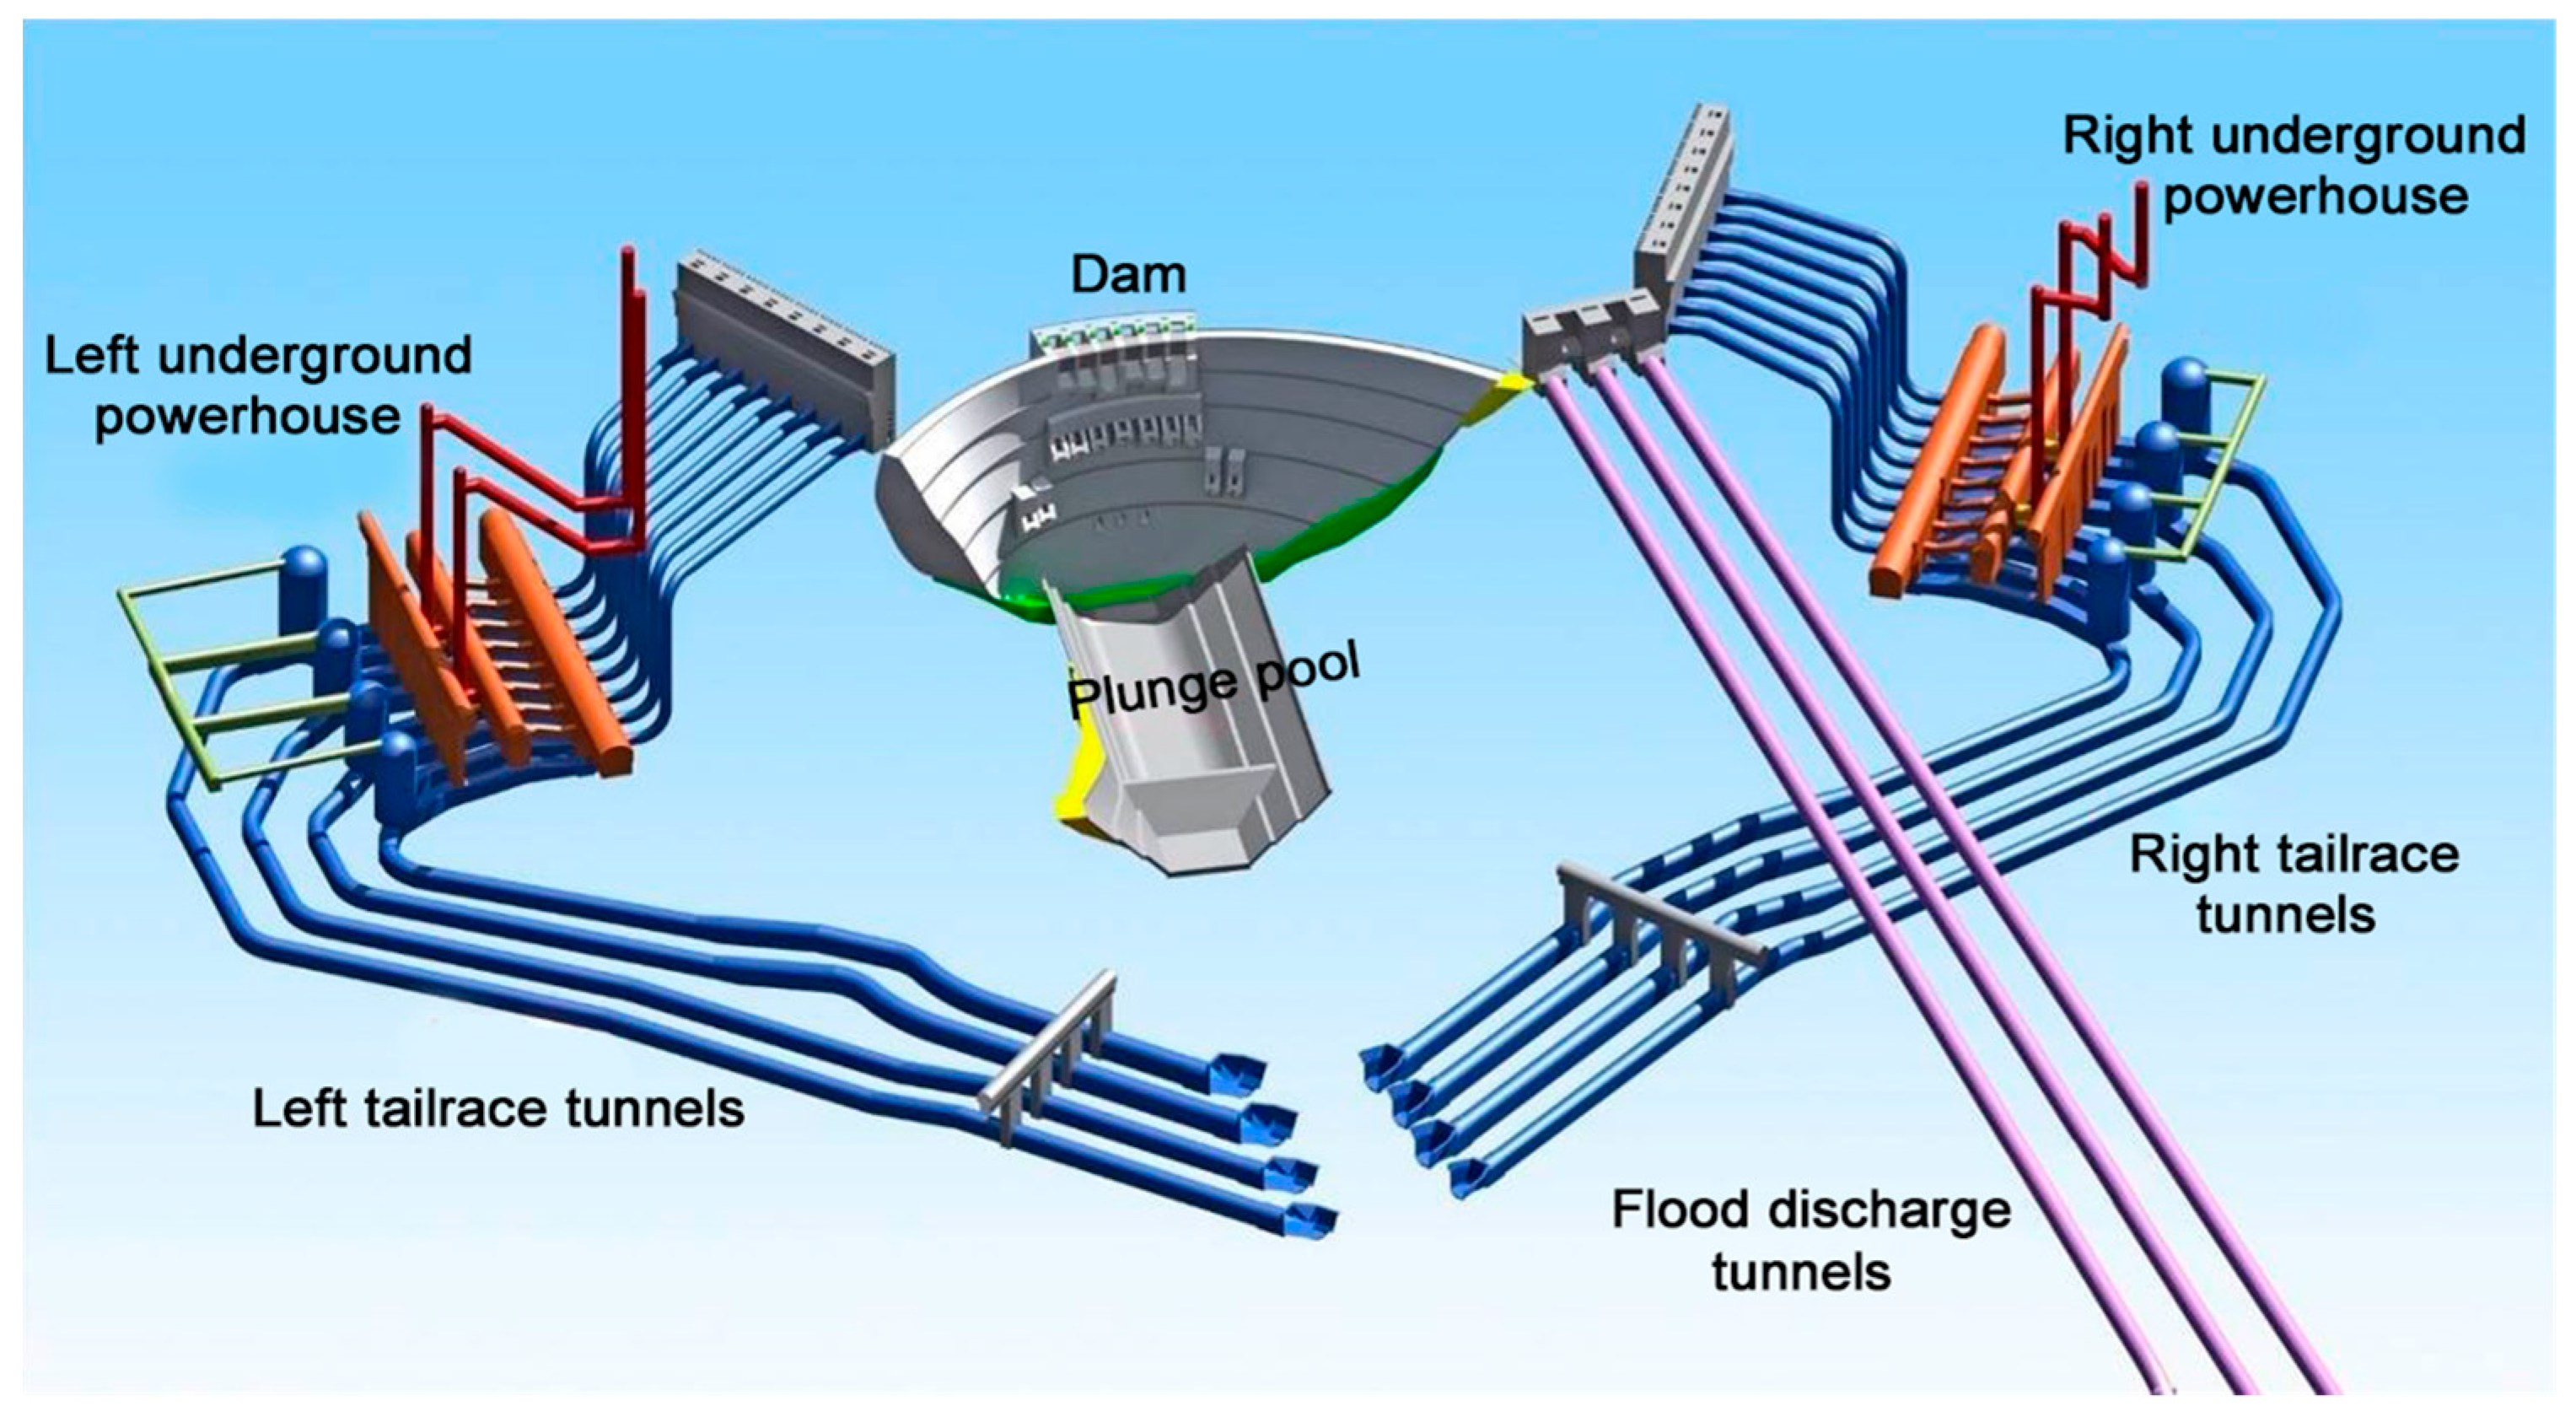
2.1. Overview

The Baihetan hydropower station on the Jinsha River is situated at the border of Ningnan County, Sichuan Province, and Qiaojia County, Yunnan Province [26], and is positioned between the upstream Wudongde hydropower station and the downstream Xiluodu hydropower station. The Baihetan hydropower station is mainly developed for power generation and also integrates flood control and navigation functions. The reservoir operates at a normal pool level of 825 m, with a total storage capacity of 20.627 billion m3 and a flood control capacity of 7.5 billion m3. Eight 1000 MW turbine generator units are installed on each bank, yielding a total installed capacity of 16,000 MW.
The key structure layout at the Baihetan hydropower station is shown in Figure 2. As can be observed, each side of the powerhouse is equipped with a water diversion and power generation system, comprising four principal caverns: the main and auxiliary powerhouse caverns, transformer caverns, tailrace gate chambers, and tailwater surge chambers. The main and auxiliary powerhouse caverns, measuring 438 m in length and 88.7 m in height, are characterized by a crown elevation of 624.6 m and rock beam elevations ranging from 602.3 to 604.4 m. These caverns exhibit a lower section width of 31 m and an upper section width of 34 m, representing the world’s largest-span underground powerhouse constructed to date.

2.2. Geological Conditions

2.2.1. Left-Bank Underground Powerhouse

The underground powerhouse on the left bank of the Baihetan hydropower station is horizontally embedded at depths of 600–1000 m and vertically buried between 260 and 330 m, with its chamber axis oriented N20°E. The stratum lithology predominantly comprises breccia lava, along with amygdaloidal basalt, plagioclase basalt, cryptocrystalline basalt, and columnar joint basalts. The interlayer dislocation zone C2 is developed along the middle section of the P2β24 tuffite stratum, primarily exposed in the northern end wall of the installation chamber and the sidewalls of the main powerhouse. The intralayer dislocation zone LS3152 is formed at the top of the P2β31 stratum, while zones LS3253, LS3254, LS3255, and LS3256, etc., are developed within the aphanitic basalt of the P2β32 stratum located in the hanging wall of C2.

2.2.2. Right-Bank Underground Powerhouse

The underground powerhouse on the right bank of the Baihetan hydropower station is horizontally embedded at depths of 420–800 m and vertically buried between 420 and 540 m, with its chamber axis oriented N10°W. The strata in this area primarily consist of layers from P2β33 to P2β51. Major faults, including F20 and f8107–f8109 with widths of 5–20 cm, are primarily composed of tectonic breccia. Interlayer dislocation zones C3, C4, and C5 are identified, where C3, characterized by gentle dip angles, obliquely intersects the main powerhouse and is predominantly exposed in the crown arch of the installation chamber and the sidewalls of the main powerhouse. C4, measuring 10–20 cm in width, is distinguished by foliated structural rocks within the zone and gently dips to intersect the crown arch of the auxiliary powerhouse and the upper section of the southern end wall. C5, with a width of 2–5 cm, is developed within the P2β52 tuffite stratum and contains foliated structural rocks, demonstrating systematic spatial relationships with adjacent geological units.

2.3. In Situ Stress

The in situ stress field in the underground powerhouse zone of the Baihetan hydropower station is dominated by tectonic stresses, with horizontal stresses consistently greater than vertical stresses in both left- and right-bank powerhouses. The first principal stress in the left-bank powerhouse intersects the chamber axis at a high angle, measuring approximately 19–23 MPa, while the second principal stress ranges between 13 and 16 MPa. The third principal stress is oriented nearly vertically, with magnitudes of 8.2–12.2 MPa. In the right-bank powerhouse, the first principal stress intersects the chamber axis at a low angle, measuring 22–26 MPa, whereas the second principal stress is nearly perpendicular to the axis, ranging from 14–18 MPa. The third principal stress in this area is also vertically oriented, with values of 13–16 MPa. The strength–stress ratios Rc/σ1 (where Rc is the saturated uniaxial compressive strength of the rock mass in the underground powerhouse area, and σ1 is the maximum stress) of the surrounding rock masses in the left- and right-bank powerhouses were determined to be 3.22–5.89 and 2.55–5.09, respectively, and the site can be classified as a region with high in situ stress [11,19,27].

3. Constitutive Model Framework and Rock Parameter Determination

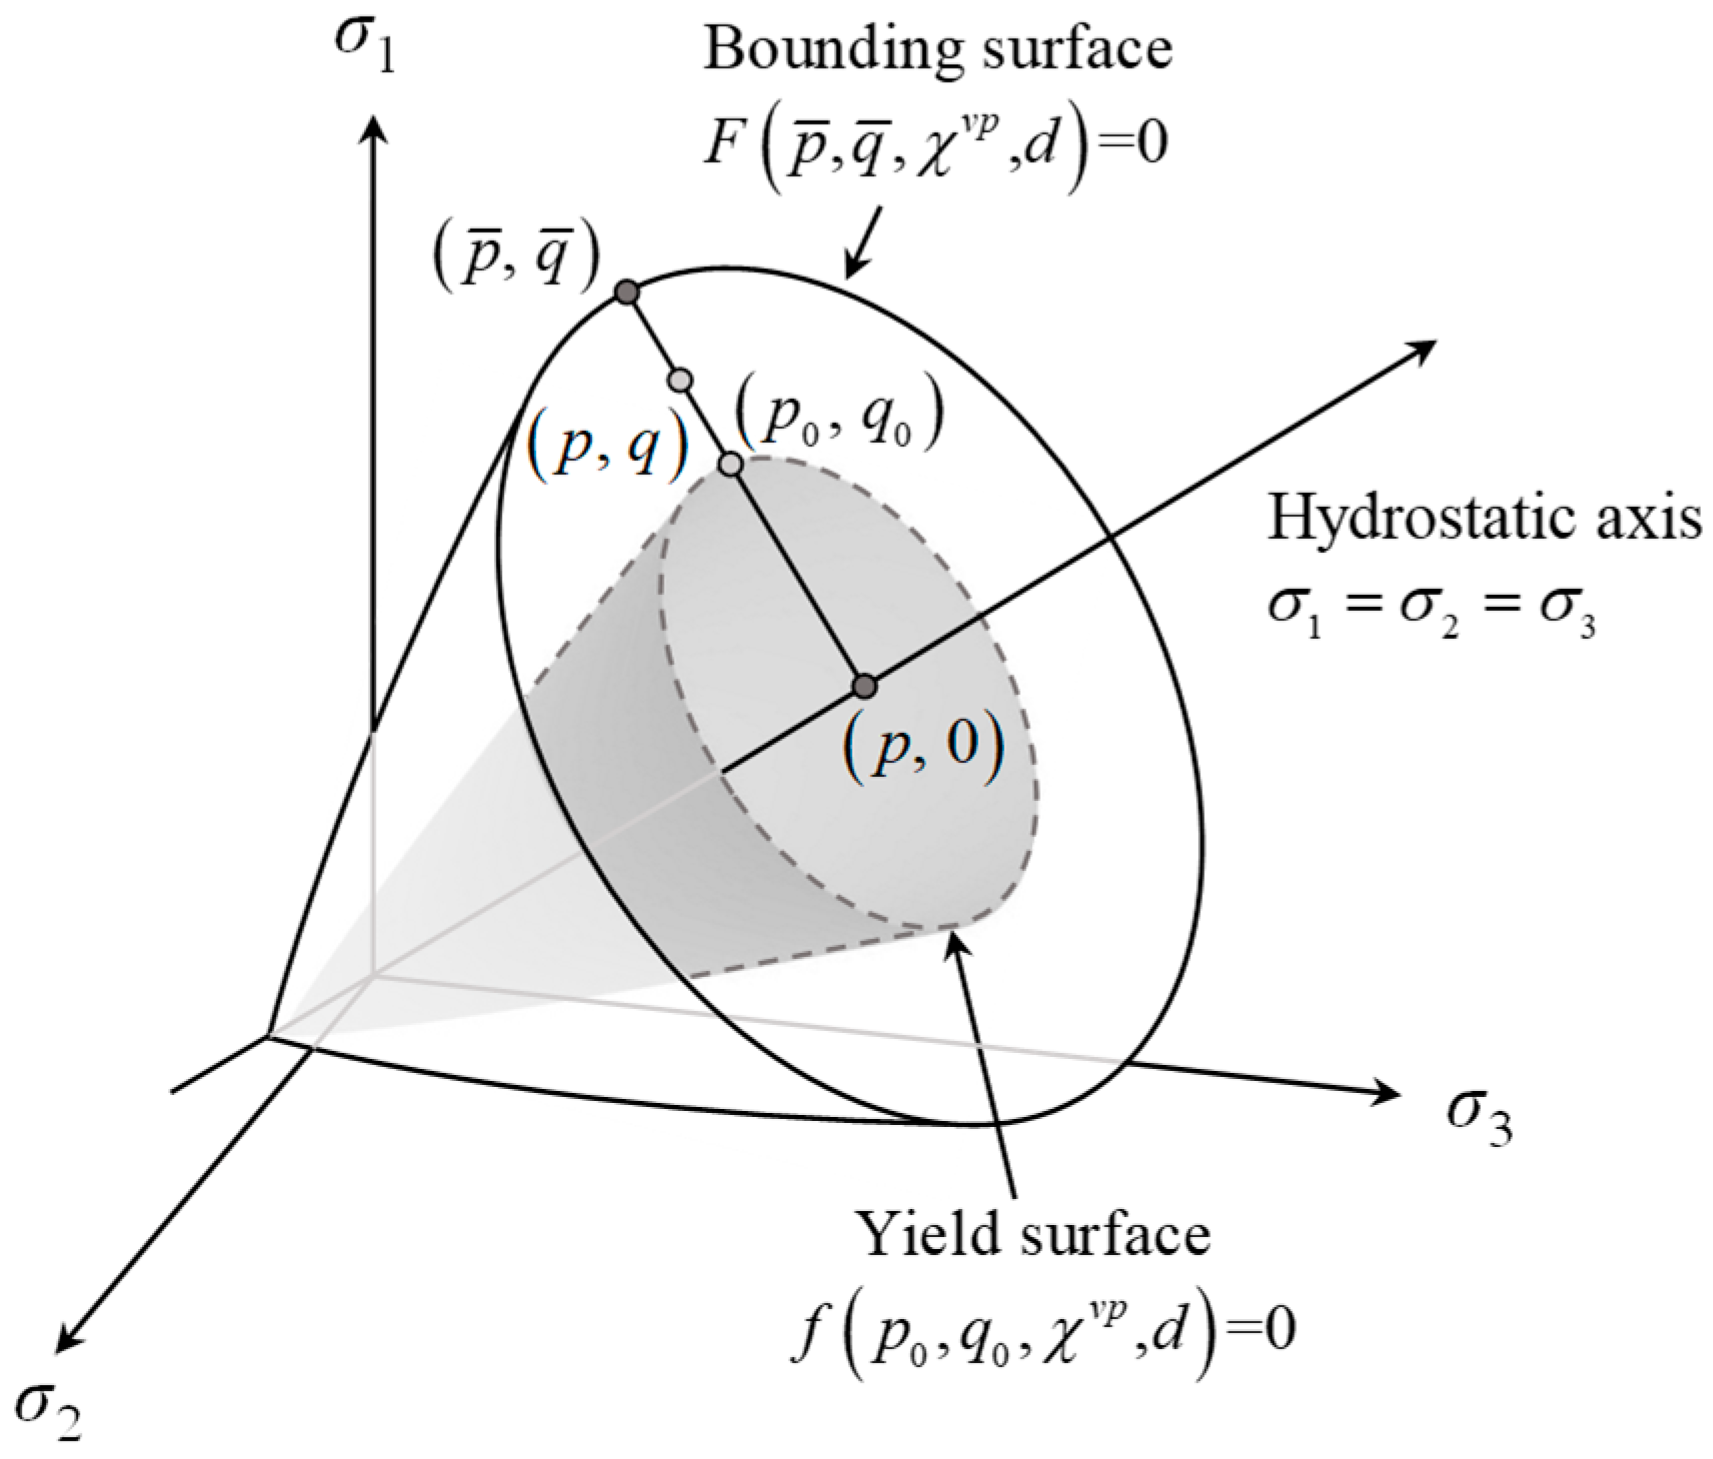
3.1. Brief Introduction of BS-VPD Model

According to Lu et al. [25], the bounding surface is defined as the outermost envelope encompassing all stress states under a given damage level, characterizing the ultimate states attainable by rock stress points across diverse loading paths. To establish the linkage between the bounding surface and the current stress state (p, q), a linear mapping procedure is implemented, wherein the current stress point (p, q) is projected from the hydrostatic pressure axis (p, 0) onto the bounding surface F, intersecting at the mapped point ( p ¯ , q ¯ ) . This geometric mapping relationship is systematically visualized across stress space projections, as shown in Figure 3.
Based on the radial mapping rule, the current stress state (p, q) and its projection point on the bounding surface satisfy the following linear relationship:
q ¯ q = b , p ¯ p = 1  
Here, b represents the similarity ratio between the bounding surface and the implicit loading surface where the current stress point is located. When the stress point is at the projection center (p, 0), b approaches +∞. Nevertheless, when the stress point moves away from the projection center (p, 0) and continuously approaches the bounding surface, the deviatoric stress q keeps increasing and the similarity ratio b gradually decreases, until the stress point meets the bounding surface when b = 1 (at this point q = q ¯ ).
According to Lu et al. [25], the plastic strain rate of the rock can be determined based on the subcritical crack propagation theory as follows:
ε ˙ i j v p = A v p 1 b 1 b 0 1 1 b 0 n v p g v p σ i j
For a more detailed formula derivation and parameter calibration process of the BS-VPD model, refer to Lu et al. [25].

3.2. Construction of the Numerical Model

3.2.1. The 0–12.7 m Cross-Section of the Left Bank

In consideration of the intricate topographic and geological conditions and complex chamber layout configuration of the Baihetan underground cavern group, the following simplified assumptions were adopted during the numerical modeling process to enhance computational efficiency:
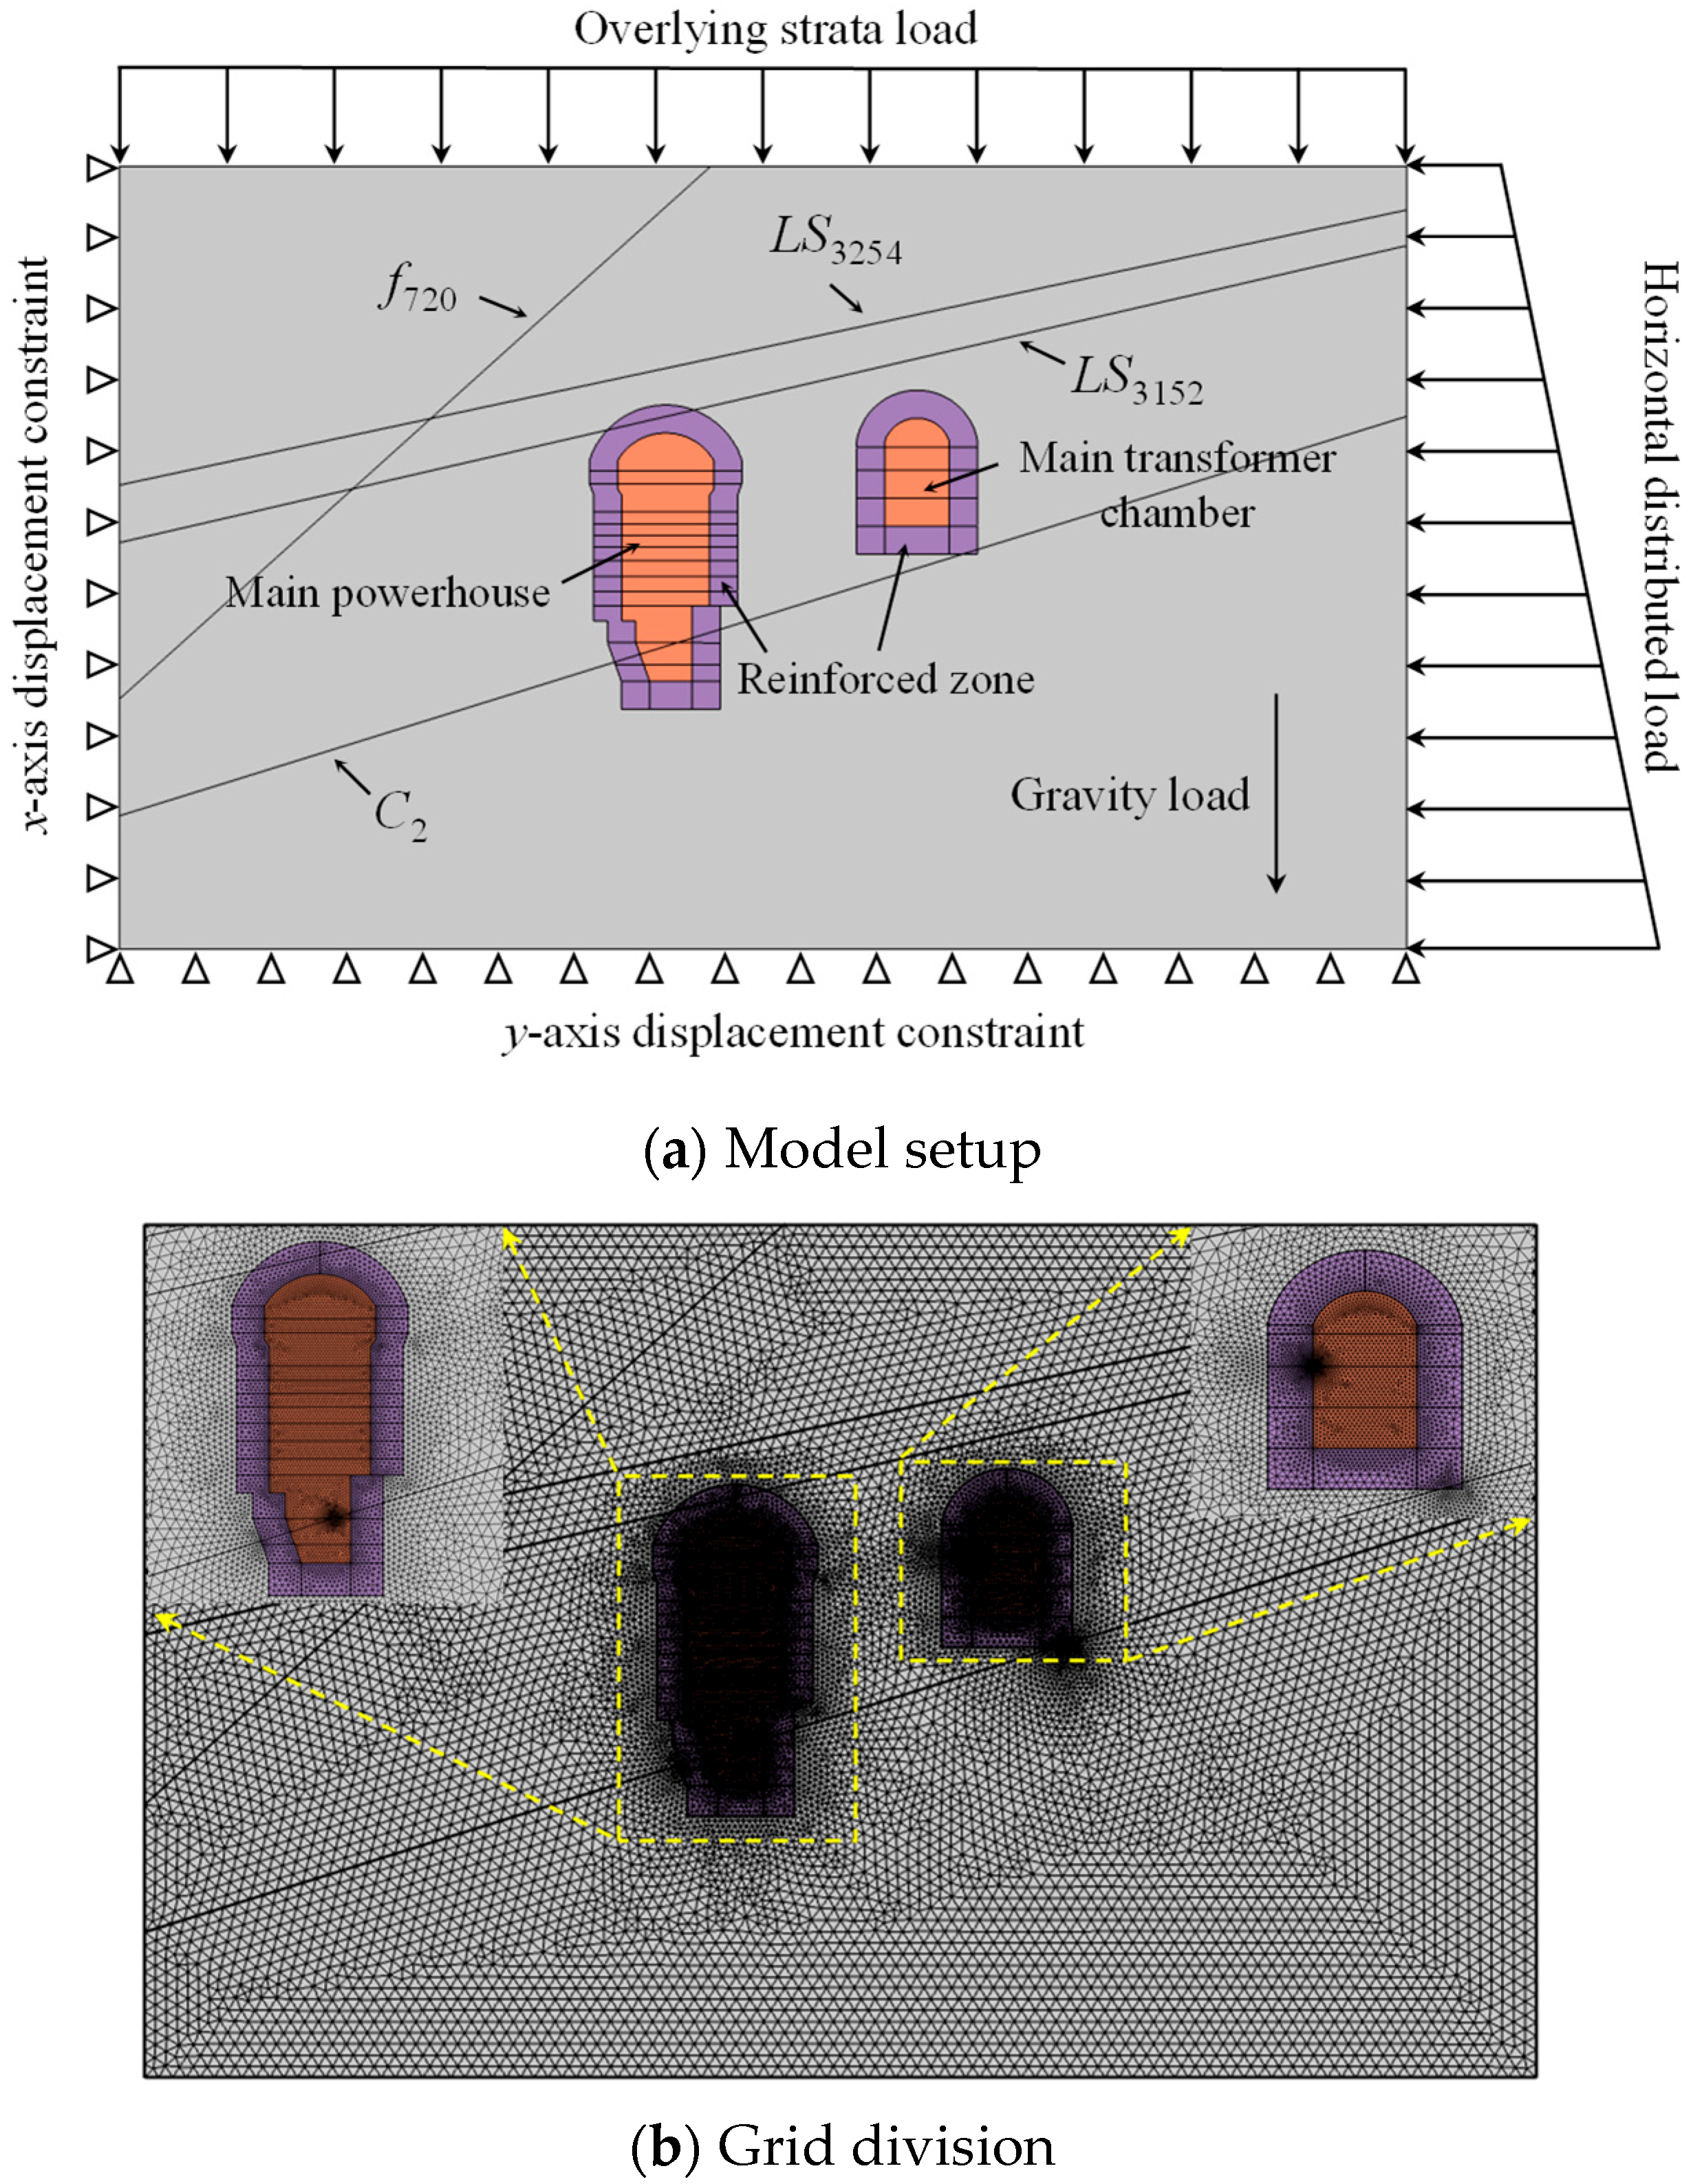
  • The longitudinal dimension of the underground powerhouse along its axis significantly exceeds its cross-sectional dimensions perpendicular to the axis, while the principal stress directions intersect with the cavern axis at substantial angles, thereby enabling the excavation simulation to be simplified as a plane strain configuration.
  • The influence of transformer cavern excavation on the surrounding rock deformation of the main powerhouse was exclusively considered. This selective simplification is justified by the substantial dimensions of the transformer cavern (spanning 21 m with a height of 39.5 m) and its proximate spatial relationship with the main powerhouse (the net distance between the two chambers is 60.65 m), whereby the secondary stress redistribution resulting from transformer cavern excavation was found to exert significant mechanical effects on the powerhouse periphery. In contrast, the remaining peripheral caverns, which exhibit dimensions substantially smaller than those of the main powerhouse, are characterized by limited stress perturbation ranges that fail to modify the global deformation patterns of the main powerhouse, and their cumulative influence was therefore considered negligible in the computational framework.
  • The equivalent simulation of rockbolt support was implemented through the enhancement of mechanical parameters in reinforcement zones. Although the explicit modeling of structural elements allows for accurate representation of stress characteristics in both rock masses and support systems, this approach inevitably incurs substantial computational overhead and prolongs numerical processing time. In fact, the reinforcing mechanism of rockbolts is fundamentally equivalent to the improvement of strength parameters in surrounding rock masses [28,29]. Therefore, the composite system of rock and bolt reinforcements in this study was homogenized as a continuum medium with uniformly enhanced strength properties, where the equivalent mechanical parameters of reinforced rock masses were determined through the following constitutive formulations:
E * = E b π r b 2 + E s l s r π r b 2 s l s r φ * = sin 1 1 + sin φ α + 2 sin φ 1 + sin φ α + 2 c * = c 1 + α 1 sin φ * cos φ 1 + sin φ cos φ *
where E*, φ*, and c* denote the equivalent elastic modulus, internal friction angle, and cohesion of the reinforced rock mass after rockbolt installation, respectively; E, φ, and c denote the corresponding mechanical parameters of the intact rock mass prior to reinforcement; Eb corresponds to the elastic modulus of rockbolt; rb indicates the rockbolt radius; sl and sr are the axial pitch and circumferential pitch of the rockbolt, respectively; and α is the anchor density factor, which can be calculated by the following formula:
α = 2 π r b η b s l s r
where ηb = tan φ denotes the friction coefficient between the rock and the rockbolt. The adopted rockbolt parameters are kept consistent with the operational support scheme implemented in the actual engineering project, as specified in Table 1, with the reinforcement scheduling implemented such that rockbolt installation would be executed immediately upon completion of excavation activities at each successive powerhouse level.
iv.
The left-bank surrounding rock mass was uniformly categorized as Class III1, as field investigations at the Baihetan underground powerhouse reveal that over 90% of the geological formation consists of this rock type, thereby justifying the adoption of a simplified Class III1 classification for the entire left-bank rock mass in the numerical model.
v.
The macroscopic structural discontinuities were explicitly modeled with elastic thin layer elements, including the interlayer shear zone C2, intrastratal shear zones LS3152 and LS3254, and fault f720 that exerts substantial influence on the powerhouse section at 0–12.7 m, as shown in Figure 4a.
The cavern excavation model for the 0–12.7 m section of Baihetan hydropower station’s left bank was constructed with COMSOL Multiphysics software, as shown in Figure 4b, where the main powerhouse had dimensions of 88.7 m × 34 m (31 m width below the rock-anchored beam) and the transformer chamber measured 39.5 m × 21 m. The model extended from elevation 450 m to 730 m, with a two-dimensional domain size of 456 m × 280 m (streamwise direction × vertical orientation), exceeding the excavation-induced stress redistribution range by 4–6 times the cavern radius. The computational mesh contains 24,762 elements and 12,565 nodes, with displacement constraints applied at the left and bottom boundaries, overburden pressure (Py = 5.1 MPa) applied at the top boundary, and horizontally distributed load (Px = 0.0304hr + 10.5 MPa, where hr is the buried depth [30]) applied at the right boundary, followed by gravitational load application throughout the model. It should be noted that although finer meshes generally yield enhanced accuracy, they concomitantly demand greater computational resources. On the contrary, too coarse a mesh quality may distort the numerical results. In order to solve mesh convergence problems, we conducted mesh size convergence tests, adjusted mesh size sensitivity, and compared displacement and stress data at identical points under different mesh sizes until differences in results became less than 5% [31,32]. Excavation was simulated using element activation technology, with sequential excavation stages matching the actual construction scheme: the main powerhouse was excavated in ten layers and the main transformer chamber in four layers.

3.2.2. The 0–040 m Cross-Section of the Right Bank

For the right-bank underground cavern group, the excavation process at the 0–040 m powerhouse section was simulated using a plane strain model, with only the main powerhouse and transformer chamber excavation considered to improve computational efficiency. Rockbolt support was equivalently simulated by enhancing the mechanical parameters of reinforced rock masses, where rockbolt parameters were identical to those used for the left bank (see Table 1), and support installation was conducted immediately after excavation completion at each powerhouse level. The surrounding rock mass of the right-bank underground powerhouse was uniformly classified as Class III1, while only macroscopic structural discontinuities, specifically interlayer shear zones C3, C4, and C5, as shown in Figure 5a, were considered to evaluate their effects on powerhouse deformation during excavation.
The excavation model for the 0–040 m section of the right-bank powerhouse at the Baihetan hydropower station was similarly established using COMSOL Multiphysics software, as shown in Figure 5b, with the computational mesh consisting of 27,374 elements and 14,936 nodes, overburden pressure (Py = 8.9 MPa) applied at the top boundary, horizontally distributed load (Px = 0.0276hr + 14.5 MPa, where hr is the buried depth) applied at the right boundary, and all other boundary conditions set identical to those of the left-bank powerhouse model.

3.3. Rock Parameter Calibration

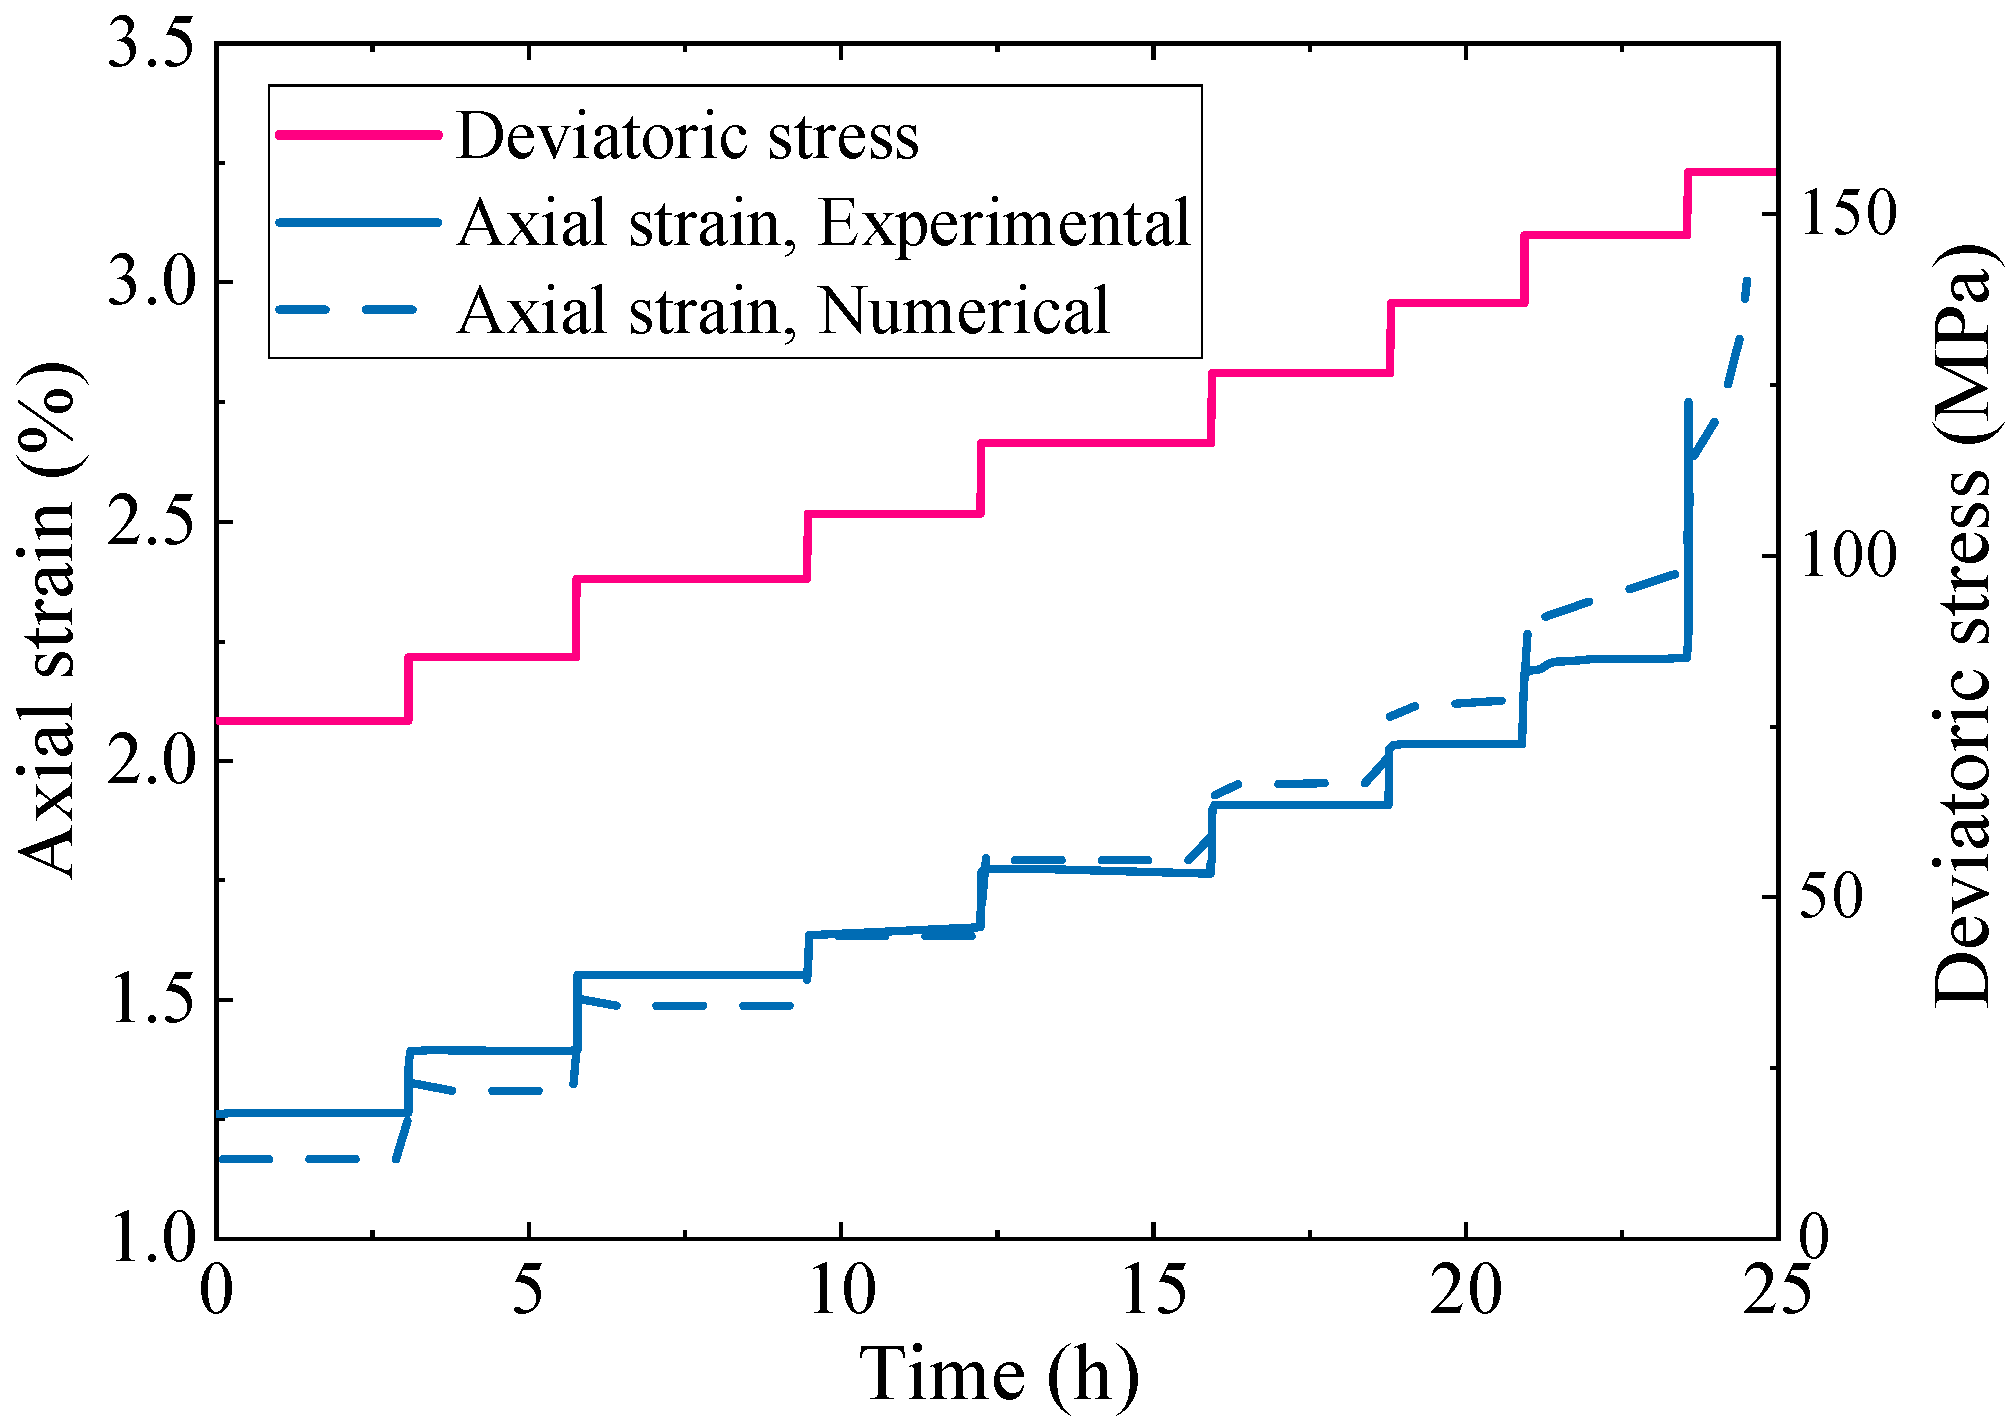
3.3.1. Model Parameter Calibration of Basalt Based on Laboratory Mechanical Tests

To acquire fundamental mechanical parameters for Baihetan basalt, triaxial compression and uniaxial creep tests were conducted in this study, utilizing aphanitic basalt specimens sourced from the tailrace surge chamber area of the right bank, which were processed through core drilling, sectioning, and polishing procedures. Cylindrical specimens measuring 50 mm in diameter and 100 mm in height were prepared, as shown in Figure 6.
A hierarchical parameter calibration method developed by Lu et al. [27] was employed in this study to determine the BS-VPD model parameters for Baihetan basalt, with the resultant values tabulated in Table 2. The simulation reproduction results of both triaxial compression and uniaxial creep tests under varying confining pressure conditions are presented in Figure 7 and Figure 8, respectively.
It is observed from Figure 7 and Figure 8 that close agreement is achieved between numerical simulations and experimental results, demonstrating that the calibrated model parameters in Table 2 accurately capture the mechanical behaviors of Baihetan basalt, including yield initiation, as well as hardening and softening characteristics, while also effectively characterizing the three-stage creep deformation features comprising decelerating, steady-state, and accelerating phases.

3.3.2. Parameter Determination of Rock Masses and Structural Planes Based on the Displacement Inversion Method

Given the inherent strength degradation of rock masses compared to intact rock blocks due to complex geological environments where macro-discontinuities and microfractures are extensively developed, displacement back analysis [33] was adopted in this study for iterative inversion calculations on the excavation model of the 0–12.7 m powerhouse section until simulated surrounding rock deformations substantially matched field monitoring data, with the finalized mechanical parameters for rock masses and structural plane listed in Table 3 and Table 4.
Similarly, displacement back analysis was employed for iterative inversion calculations on the excavation model of the 0–040 m section in the right-bank powerhouse until simulated surrounding rock deformations substantially matched field monitoring data, with the finalized mechanical parameters for rock masses and structural discontinuities listed in Table 5 and Table 6.

4. Time-Dependent Rock Deformation During the Excavation of Left-Bank Caverns

4.1. In Situ Stress Distribution

The simulated in situ stress distribution prior to excavation at the 0–12.7 m section of the left-bank powerhouse in the Baihetan hydropower station is shown in Figure 9, where positive values indicate compressive stresses. From Figure 9, it is seen that the first and third principal stresses generally increase from top to bottom, with the first principal stress ranging between 15 and 23 MPa and the third principal stress between 6 and 10 MPa. Simultaneously, distinct zoning and banding phenomena of principal stresses are observed near fault zones due to the influence of structural planes.
To further verify the accuracy of the numerical calculations, the in situ stress data obtained from the water pressure fracturing test at the left bank of Baihetan were compared with the numerical results, as shown in Table 7.
It is observed from Table 7 that left-bank in situ stress errors range from 2.8% to 32.2%, primarily due to inherent scatter in field measurements and deviations arising from simplified rock mass homogeneity assumptions.

4.2. Displacement Evolution of the Underground Powerhouse

In order to reflect the deformation trend of the surrounding rock during the excavation process of the left-bank powerhouse, Figure 10 shows the displacement distribution of the surrounding rock for each layer of the 0–12.7 m section of the left-bank powerhouse during the excavation period.
During the crown excavation of the powerhouse, deformations of approximately 15–25 mm occur at both arch spandrels due to in situ stress unloading. During the excavation of layers III–V, significant increases in surrounding rock deformation are induced by each excavation layer of the powerhouse; concurrently influenced by the gently dipping intra stratal shear zone LS3152, asymmetrical deformation distributions are observed between the upstream and downstream sidewalls, with both the deformation extent and maximum deformation values of the upstream sidewall being greater than those of the downstream sidewall. After level V excavation, maximum upstream deformation is approximately 90 mm at 10 m below the rock-anchored beam, while downstream deformation peaks around 60 mm in the upper-middle sidewall. As excavation deepens, interlayer shear zone C2 is progressively exposed and affects deformations. By level VIII, the deformation of the downstream sidewall is basically the same as that of the upstream sidewall. However, after the powerhouse building is completely excavated, affected by the interlayer displacement zone C2, the deformation range and magnitude of the downstream sidewall are greater than those of the upstream sidewall. The deformation value of the downstream sidewall is approximately 110–140 mm, while that of the upstream sidewall is approximately 90–120 mm. The maximum deformation value around the powerhouse building is located near the interlayer displacement zone C2, which is 152 mm.

4.3. Mechanism of the Time-Dependent Rock Deformation

Displacement–time curves for the surrounding rock at 1.5 m and 15 m depths within the upstream sidewall of the 0–12.7 m powerhouse section are plotted in Figure 11 and compared with the monitoring data from multipoint extensometer Mzc0–012-4, where close agreement is observed between numerical simulations and field measurements. During excavation levels II to VI, deformation rates are significantly higher in active excavation periods than during non-excavation intervals, indicating that surrounding rock deformations are primarily governed by stress redistribution induced by excavation rather than time-dependent rock mass creep effects, with the latter contributing a relatively minor proportion. Throughout the excavation of levels VI to VIII, deformation convergence is progressively achieved as the excavation face advances away from the monitoring section, resulting in diminishing disturbance effects from excavation unloading on instrumented points.
To further clarify the time-dependent deformation mechanisms of the surrounding rock under excavation unloading in Baihetan’s left-bank caverns, the stress trajectories and damage evolution patterns at varying depths along the rock-anchored beam in the upstream sidewall are shown in Figure 12. It can be observed that, at the 1.5 m depth, the secondary stress state briefly exceeds the yield surface during layer II excavation, and the maximum value is 10.88 MPa (Figure 12a), causing minor damage accumulation (Figure 12b). With progressive downward excavation, stress paths migrate toward the lower-left quadrant of the stress space and eventually re-enter the yield surface (Figure 12a). Therefore, the surrounding rock will no longer undergo non-elastic deformation, and the damage will no longer increase either (Figure 12b). This demonstrates that inelastic deformation at 1.5 m depth is generated exclusively during layer II excavation, while subsequent deformations are solely induced by stress redistribution from unloading. For the 15 m depth zone, stress trajectories are all within the yield surface (Figure 12a); thus, the rock mass itself never undergoes non-elastic deformation (as damage is 0 in Figure 12b). Consequently, time-dependent deformations on the left bank of Baihetan are primarily governed by excavation-induced stress redistribution, and the self-deformation of the surrounding rock is relatively weak.

5. Time-Dependent Rock Deformation During the Excavation of Right-Bank Caverns

5.1. In Situ Stress Distribution

The in situ stress distribution at the 0–040 m section of the powerhouse cavern prior to excavation on the right bank of the Baihetan hydropower station is shown in Figure 13, where it can be observed that both the first and third principal stresses generally increase progressively from the top downward, with values ranging between 22–30 MPa and 7–11.5 MPa, respectively, and these values are consistently higher than the in situ stresses measured on the left bank. Simultaneously, influenced by structural planes, the principal stresses are found to exhibit zoning and banding phenomena near major faults.
To further verify the accuracy of the numerical calculations, the in situ stress data obtained from the water pressure fracturing test at the right bank of Baihetan were compared with the numerical results, as shown in Table 8.
As shown in Table 8, the in situ stress state of the rock mass in the right-bank powerhouse of the Baihetan hydropower station exhibits deviations of 13–37.7% from field measurements, excluding the DK4 borehole.

5.2. Displacement Evolution of the Underground Powerhouse

To reflect the deformation trends of the surrounding rock during the excavation of the right-bank powerhouse cavern, the displacement distributions at different excavation stages of the right-bank powerhouse at the 0–040 m section are presented in Figure 14, where it can be observed that significant deformation, approximately 25–35 mm, occurs at both arch shoulders during crown excavation due to stress unloading, a value marginally higher than the displacement of the left powerhouse (15–25 mm, Figure 10a) induced by left-bank crown excavation.
During the excavation of layers III to VII, high sidewalls are progressively formed, and the zones of larger deformation gradually extend downward from the vicinity of the rock-anchored beam to the middle lower parts of the sidewalls, such that by the completion of layer VII excavation, the middle-upper section of the upstream sidewall exhibits greater deformation (approximately 100–120 mm) compared to the downstream sidewall (approximately 70–90 mm), as shown in Figure 14d. Notably, during layer VII excavation, the deformation of the surrounding rock between the crown and interlayer dislocation zone C4 undergoes an abrupt increase from 45 mm at the end of layer V excavation to 120 mm upon completion of layer VII excavation. According to the stress analysis shown in Figure 15a, stress trajectories intersect with the tensile yield surface; therefore, the sudden deformation jump is primarily induced by tensile cracking failure. Continued displacement growth is observed during subsequent downward excavation until gradual stabilization is achieved following the implementation of targeted supplementary reinforcement measures in the crown area.
It should be noted that the reinforcement and support measures adopted in the actual project included adding 252 sets of 2500 kN unbonded prestressed anchor cables to the top arch, attaching steel mesh and steel arch ribs, spraying nano-polypropylene coarse fiber concrete, and conducting low-pressure grouting of the superficial rock strata. To simplify the numerical model complexity, the reinforcement effect was equivalently simulated during computation by enhancing the mechanical parameters of the rock mass within the top reinforcement zone, with iterative trial calculations being performed based on displacement back analysis until the stabilization of the crown displacement was achieved, and the finally adopted mechanical parameters for the reinforced surrounding rock are presented in Table 9.

5.3. Mechanism of the Time-Dependent Rock Deformation

The displacement time history curves of the surrounding rock monitored by multipoint extensometer Myc0–040–1 at the crown opening (i.e., at 0 m depth) and at the 11 m depth within the 0–040 m section of the right-bank powerhouse are plotted in Figure 16. It is observed that during October–November 2017, a sudden deformation increase occurs at the crown opening with an average growth rate of approximately 0.3–0.6 mm/d, and displacement accumulates by approximately 50 mm within three to four months, accompanied by field occurrences of shotcrete cracking, spalling, rockfall, etc. Following the implementation of targeted reinforcement measures, including newly installed bonded prestressed anchor cables in the crown surrounding rock, deformation is progressively stabilized after February 2018.
Similarly, the displacement–time curves of the surrounding rock at the top arch orifice and depth of 11.0 m are plotted in Figure 16. It can be seen that the simulation results have a similar deformation trend and displacement value to the measured data and can well capture the sudden deformation phenomenon of the surrounding rock at the orifice. As such, by equivalently enhancing the mechanical parameters of the surrounding rock in the reinforcement area to strengthen and support the parts with faster deformation growth of the top arch surrounding rock, the simulation results can accurately reflect the trend of the displacement monitoring curve gradually converging in the later stage.
To further elucidate the time-dependent deformation mechanism of the surrounding rock under excavation unloading at the Baihetan right-bank underground caverns, the stress paths and damage evolution trends at varying depths within the crown of the right-bank powerhouse at the 0–040 m section are presented in Figure 15, where it is observed that the stress path of the rock mass at the orifice crosses the yield surface during the initial excavation phase, and the maximum value is 16.88 MPa (Figure 15a), indicating that inelastic deformation is initiated. In fact, due to the higher magnitude of in situ stress on the right bank compared to the left bank, the stress adjustment induced by excavation unloading is more pronounced, manifested as stress paths lying farther away from the yield surface. On one hand, stress changes directly cause surrounding rock deformation; on the other hand, the surrounding rock also exhibits more obvious viscous creep deformation under higher stress conditions. The superposition of these two effects ultimately manifests as a sharp increase in rock displacement over time. Consequently, this leads to a higher creep rate and more significant damage growth in the right-bank surrounding rock (Figure 15c). With continued excavation, the stress path returns inside the yield surface by stress adjustments caused by unloading (Figure 15a), at which point inelastic deformation ceases, and damage development is arrested (Figure 15c). Notably, during subsequent downward excavation, the stress path crosses the yield surface again and ultimately reaches the bounding surface (Figure 15a), resulting in the creep rate reaching its maximum and the damage growth rate increasing rapidly until accelerated creep failure occurs (Figure 15c), thereby inducing abrupt deformation (Figure 16). Following the implementation of supplementary reinforcement in the crown (parameters provided in Table 9), the positions of both the yield surface and bounding surface in stress space are significantly elevated due to the enhanced mechanical strength of the rock mass, causing the stress path at the crown orifice to lie within the yield surface once more (Figure 15b), consequently preventing further inelastic deformation, arresting damage development (Figure 15c), and leading to gradual stabilization of subsequent displacements. The rate of damage growth at the orifice decreases from 0.295 per month during the acceleration stage of damage before reinforcement to 0.0015 per month after reinforcement. For the surrounding rock at the 11 m depth, although its stress path lies outside the yield surface prior to reinforcement (Figure 15b, its proximity to the yield surface results in a lower creep rate, slower damage progression, and weaker time-dependent deformation. Meanwhile, due to being farther from the cavern boundary, the stress adjustment induced by excavation is weaker, maintaining displacement at a consistently low level (Figure 16). After reinforcement, the stress path of the rock mass at 15 m depth is entirely contained within the yield surface (Figure 15b), thus preventing further inelastic deformation, halting damage development, and ultimately ensuring rock mass stability. Therefore, in practical engineering design, using the damage factor as the basis to implement targeted reinforcement in high-disturbance zones such as tectonic discontinuities and crown arches will prevent abrupt deformations caused by the continuous accumulation of damage in the surrounding rock.

6. Conclusions

Layered excavation numerical models for typical monitored sections of the main and auxiliary powerhouses on both banks of the Baihetan hydropower station were established in this study based on the bounding surface viscoplastic damage (BS-VPD) model, with mechanical parameters for the rock mass and structural planes being rationally determined through displacement back analysis. The time-dependent deformation response of the surrounding rock throughout the entire cavern excavation process was subsequently successfully simulated, and the evolutionary characteristics of surrounding rock creep under excavation unloading conditions were ultimately elucidated by integrating considerations of the in situ stress distribution and secondary stress adjustments. The findings can provide theoretical guidance and technical support for optimizing the construction excavation design of deeply buried underground chambers and ensuring the long-term safety and stability of the surrounding rock. The main research conclusions are as follows:
(1)
Due to the higher magnitude of in situ stress in the right-bank underground powerhouse area compared to the left bank, the secondary stress adjustments induced by excavation were more pronounced on the right bank, resulting in the maximum stress trajectories at the right-bank powerhouse under higher stress conditions exceeding those at the left-bank powerhouse by 6 MPa due to large-scale excavation unloading. This significantly amplified the time-dependent deformation of the surrounding rock.
(2)
In localized regions of the right-bank underground powerhouse, the stress state of the surrounding rock crossed the yield surface and reached the bounding surface during excavation, leading to accelerated damage development and ultimately accelerated creep failure, indicating that large-scale excavation unloading under high stress conditions significantly exacerbated the time-dependent deformation of the surrounding rock.
(3)
Targeted supplementary reinforcement measures applied to regions strongly disturbed by excavation unloading can constrain the stress state of the surrounding rock within the elastic domain. The damage development rate at the hole opening was reduced from 0.295 to 0.0015, thereby effectively preventing abrupt deformation resulting from the continuous accumulation of damage.
The authors believe that the above findings contribute to a better understanding of the deformation and failure patterns of the surrounding rock during the staged excavation process of the Baihetan large-scale underground hydropower station, thereby providing theoretical insights for ensuring the long-term safety and stability design of the surrounding rock. Nevertheless, the conclusions derived from numerical simulations in this study are based on the assumption of homogeneous rock masses, without accounting for potential localized stress concentrations or abrupt variations caused by surrounding rock heterogeneity. Our future research will be dedicated to conducting extensive geological surveys and constructing an excavation model that takes into account the non-homogeneity of the rock mass. Moreover, it should be emphasized that the main conclusions of this study are derived from two-dimensional numerical simulations. Future studies will focus on developing three-dimensional models to rationally reflect the complex geological structure and layout of the large-scale underground caverns.

Author Contributions

W.Z.: writing—original draft preparation, investigation, formal analysis. J.T.: writing—review and editing, resources, funding acquisition, conceptualization. J.W.: validation, investigation. All authors have read and agreed to the published version of the manuscript.

Funding

This research was jointly supported by the Natural Science Special (Special Post) Scientific Research Fund Project of Guizhou University (Grant No. Guizhou University Special Post (2023) 67) and Guizhou Provincial Science and Technology Projects QKHJC [2024]youth139.

Data Availability Statement

The original contributions presented in this study are included in the article. Further inquiries can be directed to the corresponding author.

Conflicts of Interest

The authors declare no conflicts of interest.

Nomenclature

The following abbreviations and symbols are used in this manuscript:
Abbreviations
BS-VPDBounding surface viscoplastic damagefYield surface of brittle rocks
GBEGrain-based modelgvpViscoplastic potential function
NMMNumerical manifold methodAvpFlow parameter
Symbolsb0Similarity ratio between the yield surface and the bounding surface
pHydrostatic stress σ i j Stress
qDeviatoric stressEEquivalent elastic modulus
p ¯ Projection of p on the boundary surfaceφInternal friction angle
q ¯ Projection of q on the boundary surfacecCohesion of the reinforced rock mass
FBounding surfacePyOverburden pressure
bSimilarity ratio between the bounding surface and the implicit loading surface where the current stress point is locatedPxHorizontally distributed pressure
p0,q0Intersection point of the mapping trajectory of p and q on the boundary surface and the rock yield surfacehrBuried depth
χ v p Viscoplastic internal variableEbElastic modulus of rockbolt
dDamage variablerbRockbolt radius
slAxial pitch of the rockbolt
srCircumferential pitch of the rockbolt
αAnchor density factor
ηbFriction coefficient between the rock and the rockbolt

References

  1. Liu, G.F.; Liu, Z.Q.; Xu, D.P.; Jiang, Q. Prediction method of rock spalling risk in large underground cavern excavation based on Bayesian network: A case study from the Baihetan hydropower station, China. Tunn. Undergr. Space Technol. 2025, 158, 106381. [Google Scholar] [CrossRef]
  2. Liu, G.F.; Zhou, C.; Feng, K.; Jiang, Q.; Li, S.; Bao, H.; Li, A. Probabilistic evaluation method for the stability of large underground cavern considering the uncertainty of rock mass mechanical parameters: A case study of Baihetan underground powerhouse project. Eng. Geol. 2024, 340, 107660. [Google Scholar] [CrossRef]
  3. Tao, J.; Yang, X.G.; Li, H.T.; Zhou, J.-W.; Fan, G.; Lu, G.-D. Effects of In-Situ stresses on dynamic rock responses under blast loading. Mech. Mater. 2020, 145, 103374. [Google Scholar] [CrossRef]
  4. Xiao, P.W.; Yang, X.G.; Li, B.; Zhou, X.; Sun, Y.; Ding, X.; Xu, N. Roof arch collapse of underground cavern in fractured rock mass: In-Situ monitoring and numerical modeling. J. Rock Mech. Geotech. Eng. 2025, 17, 2778–2792. [Google Scholar] [CrossRef]
  5. Zhang, C.S. The Baihetan Hydropower Station Project in Jinsha River. Engineering 2024, 43, 28–36. [Google Scholar] [CrossRef]
  6. Xia, Y.J.; Zhang, C.Q.; Zhou, H.; Chen, J.; Gao, Y.; Liu, N.; Chen, P. Structural characteristics of columnar jointed basalt in drainage tunnel of Baihetan hydropower station and its influence on the behavior of P-wave anisotropy. Eng. Geol. 2020, 264, 105304. [Google Scholar] [CrossRef]
  7. Fan, Q.X.; Feng, X.T.; Weng, W.L.; Fan, Y.; Jiang, Q. Unloading performances and stabilizing practices for columnar jointed basalt: A case study of Baihetan hydropower station. J. Rock Mech. Geotech. Eng. 2017, 9, 1041–1053. [Google Scholar] [CrossRef]
  8. Fan, Q.X.; Wang, Z.L.; Xu, J.R.; Zhou, M.; Jiang, Q.; Li, G. Study on Deformation and Control Measures of Columnar Jointed Basalt for Baihetan Super High Arch Dam Foundation. Rock Mech. Rock Eng. 2018, 51, 2569–2595. [Google Scholar] [CrossRef]
  9. Shi, A.C.; Wei, Y.F.; Wu, J.Y.; Ren, D.; Tang, M. Study on the shear deformation of intralayer shear bands at the Baihetan hydropower station dam foundation. Bull. Eng. Geol. Environ. 2020, 79, 3517–3532. [Google Scholar] [CrossRef]
  10. Zhao, J.S.; Feng, X.T.; Jiang, Q.; Zhou, Y.-Y. Microseismicity monitoring and failure mechanism analysis of rock masses with weak interlayer zone in underground intersecting chambers: A case study from the Baihetan Hydropower Station, China. Eng. Geol. 2018, 245, 44–60. [Google Scholar] [CrossRef]
  11. Xiao, Y.X.; Feng, X.T.; Chen, B.R.; Feng, G.-L.; Yao, Z.-B.; Hu, L.-X. Excavation-induced microseismicity in the columnar jointed basalt of an underground hydropower station. Int. J. Rock Mech. Min. Sci. 2017, 97, 99–109. [Google Scholar] [CrossRef]
  12. Feng, X.T.; Hao, X.J.; Jiang, Q.; Li, S.-J.; Hudson, J.A. Rock Cracking Indices for Improved Tunnel Support Design: A Case Study for Columnar Jointed Rock Masses. Rock Mech. Rock Eng. 2016, 49, 2115–2130. [Google Scholar] [CrossRef]
  13. Hao, X.J.; Feng, X.T.; Yang, C.X.; Jiang, Q.; Li, S.-J. Analysis of EDZ Development of Columnar Jointed Rock Mass in the Baihetan Diversion Tunnel. Rock Mech. Rock Eng. 2016, 49, 1289–1312. [Google Scholar] [CrossRef]
  14. Jiang, Q.; Feng, X.T.; Hatzor, Y.H.; Hao, X.-J.; Li, S.-J. Mechanical anisotropy of columnar jointed basalts: An example from the Baihetan hydropower station, China. Eng. Geol. 2014, 175, 35–45. [Google Scholar] [CrossRef]
  15. Li, L.; Jiang, Q.; Huang, Q.F.; Xiang, T.; Liu, J. Advances in stability analysis and optimization design of large underground caverns under high geostress condition. Deep Resour. Eng. 2024, 1, 100113. [Google Scholar] [CrossRef]
  16. Zhao, J.S.; Chen, B.R.; Jiang, Q.; Xu, D.-P.; He, B.-G.; Duan, S.-Q. In-Situ comprehensive investigation of deformation mechanism of the rock mass with weak interlayer zone in the Baihetan hydropower station. Tunn. Undergr. Space Technol. 2024, 148, 105690. [Google Scholar] [CrossRef]
  17. Shi, A.C.; Li, C.J.; Hong, W.B.; Lu, G.; Zhou, J.; Li, H. Comparative analysis of deformation and failure mechanisms of underground powerhouses on the left and right banks of Baihetan hydropower station. J. Rock Mech. Geotech. Eng. 2022, 14, 731–745. [Google Scholar] [CrossRef]
  18. Wang, M.; Li, H.B.; Han, J.Q.; Xiao, X.-H.; Zhou, J.-W. Large deformation evolution and failure mechanism analysis of the multi-freeface surrounding rock mass in the Baihetan underground powerhouse. Eng. Fail. Anal. 2019, 100, 214–226. [Google Scholar] [CrossRef]
  19. Dai, F.; Li, B.; Xu, N.W.; Fan, Y.; Zhang, C. Deformation forecasting and stability analysis of large-scale underground powerhouse caverns from microseismic monitoring. Int. J. Rock Mech. Min. Sci. 2016, 86, 269–281. [Google Scholar] [CrossRef]
  20. Zhang, W.; Zhao, Q.H.; Huang, R.Q.; Chen, J.; Xue, Y.; Xu, P. Identification of structural domains considering the size effect of rock mass discontinuities: A case study of an underground excavation in Baihetan Dam, China. Tunn. Undergr. Space Technol. 2016, 51, 75–83. [Google Scholar] [CrossRef]
  21. Xiao, Y.X.; Feng, X.T.; Feng, G.L.; Liu, H.-J.; Jiang, Q.; Qiu, S.-L. Mechanism of evolution of stress–structure controlled collapse of surrounding rock in caverns: A case study from the Baihetan hydropower station in China. Tunn. Undergr. Space Technol. 2016, 51, 56–67. [Google Scholar] [CrossRef]
  22. Li, X.; Konietzky, H.; Li, X.B. Numerical study on time dependent and time independent fracturing processes for brittle rocks. Eng. Fract. Mech. 2016, 163, 89–107. [Google Scholar] [CrossRef]
  23. Fu, T.F.; Xu, T.; Heap, M.J.; Meredith, P.G.; Mitchell, T.M. Mesoscopic time-dependent behavior of rocks based on three-dimensional discrete element grain-based model. Comput. Geotech. 2020, 121, 103472. [Google Scholar] [CrossRef]
  24. Yu, X.Y.; Xu, T.; Heap, M.J.; Baud, P.; Reuschlé, T.; Heng, Z.; Zhu, W.-C.; Wang, X.-W. Time-dependent deformation and failure of granite based on the virtual crack incorporated numerical manifold method. Comput. Geotech. 2021, 133, 104070. [Google Scholar] [CrossRef]
  25. Lu, G.D.; Zhou, J.W.; Liu, J.F.; Liu, L.; Yang, X.-G.; Tao, J. A bounding surface viscoplastic damage model for time-dependent rock deformation. Mech. Mater. 2023, 180, 104609. [Google Scholar] [CrossRef]
  26. Espada, M.; Muralha, J.; Lemos, J.V.; Jiang, Q.; Feng, X.-T.; Fan, Q.; Fan, Y. Safety Analysis of the Left Bank Excavation Slopes of Baihetan Arch Dam Foundation Using a Discrete Element Model. Rock Mech. Rock Eng. 2018, 51, 2597–2615. [Google Scholar] [CrossRef]
  27. Feng, X.T.; Yang, C.X.; Kong, R.; Zhao, J.; Zhou, Y.; Yao, Z.; Hu, L. Excavation-induced deep hard rock fracturing: Methodology and applications. J. Rock Mech. Geotech. Eng. 2022, 14, 1–34. [Google Scholar] [CrossRef]
  28. Indraratna, B.; Kaiser, P.K. Analytical model for the design of grouted rock bolts. Int. J. Numer. Anal. Methods Geomech. 1990, 14, 227–251. [Google Scholar] [CrossRef]
  29. Zhu, F.S.; Zheng, Y.T. Support action analysis tensioned and grouted bolts. Chin. J. Rock Mech. Eng. 1996, 15, 333–337. (In Chinese) [Google Scholar] [CrossRef]
  30. Zhang, C.S.; Zhu, Y.S.; Chu, W.J.; Liu, N. Mechanical behaviors of basalt at Baihetan hydropower station and simulation with Hoek-Brown constitutive model. Chin. J. Rock Mech. Eng. 2019, 38, 1964–1978. (In Chinese) [Google Scholar] [CrossRef]
  31. Liu, K.W.; Hao, H.; Li, X.B. Numerical analysis of the stability of abandoned cavities in bench blasting. Int. J. Rock Mech. Min. Sci. 2017, 92, 30–39. [Google Scholar] [CrossRef]
  32. Tao, J.; Yang, X.G.; Li, H.T.; Zhou, J.-W.; Qi, S.-C.; Lu, G.-D. Numerical investigation of blast-induced rock fragmentation. Comput. Geotech. 2020, 128, 103846. [Google Scholar] [CrossRef]
  33. Liu, Y.R.; Zhang, R.J.; Hou, S.K.; Zhu, L.; Pang, Z.; Zhuang, W. Investigation of energy evolution process of rock mass during deep tunnel excavation based on elasto-viscoplastic damage model and time-dependent energy indices. Acta Geotech. 2025, 20, 1549–1570. [Google Scholar] [CrossRef]
Figure 1. The flowchart of the key modeling stage.
Processes 13 02244 g001
Figure 2. Layout diagram of the main structures of the Baihetan hydropower station.
Processes 13 02244 g002
Figure 3. Schematic illustration of the bounding surface, yield surface, and radial mapping procedure in the principal stress space (extracted from Lu et al. [25]). The symbols F, f, p, q, p ¯ , q ¯ , p0, q0, σσ1, σσ2, σσ3, χ v p , and d represent the bounding surface, the yield surface of brittle rocks, the hydrostatic stress, the deviatoric stress, the projection point of “p” on the bounding surface, the projection point of q on the bounding surface, the intersection point of the mapping trajectory of p towards the bounding surface and the rock yield surface, the intersection point of the mapping trajectory of q towards the bounding surface and the rock yield surface, the major principal stress, the intermediate principal stress, the minor principal stress, the viscoplastic internal variable, and the damage variable, respectively.
Processes 13 02244 g003
Figure 4. Numerical model configuration for the 0–12.7 m cross-section of the left-bank powerhouse.
Processes 13 02244 g004
Figure 5. Numerical model configuration for the 0–040 m cross-section of the left-bank powerhouse.
Processes 13 02244 g005
Figure 6. Basalt rock sample sourced from the Baihetan hydropower station.
Processes 13 02244 g006
Figure 7. Triaxial compression test simulation model of basalt at Baihetan.
Processes 13 02244 g007
Figure 8. Simulation results of the uniaxial creep test of basalt at Baihetan.
Processes 13 02244 g008
Figure 9. In situ stress field distribution of the left-bank powerhouse at the 0–12.7 m section.
Processes 13 02244 g009
Figure 10. Displacement distribution of the 0–12.7 m section of the left-bank underground powerhouse during sequential excavation.
Processes 13 02244 g010
Figure 11. Comparison of the displacement curves of the surrounding rock at different depths of the upper sidewall rock beam of the left-bank powerhouse at the 0–12.7 m section with the actual measured results.
Processes 13 02244 g011
Figure 12. Stress trajectories and damage evolution of the surrounding rock at different depths of the upper retaining wall of the left-bank powerhouse at the 0–12.7 m section.
Processes 13 02244 g012
Figure 13. In situ stress field distribution of the right-bank powerhouse at the 0–040 m section.
Processes 13 02244 g013
Figure 14. Displacement distribution of the 0–040 m section of the right-bank underground powerhouse during sequential excavation.
Processes 13 02244 g014
Figure 15. Stress trajectories and damage evolution of the surrounding rock at different depths of the top arch downstream of the right-bank powerhouse at the 0–040 m section.
Processes 13 02244 g015
Figure 16. Comparison of the displacement curves of the surrounding rock at different depths of the top arch downstream of the right-bank powerhouse at the 0-040 m section with the actual measurement results.
Processes 13 02244 g016
Table 1. Rockbolt parameter configuration for the left-bank underground cavern group.
Elastic Modulus
Eb (GPa)
Rockbolt Radius
rb (mm)
Axial Pitch
sl (m)
Circumferential Pitch
sr (m)
Frictional Coefficient
ηb
210161.21.20.32
Table 2. The BS-VPD model parameters of basalt at Baihetan.
E ˜ (GPa) v ˜ km α ¯ i α ¯ r α c d α c i
450.25800.920.750.450.660.50
βςsκ (MPa)ω1ω2Avp (1/s)nvp
0.400.051.0801.0−0.085 × 10−48
Table 3. Mechanical parameters of the rock mass in the left-bank underground cavern group.
Petrographic ClassificationE′ (GPa)k′m′ α ¯ i α ¯ r α c d α c i
III1 category10250.940.500.150.300.22
Table 4. Mechanical parameters of the structural plane in the left-bank underground cavern group.
Serial NumberTypeDeformation Modulus (GPa)Thickness (cm)Normal
Stiffness (GPa/m)
Shear Stiffness (GPa/m)Shear Strength
fc (MPa)
C2Interlayer shear zone0.12200.200.240.250.04
LS3152Intralayer shear zone0.303.58.573.420.500.10
LS3254Intralayer shear zone0.25151.670.670.460.15
F720Fault0.30251.200.480.500.10
Table 5. Mechanical parameters of the rock mass in the right-bank underground cavern group.
Petrographic ClassificationE′ (GPa)k′m′ α ¯ i α ¯ r α c d α c i
III1 category10200.920.450.150.250.20
Table 6. Mechanical parameters of the structural plane in the right-bank underground cavern group.
Serial NumberConstruction TypeDeformation Modulus (GPa)Thickness (cm)Normal Stiffness (GPa/m)Shear Stiffness (GPa/m)Shear Strength
fc (MPa)
C3Interlayer shear zone0.18400.450.720.280.04
C4Interlayer shear zone0.13400.330.350.250.03
C5Interlayer shear zone0.12300.400.480.250.03
Table 7. Comparison of numerical and measured in situ stress at different buried depths.
Drilling NumberBuried Depth (m)Data SourceMaximum Principal Stress (MPa)Error
(%)
Minimum Principal Stress (MPa)Error
(%)
DK1506Measurement16.54.25.932.2
Simulation15.87.8
DK2512Measurement13.122.16.717.9
Simulation16.07.9
σCZK3455Measurement13.018.57.02.8
Simulation15.47.2
Note: The cause of outliers lies primarily in the homogenization simplification of heterogeneous rock masses and will be further addressed in future studies.
Table 8. Comparison of numerical and measured in situ stress at different buried depths.
Drilling NumberBuried Depth (m)Data SourceMaximum Principal Stress (MPa)Error
(%)
Minimum Principal Stress (MPa)Error
(%)
DK4506Measurement21.130.85.294.2
Simulation27.610.1
DK5512Measurement21.329.111.513
Simulation27.510.0
DK6455Measurement22.917.56.937.7
Simulation26.99.5
Note: The cause of outliers lies primarily in the homogenization simplification of heterogeneous rock masses and will be further addressed in future studies.
Table 9. Reinforcement parameters of the surrounding rock in the top arch reinforcement zone of the 0-040 m section of the right-bank powerhouse.
Petrographic ClassificationE′ (GPa)k′m′ α ¯ i α ¯ r α c d α c i
III1 category10200.920.680.230.400.35
Disclaimer/Publisher’s Note: The statements, opinions and data contained in all publications are solely those of the individual author(s) and contributor(s) and not of MDPI and/or the editor(s). MDPI and/or the editor(s) disclaim responsibility for any injury to people or property resulting from any ideas, methods, instructions or products referred to in the content.

