Article

Steel-Based Gravity Energy Storage: A Two-Stage Planning Approach for Industrial Parks with Renewable Energy Integration

School of Electrical Engineering and Automation, Harbin Institute of Technology, Harbin 150001, China
*
Author to whom correspondence should be addressed.
Processes 2025, 13(6), 1922; https://doi.org/10.3390/pr13061922
Submission received: 19 May 2025 / Revised: 9 June 2025 / Accepted: 12 June 2025 / Published: 17 June 2025
(This article belongs to the Special Issue Modeling, Operation and Control in Renewable Energy Systems)

Abstract

:
Although the integration of large-scale energy storage with renewable energy can significantly reduce electricity costs for steel enterprises, existing energy storage technologies face challenges such as deployment constraints and high costs, limiting their widespread adoption. This study proposes a gravity energy storage system and its capacity configuration scheme, which utilizes idle steel blocks from industry overcapacity as the energy storage medium to enhance renewable energy integration and lower corporate electricity costs. First, a stackable steel-based gravity energy storage (SGES) structure utilizing idle blocks is designed to reduce investment costs. Second, a gravity energy storage capacity planning model is developed, incorporating economic and structural collaborative optimization to maximize profitability and minimize construction costs. Finally, a Rime and particle swarm optimization (RI-PSO) fusion algorithm is proposed to efficiently solve the optimization problem. The results demonstrate that under equivalent power and capacity conditions, the SGES structure achieves 90.11% lower costs than compressed air energy storage and 59.7% lower costs than electrochemical storage. The proposed algorithm improves convergence accuracy by 21.19% compared to Rime and 4.21% compared to PSO and increases convergence speed by 72.34% compared to Rime. This study provides an effective solution for steel enterprises to reduce costs.

1. Introduction

The integration of large-capacity energy storage systems with renewable energy sources can significantly reduce electricity costs for steel enterprises [1,2,3,4]. However, existing energy storage technologies face challenges such as deployment environmental constraints and high costs, which limit their widespread application.
Within this context, innovative applications of energy storage technologies provide viable solutions to address these challenges. By absorbing surplus renewable energy, large-capacity energy storage technologies can help reduce electricity costs for high-energy-consuming industries [5,6,7,8,9]. However, practical applications reveal technical limitations. Electrochemical storage carries thermal runaway risks in high-temperature environments and has prohibitive deployment costs for large-scale systems [10,11,12]. Compressed air storage and pumped hydroelectric storage impose rigorous demands on external structures and geological conditions [13,14,15].
Gravity energy storage is a physical energy storage technology based on mutual conversion between electrical energy and potential energy, with its core advantages manifested in the following three aspects: long life, large capacity, and ecological compatibility. Utilizing counterweights as an energy storage medium, this technology achieves bidirectional conversion between electrical energy and gravitational potential energy by controlling the vertical displacement of counterweights [16,17,18,19,20]. This operational mechanism eliminates reliance on the specific geographic conditions that are typically required by traditional energy storage, making this technology broadly applicable for large-scale deployment. With its large capacity, gravity energy storage can meet medium-to-long-term power regulation demands, making it particularly suitable for providing stable and reliable electricity supply to energy-intensive industries such as steel manufacturing. However, the cost of existing gravity energy storage solutions remains relatively high, which restricts their widespread application.
Therefore, to achieve an optimal economic performance for gravity energy storage, it is necessary to optimize the configuration of storage capacity based on the volatility of renewable energy in industrial parks, thereby striking a balance between investment costs and energy storage benefits [21,22,23,24,25,26,27].
Recent academic advancements have addressed this challenge through the following research. Firstly, hybrid intelligent algorithms have proven effective in developing capacity configuration models, as they can balance the efficiency of renewable energy integration with economic returns [28,29]. Secondly, the combination of swarm intelligence optimization methods and deep reinforcement learning has been proven effective. It has resolved multi-objective optimization problems. These problems consider both economic feasibility and power supply reliability simultaneously [30,31,32,33]. Thirdly, researchers are employing levelized cost of energy metrics to conduct comprehensive economic evaluations. They systematically analyze cost structures throughout the service life, with a focus on quantifying the impacts of policy incentives and market mechanisms on storage system configuration decisions [28,34,35,36,37]. In addition, through modular structural designs, gravity storage systems enable flexible capacity adjustment. Energy storage capacity can be modified via increasing counterweight mass and elevating operational heights [38]. The current research focuses on the technical application and economic feasibility of modular utilization for abandoned mines and mountainous areas. Recent advances demonstrate distinct optimization pathways. For example, Hunt [39] proposes a modular energy storage scheme based on cable car transportation systems. It is essentially a track-based energy conversion system. For vertical structures, Hou [40] systematically demonstrates the feasibility of layered transportation mechanisms in an abandoned mine.
Notably, existing research on gravity energy storage predominantly focuses on natural geographical environments, while its potential applicability in industrial settings, particularly within the steel industry, remains underexplored. This field presents two distinctive characteristics. First, massive quantities of steel billets remain idle in stacked configurations during production processes, where traditional solutions like additional warehousing or secondary smelting significantly increase energy consumption [41,42]. Second, structural overcapacity in the industry has exacerbated steel idling issues [43].
Therefore, this study designs a gravity energy storage structure that repurposes idle steel billets as counterweights for the system. Simultaneously, a two-stage capacity planning model is proposed that integrates renewable energy output and investment costs within industrial parks. By comprehensively considering the construction environment and operational requirements of steel industrial zones, the research achieves coordinated optimization between gravity energy storage system parameters and economic structures.
The main contributions are summarized as follows:
First, this study integrates gravity energy storage systems with steel production scenarios through deep coupling, proposing a structural design scheme for steel-based gravity energy storage (SGES) and establishing corresponding mathematical models.
Second, this study proposes a two-stage capacity planning methodology for SGES in energy-intensive steel industrial parks with high-penetration renewable energy integration. The optimized SGES system demonstrates a 34.3% reduction in construction costs. When considering counterweight costs under identical electricity pricing, the SGES maintains a 59.7% cost advantage over electrochemical energy storage. With equivalent investment, the proposed system achieves 62.3% higher revenue through peak–valley price arbitrage compared to electrochemical energy storage.
Finally, this study proposes the RI-PSO algorithm, which integrates the algorithmic mechanisms of particle swarm optimization and Rime. The proposed algorithm improves convergence accuracy by 21.19% compared to Rime and 4.21% compared to PSO and increases convergence speed by 72.34% compared to Rime.
The remainder of the paper is organized as follows. Section 2 introduces the structural composition of the steel industrial park discussed in this paper and the architecture of the proposed SGES. Section 3 presents the two-stage optimization planning model and the RI-PSO algorithm. Section 4 and Section 5 provide the simulation results analysis and conclusions, respectively.

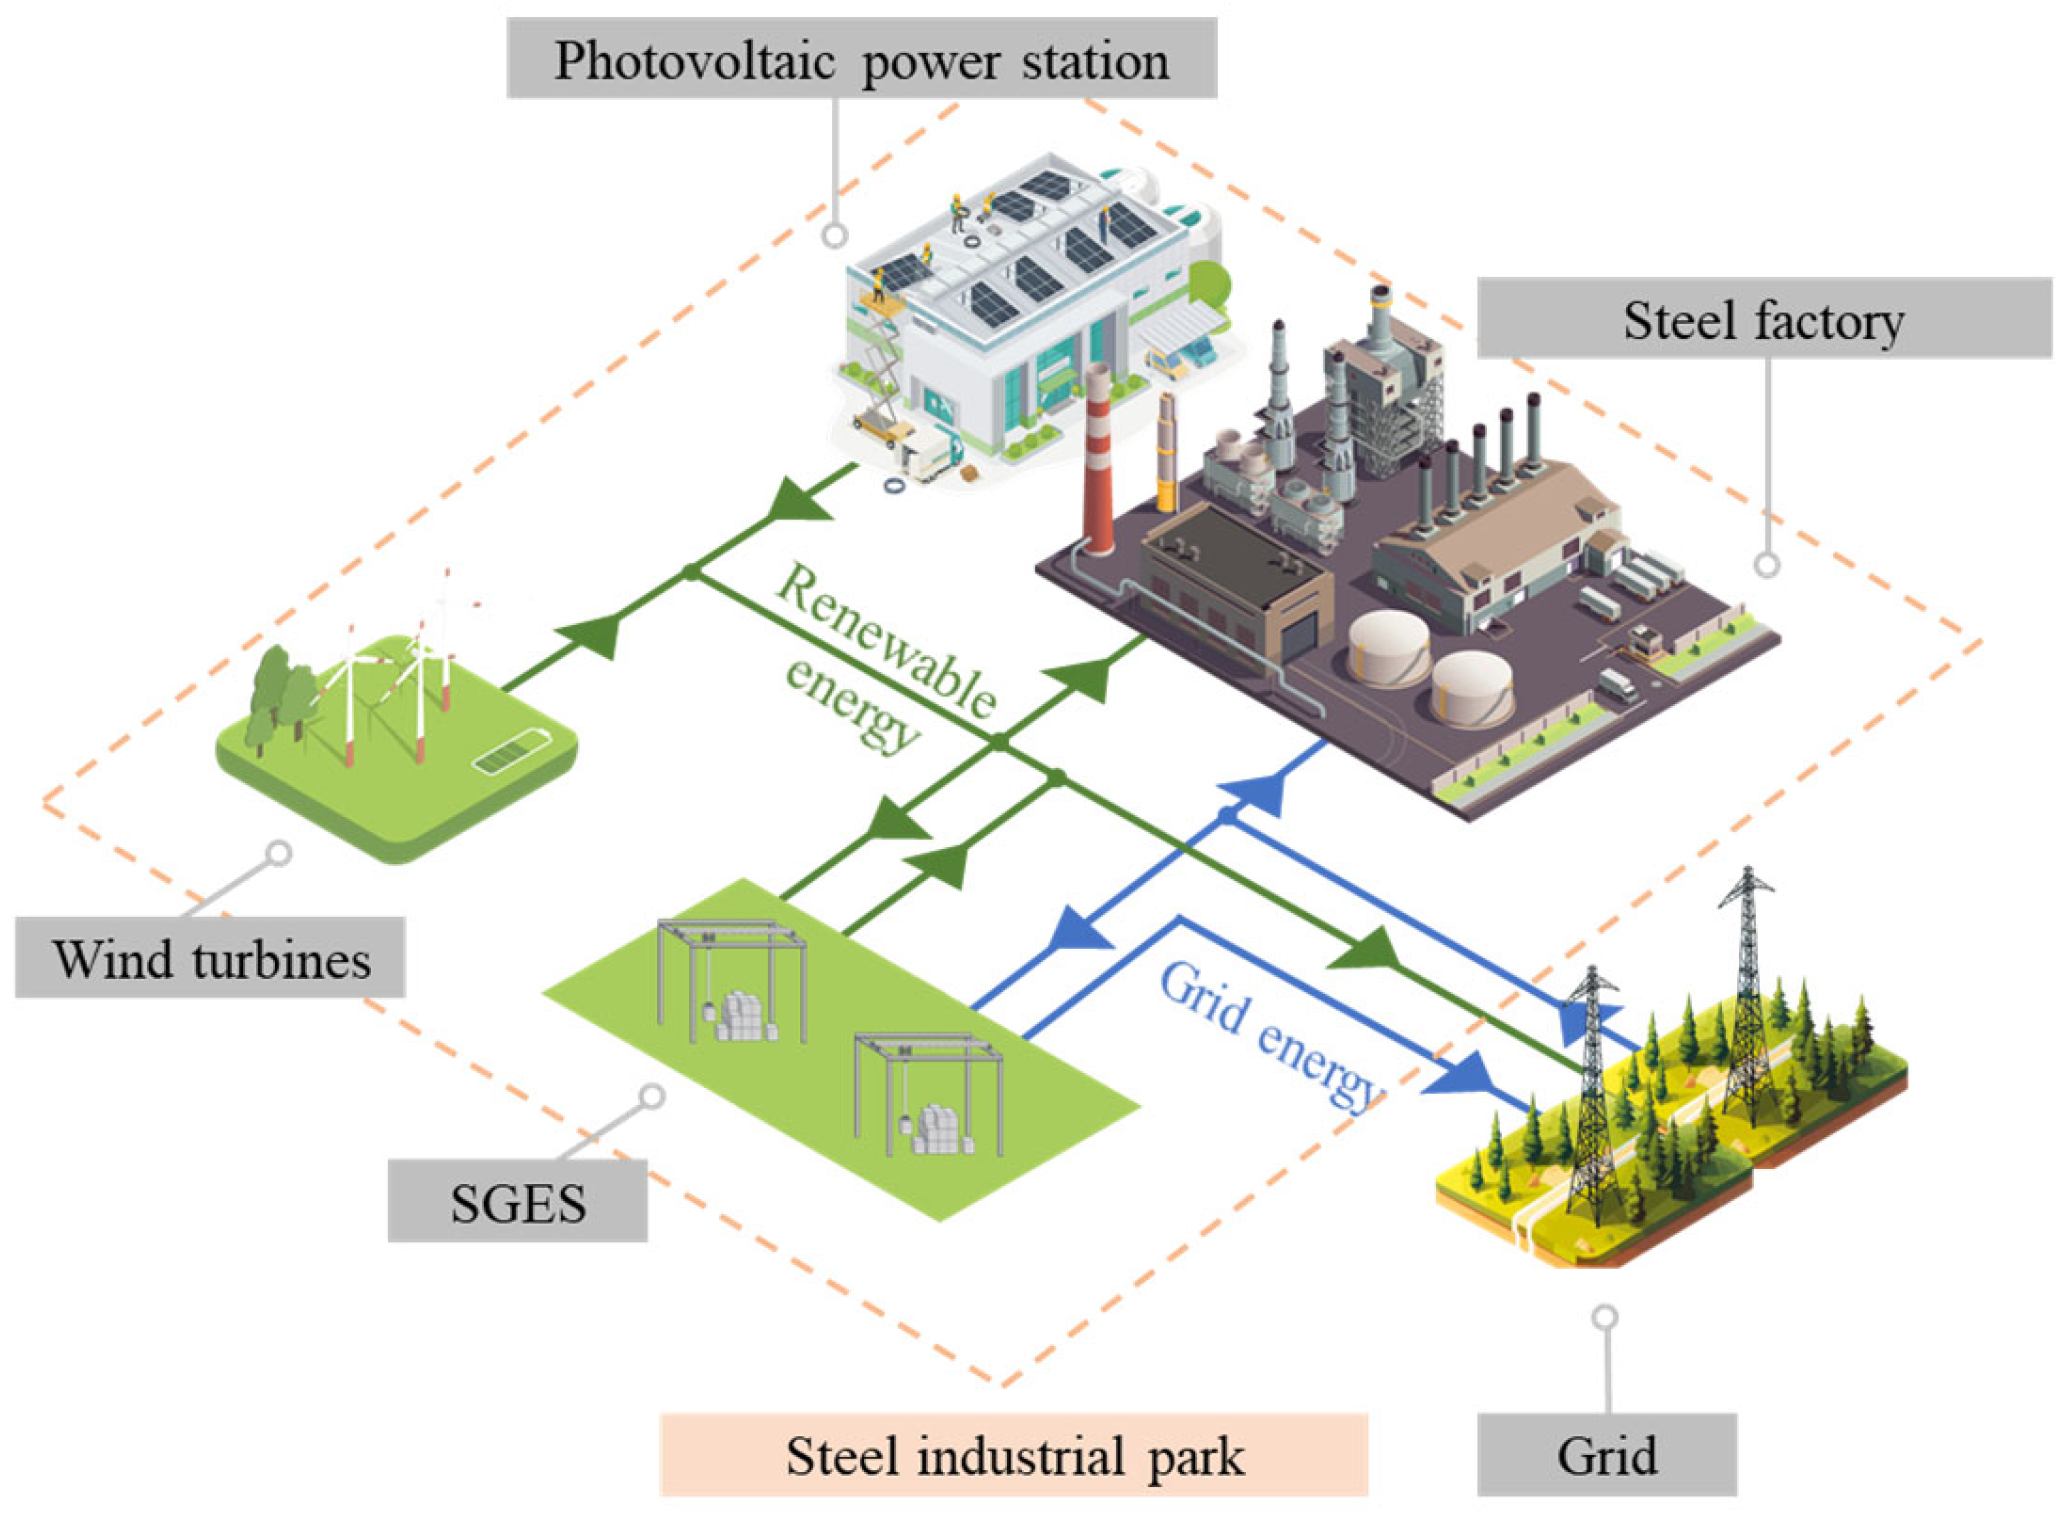
2. System Description

This section provides a detailed description of the research object of this paper. Section 2.1 introduces the structural composition of the steel industrial park under study and describes its energy flow process. Section 2.2 compares different types of gravity energy storage technological approaches and analyzes their characteristics. Section 2.3 presents the physical structure and mathematical model of energy conversion for the proposed stacked SGES. Section 2.4 presents the mechanical constraints of the proposed model.

2.1. System Structure Analysis

As part of a typical energy-intensive industry, steel enterprises exhibit distinctive characteristics in their park-level electricity load profiles. In steel industrial parks, the load composition primarily falls into three categories. Industrial production loads, dominated by processes like smelting and steel rolling, constitute the main energy demand. The remaining two types consist of auxiliary systems supporting production operations and facility loads for employee daily needs, respectively. These three components collectively form a continuous cyclical electricity consumption pattern. Specifically, daily load curves show regular fluctuations, with peak and valley periods corresponding to a fixed production schedule. Seasonal variations primarily stem from increased cooling and heating system loads during summer and winter, yet the overall pattern remains predictable due to established energy consumption modes.
Driven by strategic policies, steel enterprises are accelerating the grid integration of renewable energy sources such as wind and solar. However, structural contradictions emerge between the intermittent nature of renewable generation and rigid industrial load demands. For example, photovoltaic output peaks at midday often coincide with production troughs, causing grid voltage fluctuations, while extreme weather-induced wind power reductions exacerbate supply risks during peak periods. This spatiotemporal mismatch between energy supply and demand creates persistent electricity deficits. Consequently, the steel industry is required to configure large-capacity energy storage systems, driven by contemporary demands and policy imperatives.
Figure 1 presents a schematic diagram illustrating the energy flow relationships in a renewable energy-integrated steel industry complex. The industrial park is equipped with wind turbines and photovoltaic power station, complemented by an SGES system. The SGES system stores surplus electricity during periods of abundant renewable energy generation and discharges stored power during peak demand periods. Additionally, the park maintains bidirectional energy exchange with the external power grid, ensuring stable electricity supply through this coordinated energy management approach.
This structure enables coordinated charging and discharging regulation during peak and off-peak electricity price periods. By integrating an energy storage system, this approach not only boosts the consumption of local renewable energy within industrial parks, but also optimizes energy costs for the steel industry.

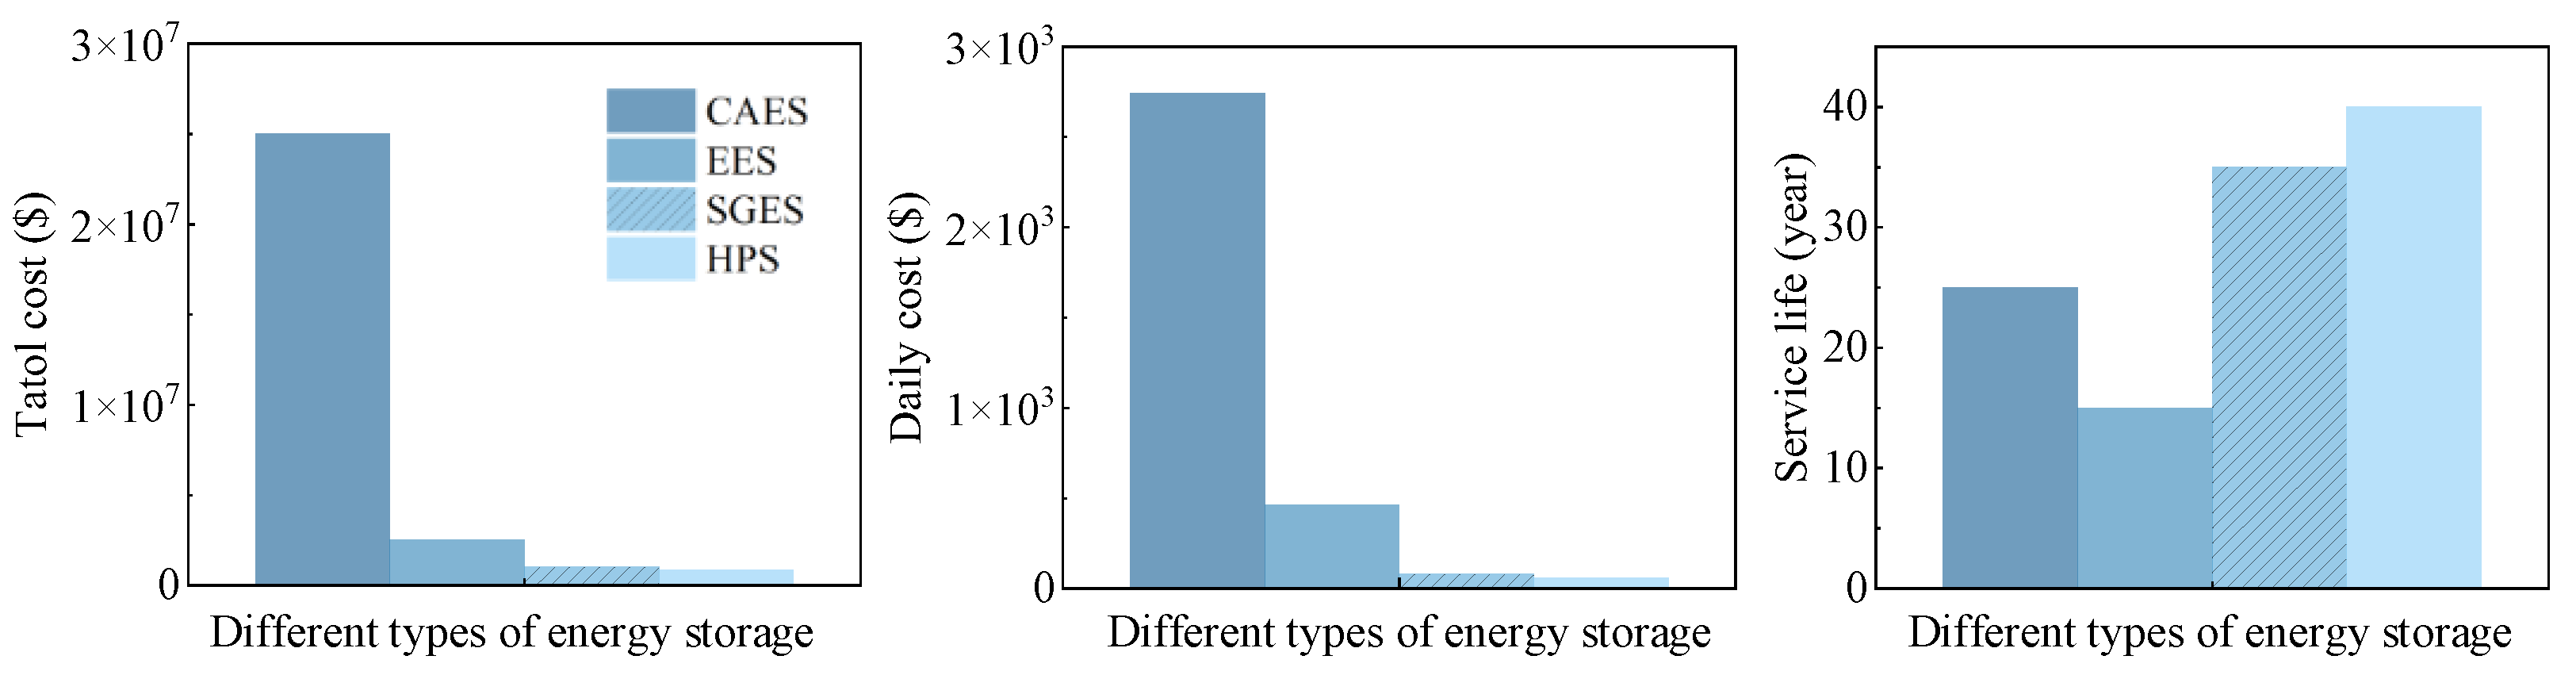
2.2. Comparison of Typical Energy Storage Types
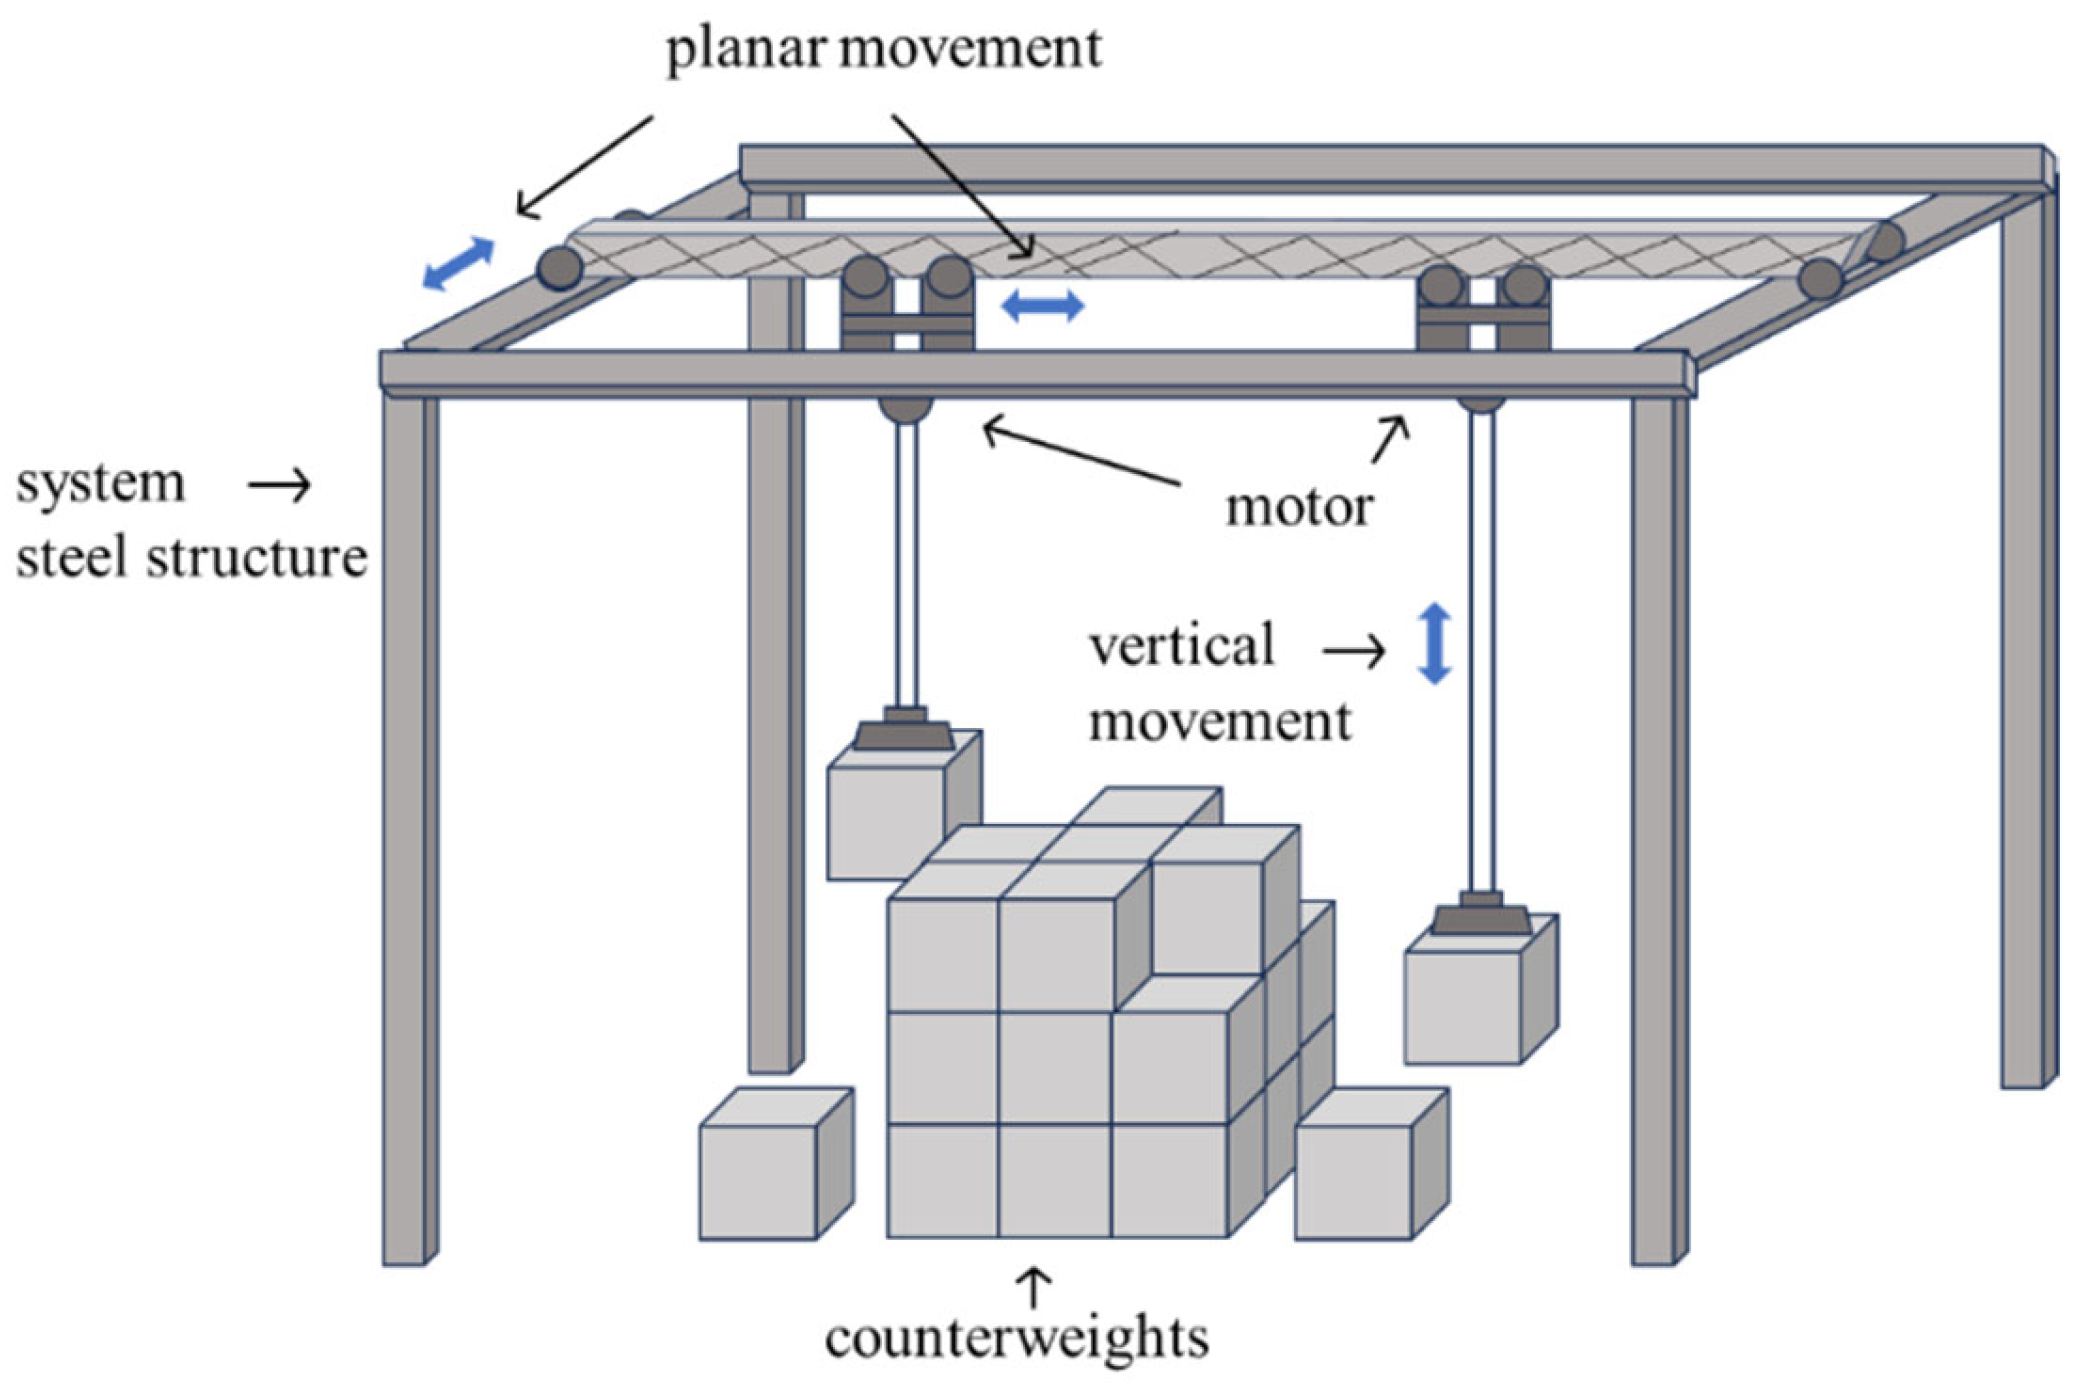
Although gravity energy systems exhibit diverse structural configurations, their fundamental operational principle remains the same. This primarily comprises “charging” and “discharging” states. During the charging state, electricity drives motors to elevate the counterweight from a lower to a higher position, converting electrical energy into gravitational potential energy. In the discharging state, the descending counterweight activates a generator to convert the gravitational potential energy back into electrical energy, which can then be transmitted to the grid.
By introducing the characteristics of different types of gravitational energy storage (GES) and conducting a comparative analysis, the type selected for this study was determined. The different types of GES are specified in Table 1.
This study adopts stacked energy storage. Compared to other technologies, there are two major constraints. Firstly, its geographical environment compatibility is insufficient. Systems such as mine cars and cable cars rely on specific industrial environments and specialized equipment, the piston type has strict requirements for mechanical strength and sealing, and gantry crane-type systems require support from load-bearing platforms, all of which struggle to match the conditions of a steel park. Secondly, fluid medium systems represented by hydroelectric pumped storage have a higher dependence on terrain and water resources, and industrial scenarios generally cannot meet these requirements.
The proposed scheme improves upon the stacked structure. Firstly, the modular stacked type does not require additional counterweight storage platforms. It is improved by relying on the conventional equipment of steel enterprises such as gantry cranes, achieving the full utilization of space layout and significantly enhancing the flexibility of site selection. Secondly, idle steel billets in the park are used to replace traditional concrete counterweights. This not only solves the problem of the static storage of steel, but also realizes resource recycling.

2.3. Model of SGES

To simplify the analysis, the following fundamental assumptions are made in this study: (i) the motion of the counterweights is assumed to be uniform (constant velocity) throughout the lifting and lowering process; (ii) in the capacity planning model, the state of charge of the SGES is assumed to follow a linear model, with its discrete characteristics neglected for simplification; (iii) the influence of the connection mechanism between the counterweights and the hoisting motors on the stacking height is assumed to be negligible; and (iv) in the system construction cost analysis, the construction cost of the energy storage tower frame is assumed to be proportional to its height, while the foundation cost is assumed to be proportional to the foundation area.
The mathematical formulations for power and energy capacity are expressed as follows:
P ch = G cw + f mr υ ch
P dis = G cw f mr υ dis
f mr = η a G cw + η e F d
E SGES = G cw H max / c const
where P ch and P dis represent the charging/discharging power of the SGES; G cw represents the gravitational force of the counterweight; f mr is the motion resistance; υ ch and υ dis correspond to the moving velocities of the counterweight block during the charging and discharging phases; F d represents the motor traction force; η a and η e indicate the mechanical loss and motor power loss; E SGES is the capacity of the SGES; H max represents the maximum lifting height of the counterweight block; and c const is a unit conversion constant.
The power of this system is mainly related to the gravity of the counterweight blocks, the running speed of the blocks, and the friction received from the outside. The capacity is related to the weight of the counterweight blocks and their placement height.
In Figure 2, this study proposes an SGES system tailored for the steel industry, utilizing stacked high-density steel blocks as energy storage counterweights. The structural design enables the counterweights to be moved and stacked within the three-dimensional space of the entire system, rather than being confined to a specific location. Additionally, multiple lifting motors can be installed in a single energy storage system to simultaneously facilitate the movement of multiple counterweights. This design significantly reduces the maximum power demand on individual lifting motors while ensuring that the overall power requirements of the energy storage system are met. Furthermore, by distributing the weight of the counterweights, the structural strength requirements for the system’s support framework can be further reduced.
By leveraging steel enterprises’ material advantages, the system enables efficient large-capacity and long-duration energy storage through elevation and descent. The compact structure optimizes spatial efficiency while maintaining compatibility with the industrial environment, offering a scalable solution that aligns with steel industry operational requirements and material resources.

2.4. Mechanical Restraints

The core safety issues of the gravity energy storage system structure include the frame load-bearing capacity, material selection and verification, and actual load and foundation bearing capacity. Below, based on the actual working conditions of steel enterprises and engineering standards, restrictions are imposed on the mechanical structure part of the energy storage system.
The conditions that the framework needs to meet are as follows:
τ SGES = F max h 1 h 2 τ design
τ design = τ yield / n safety
where τ SGES is the shear strength of the framework material for the system. In engineering projects, the Chinese national standard Q355 steel is often selected. F max is the maximum load that the framework can bear; n safety is the safety factor, with the value for heavy equipment ranging from 2.5 to 4; τ yield is the yield strength of the Q355 steel; and h 1 and h 2 are the length and width of the framework material.
We apply common empirical formulas based on engineering design experience to constrain the mechanical structure. The constraints on structural stability are as follows:
F cr = π 2 E moe I moi K H max 2 F design
F design = k F max
I moi = h 1 h 2 3 / 12
where F cr is the Euler critical load; E moe is the elastic modulus of frame material; I moi is the sectional moment of inertia; K represents fixed end constraints; F design is the Euler critical load limit of the system; and k is the safety factor.
The actual load borne by the framework is as follows:
G cw υ k F max
where G cw is the gravitational force of the counterweight block and υ is the operating velocity of the counterweight block.
When constructing ground facilities, the bearing capacity of the ground needs to be considered in actual engineering projects, so as to assess the feasibility of building the mechanical equipment. The relevant constraints regarding foundation bearing capacity are as follows:
p fd = G SGES a T b T p design
p design   =   f a + η b γ a T Δ a + η d γ m d Δ d
where p fd is the foundation bearing capacity; G SGES is the weight of the stacked gravity energy storage system; a T and b T are the length and width of the system foundation; p design is the corrected foundation bearing capacity; f a is the foundation bearing capacity of the steel plant ground; η b and η d are the correction coefficients for soil quality above and below the foundation surface; γ and γ m are the soil density above and below the foundation surface; Δ a and Δ d are correction values; and d is the buried depth.
This section construes the safety boundary of the gravitational energy storage mechanical structure by considering factors such as material strength, stability, and foundation strength. The core lies in verifying the system’s mechanical strength and foundation compatibility through load calculations.

3. Methodology

This section presents the proposed capacity planning model and meta-heuristic algorithm. Specifically, Section 3.1 provides a detailed description of the two-stage planning model, which considers both renewable energy accommodation capacity and the economic feasibility of energy storage construction. Section 3.2 introduces the proposed RI-PSO solution algorithm, which efficiently solves the planning model presented in this paper.

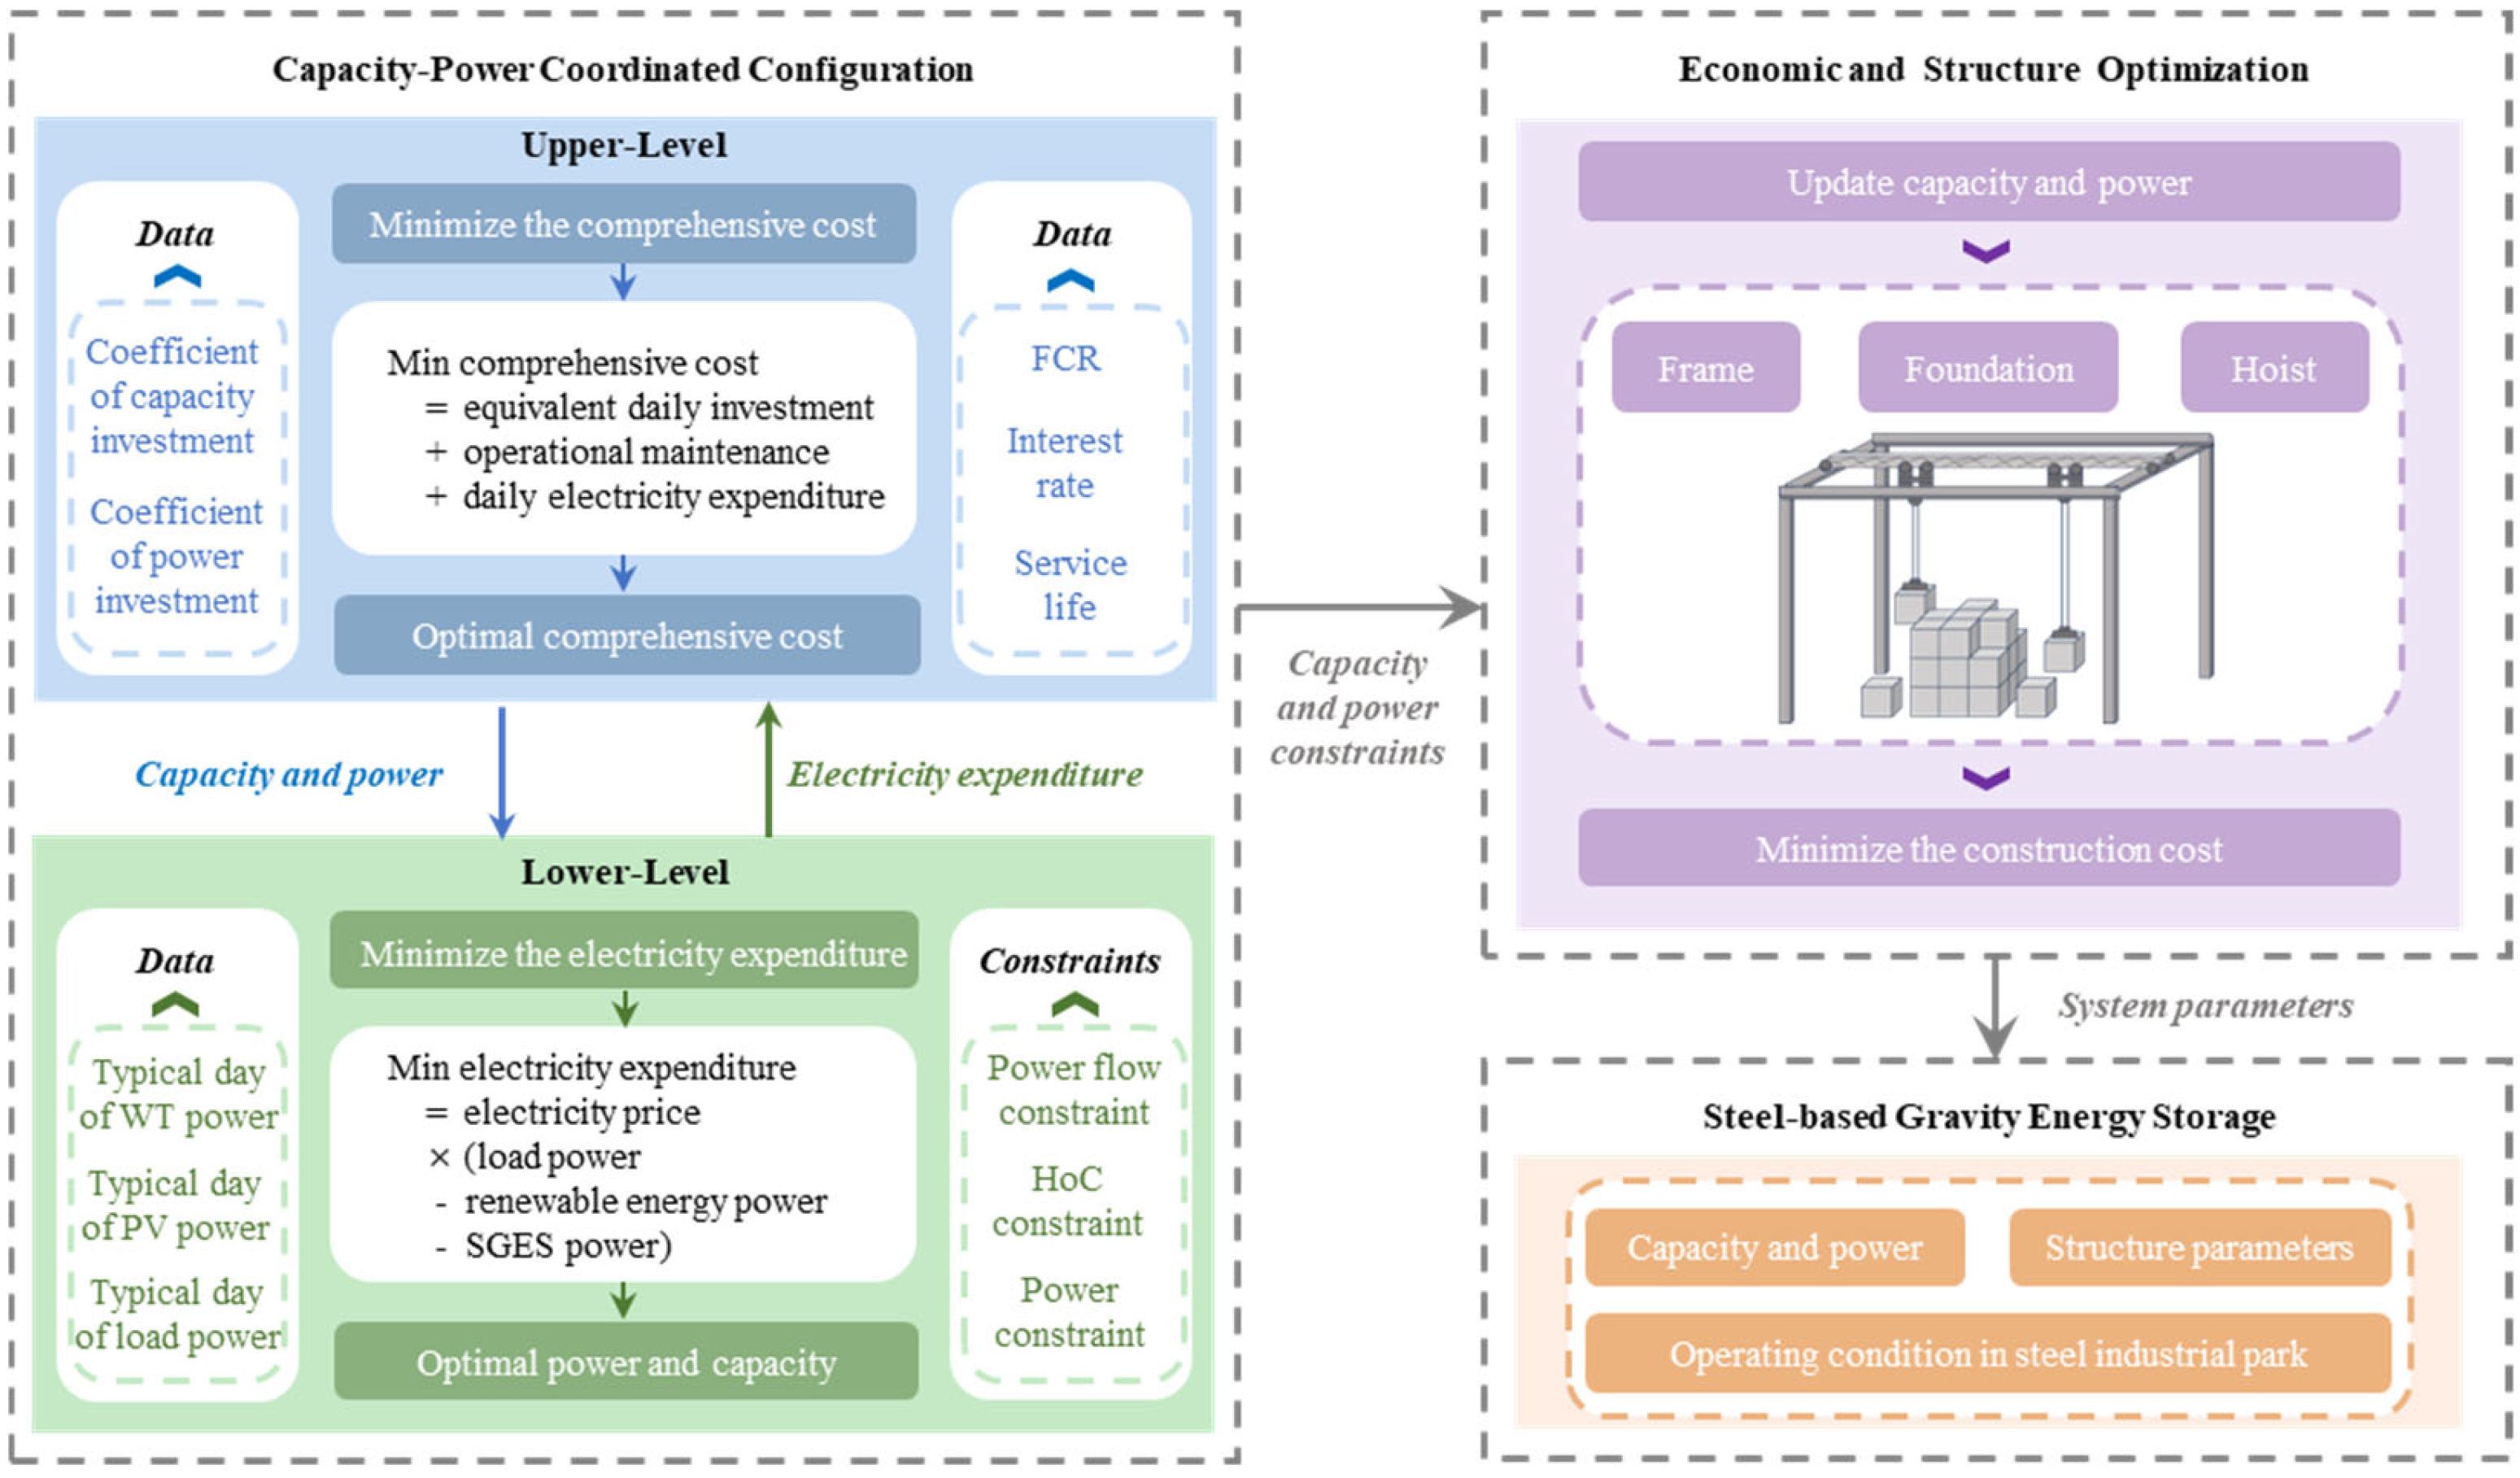
3.1. Two-Stage Planning Model

3.1.1. Overall Framework

This study establishes a two-stage planning approach to stacked SGES, as shown in Figure 3, which integrates energy storage investment costs with structural parameters. It targets a typical scenario within high-energy-consuming industrial parks that contain a high proportion of renewable energy sources.
In the first stage, a bi-level collaborative structure is established. The lower level optimizes daily electricity trading strategies based on typical daily data; the upper level aims to minimize the comprehensive energy storage costs, employing the proposed RI-PSO optimization algorithm for global optimization. The two levels achieve collaborative optimization through an iterative mechanism: the lower level feeds back daily electricity trading costs to the upper level for capacity and power adjustment, while the upper level updates the SGES parameters and transmits them back to the lower level for strategy re-optimization.
In the second stage, the focus shifts to multivariable system optimization, which involves energy storage dimensions, motor configuration quantities, and counterweight parameters.

3.1.2. Stage I

1.
Upper level
The objective of the upper level is to minimize the comprehensive energy storage costs, encompassing the following components: equivalent daily investment derived from capacity and maximum power investment, operational maintenance expenditures, and daily electricity purchase/sale expenditure within the steel park, expressed as follows.
min F stageI = C CP + C OM + C sell
where F stageI represents the comprehensive energy storage costs; C CP represents the equivalent daily investment of power and capacity; C OM represents the daily operational maintenance expenditures; and C sell is the daily electricity purchase/sale expenditure within the steel park.
Operational maintenance expenditure ( C OM ) means the maintenance costs related to power. Here, the actual operating power of the energy storage system is used to calculate these costs. The daily cost of power and capacity ( C CP ) is specifically related to the maximum daily power and capacity of operation.
C CP = F C R ( C capacity + C P max ) / c day
C OM = γ t = 0 23 P SGES ( t )
C capacity = α E SGES
C P max = β P SGES 2
where C capacity represents the equivalent daily capacity investment; C P max represents the equivalent daily investment of maximum power; c day represents the number of days in a year; P SGES ( t ) represents the operating power of the system at time t; γ represents the coefficient of operational maintenance; α represents the coefficient of the investment cost for energy storage capacity; E SGES represents the capacity of SGES; P SGES represents the power of SGES; and β represents the coefficient of the investment cost for power.
The specific formula of FCR is presented below, mainly considering the operating years and interest rates.
F C R = r ( 1 + r ) l ( 1 + r ) l 1
where FCR represents the fixed capital recovery factor, which is the annualized investment cost of the gravity energy storage system over its effective service life. When comparing investment projects from different years, the feasibility of funds for those projects from different years is often used for comparison. r represents the interest rate and l represents the life cycle in years.
Both C OM and C sell depend on the value of P SGES ( t ) ,   t = 0 , 1 , , 23 obtained from the solution of the lower level.
2.
Lower level
From the perspective of the gravity energy storage power station, the lower-level algorithm considers how the gravity energy storage system can achieve the maximum benefit in terms of power purchase and sale in the power grid.
The objective function minimizes daily electricity purchase/sale costs within steel enterprises, as follows:
min C sell = t = 0 23 C E ( t ) ( P L ( t ) P PV ( t ) P WT ( t ) P SGES ( t ) )
where C E ( t ) represents the grid electricity price at time t; P L ( t ) represents the electrical load at time t; and P PV ( t ) and P WT ( t ) represent the photovoltaic and wind power generation outputs at time t, respectively. A positive value of P SGES indicates discharging, while a negative value indicates charging.
This formula calculates the difference between the load and the power of renewable energy sources, the power of the gravity energy storage system at each time, and its relationship with the on-grid electricity price at time t. This difference represents the power that needs to be purchased from the grid at each time point t, or the power that can be sold back to the grid. The goal is to minimize this total cost, that is, by optimizing the use of renewable energy and energy storage systems to reduce the demand for power purchase from steel enterprises, thereby reducing the costs for these enterprises.
The constraints of the second stage are as follows:
H o C ( t + 1 ) = H o C ( t ) 1 E SGES 1 η dis t t + 1 P SGES ( t ) d t , P SGES ( t ) > 0 H o C ( t ) 1 E SGES η c h t t + 1 P SGES ( t ) d t , P SGES ( t ) 0
H o C min H o C ( t ) H o C max
P SGES , max P SGES ( t ) P SGES , max
where H o C ( t ) corresponds to the State of Charge manifested by the height of the counterweights at time t; η ch and η dis , respectively, represent the charging and discharging efficiency; H o C min and H o C max represent the upper and lower limits of state of the counterweight height; and P SGES , max is the upper limit of power during the algorithm’s solution process.
The solution results of the first stage should be reflected in the actual structural constraints of the second stage.

3.1.3. Stage II

Once the capacity is determined, the total mass of the counterweights within the system is already fixed. The second stage further optimizes the structural design of the SGES system based on the capacity and power solutions obtained in the first stage. It realizes the combination of capacity and actual operating scenarios.
The construction cost of the SGES structure ( F stageII ) includes the total hoisting equipment cost ( C hoist ), foundation construction cost ( C foundation ), frame construction cost ( C frame ) for n T energy storage towers, each containing n M motors, and the cost of counterweights ( C cw ) and their quantity ( n w ). Among them, C cw and n w are derived from the optimization results and do not directly participate in the optimization process.
C hoist = n T n M C motor
C motor = f ( P motor , max )
C foundation = k 1 n T b T c T
C frame = k 2 n T 4 ( a T + b T + c T )
where C motor represents the price of a motor, which is a piecewise function of the motor’s max power ( P motor , max ). k 1 and k 2 represent the unit area foundation construction cost and unit length framework construction cost and a T , b T , and c T represent the height, length, and width of the energy storage tower, respectively.
The motors of energy storage units must satisfy the total power requirement derived from the solution of Stage I. That is, the total power of all clicks in each of the all-energy-storage systems should comply with the solution of the first stage. Concurrently, both the weight of counterweights and their storage height should meet or exceed the capacity calculation results obtained in Stage I. Furthermore, the stacking dimensions of the counterweights must be constrained so that their length, width, and height do not exceed the framework’s dimensional limitations. The detailed constraints are shown as follows:
n T n M P motor , max P SGES , max
b T n M a M
c T n M a M
n T n M a M 3 ρ g v P SGES , max
a T b T c T n M a M 3 / c constant
n T a T b T c T ρ g ( 0.5 a T 0.5 a M ) E SGES / c constant
where a M represents the edge length of the cubic counterweight block; ρ represents the density of the steel material; g is the gravitational acceleration constant; and v is the operating velocity.
These costs and constraints collectively determine the economic feasibility of the gravitational energy storage system, which is crucial for its design and optimization. By precisely calculating and optimizing these costs, we can ensure that the construction and operation of the energy storage system are both economical and efficient.

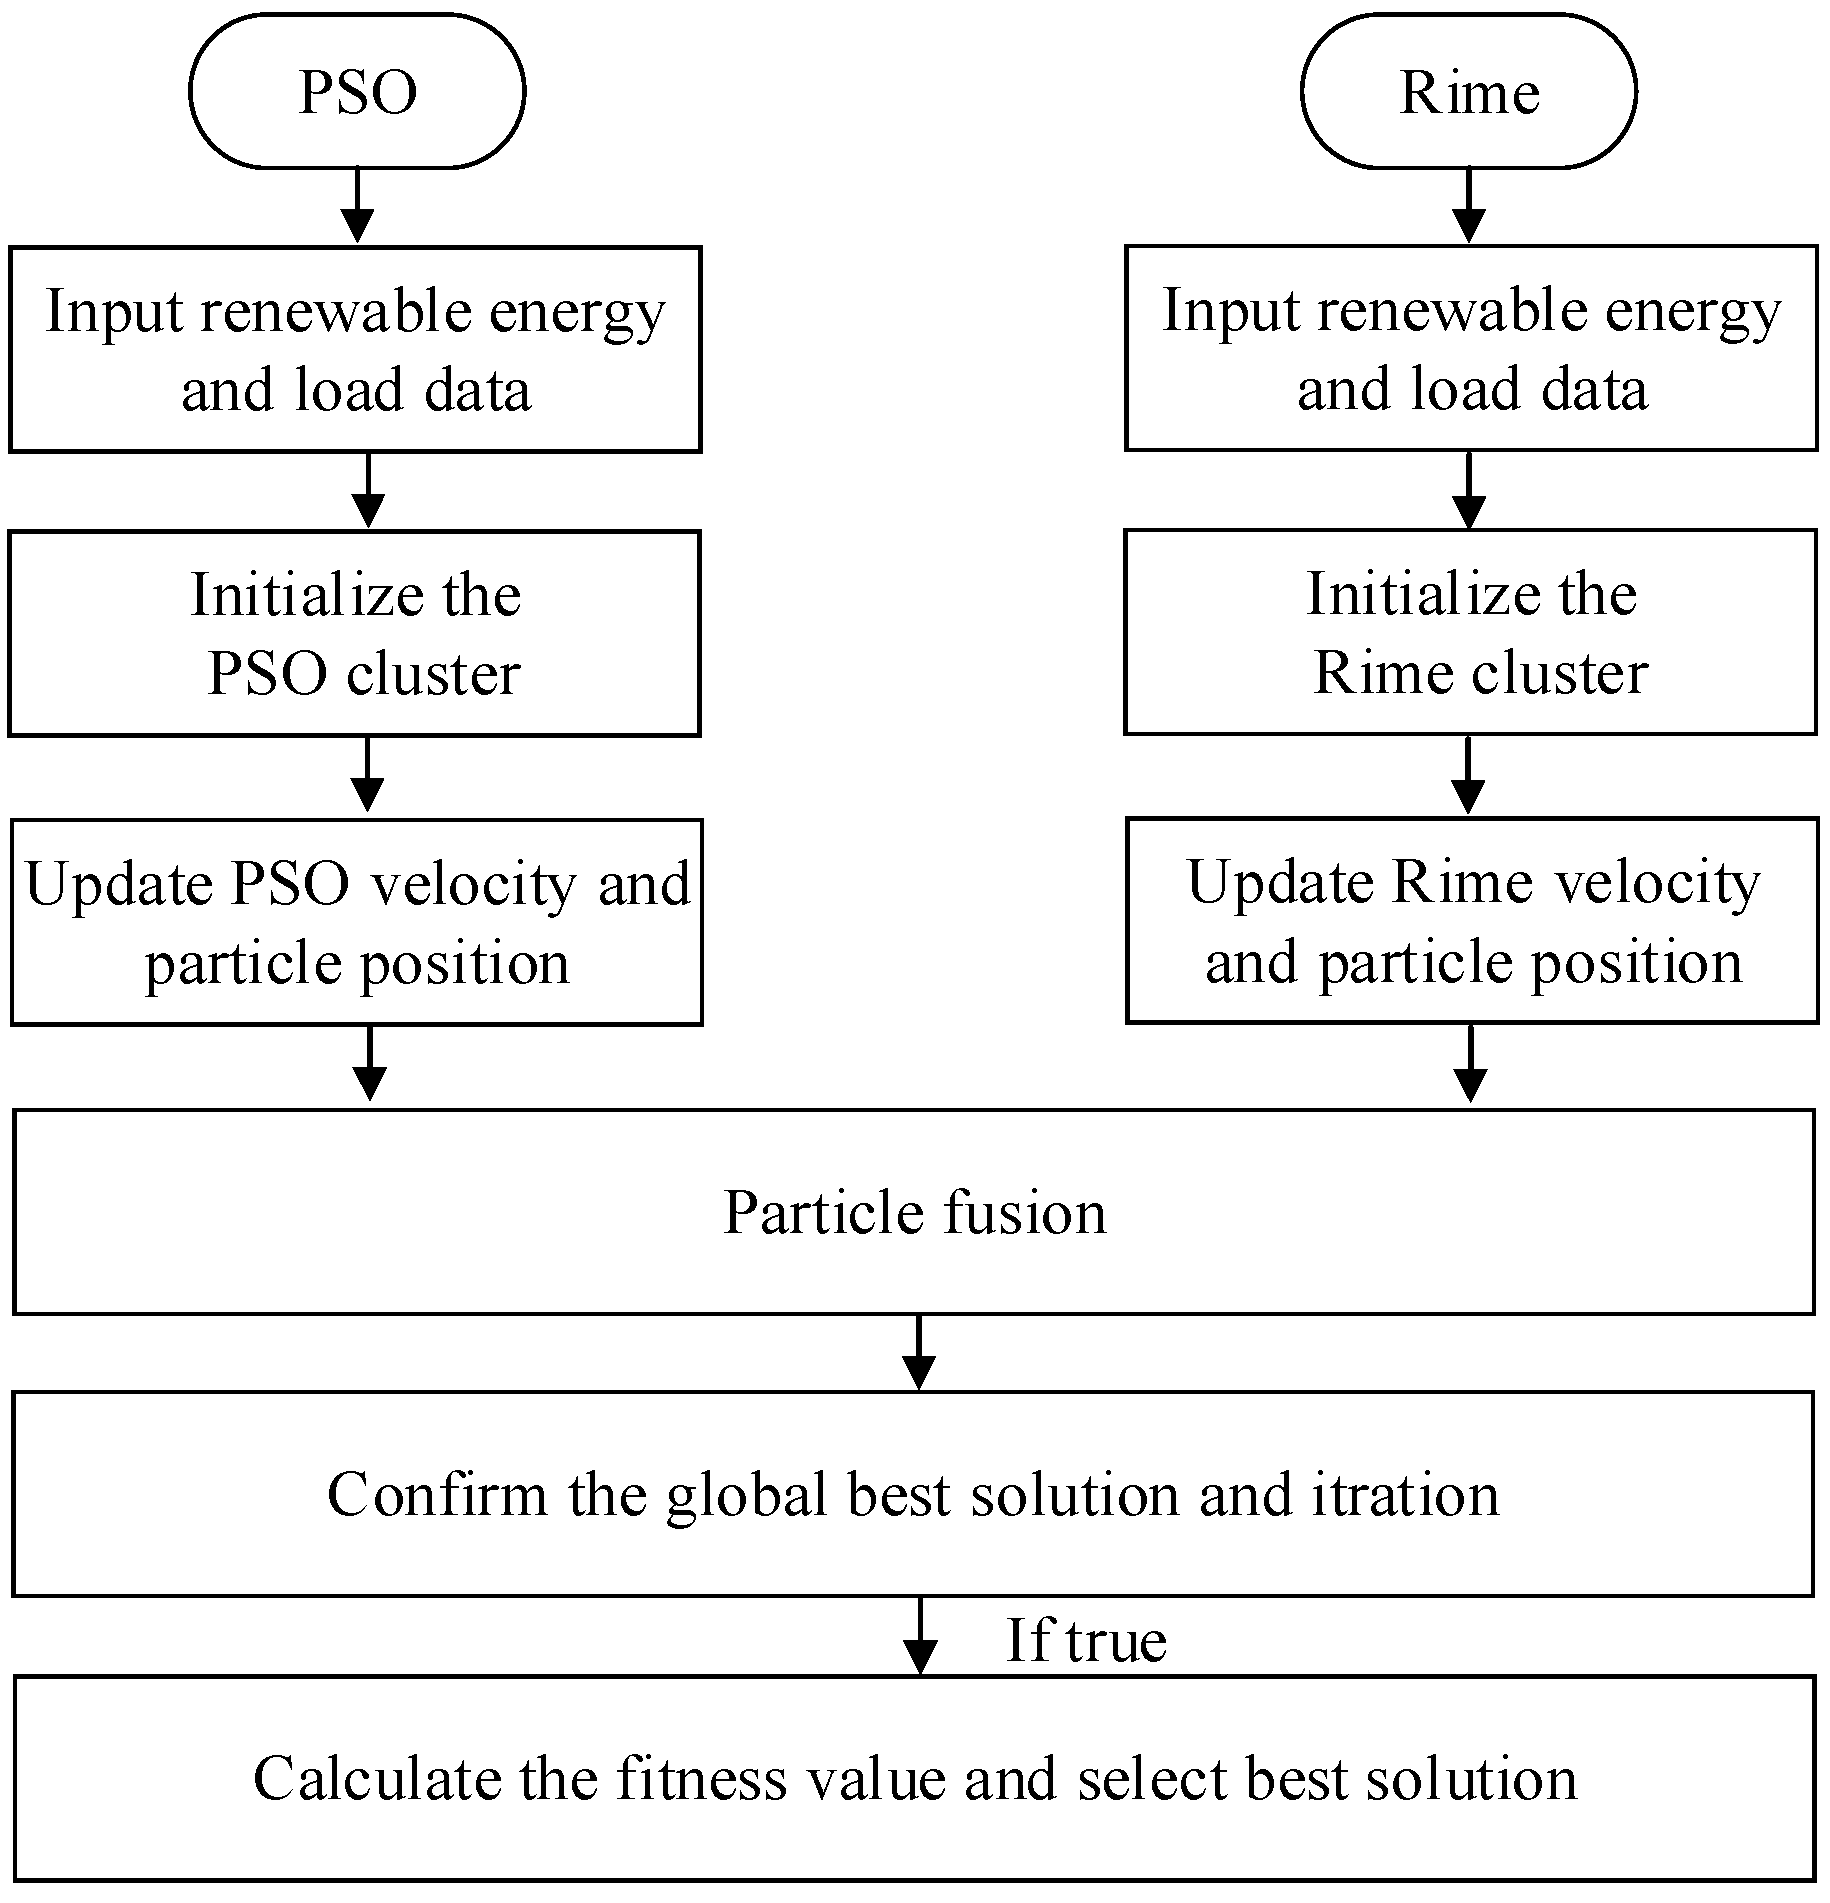
3.2. Solution Approach

3.2.1. Rime Algorithm

The Rime algorithm [44] is a heuristic optimization method inspired by the physical process of rime ice formation in nature. The growth of soft rime is highly random, allowing soft rime particles to freely cover the surface of an object, and the growth speed in the same direction is slow. The growth of hard rime is simple and regular, with particles growing rapidly in the same direction and prone to puncturing. Therefore, the core mechanism of the Rime algorithm can be divided into two parts. The first is the soft rime search strategy, which leverages the randomness and wide coverage of soft rime particles. This enables the algorithm to efficiently explore the entire search space during the early stages of iteration, thereby reducing the likelihood of becoming trapped in local optima. The second is the hard rime puncture mechanism, which simulates the cross-penetration process observed in the natural formation of hard rime. This mechanism enhances the algorithm’s ability to escape from local optima, thereby improving its convergence accuracy. The corresponding mathematical formulations are presented as follows.
(1) Soft rime search strategy
E = x / X
φ = 1 ω x X / ω
where E is the loop iteration factor; x is the current iteration number; X is the maximum number of iterations; φ is the environmental factor; ω is a parameter of the environmental factor; and [·] denotes rounding.
When r 1 < E , the soft rime search strategy is executed as follows:
R i = R i best + r 1 cos θ φ h B up B low + B low
θ = π x 10 X
where R i represents the current updated position of the particle; R i best represents the best position found by the particle so far; r 1 and h are random numbers between 0 and 1; θ is the parameter for angular change; B up is the upper bound of the search space; and B low is the lower bound of the search space.
(2) Hard rime puncture mechanism
When r 2 < F norm ( S j ) , the hard rime puncture mechanism is executed as follows:
R i = R i best
where r 2 represents a random number between −1 and 1 and F norm ( S j ) represents the normalized value of the current agent fitness value.
By integrating the two mechanisms described above, the main characteristics of the Rime algorithm are as follows:
(i) The rapid identification of promising regions in the early stage of iteration;
(ii) An effective balance between the exploration and exploitation phases;
(iii) Few hyperparameters, a stable performance, and ease of implementation.

3.2.2. RI-PSO Algorithm

In contrast, the particle swarm optimization (PSO) algorithm guides the search direction through a combination of individual experience and collective experience. The ability to locate promising regions in the early stage of iteration is relatively limited; however, its stronger local exploitation capability in the later stage contributes to improved convergence accuracy.
To synergistically address these complementary limitations, this study proposes a novel RI-PSO fusion strategy that integrates Rime’s adaptive environment exploration mechanism with PSO’s social information-sharing paradigm. This hybridization establishes a hierarchical optimization framework progressing from macroscopic space exploration to microscopic solution refinement, effectively balancing global search thoroughness with local convergence accuracy through the phased cooperation of the constituent algorithms.
The main steps of the proposed RI-PSO algorithm are as follows:
Step 1. Particle Initialization Phase: Initialize particle positions using both the Rime and PSO algorithms, respectively.
Step 2. Particle Fusion Phase: Merge the two initialized particles in Step 1 and form a new initialized particle distribution position by weighted summation.
Step 3. Confirm Phase: Update particle velocities and positions through adaptively adjusted iteration parameters to seek the optimal solution.
The flow chart of the RI-PSO hybrid phased search strategy is shown in Figure 4.
Specifically, in the first step, the formulas are as follows.
For Rime, its particle iterative soft rime search strategy and hard rime puncture mechanism are shown in Equations (33)–(37).
In PSO, the formulas for speed and position search are presented as follows.
v j + 1 = ω v j + ω r 3 P j best P j
where v j + 1 and v j are the search speeds at the times of j and j+1; P j best is the best solution; P j is the particle position at the time of j; and r 3 is a random number between 0 and 1.
P j + 1 = P j + v j
In Step 2, the specific formula of particle fusion is presented as follows.
p o s i t i o n k = κ 1 R i + κ 2 P j
where p o s i t i o n k represents the initialization result of the particle fusion and κ 1 and κ 2 are the weights of particle fusion. It should be noted here that i = j = k and the positions of particles are represented as a matrix.
Specifically, the weight in the Rime algorithm reflects the emphasis on random exploration, which helps to enhance the diversity of results. In contrast, the weight in the PSO algorithm represents the degree of inheritance of the overall optimization outcome, facilitating an accelerated convergence of the algorithm. In the field of optimization theory, convex combinations of solution sets ensure that the blended positions remain within the original solution space. This approach does not introduce invalid solutions and quickly approximates different areas, thereby accelerating the escape from local optima. Through weighted averaging, a balance can be achieved between the two algorithms, maintaining a certain degree of randomness while incorporating the optimized information.
In Step 3, the main formulas of the adaptive mechanism are as follows.
c 1 = c min c max i I + c max
where c 1 is an individual cognitive factor, which decreases the individual’s reliance on its own experience; i is the current iteration number; I is the max iteration number; and c max and c min are constant numbers with values of 2.5 and 0.5, respectively.
c 2 = c max c min i I + c min
where c 2 is a social cognitive factor which enhances the guidance ability towards the global optimal solution as the number of iterations increases.
ω iw = ω max ( ω max ω min ) i I
where ω iw is the inertia weight, which linearly decreases with an increase in the number of iterations to balance the global search ability and the local search ability, and ω max and ω max are the upper and lower limits of the inertia weight, respectively.
v k + 1 = ω 1 w v k + c 1 r 4 positon k best positon k + c 2 r 5 positon k best positon k
where v k and v k + 1 are the search speeds at the times of k and k + 1; r 4 and r 5 are random numbers between 0 and 1; positon k best is the best solution; and positon k is the particle position at the time of k.
position k + 1 = positon k + v k

4. Case Study

This section demonstrates the cost advantages of the proposed stacked SGES system and the superiority of the proposed RI-PSO algorithm through comparative analysis. Section 4.1 provides a detailed description of the simulation environment setup. Section 4.2 first presents a cost comparison between the proposed SGES system and other typical energy storage systems under equivalent capacity and power conditions. Then, the proposed RI-PSO algorithm is compared with Rime and PSO, demonstrating the effectiveness of the proposed approach.

4.1. Simulation Settings

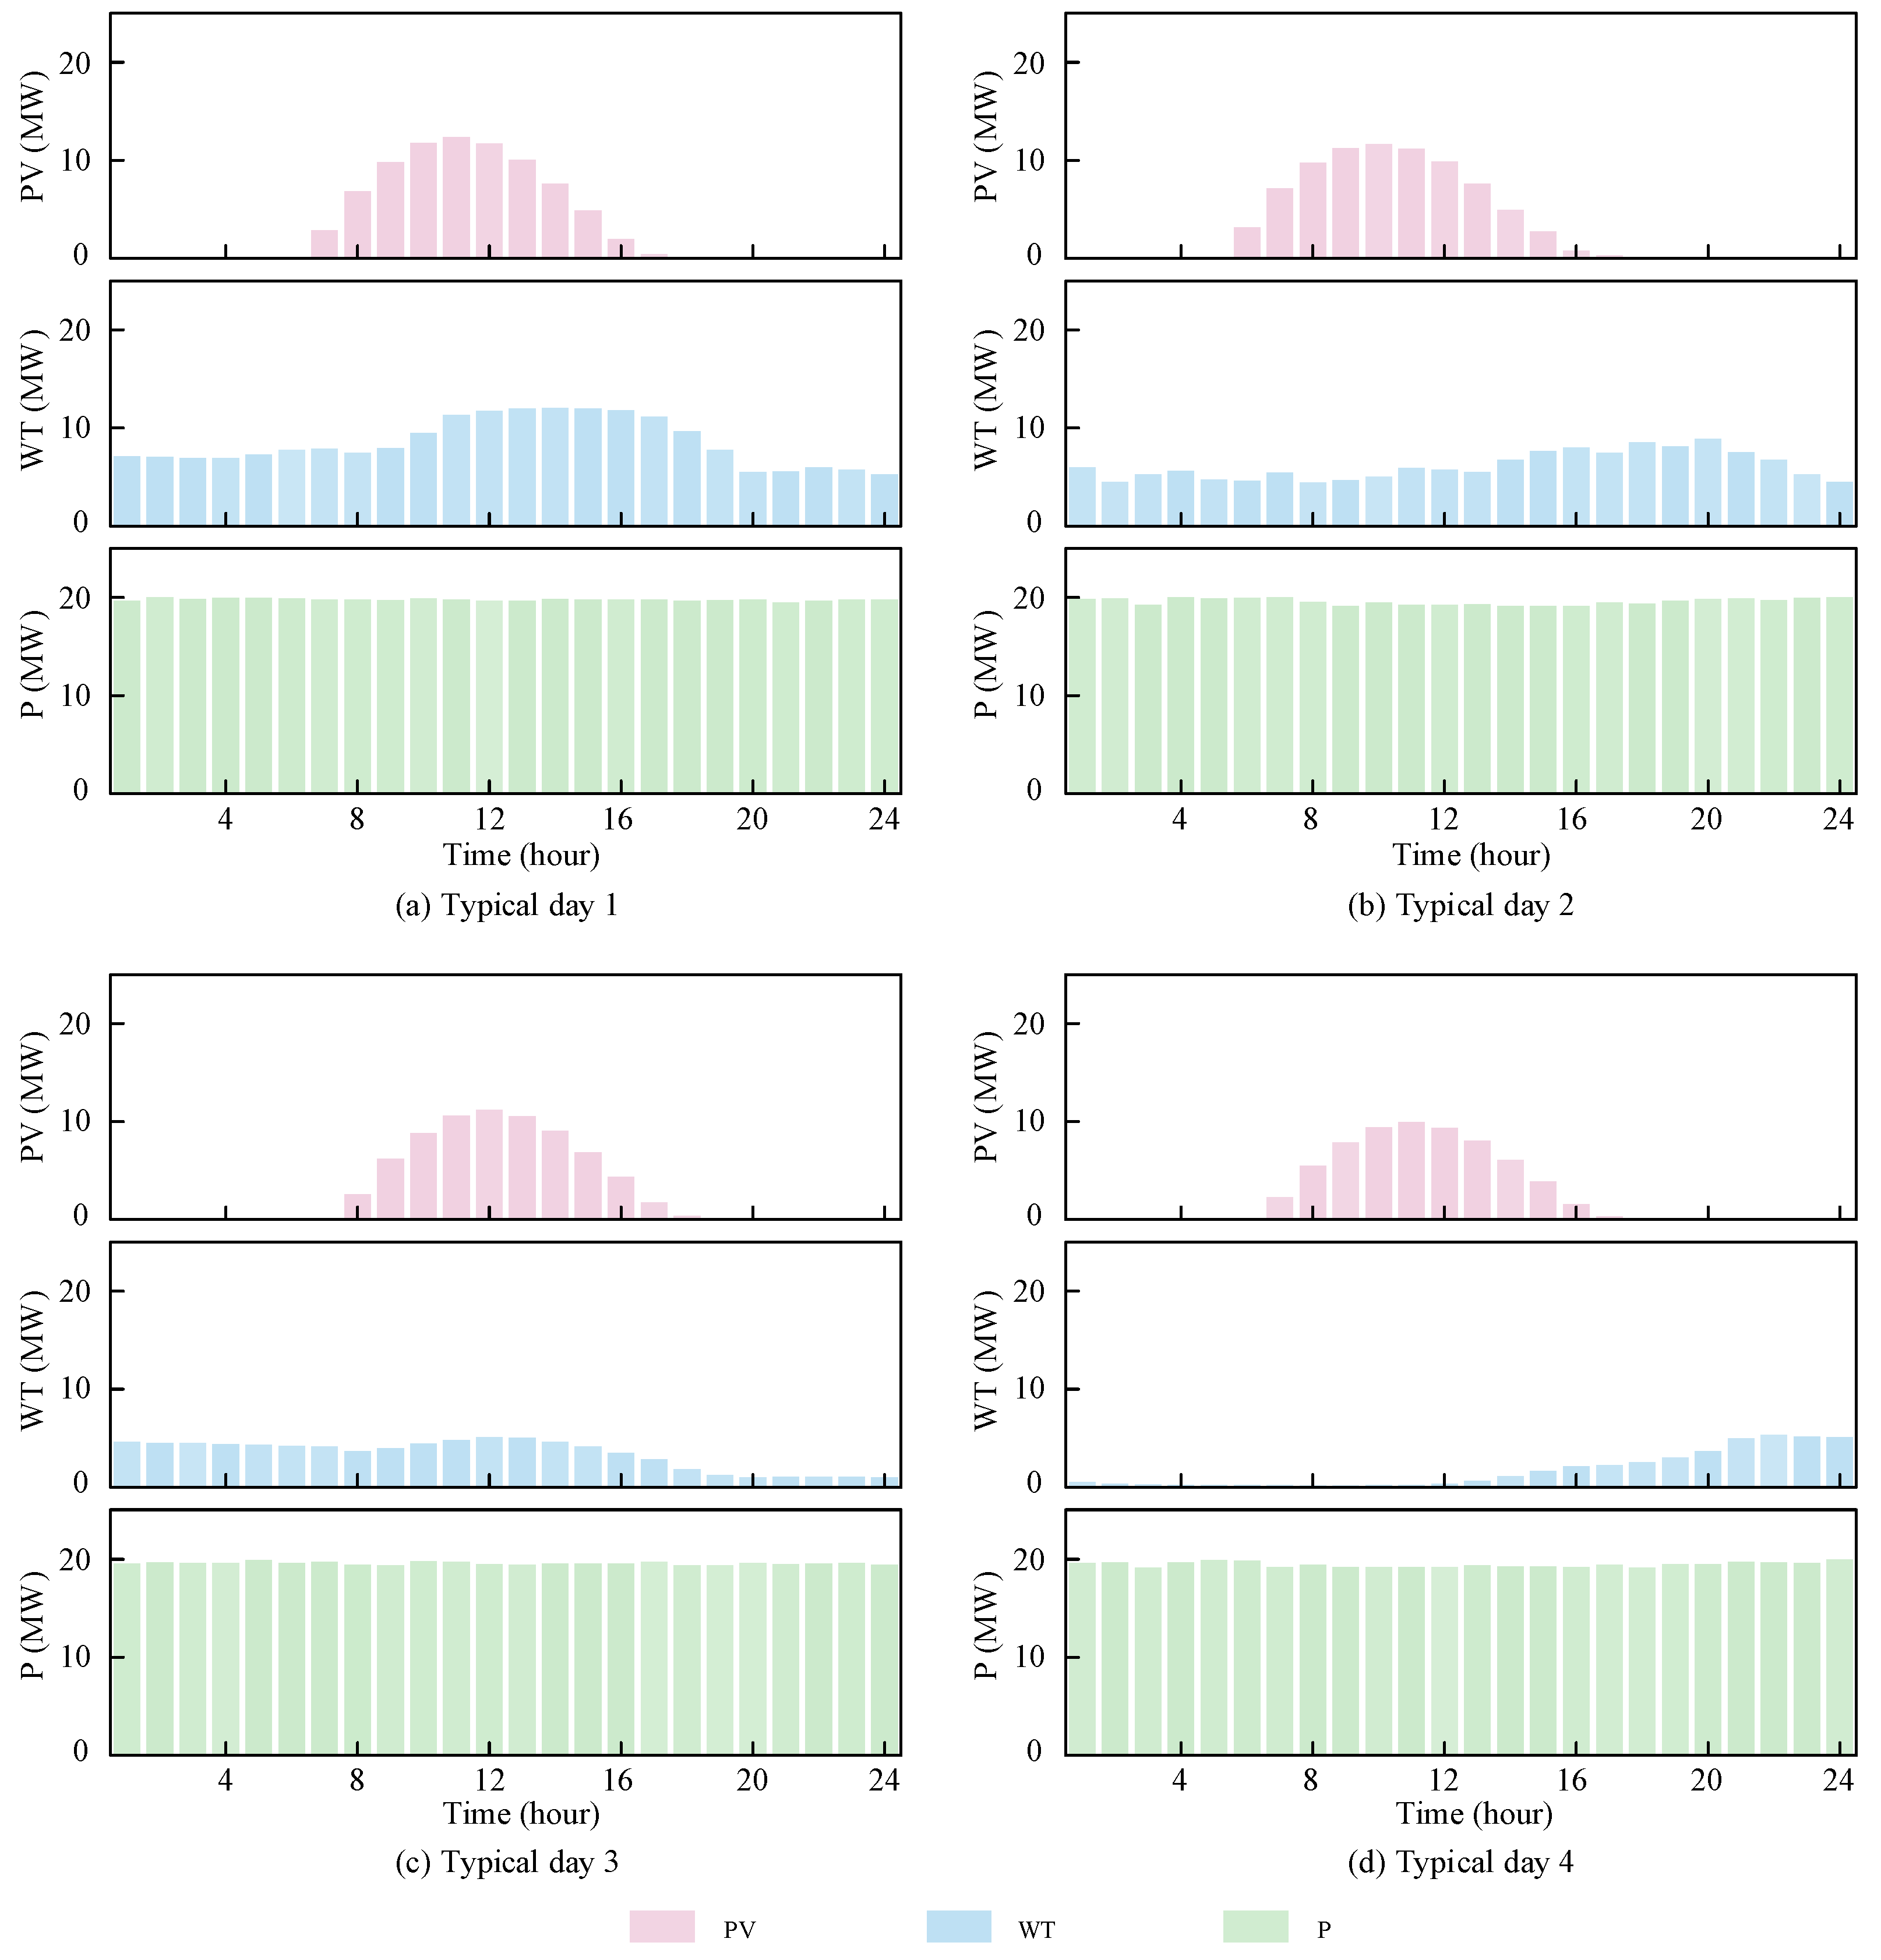
4.1.1. Environmental Settings

The steel plant selected in this study is in the northeast of China (122.6° E, 40.5° N), where the seasons are distinct and there are abundant complementary wind and solar energy resources, indicating great potential for the development of wind–solar hybrid systems. Electricity load data comes from the actual measurements of the steel plant. New energy generation data is generated by fitting the basic weather data of the region and the new energy generation capacity within the park. The data source is ECMWF Reanalysis v5 dataset 2023, and the fitting software is HOMER Pro 3.10.3 By analyzing annual enterprise load data through the K-means clustering algorithm, four typical daily load characteristic patterns are extracted, as shown in Figure 5.
The selected typical daily data includes various levels of new energy generation and different levels of electricity consumption. PV stands for solar power output, WT stands for wind power generation, and P represents the power supplied by the steel park to the electrical load.
The analysis reveals that the daily load fluctuations in steel enterprises generally remain below 10%, demonstrating typical industrial load characteristics. However, Figure 5d shows abnormal load fluctuations caused by annual equipment maintenance, a special operational condition that occurs only once per year on average.
The parameters related to operation costs are detailed in Table 2 and motor prices are detailed in Table 3, with data sources including official platforms such as China Energy Network. Unit area foundation construction cost and unit length framework construction cost were obtained through the cross-validation of on-site investigations and industry reports.

4.1.2. Parameter Settings

To provide a detailed introduction to the proposed RI-PSO algorithm and establish an effective comparison with other baseline algorithms, the parameter settings for all algorithms are presented in Table 4.

4.1.3. Mechanical Restraint Settings

To establish safety boundaries for SGES mechanical structures while accounting for material strength, structural stability, and foundation capacity constraints, system load calculations should be conducted to verify foundation strength. The commonly used engineering empirical parameters are detailed in Table 5 and Table 6.

4.2. Result Analysis

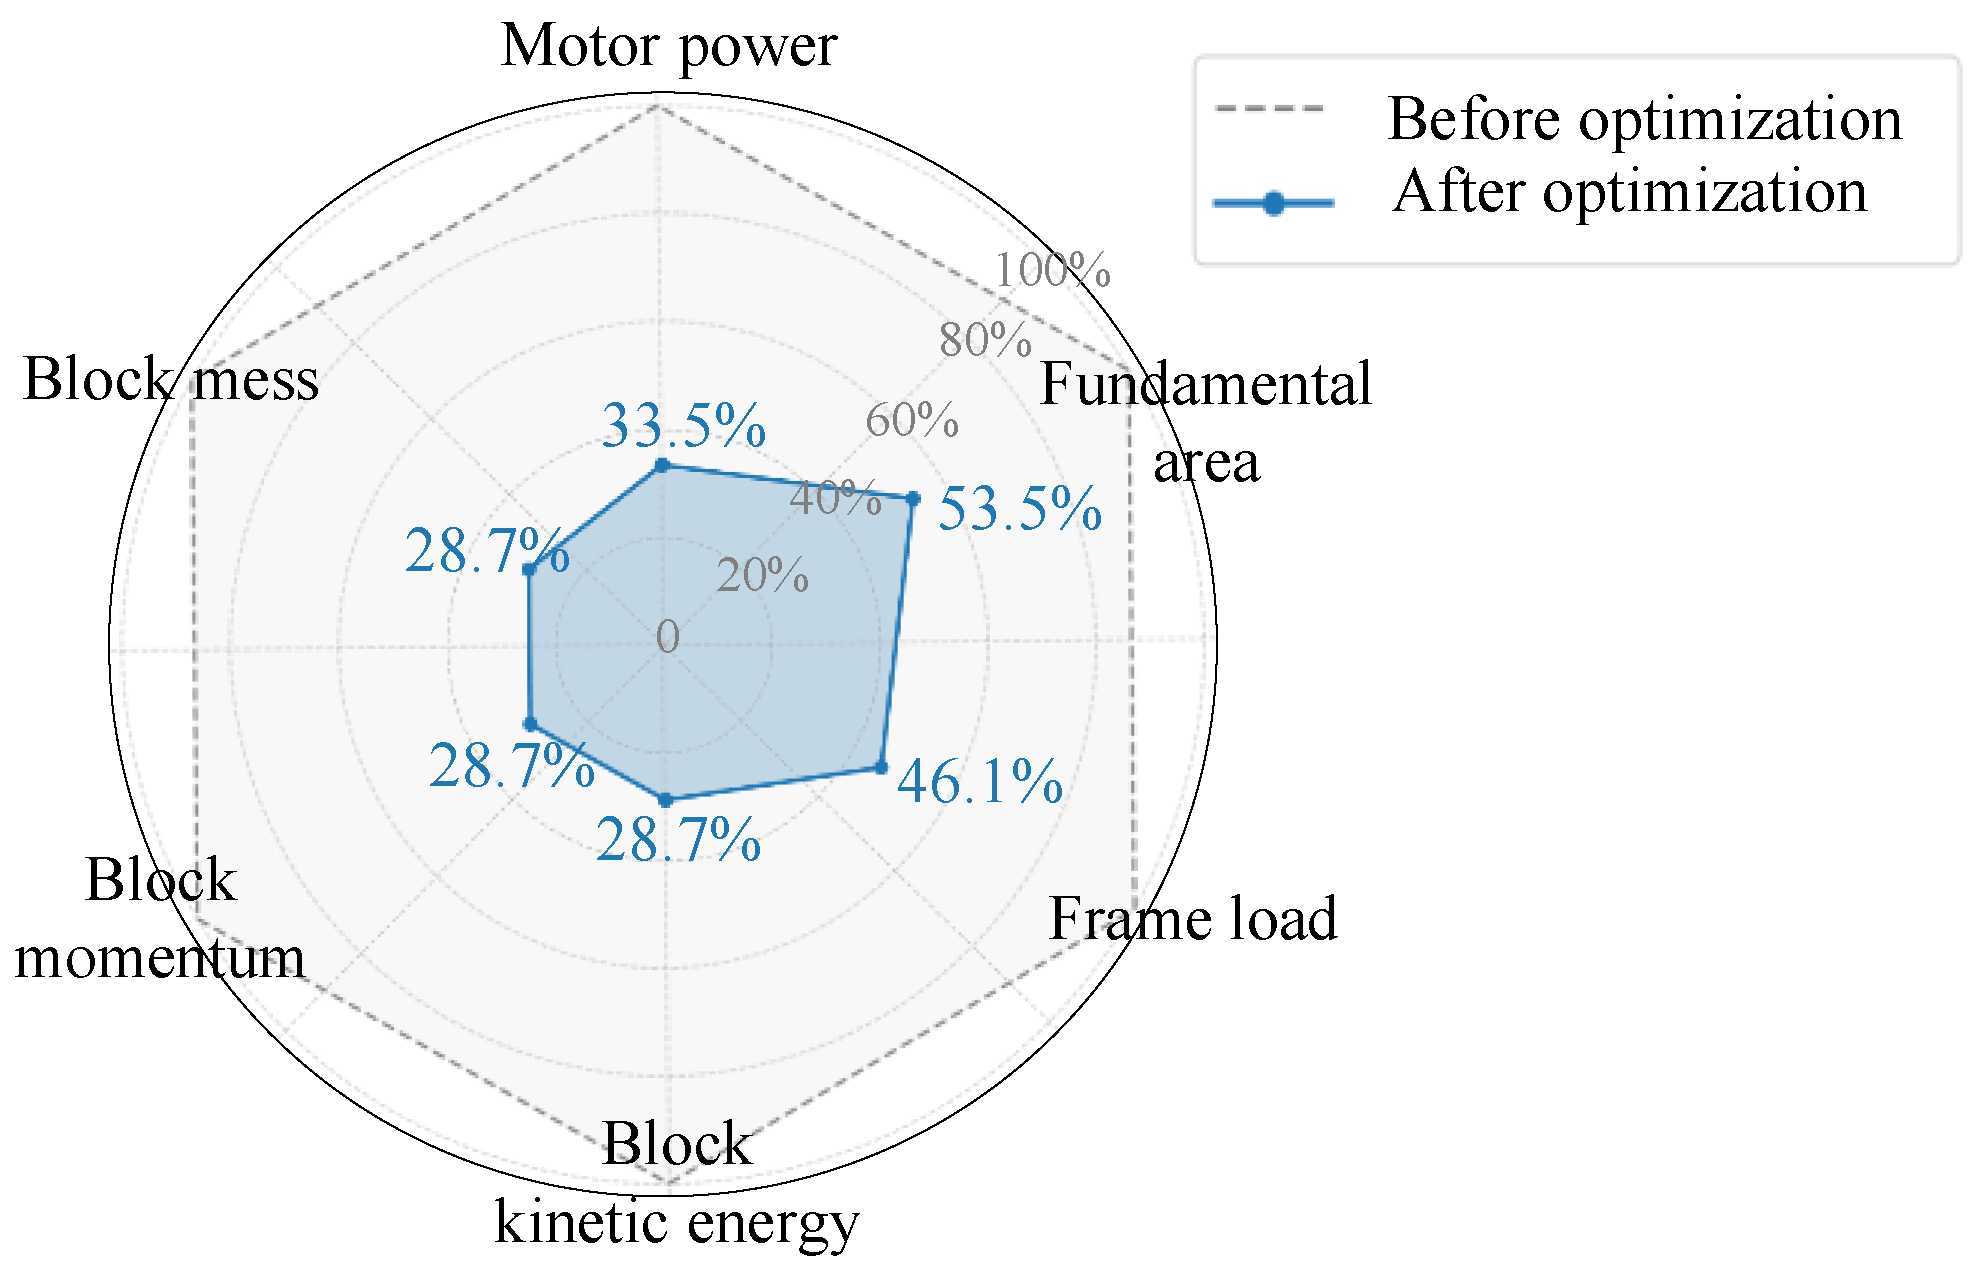
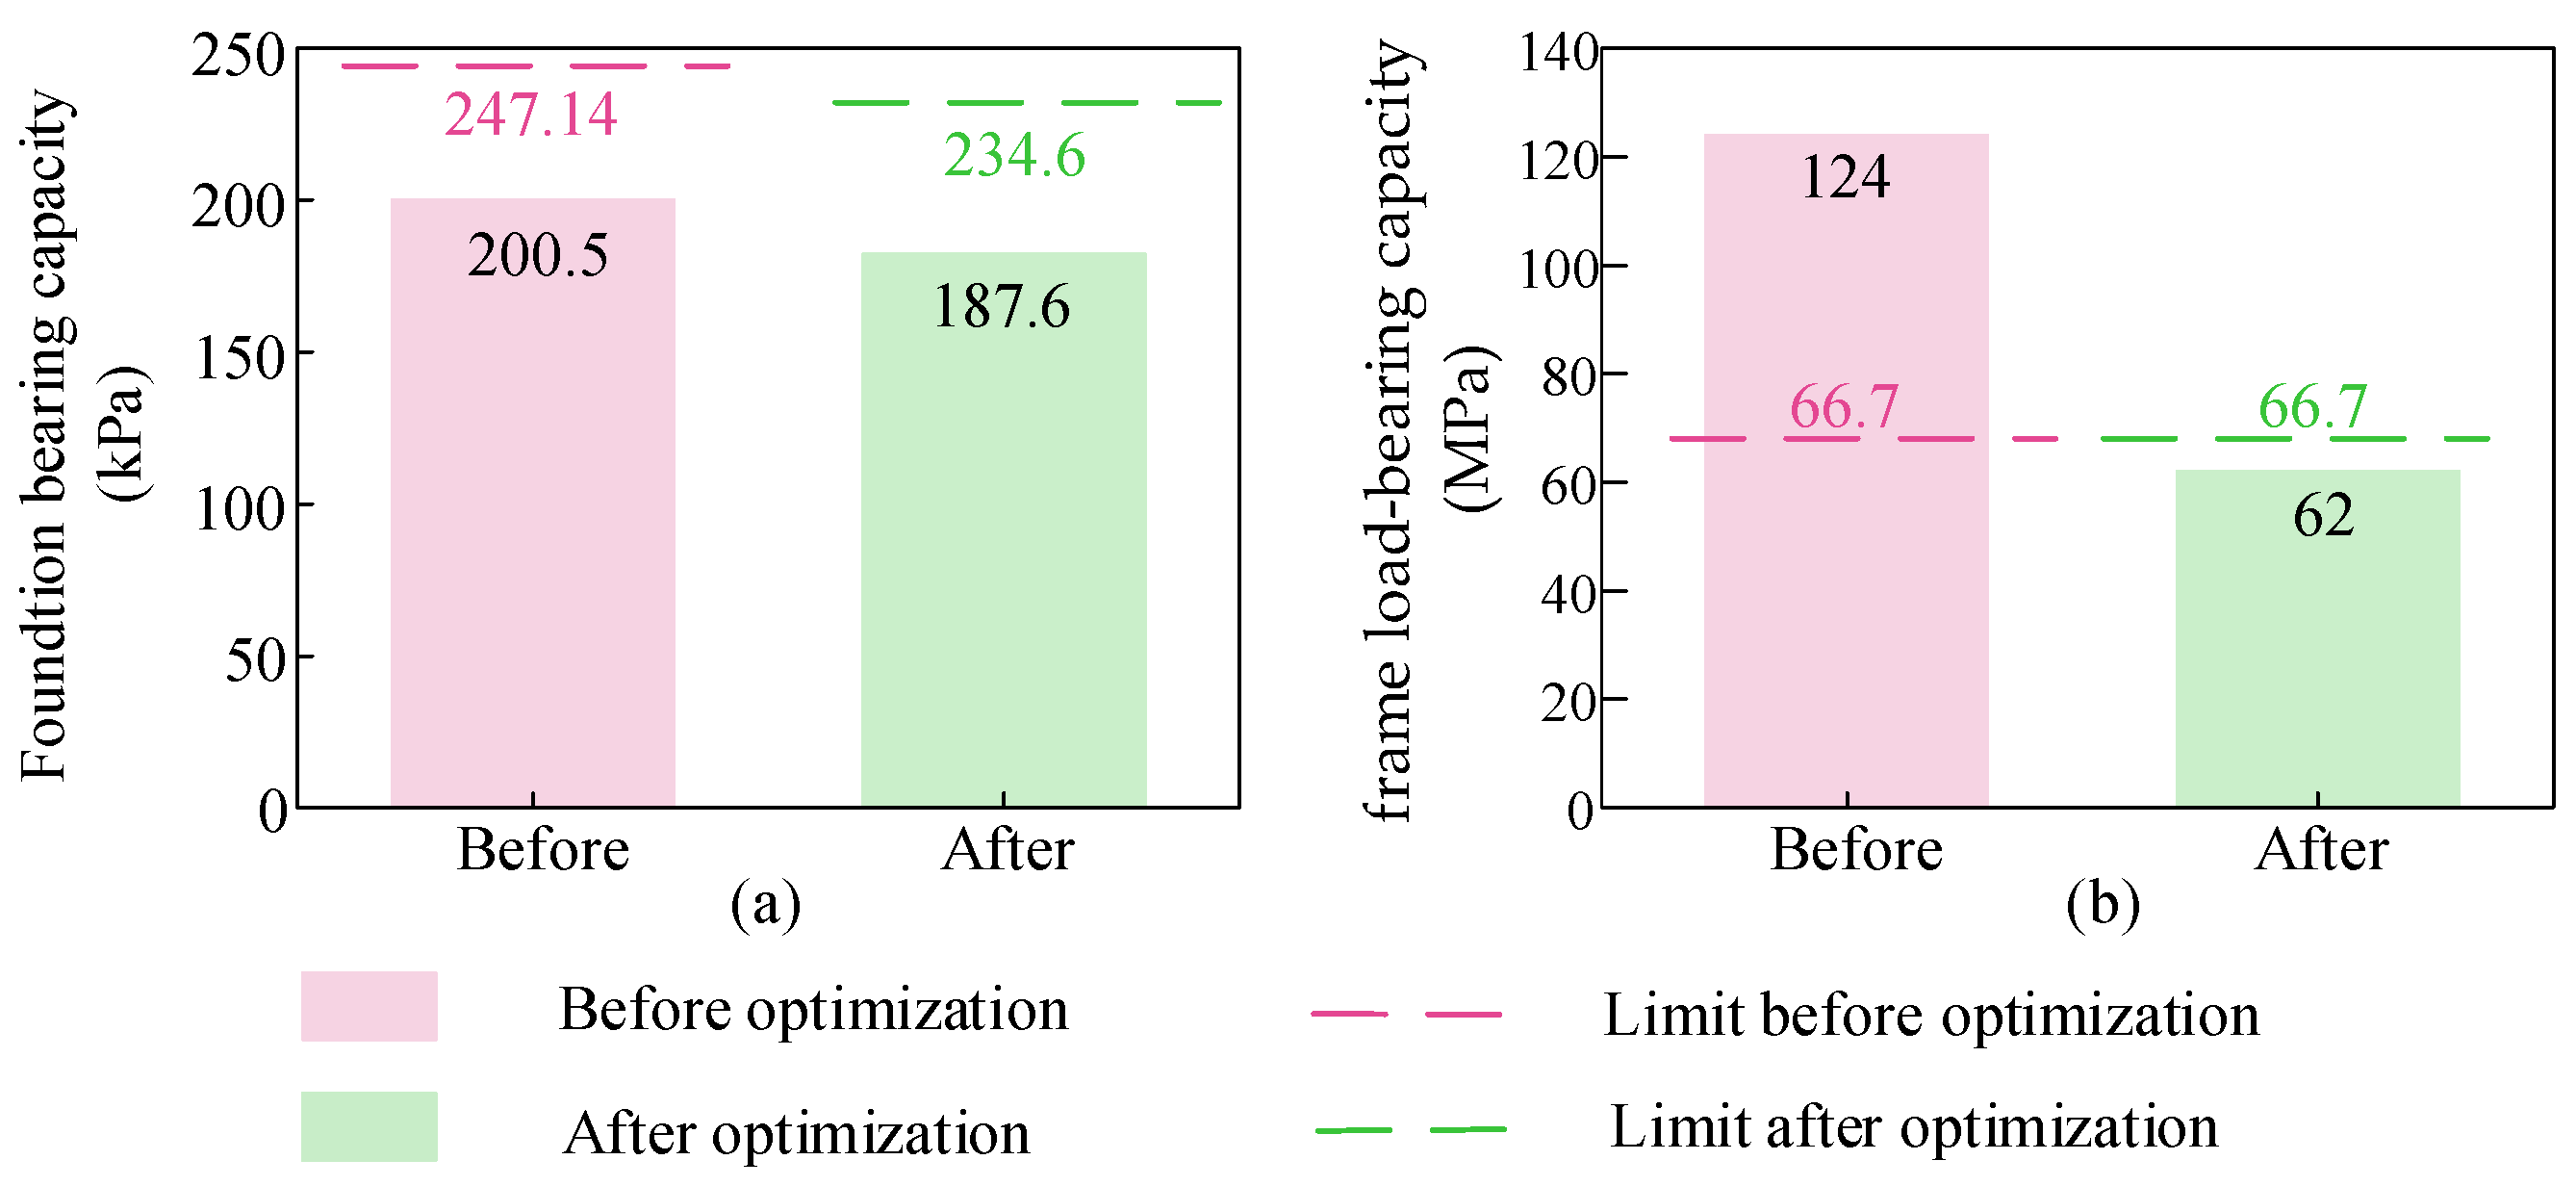
4.2.1. Mechanical Analysis of the Proposed SGES

In the first stage of planning, the SGES power and capacity is 2 MW/13.5 MWh. The second-stage structural optimization of the energy storage system is conducted based on the capacity and power calculation results obtained in the first stage.
The physical structural parameters of the SGES system before and after optimization are summarized in Table 7, including the number of energy storage towers within the system ( n T ), the frame dimensions of each tower ( a T , b T , c T ), the side length of the steel counterweights ( a M ), the total number of counterweights ( n W ), the rated power of the motors used ( P motor ), the total number of motors ( n M ), and the overall structural assembly cost ( F s t a g e   I I ).
The optimization results indicate that constructing two energy storage towers, each with a length, width, and height of 6 m, and accommodating 27 steel counterweights with a side length of 1.5 m per tower (a total of 54 counterweights) is the most cost-effective configuration. Each tower is equipped with three hoisting motors rated at 350 kW, totaling six motors. Compared with the pre-optimization configuration, this scheme reduces construction costs by 27.38%.
Equations (5)–(12) are used to calculate and verify whether the material strength, structural stability, and foundation strength satisfy the specified constraint conditions. At the same time, according to the basic physical motion formula, comparing the foundation area of a single tower, frame load, motor power, steel block mass, steel block momentum, as shown in Figure 6, it can be seen that the optimized structure shrinks in all indicators, has lower performance requirements and a higher comprehensive performance, and is suitable for steel parks with high safety requirements and limited space.
Figure 7 compares the foundation bearing capacity and frame bearing capacity of the two structural schemes before and after optimization. The dotted line represents the maximum value under this scheme. As can be seen in Figure 7a, the area of the foundation changes after structural optimization. Therefore, the limit and actual values of the foundation’s bearing capacity also change; the actual value after optimization reduces the pressure on the foundation and the bearing capacity margin of the foundation increases by 1.46%. As can be seen in Figure 7b, in the optimized system, compared to the non-optimized one, the volume of each steel block in the energy storage system changes. During the improvement process, the requirements for the bearing capacity of the framework also change. However, the size of the steel used to build the framework remains unchanged, so the limit value does not change. Before optimization, the system’s requirement for the framework’s bearing capacity exceeded the upper limit, which did not meet the actual engineering needs. After optimization, the system’s requirement drops below the limit value, ensuring the safety performance.

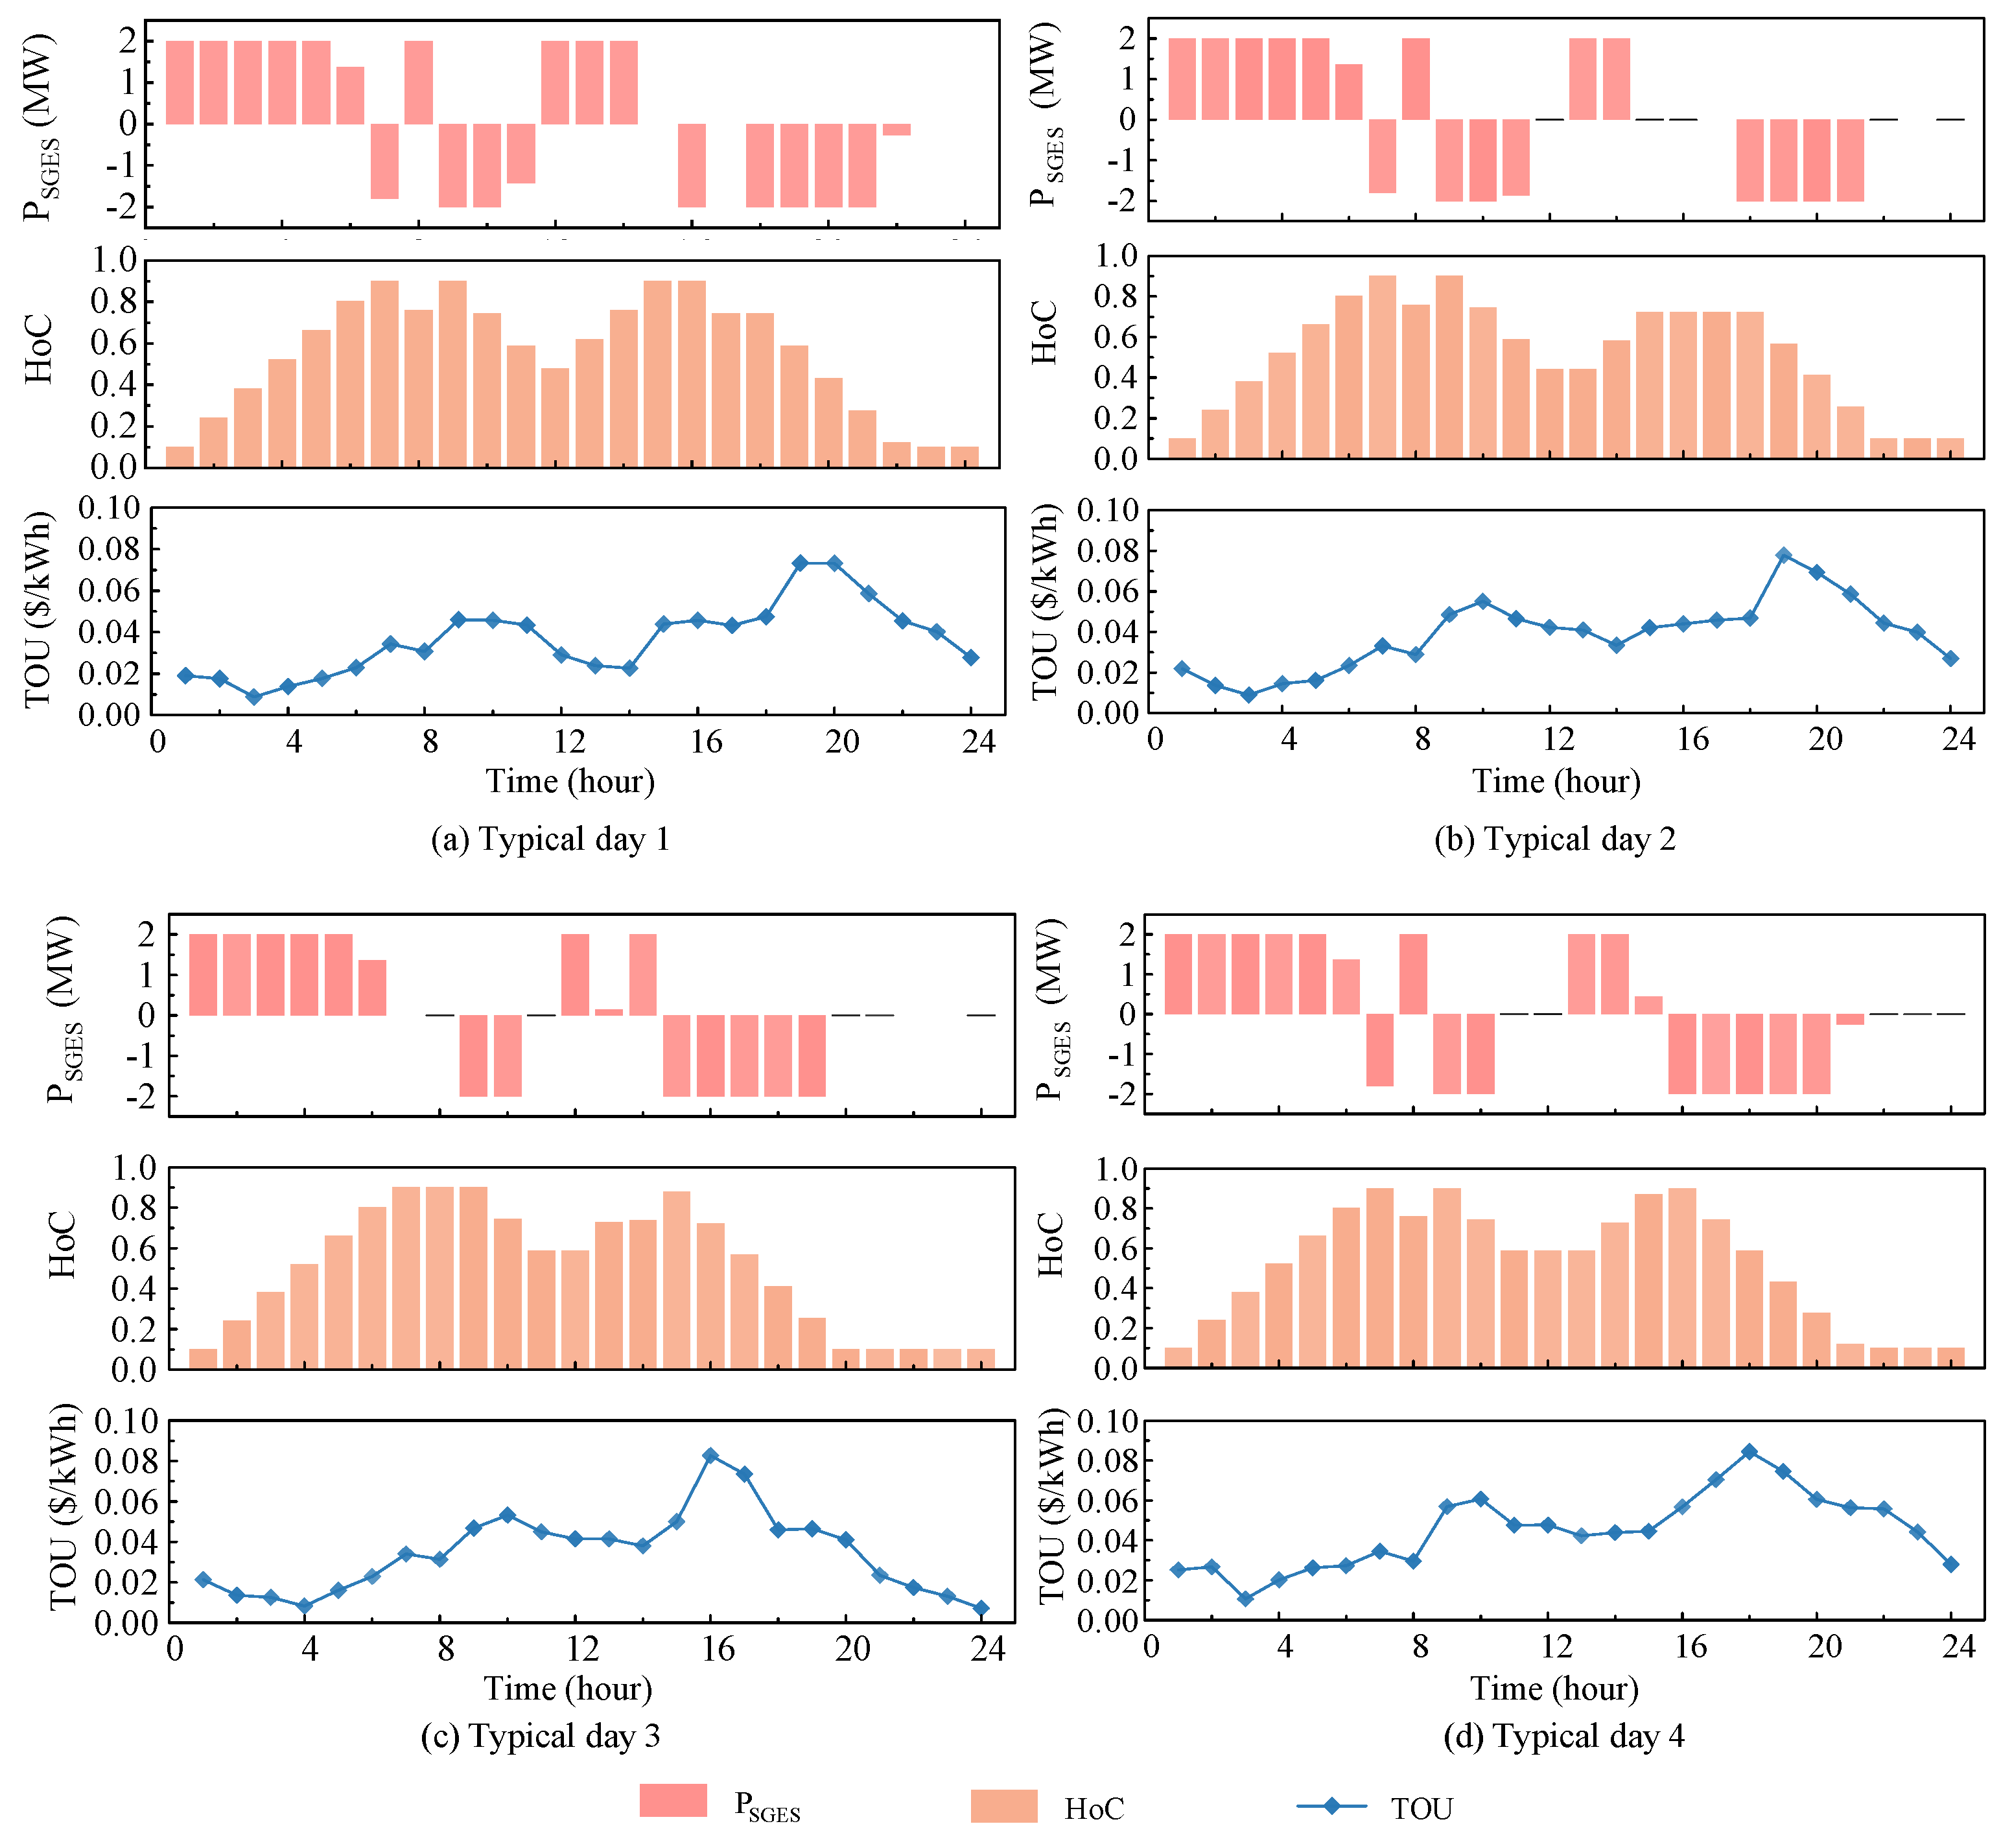
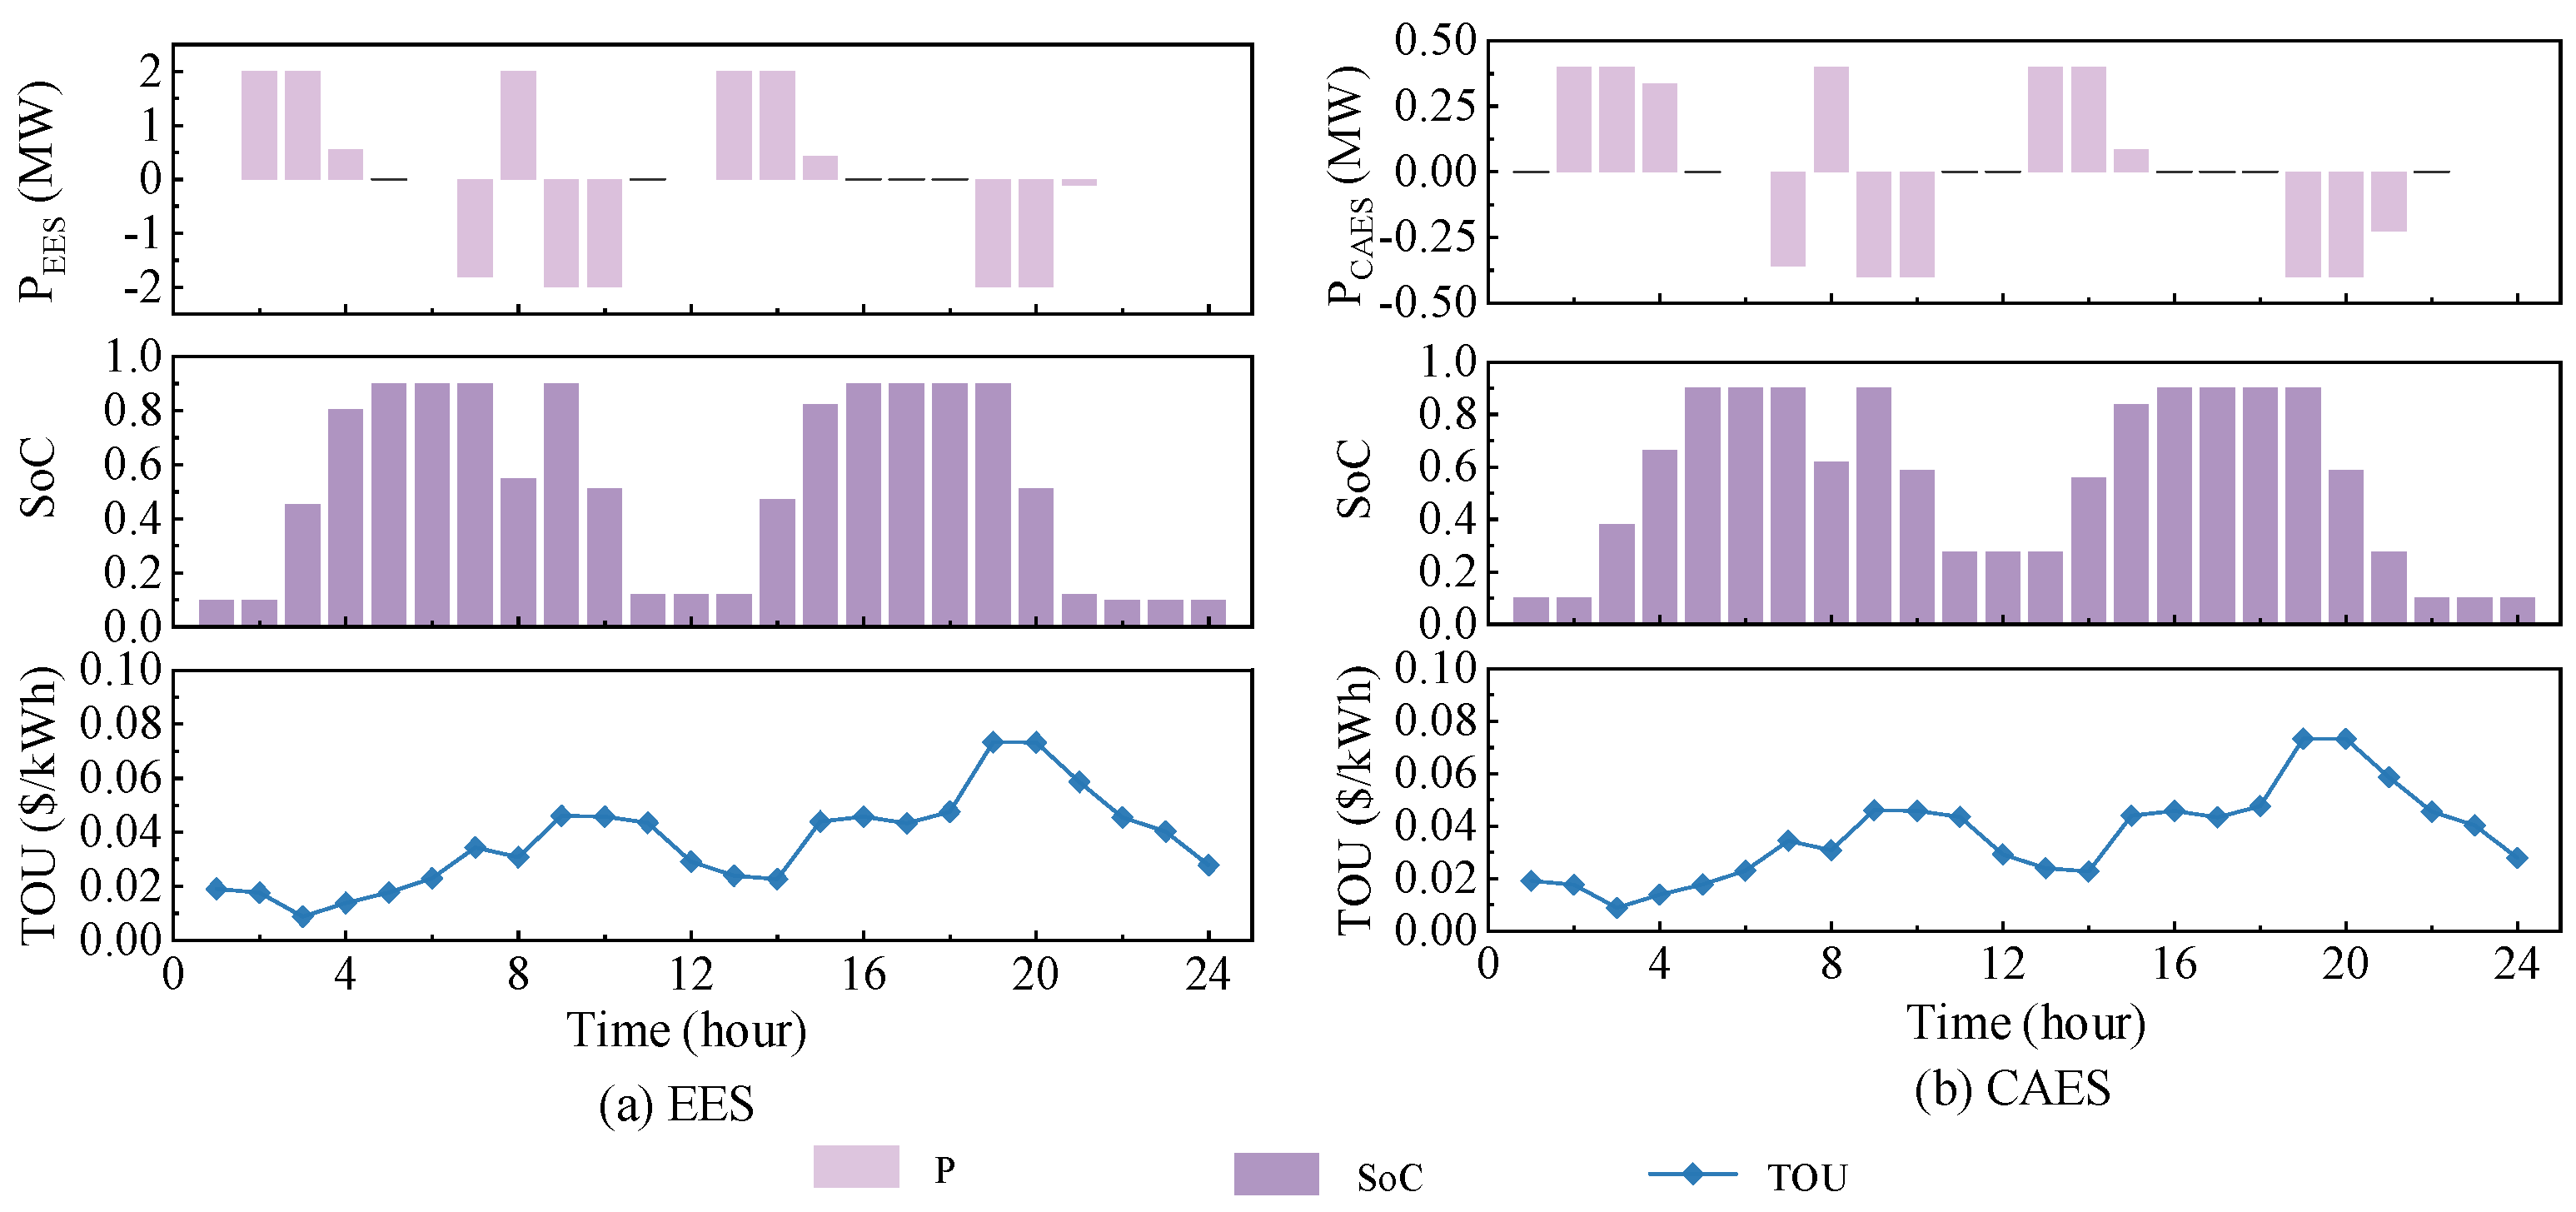
4.2.2. Economic Analysis of the Proposed SGES

This study compares the proposed SGES system with other typical energy storage types, including compressed air energy storage (CAES), electrochemical energy storage (EES), and hydroelectric pumped storage (HPS), in terms of the following three main aspects: total investment cost, equivalent daily investment cost, and service life [45,46,47,48].
Among them, all types of energy storage are evaluated based on the capacity and power determined by the first-stage optimization in conjunction with typical reference values. The structural configuration of the SGES system is defined according to the optimized parameters presented in Table 7 above. The results are shown in Figure 8.
The comparison results show that the total investment cost and equivalent daily investment cost of the proposed SGES system are comparable to those of HPS and significantly lower than those of CAES and EES. Moreover, due to its simple structure and the absence of complex chemical energy conversion, its service life is also significantly longer than that of CAES and EES. Although HPS demonstrates an optimal performance in both cost and service life, its geographical constraints limit its applicability. Since most high-energy-consuming enterprises are in plain areas and, to reduce environmental pollution, are situated away from large-scale water sources, pumped storage is hardly feasible as an independent energy storage station for high-energy-consuming enterprises. Considering the cost of steel billet counterweights, the construction cost of the proposed SGES system is approximately USD 1 million, representing a 59.7% reduction compared to EES of an equivalent capacity and a 90.11% reduction compared to CAES, demonstrating significant economic advantages. In the comparison, the investment cost, operating cost, foundation cost, and frame construction cost were all included. The reason for the significant disparity in the data is that the land and frame construction costs of CAES are excessively high. Large underground caves need to be constructed for container storage, exploration, and sealing treatment, which incurs extremely high costs; air compressor systems and high-temperature resistant systems are also very expensive [48].
Furthermore, by utilizing idle steel billets generated during the production processes of steel enterprises, the actual comprehensive cost can be further reduced.
Additionally, when compared to traditional concrete blocks, the use of steel for counterweight blocks achieves a 60% space-saving advantage due to its higher material density. The compact nature of steel enables an equivalent mass with a reduced volume, effectively minimizing spatial requirements. Furthermore, leveraging existing gantry crane infrastructure within steel manufacturing enterprises significantly reduces mobile lifting costs. These purpose-built heavy-load-handling systems eliminate the need for additional crane procurement and maintenance while avoiding new facility investments, thereby optimizing both spatial efficiency and capital allocation. This approach enhances resource utilization and delivers substantial cost-effectiveness throughout project execution.
This study conducts SGES dispatching based on the wind and solar power output and load fluctuation scenarios for the four typical days mentioned above, as shown in Figure 9. From the results, SGES can meet the mid-term and long-term dispatching needs due to its large energy storage capacity. Under the influence of time-of-use electricity prices (TOU), SGES exhibits the characteristics of two charges and two discharges in the day-ahead dispatching cycle, which matches the TOU fluctuation cycle and can minimize the electricity costs of enterprises. Specifically, SGES charges during renewable energy generation peaks and low-price valley periods (03:00–05:00), while discharging at max power during dual peak demand periods (09:00–11:00 and 17:00–20:00). This mode helps to take advantage of price differences by charging when the price is low and discharging when it is high, thereby saving costs.
After the calculation of power consumption and electricity price, the system achieves daily electricity cost savings of USD 470.1 through peak–valley arbitrage. Over its 35-year operational lifespan, it has potential arbitrage profits reaching USD 6.1 million. This fully demonstrates the economy and feasibility of deploying SGES in steel industrial parks.
To further demonstrate the dispatching advantages of the proposed SGES system in mid-term to long-term energy storage, this study conducts a comparative analysis of the scheduling results for different types of energy storage (e.g., EES and CAES) under the same investment cost conditions. The results are shown in Figure 10.
At an equivalent construction cost, the configuration of EES is approximately 2 MW/4 MWh, while that of CAES is about 0.45 MW/1.5 MWh [48]. The maximum continuous output duration for both energy storage systems is from around 2 to 3 h. In contrast, the SGES system exhibits a clear advantage in long-duration energy storage, with a continuous output capability of approximately 6 h. Under typical daily operating conditions, SGES achieves approximately 62.3% higher peak–valley arbitrage revenue compared to EES with the same construction cost. SGES also achieves approximately 158.9% higher revenue than that of compressed air energy storage.
The above results indicate that SGES exhibits a better performance in construction cost, continuous operating duration, and peak–valley arbitrage, demonstrating economic advantages for industrial applications.

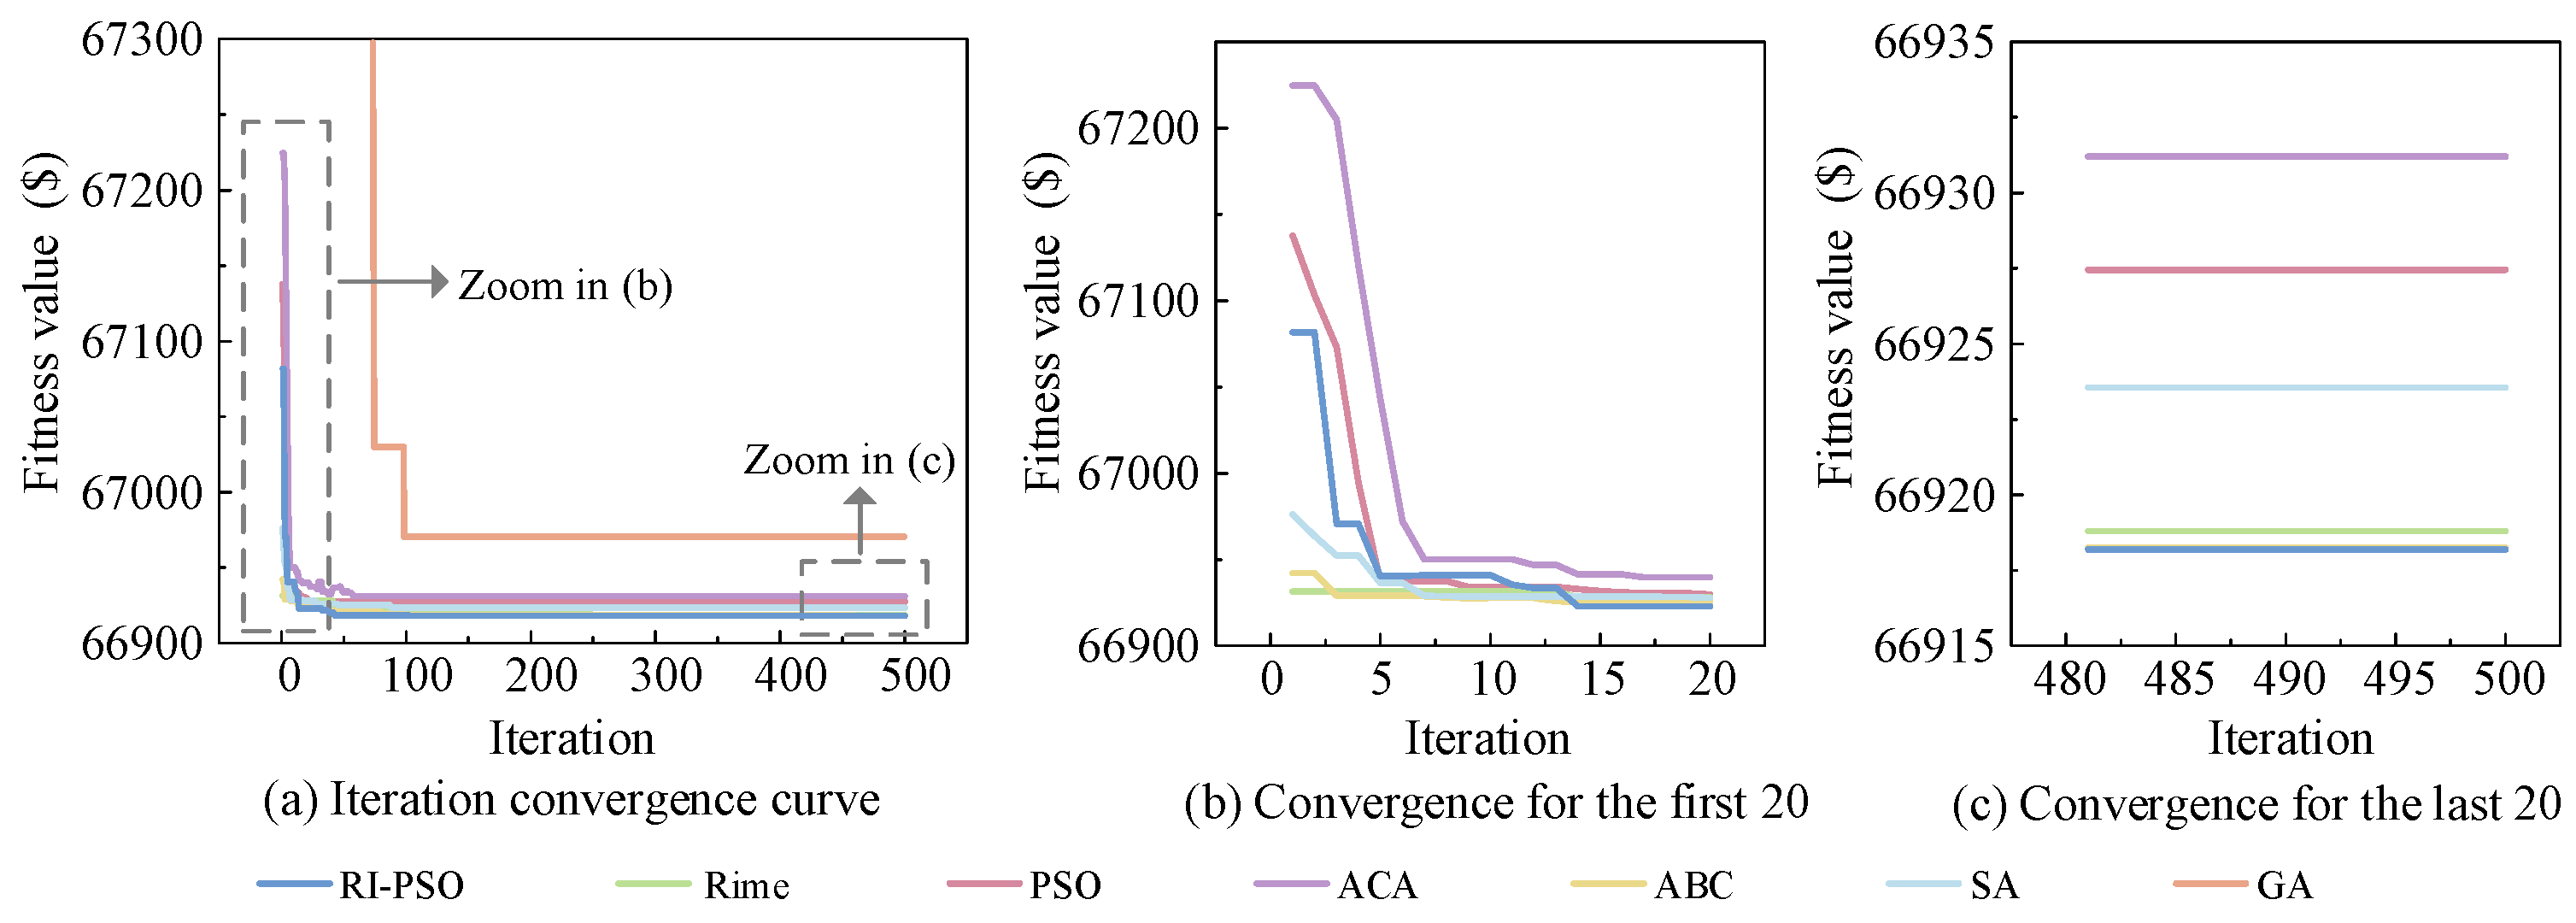
4.2.3. Superiority Analysis of the Proposed RI-PSO Algorithm

To demonstrate the superiority of the proposed RI-PSO algorithm, this study compared its convergence process with other meta-heuristic algorithms, including Rime, PSO, the ant colony algorithm (ACA), artificial bee colony (ABC), simulated annealing (SA), and the genetic algorithm (GA). The comparison results of RI-PSO with other algorithms are shown in Figure 11.
Compared with other algorithms, the convergence speed and accuracy of RI-PSO are improved. Among them, the fitness value of GA deviates too much from the other algorithms and its performance is poor, so it is not fully displayed in Figure 11.
Figure 11a displays the convergence trajectories of each algorithm over 500 iterations, while Figure 11b,c provide zoomed-in views of the convergence process during the initial 20 iterations and final 20 iterations, respectively. The experimental results demonstrate that the RI-PSO algorithm exhibits significant advantages in both convergence speed and convergence accuracy.
Specifically, the initial fitness value of RI-PSO lies between those of the PSO and Rime algorithms, which originates from its weighted fusion strategy for constructing the initial particles. During the early iteration phase, approximately the 15th generation, RI-PSO already demonstrates an outstanding optimization capability, with its fitness value decreasing by approximately 37.68% compared to the PSO algorithm, marking the initiation of its rapid convergence phase. In the latter optimization stage (150–500 generations), the convergence trajectory of RI-PSO shows distinct stable characteristics, with the final stabilized solution achieving the lowest fitness value, verifying the algorithm’s superiority in convergence stability.
In terms of convergence accuracy, RI-PSO outperforms Rime by 21.19%, PSO by 4.21%, ACA by 4.24%, and SA by 12.06%. In terms of convergence speed, RI-PSO outperforms Rime by 72.34%, ACA by 31.57%, ABC by 51.85%, SA by 15.21%, and GA by 60.21%. The experimental results show that it has significant advantages in both convergence speed and convergence accuracy.
The algorithm proposed in this study initially guides the population to quickly converge towards high-quality areas, and then uses PSO to fine-tune accuracy. Rime can quickly find a candidate set of relatively optimal solutions in the early iterations, importing the initial population into a high-quality search space, thereby improving the speed; when the population is already close to the global optimum, the speed update mechanism of PSO can meticulously track better solutions, avoiding the local accuracy bottleneck that Rime is prone to encounter when used alone. The combination of these two algorithms can more precisely control the proportion of global search and development, thereby improving accuracy.

4.2.4. Sensitivity Analysis of the Proposed Planning Model

The proposed capacity planning model encompasses both economic and structural optimization. Below, a sensitivity analysis is conducted on energy price fluctuations and structural wear. The specific parameters are as shown in Table 8 and Table 9.
As shown in Table 8, both the optimal power and capacity increase significantly with a greater electricity price volatility. This trend arises because the electricity procurement cost of the park is positively correlated with the electricity price, as indicated by Equation (19). When price fluctuations intensify, the system tends to select a higher power and capacity to better respond to these variations, thereby reducing energy costs—an outcome consistent with fundamental economic logic. Moreover, the sensitivity of capacity is higher than that of power, indicating that capacity is more responsive to energy price changes and more directly linked to overall energy consumption.
Operational maintenance expenditures ( C OM ) mainly relate to the wear and tear of the system structure and personnel maintenance costs in actual engineering projects.
As shown in Table 9, variations in the operating cost coefficient result in minimal changes to the optimal power and capacity, with fluctuations remaining within 1.5%, indicating a relatively minor impact. This suggests that operating cost is not a primary driver in the optimization decision-making process. While operating cost is positively correlated with the total cost, its proportion is relatively low.

4.3. Environmental Safety and Regulatory Considerations

Although SGES has demonstrated its economic potential by reusing idle steel blocks, its large-scale application still needs to address issues related to the environment, regulation, and occupational safety. The following provides a brief assessment framework, as shown in Table 10.
Future work should consider conducting further field validation of safety protocols and lobbying for regulatory sandboxes to accelerate deployment.

5. Conclusions

This study proposes a stacked SGES system tailored to the needs of the steel industry. A two-stage energy storage planning model is developed, considering economic and structural co-optimization, and is efficiently solved using the proposed RI-PSO algorithm.
Through the proposed two-stage energy storage capacity planning model, both the capacity and structural parameters of the energy storage system are optimized simultaneously. The simulation results demonstrate that the proposed SGES system can effectively meet the needs of steel industrial parks to reduce electricity costs and promote the integration of renewable energy. Compared with EES and CAES, the investment cost of the proposed stacked SGES system is only 59.7% and 90.11% of theirs, respectively. Notably, leveraging idle steel billets from steel enterprises as counterweights presents potential for further cost optimization. Furthermore, due to its capability to adapt to mid-term and long-term dispatching processes, the SGES system can accommodate more complex fluctuations in renewable energy generation and electricity pricing.
By leveraging the proposed RI-PSO meta-heuristic algorithm, rapid and effective solutions to the two-stage optimization problem are achieved. The comparative results indicate that, in terms of convergence accuracy, RI-PSO outperforms Rime by 21.19%, PSO by 4.21%, ACA by 4.24%, and SA by 12.06%; in terms of convergence speed, RI-PSO outperforms Rime by 72.34%, ACA by 31.57%, ABC by 51.85%, SA by 15.21%, and GA by 60.21%.
In the future, the motion process of stacked gravity energy storage systems can be studied to analyze how the dynamic stacking mechanism affects energy storage and release efficiency. This will further enhance the feasibility of practical applications.

6. Patents

  • Guo Y.; Sun Q.; Yu j. “A Method for Gravity Energy Storage Capacity Configuration Considering Renewable Energy Accommodation and Carbon Emission.” CN202411685619.0, 23 November 2024.
  • Yu J.; Guo Y.; Sun Q. “A Friendly Control Strategy for Steel Park Grid Considering Gravity Energy Storage of Steel Blocks.” CN202410627474.2, 21 May 2024.
  • Guo Y.; Xu W.; Yu J.; Wang Y.; Sun Q. “Grid Day-Ahead Scheduling Method, Device, Medium, and Product Based on Gravity Energy Storage.” CN202410442715.6, 12 April 2024.

Author Contributions

Conceptualization, Y.G.; methodology, Q.S.; writing—original draft preparation, Q.S.; writing—review and editing, Q.S.; supervision, W.X.; software, B.Z.; validation, Y.D.; investigation, Y.L. All authors have read and agreed to the published version of the manuscript.

Funding

This research was funded by the Science and Technology Project of the State Grid Fujian Electric Power Co., Ltd., grant number 52130N230011.

Data Availability Statement

The raw data supporting the conclusions of this article will be made available by the authors on request.

Conflicts of Interest

The authors declare that this study received funding from the State Grid Fujian Electric Power Co., Ltd. The funder was not involved in the study design, collection, analysis, interpretation of data, the writing of this article or the decision to submit it for publication.

Abbreviations

The following abbreviations are used in this manuscript:
GESGravity energy storage
SGESSteel-based gravity energy storage
RI-PSOA fusion of Rime and particle swarm optimization
PSOParticle swarm optimization
ECMWFLinear dichroism
CAESCompressed air energy storage
EESElectrochemical energy storage
HPSHydroelectric pumped storage

References

  1. Katerina, K.; Oreane, Y.; Wina, C.; Bas, J.; Detlef, P.; Ernst, W. Improving material projections in Integrated Assessment Models: The use of a stock-based versus a flow-based approach for the iron and steel industry. Energy 2022, 239, 122434. [Google Scholar]
  2. Wei, L.; Zhang, S.; Lu, C. Research on the driving factors and carbon emission reduction pathways of China’s iron and steel industry under the vision of carbon neutrality. J. Clean. Prod. 2022, 361, 132237. [Google Scholar]
  3. Zhu, T.; Liu, X.; Wang, X.; Bas, J.; Detlef, P.; Ernst, W. Technical Development and Prospect for Collaborative Reduction of Pollution and Carbon Emissions from Iron and Steel Industry in China. Engineering 2023, 31, 37–49. [Google Scholar] [CrossRef]
  4. Zhang, J.; Shen, J.; Xu, L.; Zhang, Q. The CO2 emission reduction path towards carbon neutrality in the Chinese steel industry: A review. Environ. Impact Assess. Rev. 2023, 99, 107017. [Google Scholar] [CrossRef]
  5. Xu, D.; Yuan, Z.; Bai, Z.; Zhang, Q. Optimal operation of geothermal-solar-wind renewables for community multi-energy supplies. Energy 2022, 249, 123672. [Google Scholar] [CrossRef]
  6. Aneke, M.; Wang, M. Energy storage technologies and real-life applications—A state of the art review. Appl. Energy 2016, 179, 350–377. [Google Scholar] [CrossRef]
  7. Wu, G.; Zeng, M.; Peng, L.; Liu, X.; Li, B.; Duan, J. China’s new energy development: Status, constraints and reforms. Renew. Sustain. Energy Rev. 2016, 53, 885–896. [Google Scholar]
  8. Wang, W.; Yuan, B.; Sun, Q.; Wennersten, R. Application of energy storage in integrated energy systems—A solution to fluctuation and uncertainty of renewable energy. J. Energy Storage 2022, 52, 104812. [Google Scholar] [CrossRef]
  9. Tan, K.; Babu, T.; Vigna, K. Empowering smart grid: A comprehensive review of energy storage technology and application with renewable energy integration. J. Energy Storage 2021, 39, 102591. [Google Scholar] [CrossRef]
  10. Carne, D.; Maroufi, S.; Beiranvand, H. The role of energy storage systems for a secure energy supply: A comprehensive review of system needs and technology solutions. Electr. Power Syst. Res. 2024, 236, 110963. [Google Scholar] [CrossRef]
  11. Zhao, L.; Li, Y.; Yu, M.; Peng, Y.; Ran, F. Electrolyte-Wettability Issues and Challenges of Electrode Materials in Electrochemical Energy Storage, Energy Conversion, and Beyond. Adv. Sci. 2023, 10, 2300283. [Google Scholar] [CrossRef] [PubMed]
  12. Chen, M.; Zhang, Y.; Xing, G.; Chou, S.; Tang, Y. Electrochemical energy storage devices working in extreme conditions. Energy Environ. Sci. 2021, 14, 3323–3351. [Google Scholar] [CrossRef]
  13. Zhang, C.; Yan, B.; Wieberdink, J.; Li, P.; Vandeven, J.; Loth, E.; Simon, T. Thermal analysis of a compressor for application to compressed air energy storage. Appl. Therm. Eng. 2024, 73, 1402–1411. [Google Scholar] [CrossRef]
  14. Budt, M.; Wolf, D.; Span, R.; Yan, J. A review on compressed air energy storage: Basic principles, past milestones and recent developments. Appl. Energy 2016, 170, 250–268. [Google Scholar] [CrossRef]
  15. Koohi-Fayegh, S.; Rosen, M. A review of energy storage types, applications and recent developments. J. Energy Storage 2020, 27, 101047. [Google Scholar] [CrossRef]
  16. Hua, W.; Lv, X.; Zhang, X.; Zhe, J.; Zhu, J. Research progress of seasonal thermal energy storage technology based on supercooled phase change materials. J. Energy Storage 2023, 67, 107378. [Google Scholar] [CrossRef]
  17. Wei, X.; Liu, D.; Shu, Y.; Chen, F.; Weng, J. Optimal sizing of energy storage in generation expansion planning of new power system with high penetration of renewable energies. Energy Rep. 2023, 9, 1938–1947. [Google Scholar] [CrossRef]
  18. Djamila, R. Energy Storage Systems for Photovoltaic and Wind Systems: A Review. Energies 2023, 16, 3893. [Google Scholar] [CrossRef]
  19. Matos, C.; Carneiro, J.; Silva, P. Overview of Large-Scale Underground Energy Storage Technologies for Integration of Renewable Energies and Criteria for Reservoir Identification. J. Energy Storage 2019, 21, 241–258. [Google Scholar] [CrossRef]
  20. Mahon, H.; O’Connor, D.; Friedrich, D.; Hughes, H. A review of thermal energy storage technologies for seasonal loops. Energy 2021, 239, 122207. [Google Scholar] [CrossRef]
  21. Tong, W.; Lu, Z.; Chen, W.; Han, X.; Zhao, G.; Wang, X.; Deng, Z. Solid gravity energy storage: A review. J. Energy Storage 2022, 53, 105226. [Google Scholar] [CrossRef]
  22. Li, F.; Xie, J.; Fan, Y.; Qiu, J. Potential of different forms of gravity energy storage. Sustain. Energy Technol. Assess. 2024, 64, 103728. [Google Scholar] [CrossRef]
  23. Mostafa, E.; Saber, A.; Ahmed, A.; Abd Elrahman, M.A. Parametric optimization for the design of gravity energy storage system using Taguchi method. Sci. Rep. 2022, 12, 19648. [Google Scholar]
  24. Chen, Q.; Guo, Y.; Wang, T. Research Status and Development Trend of Gravity Energy Storage Technology. IEEE Access 2024, 1169, 474–481. [Google Scholar]
  25. Morstyn, T.; Chilcott, M.; McCulloch, M. Gravity energy storage with suspended weights for abandoned mineshafts. Appl. Energy 2019, 239, 201–206. [Google Scholar] [CrossRef]
  26. Li, X.; Zhu, C.; Liu, Y. Traction power supply system of China high-speed railway under low-carbon target: Form evolution and operation control. Electr. Power Syst. Res. 2023, 223, 109682. [Google Scholar] [CrossRef]
  27. Yuan, J.; Peng, L.; Zhou, h.; Gan, D.; Qu, K. Recent research progress and application of energy storage system in electrified railway. Electr. Power Syst. Res. 2024, 226, 109893. [Google Scholar] [CrossRef]
  28. Berrada, A.; Loudiyi, K.; Zorkani, I. System design and economic performance of gravity energy storage. J. Clean. Prod. 2017, 156, 317–326. [Google Scholar] [CrossRef]
  29. Wang, R.; Li, M.; Ming, M.; Wu, G.; Wang, L. An efficient multi-objective model and algorithm for sizing a stand-alone hybrid renewable energy system. Energy 2017, 141, 2288–2299. [Google Scholar] [CrossRef]
  30. He, X.; Ge, S.; Liu, H.; Xu, Z.; Yang, M.; Wang, C. Frequency regulation of multi-microgrid with shared energy storage based on deep reinforcement learning. Electr. Power Syst. Res. 2022, 214, 108962. [Google Scholar] [CrossRef]
  31. Li, K.; Zhang, T.; Wang, R. Deep reinforcement learning-based multi-objective optimization for electricity–gas–heat integrated energy systems. Expert Syst. Appl. 2025, 262, 125558. [Google Scholar] [CrossRef]
  32. Liu, Z.; Wu, J.; Zhu, R.; Kong, D.; Guo, H. Double layers optimal scheduling of distribution networks and photovoltaic charging and storage station cluster based on leader follower game theory. Sci. Rep. 2025, 15, 612. [Google Scholar] [CrossRef] [PubMed]
  33. Dufo-López, R.; Bernal-Agustín, J.; Yusta-Loyo, J.; Domínguez-Navarro, J.; Ramírez-Rosado, R.; Lujano, J.; Aso, I. Multi-objective optimization minimizing cost and life cycle emissions of stand-alone PV–wind–diesel systems with batteries storage. Appl. Energy 2011, 88, 4033–4041. [Google Scholar] [CrossRef]
  34. Gao, Y.; Liu, J.; Yang, J.; Liang, H.; Zhang, J. Multi-objective planning of multi-type distributed generation considering timing characteristics and environmental benefits. Energies 2014, 7, 6242–6257. [Google Scholar] [CrossRef]
  35. Jülch, V. Comparison of electricity storage options using levelized cost of storage (LCOS) method. Appl. Energy 2016, 183, 1594–1606. [Google Scholar] [CrossRef]
  36. Ilja, P. The Cost of Storage—How to Calculate the Levelized Cost of Stored Energy (LCOE) and Applications to Renewable Energy Generation. Energy Procedia 2014, 46, 68–77. [Google Scholar]
  37. Zhou, Z.; Ma, Z.; Mu, T. Hybrid energy storage capacity optimization based on VMD-SG and improved Firehawk optimization. Electr. Power Syst. Res. 2024, 139, 111218. [Google Scholar] [CrossRef]
  38. Hunt, J.; Zakeri, B.; Falchetta, G.; Nascimento, A.; Wada, Y.; Riahi, K. Mountain gravity energy storage: A new solution for closing the gap between existing short and long-term storage technologies. Energy 2019, 190, 116419. [Google Scholar] [CrossRef]
  39. Hou, H.; Xu, T.; Wu, X.; Wang, H.; Tang, A.; Chen, Y. Optimal capacity configuration of the wind-photovoltaic-storage hybrid power system based on gravity energy storage system. Appl. Energy 2020, 271, 115052. [Google Scholar] [CrossRef]
  40. Kim, J.; Benjamin, K.; Bazilian, M.; Wang, H.; Tang, A.; Chen, Y. Decarbonizing the iron and steel industry: A systematic review of sociotechnical systems, technological innovations, and policy options. Energy Res. Soc. Sci. 2022, 89, 102565. [Google Scholar] [CrossRef]
  41. Sun, W.; Wen, Q.; Zhou, Y. Material and energy flows of the iron and steel industry: Status quo, challenges and perspectives. Appl. Energy 2020, 268, 114946. [Google Scholar] [CrossRef]
  42. Inayat, A. Current progress of process integration for waste heat recovery in steel and iron industries. Fuel 2022, 338, 127237. [Google Scholar] [CrossRef]
  43. Liu, D.; Wang, P.; Sun, Y. Co-abatement of carbon and air pollutants emission in China’s iron and steel industry under carbon neutrality scenarios. Renew. Sustain. Energy Rev. 2024, 191, 114140. [Google Scholar] [CrossRef]
  44. Su, H.; Zhao, D.; Heidari, A.; Liu, L.; Zhang, X.; Mafarja, M.; Chen, H. RIME: A physical-based optimization. Neurocomputing 2023, 532, 183–214. [Google Scholar] [CrossRef]
  45. He, W.; King, M.; Luo, X.; Dooner, M.; Li, D.; Wang, J. Technologies and economics of electric energy storage in power systems: Review and perspective. Adv. Appl. Energy 2021, 4, 100060. [Google Scholar] [CrossRef]
  46. Zakeri, B.; Syri, S. Electrical energy storage systems: A comparative life cycle cost analysis. Renew. Sustain. Energy Rev. 2015, 42, 569–596. [Google Scholar] [CrossRef]
  47. 2023 Levelized Cost of Energy. Available online: https://www.lazard.com/research-insights/2023-levelized-cost-of-energyplus/ (accessed on 2 October 2023).
  48. Emrani, A.; Berrada, A.; Bakhouya, M. Optimal sizing and deployment of gravity energy storage system in hybrid PV-Wind power plant. Renew. Energy 2022, 183, 12–17. [Google Scholar] [CrossRef]
Figure 1. Schematic diagram of the energy flow relationships.
Processes 13 01922 g001
Figure 2. The structure diagram of SGES.
Processes 13 01922 g002
Figure 3. The two-stage planning approach to stacked SGES.
Processes 13 01922 g003
Figure 4. The flow chart of the proposed RI-PSO hybrid search strategy.
Processes 13 01922 g004
Figure 5. Four typical days of renewable energy generation and load conditions.
Processes 13 01922 g005
Figure 6. Comparison of the physical characteristics of the system before and after optimization.
Processes 13 01922 g006
Figure 7. Comparison of the safety characteristics of the system before and after optimization.
Processes 13 01922 g007
Figure 8. Comparison of various prices and service lives of different energy storages.
Processes 13 01922 g008
Figure 9. SGES operating conditions for four typical days.
Processes 13 01922 g009
Figure 10. Operating curves of other energy storage systems at the same cost.
Processes 13 01922 g010
Figure 11. Convergence comparison chart of RI-PSO with other algorithms.
Processes 13 01922 g011
Table 1. Comparison of different types for GES [21,22,23,24,25,28].
Type of GESCharacteristics
StakingStacked heavy objects do not require additional storage platforms and can be deployed within a smaller space.
Suspension towerStores gravitational potential energy using lifting equipment and a platform.
Mine shaftUtilizing existing mine shafts to provide a height difference for gravitational energy storage.
PistonUsing pistons with extremely high mechanical strength and sealing levels to store gravitational energy.
Cable carIn steep terrain, the gravitational potential energy is transferred using cable cars.
Mine carIn steep terrain, the gravitational potential energy is transferred using mine cars.
Table 2. Values of certain parameters in SGES.
Investment
Type
C capacity
USD/kWh
C P max
USD/kWh
C OM
USD/kWh
k 1
USD/m2
k 2
USD/m
Cost
Fator
583.3166.7166.7138.983.3
Table 3. Motor prices for different power levels.
Power (MW)0.10.20.30.512
Price (USD)472.2986.11388.94569.48472.2138,888.9
Table 4. Parameter settings of algorithms.
AlgorithmsParametersValue
PSO c 1 0.5
c 2 0.5
v max 100
Rime w 20
RI-PSO c min 0.5
c max 2.5
ω min 0.01
ω max 0.9
v max 100
w 20
κ 1 0.6
κ 2 0.4
Common
parameters
Dimensions2
Population size30
Max number of iterations500
Table 5. Parameter settings of material strength.
F max τ yield h b n s a f e t y * υ E moi k  *
980,700 N200 MPa110 mm220 mm31 m/s210 MPa1.5
* These data are dimensionless.
Table 6. Parameter settings of foundation.
f a η b * η d * γ γ m Δ a Δ b
150 kPa0.31.519 kN/m218 kN/m23 m0.3 m
* These data are dimensionless.
Table 7. Results of the two-stage planning model.
Type n T * a T , b T , c T a M n W * P motor n M * F stage II
Before
optimization
18.4 m2.8 m81000 kW2USD 40,047
After
optimization
26 m1.5 m54350 kW6USD 30,541
* These data are dimensionless.
Table 8. System parameter variations with energy price.
0.6 C E 0.8 C E C E 1.2 C E 1.4 C E
E SGES   ( MWh ) 3.779.8513.5017.2120.00
P SGES   ( MWh ) 0.901.422.002.482.88
Table 9. System parameter variations with operational maintenance expenditures.
0.6 C OM 0.8 C OM C OM 1.2 C OM 1.4 C OM
E SGES   ( MWh ) 13.6913.5113.5013.5113.49
P SGES   ( MW ) 2.031.992.001.991.99
Table 10. Assessment framework of environmental, safety, and regulatory considerations.
TypeContent
Environmental implicationsEnergy consumption: Electrified hoisting machinery may increase local grid load.
Noise pollution: The operation of the crane will generate noise, and when deploying it, it is necessary to keep it away from residential areas.
Land footprint: The foundation may disrupt the ecological balance of the soil.
Occupational safety and riskStructural collapse and worker–machine collision: It is necessary to strengthen equipment supervision, comply with national standards, and consider deploying high-level automated equipment.
Regulation complianceSafety-by-design integration: The idle steel blocks must comply with the national steel management requirements and must not contain contaminated materials.
Policy advocacy: Land use must also conform to the regulations regarding the bearing capacity of dynamic loads as stipulated by the Chinese authorities.
Disclaimer/Publisher’s Note: The statements, opinions and data contained in all publications are solely those of the individual author(s) and contributor(s) and not of MDPI and/or the editor(s). MDPI and/or the editor(s) disclaim responsibility for any injury to people or property resulting from any ideas, methods, instructions or products referred to in the content.

