Article

Controls on the Hydrocarbon Production in Shale Gas Condensate Reservoirs of Rift Lake Basins

1
State Key Laboratory of Shale Oil and Gas Enrichment Mechanisms and Effective Development, Beijing 100083, China
2
Oil and Gas Survey, China Geological Survey, Beijing 100083, China
3
Xinjiang Yaxin Coalbed Methane Investment and Development (Group) Co., Ltd., Urumchi 830000, China
4
Department of Earth, Ocean and Ecological Sciences, University of Liverpool, Liverpool L69 3GP, UK
*
Authors to whom correspondence should be addressed.
Processes 2025, 13(6), 1868; https://doi.org/10.3390/pr13061868
Submission received: 8 April 2025 / Revised: 6 June 2025 / Accepted: 7 June 2025 / Published: 13 June 2025
(This article belongs to the Special Issue Recent Advances in Hydrocarbon Production Processes from Geoenergy)

Abstract

The production of gas and condensate from liquid-rich shale reservoirs, particularly within heterogeneous lacustrine systems, remains a critical challenge in unconventional hydrocarbon exploration due to intricate multiphase hydrocarbon partitioning, including gases (C1–C2), volatile liquids (C3–C7), and heavier liquids (C7+). This study investigates a 120-meter-thick interval dominated by lacustrine deposits from the Lower Cretaceous Shahezi Formation (K1sh) in the Songliao Basin. This interval, characterized by high clay mineral content and silicate–pyrite laminations, was examined to identify the factors controlling hybrid shale gas condensate systems. We proposed the Hybrid Shale Condensate Index (HSCI), defined as the molar ratios of (C1–C7)/C7+, to categorize fluid phases and address shortcomings in traditional GOR/API ratios. Over 1000 samples were treated by geochemical pyrolysis logging, X-ray fluorescence (XRF) spectrum element logging, SEM-based automated mineralogy, and in situ gas desorption, revealing four primary controls: (1) Thermal maturity thresholds. Mature to highly mature shales exhibit peak condensate production and the highest total gas content (TGC), with maximum gaseous and liquid hydrocarbons at Tmax = 490 °C. (2) Lithofacies assemblage. Argillaceous shales rich in mixed carbonate and clay minerals exhibit an intergranular porosity of 4.8 ± 1.2% and store 83 ± 7% of gas in intercrystalline pore spaces. (3) Paleoenvironmental settings. Conditions such as humid climate, saline water geochemistry, anoxic bottom waters, and significant input of volcanic materials promoted organic carbon accumulation (TOC reaching up to 5.2 wt%) and the preservation of organic-rich lamination. (4) Laminae and fracture systems. Silicate laminae account for 78% of total pore space, and pyrite laminations form interconnected pore networks conducive to gas storage. These findings delineate the “sweet spots” for unconventional hydrocarbon reservoirs, thereby enhancing exploration for gas condensate in lacustrine shale systems.

1. Introduction

Hybrid condensates require refining processes to eliminate higher-boiling-point hydrocarbon fractions (>CH4). Upon isolation, these residual hydrocarbons undergo liquefaction, yielding natural gas condensate [1]. Such reservoirs exhibit complex thermodynamic responses marked by sub-dew-point pressures that drive condensate precipitation and compositional alteration of reservoir gases [2,3]. Contemporary classification frameworks categorize hybrid shale gas condensate resources into two distinct groups: liquid-lean and liquid-rich systems. Both groups predominantly comprise C1–C33 n-alkanes, with the C1–C7 fraction persisting in gaseous states under reservoir conditions [4]. Volatile light hydrocarbons (C3–C7) critically control the generation of liquid-lean condensate through phase partition processes [2,3,5,6,7].
Recent exploration efforts in continental basins have exposed critical knowledge gaps in characterizing shale gas condensate reservoirs. The interplay between elevated clay mineral content and heterogeneous organic inputs introduces substantial uncertainties in hydrocarbon distribution patterns [8,9,10,11]. Hybrid shale gas condensate systems in continental basins represent a critical frontier in unconventional hydrocarbon exploration, given the complexity of multiphase fluid behaviors (gas, volatile liquids, and condensate) with the challenges of heterogeneous lithofacies and diagenetic alterations. While marine shale systems (e.g., Bossier and Haynesville shales) have been extensively studied [12,13], lacustrine systems, particularly those characterized by high clay mineral contents and strong inputs of volcanogenic materials, remain underexplored. Recent advances highlight the role of lamina architectures in enhancing hydrocarbon storage and connectivity [14], the influences of bottom-water redox conditions on organic matter preservation [15], and the development of novel indices to quantify phase partitioning [16]. However, key questions persist regarding the combined effects of volcanic inputs, salinity fluctuations, and laminae-induced fractures in controlling hybrid condensate “sweet spots” within lacustrine shales.
Overall, two principal challenges have been identified in reservoir evaluation:
  • Hydrocarbon phase dynamics. Drilling-induced perturbations of pressure and temperature tend to trigger phase transitions, particularly when reservoir pressures decline below dew-point thresholds near wellbores [17,18,19]. Differential retention mechanisms further complicate the associated analysis. C1–C2 alkanes demonstrate sluggish diffusion kinetics, while volatile light hydrocarbons (C3–C7) and liquid-phase components (C7+) persist in metastable configurations within fracture networks and matrix porosity [6,20,21]. These phenomena limit the efficacy of conventional C1–C7 advanced mud gas logging for quantitative hydrocarbon assessment.
  • Lacustrine reservoir heterogeneity. Compared to marine shales, lacustrine systems exhibit amplified variability of lithofacies due to abrupt facies changes [22,23], multiscale beddings [24], and lamina-induced fracture systems [25,26,27] that induce strong anisotropic hydrocarbon distribution and condensate productivity [28,29,30,31]. Additional complexity stems from dynamic phase behavior modulated by thermal maturity gradients, in situ P-T conditions, and near-wellbore condensate banking effects [29,31,32]. Consequently, these factors impede the reliable identification of hydrocarbon sweet spots in continental shale reservoirs.
The China Geological Survey implemented a multidisciplinary exploration project of continental shale gas resources based on the Cretaceous Shahezi Formation (K1sh) within the Songliao Basin (JLYY1 borehole, Figure 1). A 120-meter-thick, lacustrine-dominated interval at >3000 m depth was analyzed through an integrated analytical protocol.
  • High-resolution geochemical profile via systematic sampling and measurement at a 0.5 to 1 m interval (more than 1000 samples) employing multiple methods such as geochemical logging, in situ gas desorption, and electron microscopic mineralogy.
  • Phase-specific hydrocarbon characterization using S1 (C7–C33) parameters and total gas content (TGC), with speciation of gaseous (C1–C2) versus volatile (C3–C7) components.
  • Lithofacies discrimination through the correlation of total organic carbon content (TOC) and mineral composition, augmented by elemental proxies for paleoenvironmental reconstruction.
  • Nanoscale rock fabric analysis utilizing ultra-high-resolution scanning electron microscopes (SEMs) to detect the occurrence of organic matter and mineral particles, elemental migration pathways, and hydrocarbon–bitumen associations.
  • Phase behavior modeling via a proxy termed Hybrid Shale Condensate Index (HSCI), incorporating Tmax values to map maturity-controlled phase distributions across C1–C33 hydrocarbons.
  • Multivariate statistical integration of HSCI, S1, TGC, Tmax, TOC, and rock compositional datasets to delineate dominant hydrocarbon distribution controls.
Currently available methods for the evaluation of hybrid shale gas condensate systems, e.g., GOR/API classifications (GOR: gas-to-oil production ratio; API: American Petroleum Institute gravity), struggle to capture multiphase fluid behavior in lacustrine systems due to their dependence on surface fluid properties. This study addresses this gap by proposing the Hybrid Shale Condensate Index (HSCI), which integrates in situ gaseous (TGC) and liquid (S1) components to quantify fluid-phase maturity for complex unconventional reservoirs rich in clay minerals. This approach uses S1 and TGC as robust proxies for liquid and volatile hydrocarbon phases, respectively, while providing a systematic framework to decipher hydrocarbon occurrence mechanisms in complex lacustrine shale gas condensate systems influenced by volcanic activities, paleoenvironmental settings, water geochemistry, and laminae–fracture synergy.

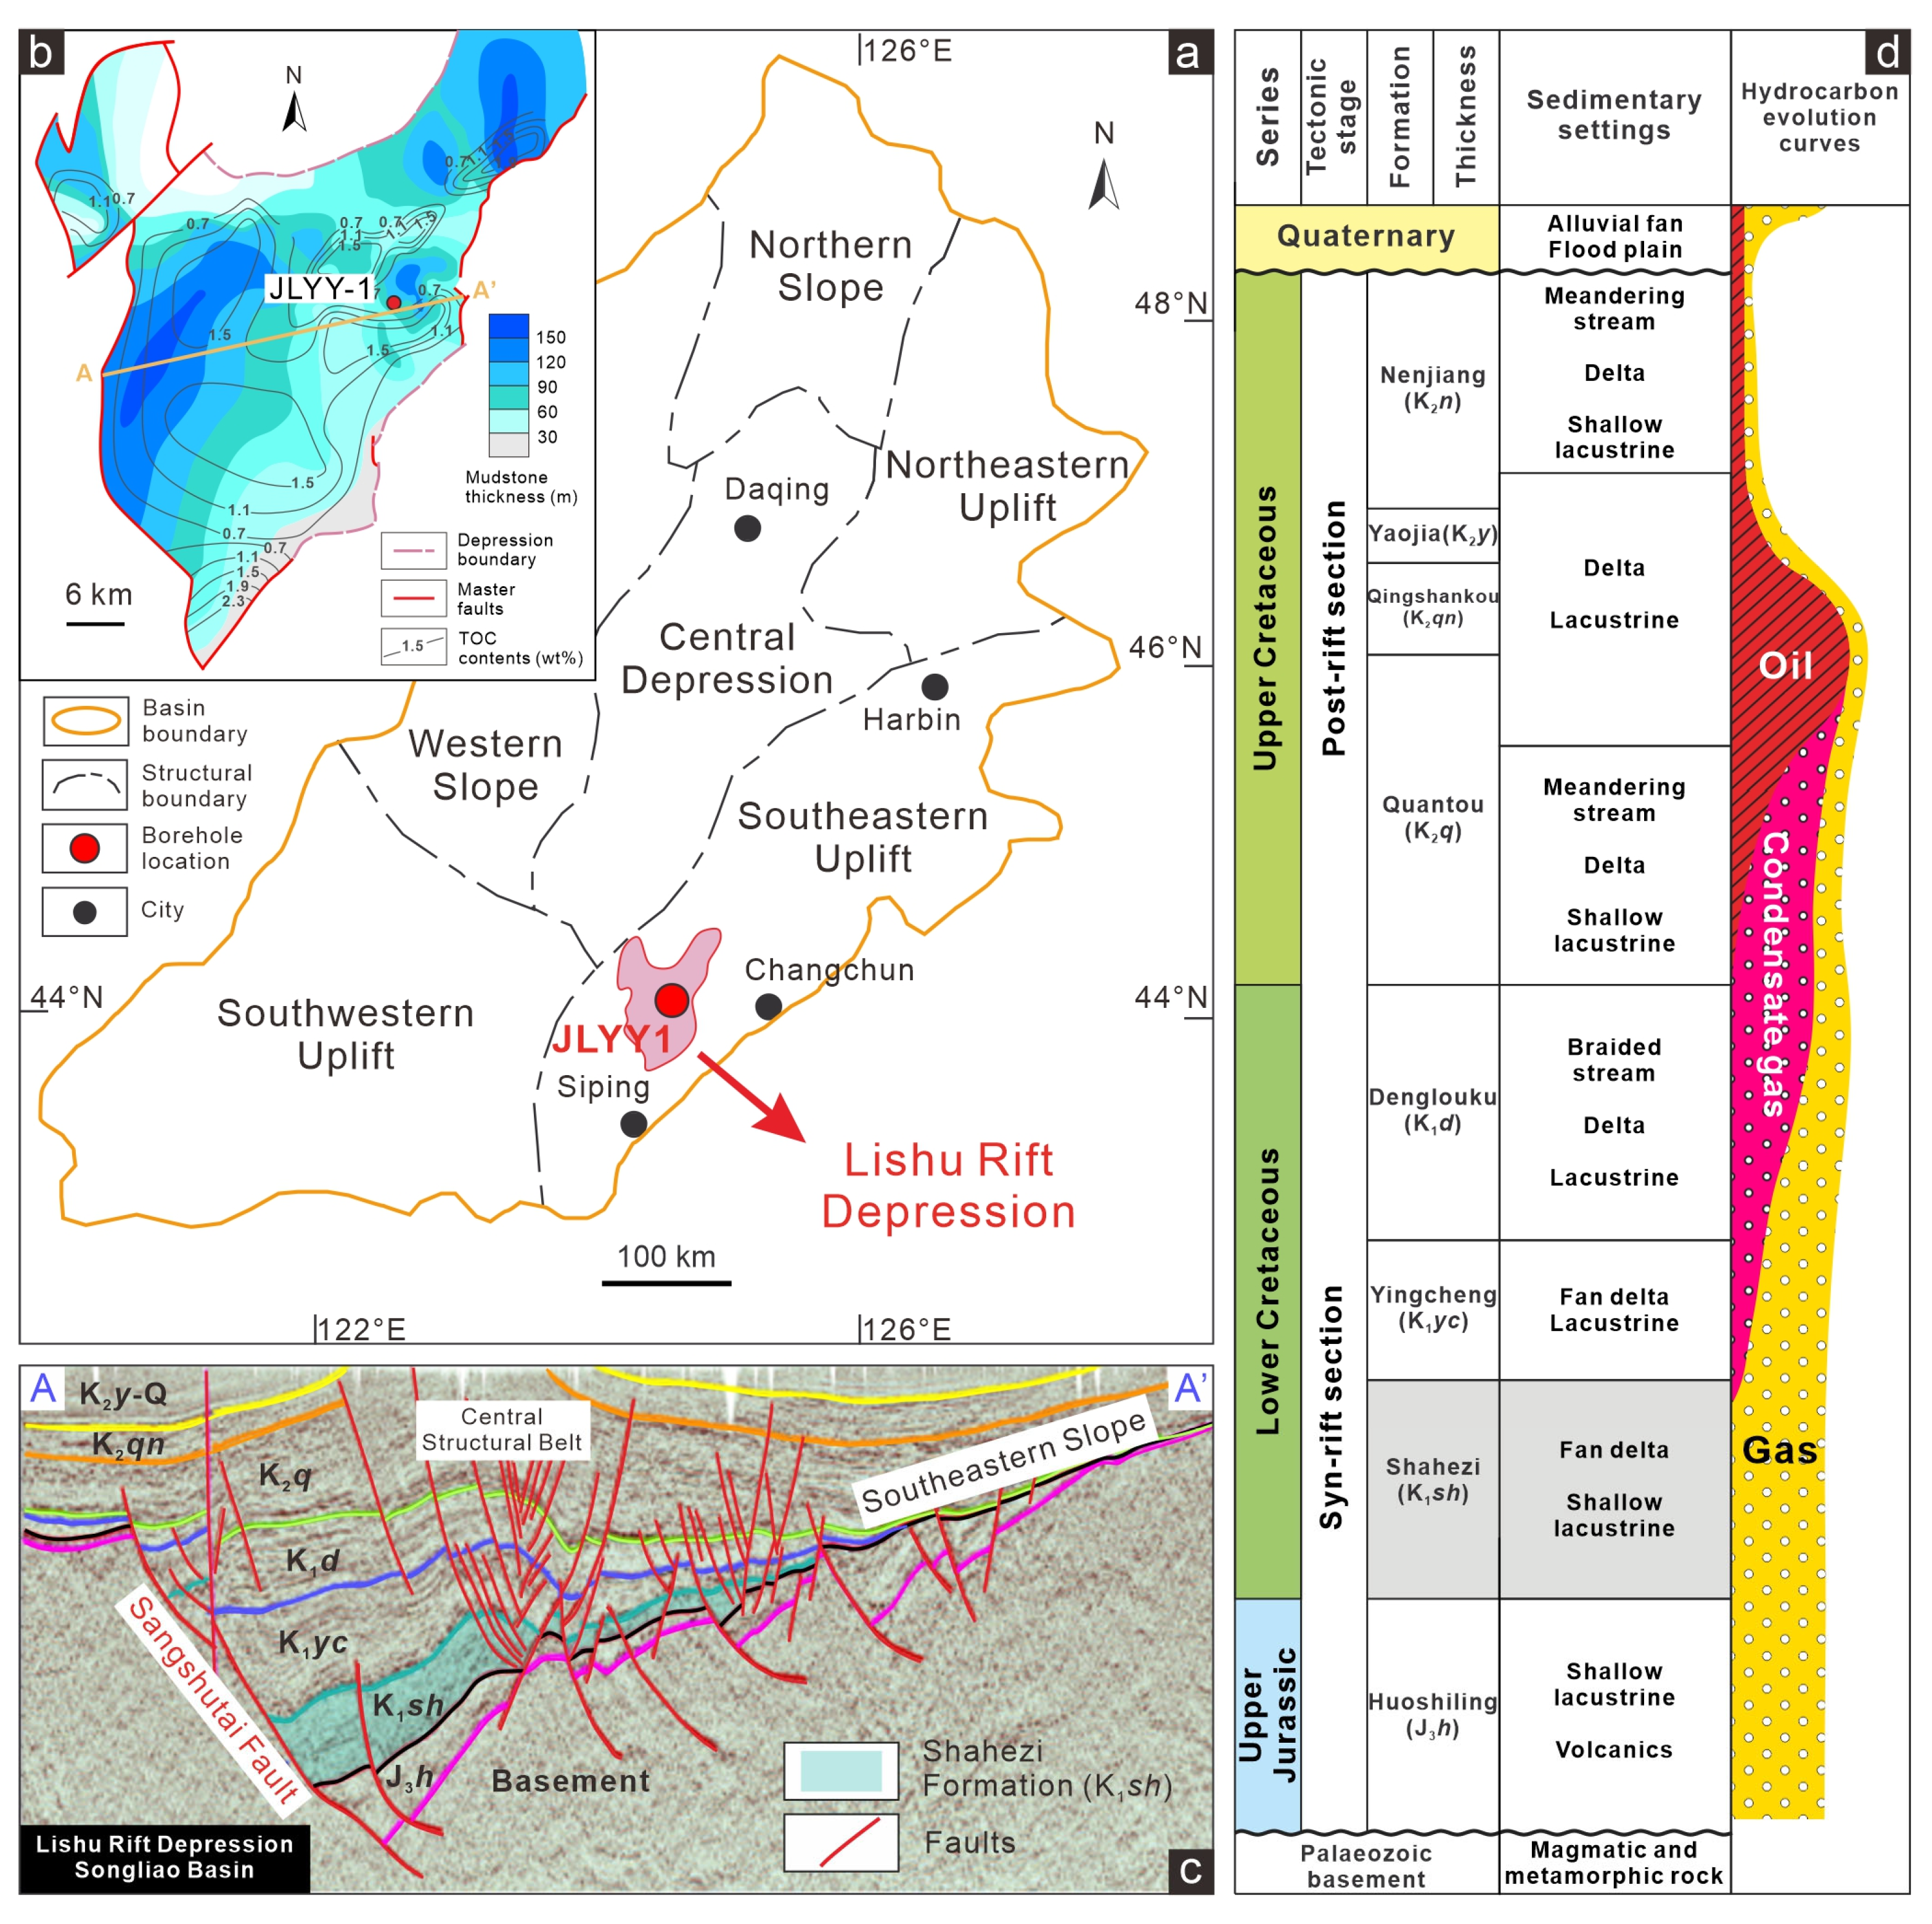
2. Geological Background

The JLYY1 borehole investigated in this study is situated in the eastern slope zone of the Lishu Rift Depression within the Southeast Uplift of the Songliao Basin (Figure 1). The Lishu Rift Depression, covering a total area of 2822 km2, is notable for having the longest rifting period, the most complete stratigraphic development, the thickest sedimentary deposits, and the deepest burial in the southeast uplift area of the Songliao Basin. This depression contains two primary sets of strata: the syn-rift and post-rift sections (Figure 1d). The syn-rift section has a thickness ranging from 0 to 8000 m, with a maximum burial depth exceeding 10,000 m. This section contains the Cretaceous Huoshiling Formation (K1h), Shahezi Formation (K1sh), Yingcheng Formation (K1yc), and Denglouku Formation (K1d), filled with lacustrine and fan delta deposits [22,33]. The post-rift section mainly consists of the Cretaceous Quantou Formation (K2q), Qingshankou Formation (K2qn), Yaojia Formation (K2y), Nenjiang Formation (K2n), and Quaternary strata, characterized by fluvial, deltaic, and lacustrine facies deposition [34]. The Shahezi and Yingcheng Formations are the primary intervals of thick shales developed during the significant rifting subsidence period.
From top to bottom, the JLYY1 borehole drilled through the Quaternary, Upper Cretaceous K2qn and K2q Formations, Lower Cretaceous K1d, K1yc, and K1sh Formations. The measured reservoir pressure of the Shahezi Formation ranges from 19.38 to 26.56 MPa, with a reservoir pressure coefficient ranging between 0.84 and 1.0, averaging approximately 0.98. The reservoir temperature gradient in the Shahezi Formation is between 3.3 °C/100 m and 3.5 °C/100 m, indicating a normal temperature system. The formation temperature at the bottom of the JLYY1 borehole is approximately 120 °C.

3. Materials and Methods

3.1. Geochemical Pyrolysis-FID Logging and In Situ Gas Desorption

The thermal maturity of source rocks and hydrocarbon fluid properties have been rapidly evaluated by the geochemical pyrolysis-FID (flame ionization detector) logging. The generated hydrocarbons and kerogens can be volatilized and cracked at different temperatures by heating sample powders within an inert gas atmosphere [31,35,36]. The light hydrocarbons (<C7) in the samples are measured as the S0 peak, while the liquid hydrocarbons (C8–C33 n-alkanes) are pyrolyzed in the temperature range of the S1 peak. The measured S2 values represent the kerogen and heavy hydrocarbons (greater than C33), and the S4 values are contributed by the residual carbon within rocks. The in situ total gas contents (TGC, m3/t) of the Shahezi Formation rocks were tested in the well site once the core segments were recovered by pressure coring and sealed in airtight desorption canisters. The coalbed methane and shale gas pulse-type intelligent tester (HTG-Pulse-6, Hengtaishanghe Energy Technology Co., Ltd., Beijing, China) was used to measure the lost gas, desorption gas, and remaining gas. Detailed information on the experimental procedure and equipment can be found in Wang et al. (2023) [31]. In this study, the content of movable liquid hydrocarbons is indicated by S1 values in the geochemical pyrolysis logging, whereas the content of light and gaseous hydrocarbons (C1–C7) is represented by the TGC values in the gas desorption tests.

3.2. X-Ray Fluorescence (XRF) Spectrum Element Logging

Major and trace element concentrations of the Shahezi Formation were measured by the X-ray fluorescence (XRF) spectrum element logging (CIT-3000SY XRF element analyzer, Sichuan Xinxianda Measurement & Controlling Co., Ltd., Chengdu, China). The XRF elemental capture energy spectrum technology is based on the interaction between high-energy X-rays and the sample. When the X-rays bombard the sample, electrons are released from the outer layers of the atoms, creating electron vacancies. Subsequently, electrons from higher energy levels fall into these vacancies, emitting characteristic X-rays. The variation in energy and wavelength of these emitted X-rays depends on the element involved. Hence, the type and quantity of elements present in the samples can be determined by analyzing the energy and wavelength of the emitted X-rays. The measured elements can be classified into five types: (1) highly migrated elements (Cl, Br, and S); (2) easily migrated elements (Ca, Mg, Na, F, Sr, K, Zn, and P); (3) migrated elements (Cu, N, Co, Mo, V, Mn, P, and S in silicates); (4) stable elements (Fe, Al, Ti, and Se); and (5) hardly migrated element (Si). In this study, twenty elements, including Na, K, Al, Si, Fe, Ca, Mg, Ti, Mn, S, P, Cl, Th, U, Ba, Sr, V, Ni, Cr, and Zr, are measured across the entire shale gas condensate interval to investigate the influence of the paleoenvironmental conditions on the in situ content of shale gas condensate.

3.3. SEM-Based Automated Mineralogy and Petrography

The RoqSCAN system is a quantitative and automated SEM-EDS (scanning electron microscopy and energy-dispersive X-ray spectroscopy) developed by Fugro Robertson Ltd. (Leidschendam, The Netherlands) and Carl Zeiss Microscopy Ltd. (Jena, Germany) [37,38]. It can not only be used in the laboratory but can also be prepared as portable, durable core analysis equipment in the field. The RoqSCAN used in this study is equipped with a Carl Zeiss EVO 50 SEM (Carl Zeiss Ltd., Jena, Germany), a Bruker AXS X-ray detector (Bruker Corporation, Billerica, MA, USA), a Bruker Pulse Processor (Bruker Corporation, Billerica, MA, USA), and Zeiss SmartPITM software (version 1.0, Carl Zeiss Ltd., Jena, Germany) [33], allowing for mineralogical and petrographic analysis of rock cuttings, cores, sidewall coring, and thin sections. It provides data on element concentrations, mineral types, rock fabrics, and petrophysical parameters (e.g., porosity, pore-size distribution, fracture numbers, and fracture density) by analyzing high-resolution SEM-EDS images (pseudo-color mineral images with a maximum resolution of 250 nm) [39,40,41]. Besides these data, the RoqSCAN system can also give information about bulk-rock density, brittleness, and elasticity [42,43]. In this study, the RoqSCAN is used to quantify the mineral composition and determine the rock fabrics. The images of laminated mudstones, composed of various mineral compositions, help to investigate the influences of lithofacies and laminae-induced fractures on shale gas condensate gas contents.
Besides RoqSCAN technology, an ultra-high-resolution FEG (field emission gun)-SEM (Zeiss GeminiSEM 450, Carl Zeiss Ltd., Jena, Germany) was utilized to detect dispersed organic matter and mineral particles across scales ranging from μm to nm, at the SEM Shared Research Facility, University of Liverpool. Backscattered (BSE, 20 kV accelerating voltage, 1 nA current) and secondary electron (SE, 5 kV, 1 nA) microscopy were performed on the Ar-ion beam-milled rock blocks to produce photomicrographs. Details of sample preparation and experimental procedure can be found in Wang et al. (2023 and 2025) [22,33].

3.4. Hybrid Shale Condensate Index (HSCI)

The fluid types on the surface are typically determined based on the gas-to-oil ratio (GOR) and oil viscosity (API), as illustrated in Table 1 and previous studies [9,29,31]. Both GOR and API are determined by the light hydrocarbon components (C1–C7) and heavy hydrocarbon components (C7+) [44,45,46]. The content of gaseous hydrocarbons ranges from mixtures of methane and ethane with very few other constituents (dry gas) to mixtures containing a range of hydrocarbons from methane to pentane, and even hexane (C6H14) and heptane (C7H16) (wet gas). In both cases, some carbon dioxide (CO2) and inert gases, including helium (He), are present along with hydrogen sulfide (H2S) and trace amounts of organic sulfur [47,48,49].
In this study, the fluid type of drilling-associated hydrocarbons is classified by using the in situ hydrocarbon components based on the surface fluid classification. While C1–C7 advanced mud gas logging methods are employed during drilling, testing the gaseous hydrocarbon content of hybrid shale gas condensates is challenging. This difficulty arises because the liquid phase formed in the matrix typically remains below residual oil saturation. Moreover, the heavier hydrocarbon components (C7+) will be permanently trapped in the matrix unless enhanced oil recovery techniques are applied. This is especially true under drilling conditions where only small quantities of C1–C2 hydrocarbons can flow to the gas content tester due to the density of the drilling fluid. Therefore, the hybrid condensates cannot be fully evaluated without considering the concomitant oils.
As a result, a new index, the Hydrocarbon Saturation Classification Index (HSCI), was proposed using the molar components of C1–C7 and C7+ to classify the fluid type, as described in Equation (1) [50]. The ratio values are calculated according to the molar ratio of hydrocarbon components, as shown in Table 1. The HSCI, as defined in Equation (1), offers an advantage in representing the occurrence of equal and elevated maturity levels in both gaseous and liquid components of condensates, particularly for hybrid condensates. Since the C7+ fraction is the only liquid-phase component available in gas condensate PVT analytical data, it is often spuriously increased by depressurization, making a reliable liquid index generally unavailable.
Liquid   hydrocarbons :   n C 1 - C 7 n C 7 + < 10 Gas   condensate :   10   <   n C 1 - C 7 n C 7 + < 60 Wet   gas :   60   <   n C 1 - C 7 n C 7 + < 128 Dry   gas :   n C 1 - C 7 n C 7 + > 128
Here, some modifications were made to fit the light hydrocarbon component ratio as Equation (2), where TGC is used to indicate the volume content of desorbed gas, and S1 is used to indicate the mass content of movable hydrocarbon in shales.
H S C I = n C 1 - C 7 n C 7 + = m C 1 - C 7 M C 8 - C 33 M C 1 - C 7 m C 8 - C 33 = 10 3 m r o c k T G C M C 1 - C 7 ρ C 1 - C 7 M C 8 - C 33 m r o c k S 1 = 10 3 T G C M C 8 - C 33 M C 1 - C 7 ρ C 1 - C 7 S 1
where n indicates the molar content, m indicates the mass for special hydrocarbon components, M indicates the molar mass, and ρ indicates the hydrocarbon density. Additionally, the fitting parameters of ρC1–C7, MC1–C7, and MC8–C33 are settled as 0.739 g/cm3, 16 g/mol, and 78 g/mol, respectively. Note that the HSCI is only proposed according to the fluid type classification during production, especially related to the hydrocarbon components. However, any kind of hydrocarbon components could not be used separately to illustrate the in situ fluid phase. Thus, a further hydrocarbon phase work using the HSCI and the geochemical pyrolysis logging data will be discussed in the following sections.

4. Results

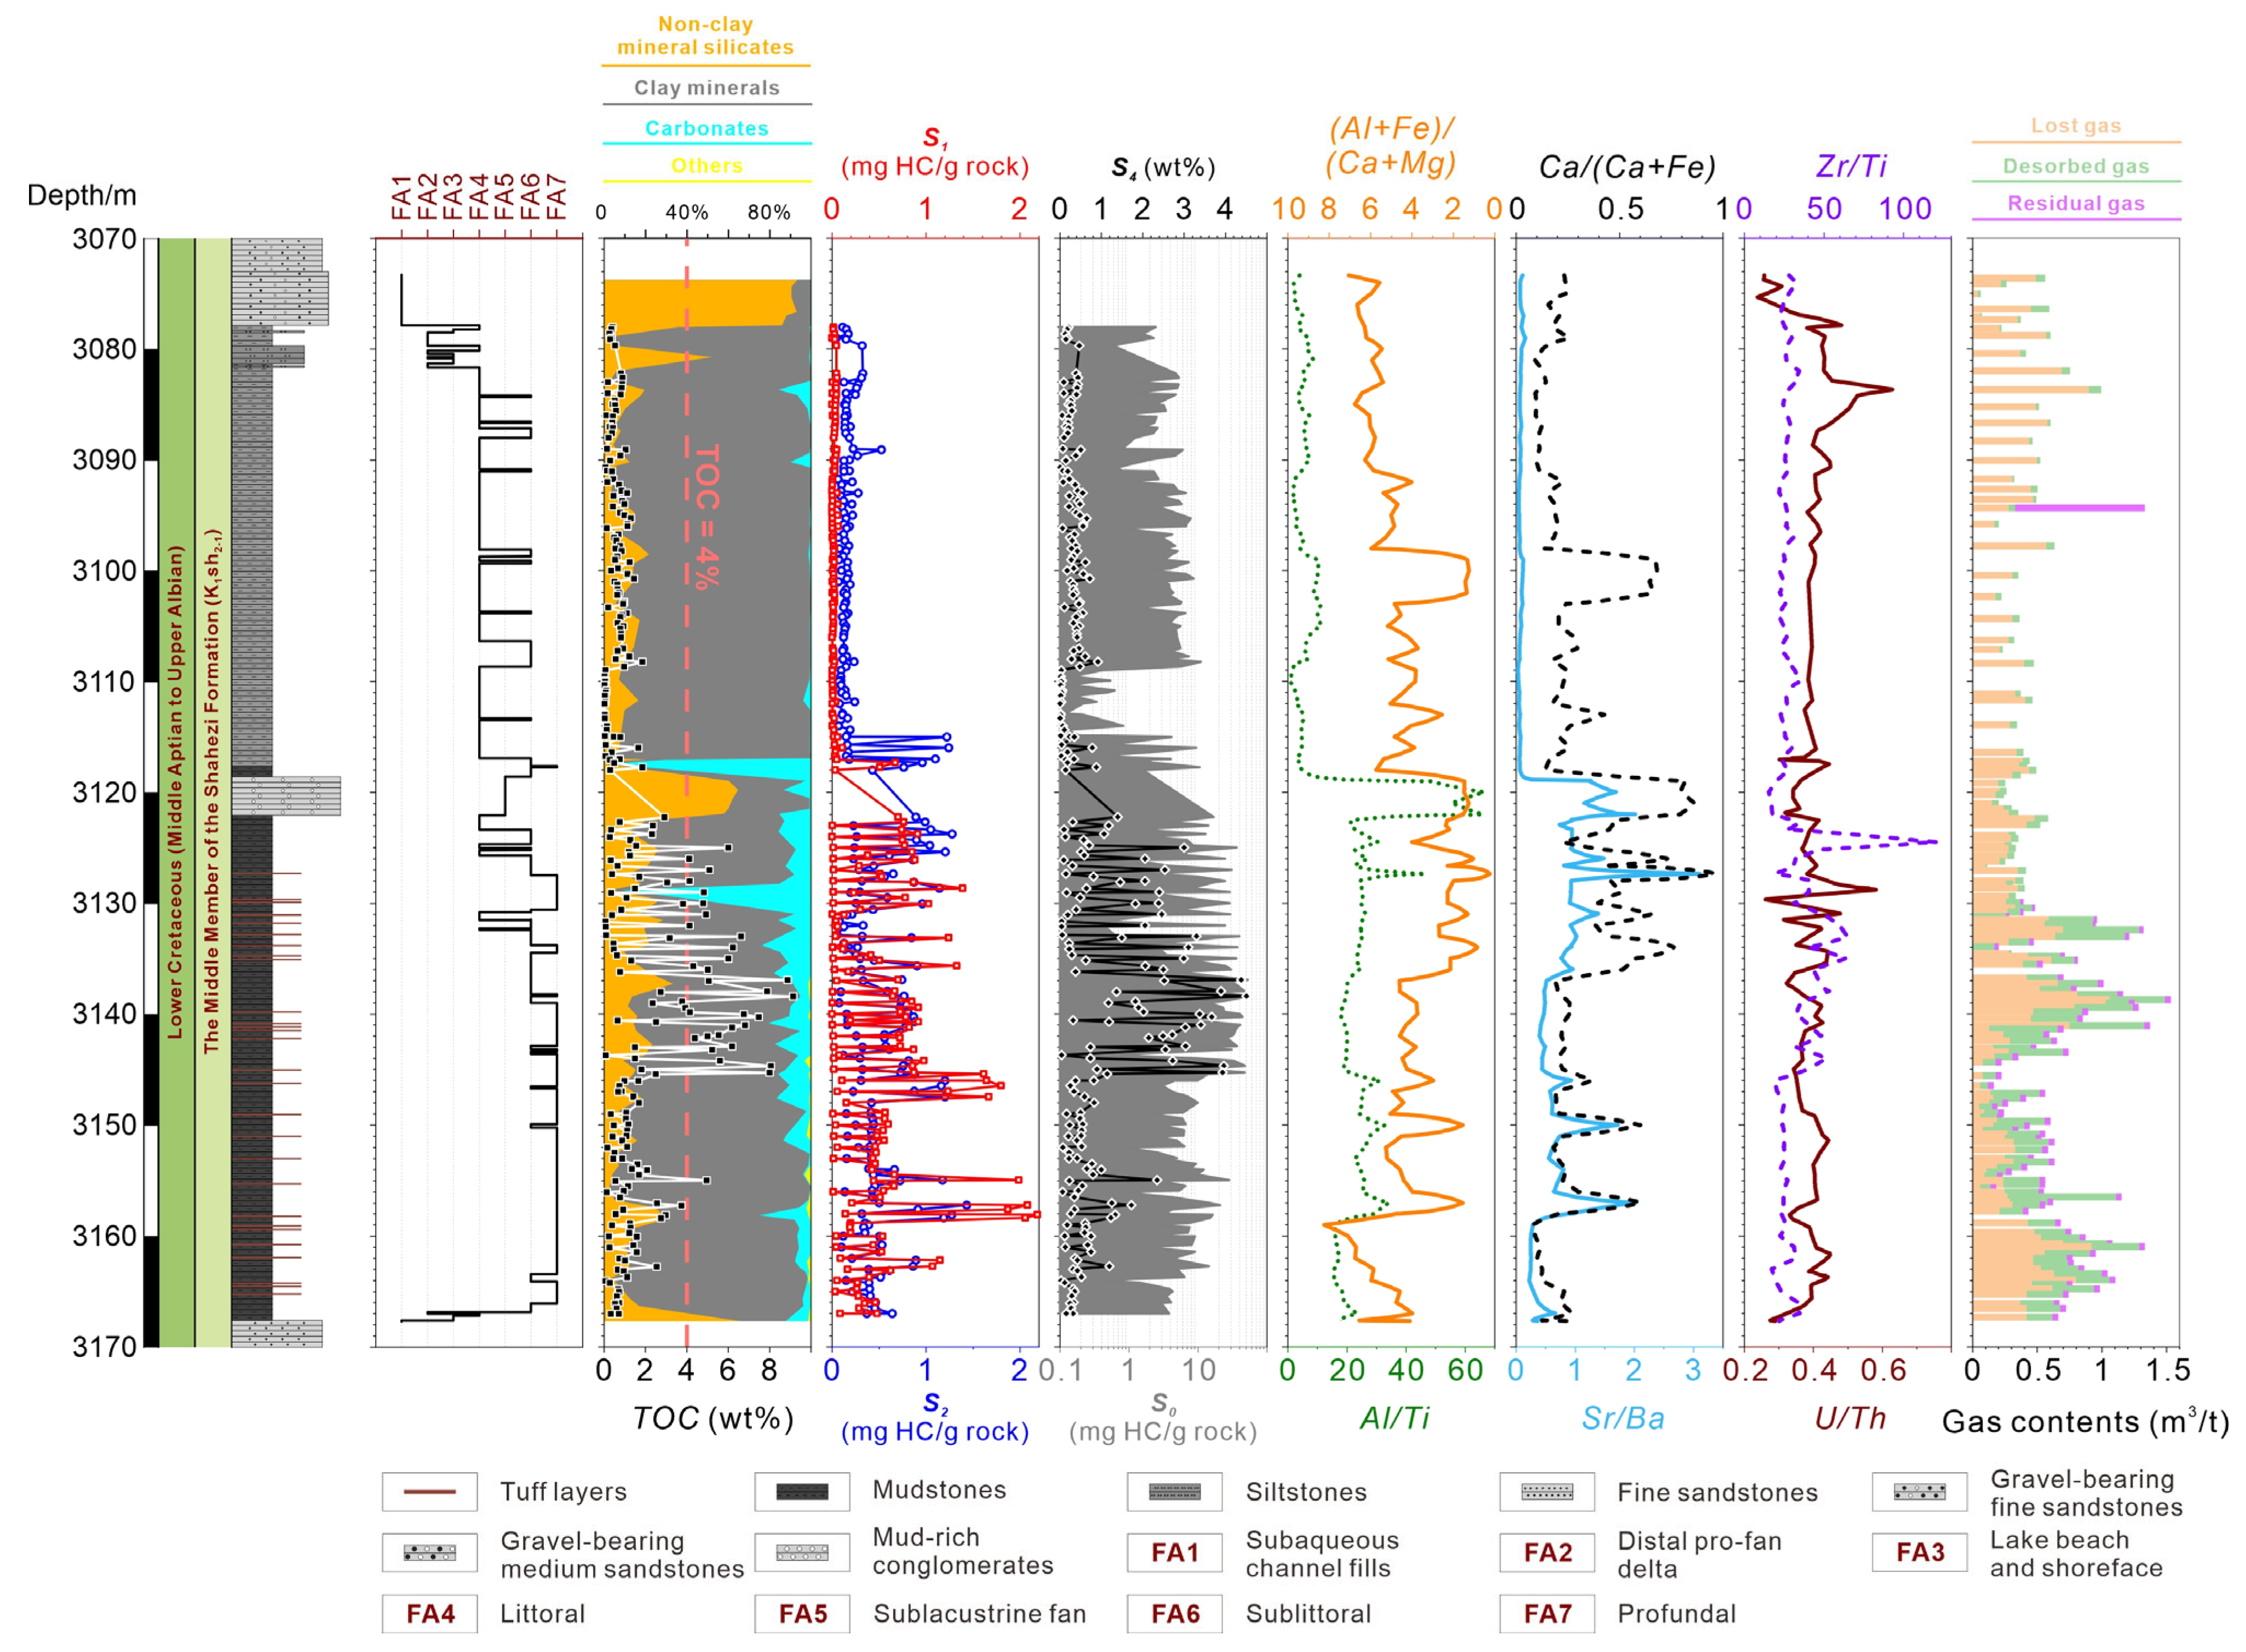
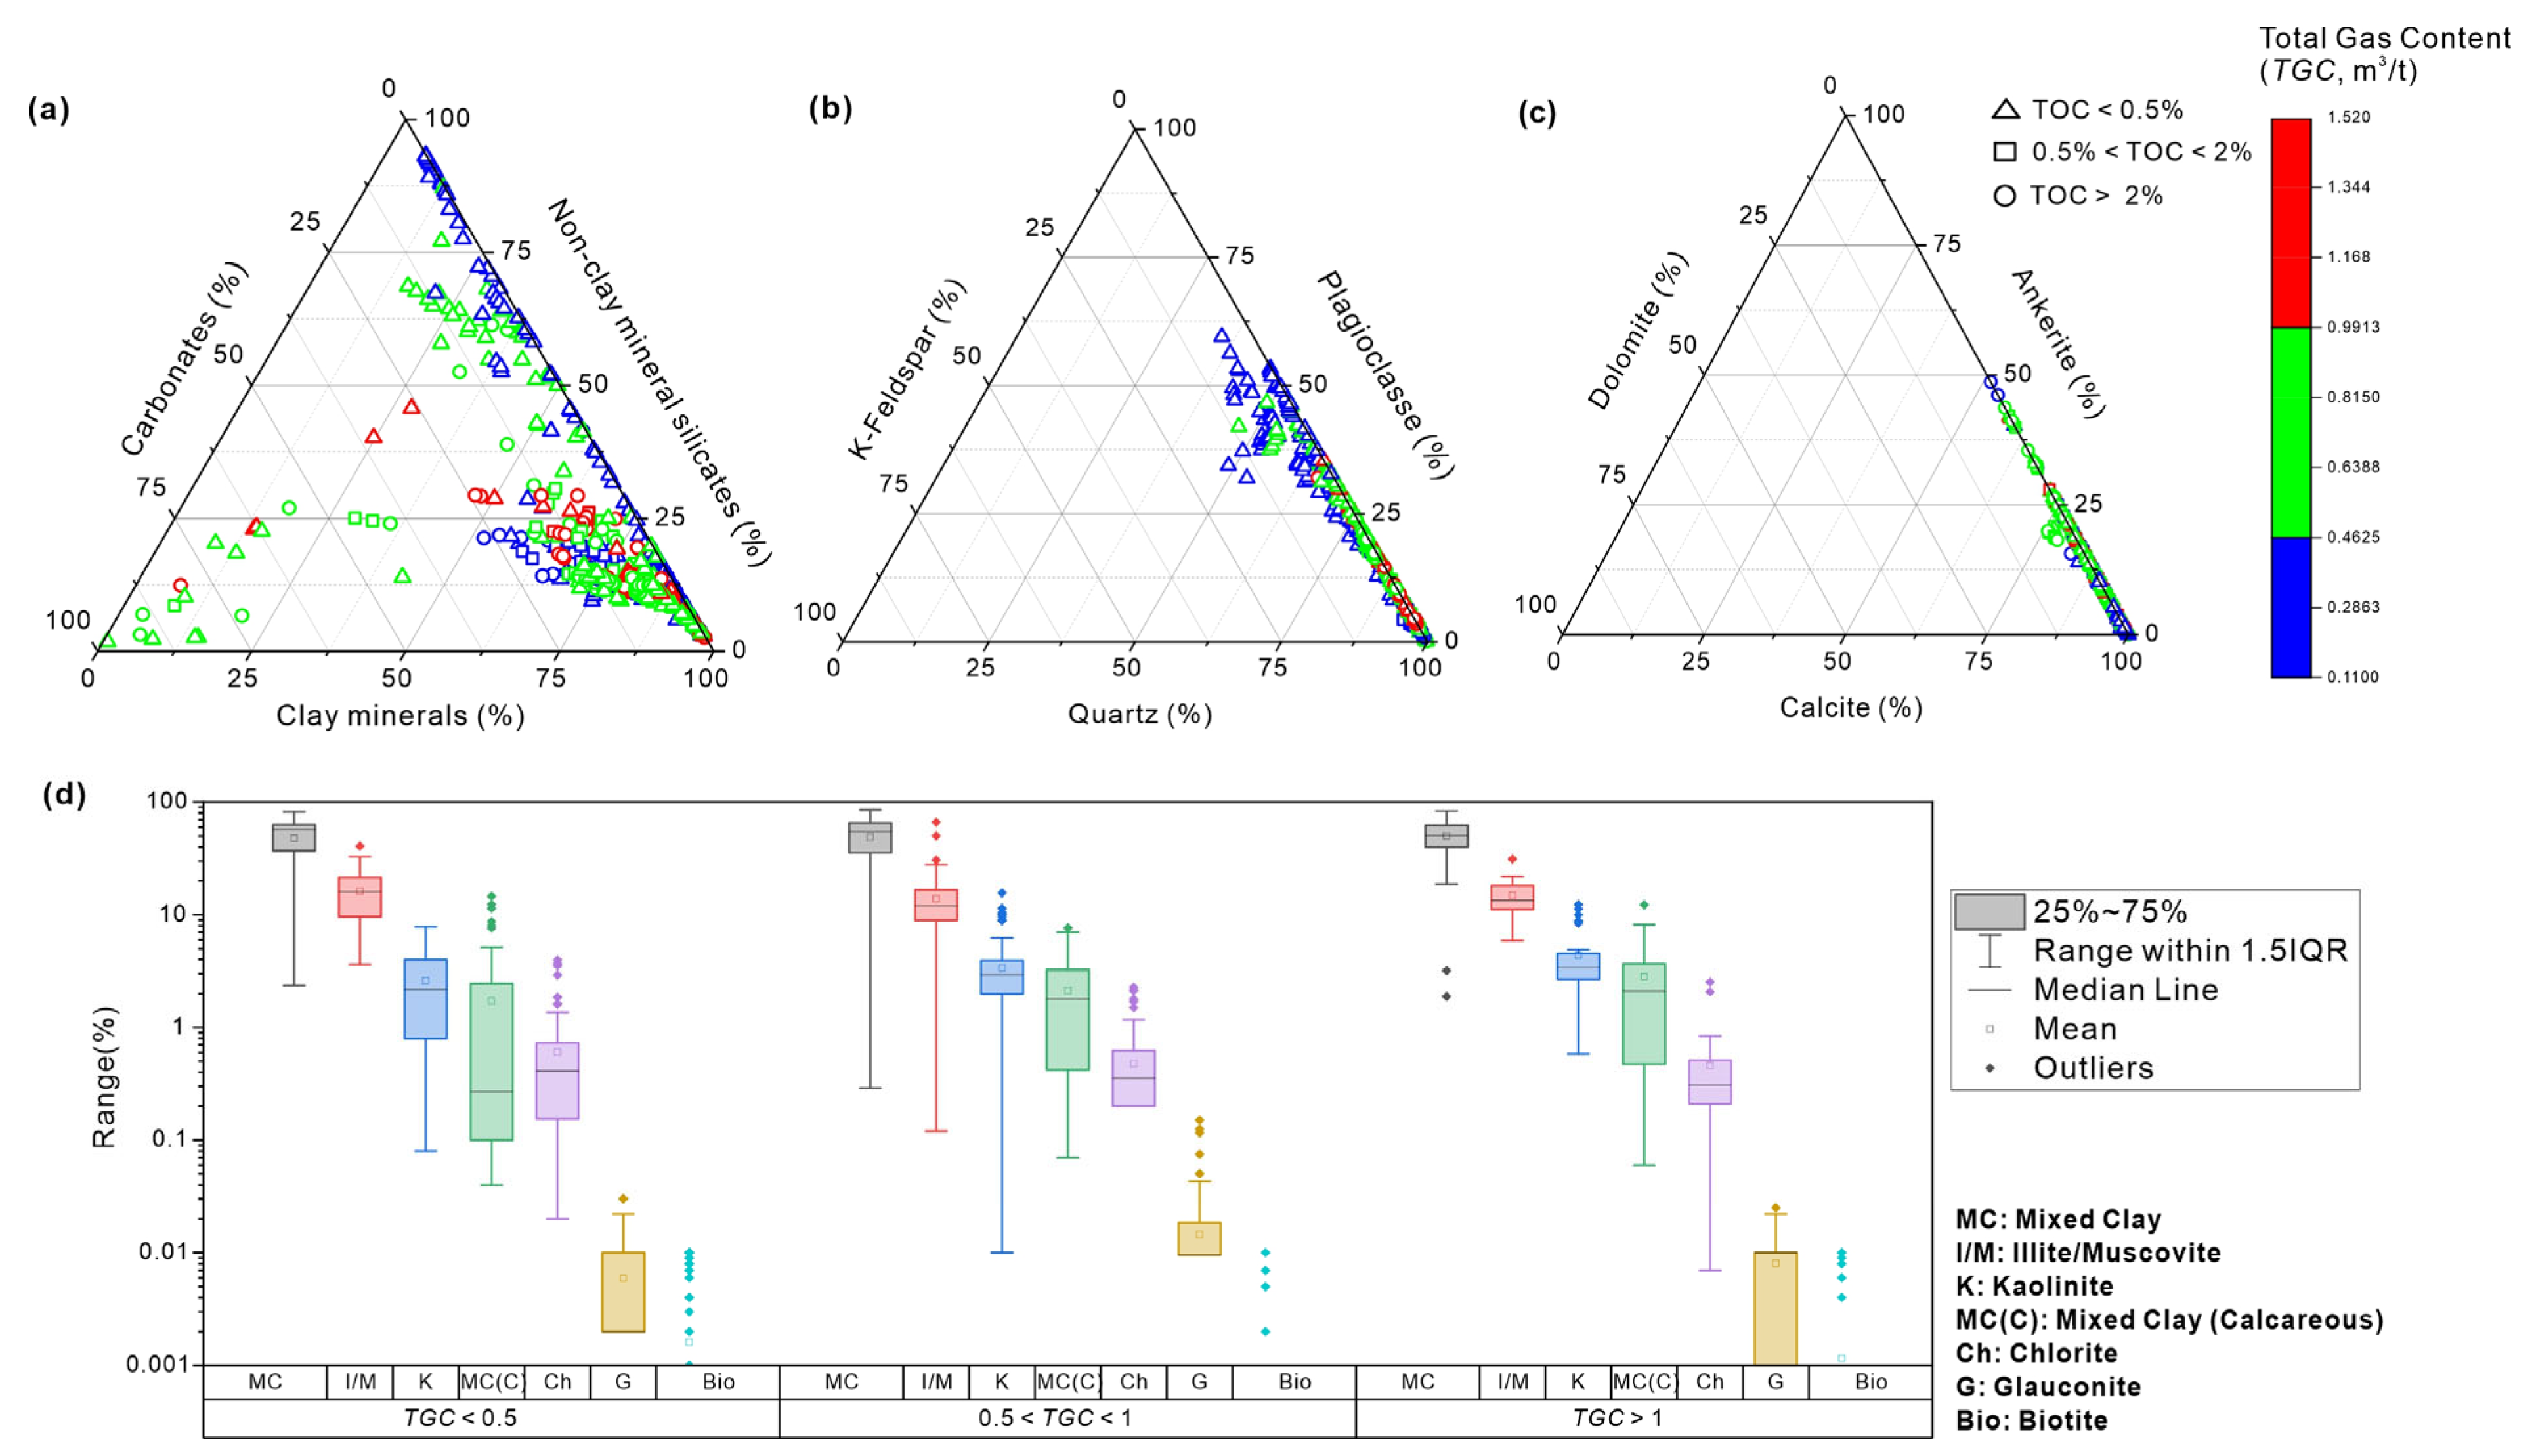
4.1. Lacustrine Shale Components and Lithofacies

Quantitative mineral analysis utilizing RoqSCAN and rock pyrolysis reveals distinct compositional zonation in lacustrine shales (Figure 2 and Figure 3). The ternary diagram in Figure 3a delineates bulk-rock mineral composition into three endmembers: carbonates, clay minerals, and non-clay mineral silicates. Detailed mineral speciation maps (Figure 3b,c) employ standardized symbology: solid circles denote high-TOC samples (>2 wt%), squares represent medium-TOC (0.5 to 2 wt%), and triangles mark low-TOC zones (<0.5 wt%). The associated clay mineral classification chart identifies seven species through diagnostic X-ray diffraction peaks: mixed clay (MC, 14 Å), illite/muscovite (I/M, 10 Å), kaolinite (K, 7 Å), mixed calcareous clays (MC(C), 12–14 Å composite), chlorite (Ch, 14 Å and 7 Å), glauconite (G, 10 Å and 4.5 Å), and biotite (Bio, 10 Å and 3.3 Å). Core analysis identifies three vertically stacked units marked by different mineral compositions: (1) argillaceous zone (3080–3115 m): clay mineral content > 75 vol% with homogenous fabric (lamination index < 0.15); (2) laminated and organic-rich unit (3115–3165 m): peak TOC (5.2 ± 0.8 wt%) coincident with pronounced bedding-parallel anisotropy (lamination index > 0.65); (3) calcite-fractured mudstone (3170–3200 m): 89 ± 4% calcite content exhibiting conjugate fracture sets (fracture density: 12 ± 3 fractures/m) and pressure solution crumples.
Three genetic classes are defined based on the following TOC thresholds:
  • Type I (TOC > 2 wt%): S1 (C7–C33) = 1.8 ± 0.3 mg/g, TGC (C1–C2) = 1.6 ± 0.2 m3/t.
  • Type II (0.5–2 wt%): S1 = 0.9 ± 0.2 mg/g, TGC = 1.1 ± 0.3 m3/t.
  • Type III (<0.5 wt%): S1 = 0.3 ± 0.1 mg/g, TGC = 0.7 ± 0.2 m3/t.
Figure 3d demonstrates S1 maxima (>1.5 mg/g) in shales of 50–75% clay mineral content, correlating with MC(C) abundance (R2 = 0.82, p < 0.01). Pore network modeling reveals MC(C)-rich zones develop 4.8 ± 1.2% intergranular porosity (Figure 4a, blue clusters) versus 1.2 ± 0.5% in I/M-dominated regions.
Furthermore, spatial correlation analysis (Figure 4b,c) shows TGC maxima (>1.5 m3/t) overlap with high-S1 intervals but lack TOC dependence (R = 0.18, p = 0.32). SEM-EDS mapping confirms < 2% organic porosity, with 83 ± 7% gas stored in intercrystalline pores within the clay mineral matrix (Figure 4d, marked by yellow).
Integrated analysis identifies optimal reservoirs as (1) liquid phase hydrocarbon: MC(C) > 25%, I/M:K < 1.5:1, TOC > 2 wt% (Figure 4a, red zones); (2) gaseous phase hydrocarbon: clay mineral content = 50–75%, illite crystallinity < 0.35 Δ°2θ (Figure 4c).

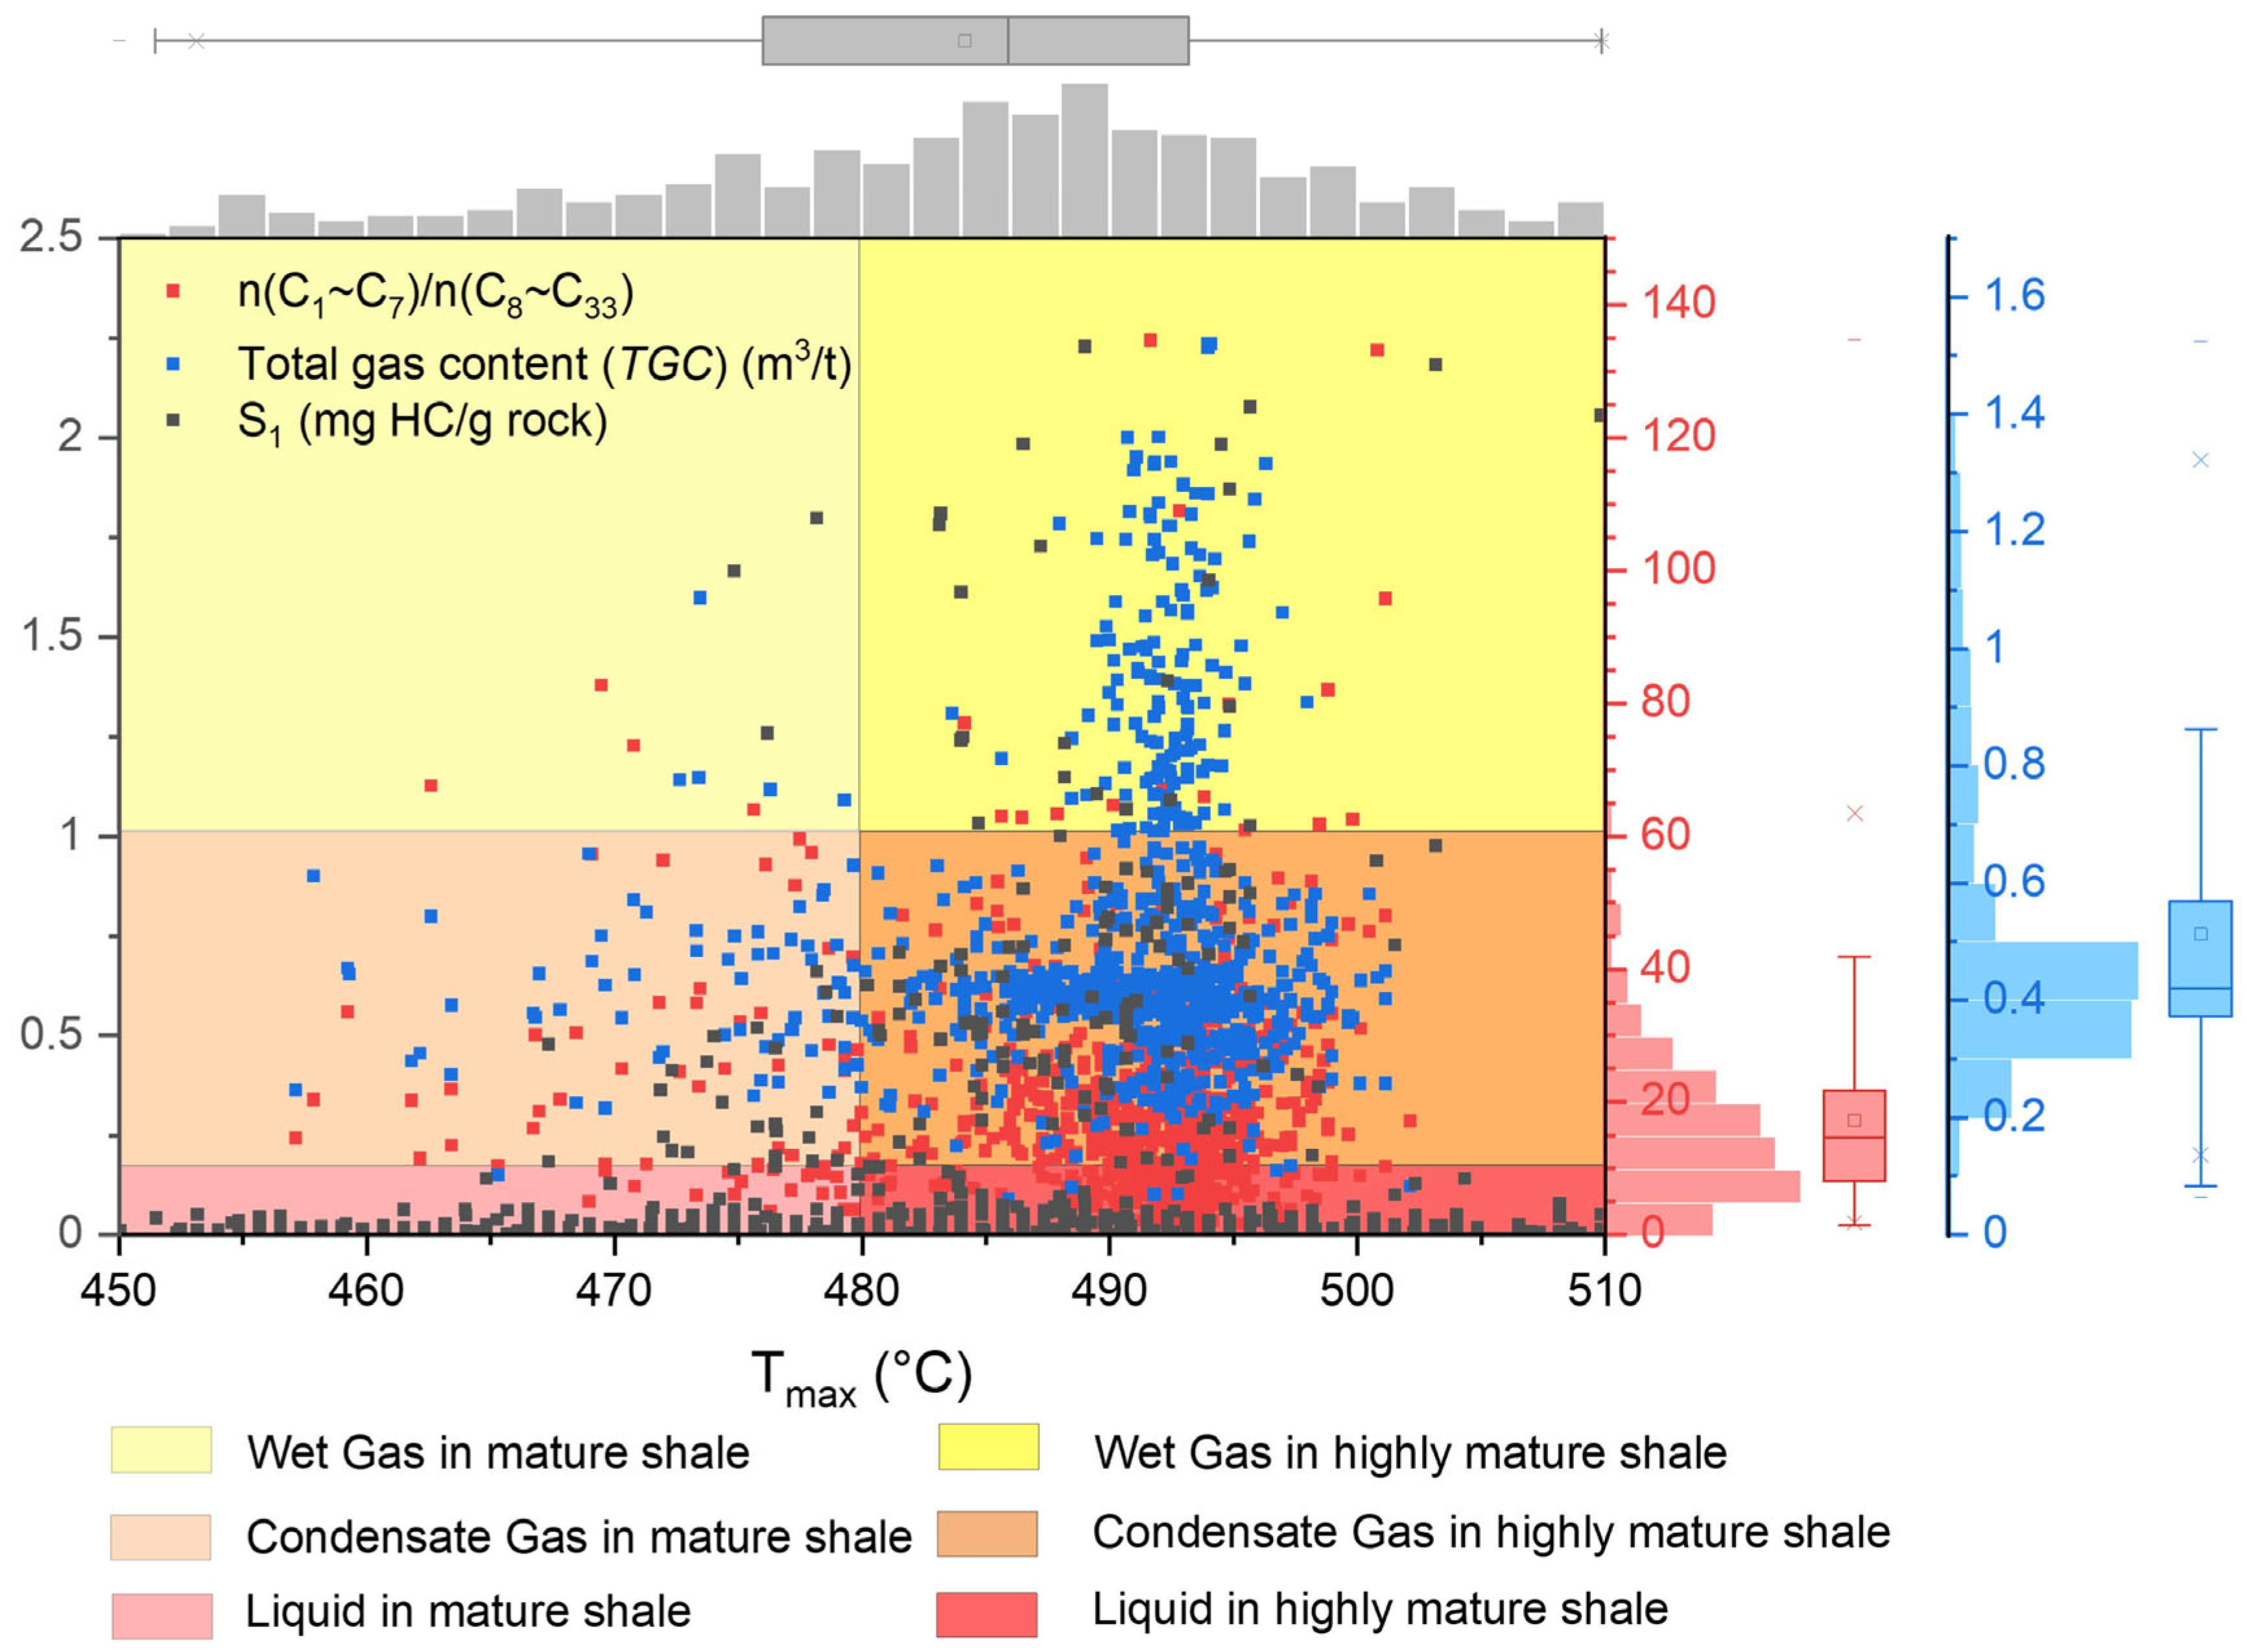
4.2. Thermal Maturity and Hydrocarbon Phases

Tmax values are used to indicate the thermal maturity between 450 °C to 510 °C in a mature and highly mature stage for the vertical shale section from 3080 m to 3165 m of JLYY1 well. The liquid friction, as mentioned in Section 3.4, is depicted by the HSCI in Equation (2), such that HSCI is valued between 0 to 140 for the vertical shale section. Generally, gas friction in gaseous and volatile phases controls the shales from 3080 m to 3115 m, where HSCI is valued between 60 to 140. Hydrocarbon content increases with the heavier components from 3115 m to 3165 m, which are controlled by the hybrid shale gas condensate phases.
To illustrate the influence of thermal maturity and hydrocarbon phases on the hydrocarbon content, parameters of S1, TGC, and HSCI are used to make a statistical scatter chart where Tmax is settled as the x-axis, black points indicate the S1 values, and blue points indicate the TGC values, as shown in Figure 5.
Here, S1 and TGC are parameters tested just following the drilling process, indicating the hydrocarbon phases upon the ground, and Tmax and HSCI are the in situ indicators of the subsurface conditions for the JLYY1 well. In detail, Tmax is valued from 460 °C to 500 °C and associated with a gaseous and liquid hydrocarbon peak (highest TGC and S1 values) around 490 °C. Here, HSCI was used to distinguish the shale hydrocarbon resources in the gas condensate, wet gas, and liquid states, respectively. Moreover, a further thermal maturity system was taken into consideration in this study. The hydrocarbon phases of the Shahezi Formation shale reservoir could be classified into six types: (1) the wet gas in mature shale (Tmax < 480 °C, HSCI > 60); (2) wet gas in highly mature shale (Tmax > 480 °C, HSCI > 60); (3) gas condensate in mature shale (Tmax < 480 °C, 10 < HSCI < 60); (4) gas condensate in highly mature shale (Tmax > 480 °C, 10 < HSCI < 60); (5) liquid in mature shale (Tmax < 480 °C, HSCI < 10); and (6) liquid in highly mature shale (Tmax > 480 °C, HSCI < 10). As indicated by the HSCI values in Figure 5, the red points indicate that shale gas condensate in mature and highly mature shale, acting as the major hydrocarbon phases, contributes mostly to the hydrocarbon content of the in situ hybrid shale gas condensate resources. Unlike marine shales (e.g., Haynesville, Marcellus), where biogenic silica and high thermal maturity dominate, the HSCI framework uniquely resolves fluid-phase ambiguities in lacustrine systems by accounting for volcanism–clay mineral interactions and lamina architectures. This approach reduces reliance on depressurization-distorted C7+ data, offering a higher accuracy in sweet spot prediction compared to traditional GOR/API methods. Section 5 provides microscopic evidence for the influence of volcanism–clay mineral interactions and lamina architectures on hydrocarbon production in shale gas condensate reservoirs.

4.3. Paleoenvironmental Conditions

Major elements (Na, K, Al, Si, Fe, Ca, Mg, Ti, Mn, S, P, Cl) and trace elements (Th, U, Ba, Sr, V, Ni, Cr, Zr) were measured to study the paleoenvironmental conditions during the deposition of the Shahezi Formation and their influences on hydrocarbon contents of shale gas condensate layers. The Al/Ti ratios indicate paleoclimate conditions (humid vs. dry), while the Sr/Ba and Ca/(Ca + Fe) proxies reflect paleosalinity (freshwater vs. saline lake). The (Al + Fe)/(Ca + Mg) ratio suggests paleowater depth, and the Zr/Ti ratio indicates the input intensity of volcanic materials. The U/Th ratio helps assess bottom-water paleoredox conditions (oxic vs. anoxic) [51,52,53,54,55,56].
As shown in Figure 2, the paleoclimate shifts from humid to dry with decreasing Al/Ti values. Shales from 3080 m to 3120 m were deposited in a more arid climate, corresponding to lower hydrocarbon content. The paleo-lake environment transitions from freshwater to saline with increasing Sr/Ba and Ca/(Ca + Fe) values, generating shales of 3115–3135 m suitable for hydrocarbon generation. These sections have higher hydrocarbon contents due to the saline water geochemistry [57]. Similarly, increasing (Al + Fe)/(Ca + Mg) values suggest high water depths, enhanced hydrocarbon generation in the section of (3120–3140 m).
Volcanic ash preserved in the paleo-lake sediments, indicated by fluctuating Zr/Ti values of 3122–3142 m, also promotes hydrocarbon generation. As proposed by Li et al. (2022), tuffaceous shale layers are key to the prediction of the hydrocarbon “sweet spot” created by water–rock interaction [50]. U is enriched in anoxic environments, while Th concentrations tend to be constant [58,59,60]. Thus, high U/Th values usually indicate anoxic bottom-water conditions. For the JLYY1 borehole, a high gas production is recorded in the shales from 3128 m to 3142 m, as well as 3155 m to 3167 m, where the highest hydrocarbon content corresponds to the most anoxic conditions.
Moreover, hybrid sedimentary factors contribute to the deposition of organic-rich shales from 3118 m to 3137 m. Under microscopes, organic matter particles are closely associated with terrigenous organic inputs (e.g., mineral particles covered by solid bitumen, Figure 6a,b), volcanogenic materials (e.g., organic-rich clay laminae derived from devitrified volcanic glass, Figure 6c–e), and terrestrial plant inputs (Figure 6f). Additionally, the migration of liquid hydrocarbon along volcanogenic silicate particles (Figure 6c,d) and the occurrence of solid bitumen within clay laminae (Figure 6e) suggest a hybrid sedimentary model contributing to hybrid condensate gas generation in lacustrine shale reservoirs.
Overall, paleoenvironmental conditions, such as volcanic materials input, a humid climate, saline lacustrine conditions, and anoxic bottom-water promoted the deposition of shale gas condensate reservoirs, enhancing hydrocarbon content in hybrid shale gas condensate reservoirs.

4.4. Shale Lamination and Lamina-Induced Fractures

Lamina-induced fracture systems constitute critical hydrocarbon storage spaces and migration pathways in lacustrine shale reservoirs, with four distinct lithological types identified through an integration of RoqSCAN and FEG-SEM approaches (Figure 6 and Figure 7): Silicate laminae (Figure 7b), predominantly developed in 3080–3165 m clay mineral-rich intervals, characterized by submillimeter quartz and feldspar bands (<200 μm) and accounting for 78% of total hydrocarbon storage space (S1 = 1.8 ± 0.4 mg/g). These laminae enhance fracture connectivity through increasing fracture density and anisotropic permeability. Clay mineral laminae (Figure 7c) tend to create fractures with apertures of 50–150 μm in shales. Carbonate laminae (Figure 7a) within the same interval exhibit 20–80 μm calcite-filled fractures with 35 ± 7% spatial filling density, supported by crystalline infill textures.
Pyrite laminae (Figure 7d) demonstrate a unique Fe-S diagenetic association with organic matter-hosted pore clusters (porosity θ = 8 ± 3%), serving as robust indicators of the “sweet spot” through their strong correlation with TOC (R2 = 0.91). Their development involves Fe migration along hydrocarbon flow paths and S enrichment in zones rich in solid bitumen (organic matter = 6 ± 2 vol%), particularly where silicate laminae fractures intersect pre-existing clay mineral-rich matrices. Spatial analysis confirms these lamina systems collectively create interconnected hydrocarbon storage networks, with silicate laminae governing bulk storage capacity while pyrite laminae mark high-TOC (>2 wt%) preservation zones. The observed lamina and fracture configurations—particularly the staggered propagation of pyrite and silicate laminae in organic-rich intervals—provide diagnostic criteria for identifying hybrid shale gas condensate sweet spots.

5. Discussion

An integrated model is proposed to illustrate the hydrocarbon generation and evolution of hybrid shale gas condensate resources, considering the four key factors, rock components and lithofacies, thermal maturity and hydrocarbon phases, paleoenvironmental conditions, and lamina-induced fractures, as shown in Figure 8.

5.1. Comparison of the Hybrid Sedimentation Model Between Hydrocarbon-Rich Shales and Hydrocarbon-Lean Shales

Volcanism commonly occurs in the syn-rift Songliao Basin, where significant volcanic activity began during the Early Cretaceous due to the subduction of the Indian and Pacific plates beneath the Eurasian plate [34]. This led to the development of grabens, particularly in the central fault block of the Songliao Basin [61]. Based on basin geometric characteristics, volcanism, and early sedimentation, a hybrid sedimentation model is proposed in Li et al. (2022), illustrating the syn-rift lake basins, affected or unaffected by volcanism, respectively [50]. The hydrocarbon-rich shales occur between 3115 m and 3165 m, while the hydrocarbon-lean section is between 3080 m and 3115 m.
During the syn-rift period, volcanic activity raised temperatures, increased atmospheric CO2, and caused mass mortality of organisms [22,62]. This created a unique environment for hydrocarbon-rich shales, including a quiescent water setting with volcanic inputs, a humid climate, saline lakes, and anoxic bottom-water conditions in the syn-rift lake. Both oxic and anoxic water layers contributed to hybrid organic-rich deposits [63], which contained terrigenous salt-tolerant plants, organic matter, and planktonic aerobic organisms [50]. These organic-rich deposits in the Shahezi Formation, primarily from oil-prone fractions of terrigenous organic matter [22,33], mixed with minerals and formed organic matter laminae, indicate a stable and anoxic water environment. Anaerobic bacteria helped degrade organic matter and form authigenic minerals. Dispersed terrigenous organic matter is deposited with detrital or authigenic quartz, generating the silicate- and organic-rich laminae possibly derived from the devitrification of volcanic glass in tuff [22].
The hydrocarbon-rich shales from 3115 m to 3165 m, which have higher hydrocarbon content than those from 3080 m to 3115 m (Figure 2), are key to defining “hybrid shale gas condensate”. The gas and liquid hydrocarbon states are influenced not only by in situ conditions like temperature and pressure [64,65,66] but also by the input of terrestrial-sourced organic matter, which contributes to the production of gas and liquid hydrocarbons in the early stages of hydrocarbon evolution [67].
As the basin evolved, volcanic activity decreased, and secondary faults formed, leading to shallow water depth, a relatively cold and arid climate, and low salinity water conditions under weak evaporation conditions. The lake environment became more stable, with an oxic layer on top and a dysoxic layer below. In this stable period, aquatic organic matter preservation was difficult due to the weak reducing environment [68]. Instead, terrigenous organic matter sourced from land plants contributed to the enrichment of Type III kerogen, which performs relatively poorly in hydrocarbon generation. This explains the lower hydrocarbon content in the shales from 3080 m to 3115 m.

5.2. The Organic–Mineral Interactions During the Diagenesis of Hydrocarbon-Rich Shales

The hydrocarbon content of hybrid shale gas condensates is influenced by organic–mineral interactions during diagenesis (Figure 8). Here, organic–mineral interactions are examined to explain hydrocarbon storage and desorption, using SEM to describe the relationship between organic matter, mineral particles, and pores (Figure 8). The test samples are horizontally stratified and finely laminated mudstones.
Organic matter, primarily composed of solid bitumen, results from kerogen evolution and often intergrows with authigenic pyrite, calcite, and non-clay mineral silicate minerals (Figure 8). In calcareous laminae (Figure 8a), calcification occurs in the presence of prior clay-sized deposits, where HCO3 combines with Ca2+ and Mg2+ ions to form calcareous diagenetic minerals in slightly alkaline, oxidizing conditions [69]. Intergranular pores of calcite particles contribute to solid bitumen storage (Figure 8a), where hydrocarbons are mainly stored in the intergranular pores of clay minerals and calcareous particles, as well as in organic matter-hosted pores.
Silicate laminae are often associated with pyrite laminae (Figure 7d and Figure 8b) due to the symbiotic relationship between organic matter and pyrite. Pyrite can either separate from organic matter or become embedded in solid bitumen, showing flow traces (Figure 7d and Figure 8b). Pyrite is typically surrounded by detrital quartz particles and authigenic quartz overgrowth, which are possibly generated during the devitrification of volcanic glass in tuff (Figure 7d). Pyrite forms in an anoxic bottom-water environment during early diagenesis [70].
An interesting phenomenon is seen in Figure 8e,f, where the clay mineral assemblages are associated with calcite particles within micro-scale organomineral composites. These formations resemble structures that likely result from the devitrification of volcanic glass into chlorite and illite. Although it remains uncertain whether this process directly influences organic matter evolution, it is clear that the combination of volcanic glass, organic matter, and calcite in a special diagenetic setting contributes to hydrocarbon-rich shales.
The most common mineral intergrowth with organic matter is authigenic quartz, followed by pyrite, illite, and carbonate minerals [71]. The complex microstructures formed by organic matter and authigenic minerals are similar to those found in intrusive igneous rock crystallization processes. This suggests that organic matter and authigenic minerals may have the same origin and evolutionary process according to their diagenetic pathways. The evolution of parent-rock material into solid bitumen and the crystallization of minerals hints at chemical differentiation between organic and inorganic components.

5.3. The Liquid Hydrocarbon and Solid Bitumen of the Hybrid Shale Gas Condensate Reservoirs

The organic matter in the cored shales of this study has evolved into condensate and wet gas stages, as discussed in Section 4.2. Hybrid shale gas condensate in mature and highly mature shale is the dominant fluid phase and contributes significantly to the in situ hydrocarbon content. Although the light hydrocarbons in gas or liquid states have been lost from the samples due to drilling and coring, the space left by hydrocarbon desorption, exudation, and diffusion remains detectable under SEM.
SEM images are used to indirectly illustrate the hydrocarbon state. The organic matter in the SEM photos is classified into three types: highly mature organic matter with a vesicular structure, mature organic matter with liquid mold holes and vesicular structures, and solid bitumen with no movable hydrocarbon traces (Figure 8e–h). Authigenic quartz and solid bitumen often coexist, with solid bitumen spherulites and pores present. In the SEM images, different pore types are visible, mainly formed by gas generation, accumulation, and escape of hydrocarbons from kerogen. These pores are typically round, with apertures ranging from tens to hundreds of nanometers, varying in size, depth, and shape. Solid bitumen development is particularly noticeable in intergranular pores of authigenic minerals, which protect the organic matter and allow hydrocarbons to generate and accumulate. The light hydrocarbons around these pores, along with the solid bitumen formed during hydrocarbon generation, as shown in Figure 8c–h, strongly support the accumulation of hybrid shale gas condensates.

6. Conclusions

This study establishes a multiscale framework for evaluating hybrid shale gas condensate reservoirs in rift lake basins affected by volcanism, integrating geochemical, mineralogical, and sedimentological analyses of the Shahezi Formation (Songliao Basin). By combining novel proxies (e.g., HSCI index) with paleoenvironmental diagnostics, a predictive model was proposed for lacustrine shale systems to distinguish them from marine analogs. Key findings include the following:
  • Argillaceous shales (50–75% clay minerals) containing mixed carbonate and clay minerals (MC(C) > 25%) and organic matter (TOC > 2 wt%) exhibit high potential of hydrocarbon storage, achieving S1 > 1.5 ± 0.3 mg/g (C7–C33) and TGC > 1.5 ± 0.2 m3/t (C1–C2). These intervals develop intergranular porosity of 4.8 ± 1.2%, which is higher than illite-dominated zones.
  • Six fluid phases of hydrocarbons were identified by the HSCI index, showing that the mature (Tmax = 460–480 °C) and highly mature (Tmax = 480–500 °C) shales are dominated by gas condensates. The production of gaseous and liquid hydrocarbon peaks at Tmax = 490 °C (highest S1 and TGC values), which corresponds to intervals with enhanced preservation of MC(C).
  • Volcanic material inputs (Zr/Ti > 40), humid paleoclimate (Al/Ti > 10), saline lake water (Sr/Ba > 0.5 and Ca/(Ca + Fe) > 0.3), and anoxic bottom-water conditions (U/Th > 0.4) promote hybrid silicate and pyrite laminations, elevating TOC to 5.2 ± 0.8 wt%, which is higher than intervals unaffected by volcanism.
  • Silicate laminae (S1 = 1.8 ± 0.4 mg/g) and pyrite laminae (porosity θ = 8% ± 3%) jointly form heterogenic seepage networks, promoting hydrocarbon generation in low-porosity shales (porosity θ = 1.2–4.8%). These systems differ from their marine analogs due to significant organic–mineral interactions.
Overall, these insights redefine “sweet spot” criteria for hybrid shale gas condensate reservoirs in rift lake basins, emphasizing volcanic–diagenetic pathways and lamina architecture as key discriminators from marine systems.

Author Contributions

Conceptualization, Y.L.; methodology, Y.L.; validation, Y.L., Y.X., Y.Y., L.T. and Y.T.; formal analysis, Y.L. and Q.W.; investigation, Y.L. and Q.W.; resources, Y.X., Y.Y., L.T., Y.T. and Q.W.; writing—original draft preparation, Y.L. and Q.W.; writing—review and editing, Y.L., C.F. and Q.W.; visualization, Y.L. and Q.W.; supervision, C.B. and C.F.; project administration, C.B. and C.F.; funding acquisition, Y.L., C.B. and C.F. All authors have read and agreed to the published version of the manuscript.

Funding

This research was financially supported by the National Natural Science Foundation of China (grant numbers U2244207 and 42202179), State Key Laboratory of Shale Oil and Gas Enrichment Mechanisms and Effective Development, State Key Laboratory of Petroleum Resources and Prospecting, China University of Petroleum (grant number PRP/open-2217), and China Geological Survey (grant numbers DD20190115 and DD20240201002).

Data Availability Statement

The data presented in this study are openly available in Mendeley Data: http://dx.doi.org/10.17632/gtgjcpyzcn.1 (accessed on 3 June 2025).

Acknowledgments

The authors would like to thank the Scanning Electron Microscopy Shared Research Facility (SEM-SRF) at the University of Liverpool for the ultra-high-resolution SEM-EDS equipment.

Conflicts of Interest

Author Chao Fu was employed by the Xinjiang Yaxin Coalbed Methane Investment and Development (Group) Co., Ltd. The remaining authors declare that the research was conducted in the absence of any commercial or financial relationships that could be construed as a potential conflict of interest.

Abbreviations

The following abbreviations are used in this manuscript:
TOCTotal organic carbon content (wt%)
TGCTotal gas content (m3/t)
HSCIHybrid Shale Condensate Index
GORGas-to-oil production ratio (Scf/STB)
APIAmerican Petroleum Institute gravity (°API)

References

  1. Speight, J. Chapter 7—Analysis of gas and condensate from tight formations. In Shale Oil and Gas Production Processes; Speight, J., Ed.; Gulf Professional Publishing: Houston, TX, USA, 2020; pp. 373–450. [Google Scholar]
  2. Hassan, A.; Mahmoud, M.; Al-Majed, A.; Alawi, M.B.; Elkatatny, S.; BaTaweel, M.; Al-Nakhli, A. Gas condensate treatment: A critical review of materials, methods, field applications, and new solutions. J. Pet. Sci. Eng. 2019, 177, 602–613. [Google Scholar] [CrossRef]
  3. Hassan, A.M.; Mahmoud, M.A.; Al-Majed, A.A.; Al-Shehri, D.; Al-Nakhli, A.R.; Bataweel, M.A. Gas production from gas condensate reservoirs using sustainable environmentally friendly chemicals. Sustainability 2019, 11, 2838. [Google Scholar] [CrossRef]
  4. El Diasty, W.S.; Peters, K.E.; Moldowan, J.M.; Essa, G.I.; Hammad, M.M. Organic geochemistry of condensates and natural gases in the northwest Nile Delta offshore Egypt. J. Pet. Sci. Eng. 2020, 187, 106819. [Google Scholar] [CrossRef]
  5. Clarkson, C.R.; Williams-Kovacs, J.D.; Qanbari, F.; Behmanesh, H.; Heidari Sureshjani, M. History-matching and forecasting tight/shale gas condensate wells using combined analytical, semi-analytical, and empirical methods. J. Nat. Gas Sci. Eng. 2015, 26, 1620–1647. [Google Scholar] [CrossRef]
  6. Sheng, J.J.; Mody, F.; Griffith, P.J.; Barnes, W.N. Potential to increase condensate oil production by huff-n-puff gas injection in a shale condensate reservoir. J. Nat. Gas Sci. Eng. 2016, 28, 46–51. [Google Scholar] [CrossRef]
  7. Wang, X.-W.; Xiao, P.; Yang, Z.-M.; Liu, X.-W.; Xia, Z.-Z.; Wang, L.-Q. Laboratory and field-scale parameter optimization of CO2 huff–n–puff with the staged-fracturing horizontal well in tight oil reservoirs. J. Pet. Sci. Eng. 2020, 186, 106703. [Google Scholar]
  8. Cardott, B.J. Thermal maturity of Woodford Shale gas and oil plays, Oklahoma, USA. Int. J. Coal Geol. 2012, 103, 109–119. [Google Scholar] [CrossRef]
  9. Gherabati, S.A.; Browning, J.; Male, F.; Ikonnikova, S.A.; McDaid, G. The impact of pressure and fluid property variation on well performance of liquid-rich Eagle Ford shale. J. Nat. Gas Sci. Eng. 2016, 33, 1056–1068. [Google Scholar] [CrossRef]
  10. Şen, Ş.; Kozlu, H. Impact of maturity on producible shale oil volumes in the Silurian (Llandovery) hot shales of the northern Arabian plate, southeastern Turkey. AAPG Bull. 2020, 104, 507–524. [Google Scholar] [CrossRef]
  11. Strąpoć, D.; Jacquet, B.; Torres, O.; Khan, S.; Villegas, E.I.; Albrecht, H.; Okoh, B.; McKinney, D. Deep biogenic methane and drilling-associated gas artifacts: Influence on gas-based characterization of petroleum fluids. AAPG Bull. 2020, 104, 887–912. [Google Scholar] [CrossRef]
  12. Chalmers, G.R.; Bustin, R.M.; Power, I.M. Characterization of gas shale pore systems by porosimetry, pycnometry, surface area, and field emission scanning electron microscopy/transmission electron microscopy image analyses: Examples from the Barnett, Woodford, Haynesville, Marcellus, and Doig units. AAPG Bull. 2012, 96, 1099–1119. [Google Scholar]
  13. Merkel, A.; Fink, R.; Littke, R. The role of pre-adsorbed water on methane sorption capacity of Bossier and Haynesville shales. Int. J. Coal Geol. 2015, 147–148, 1–8. [Google Scholar] [CrossRef]
  14. Gou, Q.; Xu, S. The controls of laminae on lacustrine shale oil content in China: A review from generation, retention, and storage. Energies 2023, 16, 1987. [Google Scholar] [CrossRef]
  15. Chen, G.; Tang, Y.; Nan, Y.; Yang, F.; Wang, D. Paleo-sedimentary environments and controlling factors for enrichment of organic matter in alkaline lake sediments: A case study of the Lower Permian Fengcheng Formation in Well F7 at the western slope of Mahu Sag, Junggar Basin. Processes 2023, 11, 2483. [Google Scholar] [CrossRef]
  16. Xiao, H.; Hu, T.; Pang, X.; Ding, C.; Xu, Y.; Zhang, S.; Hu, Y.; Li, C.; Xu, T.; Zheng, D.; et al. A novel method for identifying oil content and moveable thresholds in heterogeneous shales. Fuel 2025, 397, 135473. [Google Scholar] [CrossRef]
  17. Clarkson, C.R.; Haghshenas, B.; Ghanizadeh, A.; Qanbari, F.; Williams-Kovacs, J.D.; Riazi, N.; Debuhr, C.; Deglint, H.J. Nanopores to megafractures: Current challenges and methods for shale gas reservoir and hydraulic fracture characterization. J. Nat. Gas Sci. Eng. 2016, 31, 612–657. [Google Scholar] [CrossRef]
  18. Middleton, R.S.; Carey, J.W.; Currier, R.P.; Hyman, J.D.; Kang, Q.; Karra, S.; Jiménez-Martínez, J.; Porter, M.L.; Viswanathan, H.S. Shale gas and non-aqueous fracturing fluids: Opportunities and challenges for supercritical CO2. Appl. Energy 2015, 147, 500–509. [Google Scholar] [CrossRef]
  19. Zhang, C.P.; Cheng, P.; Ranjith, P.G.; Lu, Y.Y.; Zhou, J.P. A comparative study of fracture surface roughness and flow characteristics between CO2 and water fracturing. J. Nat. Gas Sci. Eng. 2020, 76, 103188. [Google Scholar] [CrossRef]
  20. Jiang, J.; Younis, R.M. Compositional modeling of enhanced hydrocarbons recovery for fractured shale gas-condensate reservoirs with the effects of capillary pressure and multicomponent mechanisms. J. Nat. Gas Sci. Eng. 2016, 34, 1262–1275. [Google Scholar] [CrossRef]
  21. Sheng, J.J. Increase liquid oil production by huff-n-puff of produced gas in shale gas condensate reservoirs. J. Unconv. Oil Gas Resour. 2015, 11, 19–26. [Google Scholar] [CrossRef]
  22. Wang, Q.; Li, Y.; Sanei, H.; Gardner, J.; Rudra, A.; Utley, J.E.P.; Worden, R.H. Lacustrine and fan-delta sediments in syn-rift lake basins. Depos. Rec. 2025, 11. [Google Scholar] [CrossRef]
  23. Yang, W.; Wang, Q.; Wang, Y.; Jiang, Z.; Song, Y.; Li, Y.; Liu, D.; Zuo, R.; Gu, X.; Zhang, F. Pore characteristic responses to categories of depositional microfacies of delta-lacustrine tight reservoirs in the Upper Triassic Yanchang Formation, Ordos Basin, NW China. Mar. Pet. Geol. 2020, 118, 104423. [Google Scholar] [CrossRef]
  24. Wang, Q.; Li, Y.; Yang, W.; Jiang, Z.; Song, Y.; Jiang, S.; Luo, Q.; Liu, D. Finite element simulation of multi-scale bedding fractures in tight sandstone oil reservoir. Energies 2020, 13, 131. [Google Scholar] [CrossRef]
  25. Li, Y.; Song, Y.; Jiang, Z.; Yin, L.; Chen, M.; Liu, D. Major factors controlling lamina induced fractures in the Upper Triassic Yanchang formation tight oil reservoir, Ordos basin, China. J. Asian Earth Sci. 2018, 166, 107–119. [Google Scholar] [CrossRef]
  26. Li, Y.; Wang, Q.; Xu, X.; Jiang, S.; Zhang, F. Permeability evolution of the lamina induced fractures (LFs) during the triaxial compression rupture phase. J. Pet. Sci. Eng. 2020, 188, 106870. [Google Scholar] [CrossRef]
  27. Liu, D.; Li, Y.; Luo, Q.; Wang, Q.; Meng, X.; Ge, Y.; Luo, J.; Feng, H.; Li, Y.; Zhang, X. Dynamic mechanisms of lamina-induced fracture propagation in tight oil-sand formations. Interpretation 2019, 7, T179–T193. [Google Scholar] [CrossRef]
  28. Li, Y.; Song, Y.; Jiang, S.; Jiang, Z.; Yang, W.; Wang, Q.; Liu, D. Tight reservoir oiliness numerical simulation based on a Markov chain Monte Carlo (MCMC) method: A case study of the upper Triassic Yanchang-6 formation (T3ch6 Fm.) outcrop of Ordos Basin. J. Pet. Sci. Eng. 2019, 175, 1150–1159. [Google Scholar] [CrossRef]
  29. Li, Y.; Song, Y.; Jiang, S.; Wang, Q.; Jiang, Z.; Zhang, F. Influence of gas and oil state on oil mobility and sweet-spot distribution in tight oil reservoirs from the perspective of capillary force. SPE Reserv. Eval. Eng. 2019, 23, 824–842. [Google Scholar] [CrossRef]
  30. Li, Y.; Song, Y.; Jiang, Z.; Yin, L.; Luo, Q.; Ge, Y.; Liu, D. Two episodes of structural fractures: Numerical simulation of Yanchang Oilfield in the Ordos basin, northern China. Mar. Pet. Geol. 2018, 97, 223–240. [Google Scholar] [CrossRef]
  31. Wang, Q.; Yang, W.; Li, Y.; Jiang, Z.; Wen, M.; Zuo, R.; Wang, X.; Xue, Z.; Wang, Y. In-situ fluid phase variation along the thermal maturation gradient in shale petroleum systems and its impact on well production performance. J. Earth Sci. 2023, 34, 985–1001. [Google Scholar] [CrossRef]
  32. Li, P.; Hao, F.; Zhang, B.; Zou, H.; Yu, X.; Wang, G. Heterogeneous distribution of pyrobitumen attributable to oil cracking and its effect on carbonate reservoirs: Feixianguan Formation in the Jiannan gas field, China. AAPG Bull. 2015, 99, 763–789. [Google Scholar] [CrossRef]
  33. Wang, Q.; Li, Y.; Utley, J.E.P.; Gardner, J.; Liu, B.; Hu, J.; Shao, L.; Wang, X.; Gao, F.; Liu, D.; et al. Terrestrial dominance of organic carbon in an early cretaceous syn-rift lake and its correlation with depositional sequences and paleoclimate. Sediment. Geol. 2023, 455, 106472. [Google Scholar] [CrossRef]
  34. Wang, P.-J.; Mattern, F.; Didenko, N.A.; Zhu, D.-F.; Singer, B.; Sun, X.-M. Tectonics and cycle system of the Cretaceous Songliao Basin: An inverted active continental margin basin. Earth Sci. Rev. 2016, 159, 82–102. [Google Scholar] [CrossRef]
  35. Espitalié, J.; Marquis, F.; Barsony, I. 9—Geochemical Logging. In Analytical Pyrolysis; Voorhees, K.J., Ed.; Butterworth-Heinemann: Oxford, UK, 1984; pp. 276–304. [Google Scholar]
  36. Wang, Q.; Li, Y.; Sanei, H.; Rudra, A.; Yuan, M.; Wang, Y.; Huang, Y.; Worden, R.H. Restoration of buried organic carbon for catagenesis-affected rocks using Rock-Eval thermal analysis: Assumptions, performance, and uncertainty analysis. Earth Sci. Rev. 2025, 267, 105155. [Google Scholar] [CrossRef]
  37. Ashton, T.; Ly, C.V.; Spence, G.; Oliver, G. Portable technology puts real-time automated mineralogy on the well site. In Proceedings of the SPE Unconventional Resources Conference and Exhibition-Asia Pacific, Brisbane, Australia, 11–13 November 2013. [Google Scholar]
  38. Oliver, G.M.; Ly, C.V.; Spence, G.; Rael, H. A new approach to measuring rock properties data from cores & cuttings for reservoir & completions characterization: An example from the Bakken Formation. In Proceedings of the SPE Unconventional Resources Conference and Exhibition-Asia Pacific, Brisbane, Australia, 11–13 November 2013. [Google Scholar]
  39. Parian, M.; Lamberg, P.; Möckel, R.; Rosenkranz, J. Analysis of mineral grades for geometallurgy: Combined element-to-mineral conversion and quantitative X-ray diffraction. Miner. Eng. 2015, 82, 25–35. [Google Scholar] [CrossRef]
  40. Shi, X.; Jiang, S.; Lu, S.; He, Z.; Li, D.; Wang, Z.; Xiao, D. Investigation of mechanical properties of bedded shale by nanoindentation tests: A case study on Lower Silurian Longmaxi Formation of Youyang area in southeast Chongqing, China. Pet. Explor. Dev. 2019, 46, 163–172. [Google Scholar] [CrossRef]
  41. Zhai, G.; Li, J.; Jiao, Y.; Wang, Y.; Liu, G.; Xu, Q.; Wang, C.; Chen, R.; Guo, X. Applications of chemostratigraphy in a characterization of shale gas Sedimentary Microfacies and predictions of sweet spots—Taking the Cambrian black shales in Western Hubei as an example. Mar. Pet. Geol. 2019, 109, 547–560. [Google Scholar] [CrossRef]
  42. Johnson, C.; Pownceby, M.I.; Wilson, N.C. The application of automated electron beam mapping techniques to the characterisation of low grade, fine-grained mineralisation; potential problems and recommendations. Miner. Eng. 2015, 79, 68–83. [Google Scholar] [CrossRef]
  43. Li, G.; Li, G.; Wang, Y.; Qi, S.; Yang, J. A rock physics model for estimating elastic properties of upper Ordovician-lower Silurian mudrocks in the Sichuan Basin, China. Eng. Geol. 2020, 266, 105460. [Google Scholar] [CrossRef]
  44. Arouri, K.R.; Jenden, P.D.; Al-Hajji, A.A. Petroleum inclusions atop Unayzah gas condensate reservoir: Signpost for an undocumented chapter of the Arabian Basin filling history? Org. Geochem. 2010, 41, 698–705. [Google Scholar] [CrossRef]
  45. Cesar, J.; Eiler, J.; Dallas, B.; Chimiak, L.; Grice, K. Isotope heterogeneity in ethyltoluenes from Australian condensates, and their stable carbon site-specific isotope analysis. Org. Geochem. 2019, 135, 32–37. [Google Scholar] [CrossRef]
  46. Huang, S.; Liu, D.; Wang, Z.; Feng, Z.; Huang, T. Genetic origin of gas condensate in Permian and Triassic strata in the southern Sichuan Basin, SW China. Org. Geochem. 2015, 85, 54–65. [Google Scholar] [CrossRef]
  47. Huang, S.; Wang, Z.; Lv, Z.; Gong, D.; Yu, C.; Wu, W. Geochemical identification of marine and terrigenous condensates—A case study from the Sichuan Basin, SW China. Org. Geochem. 2014, 74, 44–58. [Google Scholar] [CrossRef]
  48. Mei, M.; Bissada, K.K.; Malloy, T.B.; Darnell, L.M.; Liu, Z. Origin of condensates and natural gases in the Almond Formation reservoirs in southwestern Wyoming, USA. Org. Geochem. 2018, 124, 164–179. [Google Scholar] [CrossRef]
  49. Milkov, A.V.; Faiz, M.; Etiope, G. Geochemistry of shale gases from around the world: Composition, origins, isotope reversals and rollovers, and implications for the exploration of shale plays. Org. Geochem. 2020, 143, 103997. [Google Scholar] [CrossRef]
  50. Li, Y.; Xu, X.; Zhang, J.; Chen, S.; Bai, J.; Liu, W.; Wang, Q. Hybrid sedimentary conditions of organic-rich shales in faulted lacustrine basin during volcanic eruption episode: A case study of Shahezi Formation (K1sh Fm.), Lishu Faulted Depression, south Songliao Basin. Earth Sci. 2022, 47, 1728–1747, (In Chinese with English Abstract). [Google Scholar]
  51. Hara, H.; Kurihara, T.; Kuroda, J.; Adachi, Y.; Kurita, H.; Wakita, K.; Hisada, K.-I.; Charusiri, P.; Charoentitirat, T.; Chaodumrong, P. Geological and geochemical aspects of a Devonian siliceous succession in northern Thailand: Implications for the opening of the Paleo-Tethys. Palaeogeogr. Palaeoclimatol. Palaeoecol. 2010, 297, 452–464. [Google Scholar] [CrossRef]
  52. Hu, C.; Zhang, Y.; Tian, J.; Wang, W.; Han, C.; Wang, H.; Li, X.; Feng, S.; Han, C.; Algeo, T.J. Influence of paleo-Trade Winds on facies patterns of the Cambrian Shanganning Carbonate Platform, North China. Palaeogeogr. Palaeoclimatol. Palaeoecol. 2020, 552, 109556. [Google Scholar] [CrossRef]
  53. Li, Y.; Yang, W.; Wang, Q.; Song, Y.; Jiang, Z.; Guo, L.; Zhang, Y.; Wang, J. Influence of the actively migrated diagenetic elements on the hydrocarbon generation potential in tuffaceous shale. Fuel 2019, 256, 115795. [Google Scholar] [CrossRef]
  54. Schenk, B.; Gebhardt, H.; Wolfgring, E.; Zorn, I. Cyclic paleo-salinity changes inferred from benthic foraminiferal assemblages in the Upper Burdigalian (Lower Miocene) Korneuburg Basin, Austria. Palaeogeogr. Palaeoclimatol. Palaeoecol. 2018, 490, 473–487. [Google Scholar] [CrossRef]
  55. Toyoda, K. Geochemical history of ancient Lake Biwa in Japan—Chemical indicators of sedimentary paleo-environments in a drilled core. Palaeogeogr. Palaeoclimatol. Palaeoecol. 1993, 101, 169–184. [Google Scholar] [CrossRef]
  56. Wu, Y.; Tian, H.; Gong, D.; Li, T.; Zhou, Q. Paleo-environmental variation and its control on organic matter enrichment of black shales from shallow shelf to slope regions on the Upper Yangtze Platform during Cambrian Stage 3. Palaeogeogr. Palaeoclimatol. Palaeoecol. 2020, 545, 109653. [Google Scholar] [CrossRef]
  57. Li, W.; Cao, J.; Shi, C.; Xu, T.; Zhang, H.; Zhang, Y. Shale oil in saline lacustrine systems: A perspective of complex lithologies of fine-grained rocks. Mar. Pet. Geol. 2020, 116, 104351. [Google Scholar] [CrossRef]
  58. Algeo, T.J.; Liu, J. A re-assessment of elemental proxies for paleoredox analysis. Chem. Geol. 2020, 540, 119549. [Google Scholar] [CrossRef]
  59. Breit, G.N.; Wanty, R.B. Vanadium accumulation in carbonaceous rocks: A review of geochemical controls during deposition and diagenesis. Chem. Geol. 1991, 91, 83–97. [Google Scholar] [CrossRef]
  60. Tribovillard, N.; Algeo, T.J.; Lyons, T.; Riboulleau, A. Trace metals as paleoredox and paleoproductivity proxies: An update. Chem. Geol. 2006, 232, 12–32. [Google Scholar] [CrossRef]
  61. Ji, Z.; Meng, Q.; Wan, C.; Ge, W.; Yang, H.; Zhang, Y.; Dong, Y.; Jin, X. Early Cretaceous adakitic lavas and A-type rhyolites in the Songliao Basin, NE China: Implications for the mechanism of lithospheric extension. Gondwana Res. 2019, 71, 28–48. [Google Scholar] [CrossRef]
  62. Zhang, L.; Wang, C.; Wignall, P.B.; Kluge, T.; Wan, X.; Wang, Q.; Gao, Y. Deccan volcanism caused coupled pCO2 and terrestrial temperature rises, and pre-impact extinctions in northern China. Geology 2018, 46, 271–274. [Google Scholar] [CrossRef]
  63. Zou, C.; Zhu, R.; Chen, Z.-Q.; Ogg, J.G.; Wu, S.; Dong, D.; Qiu, Z.; Wang, Y.; Wang, L.; Lin, S.; et al. Organic-matter-rich shales of China. Earth Sci. Rev. 2019, 189, 51–78. [Google Scholar] [CrossRef]
  64. Lerch, B.; Karlsen, D.A.; Abay, T.B.; Duggan, D.; Seland, R.; Backer-Owe, K. Regional petroleum alteration trends in Barents Sea oils and condensates as a clue to migration regimes and processes. AAPG Bull. 2016, 100, 165–190. [Google Scholar] [CrossRef]
  65. Liu, Y.; Qiu, N.; Hu, W.; Li, H.; Shen, F.; Yao, Q. Temperature and pressure characteristics of Ordovician gas condensate reservoirs in the Tazhong area, Tarim Basin, northwestern China. AAPG Bull. 2019, 103, 1351–1381. [Google Scholar] [CrossRef]
  66. Su, J.; Zhang, S.; Huang, H.; Wang, Y.; Wang, H.; He, K.; Wang, X.; Zhang, B.; Wang, H. New insights into the formation mechanism of high hydrogen sulfide–bearing gas condensates: Case study of Lower Ordovician dolomite reservoirs in the Tazhong uplift, Tarim Basin. AAPG Bull. 2016, 100, 893–916. [Google Scholar] [CrossRef]
  67. Huang, R.; Li, J.; Xie, Z.; Li, J. Formation and distribution of condensate gas pools in China. Oil Gas Geol. 1996, 17, 237–242, (In Chinese with English Abstract). [Google Scholar]
  68. Varela, S.; Lobo, J.M.; Hortal, J. Using species distribution models in paleobiogeography: A matter of data, predictors and concepts. Palaeogeogr. Palaeoclimatol. Palaeoecol. 2011, 310, 451–463. [Google Scholar] [CrossRef]
  69. Cao, J.; Xia, L.; Wang, T.; Zhi, D.; Tang, Y.; Li, W. An alkaline lake in the Late Paleozoic Ice Age (LPIA): A review and new insights into paleoenvironment and petroleum geology. Earth Sci. Rev. 2020, 202, 103091. [Google Scholar] [CrossRef]
  70. Kolker, A. Minor element distribution in iron disulfides in coal: A geochemical review. Int. J. Coal Geol. 2012, 94, 32–43. [Google Scholar] [CrossRef]
  71. Kwiecińska, B.; Pusz, S.; Valentine, B.J. Application of electron microscopy TEM and SEM for analysis of coals, organic-rich shales and carbonaceous matter. Int. J. Coal Geol. 2019, 211, 103203. [Google Scholar] [CrossRef]
Figure 1. (a) The tectonic units of the Songliao Basin in northeastern Asia and the location of the Lishu Rift Depression. (b) Spatial distribution of mudstones and total organic carbon (TOC) concentrations within the Lishu Rift Depression. (c) An interpreted seismic reflection profile A–A’ showing the basin geometry, major faults, and depositional filling of the Lishu Rift Depression. The profile location is illustrated in panel (b). (d) A stratigraphic section measured from drilling boreholes, illustrating the tectonostratigraphic evolution, sedimentary settings, and hydrocarbon phase changes of the Lishu Rift Depression.
Processes 13 01868 g001
Figure 2. Comprehensive stratigraphic section of the lacustrine-dominated interval within the Shahezi Formation (JLYY1 borehole, Lishu Rift Depression), illustrating the vertical variations in lithology, facies associations (FA1–FA7, after Wang et al., 2025) [22], mineral composition, total organic carbon (TOC) content, pyrolysis logging proxies (S0, S1, S2, and S4), geochemical indicators, and total gas content (TGC). The Al/Ti ratio is used to infer paleoclimate conditions (humid vs. dry), while the (Al + Fe)/(Ca + Mg) proxy reflects paleowater depth. Sr/Ba and Ca/(Ca + Fe) ratios are employed to differentiate paleosalinity (freshwater vs. saline lake), the Zr/Ti ratio indicates the input intensity of volcanic materials, and the U/Th ratio serves as an indicator of bottom-water paleoredox conditions.
Processes 13 01868 g002
Figure 3. Ternary (ac) and box (d) diagrams showing the correlation between RoqSCAN mineral composition, total organic carbon (TOC) concentrations, and pyrolysis S1 values. S1 values are used to indicate the contents of liquid hydrocarbons.
Processes 13 01868 g003
Figure 4. Ternary (ac) and box (d) diagrams showing the correlation between RoqSCAN mineral composition, total organic carbon (TOC) concentrations, and total gas contents (TGC). TGC values are used to indicate the contents of liquid hydrocarbons.
Processes 13 01868 g004
Figure 5. A scatter diagram of thermal maturation (Tmax), Hydrocarbon Saturation Classification Index (HSCI), pyrolysis S1, and total gas content (TGC), illustrating the changes in hydrocarbon fluid phase with evolving thermal maturation in the Shahezi Formation shales (JLYY1 borehole, Lishu Rift Depression, Songliao Basin). Frequency distribution histograms and box-and-whisker plots for Tmax, HSCI, and TGC are also provided, showing data distribution, outliers, and confidence intervals for these variables.
Processes 13 01868 g005
Figure 6. SEM photomicrographs of lacustrine shale samples from the Shahezi Formation (JLYY1 borehole, Lishu Rift Depression, Songliao Basin). (ad) Secondary electron (SE) images, 3124.55 m depth. Panels (b) and (d) are magnified views of selected regions in (a) and (b), respectively. (e) Backscattered electron (BSE) image, 3128.67 m depth. (f) SE image, 3130.2 m depth. Images (ce) show the microscopic structure and mineral composition of tuff laminae, consisting predominantly of authigenic chlorite blades, quartz, minor calcite, and pore-filling solid bitumen. These organomineral composites are interpreted as products of the devitrification of volcanic glass [22]. During this process, montmorillonite formed in early stages reacts with Fe oxide in shallow-water and alkaline conditions to produce chlorite, releasing Ca2+ and Si4+ ions that contribute to the generation of calcite and quartz. Abbreviations: Ilt = illite; Bt = biotite; Ms = muscovite; Chl = chlorite; Cal = calcite; Qz = quartz; Sb = solid bitumen; TOM = terrigenous organic matter.
Processes 13 01868 g006
Figure 7. RoqSCAN SEM-EDS photomicrographs of lacustrine shale samples from the Shahezi Formation (JLYY1 borehole, Lishu Rift Depression, Songliao Basin), showing four types of laminae: (a) 3125.15 m depth, calcareous laminae; (b) 3125.15 m depth, non-clay mineral silicate laminae; (c) 3155.5 m depth, argillaceous laminae; and (d) 3138.4 m depth, pyrite laminae.
Processes 13 01868 g007
Figure 8. A schematic diagram showing the hydrocarbon generation and evolution model of the shale gas condensate reservoir in syn-rift lake basins. Four controlling factors are illustrated in this model: (1) rock components and lithofacies; (2) thermal maturity and hydrocarbon fluid phases; (3) paleoenvironmental conditions; and (4) shale lamination and lamina-induced fractures. (a) Second electron (SE) image, 3101.24 m depth. (b) Backscattered electron (BSE) image, 3166.52 m depth. (c) SE image, 3130.2 m depth. (d) SE image, 3124.55 m depth. (e,f) SE images, 3125.19 m depth. (g) SE image, 3122 m depth. (h) SE image, 3131.96 m depth. Panel (f) is an enlarged view of a region of (e).
Processes 13 01868 g008
Table 1. Measured fluid composition and fraction properties for typical condensate gas regions. Separator gas and oil samples were captured and recombined to the reported GOR in the laboratory.
GOR (scf/STB) 13000–40004000–50005000–80008000–15,00015,000–50,000
Specific gravity (°API)52.155.5N/A 254.58N/A
Reservoir pressure (psi)11,02510,63010,0009300N/A
Reservoir temperature (°F)321328300290275
Dew point (psi)43124165405038923310
CO21.070.691.571.9711.10
N20.150.070.090.0920.10
C161.8864.1767.9769.72272.60
C211.6411.2211.6111.79112.95
C35.585.464.574.1653.79
I-C41.321.531.381.3161.25
N-C42.352.391.901.671.46
I-C51.201.351.241.1881.14
1 scf/STB: cubic feet of gas per barrel of oil or condensate. 2 N/A: not available.
Disclaimer/Publisher’s Note: The statements, opinions and data contained in all publications are solely those of the individual author(s) and contributor(s) and not of MDPI and/or the editor(s). MDPI and/or the editor(s) disclaim responsibility for any injury to people or property resulting from any ideas, methods, instructions or products referred to in the content.

