Abstract
This study explores the production of anhydrous ethanol from discarded fruits, aiming to determine optimal fermentation conditions and evaluate the feasibility of a green separation technology. Fermentation experiments were performed using juices from Psidium guajava (S1), Carica paapaya (S2), and mucilage residues of Coffea arabica (S3). All fermentations were carried out at a pH of 4.5 for 7 days in 1 L bioreactors. A full 22 factorial design was applied to evaluate the effects of two variables: yeast type (commercial Saccharomyces cerevisiae [CY] vs. native yeast [NY]) and temperature (21 °C vs. 30 °C). Higher ethanol concentrations were achieved with CY at 30 °C, yielding 6.79% ethanol for S3. A multi-criteria matrix prioritized coffee residues due to their high ethanol yield, biomass availability, and economic viability. The ethanol was dehydrated using a packed-bed bioadsorption system with crushed corn, which increased purity from 6.7% v/v to 98.9% v/v in two stages, while avoiding azeotropic limitations. Energy analysis revealed low specific consumption (3.68 MJ/kg), outperforming conventional distillation. The results of this study, obtained at operating temperatures of 30 °C and 21 °C, a pH of 4.5, and an operating time of 7 days in a 1L bioreactor, demonstrate ethanol concentrations of 6.79%, confirming the technical feasibility of using agricultural waste as a raw material and validating the efficiency of a bioadsorption-based dehydration system. These findings address the current gap in integrating green ethanol separation with low-cost agricultural residues and highlight a sustainable alternative for decentralized bioethanol production.
1. Introduction
The global ethanol market size was valued at USD 87.71 billion in 2022 and is projected to grow from USD 92.48 billion in 2023 to USD 135.07 billion by 2030, with a 5.6% growth rate over the forecast period [1].
To meet ethanol demand, an expansion of cultivation areas is required. It is estimated that approximately 48% and 36% of the current arable land in the United States and Europe, respectively, would be needed to replace 10% of gasoline with biofuels [2]. Additionally, environmental impacts, such as increased water consumption for crops, contamination from surface runoff, and groundwater infiltration of nutrients (e.g., nitrates from fertilizers), are significant. Other negative effects include soil erosion and degradation due to land expansion, high-speed waste disposal, and land-use changes [3]. Social impacts also arise, such as food price increases, due to competition for arable land and access to irrigation water.
Given these challenges, there is a growing interest in intensifying second-generation ethanol production using agricultural residues and by-products, particularly from fruit crops [4], which represent 14% of global waste [5]. Agricultural residues are rich in cellulose, hemicellulose, lignin, pectin, and simple sugars, making them suitable raw materials for ethanol production [6], thus mitigating competition for arable land and minimizing negative effects on food security.
The fruit and vegetable segment are one of the leading sectors in the agri-food industry in terms of waste generation, including peels, seeds, stems, rinds, and leaves [7]. Approximately 45% of global fruit and vegetable production is wasted, with 21% of losses occurring between harvest and distribution [8]. Fruit waste can account for 10% to 60% of the total fruit weight, with peels alone ranging between 15% and 40% [9,10].
In Colombia, 9.76 million tons of food are wasted annually, equivalent to 34% of total production. The highest losses occur in the fruit and vegetable supply chains, representing 62% of the total. Losses are most pronounced during the production phase (40.5%, or 3.95 million tons), followed by the post-harvest and storage phase (19.8%, or 1.93 million tons), and the industrial processing phase (3.5%, or 342,000 tons) [11]. To mitigate the environmental impact of industrial waste, various alternatives have been explored to transform these by-products into value-added compounds, such as ethanol [12,13,14].
Several raw materials have been studied for ethanol production, including sugarcane bagasse, corn, lignocellulosic biomass, and agro-industrial residues [15]. For instance, sugarcane-based ethanol dominates biofuel markets due to the high carbohydrate content and fermentation efficiency [16]. Lignocellulosic biomass, such as corn stover and wheat straw, has been explored as a second-generation bioethanol source, though challenges such as pretreatment and enzymatic hydrolysis persist [17]. More recently, studies have evaluated fruit and food waste as alternative substrates, with promising ethanol yields and reduced competition with food supply chains [18,19].
Previous studies have demonstrated second-generation ethanol production through the alcoholic fermentation of guava [20], papaya [21], and coffee pulp [22]. Following fermentation, ethanol is typically processed in distillation columns [23]. While non-conventional systems—such as pervaporation, vacuum distillation, adsorption, gas extraction, solvent extraction, and other hybrid processes—have been proposed as energy-saving alternatives for ethanol recovery, their large-scale integration in the industry remains limited [24].
Distillation is the main energy consumer and cost driver in conventional ethanol recovery processes [24]. The separation of azeotropic mixtures presents a major challenge for equilibrium-based methods. Common approaches—such as extractive distillation, azeotropic distillation, liquid–liquid extraction, and membrane distillation—are effective but involve high unit costs, particularly in developing countries [25,26]. Despite the ongoing advances, no large-scale alternative has yet replaced conventional pre-concentration systems while maintaining low energy consumption [27].
An adsorption system for solvent dehydration is a set of equipment and materials designed to remove water content from organic solvents through the adsorption process. This process relies on the physical or chemical adhesion of water molecules onto the surface of an adsorbent material, without altering the chemical composition of the solvent [28].
In the specific case of ethanol dehydration, the adsorption system employs an adsorbent material to remove water from an ethanol solution—typically an azeotropic mixture—in order to obtain anhydrous ethanol. The operational procedure involves bringing ethanol into contact with the adsorbent, followed by a regeneration process that enables the reuse of the material [29].
The use of adsorption in ethanol dehydration aims to reduce the energy consumption associated with conventional dehydration technologies, which rely exclusively on distillation operations. As a result, modern anhydrous ethanol production plants have increasingly adopted adsorption systems as a more energy-efficient alternative [30].
In this study, ethanol production was carried out using a full 22 factorial experimental design, employing guava, papaya, and coffee residues as fermentation substrates. Ethanol separation was achieved through a novel gas-phase dehydration technology developed by the CIBIOT group at Universidad Pontificia Bolivariana [29]. This innovation eliminates azeotropic limitations by using a packed bed of crushed grains as the adsorbent material, integrated with a thermal exchange column that enhances energy efficiency.
2. Materials and Methods
2.1. Fermentation
Ethanol was produced using two types of rejected fruits, Psidium guajava (guava) and Carica papaya (papaya), as well as mucilage residues from Coffea arabica (coffee), through yeast fermentation.
The substrates from papaya, guava, and coffee residues were prepared by blending the respective pulps in a Black and Decker® blender (model BLM10350G, Black & Decker Inc., Towson, MD, USA). A 1:4 pulp-to-water ratio was used in all cases. However, only the coffee pulp underwent an additional thermal treatment: the mixture was heated at 55 °C for 30 min and then filtered using an 80-mesh screen.
The fermentations were inoculated with two types of yeast: a commercial strain (Levapan) and a native strain. The native yeast strain was isolated from each substrate by preparing fruit musts at 20% (w/v) until a homogeneous suspension was obtained. The resulting product was stored in a container sanitized with 5% hypochlorite for 40 min. It was then kept at room temperature in a cool, dry, and dark place for eight days, after which native yeast was isolated from the juice of each fruit residue. For the yeast isolation process, each must was cultured on PDA (Potato Dextrose Agar) plates using streak and well-diffusion methods. The plates were incubated at 30 °C [31].
To purify the yeast, a detailed examination of the microbial growth on the Petri dishes was conducted, focusing on yeast colonies. Qualitative analyses were performed to confirm their identity. Additionally, cross-streaking techniques were employed [32]. Using an inoculating loop, a sample from the identified yeast colonies was streaked across the PDA medium. This procedure was repeated at least once a week for two months for each substrate.
To assess the operational conditions for ethanol production, fermentations were performed following the experimental design matrix shown in Table 1, with different substrates used in each trial, as indicated in Table 2.

Table 1.
22 Experimental design matrix for each substrate.
Table 2.
Substrates used in fermentation process.
Each trial was conducted in a 500 mL container sanitized beforehand, with 300 mL of substrate and 10% inoculum added after activation. Samples for trials 1 and 3 were placed in an oven (WTC Binder, 12880, Tuttlingen, Germany) at 30 °C, while samples for trials 2 and 4 were kept in the laboratory at 21 °C.
Fermentation was carried out for seven days under anaerobic conditions at a pH of 4.5. After this period, a 10 mL sample was taken and placed in a Falcon tube. The samples were centrifuged at 5000 rpm for 15 min, and the supernatant was filtered using a 0.45 μm membrane filter. Ethanol concentration was then quantified using high-performance liquid chromatography (Prominence, Shimadzu Corporation, Columbia, MD, USA) controlled by a workstation with Lab Solutions software (version 5.82) and equipped with a UV/VIS diode array detector.
The data collected from the experiments were analyzed statistically to assess the fermentation treatments for ethanol production. Statistical analyses were conducted using Statgraphics Centurion XIX® (Statgraphics Technologies, Version 19.0, The Plains, VA, USA).
2.2. Selection of the Ethanol Produced to Be Distilled
To select the fermentation process for ethanol concentration using a packed-bed bioadsorption dehydration system, a multi-parameter priority matrix was developed. This matrix evaluated the fermentation process conditions and the agricultural residue used, based on the following criteria: ethanol concentration obtained during fermentation (C1), residual biomass from the fruit (C2), cultivated area in Colombia (C3), seasonal availability (C4), and commercial cost of the fruit (C5). Each criterion was assessed using a three-level Likert scale (1, 3, 5), as shown in Table 3.
Table 3.
Likert scale for process evaluation criteria.
The weights for each criterion were estimated using the eigenvector technique as described by Rendón-Castrillón et al. [33]. The collected data were analyzed by pairwise comparison, with Pearson distance correlation calculated as shown in Equation (1):
where and represent the criteria scores, and are the score means.
The collection of distance correlations derived a symmetric square matrix, R, of dimensions 5 × 5. The eigenvectors were calculated using Equation (2):
where is the eigenvalue of , is the identity matrix of a dimension of 5 × 5, and is the eigenvector of . The eigenvector corresponding to the largest eigenvalue, max, of the correlation distance matrix, , was used to derive the weights in accordance with the Perron–Frobenius theorem, which ensures that for a positive reciprocal matrix, the principal eigenvector provides a consistent estimate of the relative weights among criteria.
The eigenvector method was applied to capture the correlation structure among selected criteria and to derive consistent relative weights. This statistical tool was used as a support for decision structuring, not as an absolute measure of criterion importance.
After substituting the quantitative judgments of criteria from C1 to C5 into MS Excel to perform the Pearson distance correlation operation, we obtained a proximity matrix as shown in Equation (3).
Taking advantage of the eigenvalue algorithms, we found a set of eigenvalues: 3.366, 1.634, 0, 0 and 0. The eigenvector corresponding to the maximum eigenvalue max = 3.366 was [0.385, 0.385, 0.526, 0.385, −0.526]. Further normalizing this eigenvector, the weights of the criteria from C1 to C5 were determined as follows, according to Equation (4).
2.3. Ethanol Dehydration via Bioadsorption
The ethanol concentration from the prioritized fermentation process was obtained using a packed-bed bioadsorption solvent dehydration system, which was constructed and patented for this purpose [29]. The system consists of a cylindrical stainless-steel dehydration column, with a height of 2.5 m and an internal diameter of 0.15 m. The packed bed contained crushed corn, with a particle size between mesh sizes 8 and 9, arranged homogeneously along the column using a redistribution system as proposed by Ramírez-Carmona et al. [34].
The system operates at a pressure of 1.2 atm and an inlet temperature of 85 °C through energy integration with a thermal conditioning column. This column consisted of spiral heat exchangers connected laterally to the dehydration column via a network of pipes controlled by solenoid valves. Hot gases from a propane combustion flame served as the heat source, directing the vapor-phase ethanol–water mixture from the boiler vessel to the dehydration column, as shown in Figure 1.
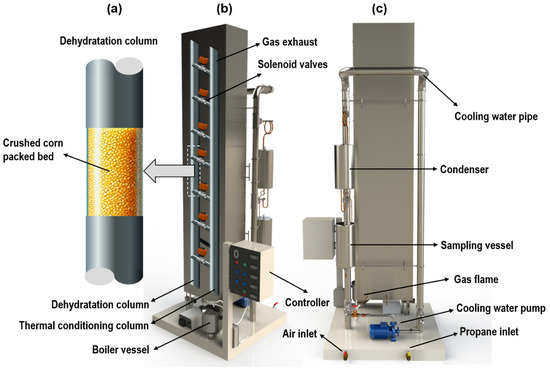
Figure 1.
Solvent dehydration system used for concentrating the ethanol produced in this study. (a) Detail of the packed bed with crushed corn as the adsorbent material, (b) isometric front view of the solvent dehydration system with its components, and (c) rear view of the solvent dehydration system showing thermal elements and the sampling port.
The system included three thermocouple temperature sensors positioned equidistantly along the dehydration column to monitor the thermal profile during operation. Additionally, a concentric-tube condenser located at the column outlet operated with cooling water. A controller regulated the ignition of the propane flame to ensure optimal operation.
The operation consisted of two stages:
Pre-heating Stage: The packed bed was pre-heated by injecting compressed air into the spiral heat exchangers within the thermal conditioning column, which operates with propane gas. The heated air was then injected laterally into the dehydration column through a parallel piping arrangement regulated by solenoid valves, raising the temperature of the crushed corn packed bed to 85 °C.
Dehydration Stage: Once pre-heating was complete, the hot air supply was suspended. The fermented liquid was evaporated in the boiler vessel and directed through the dehydration column. As the ethanol–water vapor mixture was passed through the column; water was adsorbed onto the corn packed bed, increasing the ethanol concentration in the gas phase. The concentrated vapor was subsequently condensed into a saturated liquid for further analysis.
The distillate flow rate was measured volumetrically in triplicate, while ethanol concentration was determined using refractive index measurements with a calibrated refractometer (XRCLIF, RZ116, Guangzhou, China). The properties of the ethanol–water solutions in both the feed and distillate were estimated using the NRTL thermodynamic model, employing the DIPPR database in MS Excel [35].
2.4. Mass and Energy Balances
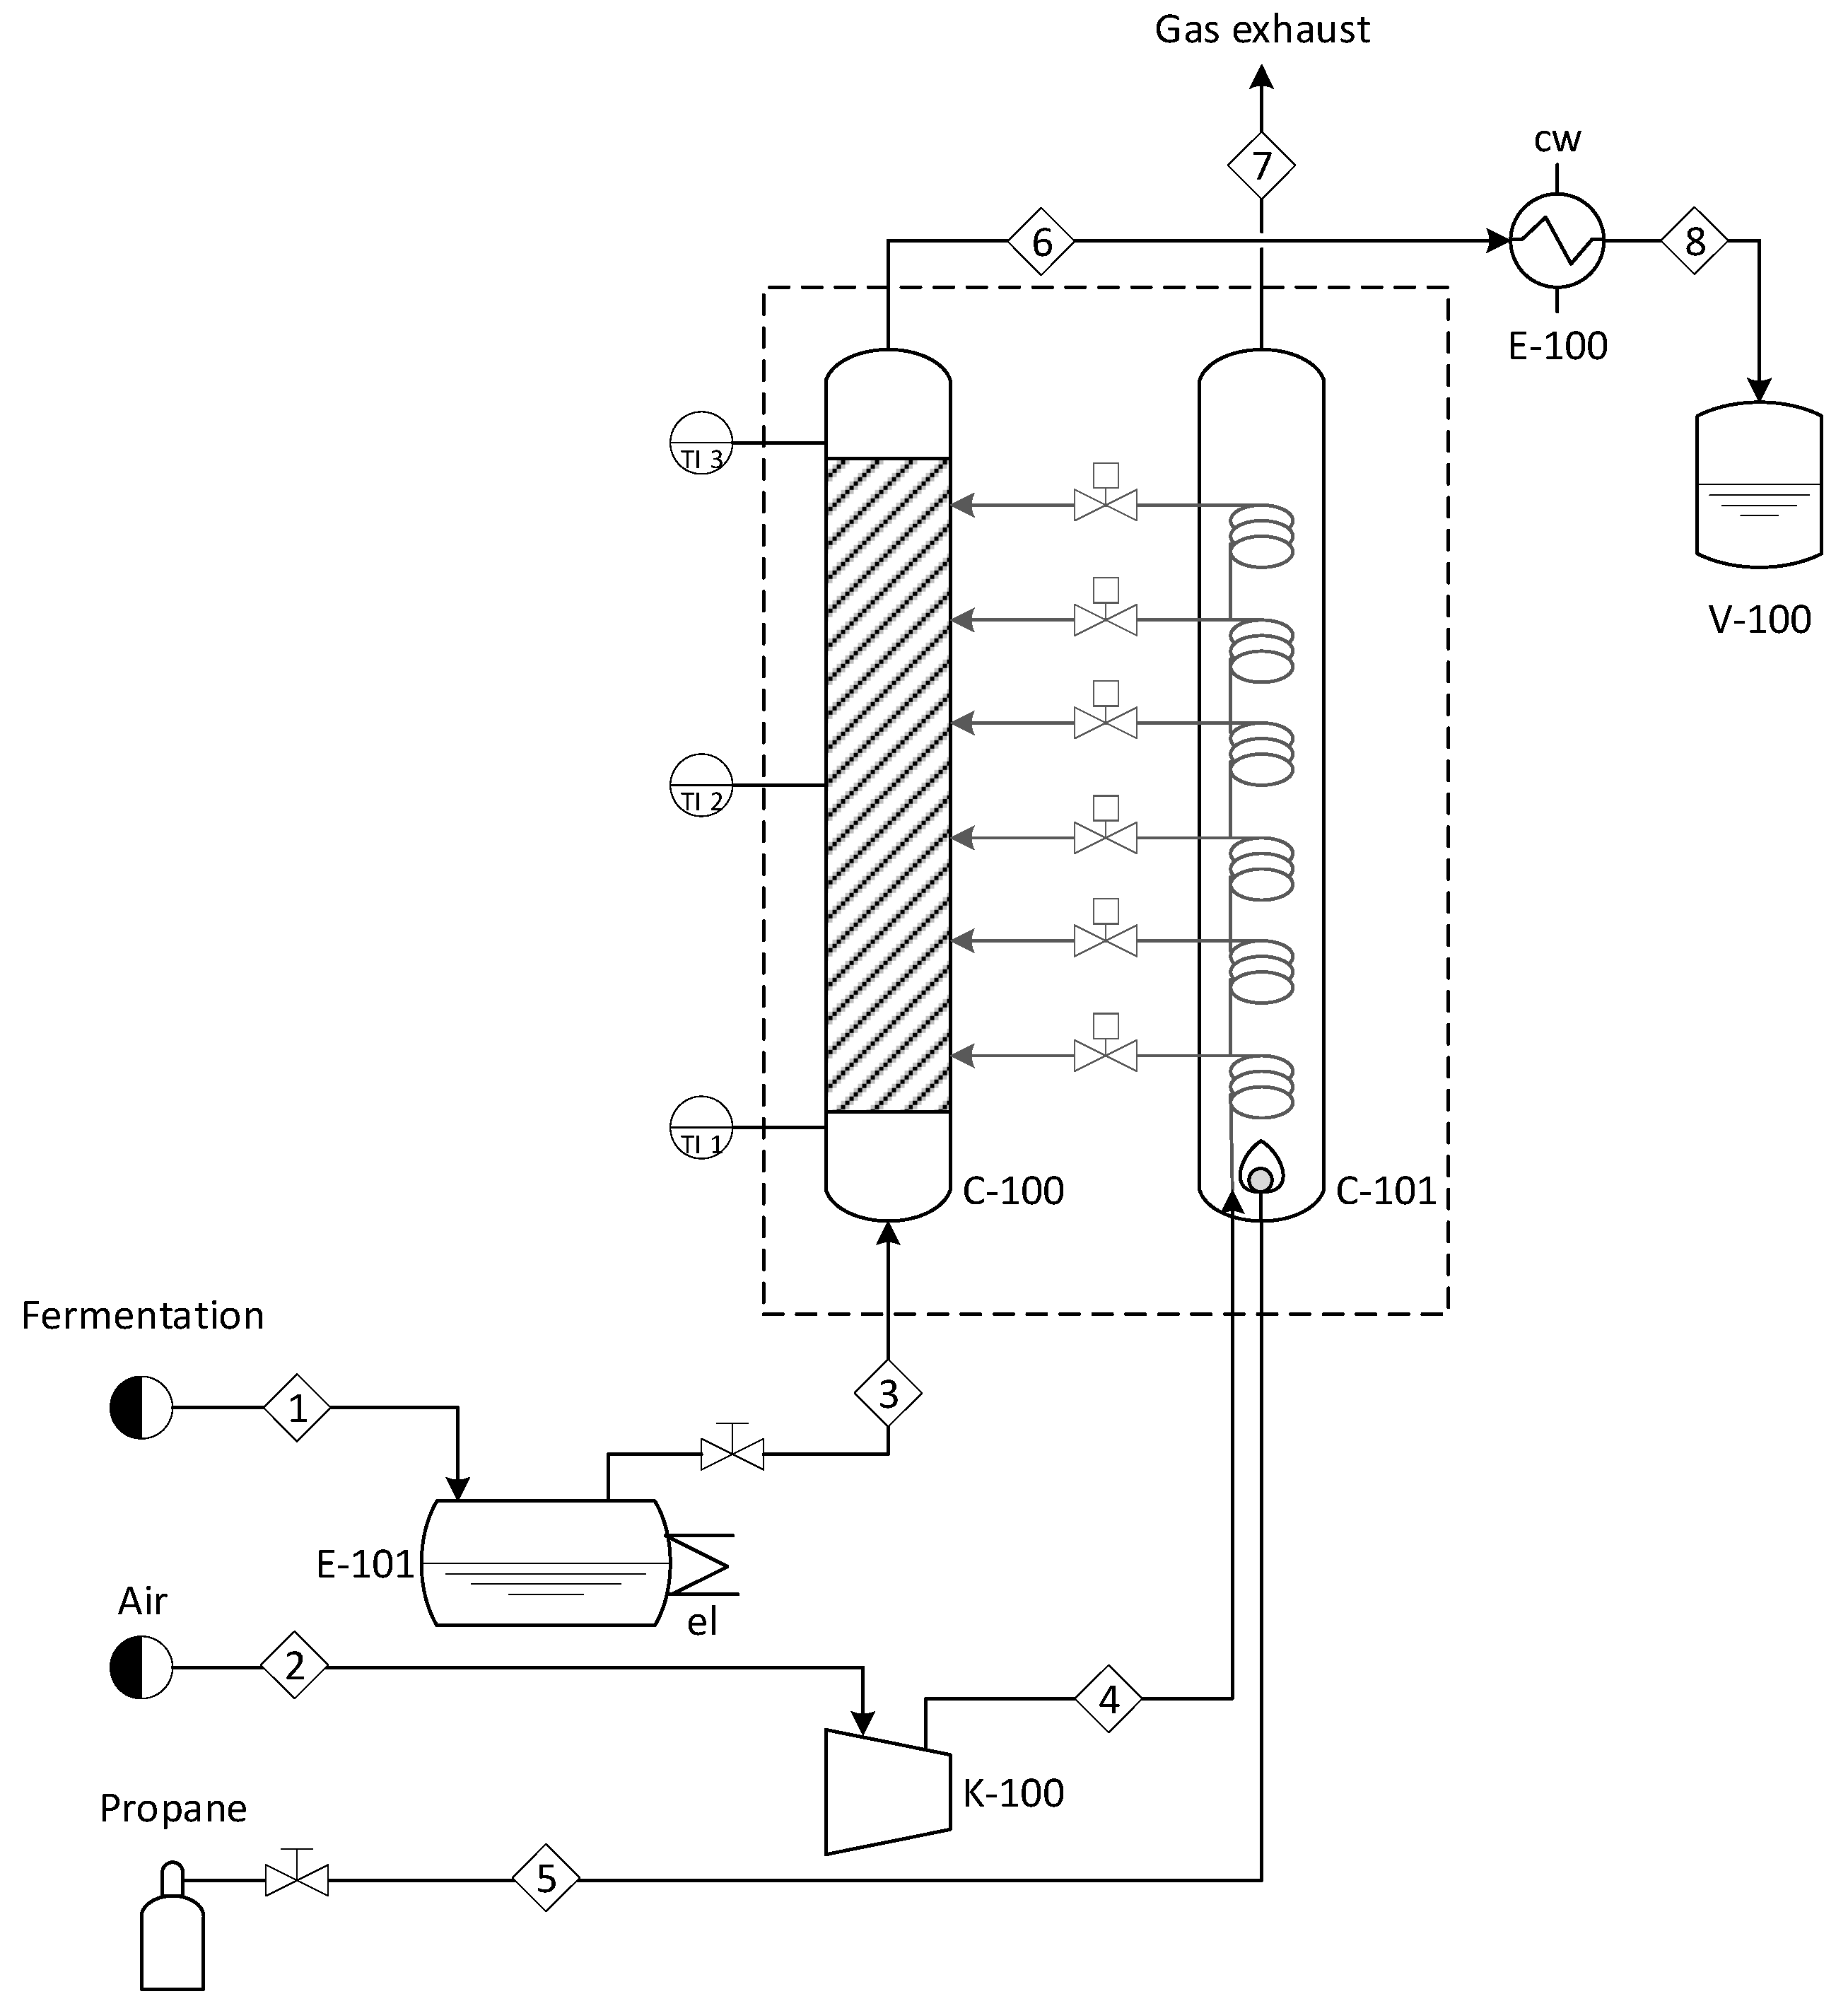
During ethanol dehydration via bioadsorption, mass and energy balances were evaluated. The process flow diagram of the solvent dehydration system used for these balances is shown in Figure 2.

Figure 2.
Process flow diagram of the solvent dehydration system used to perform mass and energy balances. The numbered diamonds (1–8) indicate process streams as follows: (1) fermented liquid feed entering the boiler (E-101); (2) compressed air entering the thermal conditioning column (C-101); (3) ethanol–water vapor stream entering the packed-bed dehydration column (C-100); (4) exhaust air leaving the thermal conditioning column; (5) propane gas supply entering the burner of the thermal conditioning column (C-101); (6) dehydrated ethanol-rich vapor stream exiting the packed column; (7) combustion exhaust gases from the thermal conditioning unit; (8) condensed ethanol product obtained from stream (6).
where:
C-100: Packed-bed dehydration column;
C-101: Thermal conditioning column;
E-100: Concentric-tube condenser;
E-101: Boiler vessel with induction heating;
K-100: Air compressor;
TI1, TI2, TI3: Temperature sensors;
V-100: Sampling vessel.
2.4.1. Mass Balances
For the mass balance of ethanol dehydration, it was assumed that no chemical reactions occurred and that selective adsorption of water vapor took place on the surface of the packed bed of crushed corn. The control volume was limited to the boundary of C-100. A total mass balance and a water-specific balance were applied, as described in Equations (5) and (6):
where is the mass fraction of water in process stream 3; is the mass fraction of ethanol in process stream 6; and are the mass flows of process streams 3 and 6, respectively; and is the mass flow of water adsorbed in the packed bed of crushed corn.
2.4.2. Energy Balances
The global energy balance during the first stage of the system’s operation, under steady-state conditions, was calculated using Equation (7):
where (W) is the heat generated by propane combustion, (W) and (W) represent the heat transferred by convection and radiation, respectively, between the system’s surface and the surroundings, (W) is the heat absorbed by the air stream during the pre-heating stage, and (W) is the heat lost by convection from the thermal conditioning column exhaust.
The value of was determined using the stoichiometry shown in Equation (8), with a standard reaction enthalpy of = −2.04 × 10⁶ kJ/kmol [36].
The heat transferred by convection (W) and radiation (W) was calculated using Equations (9) and (10):
where (W/m2⋅K) is the convection coefficient between the surface of the dehydration system and the surroundings, (K) is the surface temperature of the dehydration system (343.1 K), (K) is the ambient temperature (299.2 K), (m2) is the surface area of the packed-bed system (4.8 m2), is the emissivity of steel (0.17), and y is the Stefan–Boltzmann constant (5.67 × 10⁻⁸ W/m2⋅K4).
The convection coefficient, , was estimated using correlations of the Nusselt (), Rayleigh (), and Prandtl () numbers, as shown in Equations (11) and (12):
where (m) is the system height (3 m), (m3) is the system volume (0.36 m3), (m/s2) is the gravitational acceleration (9.81 m/s2), (W/m⋅K) is the air’s thermal conductivity (0.02717 W/m⋅K), is the Prandtl number of air (0.723), (m2/s) is the air’s kinematic viscosity (1.77 × 10⁻⁵ m2/s), and (m2/s) is the air’s thermal diffusivity (2.45 × 10⁻⁵ m2/s). The mean value of the properties was estimated between and .
The heat absorbed by the air stream entering the thermal conditioning column during the pre-heating of the packed bed, (W), was calculated using Equation (13):
where (kg/s) is the mass flow of air entering stream 4, (kJ/kg⋅K) is the average heat capacity of the air entering from the compressor (1.012 kJ/kg⋅K), (K) is the temperature of the air at the inlet, and (K) is the temperature of the air at the outlet.
The heat required to evaporate the feed, (W), was calculated using Equation (14):
where (kg/s) is the feed mass flow, (kJ/kg⋅K) is the heat capacity of the feed stream, (K) is the bubble temperature of the feed at the operating pressure of the dehydration system, (K) is the temperature, and (kJ/kg) is the latent heat of vaporization of the feed at the operating pressure of the dehydration system.
2.4.3. Packed-Bed Behavior
To assess the performance of the packed column used for ethanol dehydration, we estimated the pressure drop, the superficial velocity, and saturation time of the maize-based adsorbent. The pressure drop across the packed column was estimated using the Ergun model, as presented in Equation (15):
where is the pressure drop (Pa), is the particle diameter (0.002 m), is the packed bed porosity (estimated as 0.4 according to [37]), is the viscosity of the water–ethanol mixture in gas phase (1.20 × 10⁻⁵ Pa·s), is the superficial velocity that is estimated as the ratio of the volumetric flow rate of the fed water–ethanol mixture to the cross-sectional area of the packed column (0.0177 m2), is the density of the water–ethanol mixture in gas phase (1.5 kg/m3), and is the column height (2.5 m).
The saturation time of the crushed maize used as an adsorbent in the packed column was estimated based on its water adsorption capacity and the mass flow rate of water in the vapor mixture. The calculation followed the mass balance approach, assuming that the maize retains water until reaching its maximum adsorption capacity. The total mass of maize in the packed bed () was determined using the bed volume and porosity, as presented in Equation (16):
where is the bulk density of the crushed maize (kg/m3), is the volume of the packed column (m3), and is the packed-bed porosity (0.4). The saturation time () was determined by dividing the total adsorbed water by the water mass flow rate in the vapor mixture, as presented in Equation (17):
where is the total amount of water that the maize could adsorb (kg/h), and is the mass flow rate of water in the vapor phase (kg/h), as explained in the mass balances.
3. Results and Discussion
3.1. Fermentation Results
The fermentations were performed using a full 22 factorial design, which analyzed the influence of yeast type and temperature on ethanol production for each substrate: S1, S2, and S3. For substrates S1 and S2, the rejected fruits’ peels, seeds, and pulp were used, while for S3, coffee mucilage was employed. The pH was set to 4.5, and the operational time was fixed at seven days for all trials.
Guava was selected as substrate S1 due to its high antioxidant content, including vitamin C, vitamin E, phenols, and carotenoids [38]. In addition, it contains reducing sugars ranging from 2.1% to 6%, and total sugars from 2.25% to 4.05% [39]. The seeds also enhance the fermentation process due to their fatty acid content, which provides antifoaming properties during fermentation. This helps prevent microbial contamination and reduces substrate loss [20].
Papaya was used as substrate S2 because it contains about 14.21% protein, which plays an important role in fermentation [40]. It also has a sugar composition of sucrose (48.13%), glucose (29.8%), and fructose (21.9%) [21]. Furthermore, papaya provides vitamins (A, B1, B2, C, D) and minerals such as calcium, potassium, sodium, and magnesium [41], which act as essential cofactors in yeast metabolism [42].
Coffee was employed as substrate S3 because it contains 22.65% reducing sugars by dry weight, including D-fructose (in its α and β anomers), D-glucose (in both anomers), sucrose (14.1%), D-galactose (10.1%), and inositol (1.2%). These fermentable sugars enhance ethanol production while minimizing the formation of by-products, like vinasse [43,44]. Additionally, coffee contains proteins, tannins, and other compounds that promote ethanol production [45].
The yeast used for ethanol production was Saccharomyces cerevisiae, a common strain in the industry due to its robustness, high ethanol tolerance, and efficient yield [46]. S. cerevisiae also exhibits resistance to a low pH, bacterial contamination, and is readily available commercially [47].
The fermentation temperatures were set to 21 °C and 30 °C. Studies have shown that ethanol production increases gradually at 30 °C, but decreases at higher fermentation temperatures [48,49]. In general, S. cerevisiae thrives at optimal growth temperatures in the ranges of 25–30 °C or 30–33 °C, with a pH range from 3.0 to 7.0 [50,51].
Fermentation using substrates S1, S2, and S3 was performed at a pH of 4.5, which falls within the recommended range for ethanol production (4.5–5.0) [49,50]. Both commercial and native yeasts exhibit optimal growth at a pH between 5.0 and 5.5 [52]. Despite this, pH does not influence the outcome of the fermentation process within the range from 4 to 5; when the pH drops below 4, the formation of acetic acid is favored [53,54]. Moreover, lower pH values help minimize bacterial contamination [55]. Therefore, the initial pH of the substrate was not adjusted, in order to avoid the use of chemical reagents and to facilitate process scale-up.
The fermentation time was fixed at seven days to ensure sufficient yeast activity and complete sugar conversion [56]. This duration optimizes ethanol concentration while preventing yeast stress, which could reduce yields [57]. Moreover, it guarantees the complete conversion of reducing sugars into ethanol through the yeast’s metabolic pathway [49].
Table 4 presents the design matrix and the ethanol concentration results (% v/v) obtained using substrates S1, S2, and S3.
Table 4.
Design matrix with the ethanol concentration results for substrates S1, S2, and S3.
The results were analyzed using Statgraphics Centurion XIX® (Statgraphics Technologies, Version 19.0, The Plains, VA, USA), with ethanol concentration (% v/v) as the response variable, yeast type (YC = +1, YN = −1), and temperature (21 °C, 30 °C) as the factors.
To determine whether the calculated effects were statistically significant, Student’s t-test was applied. At a 95% confidence level (α = 0.05) and with 4 degrees of freedom, the two-tailed critical t-value was 3.1824 for all experimental designs.
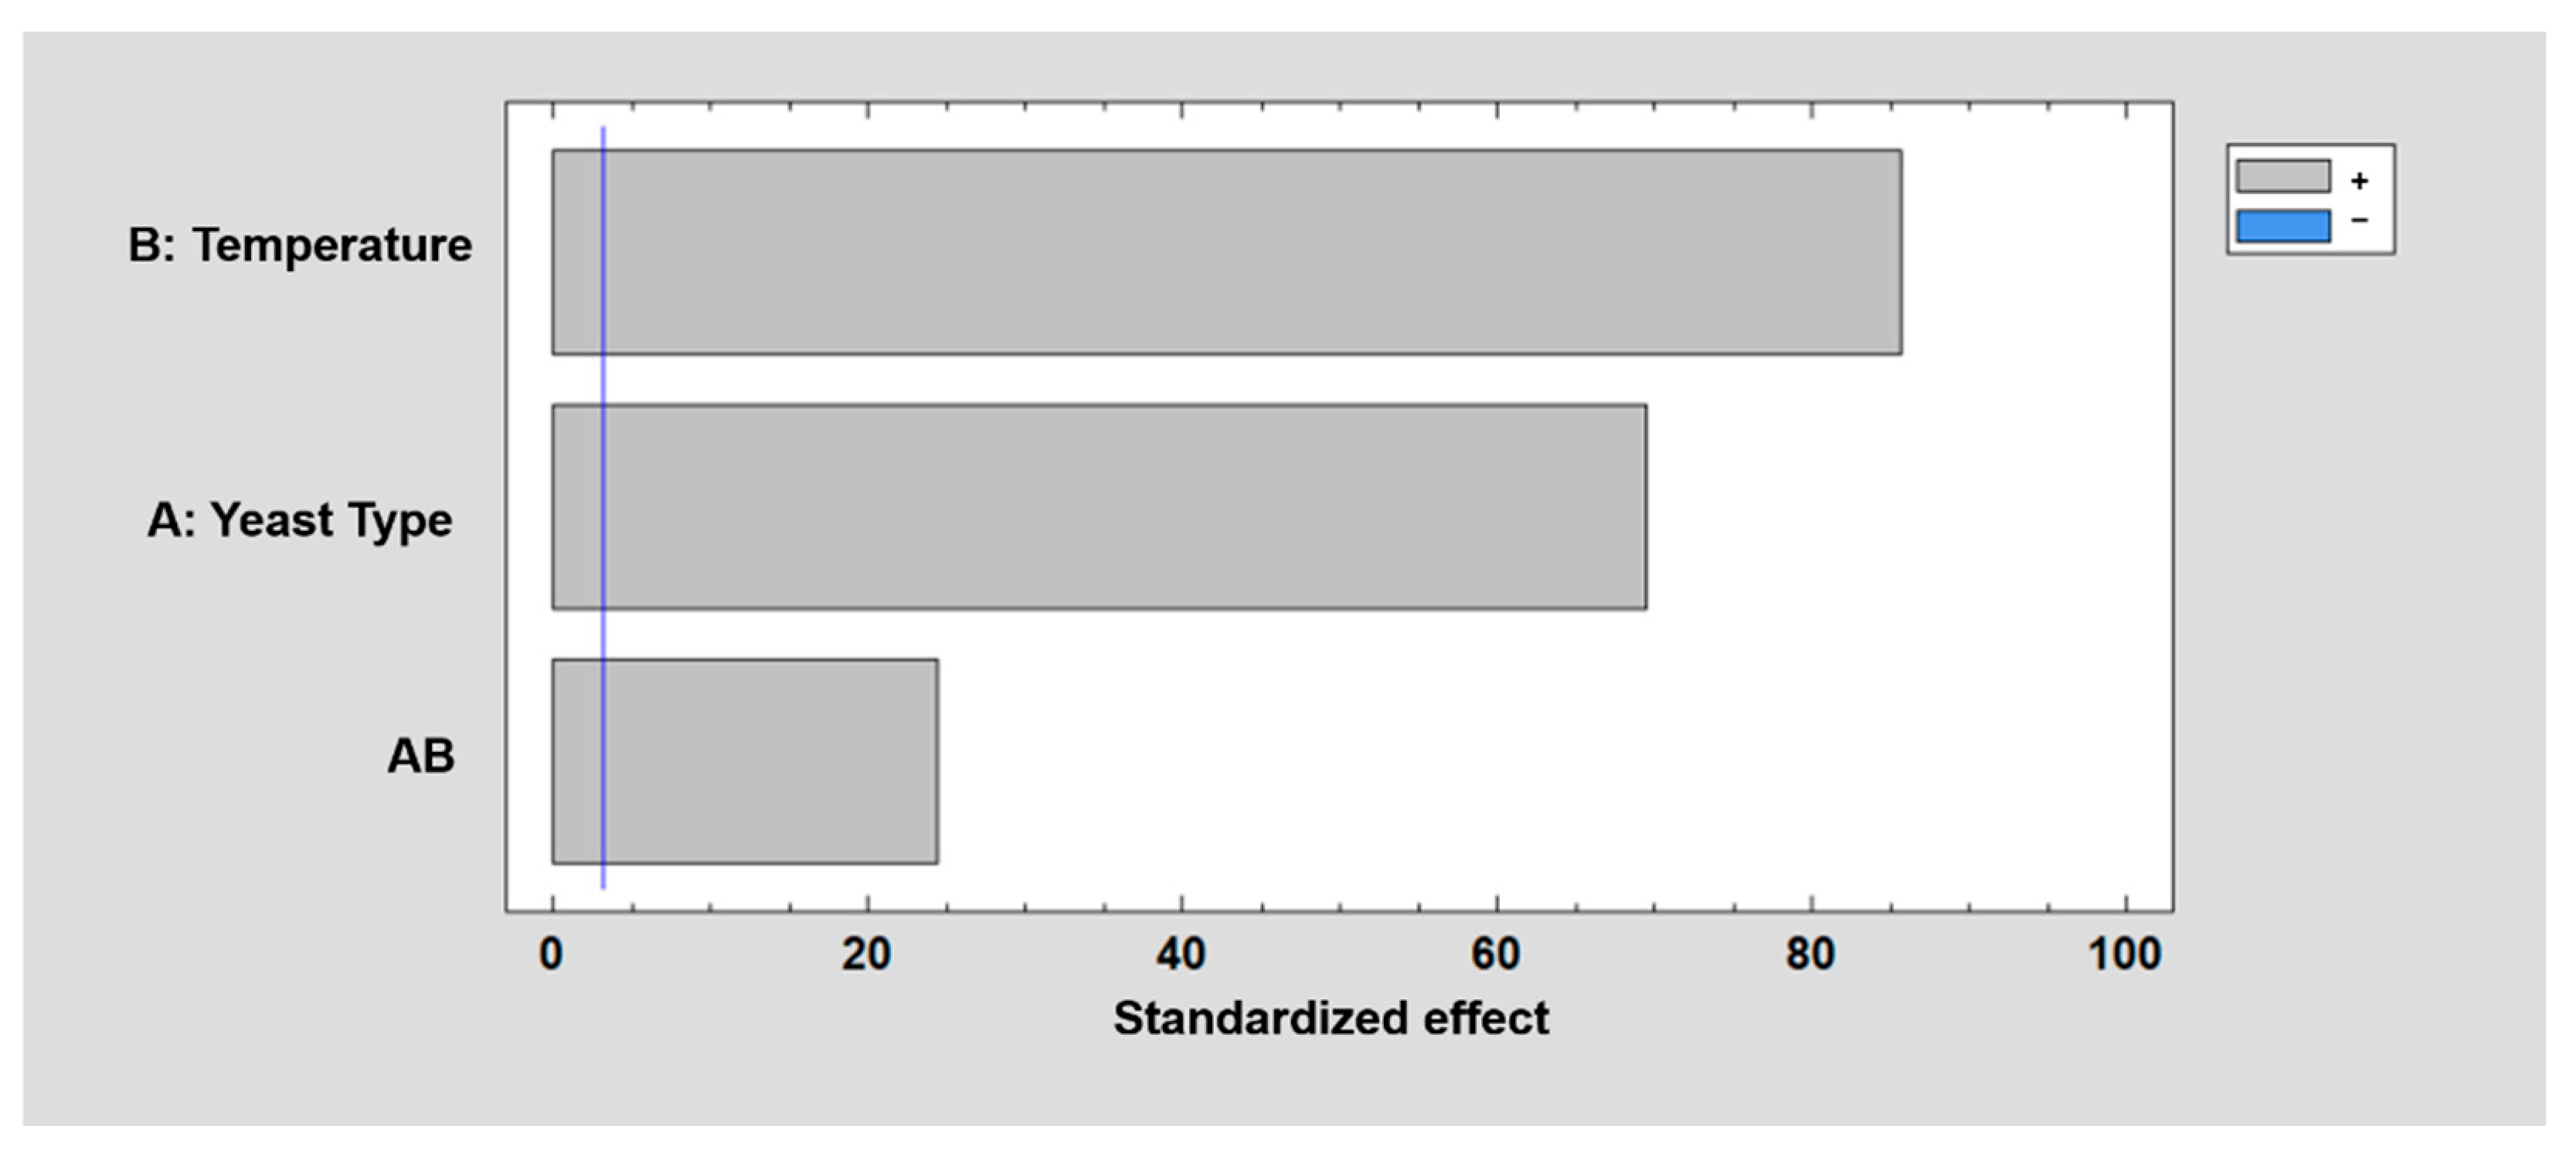
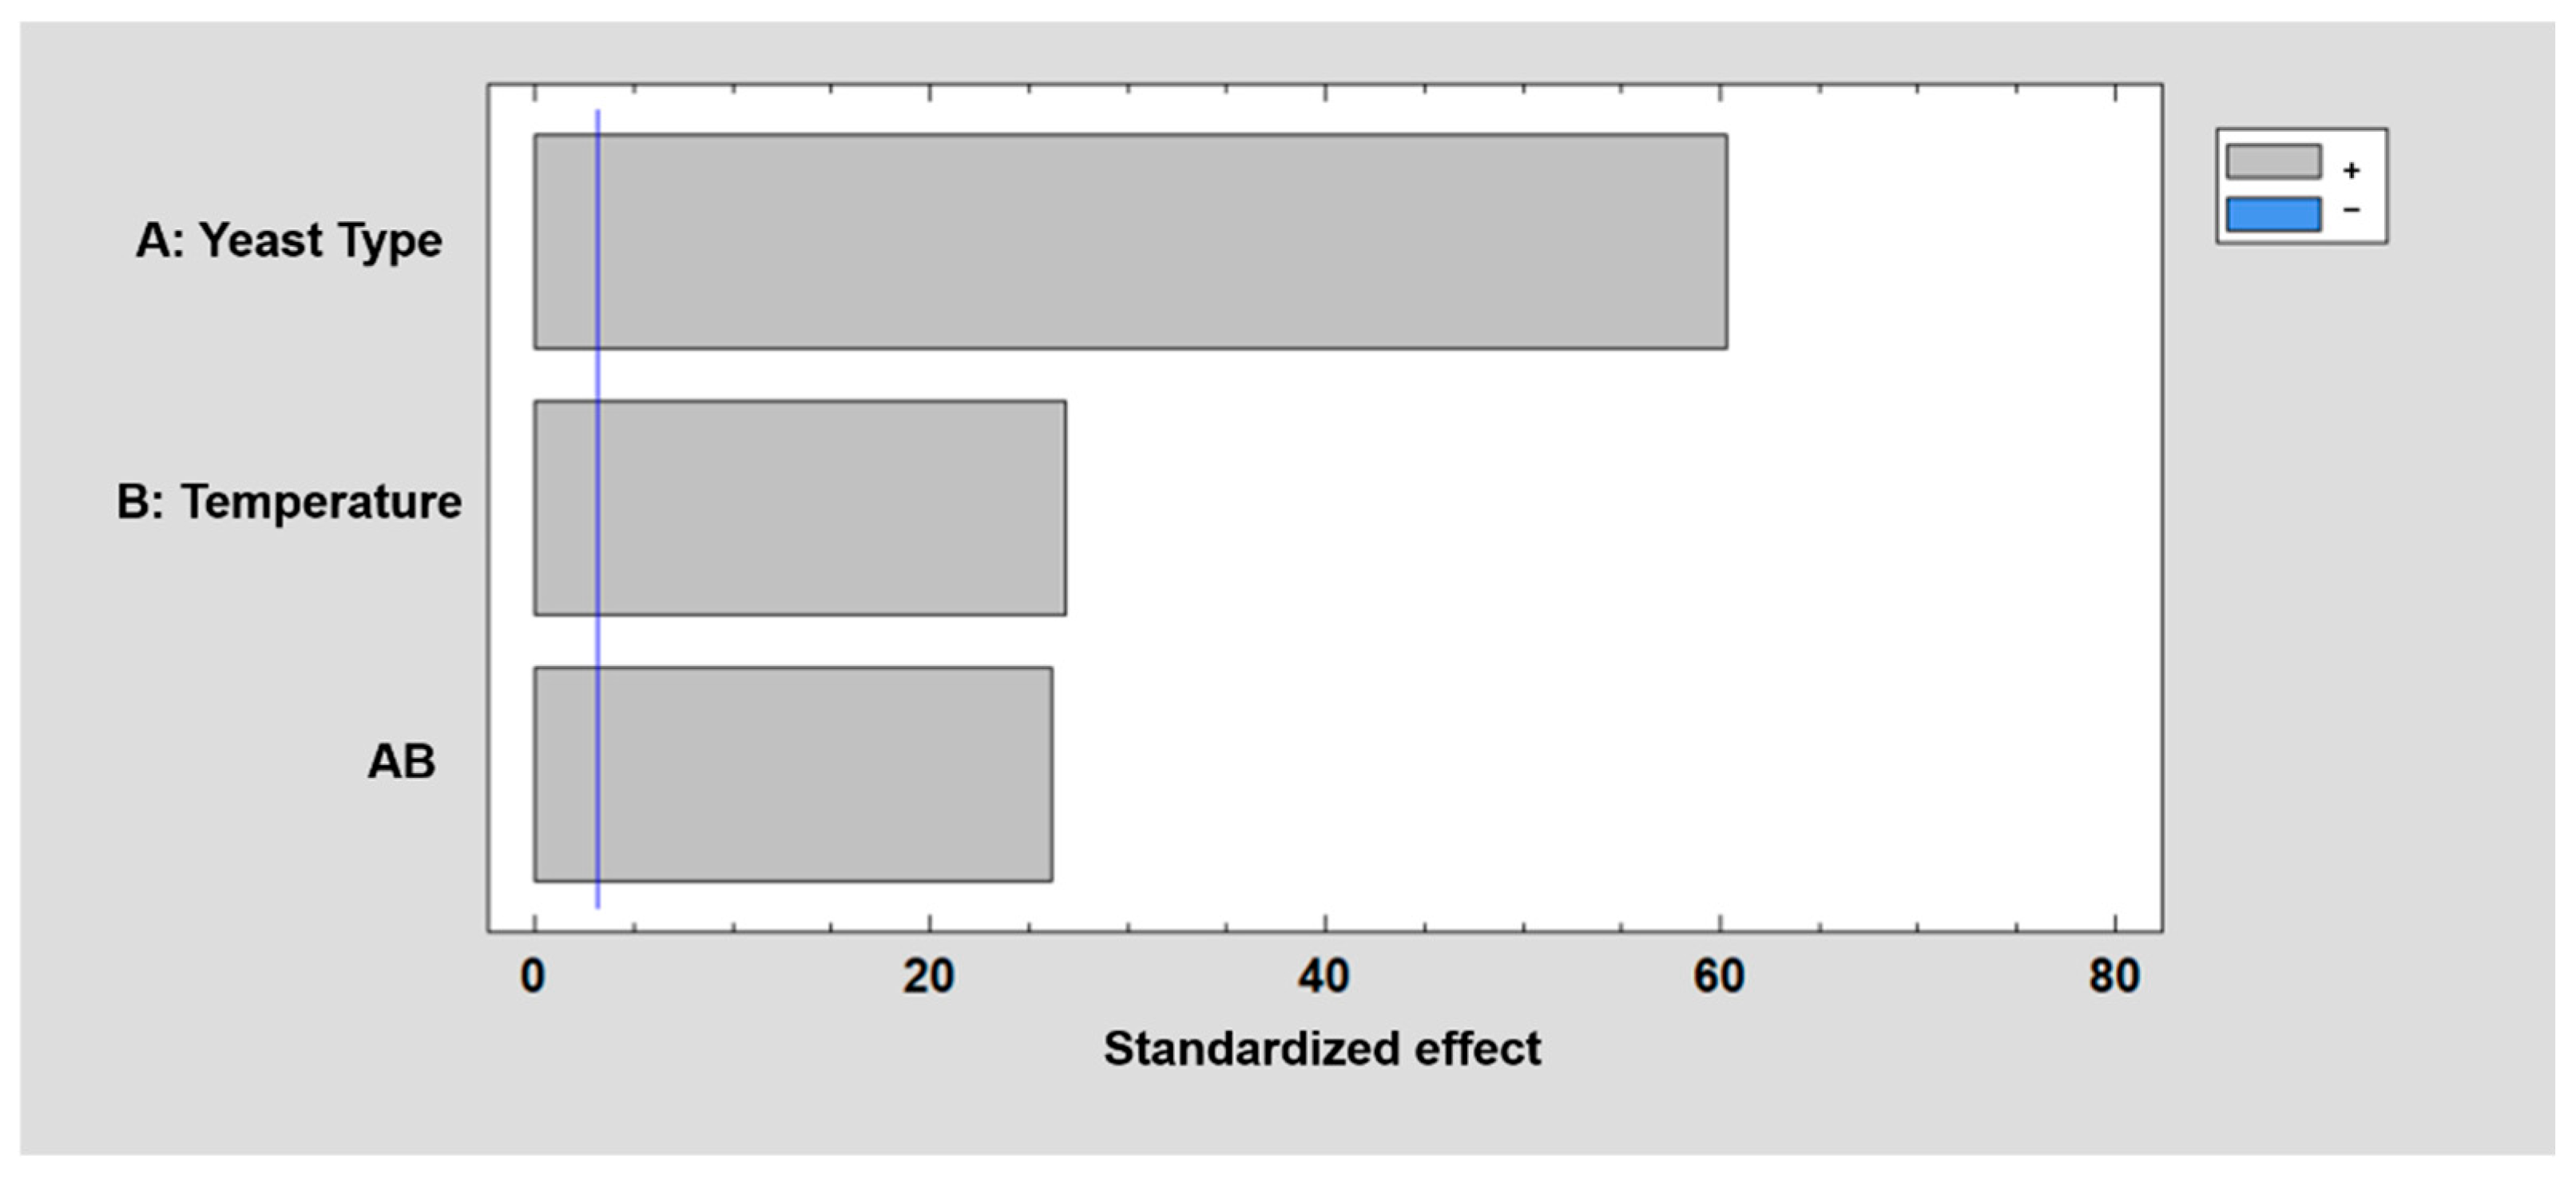
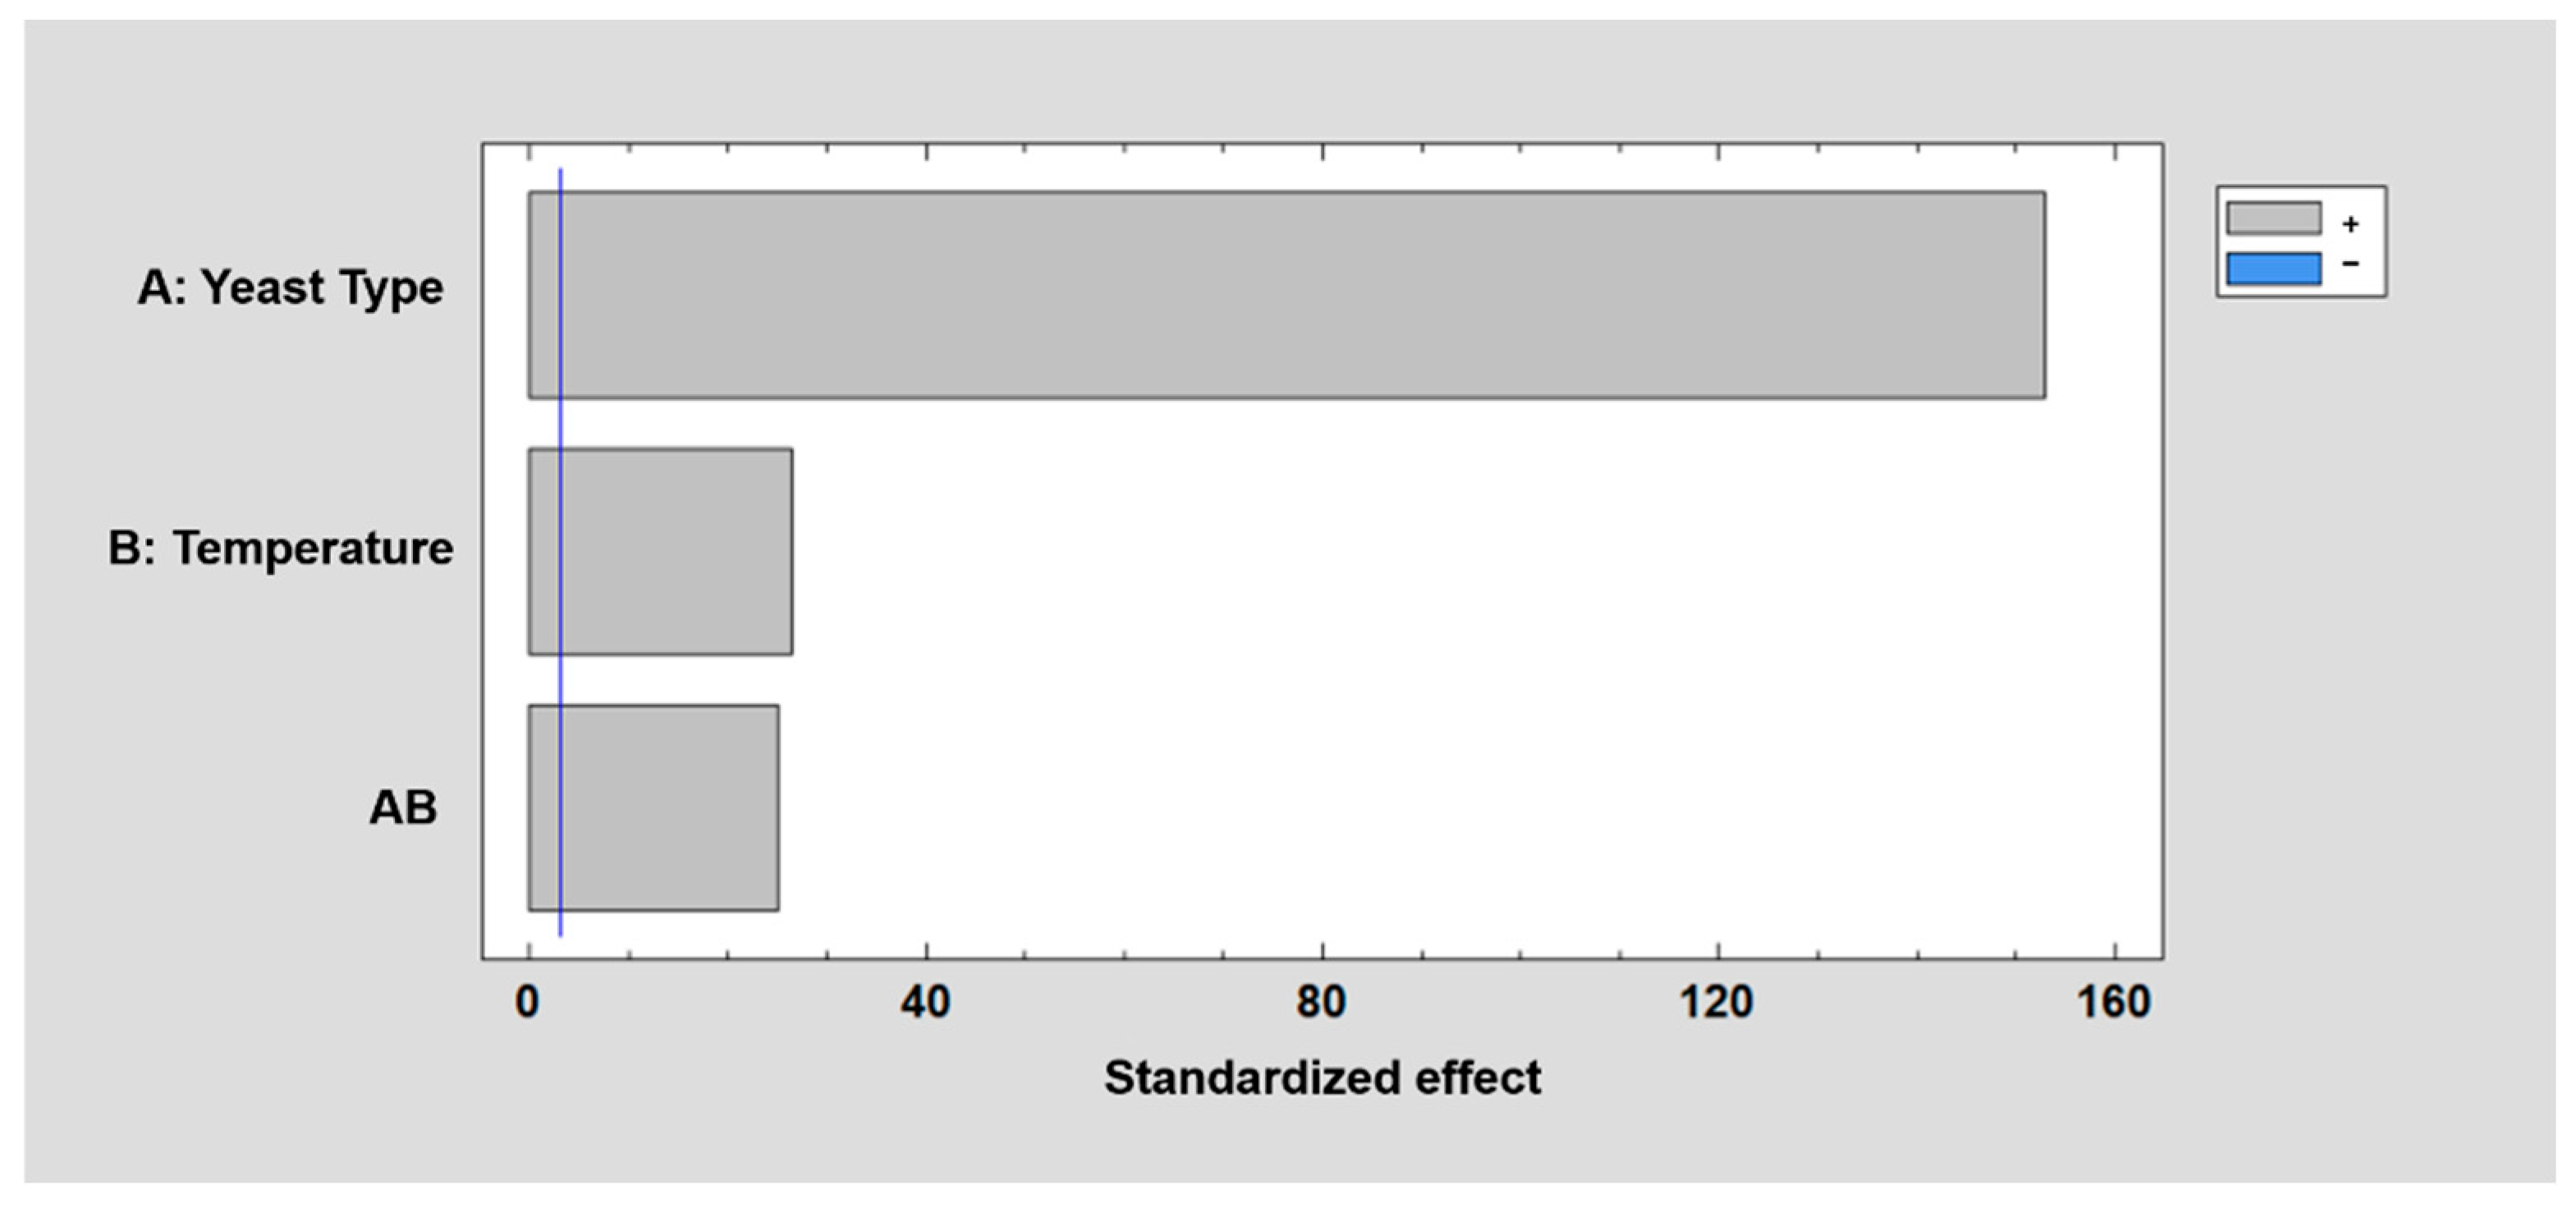
Figure 3, Figure 4 and Figure 5 show the Pareto charts, where the factors and their interactions are ordered based on the absolute values of their standardized effects. The vertical line in each chart represents the critical t-value. Any effect surpassing the vertical line is considered statistically significant. In this case, yeast type, temperature, and their interaction were found to be statistically significant for ethanol production across substrates S1, S2, and S3.

Figure 3.
Standardized Pareto chart for ethanol concentration using S1. R2 = 99.98%.
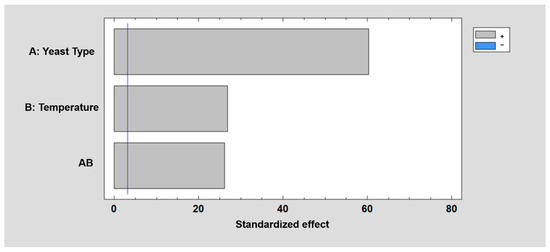
Figure 4.
Standardized Pareto chart for ethanol concentration using S2. R2 = 99.94%.
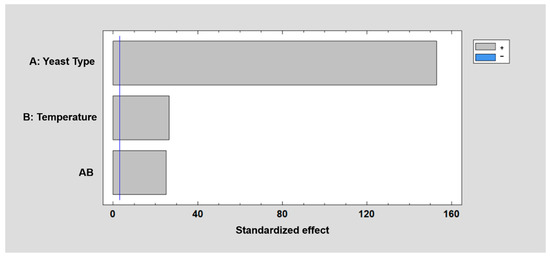
Figure 5.
Standardized Pareto chart for ethanol concentration using S3. R2 = 99.99%.
To evaluate the fit of the experimental data to the proposed mathematical model, we performed a linear regression analysis using yeast type and temperature as independent variables. The ethanol concentration (% v/v) was modeled for each substrate (S1: guava, S2: papaya, S3: coffee) based on Equation (18):
where is the ethanol concentration (% v/v), is the intercept, represents the effect of Yeast type (YC = +1, YN = −1), and represents the effect of temperature (21 °C or 30 °C).
To assess the accuracy of the models, the coefficient of determination (R2), root mean square error (RMSE), standard error, and p-value were calculated for each substrate. The results are summarized in Table 5.
Table 5.
Regression model statistics for ethanol concentration prediction, including R2, RMSE, standard error, p-value, and coefficients (, , ).
These results indicate a strong correlation between the experimental data and the model predictions, with R2 values above 0.99 for all substrates. The low RMSE, standard error values, and statistically significant p-values (p < 0.05) further confirm the robustness of the models.
According to the full 22 factorial design, the factor levels for maximizing ethanol production are presented in Table 6.
Table 6.
Factor-level combinations associated with the highest ethanol concentrations in the 22 factorial design.
The results show that the commercial yeast S. cerevisiae outperformed the native yeast isolated from the substrates. This was reflected in the higher ethanol concentrations obtained at the end of fermentation for all substrates (S1, S2, and S3). The highest ethanol concentrations were achieved when commercial yeast and a temperature of 30 °C were used, both at their upper levels. The ethanol concentrations obtained under these conditions align with the reported values in the literature, which range between 3% and 8% [58].
The maximum ethanol concentrations were 4.78% (v/v) for S1, 5.69% (v/v) for S2, and 6.79% (v/v) for S3. These results may have been influenced in part by the C/N ratios: 6.33 for S1, 16.08 for S2, and 21.09 for S3 [59]. Maintaining a C/N ratio between 20 and 35 provides energy and supports the formation of new cellular structures [60]. Microorganisms utilize carbon as an energy source and nitrogen for protein and nucleic acid synthesis [61]. To maintain that ratio in their cells, they have been found to perform best with a C/N ratio of 24 [62].
A study by Manikandan and Viruthagiri highlighted the effect of the C/N ratio on ethanol concentration and biomass production, finding that a C/N ratio of 35.2 in the fermentation medium resulted in a maximum ethanol concentration of 8.85 g/L [63].
The ethanol concentration obtained using coffee mucilage (S3) was 29.5% higher than that obtained with guava (S1) and 17.1% higher than with papaya (S2).
Studies show that the ethanol yield from coffee mucilage (0.47 g ethanol/g sugar) is higher than that of other agro-industrial residues, such as barley hay (0.3 g/g), barley straw (0.31 g/g), millet hay (0.27 g/g), sweet sorghum hay (0.31 g/g), triticale hay (0.34 g/g), and wheat straw (0.31 g/g). Additionally, raw coffee mucilage does not require any pretreatment or supplemental nutrients prior to fermentation, making it attractive for various fermentation applications [50].
Given the typical composition of coffee mucilage, and the compounds that are produced by the metabolic pathway in alcoholic fermentation with S. cerevisiae, the literature reviewed indicates that during such fermentation, various metabolites are generated. These include sugars, organic acids, alcohols, and amino acids [64]. Ethanol is a primary product, with yields up to 0.47 g ethanol/g sugars reported [50]. Other metabolites include lactic acid and ethyl acetate [65]. The fermentation process also impacts volatile compounds, enhancing aroma complexity with increases in benzeneacetaldehyde, 2-heptanol, and benzylalcohol [65].
3.2. Selection of Ethanol to Be Dehydrated
Based on the multi-criteria evaluation, coffee residues emerged as the most favorable option for ethanol production according to the selected criteria. The complete priority matrix for selecting the fermentation process to be used in the dehydration system is presented in Table 7.
Table 7.
Multi-criteria priority matrix for selecting the fermentation process to be used in the dehydration system.
Among the highest-weighted criteria is the number of hectares cultivated in Colombia, reflecting crop availability and the ability to maintain a steady supply of residual biomass. Coffee holds a significant advantage with 844,744 hectares under cultivation [45], ensuring a year-round availability of residues, which is crucial for sustainable industrial processes. In comparison, guava has 18,700 hectares [66], representing moderate availability, while papaya, with only 7903 hectares, poses a significant limitation in terms of biomass supply [72].
Despite its higher commercial cost, coffee offers decisive advantages. Its high ethanol yield (6.8%) in fermentation, combined with the 80% residual biomass content and the extensive cultivated area in Colombia [20,45,77], ensures a steady and substantial flow of raw materials for large-scale bioprocesses.
Utilizing coffee residues would also enhance sustainability in Colombia’s production chain by optimizing the use of agricultural by-products that would otherwise be wasted. This makes coffee residues a promising alternative for producing ethanol with applications in energy, food, pharmaceuticals, or cosmetics [79].
Although papaya offers a low commercial cost and year-round availability, its limited biomass content reduces its attractiveness for producing significant ethanol volumes [72,74]. Similarly, guava is less viable due to its limited biomass and production cycles [66,68,69].
In addition to ethanol production, coffee residues offer great potential for various industrial applications. These residues can be used to manufacture bio-based composites [39], biodegradable polymers [80], biofuels, and oil extraction [81], contributing to a circular economy and generating high-value products. This approach not only enhances the sustainability of the process but also opens new opportunities for the bioproducts industry, maximizing the value of coffee by-products and fostering a greater integration of green technologies in agriculture and chemical industries.
3.3. Ethanol Dehydration by Bioadsorption
To address the limitations of conventional distillation, this study implemented a green bioadsorption technology for the dehydration of ethanol produced through fermentation. The system consists of two main components, a thermal conditioning column and a packed bed of crushed corn, which acts as the main adsorbent for water removal from ethanol vapor. The packed bed allows for adsorbent regeneration through a hot air injection, reducing operating costs and enhancing sustainability.
Corn was selected as the adsorbent material for vapor-phase ethanol dehydration due to its strong hydrophilic properties, renewable nature, and cost-effectiveness. Starch-based materials, such as corn, have been shown to exhibit high water affinity, making them effective in breaking ethanol–water azeotropes through adsorption processes without requiring chemical entrainers [82]. Additionally, studies indicate that cornmeal-based adsorption is significantly more energy-efficient than conventional distillation, reducing energy consumption while maintaining high ethanol purity [83]. The abundance and low cost of corn further enhance its feasibility as a sustainable and scalable alternative for bioethanol dehydration, aligning with green technology principles.
The performance of the packed column was analyzed by estimating the pressure drop, superficial velocity, and saturation time of the maize-based adsorbent. The pressure drop across the packed bed was 18.42 Pa, as calculated using the Ergun equation for gas-phase flow. This low pressure drop suggests minimal resistance to vapor flow, ensuring efficient mass transfer and stable operational conditions within the column.
The superficial velocity of the ethanol–water vapor mixture was determined to be 0.112 m/s, reflecting a stable and uniform flow through the packed bed. This velocity ensures prolonged contact between the vapor and the adsorbent material without excessive pressure losses or channeling effects. The system operated efficiently under steady-state conditions, confirming its suitability for ethanol dehydration.
The saturation time of the maize adsorbent was estimated at 2.84 h, based on its water adsorption capacity and the mass flow rate of water in the vapor phase. This represents the operational time before the adsorbent reaches its maximum water retention capacity, after which its efficiency decreases. Since the system allows adsorbent regeneration, the need for frequent material replacement is significantly reduced, lowering operational costs.
A comprehensive mass balance was performed to validate the efficiency of the bioadsorption system. The results confirm that the packed column successfully increased ethanol concentration from 6.7% to 98.9% v/v through two sequential adsorption stages. The total mass flow of ethanol and water through the packed bed is detailed in Table 8, demonstrating the system’s ability to effectively remove water and improve ethanol purity with low energy consumption.
Table 8.
Mass balance for the ethanol dehydration process.
The key advantage of this technology is that it does not involve azeotropic phenomena, unlike conventional separation processes. This enables the system to dehydrate ethanol without the high energy requirements associated with extractive or azeotropic distillation. Additionally, the system integrates spiral heat exchangers for energy recovery, reducing energy consumption by up to five times compared to traditional dehydration technologies. The use of natural and reusable adsorbents, such as crushed maize, further enhances the environmental sustainability of the process.
3.4. Mass and Energy Balance of the Dehydration Process
A global mass and energy balance were performed for the ethanol dehydration system using the bioadsorption process with crushed maize as the adsorbent. Two sequential dehydration runs were conducted: the first increased the ethanol concentration from 6.7% to 49.5% v/v, and the second achieved a final concentration of 98.9% v/v. The mass balance results are summarized in Table 8.
The mass balance shows that 101 min of processing were required to obtain high-concentration ethanol after pre-heating the dehydration system and running two adsorption stages. The results confirm that the bioadsorption system effectively removed water, progressively increasing ethanol purity.
The energy efficiency of the dehydration process was also analyzed. Conventional ethanol separation by distillation consumes more than 50% of the total energy used in distilleries, with thermodynamic efficiency values as low as in the range from 5% to 10%, primarily due to azeotropic limitations [27]. In contrast, the adsorption-based system used in this study bypasses azeotropic constraints, enabling direct ethanol dehydration without the need for chemical entrainers or additional separation stages.
The estimated specific energy consumption for ethanol dehydration in this system was 3.68 MJ/kg of ethanol recovered, which is significantly lower than conventional distillation, which can consume up to 6.0 MJ/kg for diluted ethanol solutions [84]. Compared to vapor-assisted membrane distillation (VAMS), which achieves 4.0 MJ/kg, the bioadsorption system demonstrates competitive energy efficiency with a simpler operational design [85,86].
To sustain the adsorption-driven dehydration process, propane combustion was used as the heat source. The propane flow rate was 2.2 L/min, equivalent to 3.72 × 10⁻5 m3/s under standard conditions, supplying the necessary heat to maintain ethanol volatilization at 78.3 °C [79]. The composition of the combustion gases (stream 7 in the process flow diagram) is summarized in Table 9, confirming efficient combustion.
Table 9.
Propane combustion results in the dehydration system.
The final adiabatic flame temperature was estimated at 2449.6 K, with a total combustion heat generation () of 2195.1 W, ensuring the effective thermal conditioning of the dehydration system. Heat loss analysis confirmed that radiative losses, , accounted for 7.2% of the total thermal energy, while convective losses, , were more significant at 951.3 W, aligning with the expectations for high-surface-area heat exchange systems.
The specific energy consumption for ethanol recovery in the dehydrator, based on the previous mass and energy balances, was estimated at 3.68 MJ/kg. This value is intermediate compared to other separation technologies, such as conventional distillation and hybrid membrane separation systems.
3.5. Study Limitations and Future Research
This study presents two main limitations. First, although the proposed system demonstrates strong potential in terms of energy efficiency and substrate valorization, a comprehensive life cycle assessment (LCA) and techno-economic analysis were not conducted. These evaluations are essential to fully quantify the environmental and financial implications of large-scale deployment. Second, while three distinct substrates were analyzed independently, no co-fermentation or substrate mixture experiments were performed. Exploring potential synergies among substrates could enhance fermentation efficiency and broaden the applicability of the process under variable supply conditions.
4. Conclusions
This study validated the technical feasibility of producing ethanol from agro-industrial residues—specifically guava, papaya, and coffee mucilage—using yeast fermentation followed by gas-phase dehydration via a bioadsorption system. The 22 factorial design revealed that both yeast type and fermentation temperature significantly affected ethanol concentration. The combination of commercial Saccharomyces cerevisiae and 30 °C yielded the highest ethanol concentrations, reaching up to 6.79% (v/v) with coffee mucilage (S3).
A multi-criteria evaluation matrix was developed to prioritize substrates, considering fermentation yield, biomass availability, cultivated area, commercial cost, and seasonal supply. Coffee mucilage received the highest score (4.05), due to its high ethanol yield and year-round availability supported by 844,744 hectares under cultivation in Colombia.
The ethanol dehydration process was carried out using a patented green technology based on a packed-bed bioadsorption system with crushed corn as the adsorbent. This system effectively increased the ethanol concentration from 6.7% to 98.9% (v/v) through two sequential adsorption stages. The energy analysis showed a specific energy consumption value of 3.68 MJ/kg of ethanol, which is substantially lower than the values reported for conventional distillation.
Overall, the integration of efficient fermentation conditions with a low-energy, environmentally friendly dehydration process demonstrates strong potential for decentralized and sustainable bioethanol production.
5. Patents
A patent associated with the work reported in this manuscript was issued from the Colombian patent office (Superintendencia de Industria y Comercio). Title: “Sistema de adsorción para la deshidratación de etanol y su procedimiento de operación” (2009). Code: CO6140017(A1).
Author Contributions
All authors contributed to the study conception and design. Material preparation, data collection, and analysis were performed by M.R.-C., L.R.-C. and C.O.-L. The first draft of this manuscript was written by M.R.-C., L.R.-C. and C.O.-L., and all authors—M.G.-R., X.L.-M., S.P.-P., J.R.-E., V.S.-S., S.U.-L., D.V.-Y. and S.Z.-G.—participated in the experimentation stage and provided comments on previous versions of this manuscript. All authors have read and agreed to the published version of the manuscript.
Funding
The APC was funded by Universidad Pontificia Bolivariana.
Data Availability Statement
The original contributions presented in this study are included in the article. Further inquiries can be directed to the corresponding author.
Conflicts of Interest
The authors declare no conflicts of interest.
References
- Fortune Business Insights. Ethanol Market Size, Share & COVID-19 Impact Analysis,by Type (Synthetic and Biobased), by Application (Fuel, Industrial Solvent, Food & Beverages, Chemicals, and Others), and Regional Forecast, 2023–2030; Fortune Business Insights Pvt. Ltd.: Pune, India, 2024. [Google Scholar]
- Sanhueza, E. Agroetanol ¿un Combustible Ambientalmente Amigable? Interciencia 2009, 34, 106–112. [Google Scholar]
- Wu, Y.; Zhao, F.; Liu, S.; Wang, L.; Qiu, L.; Alexandrov, G.; Jothiprakash, V. Bioenergy Production and Environmental Impacts. Geosci. Lett. 2018, 5, 14. [Google Scholar] [CrossRef]
- Duarte, A.; Uribe, J.C.; Sarache, W.; Calderón, A. Economic, Environmental, and Social Assessment of Bioethanol Production Using Multiple Coffee Crop Residues. Energy 2021, 216, 119170. [Google Scholar] [CrossRef]
- de Quadros, T.C.F.; Sicchieri, I.M.; Perin, J.K.H.; Challiol, A.Z.; Bortoloti, M.A.; Fernandes, F.; Kuroda, E.K. Valorization of Fruit and Vegetable Waste by Anaerobic Digestion: Definition of Co-Substrates and Inoculum. Waste Biomass Valorization 2023, 14, 407–419. [Google Scholar] [CrossRef]
- López, Y.; García, J.; Durán, D.; Sierra, R. Producción de Bioetanol a Partir de Residuos de Fruta Utilizando Saccharomyces cerevisiae: Una Revisión de Las Diferentes Condiciones y Métodos de Proceso. Bachelor’s Thesis, Universidad de los Andes, Bogotá, Colombia, 2020. [Google Scholar]
- Saldanha, L.F.; Longo, V.D.; Romani, L.C.; Klein, G.H.; Camargo, A.F.; Fornari, A.C.; Bazoti, S.F.; Alves, S.L.; Treichel, H. Use of Mixed Fruit Waste Aimed at Producing Bioethanol and Extracting D-Limonene. Waste Biomass Valorization 2024, 16, 871–879. [Google Scholar] [CrossRef]
- Danielski, R.; Shahidi, F. Guava Processing Waste: Biological Activity Profile of a Natural and Sustainable Source of Phenolic Antioxidants. Food Biosci. 2023, 56, 103294. [Google Scholar] [CrossRef]
- Fernandes, F.; Delerue-Matos, C.; Grosso, C. Unveiling the Potential of Agrifood By-Products: A Comprehensive Review of Phytochemicals, Bioactivities and Industrial Applications. Waste Biomass Valorization 2024, 9, 1–34. [Google Scholar] [CrossRef]
- Ulloa, J.A.; Villalobos Barbosa, M.C.; Resendiz Vazquez, J.A.; Rosas Ulloa, P.; Ramírez Ramírez, J.C.; Silva Carrillo, Y.; González Torres, L. Production, Physico-Chemical and Functional Characterization of a Protein Isolate from Jackfruit (Artocarpus heterophyllus) Seeds. CyTA-J. Food 2017, 15, 497–507. [Google Scholar] [CrossRef]
- Ijaz, N.; Bashir, S.; Ikram, A.; Zafar, A.; Ul Ain, H.B.; Ambreen, S.; Ahmad, M.; Almalki, R.S.; Khalid, M.Z.; Khalid, W.; et al. Valorization of Potato Peel: A Sustainable Eco-Friendly Approach. CyTA-J. Food 2024, 22, 1–10. [Google Scholar] [CrossRef]
- Chicaiza, L.; Robles, J. Proposal for a Circular Economy for the Recovery of Value from Fruit Waste in Packaging Manufacturing. Dyna 2021, 88, 140–149. [Google Scholar] [CrossRef]
- Mohamad, M.; Talib, R.; Taip, F.; Chin, N.; Sulaiman, R.; Shukri, R.; Mohd, M. Changes in the Physical Properties and Specific Mechanical Energy of Corn-Mango Peel Extrudates. CyTA-J. Food 2020, 18, 417–426. [Google Scholar] [CrossRef]
- Pedroza, M.A.; Carmona, M.; Pardo, F.; Salinas, M.R.; Zalacain, A. Waste Grape Skins Thermal Dehydration: Potential Release of Colour, Phenolic and Aroma Compounds into Wine. CyTA-J. Food 2012, 10, 225–234. [Google Scholar] [CrossRef]
- Pan, S.; Zabed, H.M.; Wei, Y.; Qi, X. Technoeconomic and Environmental Perspectives of Biofuel Production from Sugarcane Bagasse: Current Status, Challenges and Future Outlook. Ind. Crops Prod. 2022, 188, 115684. [Google Scholar] [CrossRef]
- Huang, J.; Khan, M.T.; Perecin, D.; Coelho, S.T.; Zhang, M. Sugarcane for Bioethanol Production: Potential of Bagasse in Chinese Perspective. Renew. Sustain. Energy Rev. 2020, 133, 110296. [Google Scholar] [CrossRef]
- Broda, M.; Yelle, D.J.; Serwańska, K. Bioethanol Production from Lignocellulosic Biomass—Challenges and Solutions. Molecules 2022, 27, 8717. [Google Scholar] [CrossRef]
- Dey, N.; Bhaskarwar, A.N. Bioconversion of Food Waste into Ethanol: A Review. In Sustainable Bioconversion of Waste to Value Added Products; Springer: Cham, Switzerland, 2021; pp. 45–58. [Google Scholar]
- Detho, A.; Kadir, A.A.; Memon, A.A. Ethanol Production from Fruit and Vegetable Waste: A Sustainable Approach for Resource Recovery. Water Air Soil Pollut. 2024, 235, 758. [Google Scholar] [CrossRef]
- Serna, L.; Mera, J.D.; Angulo, J.E.; Gomez, A.L. Kinetics of Alcoholic Fermentation Using Guava (Psidium guajava) Seed Flour and Dry Mycelium of Aspergillus niger as Nitrogen Sources. Dyna 2013, 80, 113–121. [Google Scholar]
- Navarrete, S. Elaboración de Papaya (Carica papaya) Por Deshidratación Osmótica; Universidad Nacional Autónoma de Nicaragua: León, Nicaragua, 2003. [Google Scholar]
- Kefale, A.; Redib, M.; Asfaw, A. Bioethanol Production and Optimization Test from Agricultural Waste: The Case of Wet Coffee Processing Waste (Pulp). Int. J. Renew. Energy Res. 2012, 2, 447–450. Available online: https://dergipark.org.tr/en/pub/ijrer/issue/16082/168344 (accessed on 29 April 2025).
- Marafon, A.; Salomon, K.; Amorim, E.; Peiter, F. Use of Sugarcane Vinasse to Biogas, Bioenergy, and Biofertilizer Production. In Sugarcane Biorefinery, Technology and Perspectives; Elsevier: Amsterdam, The Netherlands, 2020; pp. 179–194. [Google Scholar]
- Battisti, R.; Galeazzi, A.; Prifti, K.; Manenti, F.; Machado, R.A.F.; Marangoni, C. Techno-Economic and Energetic Assessment of an Innovative Pilot-Scale Thermosyphon-Assisted Falling Film Distillation Unit for Sanitizer-Grade Ethanol Recovery. Appl. Energy 2021, 297, 117185. [Google Scholar] [CrossRef]
- Li, Q.; Hu, N.; Zhang, S.; Wu, Q.; Qi, J. Energy-Saving Heat Integrated Extraction-Azeotropic Distillation for Separating Isobutanol-Ethanol-Water. Sep. Purif. Technol. 2021, 255, 117695. [Google Scholar] [CrossRef]
- Graczová, E.; Steltenpohl, P. Application of Ionic Liquids in Extractive Distillation of Ethanol—Water System. Chem. Eng. Trans. 2015, 45, 1957–1962. [Google Scholar] [CrossRef]
- Alves, J.; da Silva, V.; Machado, R.; Marangoni, C. Ethanol Enrichment from an Aqueous Stream Using an Innovative Multi-Tube Falling Film Distillation Column Equipped with a Biphasic Thermosiphon. Process Saf. Environ. Prot. 2020, 139, 69–75. [Google Scholar] [CrossRef]
- Loureiro Cavalcante, C., Jr.; Cavalcante, C.L., Jr. Industrial Adsorption Separation Processes: Fundamentals, Modeling and Applications. Lat. Am. Appl. Res. 2000, 30, 357–364. [Google Scholar]
- Ramírez-Carmona, M.; Ocampo-López, C.; Manzur, J.; Ceballos, F.; Gil, J. Sistema de Adsorción para la Deshidratación de Etanol y Su Procedimiento de Operación. 8895, 1 March 2013. [Google Scholar]
- Carmo, M.J.; Gubulin, J.C. Kinetic and Thermodynamic Study on Adsorption by Starchy Materials in The Ethanol-Water System. Braz. J. Chem. Eng. 1997, 14. [Google Scholar] [CrossRef]
- Sidari, R.; Ženišová, K.; Tobolková, B.; Belajová, E.; Cabicarová, T.; Bučková, M.; Puškárová, A.; Planý, M.; Kuchta, T.; Pangallo, D. Wine Yeasts Selection: Laboratory Characterization and Protocol Review. Microorganisms 2021, 9, 2223. [Google Scholar] [CrossRef] [PubMed]
- Olivas, E.; Alarcón, L. Manual de Practicas de Microbiología Básica y Microbiología de Alimentos; Universidad Autónoma de Ciudad Juárez: Ciudad Juárez, Mexico, 2004; ISBN 9687845287. [Google Scholar]
- Rendón-Castrillón, L.; Ramírez-Carmona, M.; Ocampo-López, C.; Pinedo-Rangel, V.; Muñoz-Blandón, O.; Trujillo-Aramburo, E. The Industrial Potential of Fique Cultivated in Colombia. Sustainability 2022, 15, 695. [Google Scholar] [CrossRef]
- Ramírez Carmona, M.E.; Pereira da Silva, M.A.; Ferreira Leite, S.G.; Vasco Echeverri, O.H.; Ocampo-López, C. Packed Bed Redistribution System for Cr(III) and Cr(VI) Biosorption by Saccharomyces cerevisiae. J. Taiwan Inst. Chem. Eng. 2012, 43, 428–432. [Google Scholar] [CrossRef]
- Wittig, R.; Lohmann, J.; Gmehling, J. Vapor−Liquid Equilibria by UNIFAC Group Contribution. 6. Revision and Extension. Ind. Eng. Chem. Res. 2003, 42, 183–188. [Google Scholar] [CrossRef]
- Rossini, F.D. Calorimetric Determination of the Heats of Combustion of Ethane, Propane, Normal Butane, and Normal Pentane. Bur. Stand. J. Res. 1934, 12, 735. [Google Scholar] [CrossRef]
- Kango, R.; Chandel, A.; Shankar, V. A Statistical Model for Estimating Porosity Based on Various Parameters of Flow through Porous Media. Water Pract. Technol. 2024, 19, 1936–1947. [Google Scholar] [CrossRef]
- Minh, N.P.; Pham, V.T.; Tre, T.T.; Kieu, T.T.; Nhu, N.T.H.; Van, T.T.C. Different Factors Affecting Guava (Psidium guajava) Wine Fermentation. J. Pharm. Sci. Res. 2019, 11, 1458–1463. [Google Scholar]
- Medina, M.; Pagano, F. Caracterización de La Pulpa de Guayaba (Psidium guajava L.) Tipo Criolla Roja. Rev. De La Fac. de Agronomía 2003, 20, 72–86. [Google Scholar]
- Moses, M.O.; Olanrewaju, M.J. Proximate and Selected Mineral Composition of Ripe Pawpaw (Carica papaya) Seeds and Skin. J. Sci. Innov. Res. 2018, 7, 75–77. [Google Scholar] [CrossRef]
- Rubio-Cervantes, G. Caracterización Física, Química, Fitoquímica y de Capacidad Antioxidante de Partes Estructurales de Papaya (Carica papaya L.). Master’s Thesis, Universidad Autónoma de Sinaloa, Culiacán, Mexico, 2017. [Google Scholar]
- Cyert, M.S.; Philpott, C.C. Regulation of Cation Balance in Saccharomyces cerevisiae. Genetics 2013, 193, 677–713. [Google Scholar] [CrossRef] [PubMed]
- Rodríguez, N. Producción de Alcohol a Partir de La Pulpa de Café. Rev. Cenicafé 2013, 64, 78–93. [Google Scholar]
- Gallego, C. Influencia de La Acidez Volátil En El Proceso de Fermentación de La Planta de Alcohol Del Ingenio Risaralda S.A. Bachelor’s Thesis, Universidad Tecnológica de Pereira, Pereira, Colombia, 2007. [Google Scholar]
- Acevedo, A.; Peñaloza, I.; Morales, D. Aprovechamiento de Los Polisacáridos de La Pulpa de Café Residual Para La Obtención de Bioetanol Como Estrategia Hacia La Bioeconomía. Gestión Ambiente 2021, 24, 100–113. [Google Scholar] [CrossRef]
- Wu, Y.; Wen, J.; Wang, K.; Su, C.; Chen, C.; Cui, Z.; Cai, D.; Cheng, S.; Cao, H.; Qin, P. Understanding the Dynamics of the Saccharomyces cerevisiae and Scheffersomyces stipitis Abundance in Co-Culturing Process for Bioethanol Production from Corn Stover. Waste Biomass Valorization 2023, 14, 43–55. [Google Scholar] [CrossRef]
- Nogueira, D.; Branco, V.; Almeida, J.; Moraes, L.; Torres, F. Xylose Fermentation by Saccharomyces cerevisiae: Challenges and Prospects. Int. J. Mol. Sci. 2016, 17, 207. [Google Scholar] [CrossRef]
- Fakruddin; Quay, A.; Morshed Ahmed, M.; Choudhury, N. Analysis of Key Factors Affecting Ethanol Production by Saccharomyces cerevisiae IFST-072011. Biotechnology 2012, 11, 248–252. [Google Scholar] [CrossRef]
- Abdulla, R.; Derman, E.; Tharsini, R.; Azmah, S. Fuel Ethanol Production from Papaya Waste Using Immobilized Saccharomyces cerevisiae. ASM Sci. J. 2018, 11, 112–123. [Google Scholar]
- Orrego, D.; Zapata-Zapata, A.; Kim, D. Optimization and Scale-Up of Coffee Mucilage Fermentation for Ethanol Production. Energies 2018, 11, 786. [Google Scholar] [CrossRef]
- Ndubuisi, I.A.; Amadi, C.O.; Nwagu, T.N.; Murata, Y.; Ogbonna, J.C. Non-Conventional Yeast Strains: Unexploited Resources for Effective Commercialization of Second Generation Bioethanol. Biotechnol. Adv. 2023, 63, 108100. [Google Scholar] [CrossRef]
- Desissa, B.; Muleta, D.; Abate, D. Isolation and Characterization of Some Dominant Yeast Strains for Ethanol Production from Coffee (Coffea arabica L.) Wastes. J. Biol. Sci. 2015, 14, 171–184. [Google Scholar]
- Londoño-Hernandez, L.; Ruiz, H.A.; Cristina Ramírez, T.; Ascacio, J.A.; Rodríguez-Herrera, R.; Aguilar, C.N. Fungal Detoxification of Coffee Pulp by Solid-State Fermentation. Biocatal. Agric. Biotechnol. 2020, 23, 101467. [Google Scholar] [CrossRef]
- Lin, Y.; Zhang, W.; Li, C.; Sakakibara, K.; Tanaka, S.; Kong, H. Factors Affecting Ethanol Fermentation Using Saccharomyces Cerevisiae BY4742. Biomass Bioenergy 2012, 47, 395–401. [Google Scholar] [CrossRef]
- Menezes, E.G.T.; do Carmo, J.R.; Menezes, A.G.T.; Alves, J.G.L.F.; Pimenta, C.J.; Queiroz, F. Use of Different Extracts of Coffee Pulp for the Production of Bioethanol. Appl. Biochem. Biotechnol. 2013, 169, 673–687. [Google Scholar] [CrossRef]
- Monroy, A.; Narváez, R.; Vera, B.; Bautista, L. Generación de Bioetanol Como Combustible Alternativo a Partir de Compuestos Lignocelulósicos a Nivel Laboratorio. Rev. Energía Química Física 2017, 4, 49–57. [Google Scholar]
- Malagón, M.; Garay, C.; Peña, N. Obtención de Bioetanol a Partir de Residuos Lignocelulósicos. Semilleros Form. Investig. 2017, 3, 69–76. [Google Scholar]
- Jover-de la Prida, J.; Cuevas-Hernández, M.; Quintana-Jover, C. Evaluación Industrial de Levaduras Del Género Saccharomyces En La Destilería George Washington. Tecnol. Química 2012, 32, 42–52. [Google Scholar]
- Ramírez-Carmona, M.; Ocampo-López, C.; Rendón-Castrillón, L. Open Residues Software, Version 1.0; Universidad Pontificia Bolivariana: Medellín, Colombia, 2019. [Google Scholar] [CrossRef]
- Bandgar, P.S.; Jain, S.; Panwar, N.L. A Comprehensive Review on Optimization of Anaerobic Digestion Technologies for Lignocellulosic Biomass Available in India. Biomass Bioenergy 2022, 161, 106479. [Google Scholar] [CrossRef]
- Raja, N.; Nikhil, G.N. A Critical Review on Sustainable Biogas Production with Focus on Microbial-Substrate Interactions: Bottlenecks and Breakthroughs. Bioresour. Technol. Rep. 2022, 19, 101170. [Google Scholar] [CrossRef]
- Brust, G.E. Management Strategies for Organic Vegetable Fertility. In Safety and Practice for Organic Food; Elsevier: Amsterdam, The Netherlands, 2019; pp. 193–212. [Google Scholar]
- Manikandan, K.; Viruthagiri, T. Optimization of C/N Ratio of the Medium and Fermentation Conditions of Ethanol Production from Tapioca Starch Using Co-Culture of Aspergillus Niger and Sachormyces cerevisiae. Int. J. Chemtech Res. 2010, 2, 947–955. [Google Scholar]
- Aswathi, K.N.; Shirke, A.; Praveen, A.; Murthy, P.S. Functioning of Saccharomyces cerevisiae in Honey Coffee (Coffea canephora) and Their Effect on Metabolites, Volatiles and Flavor Profiles. Food Res. Int. 2024, 180, 114092. [Google Scholar] [CrossRef] [PubMed]
- da Silva Vale, A.; de Melo Pereira, G.V.; de Carvalho Neto, D.P.; Rodrigues, C.; Pagnoncelli, M.G.B.; Soccol, C.R. Effect of Co-Inoculation with Pichia fermentans and Pediococcus acidilactici on Metabolite Produced During Fermentation and Volatile Composition of Coffee Beans. Fermentation 2019, 5, 67. [Google Scholar] [CrossRef]
- OCDE. OCDE–FAO Perspectivas Agrícolas 2022–2029; OECD: Paris, France, 2020; ISBN 9789264858336. [Google Scholar]
- FedeBiocombustibles. Demanda de Biocombustibles en Colombia Cierra El Primer Semestre de 2022 en Positivo. Available online: https://fedebiocombustibles.com/la-demanda-del-biodiesel-en-el-pais-cerro-con-aumento-del-13-y-la-de-bioetanol-con-9 (accessed on 21 October 2023).
- Álvarez, C. Biocombustibles: Desarrollo Histórico-Tecnológico, Mercados Actuales y Comercio Internacional. Econ. Inf. 2009, 1, 63–89. [Google Scholar]
- Ocampo, A. Alcohol Carburante: Actualidad Tecnológica. Rev. EIA 2004, 1, 39–46. [Google Scholar]
- da Silva Lima, R.; Ferreira, S.R.S.; Vitali, L.; Block, J.M. May the Superfruit Red Guava and Its Processing Waste Be a Potential Ingredient in Functional Foods? Food Res. Int. 2019, 115, 451–459. [Google Scholar] [CrossRef]
- Kumar, M.; Kapoor, S.; Dhumal, S.; Tkaczewska, J.; Changan, S.; Saurabh, V.; Mekhemar, M.; Radha; Rais, N.; Satankar, V.; et al. Guava (Psidium guajava L.) Seed: A Low-Volume, High-Value Byproduct for Human Health and the Food Industry. Food Chem. 2022, 386, 132694. [Google Scholar] [CrossRef]
- Ibarra, D.; Gerard, O. Aproximación Sistémica de La Sostenibilidad en La Producción de Bioetanol. Rev. Investig. Agrar. Ambient. 2018, 9. [Google Scholar] [CrossRef]
- UPME. Biocombustibles en Colombia; UPME: Bogotá, Colombia, 2009; pp. 1–22. [Google Scholar]
- Aguilar-Rivera, N. Bioetanol de La Caña de Azúcar. Av. Investig. Agropecu. 2007, 11, 25–39. [Google Scholar]
- Sevda, S.; Rodrígues, L. Fermentative Behavior of Saccharomyces Strains during Guava (Psidium guajava L.) Must Fermentation and Optimization of Guava Wine Production. Food Process. Technol. 2011, 2, 118. [Google Scholar]
- Kathiresan, S.; Lasekan, O. Effects of Glycerol and Stearic Acid on the Performance of Chickpea Starch-Based Coatings Applied to Fresh-Cut Papaya. CyTA-J. Food 2019, 17, 365–374. [Google Scholar] [CrossRef]
- Argote, F.; Cuervo, R.; Osorio, E.; Delgado, J.; Villada, H. Evaluación de La Producción de Etanol a Partir de Melaza Con Cepas Nativas Saccharomyces cerevisiae. Biotecnol. Sect. Agropecu. Agroind. 2015, 13, 40–48. [Google Scholar] [CrossRef]
- Alsanad, M.; Sassine, Y.N.; Sebaaly, Z.; Abou, S. Spent Coffee Grounds Influence on Pleurotus Ostreatus Production, Composition, Fatty Acid Profile, and Lignocellulose Biodegradation Capacity. CyTA-J. Food 2021, 19, 11–20. [Google Scholar] [CrossRef]
- Labster Siembra Por Extensión. Available online: https://theory.labster.com/es/spreading/ (accessed on 24 October 2024).
- Insumolab Agar Papa Dextrosa. Available online: https://www.insumolab.cl/descargas/industria/placas_90mm/ficha_tecnica/02.pdf (accessed on 15 December 2024).
- Palma, L. Levaduras: Las Múltiples Aplicaciones de Un “Organismo Modelo”. Available online: https://www.cienciaenchile.cl/levaduras-las-multiples-aplicaciones-de-un-organismo-modelo/ (accessed on 15 December 2024).
- Sun, J.; Shi, M.; Wang, W. Ethanol-Water near-Azeotropic Mixture Dehydration by Compound Starch-Based Adsorbent. Trans. Tianjin Univ. 2015, 21, 427–432. [Google Scholar] [CrossRef]
- Quintero, J.A.; Cardona, C.A. Ethanol Dehydration by Adsorption with Starchy and Cellulosic Materials. Ind. Eng. Chem. Res. 2009, 48, 6783–6788. [Google Scholar] [CrossRef]
- Vane, L.M.; Alvarez, F.R.; Huang, Y.; Baker, R.W. Experimental Validation of Hybrid Distillation-vapor Permeation Process for Energy Efficient Ethanol–Water Separation. J. Chem. Technol. Biotechnol. 2010, 85, 502–511. [Google Scholar] [CrossRef]
- Vane, L.M.; Alvarez, F.R.; Rosenblum, L.; Govindaswamy, S. Efficient Ethanol Recovery from Yeast Fermentation Broth with Integrated Distillation–Membrane Process. Ind. Eng. Chem. Res. 2013, 52, 1033–1041. [Google Scholar] [CrossRef]
- Guevara Luna, M.A.; Fredy Alejandro, F.A.; Belalcazar, L.C. Experimental Data and New Binary Interaction Parameters for Ethanol-Water VLE at Low Pressures Using NRTL and UNIQUAC. Tecciencia 2018, 12, 17–26. [Google Scholar] [CrossRef]

Disclaimer/Publisher’s Note: The statements, opinions and data contained in all publications are solely those of the individual author(s) and contributor(s) and not of MDPI and/or the editor(s). MDPI and/or the editor(s) disclaim responsibility for any injury to people or property resulting from any ideas, methods, instructions or products referred to in the content. |
© 2025 by the authors. Licensee MDPI, Basel, Switzerland. This article is an open access article distributed under the terms and conditions of the Creative Commons Attribution (CC BY) license (https://creativecommons.org/licenses/by/4.0/).