Article

Nano Water Ion Technology for VOCs Degradation: Insights into the Synergistic Mechanism of Hydrogen-Containing and Non-Hydrogen-Containing Reactive Oxygen Species

School of Future Cities, University of Science and Technology Beijing, Beijing 100083, China
*
Author to whom correspondence should be addressed.
Processes 2025, 13(7), 1959; https://doi.org/10.3390/pr13071959
Submission received: 22 May 2025 / Revised: 16 June 2025 / Accepted: 18 June 2025 / Published: 20 June 2025
(This article belongs to the Special Issue Green Separation and Purification Processes)

Abstract

:
Volatile Organic Compounds (VOCs) pollution poses significant threats to both environmental quality and human health, while conventional purification technologies such as photocatalysis and adsorption exhibit limitations, including low efficiency and high operational costs. This study implements Nano Water Ion Technology (NWIT) for efficient VOCs degradation under ambient conditions (20 °C). Through a customized reaction system, we systematically investigated the degradation performance and mechanistic pathways of NWIT toward representative VOCs (formaldehyde and toluene). Experimental analysis revealed significant correlations between NWIT operation and VOCs degradation: degradation efficiency decreased with elevated airflow velocity, increased with higher relative humidity, and demonstrated concentration-dependent kinetics influenced by ambient VOCs levels. Mechanistic studies identified the co-existing state of O2 and H2O as a decisive factor in NWIT efficacy, with non-hydrogen-containing reactive oxygen species exhibiting dominant regulatory roles in VOCs degradation processes, demonstrating superior efficiency enhancement contributions compared to hydrogen-containing reactive oxygen species.

1. Introduction

Volatile Organic Compounds (VOCs), as representative persistent organic contaminants, pose severe threats to air quality, ecological security, and human health due to their extensive release from industrial emissions and indoor decoration scenarios [1,2,3]. Toxic components such as formaldehyde (HCHO) and toluene (C6H5CH3) not only induce respiratory diseases and allergic reactions but are also documented to pose carcinogenic and teratogenic risks [4,5,6,7]. Conventional VOCs treatment technologies including activated carbon adsorption, photocatalytic oxidation, and plasma-based technologies face challenges in meeting practical requirements for cleaner production and sustainable development due to limitations such as high energy consumption for material regeneration, catalyst dependency under stringent reaction conditions, and byproduct pollution (e.g., ozone generation) [8,9,10,11,12]. The development of green purification technologies characterized by high efficiency and environmental compatibility has emerged as a critical pathway to overcome current VOC treatment bottlenecks.
Nano Water Ion Technology (NWIT), as an innovative process grounded in green chemistry principles, employs high-voltage electric fields to dissociate water molecules into nano-scale aqueous clusters and highly reactive oxidative species. This generates a multi-component oxidative system dominated by hydroxyl radicals (·OH) and superoxide anions (O2), while also incorporating hydrogen-containing reactive oxygen species (ROS) such as hydrogen peroxide (H2O2) and singlet oxygen (1O2) [13,14,15,16]. Utilizing water as the sole reaction medium, NWIT demonstrates distinct advantages including ambient temperature/pressure operation (20 °C), absence of secondary pollutant generation, and low energy consumption, thereby aligning with the core philosophy of cleaner production through “pollution prevention at source and process control”. However, current understanding of NWIT-mediated VOC degradation remains confined to the macroscopic “radical oxidation” effects. Systematic elucidation is critically lacking regarding: (1) synergistic/competitive mechanisms between distinct ROS categories (particularly hydrogen-containing vs. non-hydrogen-containing ROS) during purification processes, and (2) regulatory effects of key environmental factors (e.g., co-existing states of O2 and H2O) on ROS generation pathways [17,18,19,20].
The generation of ROS in the NWIT system follows a dual-pathway mechanism. Previous studies have demonstrated that the high-voltage electric field drives water dissociation through two principal routes: (i) direct ionization (H2O → H+ + ·OH + e) and (ii) excited-state dissociation (H2O* →·OH + H·), both generating hydroxyl radicals [21,22,23,24,25]. These radicals subsequently undergo hydrogen-associated recombination (2·OH → H2O2)to form hydrogen peroxide [26,27]. Simultaneously, dissolved oxygen participates in electron capture (O2 + e → O2) under electric field activation, yielding superoxide anion as the primary intermediate [28,29,30]. This O2 species serves as a critical intermediate that progresses through either energy transfer (O2 + ·OH → 1O2 + OH) or redox-mediated transformation (O2 + H2O21O2 + ·OH + OH) to produce singlet oxygen [31,32,33,34]. The distinct reaction pathways underlying ROS formation establish a theoretical framework for the dynamic regulation of ROS composition by microenvironmental factors. Specifically, elevated O2 concentration preferentially enhances O2 and 1O2 production, whereas high humidity amplifies ·OH and H2O2 yields through intensified water dissociation.
Notably, hydrogen-containing ROS (e.g., ·OH and H2O2) and non-hydrogen-containing ROS (e.g., O2 and 1O2) exhibit marked differences in generation mechanisms and oxidative characteristics: the former relies on water molecule dissociation, while the latter is predominantly governed by oxygen activation [21]. Elucidating the respective contributions of these two ROS categories in VOCs degradation represents not only a pivotal scientific challenge for deciphering NWIT’s mechanistic framework but also provides critical guidance for optimizing operational parameters (e.g., humidity and oxygen concentration) to enhance energy-service efficiency. For instance, hydroxyl radicals (·OH), as the hydrogen-containing ROS with the highest oxidation potential (2.8 V), enable non-selective mineralization of VOC molecules. Conversely, superoxide anions (O2), serving as precursors for non-hydrogen-containing ROS, may alter pollutant degradation pathways through chain reactions [30,35,36,37]. However, two fundamental questions remain unresolved: (1) whether hydrogen-containing ROS constitute the dominant driver of NWIT-mediated purification, and (2) how O2/H2O interactions modulate ROS composition to govern degradation efficiency. These knowledge gaps critically hinder the engineering transformation of NWIT into high-efficiency, low-consumption industrial processes.
Building upon this foundation, this study focuses on formaldehyde and toluene as target pollutants. By constructing a reaction system with controlled O2/H2O coexistence states, we systematically investigate the degradation kinetics of NWIT under varying environmental parameters (gas flow rate, relative humidity). The research objectives center on: (1) delineating the practical contributions of hydrogen-containing ROS (·OH, H2O2) versus non-hydrogen-containing ROS (O2) in VOCs purification; (2) elucidating the synergistic regulatory mechanisms of O2 and H2O on ROS generation pathways; (3) uncovering intrinsic correlations between technological performance and cleaner production indicators (energy consumption, water usage, byproduct generation). The findings not only provide a microscopic perspective on ROS-level mechanisms in NWIT but also establish a theoretical foundation for developing high-efficiency air purification systems aligned with cleaner production requirements by defining green reaction conditions governed by “air humidity and oxygen as regulatory factors”.

2. Materials and Methods

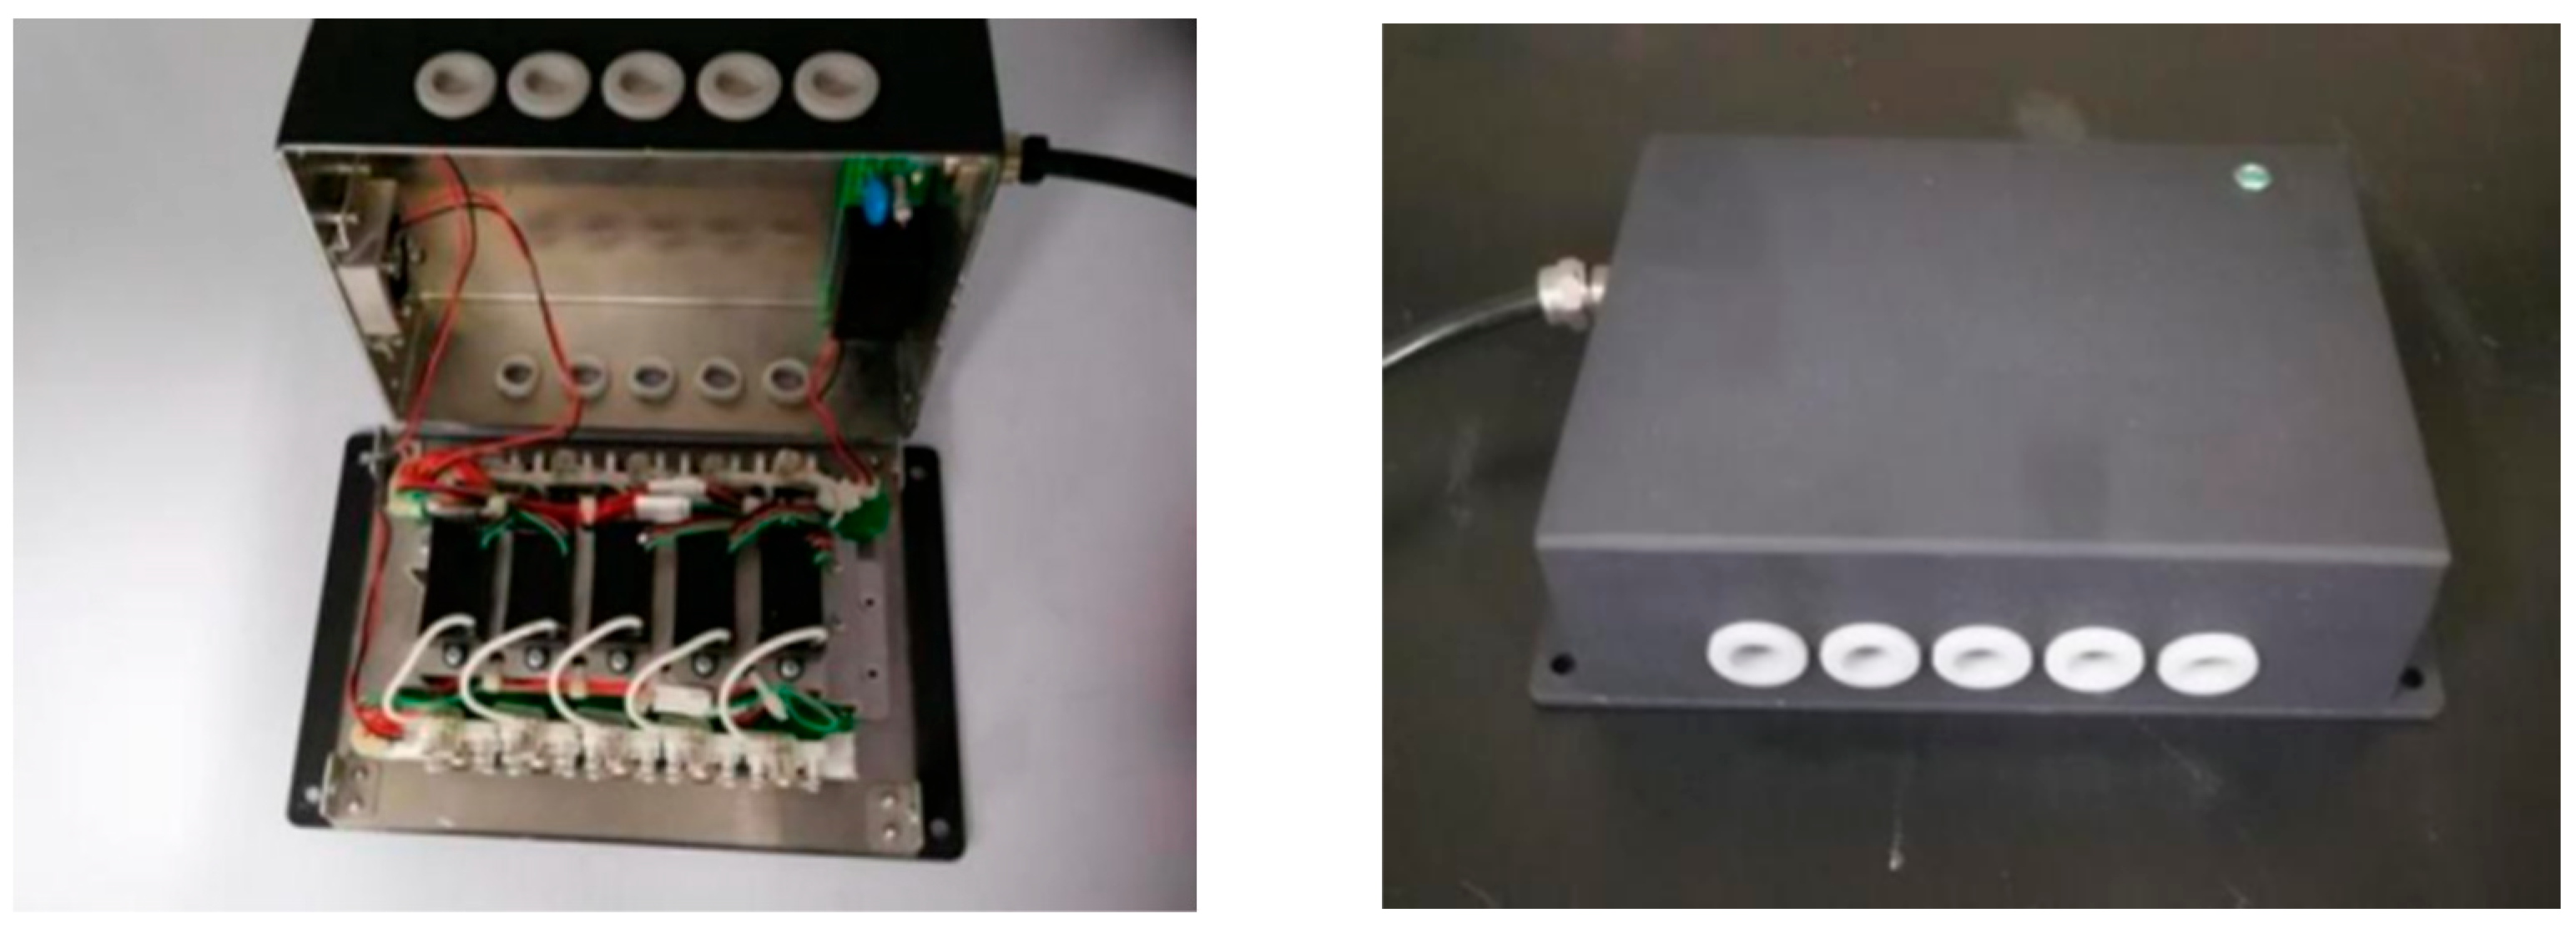
2.1. Experimental Materials and Instruments

Formaldehyde (analytical grade, supplied as a 45% formaldehyde solution) (Sinopharm Chemical Reagent Co., Ltd., Shanghai, China) and toluene (chromatographic grade) (Sinopharm Chemical Reagent Co., Ltd., Shanghai, China) were selected as target pollutant sources. Gaseous VOCs were generated via nitrogen gas (≥99.999%) (Beijing Millennium Gas Sales Company, Beijing, China) and compressed air (≥99.9%) (Beijing Millennium Gas Sales Company, Beijing, China) bubbling methods, respectively.
The experimental system comprised three core components (Figure 1): an H01T19 nano-water ion generator (Suzhou Environmental Technology Co., Suzhou, China), a stainless-steel reaction chamber (0.64 m × 0.49 m × 0.39 m), and an Agilent 7820A gas chromatograph (Agilent Technology Co., Ltd., Beijing, China). The experimental system employed an H01T19 nanoscale aqueous ion generator featuring a dual-chamber design (Figure 2) (dimensions: L × W × H = 20 cm × 15 cm × 7 cm), with an external power supply system. The alternating current to direct current (AC-DC) conversion module facilitates energy transformation, while the discharge electrode configuration consists of an array-type needle-plate structure. Under 12VDC operating voltage, a transient high-voltage electric field forms between electrodes, enabling ambient-temperature water molecular dissociation through gas-phase discharge. This process generates nanoscale aqueous mist and multiple ROS, including hydrogen-containing radicals (·OH, H2O2) and non-hydrogen-containing radicals (O2 and 1O2). The apparatus incorporates five symmetrically arranged air outlets per lateral side (vent dimensions: 1 cm × 1 cm; total airflow: 0.3 L/s; outlet velocity: 0.3 m/s), coordinated with axial flow fans to achieve directional radical dispersion. This aerodynamic design ensures controlled transportation of reactive species within the test environment while maintaining operational stability. VOCs were periodically injected via a 2 mL six-port quantitative loop integrated into the gas chromatograph. Real-time VOC concentrations were monitored using a hydrogen flame ionization detector (FID), with ultra-high-purity hydrogen (≥99.999%) as the carrier gas and compressed air as the auxiliary gas, both supplied by an HA-300 hydrogen-air generator (Beijing Zhonghuipu Analytical Technology Research Institute, Beijing, China).
During experiments, the airflow rate was precisely controlled using an ALICAT mass flow controller (range: 0–2 L/min, accuracy: ±0.5%) (Beijing Taiermeida Technology Development Co., Ltd., Beijing, China). In this study, experimental conditions with varying oxygen presence were established through controlled switching between compressed nitrogen (≥99.9%) and compressed air (≥99.9%) supplies. Relative humidity (RH) was adjusted by varying the concentration of scrubbing solutions in gas washing bottles and dynamically monitored using a WSZY-1 hygrometer (range: 0–90% RH, accuracy: ±2%) (Beijing Tianjian Huayi Technology Development Co., Ltd., Beijing, China).
To ensure data reliability, the gas chromatograph was calibrated with formaldehyde/toluene standard gases (0.1–10 ppm, National Standard Reference Material Research Center, Beijing, China) using a five-point calibration method (R2 > 0.995). The mass flow controller exhibited <1% deviation after calibration with a soap film flowmeter. Triplicate experiments were conducted for each condition, with toluene concentration measurements showing a relative standard deviation (RSD) <3.5%. In blank tests, background pollutant concentrations remained below detection limits (formaldehyde: 0.01 ppm, toluene: 0.005 ppm).
The Agilent 7820A gas chromatography system was optimized with the following experimental parameters for quantitative determination of formaldehyde and toluene: chromatographic separation was achieved using an AC1 capillary column (30 m × 320 μm i.d. × 0.25 μm film thickness), with the injector maintained isothermally at 200 °C under 10 psi pressure in splitless mode to maximize sample introduction efficiency. To address analyte-specific detection requirements, the FID was temperature-optimized with distinct configurations: 280 °C for formaldehyde quantification versus 300 °C for toluene analysis, aligning with their respective ionization characteristics. Quantitative determination relied primarily on peak area integration, while formaldehyde analysis was further supplemented by concurrent peak height evaluation to enhance measurement precision, particularly at trace-level concentrations.

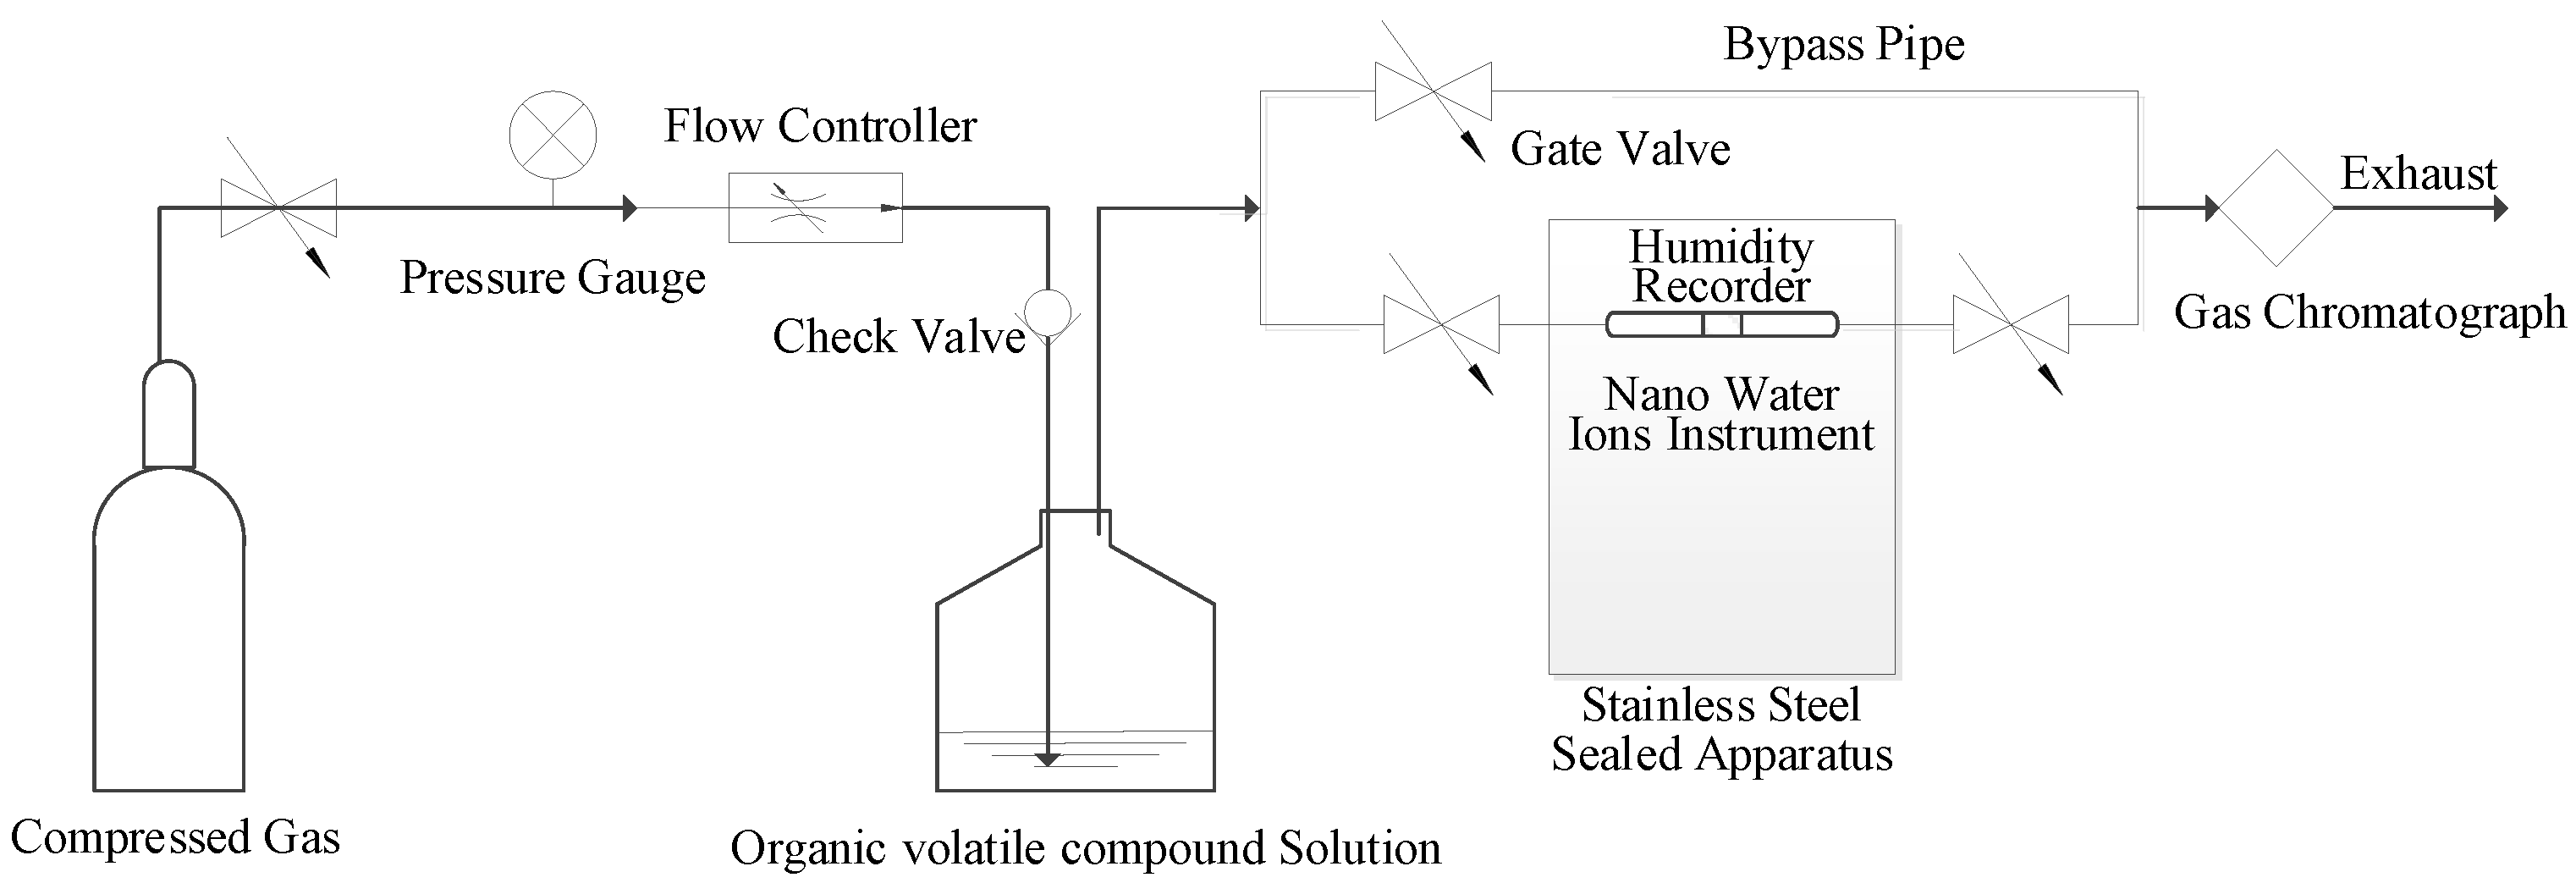
2.2. Experimental Methods and Procedures

The experimental protocol was designed to investigate the purification efficacy and mechanism of NWIT in degrading VOCs through controlled environmental parameters and reaction media conditions.

2.2.1. Purification Efficiency Experiment

The experimental objectives were to determine the kinetic characteristics of formaldehyde and toluene degradation by NWIT, and to quantify the regulatory effects of gas flow velocity and relative humidity on degradation efficiency. Experiments were conducted in a sealed reaction chamber, with steady-state VOCs flow generated via a bubbling method, under operational conditions detailed in Table 1. The experimental procedure involved first placing VOC solutions in the sealed chamber, introducing carrier gas (nitrogen or compressed air) at preset flow rates until concentration stabilization (<5% fluctuation), followed by activating the NWIT system with real-time concentration monitoring. Continuous data acquisition was maintained until purification efficiency reached steady-state (approximately 60 min), during which environmental humidity variations were simultaneously tracked using data-logging hygrometers.

2.2.2. Purification Mechanism Experiment

The experimental objectives were to elucidate the synergistic/competitive mechanisms between O2 and H2O in radical generation pathways and to analyze the differential contributions of these dual factors to degradation rates. Experiments were conducted by adjusting gas composition and solution systems to establish controlled conditions (as detailed in Table 2), with oxygen-free conditions achieved by using nitrogen as the carrier gas in the bubbling method.

2.3. Data Analysis and Evaluation

Taking VOCs in the stainless steel chamber as the research object, governing equations were established based on mass conservation:
d C ( t ) d t = G V [ C 0 C ( t ) ] S V
where C(t)—Real-time VOCs concentration in the chamber, mg/m3;
V—Volume of the stainless steel chamber, 0.122304 m3;
t—Time, min;
G—Ventilation rate measured by gas flowmeter, m3/min;
C0—VOCs concentration in inlet airflow, mg/m3;
S—Purification rate of the air purifier, mg/min.
Model I: When purification efficiency remains constant (S = m, where m is a constant), the solution to the differential equation is:
C ( t ) = G C 0 m G + ( C i n i t G C 0 m G ) e G V t
where Cinit—Initial VOCs concentration in the chamber at t = 0, mg/m3.
Model II: When purification efficiency shows first-order correlation with chamber VOCs concentration (S = rC(t), with constant coefficient r (m3/min)), the solution becomes the following:
C ( t ) = G C 0 G + r + ( C i n i t G C 0 G + r ) e G + r V t
The unknown parameters m, r, and C0 in both models were determined through experimental data fitting using Levenberg–Marquardt optimization algorithm. Dual evaluation metrics (Residual Sum of Squares (RSS), adjusted Coefficient of Determination (COD))were employed to assess model fitting quality. Lower RSS values indicate better agreement between fitted and measured values, while a COD approaching 1 demonstrates a higher proportion of data variability explained by the model.
Based on the dual evaluation system of RSS and COD, this study identified the optimal fitting model for the VOCs degradation process by NWIT. A quantitative comparative analysis framework was established to investigate the nonlinear regulation patterns of gas flow rate and relative humidity on degradation efficiency under various experimental conditions, revealing the structure–activity relationships between critical environmental factors and NWIT performance. Through purification mechanism experiments, the differential contributions of hydrogen-containing and hydrogen-free ROS in NWIT-mediated VOCs degradation were quantitatively analyzed, while the dynamic regulatory effects of O2 and H2O molecules on ROS generation mechanisms and their respective contributions to NWIT purification efficiency were systematically elucidated.

3. Results and Discussion

3.1. Degradation Kinetics and Response to Environmental Parameters

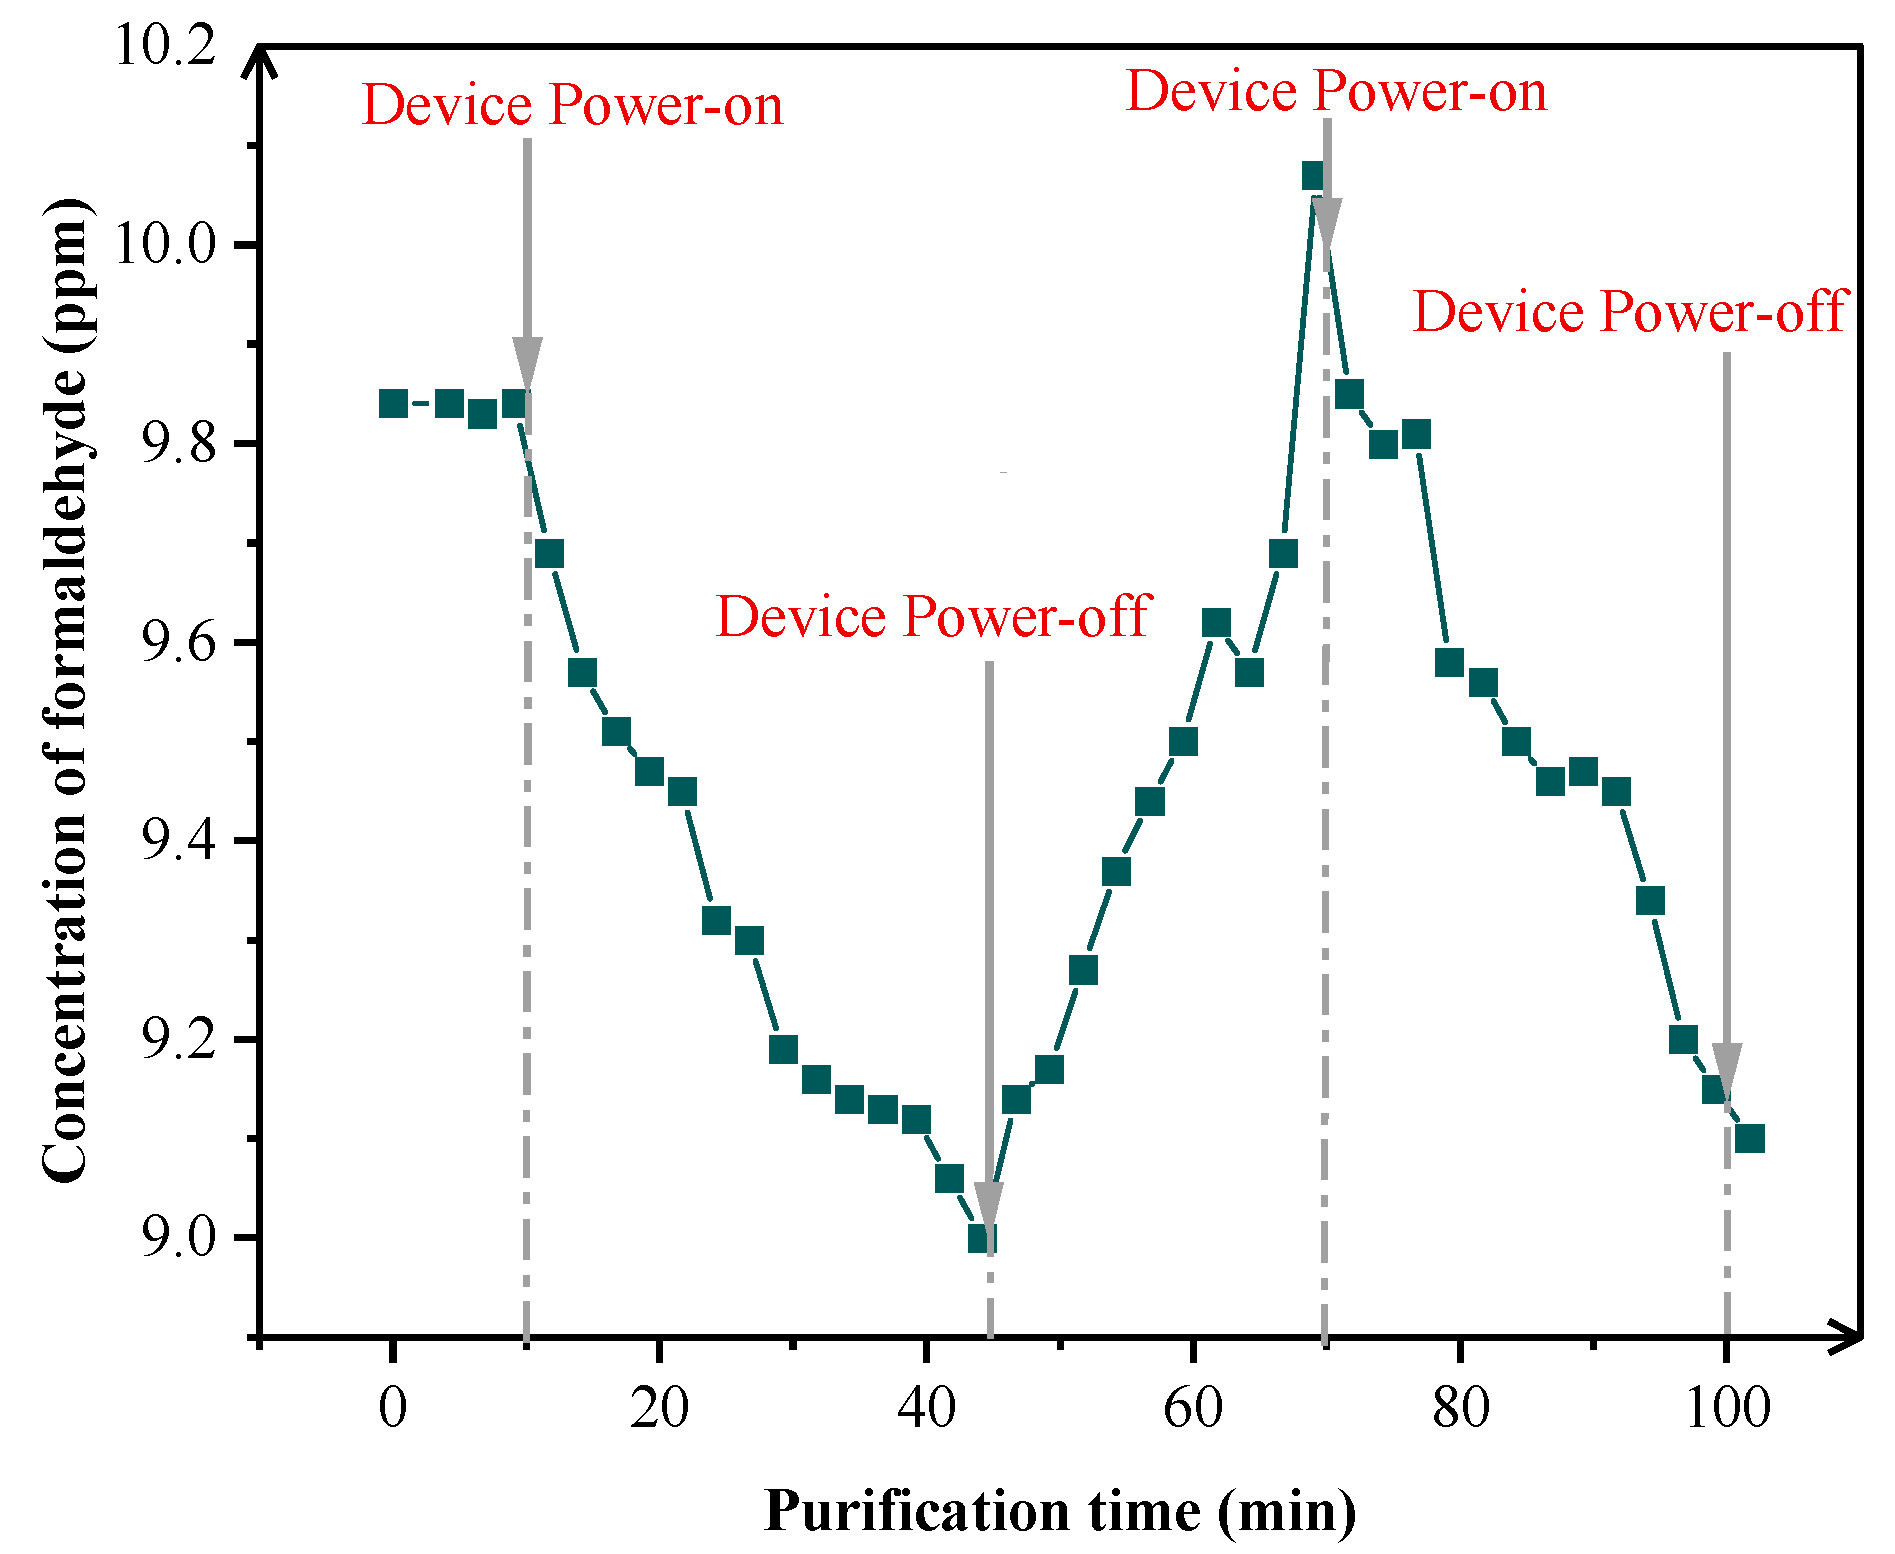
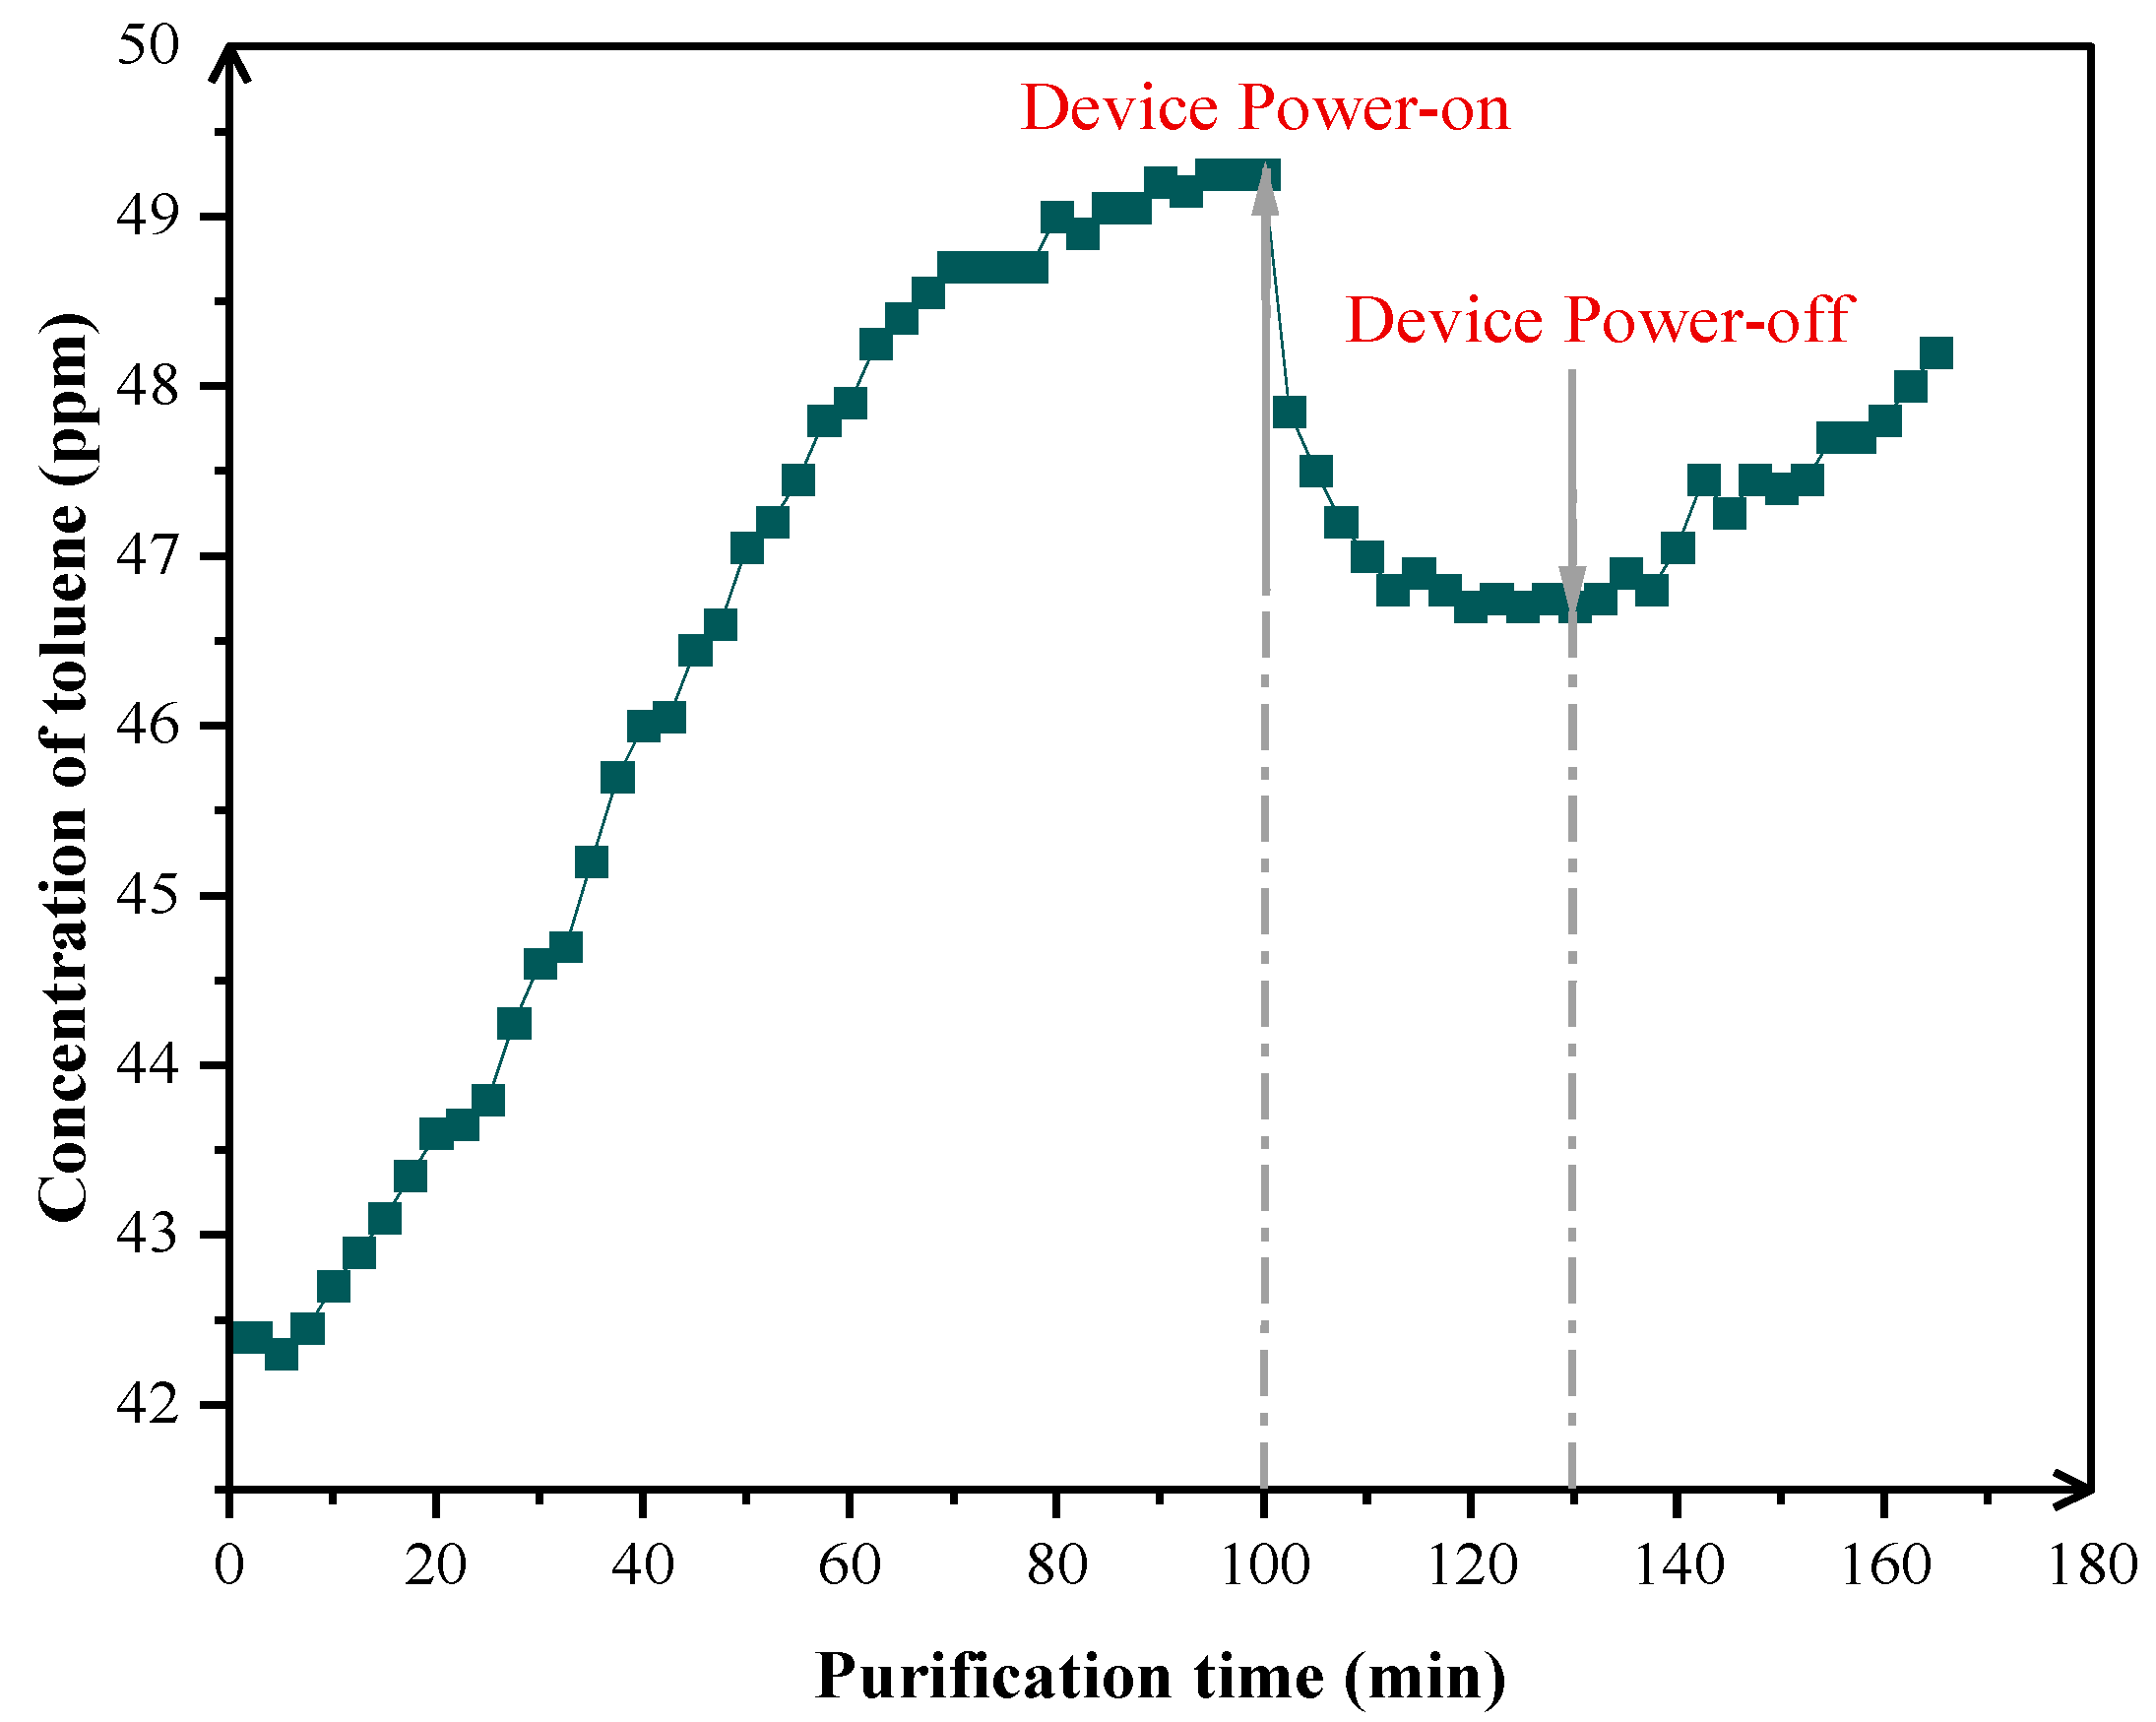
3.1.1. Verification of Temporal Response Between NWIT and VOCs Degradation

The temporal responsiveness was systematically validated through a three-phase control strategy using dry compressed air (1.4 SLPM) to bubble through 5% formalin solution, establishing a steady-state formaldehyde release system, as illustrated in Figure 3. Upon stabilizing the formaldehyde concentration at 9.84 ± 0.05 ppm in the sealed chamber, the NWIT device was activated at t = 10 min, achieving a 7.32% reduction (9.12 ± 0.05 ppm) within 35 min. Subsequent deactivation at t = 45 min resulted in concentration recovery to 10.07 ± 0.05 ppm (t = 70 min) due to continuous source gas replenishment. Reactivation at t = 70 min reproduced the degradation efficacy, reaching 9.15 ± 0.05 ppm at t = 100 min. The strict synchronization between device operation and concentration dynamics effectively excluded natural decay interference (blank test decay rate < 3%/h).
A steady-state toluene environment was established by bubbling compressed air (1.4 SLPM) through a 10% toluene solution. The initial concentration stabilized at 49.20 ± 0.05 ppm. Upon NWIT activation at t = 100 min, a nonlinear concentration decay to 46.70 ± 0.05 ppm (5.08% reduction) was observed within 30 min. During the deactivation phase (t = 130–160 min), the concentration rebounded to 47.8 ± 0.05 ppm due to continuous pollutant replenishment. Repeatable degradation efficacy was demonstrated through device reactivation, confirming the NWIT-driven nature of toluene purification (Figure 4). It is worth emphasizing that during the degradation experiments of both formaldehyde and toluene, no significant byproduct peaks were observed in the chromatograms. All detected signals strictly corresponded to the retention times and response characteristics of the target pollutants (formaldehyde or toluene), with no additional identifiable chromatographic peaks detected. These results indicate that the NWIT-mediated VOC degradation process generates minimal byproducts, whose concentrations fall below the limit of detection (LOD) of GC-FID analysis.

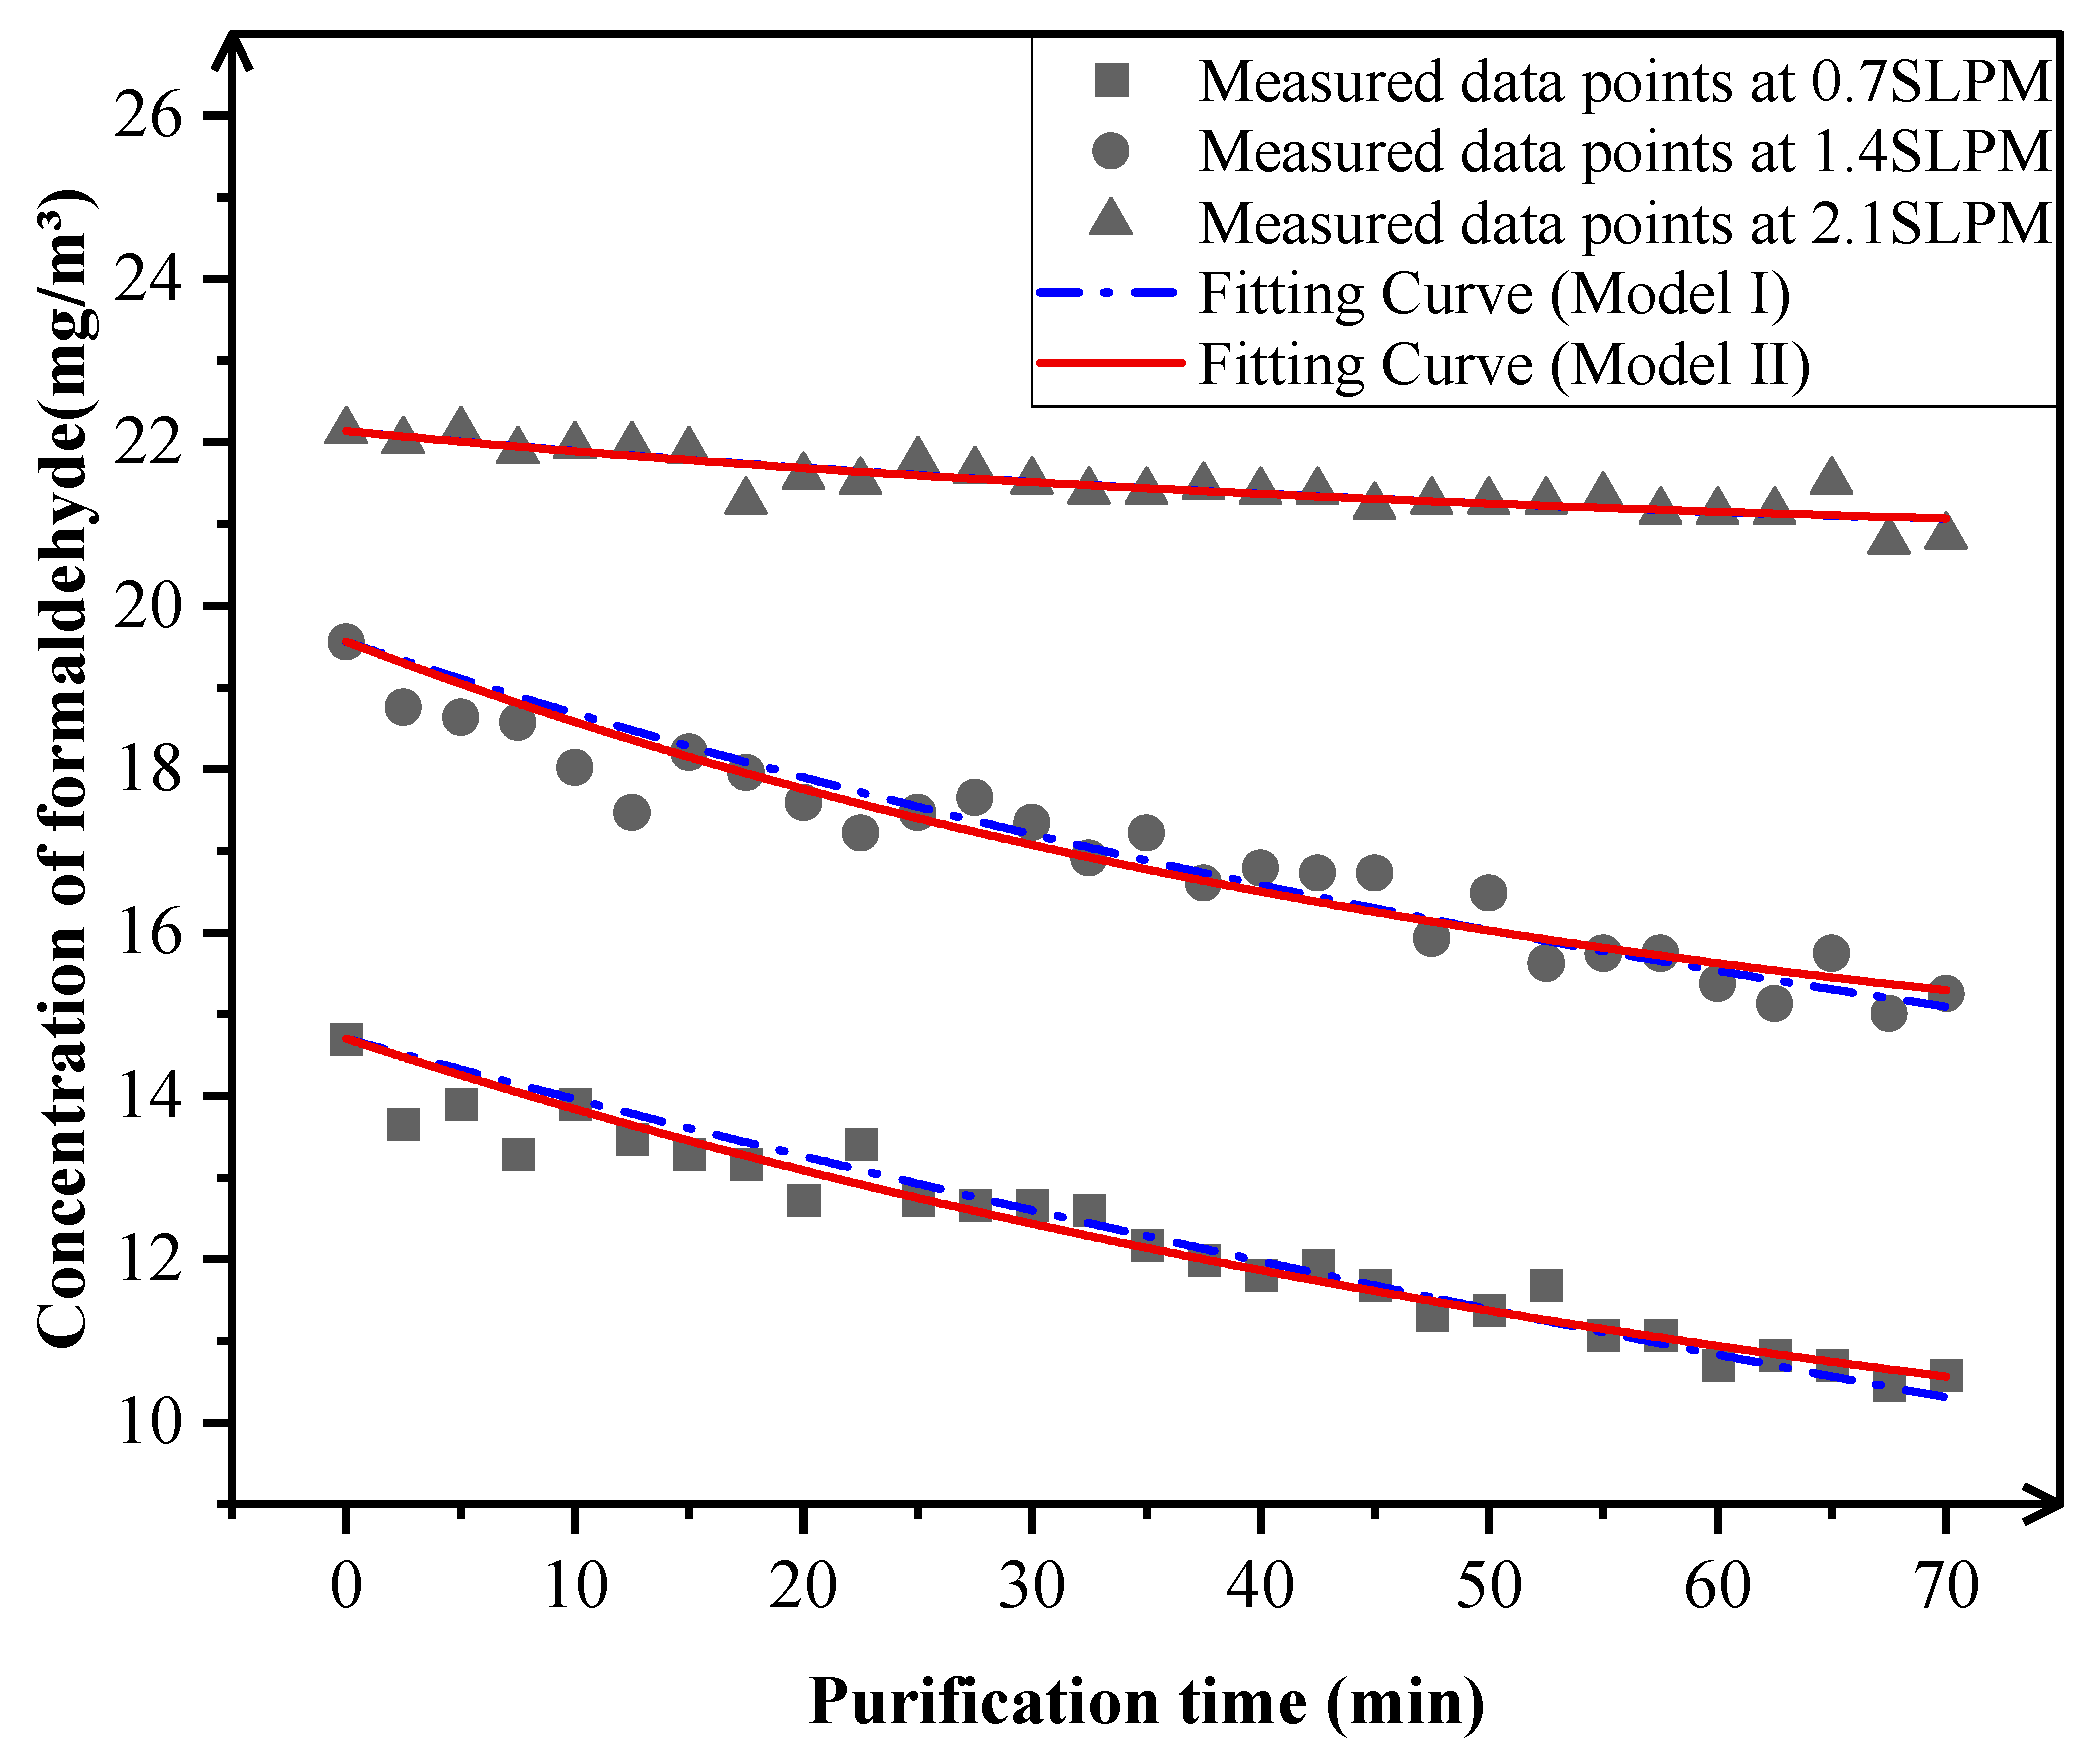
3.1.2. Flow Decay-Induced Mass Transfer Limitations

The gas flow rate critically governs VOC degradation efficiency. Using dry compressed air at ambient temperature (20 °C), we systematically bubbled 5% formaldehyde solution at 0.7, 1.4, and 2.1 SLPM. Following formaldehyde concentration stabilization in the stainless steel chamber, the nano aqua ion generator was activated. Figure 5 displays time-dependent concentration profiles under different flow rates with Model I/II fitting curves, while Table 3 compares the goodness-of-fit metrics between the two models.
As evidenced by the data shown in Table 3, Model II demonstrates consistently lower RSS than Model I across all tested flow-rate conditions. Specifically, under 0.7 and 1.4 SLPM conditions, Model II achieves adjusted COD closer to 1 compared to Model I, indicating its superior fitting performance in describing NWIT-mediated formaldehyde degradation dynamics. Notably, at 2.1 SLPM, while both models exhibit comparable COD values, this parity likely stems from the diminished overall degradation efficiency observed at this elevated flow rate. Collectively, the dominance of Model II implies a dynamic coupling between NWIT-driven degradation efficiency and real-time formaldehyde concentration, as governed by the relationship S = rC(t), where S represents the degradation rate and C(t) denotes instantaneous concentration.
Further analysis of the reaction rate constant r derived from Model II fitting reveals distinct values across flow rates: 9.93108 × 10⁻⁴ m3/min at 0.7 SLPM, 8.05983 × 10⁻⁴ m3/min at 1.4 SLPM, and 1.34534 × 10⁻⁴ m3/min at 2.1 SLPM. This demonstrates a monotonic decrease in r with increasing flow rates (0.7 → 1.4 → 2.1 SLPM), indicating that elevated airflow velocities suppress formaldehyde degradation efficiency. The suppression mechanism arises from high-speed flow drastically reducing the contact duration between formaldehyde molecules and ROS, thereby limiting the completion of effective degradation reactions [38,39].
In the study on toluene, under the same ambient temperature of 20 °C, compressed air was bubbled into a 20% toluene solution at three flow rates: 0.7, 1.4, and 2.1 SLPM. After the toluene concentration stabilized in the stainless steel chamber, the nano hydrated ion generator was activated, and a gas chromatograph (sampling interval: 2.5 min) was used to monitor toluene concentration changes in real time. The temporal concentration profiles of toluene under different flow rates and the fitting curves of Model I and Model II are shown in Figure 6, while a detailed comparison of the fitting performance between the two models is provided in Table 4.
The goodness-of-fit of Model II for toluene degradation also exhibited flow rate dependent characteristics. Under the 0.7 SLPM condition, Model II showed a 13.94% improvement in COD compared to Model I, with a 53.35% reduction in RSS. At 1.4 SLPM, COD increased by 1.49% and RSS decreased by 48.78%, while at 2.1 SLPM, COD improved by 0.41% with a 37.51% RSS reduction. These results indicate that the degradation kinetics of toluene align with a concentration-dependent mechanism (S = rC(t)).
The toluene degradation rate constant r obtained from Model II fitting exhibited a progressively declining trend with increasing flow rates: r = 6.73161 × 10⁻³ m3/min at 0.7 SLPM, decreasing to 2.39838 × 10⁻³ m3/min at 1.4 SLPM, and sharply dropping to 1.29153 × 10⁻³ m3/min at 2.1 SLPM. Compared to toluene, formaldehyde showed a more pronounced attenuation in r-values across flow conditions (86.45% reduction for formaldehyde vs. 80.81% for toluene from 0.7 SLPM to 2.1 SLPM). This discrepancy is directly attributed to the chemical stability of the benzene ring in toluene’s molecular structure—toluene degradation requires higher-energy radical attacks, while high-velocity airflow not only shortens reaction contact time but also accelerates the quenching rate of ROS in the gas phase [40,41].

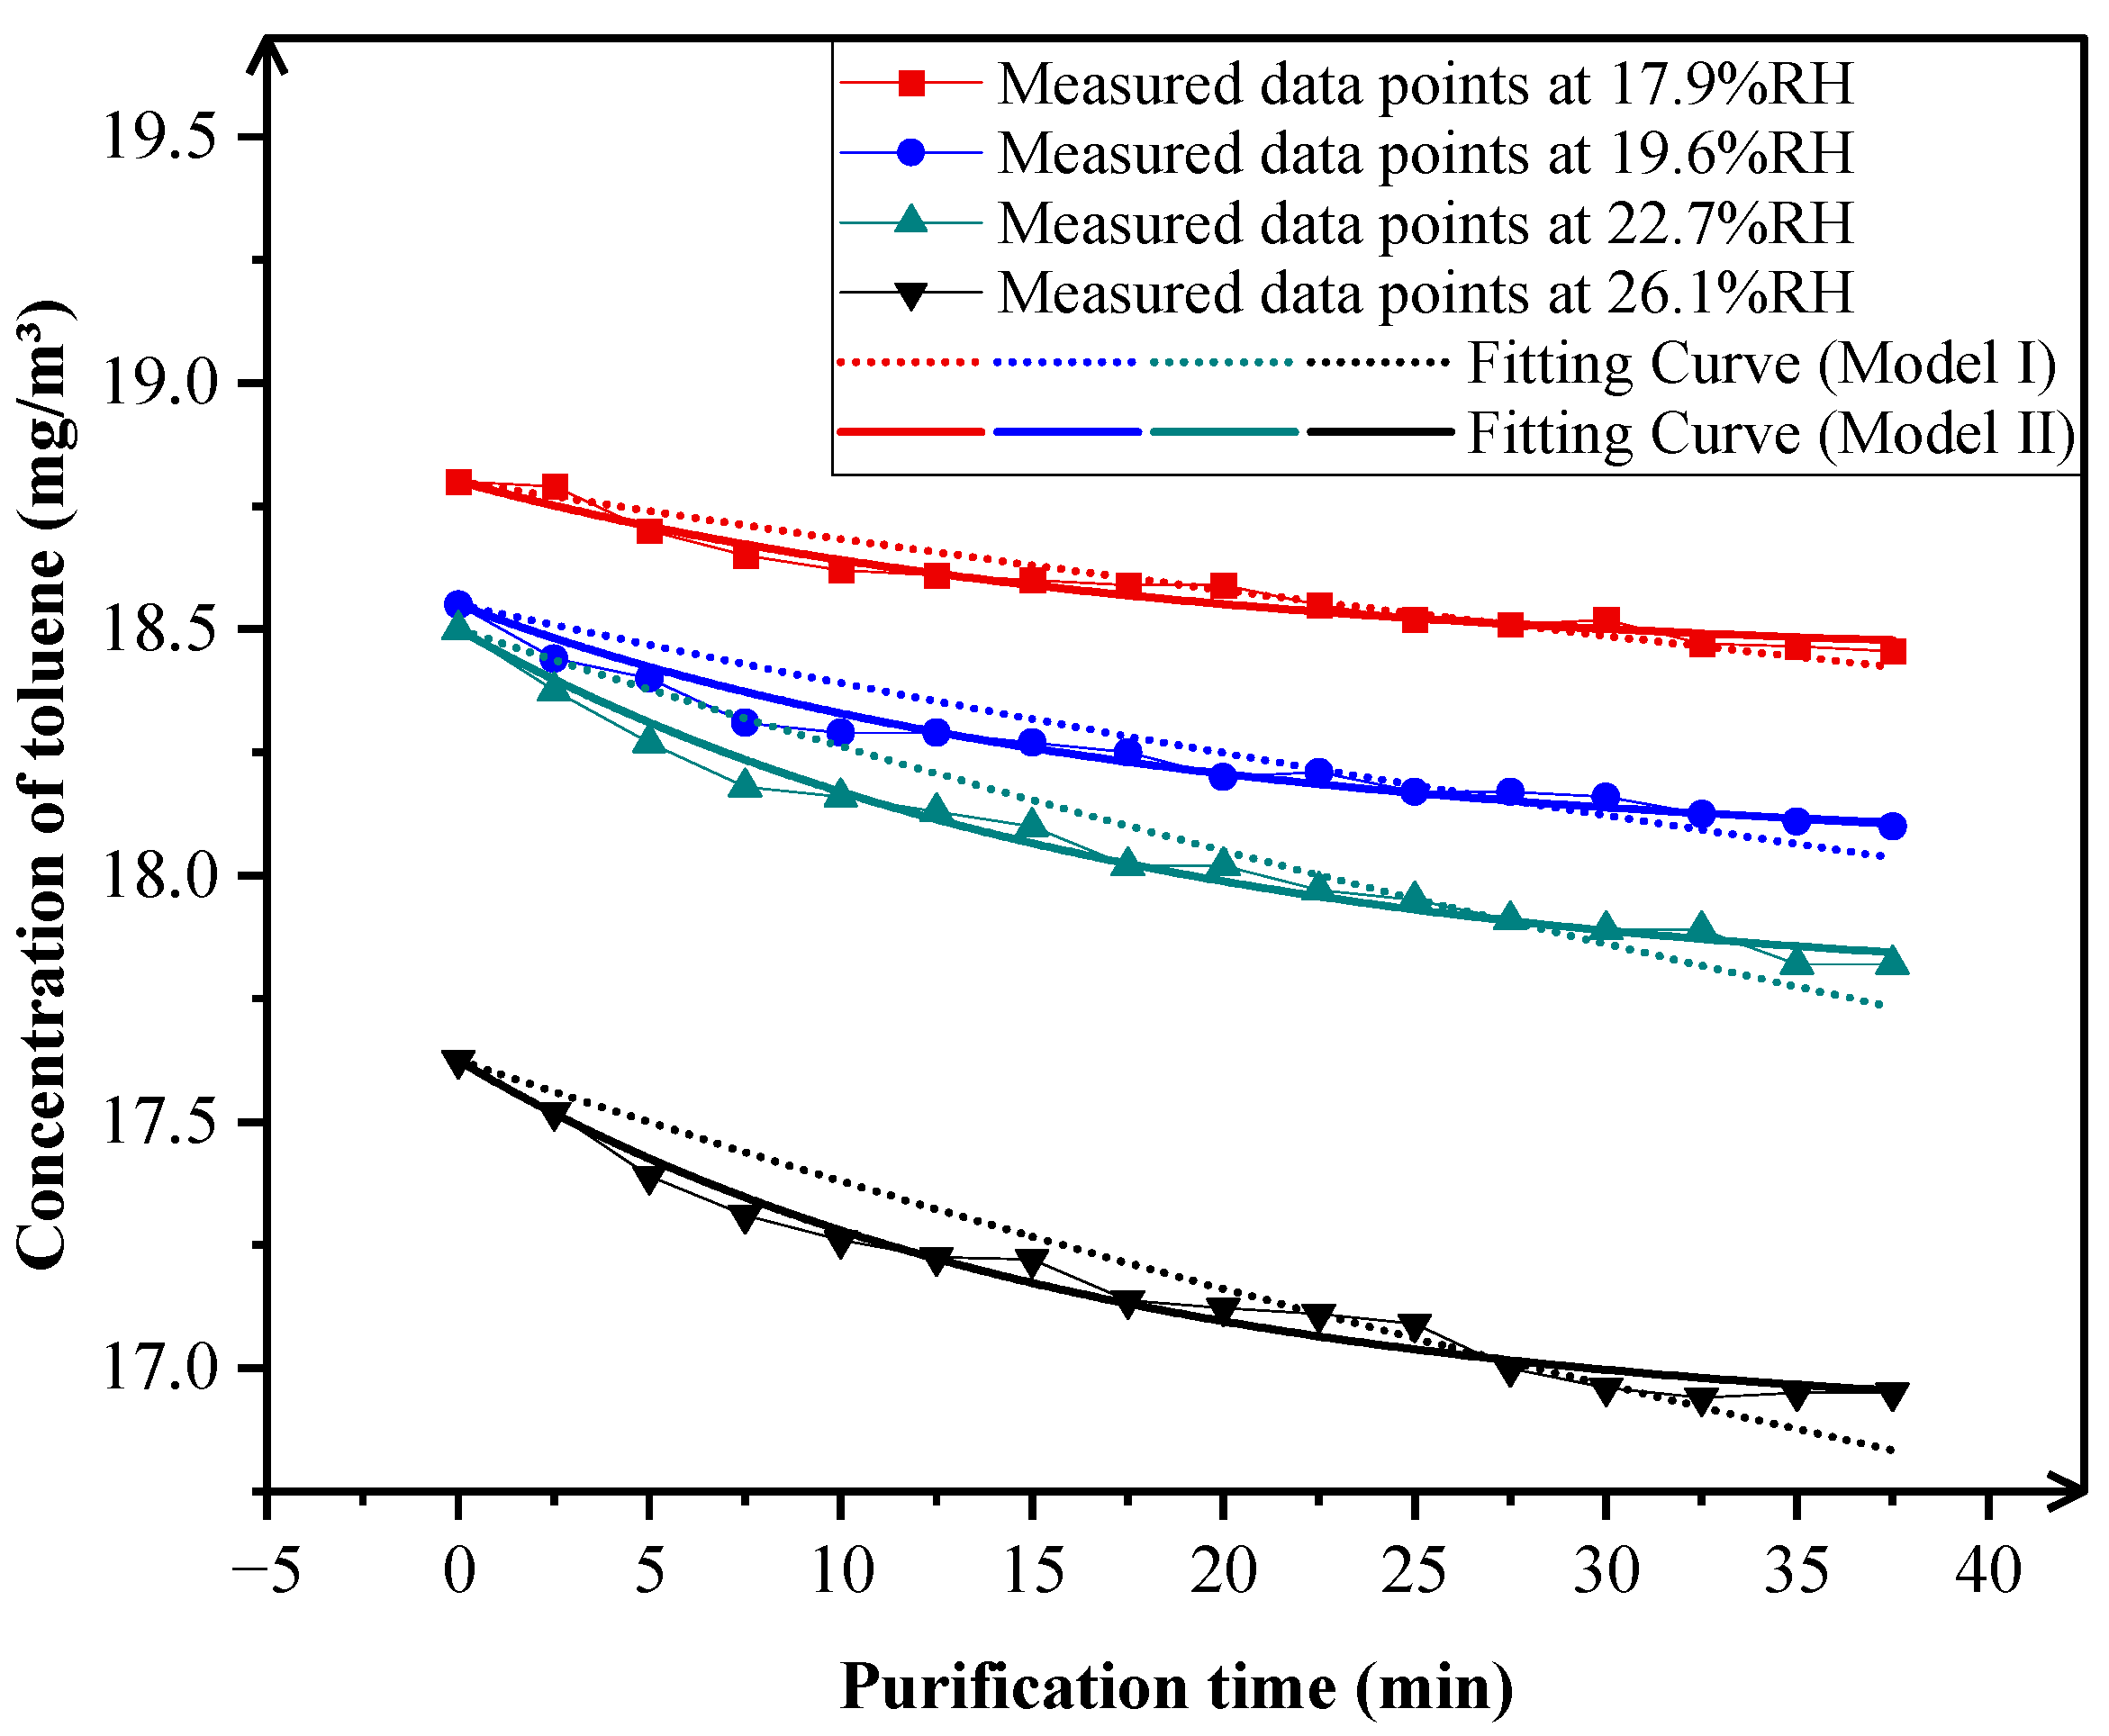
3.1.3. Impact of Relative Humidity on Degradation Efficiency

Water molecules, serving as the core reaction medium for hydrogen-containing ROS generation, exhibit regulatory control over the production of hydroxyl radicals (·OH), hydrogen peroxide (H2O2), and related ROS through their concentration variations. During the experiment, different humidity environments were established by modulating the amount of deionized water added to the 5% formaldehyde solution and introducing pure nitrogen gas into the solution via the bubbling method. Formaldehyde degradation experiments demonstrated that NWIT achieved significantly enhanced degradation efficiency when relative humidity (RH) increased from 40.1% to 58.0% (Figure 7). As shown in Table 5, Model II fitting results revealed a humidity-dependent elevation in formaldehyde degradation rate constants (r-values) from 3.31 × 10⁻³ m3/min to 3.56 × 10⁻³ m3/min, corresponding to an 8% efficiency enhancement. This improvement stems from elevated water content, which not only amplifies ·OH generation but also sustains H2O2 supply capacity, thereby increasing the oxidative attack density of radicals on formaldehyde molecules.
During the experiment, different humidity environments were established by modulating the amount of deionized water added to the pure toluene solution, followed by introducing pure nitrogen gas into the solution via the bubbling method at 20 °C. Temporal concentration profiles of toluene under different relative humidity are shown in Figure 8. In toluene degradation experiments, despite a lower relative humidity adjustment range (17.9~26.1%) compared to the formaldehyde group, a similar trend was observed: when RH increased from 17.9% to 26.1%, the toluene degradation rate constant (r-value) rose from 5.63 × 10⁻³ m3/min to 6.28 × 10⁻³ m3/min, achieving an efficiency gain of 11.5% (Table 6). This phenomenon indicates that elevated humidity enhances water molecule dissociation efficiency, thereby increasing the concentration of hydrogen-containing ROS (e.g., ·OH and H2O2) and accelerating oxidative cleavage of the aromatic ring in toluene molecules. Notably, compared to formaldehyde, toluene degradation exhibits higher humidity sensitivity, which may correlate with its greater chemical stability—its degradation requires a sustained high-concentration ROS supply to overcome the reaction energy barrier [40,41].
Experimental data further reveal a nonlinear positive correlation between hydrogen-containing ROS generation and ambient humidity. For instance, at 40.1% RH, the production rate of hydrogen-containing ROS is constrained by limited water molecule dissociation efficiency, resulting in relatively low degradation efficiency. However, when the humidity rises to 58.0% RH, abundant water molecules not only supply raw materials for ·OH generation but also facilitate chain decomposition of intermediates (e.g., H2O2), forming a multicomponent oxidation system that significantly enhances VOCs mineralization efficiency. This finding demonstrates that humidity regulation in NWIT operates globally, essentially strengthening pollutant degradation through synergistic generation pathways of hydrogen-containing ROS.

3.2. Analysis of Synergistic Interaction Mechanisms of ROS

Current research demonstrates dual-pathway mechanisms in NWIT-mediated VOCs degradation: hydrogen-containing ROS oxidation and non-hydrogen-containing ROS reaction pathways. The degradation rate of VOCs is co-regulated by the concentrations of hydrogen-containing ROS (e.g., hydroxyl radicals (·OH) and hydrogen peroxide (H2O2)) and non-hydrogen-containing ROS (e.g., superoxide anion (O2·) and singlet oxygen (1O2)). Specifically, molecular oxygen (O2) serves as a prerequisite for non-hydrogen-containing ROS generation, while hydrogen-containing ROS production is strictly dependent on H2O availability [19,42]. This study systematically investigates the divergent degradation behaviors of toluene and formaldehyde under varying environmental conditions by modulating the presence states of O2 and H2O in mechanistic experiments.

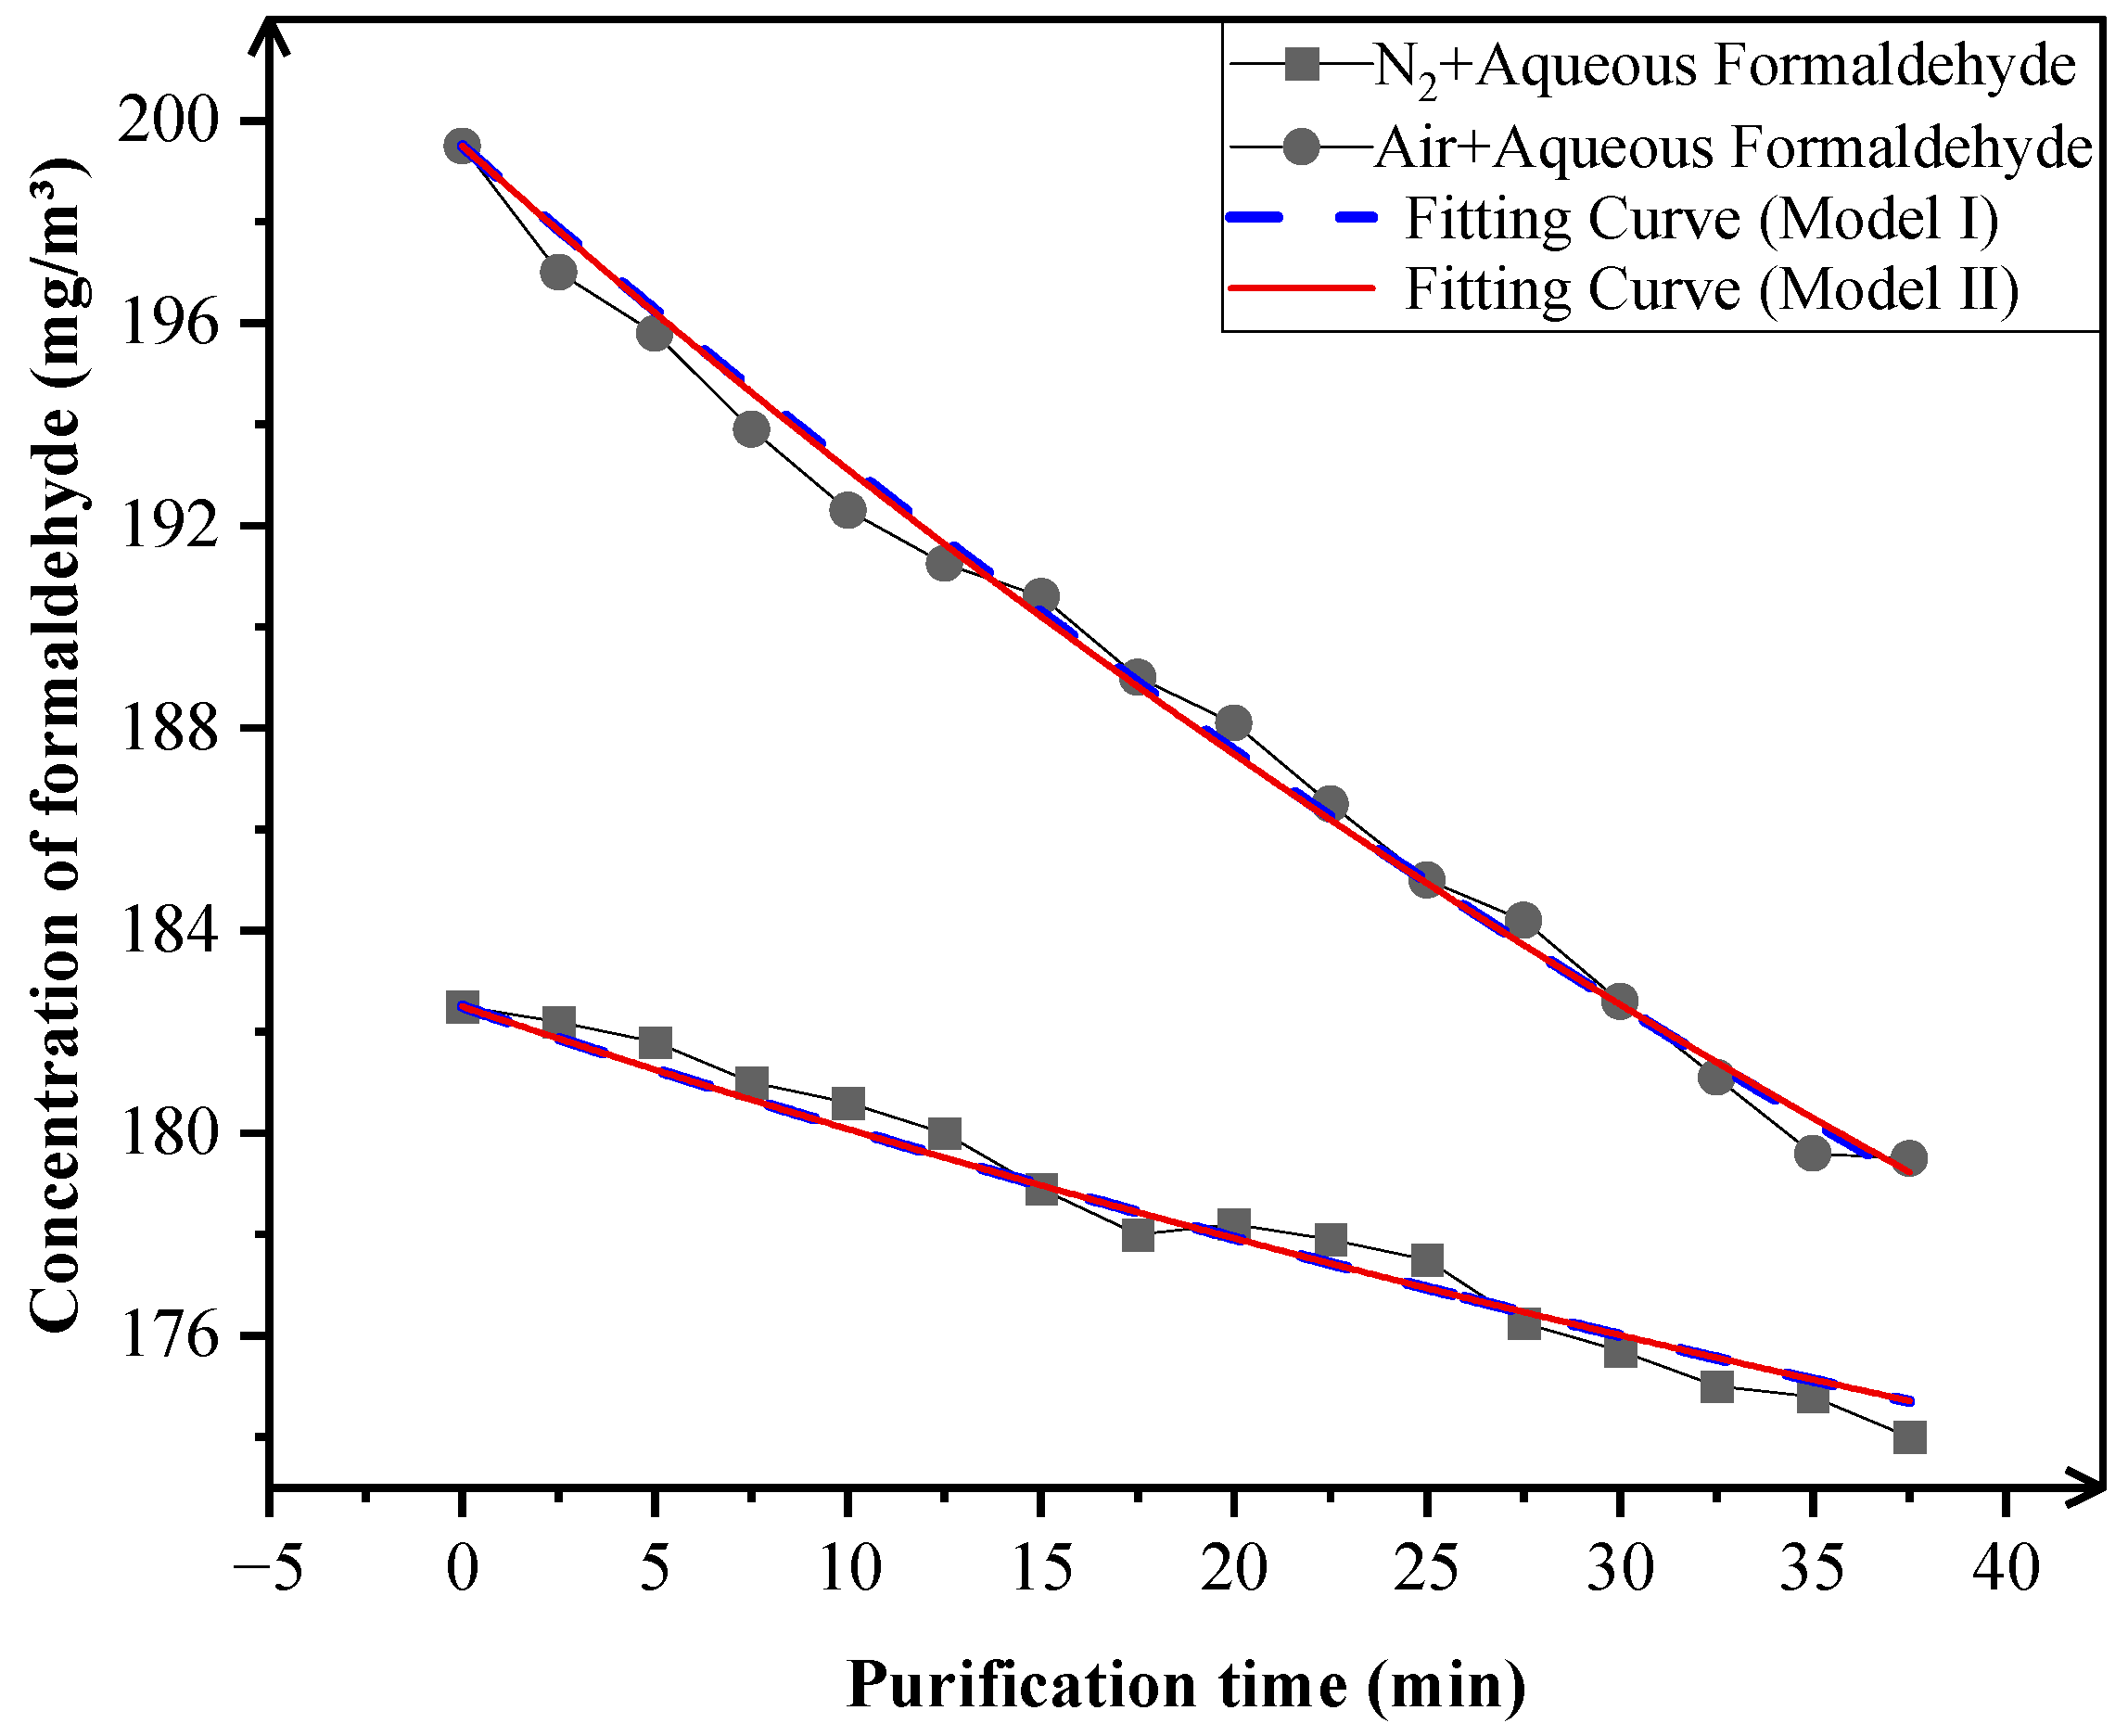
3.2.1. Mechanistic Study on Formaldehyde Purification

The mechanistic study on formaldehyde purification employed a dual-control experimental system: The first group utilized a nitrogen (N2)-formaldehyde aqueous solution system, while the second group consisted of an air–formaldehyde aqueous solution system, with the key distinction between the two experimental systems lying in the presence/absence of molecular oxygen (O2). During the experiment, formaldehyde gas was delivered into the reactor via the bubbling method using background gas through a stainless steel cylindrical bottle containing a 5% formaldehyde solution maintained at 20 °C. Figure 9 provides a visual comparison, demonstrating significantly superior formaldehyde degradation efficiency in the oxygen-containing system compared to the oxygen-free system. The fitting results of Model II under both conditions are systematically presented in Table 7. Notably, the degradation efficiency constant (r value) in the air–formaldehyde aqueous solution system exhibits a substantial enhancement relative to that observed in the nitrogen–formaldehyde system.
In the oxygen-free system, the absence of O2 impedes the generation of non-hydrogen-containing ROS (e.g., O2· and 1O2), leaving hydrogen-containing ROS (e.g., ·OH and H2O2) as the primary contributors to formaldehyde degradation. However, due to the limited production efficiency and restricted reaction radius of hydrogen-containing ROS, the overall formaldehyde degradation capacity remains suboptimal. Conversely, in the oxygen-containing system, O2 availability facilitates the formation of non-hydrogen-containing ROS (e.g., O2· and 1O2), which synergistically interact with hydrogen-containing ROS to amplify the concentration gradient of highly reactive radicals within the experimental microenvironment. These results unambiguously demonstrate a cooperative enhancement mechanism between hydrogen-containing and non-protonated ROS during formaldehyde degradation, collectively driving the pollutant mineralization process.

3.2.2. Mechanistic Study on Toluene Purification

The toluene purification experiment established a four-condition control matrix: The baseline group employed an O2 and H2O-free pure N2-toluene system, while other groups combined H2O/O2 presence modulation. During the experiment, toluene gas was delivered into the reactor via the bubbling method using background gas through a stainless steel cylindrical bottle containing a 20% toluene solution or pure 100% toluene solution, with the system maintained at 20 °C. Experimental data and fitting curves of both models under four configurations are shown in Figure 10, with fitting results of Model II in Table 8.
Under dual-deprivation of O2 and H2O (N2-toluene system), NWIT exhibited minimal toluene degradation efficiency due to the absence of both H2O (source for hydrogen-containing ROS like ·OH/H2O2) and O2 (source for non-hydrogen-containing ROS like O2·/1O2). When H2O alone was present (N2-aqueous toluene system), hydrogen-containing ROS dominated oxidation-enhanced degradation, yet the inherent stability of the aromatic ring still imposed significant kinetic barriers without synergistic non-hydrogen-containing ROS.
Under O2-only conditions (air–pure toluene system), non-hydrogen-containing ROS (e.g., O2· and 1O2) became the dominant reactive species, driving superior toluene degradation efficiency compared to H2O-dominant scenario. This enhancement stems from non-hydrogen-containing ROS initiating chain reactions that specifically target the aromatic ring’s electron-dense regions through radical addition pathways, thereby confirming O2’s master regulatory role in degradation kinetics.
In the dual-factor coexistence system (air + toluene aqueous solution), both hydrogen-containing ROS and non-hydrogen-containing ROS jointly participate in the purification reaction, exhibiting a synergistic enhancement effect, with toluene degradation efficiency reaching the highest value. Hydrogen-containing ROS can perform preliminary oxidation on toluene molecules, breaking partial chemical bonds and creating conditions for further attack by non-hydrogen-containing ROS, while non-hydrogen-containing ROS accelerate the mineralization process of toluene molecules through chain reactions.
Mechanistic studies reveal that the coexistence of O2 and H2O exerts a decisive influence on the VOCs degradation efficiency of NWIT. For both toluene and formaldehyde systems, the dual-factor (O2 + H2O) synergistic catalysis demonstrates optimal purification performance. Notably, toluene-specific experiments further indicate that non-hydrogen-containing ROS play a dominant regulatory role in VOCs degradation processes, with their contribution to efficiency enhancement exceeding that of hydrogen-containing ROS. These findings provide critical evidence for understanding the radical synergy mechanism in NWIT-mediated VOCs degradation and offer theoretical support for optimizing the technology’s operational conditions.

4. Conclusions

This study centers on the degradation efficiency and mechanistic pathways of NWIT toward VOCs. Through systematic experimental investigations, the following critical conclusions are drawn:
The degradation efficiency of NWIT toward VOCs demonstrates marked concentration dependence. For both formaldehyde and toluene as representative pollutants, the systems exhibit concentration-dependent degradation kinetics, with their structure–activity relationship accurately described by S = rC(t). This characteristic provides critical evidence for elucidating NWIT’s degradation behaviors under varying VOC concentration conditions.
Elevated airflow velocity significantly shortens the effective reaction time, thereby leading to reduced degradation efficiency. The high-speed airflow substantially decreases contact duration between VOC molecules and ROS, which provides insufficient time for effective degradation reactions to fully proceed. This phenomenon was conclusively validated in degradation experiments involving both formaldehyde and toluene.
Elevated relative humidity positively enhances VOC degradation efficiency. As critical mediators for hydrogen-containing ROS generation, water molecules stimulate substantial production of hydrogen-containing ROS, including hydroxyl radicals (OH) and hydrogen peroxide (H2O2) under high-humidity conditions. These hydrogen-containing ROS play pivotal roles in the oxidative degradation pathways of VOCs, thereby significantly improving degradation performance.
During the degradation of toluene and formaldehyde, the system demonstrates optimal degradation performance when O2 and H2O coexist. non-hydrogen-containing ROS play a predominant regulatory role in VOCs degradation, exhibiting significantly higher contributions to purification efficiency compared to hydrogen-containing ROS. For instance, in toluene degradation experiments, the efficiency enhancement under O2 alone exceeded that with H2O alone, while peak efficiency was achieved under their coexistence. This discovery establishes a theoretical framework for optimizing oxidative reaction conditions in NWIT environmental purification systems, providing critical insights for enhancing the technology’s operational effectiveness in real-world applications.

Author Contributions

Conceptualization, G.Z. and F.S.; methodology, G.Z.; software, Y.W.; validation, G.Z., F.S. and Y.W.; formal analysis, G.Z. and Y.W.; investigation, M.M.; resources, G.Z.; data curation, Y.W.; writing—original draft preparation, Y.W.; writing—review and editing, G.Z.; visualization, Y.W.; supervision, G.Z.; project administration, G.Z.; funding acquisition, G.Z. All authors have read and agreed to the published version of the manuscript.

Funding

This research received no external funding.

Data Availability Statement

The original contributions presented in this study are included in the article. Further inquiries can be directed to the corresponding author.

Conflicts of Interest

The authors declare no conflicts of interest.

References

  1. Mai, J.-L.; Yang, W.-W.; Zeng, Y.; Guan, Y.-F.; Chen, S.-J. Volatile organic compounds (VOCs) in residential indoor air during interior finish period: Sources, variations, and health risks. Hyg. Environ. Health Adv. 2024, 91, 100087. [Google Scholar] [CrossRef]
  2. Jindamanee, K.; Keawboonchu, J.; Pinthong, N.; Meeyai, A.; Inchai, P.; Thepanondh, S. Environmental impacts and emission profiles of volatile organic compounds from petroleum refineries. Sci. Rep. 2025, 15, 15509. [Google Scholar] [CrossRef] [PubMed]
  3. Montero-Montoya, R.; López-Vargas, R.; Arellano-Aguilar, O. Volatile Organic Compounds in Air: Sources, Distribution, Exposure and Associated Illnesses in Children. Ann. Glob. Health 2018, 84, 225–238. [Google Scholar] [CrossRef] [PubMed]
  4. Tunga, S.; Sibel, M.; Rainer, M. Formaldehyde in the indoor environment. Chem. Rev. 2010, 110, 2536–2572. [Google Scholar]
  5. Jiménez-Garza, O.; Baccarelli, A.A.; Byun, H.; Márquez-Gamiño, S.; Barrón-Vivanco, B.S.; Albores, A. CYP2E1 epigenetic regulation in chronic, low-level toluene exposure: Relationship with oxidative stress and smoking habit. Toxicol. Appl. Pharmacol. 2015, 286, 207–215. [Google Scholar] [CrossRef]
  6. Li, X.; Li, Z. Safe or unsafe: Role of exposure time and interactions between volatile organic compounds in mixtures. Build. Environ. 2025, 27, 112619. [Google Scholar] [CrossRef]
  7. Wen, H.; Yuan, L.; Wei, C.; Zhao, Y.; Qian, Y.; Ma, P.; Ding, S.; Yang, X.; Wang, X. Effects of combined exposure to formaldehyde and benzene on immune cells in the blood and spleen in Balb/c mice. Environ. Toxicol. Pharmacol. 2016, 45, 265–273. [Google Scholar] [CrossRef]
  8. Wang, Y.; Bi, R.; Ge, J.; Xu, P. VOCs absorption using ionic liquids. Sep. Purif. Technol. 2025, 363, 132265. [Google Scholar] [CrossRef]
  9. Takeuchi, M.; Hidaka, M.; Anpo, M. Efficient removal of toluene and benzene in gas phase by the TiO2/Y-zeolite hybrid photocatalyst. J. Hazard. Mater. 2012, 237, 133–139. [Google Scholar] [CrossRef]
  10. Chang, T.; Wang, Y.; Wang, Y.; Zhao, Z.; Shen, Z.; Huang, Y.; Veerapandian, S.K.P.; De Geyter, N.; Wang, C.; Chen, Q.; et al. A critical review on plasma-catalytic removal of VOCs: Catalyst development, process parameters and synergetic reaction mechanism. Sci. Total environment 2022, 828, 154290. [Google Scholar] [CrossRef]
  11. Linley, S.; Thomson, N.R. Environmental Applications of Nanotechnology: Nano-enabled Remediation Processes in Water, Soil and Air Treatment. Water Air Soil Pollut. 2021, 232, 59. [Google Scholar] [CrossRef]
  12. Ahmadi, Y.; Bhardwaj, N.; Kim, K.H.; Kumar, S. Recent advances in photocatalytic removal of airborne pathogens in air. Sci. Total Environ. 2021, 794, 148477. [Google Scholar] [CrossRef] [PubMed]
  13. Wong, S.K.; Chew, L.S.N.; Low, M.; Tan, M.K. Plasma-Activated Water: Physicochemical Properties, Generation Techniques, and Applications. Processes 2023, 11, 2213. [Google Scholar] [CrossRef]
  14. Shen, J.; Zhang, H.; Xu, Z.; Zhang, Z.; Cheng, C.; Ni, G.; Lan, Y.; Meng, Y.; Xia, W.; Chu, P.K. Preferential Production of Reactive Species and Bactericidal Efficacy of Gas-liquid Plasma Discharge. Chem. Eng. J. 2019, 362, 402–412. [Google Scholar] [CrossRef]
  15. Nidheesh, V.P.; Boczkaj, G.; Ganiyu, O.S.; Oladipo, A.A.; Fedorov, K.; Xiao, R. Generation, properties, and applications of singlet oxygen for wastewater treatment: A review. Environ. Chem. Lett. 2024, 23, 195–240. [Google Scholar] [CrossRef]
  16. Xie, Z.-H.; He, C.-S.; Pei, D.-N.; Dong, Y.; Yang, S.-R.; Xiong, Z.; Zhou, P.; Pan, Z.-C.; Yao, G.; Lai, B. Review of characteristics, generation pathways and detection methods of singlet oxygen generated in advanced oxidation processes (AOPs). Chem. Eng. J. 2023, 468, 143778. [Google Scholar] [CrossRef]
  17. Kamal, S.M.; Razzak, A.S.; Hossain, M.M. Catalytic oxidation of volatile organic compounds (VOCs)—A review. Atmos. Environ. 2016, 140, 117–134. [Google Scholar] [CrossRef]
  18. Wang, S.; Wu, X.; Chen, X. Detailed mechanism study of volatile organic compound decomposition and oxidation removal based on a ReaxFF MD method. RSC Adv. 2024, 14, 5863–5874. [Google Scholar] [CrossRef]
  19. Zhao, R.; Wang, H.; Zhao, D.; Liu, R.; Liu, S.; Fu, J.; Zhang, Y.; Ding, H. Review on Catalytic Oxidation of VOCs at Ambient Temperature. Int. J. Mol. Sci. 2022, 23, 13739. [Google Scholar] [CrossRef]
  20. Dai, Z.; Li, D.; Ao, Z.; Wang, S.; An, T. Theoretical exploration of VOCs removal mechanism by carbon nanotubes through persulfate-based advanced oxidation processes: Adsorption and catalytic oxidation. J. Hazard. Mater. 2021, 405, 124684. [Google Scholar] [CrossRef]
  21. Hou, X.; Qi, L.; Li, W.; Zhao, J.; Liu, S. Theoretical study on water adsorption and dissociation on the nickel surfaces. J. Mol. Model. 2021, 27, 36. [Google Scholar] [CrossRef] [PubMed]
  22. Hou, X.; Qi, L.; Li, W.; Zhao, J.; Liu, S. Theoretical study on water behavior on the copper surfaces. J. Mol. Model. 2021, 27, 149. [Google Scholar] [CrossRef] [PubMed]
  23. Liu, X.; Zhang, W.; Peng, M.; Zhai, G.; Hu, L.; Mao, L. The role of S and Mo doping on the dissociation of water molecule on FeOCl surface: Experimental and theoretical analysis. Chem. Eng. J. 2021, 426, 131353. [Google Scholar] [CrossRef]
  24. Reese, J.A.; Gelin, S.; Maalouf, M.; Wadehra, N.; Schlom, D.; Dabo, I.; Suntivich, J. Tracking Water Dissociation on Well-Defined Ruthenium Oxide Surfaces. Electrochem. Soc. Meet. Abstr. 2024, MA2024-02, 3895. [Google Scholar] [CrossRef]
  25. Reese, J.A.; Gelin, S.; Maalouf, M.; Wadehra, N.; Zhang, L.; Hautier, G.; Schlom, D.G.; Dabo, I.; Suntivich, J. Tracking Water Dissociation on RuO2(110) Using Atomic Force Microscopy and First-Principles Simulations. J. Am. Chem. Soc. 2024, 146, 32080–32087. [Google Scholar] [CrossRef]
  26. Shirato, M.; Ikai, H.; Nakamura, K.; Hayashi, E.; Kanno, T.; Sasaki, K.; Kohno, M.; Niwano, Y. Synergistic effect of thermal energy on bactericidal action of photolysis of H2O2 in relation to acceleration of hydroxyl radical generation. Antimicrob. Agents chemotherapy 2012, 56, 295–301. [Google Scholar] [CrossRef]
  27. Wang, L.; Liu, S.; Meng, J.; Song, M.; Jiao, M.; Jiang, H.; Chen, Y. Electrocatalytic Lignin Valorization via Enhanced H2O2 Generation Using a MWNCT-Modified Gas Diffusion Electrode. ChemPlusChem 2025, 90, e202400769. [Google Scholar] [CrossRef]
  28. Rawal, S.H.; McKeea, W.C.; Xu, Y. Estimation of electric field effects on the adsorption of molecular superoxide species on Au based on density functional theory. Phys. Chem. Chem. Phys. 2017, 19, 32626–32635. [Google Scholar] [CrossRef]
  29. Chen, H.J.; Li, T.W.; Cai, Y.K.; Tu, H.-J.; Long, Z.-T.; Akhtar, S.; Liu, L.-D. Proton-coupled electron transfer controls peroxide activation initiated by a solid-water interface. Nat. Commun. 2025, 16, 3789. [Google Scholar] [CrossRef]
  30. Andrés, C.M.C.; de la Lastra, J.M.P.; Juan, C.A.; Plou, F.J.; Pérez-Lebeña, E. Superoxide Anion Chemistry—Its Role at the Core of the Innate Immunity. Int. J. Mol. Sci. 2023, 24, 1841. [Google Scholar] [CrossRef]
  31. Kiselev, M.V.; Kislyakov, M.I.; Burchinov, N.A. Generation of singlet oxygen on the surface of metal oxides. Opt. Spectrosc. 2016, 120, 520–528. [Google Scholar] [CrossRef]
  32. Safin, R.R.; Ershov, K.; Valiulin, S.; Pyryaeva, A. Singlet Oxygen Generation by Photoexcitation of Gold Nanoparticles. High Energy Chem. 2024, 57 (Suppl. S3), S464–S469. [Google Scholar] [CrossRef]
  33. Ershov, K.; Valiulin, S.; Pyryaeva, A. Singlet Oxygen Generaion via Silver Nanoparticles UV-Photoexcitation. Russ. J. Phys. Chem. B 2024, 18, 289–295. [Google Scholar] [CrossRef]
  34. Sha, N.; Xu, S.; Wan, B.; Zhao, K.-H. Light-oxygen-voltage (LOV) domain-derived photosensitizers with the highest quantum yield for superoxide anion or singlet oxygen. J. Photochem. Photobiol. A Chem. 2024, 452, 115591. [Google Scholar] [CrossRef]
  35. Zhang, C.; Ding, N.; Pan, Y.; Fu, L.; Zhang, Y. The degradation pathways of contaminants by reactive oxygen species generated in the Fenton/Fenton-like systems. Chin. Chem. Lett. 2024, 35, 109579. [Google Scholar] [CrossRef]
  36. Lew, M.M.; Rickly, S.P.; Bottorff, P.B.; Reidy, E.; Sklaveniti, S.; Léonardis, T.; Locoge, N.; Dusanter, S.; Kundu, S.; Wood, E.; et al. OH and HO2 radical chemistry in a midlatitude forest: Measurements and model comparisons. Atmos. Chem. Phys. 2020, 20, 9209–9230. [Google Scholar] [CrossRef]
  37. Wang, Z.; Berbille, A.; Feng, Y.; Li, S.; Zhu, L.; Tang, W.; Wang, Z.L. Contact-electro-catalysis for the degradation of organic pollutants using pristine dielectric powders. Nat. Commun. 2022, 13, 130. [Google Scholar] [CrossRef]
  38. Dan, W.; Le, Y. Effects of airflow rate and plant species on formaldehyde removal by active green walls. Environ. Sci. Pollut. Res. Int. 2022, 29, 88812–88822. [Google Scholar]
  39. Zhang, T.; Li, X.; Rao, Y.; Liu, Y.; Zhao, Q. Removal of formaldehyde in urban office building by the integration of ventilation and photocatalyst-coated window. Sustain. Cities Soc. 2020, 55, 102050. [Google Scholar] [CrossRef]
  40. Nikita, M.; Gordon, M.S. Stabilities and Energetics of Inorganic Benzene Isomers: Prismanes. J. Am. Chem. Soc. 1994, 116, 11407–11419. [Google Scholar]
  41. Swain, K.C.; Scheiner, S. Comparison of Various Theoretical Measures of Aromaticity within Monosubstituted Benzene. Molecules 2024, 29, 2260. [Google Scholar] [CrossRef] [PubMed]
  42. Wang, J.; Wang, S. Reactive species in advanced oxidation processes: Formation, identification and reaction mechanism. Chem. Eng. J. 2020, 401, 126158. [Google Scholar] [CrossRef]
Figure 1. Schematic diagram of the experimental gas handling system.
Processes 13 01959 g001
Figure 2. H01T19 nano-aqueous ion generator schematic.
Processes 13 01959 g002
Figure 3. Correlation between NWIT operation and formaldehyde degradation dynamics. Conversion formula: 1 mg/m3 = (22.4/M) × ppm × [(273 + T)/273] × (101,325/Ba), where M denotes molecular weight (g/mol), T is temperature (°C), and Ba is atmospheric pressure (Pa). Given our experimental conditions at standard atmospheric pressure (101,325 Pa) and 20 °C, the conversion formula for formaldehyde (HCHO, M = 30.03) becomes: 1 mg/m3= 0.81 ppm. Controlled laboratory environment: temperature maintained at 20 °C (±0.5 °C), relative humidity (RH) = (40 ± 8)%.
Processes 13 01959 g003
Figure 4. Correlation between NWIT operation and toluene degradation dynamics. Conversion formula: 1 mg/m3 = (22.4/M) × ppm × [(273 + T)/273] × (101,325/Ba), where M denotes molecular weight (g/mol), T is temperature (°C), and Ba is atmospheric pressure (Pa). Given our experimental conditions at standard atmospheric pressure (101,325 Pa) and 20 °C, the conversion formula for toluene (C7H8, M = 92.14) becomes: 1 mg/m3= 0.2653 ppm. Controlled laboratory environment: temperature maintained at 20 °C (±0.5 °C), relative humidity (RH) = (40 ± 8)%.
Processes 13 01959 g004
Figure 5. Temporal concentration profiles of formaldehyde under different flow rates. Controlled laboratory environment: temperature maintained at 20 °C (±0.5 °C), relative humidity (RH) = (40 ± 8)%.
Processes 13 01959 g005
Figure 6. Temporal concentration profiles of toluene under different flow rate. Controlled laboratory environment: temperature maintained at 20 °C (±0.5 °C), relative humidity (RH) = (40 ± 8)%.
Processes 13 01959 g006
Figure 7. Temporal concentration profiles of formaldehyde under different relative humidity. Controlled laboratory environment: temperature maintained at 20 °C (±0.5 °C), relative humidity (RH) = (40 ± 8)%.
Processes 13 01959 g007
Figure 8. Temporal concentration profiles of toluene under different relative humidity. Controlled laboratory environment: temperature maintained at 20 °C (±0.5 °C), relative humidity (RH) = (40 ± 8)%.
Processes 13 01959 g008
Figure 9. Formaldehyde concentration dynamics under aerobic/anaerobic conditions. Controlled laboratory environment: temperature maintained at 20 °C (±0.5 °C), relative humidity (RH) = (40 ± 8)%.
Processes 13 01959 g009
Figure 10. Temporal concentration profiles of toluene under four operating conditions. Controlled laboratory environment: temperature maintained at 20 °C (±0.5 °C), relative humidity (RH) = (40 ± 8)%.
Processes 13 01959 g010
Table 1. Purification efficiency experimental conditions.
Experimental VariablesParameter GradientTypes of VOCsDetection Indicators
Gas flow rate0.7/1.4/2.1 SLPM
(Standard Liters Per Minute)
FormaldehydeConcentration decay rate;
Model fitting goodness
Gas flow rate0.7/1.4/2.1 SLPMTolueneConcentration decay rate;
Model fitting goodness
Relative humidity40.1~58.0% RHFormaldehydeHumidity Efficiency Response Curve
Relative humidity17.9~26.1% RHTolueneHumidity Efficiency Response Curve
Table 2. Purification Mechanism Experimental Conditions.
Experiment GroupO2 ConditionH2O ConditionTypes of VOCsObjective Mechanistic Analysis
1AbsentPresent (Aqueous Solution)FormaldehydeTo verify the necessity of H2O for the generation of ROS
2PresentPresent (Aqueous Solution)FormaldehydeTo evaluate the synergistic effect of O2 and H2O on ROS, and to analyze the enhancement effect of dual factors on the total reactive oxygen concentration
3AbsentAbsent (Pure Toluene)TolueneTo verify the inhibitory effect of the absence of O2 and H2O on the generation of ROS
4AbsentPresent (Aqueous Solution)TolueneTo quantify the degradation efficiency of ROS under the sole action of H2O
5PresentAbsent (Pure Toluene)TolueneTo evaluate the degradation efficiency of ROS under the sole action of O2
6PresentPresent (Aqueous Solution)TolueneTo analyze the mechanism of the combined action of O2 and H2O on the degradation of ROS
Table 3. Flow-rate effects on model fitting for formaldehyde degradation.
Condition ParametersFitting ResultsModel IModel II
0.7 SLPMm (μg/min)12.6251——
r (m3/min)——9.93108 × 10−4
RSS2.834662.34754
COD0.926190.93661
1.4 SLPMm (μg/min)13.9769——
r (m3/min)——8.05983 × 10−4
RSS3.749353.46405
COD0.908760.91258
2.1 SLPMm (μg/min)2.89781——
r (m3/min)——1.34534 × 10−4
RSS0.6844480.683936
COD0.806910.79990
Table 4. Flow-rate effects on model fitting for toluene degradation.
Condition ParametersFitting ResultsModel IModel II
0.7 SLPMm (μg/min)72.2535——
r (m3/min)——6.73161 × 10−3
RSS0.315840.14735
COD0.781130.89004
1.4 SLPMm (μg/min)28.1592——
r (m3/min)——2.39838 × 10−3
RSS0.039340.02015
COD0.967770.98222
2.1 SLPMm (μg/min)17.8185——
r (m3/min)——1.29153 × 10−3
RSS0.011650.00728
COD0.987630.99168
Table 5. Model II fitting results for formaldehyde under different relative humidity.
Relative Humidityr (m3/min)Purification Efficiency S
(Mean ± Variance)
40.1% RH3.305877 × 10−3(3.444081 × 10⁻³ ± 8.25172 × 10⁻⁹) × C(t)
48.7% RH3.435519 × 10−3
53.8% RH3.478326 × 10−3
58.0% RH3.556600 × 10−3
Table 6. Model II fitting results for toluene under different relative humidity.
Relative Humidityr (m3/min)Purification Efficiency S
(Mean ± Variance)
17.9% RH5.630876 × 10−3(5.895664 × 10⁻³ ± 5.71536 × 10⁻⁸) × C(t)
19.6% RH5.780087 × 10−3
22.7% RH5.895053 × 10−3
26.1% RH6.276641 × 10−3
Table 7. Model II fitting results of formaldehyde under aerobic/anaerobic conditions.
Condition Parametersr (m3/min)Purification Efficiency S
(Mean ± Variance)
N2 + Aqueous Formaldehyde3.69981 × 10−5(1.05947 × 10⁻⁴ ± 4.75389 × 10⁻⁹) × C(t)
Air + Aqueous Formaldehyde1.74895 × 10−4
Table 8. Model II fitting results of toluene under four operating conditions.
Condition Parametersr (m3/min)Purification Efficiency S
(Mean ± Variance)
N2 + Pure Toluene1.570383 × 10−3(5.291789 × 10⁻³ ± 5.69704 × 10⁻⁶) × C(t)
N2 + Aqueous Toluene5.490227 × 10−3
Air + Pure Toluene5.892607 × 10−3
Air + Aqueous Toluene8.213937 × 10−3
Disclaimer/Publisher’s Note: The statements, opinions and data contained in all publications are solely those of the individual author(s) and contributor(s) and not of MDPI and/or the editor(s). MDPI and/or the editor(s) disclaim responsibility for any injury to people or property resulting from any ideas, methods, instructions or products referred to in the content.

