Article

Power Supply Resilience Under Typhoon Disasters: A Recovery Strategy Considering the Coordinated Dispatchable Potential of Electric Vehicles and Mobile Energy Storage

1
State Key Laboratory of Power Transmission Equipment Technology, Chongqing University, Chongqing 400044, China
2
Chongqing Huizhi Energy Co., Ltd., Chongqing 400044, China
*
Author to whom correspondence should be addressed.
Processes 2025, 13(6), 1638; https://doi.org/10.3390/pr13061638
Submission received: 28 March 2025 / Revised: 12 May 2025 / Accepted: 14 May 2025 / Published: 23 May 2025

Abstract

:
In recent years, extreme natural disasters, such as typhoons, have become increasingly frequent, leading to persistent power outages in urban distribution grids. These outages pose significant challenges to the stability of urban power supply systems. With the growing number of electric vehicle (EV) users and the expanding EV industry, and considering the potential of EVs as flexible load storage resources, this paper proposes a post-disaster power supply restoration strategy that takes into account the potential of coordinated scheduling of EVs and mobile energy storage. First, a compression method based on the Minkowski addition is proposed for the EV cluster model in charging stations, which establishes an EV dispatchable model. Second, the spatiotemporal matrix of failure rates for distribution network elements is calculated using the Batts wind field model, enabling the generation of distribution network failure scenarios under typhoon conditions. Finally, the power supply restoration strategy of multi-source coordination with the participation of EV cluster and mobile storage is formulated with the objective of minimizing the loss of the distribution network side. Simulation results demonstrate that the proposed strategy effectively utilizes the load storage potential of EVs and mobile energy storage, enhances recovery performance, ensures cost-effectiveness, and explicitly solves the islanding operation stability problem.

1. Introduction

In recent years, the frequency and intensity of extreme weather events have increased due to climate change, leading to the frequent occurrence of large-scale power outages, which have resulted in significant economic losses and social disruptions. Extreme events, such as the powerful typhoon in Japan in 2023, the storms in California in 2023, the heatwave in Europe in 2021, and the extreme cold snap in Texas, USA, in 2021, have all caused severe disruptions to power supply systems [1]. The increasing frequency of large-scale power outages not only disrupts residential and commercial activities, leading to substantial economic losses, but also triggers public panic. To mitigate the impacts of large-scale power outages, researchers have started to investigate the restoration process of distribution networks during extreme weather events [2].
“Resilience” refers to the ability of a system to resist damage and quickly return to normal operation after being subjected to an external shock or disturbance [2,3,4]. Distribution grid resilience generally refers to the resistance and resilience under extreme events such as natural disasters, equipment failures, and cyber attacks. In traditional studies, distribution network resilience enhancement mainly relies on fixed distributed energy and network reconfiguration technologies [5,6]. The literature [7] presents a model for various types of fixed resources to support the post-disaster recovery of distribution networks. The literature [8] provides fault recovery through islanding and network reconfiguration, which can improve the reliability of the power supply. The literature [9] introduces an adaptive islanding algorithm designed to mitigate the cascading effects that may occur in the grid during extreme weather events. The literature [10] proposes a deep reinforcement learning model to optimize a dispatch plan for distributed energy resources, maximizing load restoration while minimizing operational costs. Fixed-location energy storage or distributed generators (e.g., battery stations, diesel generators) cannot dynamically adapt to fault location changes, resulting in low resource utilization during localized failures. Frequent reconfiguration accelerates switchgear aging, raising long-term maintenance costs. That is why it is urgent to develop more flexible schedulable resources.
With the popularity and application of mobile energy storage (MES) and other mobile resources [11], MES as an important flexible power supply resource with spatial and temporal transfer characteristics for energy has received wide attention [12]. The literature [13] proposes a novel power distribution system restoration mechanism for flexible system response and restoration in the face of the consequences of high-impact low-probability (HILP) events [14]. However, in the available studies, MES has the disadvantages of high cost, discontinuous scheduling time, limited battery capacity, and few strategies that consider adding other resources to it for collaborative recovery, so it can be considered that user-side resources, such as self-provisioned emergency resources, and EVs can be considered to participate in the system scheduling process together.
The potential of EVs as a mobile energy storage resource for disaster response is gradually being explored [15,16,17]. In the literature [18], a spatiotemporal scheduling model for EVs is established based on the transport network, and a multi-temporal coordinated load restoration strategy including distributed generators and EV charging stations is proposed. The literature [19] proposes a distribution system restoration strategy that utilizes electric vehicles and an electric vehicle-oriented incentive mechanism to motivate electric vehicles to participate in power supply restoration. Based on the consideration of EV participation in power supply restoration, the literature [20] proposes an integrated coordination scheme covering service restoration, personnel scheduling, EV scheduling, and distributed energy resources (DERs). From the above literature, it is evident that the integration of electric vehicles (EVs) can significantly enhance the recovery capabilities of distribution networks and collaborate with other distributed resources to meet customer demand. However, in the existing studies on EV participation in post-disaster power supply restoration strategies, the focus on discharging behavior is primarily on individual vehicles, while the spatial distribution of EVs remains challenging to estimate accurately. Moreover, these studies do not fully address the scheduling needs of large-scale EV deployment. Therefore, it is essential to cluster EVs to analyze their charging and discharging decisions from a holistic perspective.
In summary, this paper investigates power supply restoration strategies for distribution network failure scenarios caused by typhoon events, considering the dispatchable potential of EVs and MES. The research is primarily focused on the following three aspects: ① A compression method for the EV cluster model in charging stations is proposed, based on the Minkowski addition method, to establish a dispatchable EV cluster model, thereby improving computational efficiency. ② The failure rate spatiotemporal matrix of distribution network elements is calculated using the Batts wind field model to accurately simulate distribution network failures under typhoon disaster scenarios. ③ The role of mobile energy storage systems (MESs) and EV scheduling in power supply restoration and enhancing the resilience of the distribution network is analyzed and evaluated based on the simulation results.

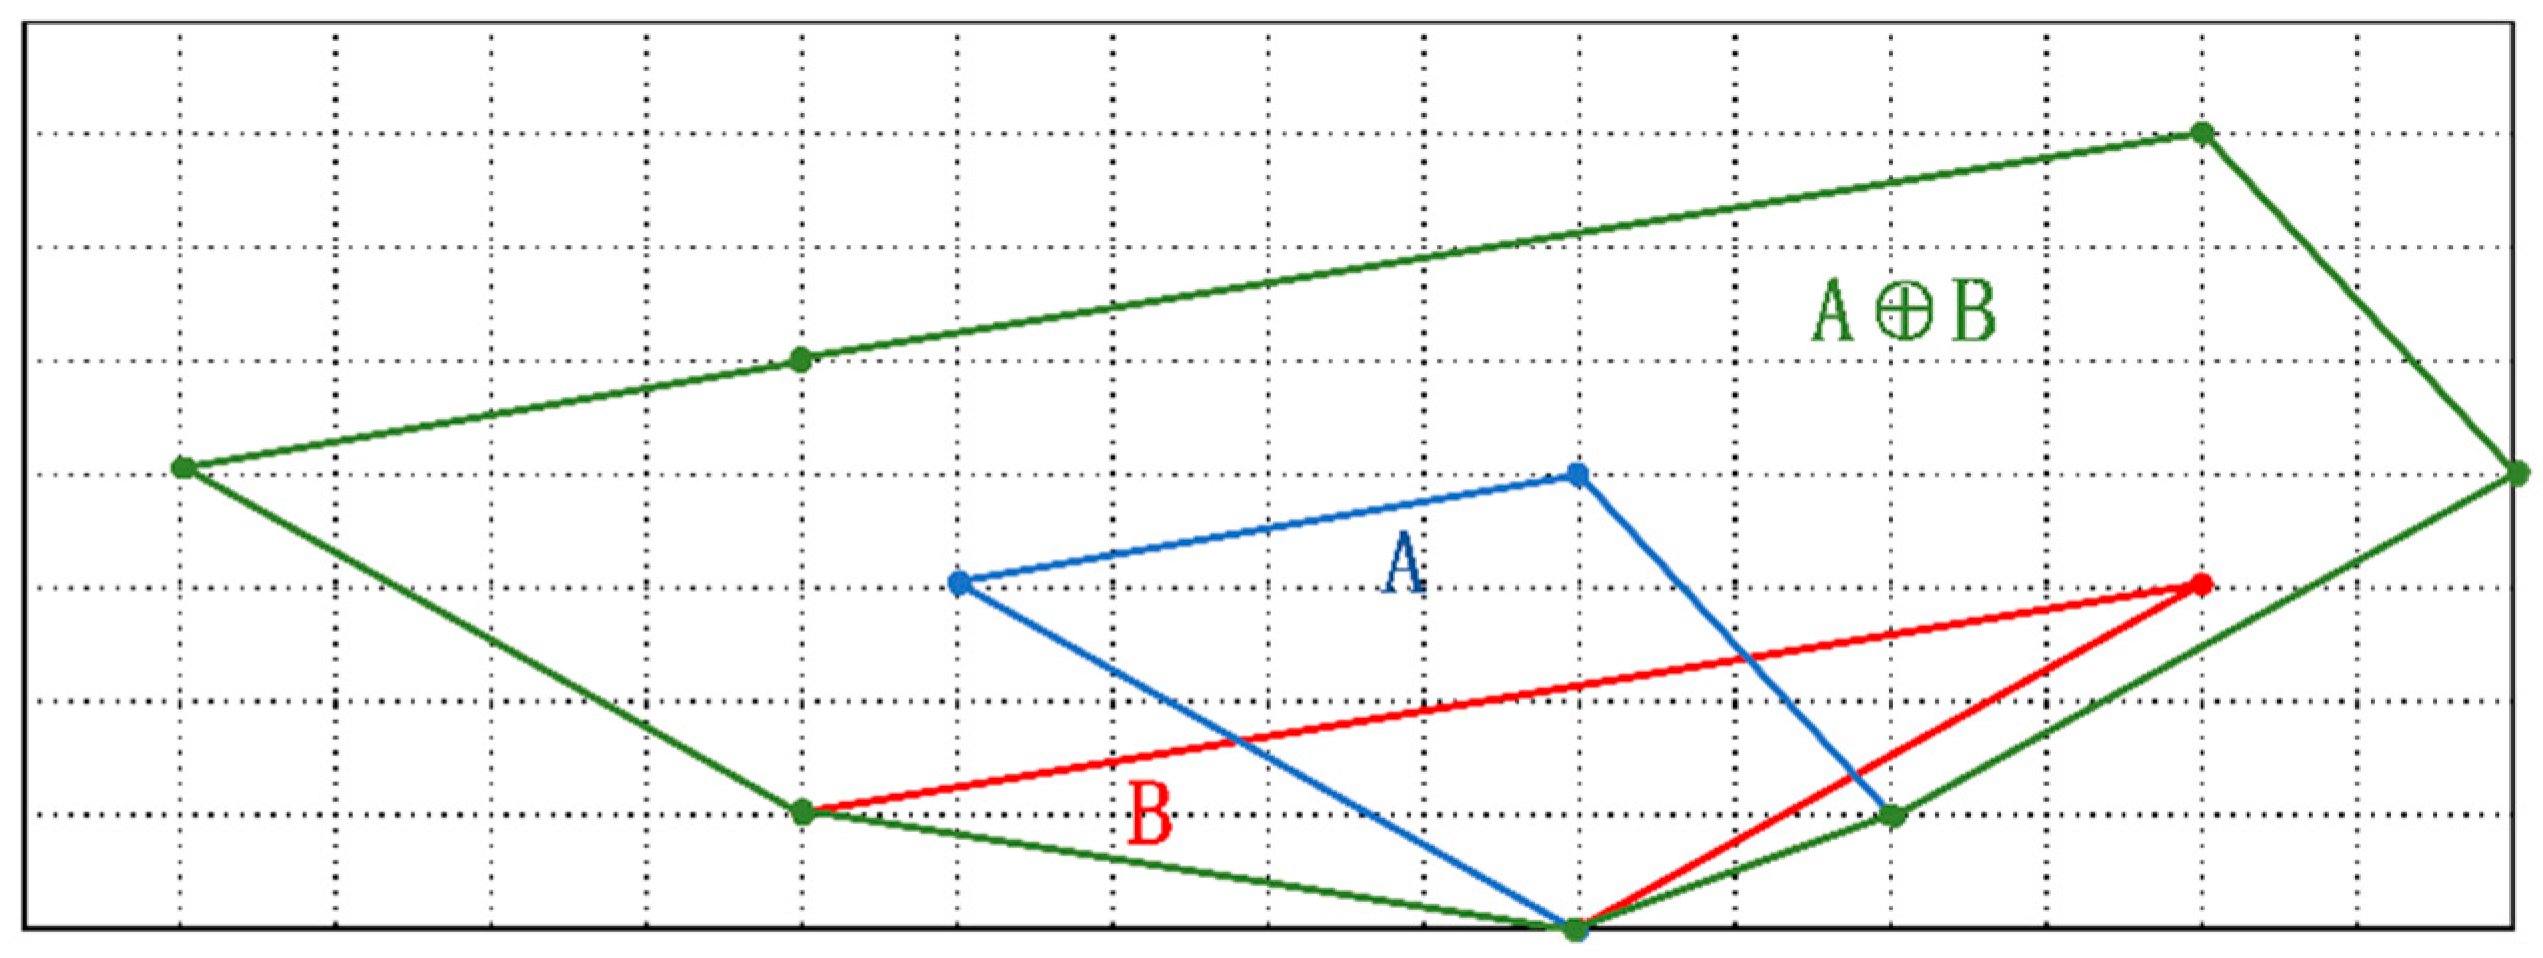
2. EV Dispatchable Potential Based on Minkowski Summation and Data-Driven Approaches

2.1. EV Individual Modeling

Typically, the charging modes of EVs can be classified into fast-charging and slow-charging modes [21], EVs in fast charging mode will be charged at maximum power, and their charging loads are uncontrollable, so this paper subsumes them to regular base loads; however, EVs in slow charging mode have the ability of load leveling and reverse power supply. The battery losses of EVs have complex expressions that often lead to highly non-linear models. In order to consider the cost of EV discharge loss, this paper introduces a discharge compensation factor [22], which aims to consider the impact of battery loss on V2G decision-making in a statistical sense. Considering the EV individual battery capacity and safety boundaries, the charging and discharging mathematical models are shown in Equations (1)–(4).
0 p n , t ch p max , n ch , t T n EV ,
0 p n , t dis p max , n dis , t T n EV ,
s n , t = s n , t 1 + η ch p n , t ch Δ t η ref p n , t dis Δ t η dis , t T n EV ,
s n min s n , t s n max , t T n EV ,
where p n , t ch and p n , t dis denote the charging and discharging scheduling power of EVs in time period t, p max , n dis and p max , n ch denote the upper limit of charging and discharging power of EVs, T n EV denotes the set of grid-connected time of EVs, s n , t and s n , t 1 denote the battery energy of EVs at time period t and its upper time period, η ch and η dis denote the charging and discharging efficiencies, Δt denotes the scheduling time window, and η ref denotes the discharge compensation coefficient, which is determined by the discharge loss; it is used to compensate for deviations in nominal discharge efficiency ( η dis ) in actual operation, including aging and thermal effects. The value refers to the manufacturer’s cyclic test data, which are generally 0.98. s n min and s n max denote the battery power safety boundaries of EVs.

2.2. Generalized Energy Storage Models

From the previous section, it is evident that the charging station must aggregate the decision spaces of individual electric vehicles (EVs) to participate in power optimization scheduling as a collective entity. The Minkowski sum is a common operation in geometry, primarily used for the combination and analysis of convex sets [23].
For two sets A and B in the plane, Minkowski summation adds each point in set A to each point in set B to form a new set. As shown in Figure 1, in simple terms, it combines all points from one set with all points from the other set in space to generate a new set of points, as shown in Equation (5):
A B = a + b | a A , b B ,
where A and B denote two variable spaces; a and b are elements of them; and AB denotes their Minkowski sum.
The premise of Minkowski’s summation is that the two variable spaces have the same definition domain; in order to achieve the definition domain extension of the charging station individual, the state variable Xn,t is firstly induced to characterize the grid-connected state of the EV, and the Xn,t is able to be computed directly from the EV’s stopping time, as shown in Equation (6).
X n , t = 0 , t T n a r r i v a l , T n l e a v e 1 , t T n a r r i v a l , T n l e a v e ,
where X n , t denotes the state of EV n at time period t, X n , t = 1 denotes that EVn is in a grid-connected state at time period t, T n a r r i v a l is the time period when vehicle n arrives at the charging station, and T n l e a v e denotes the time period when EVn leaves the charging station.
Further, Equations (1)–(4) are extended from the definition domain T n E V to the full scheduling period T, as shown in Equations (7)–(10).
0 p n , t ch p max , n ch X n , t , n N j EV , t T ,
0 p n , t dis p max , n dis X n , t , n N j EV , t T ,
s n , t = X n , t s n , t 1 + η ch p n , t ch Δ t η ref p n , t dis Δ t η dis , n N j EV , t T ,
s n min X n , t s n , t s n max X n , t , n N j EV , t T ,
Among them, Equations (7) and (8) have Minkowski additivity, while Equation (9) needs to consider three scenarios: grid entry time, normal grid connection time, and off-grid time. It models the aggregated virtual storage capacity of the EV cluster, representing the available energy reserves for restoration, rather than the physical dynamics of individual batteries. As shown in Equation (11),
s n , t = s n ,   arival + η ch p n , t ch Δ t η ref   p n , t dis Δ t η dis , n N j EV , t = T n arival   s n , t = s n , t 1 + η ch   p n , t ch   Δ t η ref p n , t dis   Δ t η dis   , n N j EV , t T n arival , T n leave s n , t = s n , t 1 s n ,   leave   , n N j EV , t = T n leave   + Δ t ,
where s n , arival denotes the initial charge of the EVn. s n , leave donate the charge level that the user desires when leaving the charging station, i.e., the desired state of charge at departure. When the EV leaves the charging station, its counterpart defaults to zero. When t = T n arival , its state is equivalent to X n , t X n , t X n , t 1 = 1 ; when t = T n leave + Δ t , its state is equivalent to X n , t 1 X n , t 1 X n , t = 1 . Therefore, Equation (11) can be further integrated into Equation (12), which has Minkowski additivity.
s n , t = s n , t 1 + s n , arrival X n , t X n , t X n , t 1 s n , leave X n , t 1 X n , t 1 X n , t + η ch   p n , t ch   Δ t η ref   p n , t dis .   Δ t η dis   , n N j EV , t T ,
Further defining the variables of the generalized energy storage device at the charging station and performing Minkowski summation, the generalized energy storage can be modeled as in Equation (13)
0 P j , t ch   P j , t ch ,   max   t T 0 P j , t dis   P j , t dis .   max t T S j , t = S j , t 1 + Δ S j , t + η ch   P j , t ch   Δ t η ref   P j , t dis   Δ t η dis   t T S j , t min S j , t S j , t max t T ,
where P j , t ch ,   max   and P j , t dis .   max denote the maximum charging and discharging dispatching power of the broad energy storage equipment of charging station j in time period t, respectively; P j , t ch   and P j , t dis   are the total charging and discharging power of charging station j in time period t, respectively; and S j , t denotes the power quantity of charging station j in time period t. Δ S j , t is the power change in charging station j’s generalized energy storage device in time period t due to the change in EV grid-connected status.
Using Minkowski summation to project the variable space of individual EVs into a hypercube space while preserving the constraint relationships between the variables, its compression of the EV set into a generalized energy storage device greatly reduces the dimensionality of the model. The hypercube space contains all feasible charging and discharging decisions of the charging station, while the parameter P j , t ch .   max , P j , t dis .   max , Δ S j , t , S j , t min , S j , t max of the generalized energy storage device is the dispatchable potential of the EV cluster.

3. Overhead Line Fault Rate Model Based on Typhoon Disaster Process

3.1. Typhoon Impact Mechanisms

Given the relatively small scale of the distribution network, the impact of the typhoon wind field on this regional network is confined to a limited duration, during which the typhoon intensity is assumed to remain constant. The velocity of the atmospheric flow is determined by the air pressure difference. Under the assumption that the typhoon wind field exhibits an approximately symmetric circular structure, the Batts gradient wind model is employed to characterize the maximum gradient wind speed, which is derived from the air pressure distribution between the typhoon center and its periphery [24], as in Equation (14) and Figure 2.
v g x = K Δ P R max f 2 ,
where v g x is the maximum gradient of the typhoon wind speed, R max is the radius of the maximum wind speed of the typhoon; K is a constant, taken as 6.72; ΔP is the maximum atmospheric pressure difference at the center of the typhoon; and f is the coefficient of rotation of the earth.
According to the wind field model approximation, the maximum gradient wind speed at 10 m above sea level is given by Equation (15). The wind speed at r from the typhoon center is shown in Equation (16):
V max , 10 = 0.865 V gx + 0.5 v t
V = V 1 = V R max r / R max , r < R max V 2 = V R max R max / l β , r R max ,
where V R max is the average maximum wind speed in the typhoon wind circle at a height of 10 m above sea level; V 1 and V 2 are the wind speeds inside and outside the maximum wind speed radius, respectively. v t denotes the propagation velocity of the typhoon system; v z is the average wind speed at any point at sea level at a height of 10 m and a distance of r from the typhoon; and r is the distance from the study point to the center of the typhoon.
When a typhoon arrives on land, the location of the ground facilities and the terrain they are situated in will have an impact on its wind speed. For this reason, a terrain correction factor is introduced to correct the offshore typhoon model to ensure that it reflects the actual situation on land, as shown in Equation (17) [25].
V l a n d = 1 0.2 ln 10 z V Z ,
where V l a n d is the average wind speed at any point in the corrected land typhoon wind field; z is the degree of ground roughness, which is taken as 1 in this paper according to the classification criteria.
The trajectory of the typhoon can be derived from the pre-disaster weather forecast. It is assumed that the typhoon maintains a constant angle of movement and speed during its intrusion into the distribution network. The impact of the typhoon’s intrusion on the distribution network can be characterized using the simulation circle method (circular sub-region method, CSM) [26]. The specific steps are as follows: (1) A coordinate system is established with the initial position of the typhoon center as the origin and the initial direction of movement as the horizontal axis, where the distribution network is located within the geographic-level grid division of the region. (2) A simulation circle is constructed with the target distribution network as the center and R as the radius. (3) If the typhoon trajectory intersects the simulation circle, it is concluded that the typhoon affects the distribution network. As illustrated in Figure 3, a radius of R = 250 km is adopted in this study.

3.2. Generation of Fault Scenarios for Distribution Network Line Towers Under Typhoon Conditions

Based on the wind direction and speed of the simulated typhoon, the failure probability of conductors and poles due to wind-induced loads is estimated. The overhead conductor is most susceptible to fracture at its highest suspension point, as the stress on the conductor is directly proportional to the combined wind and gravitational loads. Simultaneously, the loads acting on the pole generate the maximum bending moment at its base, resulting from the vector sum of the pole’s self-weight and the wind loads exerted on the suspended conductor.
The wind load calculation formula for overhead wires and towers is shown in (18) [27].
N w = α μ z μ S C D l H ( sin θ ) 2 V land 2 1600 , N s = β μ z μ S   A V land 2 1600 ,
where N w for the role of the wind load on the overhead line; D for the role of the point of the outer diameter of the overhead line; θ for the angle between the overhead line and the wind direction; α for the uneven coefficient of wind pressure on the overhead line; μ S C for the body shape factor of the overhead line; l H for the horizontal pitch of the overhead line; N s for the role of the wind load on the poles; β for wind vibration coefficients; μ S for the wind load coefficient of the body shape factor; A for the wind surface of the pole structural components of the projected area.
Tensile Strength of Conductors and Flexural Strength of Poles obeying the normal distribution, the failure rates of conductors and poles are Equations (19) and (20), respectively, due to the fact that the failure rates of different originals are independent of each other. The final failure rate of the distribution line is (21)
λ line   = 0 σ 0 1 2 π δ 1 exp 1 2 σ 1 μ 1 δ 1 2 d σ i ,
λ lower   = 0 M T 1 2 π δ p exp 1 2 M p μ p δ p 2 d M p ,
λ 1 = 1 m = 1 M 1 1 λ 1 , m lower   m = 1 M 2 1 λ 1 , m lime   ,
where λ line   is the failure rate of overhead conductor; μ 1 is the mean value of overhead conductor strength; δ 1 is the standard deviation of overhead conductor strength; λ lower   is the failure rate of poles; μ p is the mean value of flexural strength of pole elements; δ p is the standard deviation of flexural strength of pole elements; M p is the bending moment of poles; λ 1 is the failure rate of distribution line l; M 1 is the number of poles in distribution line l; M 2 is the number of conductors in distribution line l; λ 1 , m lower   is the failure rate of the m-th pole in distribution line l; λ 1 , m lime   is the failure rate of the m-th conductor of distribution line l.
The spatiotemporal failure rate calculation process for distribution lines is as follows: (1) Using wind field location data and wind speed data during the typhoon, calculate the angle θ between the center point of any line l in the gridded distribution network at time t and the corrected land-average wind speed. (2) Using the wind speed and other parameters, compute the wind load on the conductors and poles. Subsequently, determine the cross-sectional stress of the conductors and the bending moments at the pole roots. Finally, calculate the component failure rates based on the probability density functions of tensile and flexural strengths. (3) Based on the spatiotemporal failure rate matrix, discrete scenarios and their probabilities can be generated using the Monte Carlo simulation method.

4. Strategies for Multi-Source Collaborative Restoration of Distribution Networks

4.1. Objective Function

This study proposes a coordinated optimal dispatch model for post-disaster power supply restoration, aiming to minimize the total cost of load curtailments following a typhoon disaster. The model determines the on/off status of distribution network branches, the spatiotemporal transfer of the Mobile Energy Storage System (MESS) within the energy dispatch scheme, and the power exchange magnitude between the electric vehicle station (EVS) and the distribution network. The objective function of the proposed model is formulated as follows:
min t = 1 T j N c j 1 α j , t P j , t D Δ T ,
where N is the set of all nodes; c j is cost coefficient of load curtailment at node j, reflecting grid reliability priorities; α j , t is the 0–1 variable of whether the load is restored at node j at time t, a value of 1 means load restoration, and vice versa is 0; P j , t D is the demand load during time interval at node j at time t.

4.2. Constraints

4.2.1. Constraints for Scheduling Mobile Energy Storage Systems

Typhoon weather has a large impact on the real-time road conditions of the transport network, and the time for mobile storage energy to pass between nodes changes with the impact of the disaster and traffic flow at different times of the disaster. Considering the impact of disaster weather on road traffic conditions, the fusion coefficient is used to correct the spatial correspondence between the speed and distance of mobile storage energy moving between nodes. The traveling time of mobile storage energy i from node r to r is T m , r , r ME ( t ) , and the distance between nodes and the speed of the vehicle in the disaster scenario are v m ME ( t )
T m , r , r ME ( t ) = S r , r ( t ) v m ME ( t ) ,
S r , r ( t ) = S r , r , 0 1 + β v r e f v m ME ( t ) ,
v i ME ( t ) = v i , 0 e 1.7 c ,
where S r , r , 0 is the actual distance between nodes, v i , 0 is the mobile storage energy movement speed without considering the traffic condition; c is the congestion coefficient of the traffic network in the disaster scenario, which is related to the time and path of the typhoon transit. c is obtained based on historical traffic data with grid blockage records. β is used to quantify the nonlinear distance adjustment required due to road conditions based on historical traffic data calibration (typical values range from 0.1 ≤ β ≤ 0.5); v r e f (baseline speed) represents the baseline travel speed under ideal conditions (e.g., no congested roads).
After receiving the scheduling instruction, the mobile energy storage chooses the shortest traveling time from r to the destination r for charging and discharging, considering the traffic condition, and completes the spatiotemporal transfer of energy. The connection state and charging/discharging power of the mobile energy storage with the node need to satisfy the following constraints, and Equation (26) ensures that mobile energy storage systems are located at pre-deployed positions at the time of disaster occurrence. Equation (27) ensures physical movement time constraints for mobile energy storage devices to avoid conflicting scheduling. Equation (28) ensures that each mobile energy storage device can only have one moving target at the same time:
m N MES σ m , r , t 0 ME = σ r , 0 ME ,
σ m , r , t ME + σ m , r , t + Δ t ME 1 Δ t < T i , r , r ME ( t ) + T 0 ME ,
r N σ i , r , t ME 1
0 P m , t Mch θ m , t Mch P m , max Mch ,
0 P m , t Mdch θ m , t Mdch P m , max Mdch
0 Q m , t Mch θ m , t Mch Q m , max Mch ,
0 Q m , t Mdch θ m , t Mdch Q m , max Mdch ,
S m , t + Δ t ME = S m , t ME + P m , t Mch η m Mch Δ t P m , t Mdch η m Mdch Δ t ,
S m , min M E S m , t M E S m , max M E
where t 0 is the moment when the scheduling command is issued; σ i , r , t ME is the connection state of mobile storage energy m and node r; θ m , t Mch / θ m , t Mdch is a 0–1 variable indicating whether the mobile storage energy is charging/discharging or not; P m , t Mch / P m , t Mdch is the charging/discharging active power of the mobile storage energy; Q m , t Mch / Q m , t Mdch is the charging/discharging reactive power of the mobile storage energy; η m Mch / η m Mdch is the charging and discharging efficiencies of the mobile storage energy, respectively; S m , min ME and S m , max ME is the upper limit and the lower limit of the storage capacity of the mobile storage energy, respectively.

4.2.2. Radiality Constraints in Distribution Networks

Considering the case of island fusion and no power islanding, the improved single commodity flow method is used to ensure that the distribution network meets the radial topology requirements during the restoration process, and the number of islands after network reconfiguration is added to the optimization process through the introduction of the virtual source node flag 0–1 variable, and the big-M method is used to slacken the virtual power flow, which is expressed as follows:
j k B α j k = N L j N ε j VS ,
k δ ( j ) F j k i γ ( j ) F i j = F i vs 1 ,
M 1 ε j vs F i vs M 1 ε j VS ,
M 1 ω j k F j k M 1 ω j k ,
where B is the set of branches; N is the set of nodes; δ(j), γ(j) are the set of child and parent nodes of node i; F i j is the virtual power flow of the branch; F i vs is the virtual power emitted by the node, Virtual Source Nodes (VSNs) are abstract nodes that perform aggregated computation on distributed resources while maintaining the radial structure of the network; M 1 is the number of extremely large; ε j VS is the decision variable that indicates whether or not the nth DG serves as the root node of the silo in which it is located; and ω j k is the decision variable that indicates the connectivity status of the branch jk at time t.

4.2.3. Distribution Network Operational Constraints

Disflow current constraints are used to describe the AC currents in the distribution network, and second-order cone relaxation is used to transform the model into a mixed-integer second-order cone-planning model. Also, since the distribution network topology and the number of islands formed vary with the switching state of the transmission branches, the Big-M method is used to relax the branch power as well as the voltage equations. Equation (41) utilizes the Disflow formulation to represent the branch power flow constraints. The detailed constraints are expressed as follows:
i γ ( j ) P i j , t I i j , t r i j + P w , t DG + m N MES P m , r , t M d c h + P n , t EV = h δ ( j ) P j h , t + m N Mes P m , r , t M c h + α j , t P j , t D
i γ ( j ) Q i j , t I i j , t x i j + Q w , t DSG + m N MES Q m , r , t M d c h + Q n , t EV = h δ ( j ) Q j h , t + m N MIS   Q m , r , t M c h + α j , t Q j , t D
M 1 ω i j , t V i , t V j , t 2 r i j P i j , t + x i j Q i j , t + r i j 2 + x i j 2 I i j , t M 1 ω i j , t x i j
V j , t I i j , t P i j , t 2 + Q i j , t 2 ,
V j min 2 V j , t V j max 2 ,
ω i j , t P i j , min P i j , t ω i j , t P i j , max ,
ω i j , t Q i j , max Q i j , t ω i j , t Q i j , max ,
t = 1 T ω i j , l + 1 ω i j , j N i j max ,
α j , t α j , t + 1 ,
0 P w , t DG P w ,   max   DG ,
0 Q w , t DG Q w ,   max   DG ,
where P i j , t and Q i j , t are the active and reactive power transmitted by the branch ij in time period t, respectively; V j , t and I i j , t are the square of the current amplitude flowing through the branch ij and the square of the voltage amplitude at node j in time period t, respectively; r i j and x i j are the equivalent resistance and impedance of the branch ij, respectively; P w , t DG is the reactive power emitted from the DG in time period t; P j , t D and Q j , t D are the reactive power demand of the loads at node j in time period t; V j min and V j max are the lower and upper bounds of the squared voltage amplitude at node j, respectively; P i j , min and P i j , max are the lower and upper limits of active power of branch ij; N i j max is the upper limit of the number of switching operations of branch ij; P w , max DG and Q w , max DG are the upper limits of active and reactive power output of the DG, respectively.

5. Example Analyses

5.1. Arithmetic Examples and Their Parameterization

The algorithm is simulated and analyzed using a modified IEEE 33-node test system. The topology of the transportation network is identical to that of the power grid, which is meshed, with a distance of 2 km between electrical nodes. The network topology impacted by the typhoon is illustrated in Figure 3. Typhoon parameters are taken from the Japan Meteorological Agency Typhoon Database. The design wind speed for the distribution lines is 25 m/s. The typhoon is assumed to make landfall at coordinates (−125 km, −150 km), moving at a speed of 20 km/h at a 30° angle to the horizontal axis. The central pressure of the typhoon is 995 hPa, with its center located at 23° N latitude and a maximum wind radius of 80.96 km [25].
The system is configured with five photovoltaic power stations, five diesel generators, four EV charging stations, and two mobile energy storage; the load levels of the nodes are shown in Table 1. Three types of EVs were modeled based on arrival/departure time patterns in Table 2. Table 3 lists the uniformly distributed sampling ranges for the number of three types of EVs (Type-A/B/C) at each charging station. Critical load (CL) is defined as demand whose interruption would endanger life or cause major economic disruption. Non-critical loads (NCLs) tolerate temporary curtailment. Load-shedding costs are derived with reference to regional electricity market prices. The load-shedding costs for critical and non-critical loads are USD 10/kW and USD 1/kW, respectively, and the parameters of the distributed power sources are shown in Table 4.
Assuming that the charging and discharging efficiency of the grid-connected EV is 95%, its maximum charging and discharging power is 6.6 kW, the battery capacity is 32 kWh, and the access locations of the EV charging stations are 5, 12, 21, and 23, respectively. EV and charging station sampling data were obtained from the NHTS (National Household Travel Survey), 2022, for 1200 live vehicle trips. The data of the individual grid-connected EVs are generated by repeated sampling 1000 times according to its setup parameter, and the generalized energy storage dispatchable potential is obtained from the EV cluster model as shown in Figure 4.

5.2. Considering the Time-Varying Failure Rate of Distribution Lines Under the Influence of Typhoons

The Batts wind field model is used to calculate the wind field information, and on this basis, the relationship between each component of the distribution network and the failure rate is deduced. When the wind speed is greater than 120 km/h, the failure rate of the conductors and towers will increase significantly. As the typhoon approaches, the wind speed on the line gradually increases. Finally, the time-varying failure rate of the distribution line is calculated, and the maximum value of each line during the typhoon is taken as shown in Table 5. The track of the typhoon is shown in Figure 5.
Two hundred typhoon scenarios are randomly selected, and scenario clustering is applied to the chosen fault scenarios. The selected scenarios are clustered and reduced, followed by a comparison of their post-disaster power supply restoration assessment metrics. Finally, one scenario from the generated set is selected as an illustrative example.

5.3. Power Supply Restoration Strategy and Result Analysis

In order to verify the effectiveness of the post-disaster power supply restoration scheme strategy proposed in this paper for distribution networks, three comparison schemes are set up for comparative analysis.
Scheme 1: Consider only distribution network reconfiguration;
Scheme 2: Restoration of power supply based on reconfiguration of the distribution network using only mobile energy storage;
Scheme 3: Simultaneous use of mobile energy storage and V2G for restoration based on distribution grid reconfiguration.

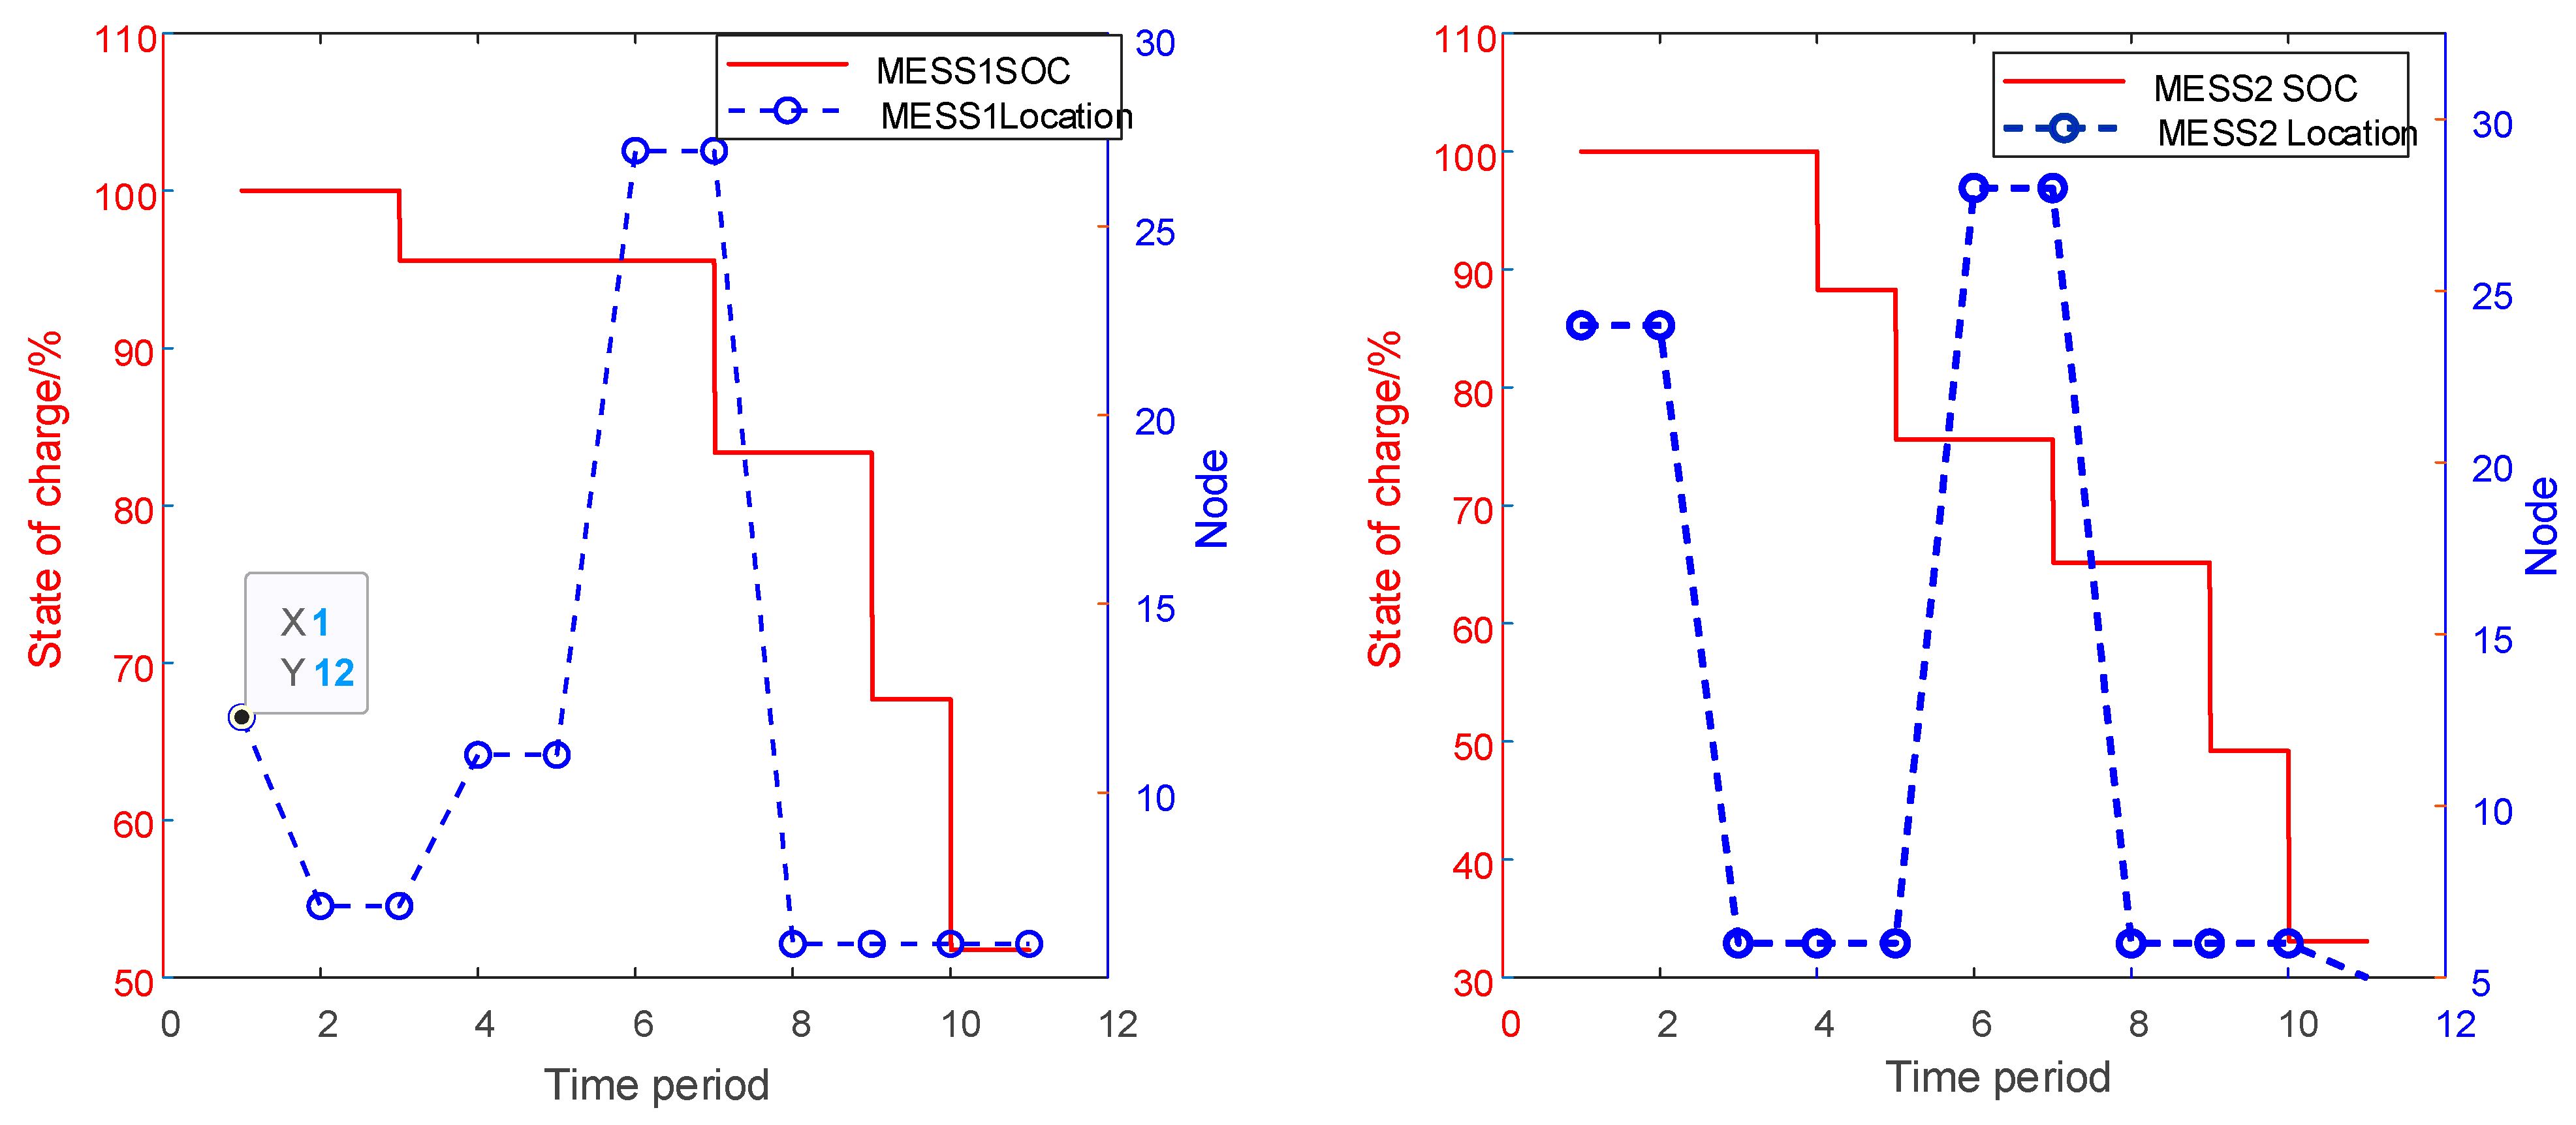
5.3.1. Analysis of Mobile Energy Storage Systems (MESS) and Dynamic Network Reconfiguration Strategy

As can be seen in Table 6, the introduction of MESS based on distribution network reconfiguration can effectively reduce the amount of power loss. Using MESS in conjunction with contact line reconstruction can reduce power loss by 19.23%. Fault scenarios are extracted from 1–2, 3–4, 7–8, 28–29, 18–33; line faults are analyzed individually, assuming that the disaster occurs at 4:00, and the expected repair time is 9 h. The mobile energy storage starts to be located at nodes 12 and 24. The charging state and location of the two mobile storage energies are shown in Figure 6.
The scheduling time is from 4:00 to 14:00, and every 1 h is a time period, with a total of 11 time periods. In time period 1, none of the mobile energy storage reaches the destination node, and at this time, the output is also relatively small, and the only one that can provide load support is the DSG, which outputs at maximum active power, and the non-critical load is severely curtailed, but the recovery ratio of non-critical load is still above 80%. MESS1 and MESS2 arrive at nodes 4 and 18 to discharge in time period 2, respectively, and due to the disconnection of lines 3–4, MESS1 is discharged at node 4. As time passes, the PV output at node 18 gradually increases, and MESS2 travels to node 6, which contains critical loads that supply power during time periods 5–6. MESS1 discharges at the islanded node 28 during time periods 4–6, and MESS2 discharges at node 27 during time periods 7–9. As the PV output decreases again, MESS2 goes to discharge at node 5 in time period 10–11, and MESS1 goes to discharge at nodes 2 and 23 successively in time period 7–11. At this point, more than half of the mobile energy storage capacity is used, and more than 98 per cent of the critical loads are restored.
In summary, the post-disaster distribution network restoration strategy integrates Mobile Energy Storage (MES) into network reconfiguration and islanding operations. This approach enables spatiotemporal energy transfer, establishes discrete energy links between islands, and balances electrical energy resources across different regions of the distribution network. Consequently, it enhances load restoration levels and reduces power outage losses in the distribution network.

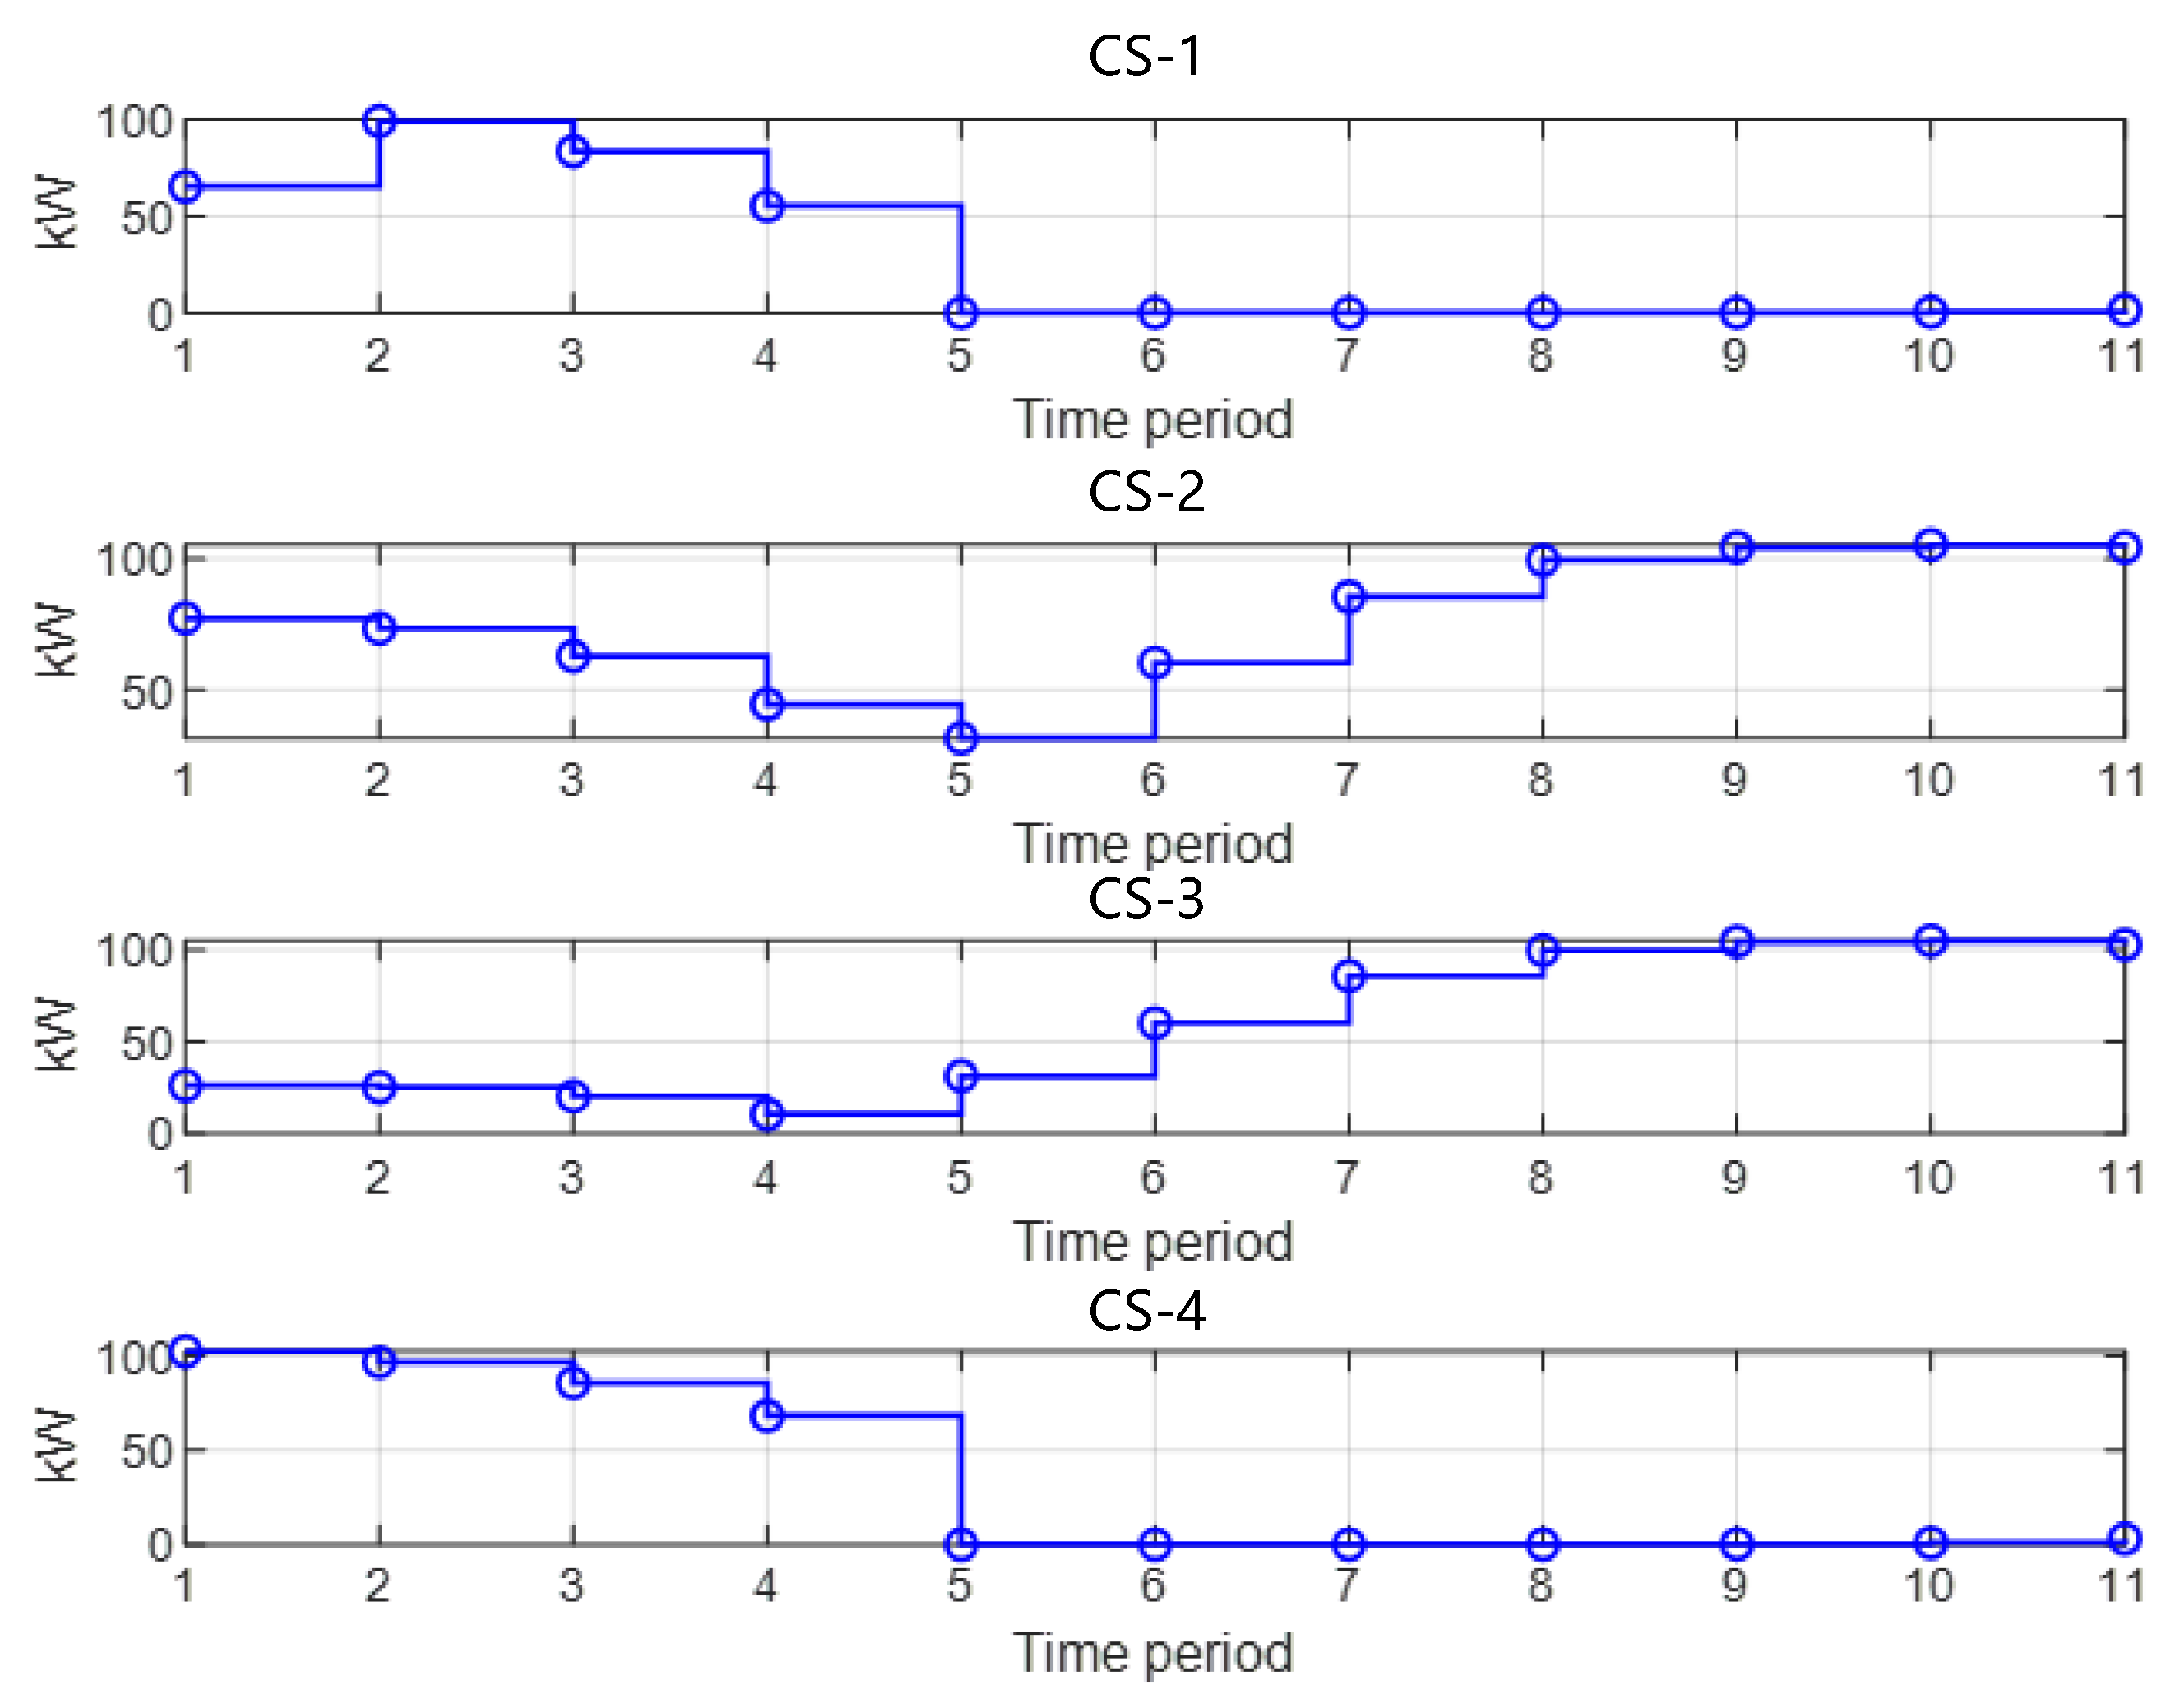
5.3.2. Analysis of the Effectiveness and Necessity of Electric Vehicle (EV) Cluster Participation in Distribution Network Restoration for Discharge Response

As can be seen in Table 7, the equivalent cost of Option 2 is 21.48% higher than that of Option 1, reflecting that MESS participation in power supply restoration has to pay more economic costs, while the equivalent cost of Option 3 is 26.12% lower than that of Option 1, indicating that EV cluster participation in power supply restoration is highly economical and has obvious advantages in reducing costs.
The discharge curves of electric vehicle (EV) clusters at the charging station and the spatiotemporal scheduling results of the Mobile Energy Storage (MES) system under Scheme 3 are illustrated in Figure 7 and Figure 8, respectively. As shown in Figure 7, all four EV clusters participate in the power supply restoration process. Figure 7 represents the total discharging power (in kW) from the EV charging station to the grid during vehicle-to-grid (V2G) operation. Due to the varying proportions of EVs with distinct charging and discharging behaviors within each cluster, differences arise in the generalized charging and discharging boundaries derived from these clusters. During time periods 1–5, EVs-1 and EVs-4 have a higher number of vehicles stationed at night, enabling them to provide greater power support to the loads. In contrast, during time periods 6–11, EVs-2 and EVs-3 contribute more power.
The typhoon disaster has a large impact on the road conditions, and it is not difficult to see that when MESS1 and MESS2 are moving between nodes, the EV clusters located on the off-grid island nodes can always maintain the discharge state to provide electrical support to the node loads, make up for the power vacancies, and ensure the continuity of power supply. Meanwhile, Scheme 3 reduces the power loss by 19.23% compared to Scheme 1, and the fault recovery effect is significant. According to the charging state of the MESS, it can also be seen that the proportion of its power usage is reduced to a certain extent compared with Scheme 2, reducing the cost of using the MESS.

6. Conclusions

In this paper, a power supply restoration strategy considering the dispatchable potential of EVs and MES is proposed in the context of distribution network branch circuit failures after a typhoon disaster. The purpose of this study is to improve the reliability of the power system restoration system with mobile energy storage and reduce the economic losses of the distribution network during the fault phase through the use of EVs and MES. The conclusions can be drawn from the simulation analysis:
  • The proposed Minkowski summation-based approach successfully compresses EV clusters into generalized energy storage devices, enabling dimensionality reduction while preserving variable constraints. This method ensures the accuracy and reliability of charging station operations, facilitating effective load support during typhoon disasters.
  • By integrating the Batts wind field model, this study quantifies typhoon-induced failures in distribution networks and traffic systems. The derived line failure rates and scenario analyses provide actionable insights for resilience planning.
  • Introducing MESS into the post-disaster distribution network restoration strategy that uniformly considers the reconfiguration of the distribution network and the division of active islands can realize the spatial and temporal transfer of electric energy, equalize the electric energy resources between the regions of the distribution network, and effectively improve the level of load restoration.
  • In the case of limited stationary energy sources, considering V2G participation in distribution network power supply restoration can play an auxiliary support role in the energy spatial and temporal transfer functions of MESS, and the proposed method reduces the economic loss of power outage by 29.78% compared with the traditional scheme by dispatching EV as a mobile power source, which can help to connect off-grid islands with the outside world, improve the resilience of the distribution network, reduce the amount of lost power, and increase the strategy’s economy.

Author Contributions

Conceptualization, X.D.; methodology, X.D.; software, D.Y.; validation, X.X.; formal analysis, S.W.; investigation, S.W.; resources, D.Y.; data curation, Y.Z.; writing—original draft preparation, X.D; writing—review and editing, X.X.; visualization, X.D.; supervision, X.X. All authors have read and agreed to the published version of the manuscript.

Funding

This research was funded by Chongqing Municipal Science and Technology Bureau Projects, grant number CSTB2024TIAD-KPX0088.

Data Availability Statement

The raw data supporting the conclusions of this article will be made available by the authors on request.

Conflicts of Interest

Authors Di Yang and Song Wang were employed by the Chongqing Huizhi Energy Co., Ltd. The remaining authors declare that the research was conducted in the absence of any commercial or financial relationships that could be construed as a potential conflict of interest. The company had no role in the design of the study; in the collection, analyses, or interpretation of data; in the writing of the manuscript, or in the decision to publish the results.

References

  1. Zhang, Y.; Liu, W.; Shi, Q.; Huang, Y.; Huang, S. Resilience assessment of multi-decision complex energy interconnection system. Int. J. Electr. Power Energy Syst. 2022, 137, 107809. [Google Scholar] [CrossRef]
  2. Zhang, H.; Zhao, T.; Yao, S.; Wang, P.; Goel, L.K. Power System Hurricane Resilience Assessment Considering Fuel Supply System. In Proceedings of the 2018 IEEE Power & Energy Society General Meeting (PESGM), Portland, OR, USA, 5–10 August 2018; pp. 1–5. [Google Scholar]
  3. Fang, Y.-P.; Zio, E. An adaptive robust framework for the optimization of the resilience of interdependent infrastructures under natural hazards. Eur. J. Oper. Res. 2019, 276, 1119–1136. [Google Scholar] [CrossRef]
  4. Aldarajee, A.H.M.; Hosseinian, S.H.; Vahidi, B.; Dehghan, S. A coordinated planner-disaster-risk-averse-planner investment model for enhancing the resilience of integrated electric power and natural gas networks. Int. J. Electr. Power Energy Syst. 2020, 119, 105948. [Google Scholar] [CrossRef]
  5. Igder, M.A.; Liang, X.; Mitolo, M. Service Restoration Through Microgrid Formation in Distribution Networks: A Review. IEEE Access 2022, 10, 46618–46632. [Google Scholar] [CrossRef]
  6. Shi, Q.; Liu, W.; Zeng, B.; Hui, H.; Li, F. Enhancing distribution system resilience against extreme weather events: Concept review, algorithm summary, and future vision. Int. J. Electr. Power Energy Syst. 2022, 138, 107860. [Google Scholar] [CrossRef]
  7. Liu, W.; Ding, F. Hierarchical Distribution System Adaptive Restoration with Diverse Distributed Energy Resources. IEEE Trans. Sustain. Energy 2021, 12, 1347–1359. [Google Scholar] [CrossRef]
  8. Moreno, R.; Torres, A. Security of the power system based on the separation into islands. In Proceedings of the 2011 IEEE Pes Conference on Innovative Smart Grid Technologies Latin America (ISGT LA), Medellin, Colombia, 19–21 October 2011; pp. 1–5. [Google Scholar]
  9. Panteli, M.; Trakas, D.N.; Mancarella, P.; Hatziargyriou, N.D. Boosting the Power Grid Resilience to Extreme Weather Events Using Defensive Islanding. IEEE Trans. Smart Grid 2016, 7, 2913–2922. [Google Scholar] [CrossRef]
  10. Du, Y.; Wu, D. Deep Reinforcement Learning from Demonstrations to Assist Service Restoration in Islanded Microgrids. IEEE Trans. Sustain. Energy 2022, 13, 1062–1072. [Google Scholar] [CrossRef]
  11. Sun, S.; Cong, W.; Qiu, J.; Chen, M.; Wei, Z.; Zhang, Z. Power Restoration Method of Distribution Network with ESS and DG. In Proceedings of the 2021 IEEE/IAS Industrial and Commercial Power System Asia (I&CPS Asia), Chengdu, China, 18–21 July 2021; pp. 1075–1079. [Google Scholar]
  12. Kim, J.; Dvorkin, Y. Enhancing Distribution System Resilience with Mobile Energy Storage and Microgrids. IEEE Trans. Smart Grid 2019, 10, 4996–5006. [Google Scholar] [CrossRef]
  13. Nazemi, M.; Dehghanian, P.; Lu, X.; Chen, C. Uncertainty-Aware Deployment of Mobile Energy Storage Systems for Distribution Grid Resilience. IEEE Trans. Smart Grid 2021, 12, 3200–3214. [Google Scholar] [CrossRef]
  14. Zhang, L.; Jiang, S.; Zhang, B.; Li, G.; Wang, Z.; Tang, W. Coordinated Optimization of Emergency Power Vehicles and Distribution Network Reconfiguration Considering the Uncertain Restoration Capability of E-Taxis. IEEE Trans. Ind. Appl. 2022, 58, 2707–2717. [Google Scholar] [CrossRef]
  15. Alghamdi, A.; Jayaweera, D. Resilience of modern power distribution networks with active coordination of EVs and smart restoration. IET Gener. Transm. Distrib. 2023, 17, 4836–4857. [Google Scholar] [CrossRef]
  16. El-Hawary, M.E. The Smart Grid—State-of-the-art and future trends. In Proceedings of the 2016 Eighteenth International Middle East Power Systems Conference (MEPCON), Cairo, Egypt, 27–29 December 2016; p. xvii. [Google Scholar] [CrossRef]
  17. Kang, Y.; Lu, G.; Chen, M.; Li, X.; Li, S. Fault recovery method of DC distribution network considering EV charging and discharging and SOP network reconfiguration. Electr. Power Syst. Res. 2025, 245, 111607. [Google Scholar] [CrossRef]
  18. Su, S.; Wei, C.; Li, Z.; Xia, M.; Chen, Q. Critical load restoration in coupled power distribution and traffic networks considering spatio-temporal scheduling of electric vehicles. Int. J. Electr. Power Energy Syst. 2022, 141, 108180. [Google Scholar] [CrossRef]
  19. Wu, C.; Cen, C.; Ma, Y.; Li, F.; Sui, Q. Enhancing resilient restoration of distribution systems utilizing electric vehicles and supporting incentive mechanism. Appl. Energy 2022, 9, 372–380. [Google Scholar] [CrossRef]
  20. Wang, L.; Chen, B.; Ye, Y.; Chongfuangprinya, P.; Yang, B.; Zhao, D.; Hong, T. Enhancing Distribution System Restoration with Coordination of Repair Crew, Electric Vehicle, and Renewable Energy. IEEE Trans. Smart Grid 2024, 15, 3694–3705. [Google Scholar] [CrossRef]
  21. Chao, L.; Yu, L.; Yihua, L.; Menghua, D.; Yanjun, C.; Ruochen, D. An evaluation method for integrating EVs in distribution networks with clustering algorithms. Front. Energy Res. 2024, 12, 1403430. [Google Scholar] [CrossRef]
  22. Huang, L.; Li, H.; Lai, C.S.; Zobaa, A.F.; Zhong, B.; Zhao, Z.; Lai, L.L. Electric Vehicle Cluster Scheduling Model for Distribution Systems Considering Reactive-Power Compensation of Charging Piles. Energies 2024, 17, 2541. [Google Scholar] [CrossRef]
  23. Bourrières, J.-P. The Minkowski sum of simplices in 3-dimensional space: An analytical description. Comput. Geom. 2014, 47, 856–867. [Google Scholar] [CrossRef]
  24. Wang, Z.; Wang, Z. A novel preventive islanding scheme of power system under extreme typhoon events. Int. J. Electr. Power Energy Syst. 2023, 147, 108857. [Google Scholar] [CrossRef]
  25. Li, Q.S.; Li, X.; He, Y.; Yi, J. Observation of wind fields over different terrains and wind effects on a super-tall building during a severe typhoon and verification of wind tunnel predictions. J. Wind. Eng. Ind. Aerodyn. 2017, 162, 73–84. [Google Scholar] [CrossRef]
  26. Wu, F.; Huang, G.; Zhou, X. Enhanced Circular Subregion Method in Typhoon Hazard Analysis. J. Struct. Eng. 2021, 147, 06021003. [Google Scholar] [CrossRef]
  27. Wu, F.; Huang, G. Refined empirical model of typhoon wind field and its application in China. J. Struct. Eng. 2019, 145, 04019122. [Google Scholar] [CrossRef]
Figure 1. Minkowski addition.
Processes 13 01638 g001
Figure 2. Batts wind field model.
Processes 13 01638 g002
Figure 3. Sketch of circular sub-region method.
Processes 13 01638 g003
Figure 4. Charging stations dispatchable potential.
Processes 13 01638 g004
Figure 5. IEEE 33-node distribution system affected by typhoon.
Processes 13 01638 g005
Figure 6. MESS charge state and position.
Processes 13 01638 g006
Figure 7. EV cluster discharge curve under Scheme 3.
Processes 13 01638 g007
Figure 8. Charge state and position at the MESS moment.
Processes 13 01638 g008
Table 1. Classification of node loads.
Load ClassificationNode
Critical loads3, 4, 6, 10, 11, 15, 17, 19, 24, 26, 28, 33
Non-critical loadsNodes other than critical loads
Table 2. EV sampling parameters.
EV Parameter Distribution T n a r r i v a l T n l e a v e S n , 0
Type AN (18, 4)N (8, 4)U (0.4, 0.6)
Type B N (21, 1)N (7, 1)U (0.2, 0.4)
Type C N (9, 2)N (17, 4)U (0.4, 0.6)
Table 3. Charging station sampling parameters.
Number of EVsType AType B Type C
CS1U (36, 44)U (38, 42)-
CS2U (36, 44)U (16, 24)U (76, 84)
CS3-U (18, 22)U (76, 84)
CS4U (76, 84)--
Table 4. DG parameters.
Pmax/kWQmax/kWηE/kWh
DSG1\DSG2\DSG3120100--
DSG4\DSG58060--
MESS2001700.98600
Table 5. Maximum values of time-varying failure rates of distribution lines in typhoon conditions.
NumberFirst NodeLast
Node
Failure Rate (Times/h)NumberFirst NodeLast
Node
Failure Rate (Times/h)
1120.0537921714150.3487650
2230.2876301815160.435412
32190.2135351916170.592039
4340.2223442017180.428976
53230.4778282119200.584876
6450.1092182220210.217654
7560.4250512321220.390875
8670.4909322423240.523919
96260.4690992524250.526275
10780.1847032626270.155811
11890.2176462727280.567851
129100.3998542828290.439865
1310110.3187652929300.276050
1411120.3487653030310.517894
1512130.4390763131320.186548
1613140.3278653232330.390675
Table 6. Comparison of power losses across different scenarios.
Loss of Power/MWPercentage Reduction in Power Loss/%
Scheme 12.3415-
Scheme 21.891219.23
Scheme 31.655429.78
Table 7. Comparison of economic losses under various programs.
Economic Losses/USDPercentage Reduction in Cost/%
Scheme 145,187.67-
Scheme 254,892.98−21.48
Scheme 333,384.7626.12
Disclaimer/Publisher’s Note: The statements, opinions and data contained in all publications are solely those of the individual author(s) and contributor(s) and not of MDPI and/or the editor(s). MDPI and/or the editor(s) disclaim responsibility for any injury to people or property resulting from any ideas, methods, instructions or products referred to in the content.

