Article

Influence of the Layout of Cells in a Traction Battery on the Evolution of a Fire in the Event of a Failure

1
Research Department, Electric Vehicle and Mobility Area, Instituto de Investigación sobre Vehículos, S.A., Ctra. N232, km 273, 50690 Pedrola, Zaragoza, Spain
2
Department of Mechanical Engineering, University of Zaragoza, C/María de Luna s/n, 50018 Zaragoza, Spain
*
Author to whom correspondence should be addressed.
Processes 2025, 13(3), 889; https://doi.org/10.3390/pr13030889
Submission received: 31 January 2025 / Revised: 12 March 2025 / Accepted: 12 March 2025 / Published: 18 March 2025

Abstract

:
Research on the safety and impact of lithium-ion battery failure has focused on individual cells as lithium-ion batteries began to be used in small devices. However, large and complex battery packs need to be considered, and how the failure of a single cell can affect the system needs to be analyzed. This initial failure at the level of a single cell can lead to thermal runaway of other cells within the pack, resulting in increased risk. This article focuses on tests of mechanical abuse (perforation of cylindrical cells), overcharge (pouch cells), and heating (cylindrical cells with different arrangements and types of connection) to analyse how various parameters influence the mechanism of thermal runaway (TR) propagation. Parameters such as SoC (State of Charge), environment, arrangement, and type of connection are thoroughly evaluated. The tests also analyse the final state of the post-mortem cells and measure the internal resistance of the cells before and after testing. The novelty of this study lies in its analysis of the behavior of different types of cells at room temperature, since the behavior of lithium-ion batteries under adverse circumstances has been extensively studied and is well understood, failures can also occur under normal operating conditions. This study concludes that temperature is a crucial parameter, as overheating of the battery can cause an exothermic reaction and destroy the battery completely. Also, overcharging the cell can compromise its internal structure, which underlines the importance of a well-functioning battery management system (BMS).

1. Introduction

It is a fact that lithium-ion cells are being used in larger devices and therefore they already need battery packs, as is the case in electric vehicles. In most accidents, the thermal runaway (TR) of a single cell occurs first, then the heat dissipates into adjacent cells and thermal runaway propagation occurs. Therefore, it is important to investigate the mechanism of thermal runaway propagation and determine the key parameters during thermal runaway propagation in a battery.
This article will analyze the behavior of cylindrical cells after inducing thermal runaway in a single cell and the behavior of a pouch cell subjected to overcharge at different ambient temperatures. Initial failures in lithium-ion cells can be due to mechanical failure [1], thermal failure [2] or electrical failure [3]. Understanding the behavior of lithium-ion cells under these failures is important for developing safe cells.
Before discussing thermal runaway, it is essential to understand various reaction mechanisms inside the battery. The internal reactions experienced by Li-ion battery during thermal runaway include SEI film decomposition reaction, reaction between negative electrode and electrolyte, membrane melting, decomposition reaction of both the positive electrode and electrolyte, as well as oxidation reactions. In lithium-ion batteries, lithium is initially stored in the metal oxide cathode (for example, LiCoO₂). During charging, lithium ions migrate to the anode, forming C₆Li. In this state, lithiated graphite reacts with alkyl carbonate electrolytes, leading to the formation of a passivation layer on the anode’s surface. This layer, known as the solid electrolyte interface (SEI), plays a crucial role in stabilizing the battery [4].
The SEI film of the negative electrode is mainly composed of stable layers (such as LiF and Li2CO3) and metastable layers (including (CH2OCO2Li)2, ROCO2Li, ROLi and oxygen-containing polymers). Studies have shown that the initial decomposition temperature of SEI film is related to the lithium salt, generally at 80–120 °C. At 80 °C, the SEI film undergoes initial decomposition, which peaks as the temperature rises to 100 °C. During this process, the battery generates self-heat [5,6,7], which is a crucial indicator of the battery’s thermal runaway. The decomposition reactions of SEI film are exhibited in Equations (1)–(3) [8]:
(CH2OCO2Li)2 → Li2CO3 + C2H4 + CO2 + 0.5O2
2Li + (CH2OCO2Li)2 → 2Li2CO3 + C2H4
Li2CO3 + 2HF → 2LiF + CO2 + H2O
Here, in Equation (2), Li2CO3 is a salt that forms the passivation layer, and we also observe gas generation in the form of ethene. Other possible processes will form organic salts that are subject to thermal decomposition to similar products.
The passivation layer in lithium-ion batteries, composed of Li₂CO₃ and (CH₂OCO₂Li)₂, is formed during manufacturing and remains stable under normal conditions. However, thermal activation affects its stability. Material variability leads to differences in reaction chemistry, making precise analysis complex and requiring material-specific measurements. This information is crucial for understanding thermal runaway behavior and improving battery safety.
After the SEI film decomposes, the active substance of the negative electrode (the lithium metal embedded in it) is in direct contact with the electrolyte. When the temperature rises to 100–250 °C, an exothermic reaction occurs between lithium and the organic solvent (EC (Cyclic Ethylene Carbonate), PC (Propylene Carbonate), BC (Butene Carbonate), DMC (Chain Dimethyl Carbonate), DEC (Diethyl Carbonate), EMC (Methyl Ethyl Carbonate)) in the electrolyte, further increasing the temperature [4].
In addition, the injection and storage environment of the battery can introduce trace amounts of humidity. Lithium metal, being highly reactive, is prone to absorbing the humidity, leading to the formation of hydrogen gas, as shown in Equation (4) [9]:
2Li + H2O → Li2O + H2
The carbon dioxide formed in the electrolyte reaction may react with Li to form carbon monoxide [10].
At present, the melting point of the commonly employed polypropylene (PP) and polyethylene (PE) diaphragm are 150 °C and 112 °C, respectively [11,12]. As the internal temperature of the battery rises, the micropores on the diaphragm will immediately close and block the current. When the temperature reaches the melting point, the diaphragm begins to shrink and melts at an accelerated rate [13,14], which causes the direct contact of the positive and negative electrodes of the battery, namely an internal short circuit. Given that the melting process absorbs heat from the surrounding area, the temperature inside the battery rises at a slower rate. Arora and Zhang [15] reported that the endothermic reaction of PE diaphragm reached its peak at 130 °C. During the melting process of the separator, the internal resistance of the battery increases due to the disruption of the film’s insulating properties, allowing for easier ionic movement within the battery. Notably, at 150 °C, the internal resistance of the battery increased significantly due to the fully impaired mechanical strength of PE diaphragm that causes direct contact between the positive and negative electrodes [4].
After the diaphragm is decomposed, an internal short circuit occurs inside the battery, and the battery temperature rapidly rises from 150 °C to 300 °C and even higher. At this stage, the positive electrode, electrolyte, and other components in the battery rapidly decompose and continue to release a great amount of heat [16]. The decomposition reactions of different cathode materials are different, and the decomposition temperature of lithium cobalt oxide, ternary lithium and lithium iron phosphate are 150, 210 and 310 °C, respectively [13,17].
It has been reported that the electrolyte of lithium-ion batteries is unstable [18]; while this instability is conducive to the generation and repair of SEI film, it also leads to the loss of battery capacity and power. As the internal temperature of lithium-ion batteries continues to rise, a series of complex exothermic reactions occur in the electrolyte. Specifically, when the temperature rises to 100–120 °C, the solute lithium hexafluorophosphates (LiPF6) in the electrolyte will decompose and produce PF5 [18]. If the battery contains a small amount of water, PF5 or LiPF6 will undergo a hydrolysis reaction with water [19,20]. When the temperature rises to 180–200 °C, PF5 produced by the decomposition of LiPF6 will further produce a violent exothermic reaction with organic solvents, accelerating the decomposition of the electrolyte and releasing CO2, hydrocarbons, and the highly toxic gas hydrofluoric acid (HF) [21]. Additionally, as the concentration of LiPF6 increases, the activity of the electrolyte also increases, leading to a lower decomposition temperature [22].
During various reactions within lithium-ion batteries, a significant amount of gas is produced while releasing considerable heat, leading to a rapid increase in the internal battery temperature, potentially reaching up to 800 °C. It is observed [4] that materials exhibiting higher reaction temperatures demonstrate greater stability and safety, associated with lower heat releases. The intricate reactions within the battery generate a diverse array of gases, including CO2, CO, H2, CH4, C2H4, C2H6, C3H6, O2, H2O, and HF [23,24]. The five gases with the highest concentrations resulting from battery thermal runaway are CO2, CO, H2, CH4, and C2H6, among which CO2, CO, or H2 accounts for the highest proportion [25,26], with CO2 and CO exhibiting a decreasing trend. Notably, the higher energy density of the battery is associated with increased CO content [27]. Additionally, H2 and C2H4 are the primary culprits in battery explosions.
The initial reactions generate a significant amount of gas; in a sealed cell, this leads to pressurization and venting, releasing gaseous products like CO₂ (60%), CO, C₂H₄, CH₄ (together 20%), and H₂ (10%), among others [28]. Additionally, liquid alkyl carbonates may be expelled as a spray, often resulting in a burst of flames. Prior to addressing the oxidation of the electrolyte and vapors in air, we address reactions between the cathode and the electrolyte. As temperatures rise, the metal oxide can undergo phase transformations that release oxygen, and this oxygen can react with the electrolyte at the particle surface.
These reactions are strongly exothermic, which is typical for combustion oxidation. However, the amount of oxygen released by the cathode is only sufficient to oxidize a small fraction of the electrolyte, so that the direct electrolyte flammability is a significant issue [28]. If thermal energy is not dissipated quickly, the gas generation and exothermic reactions can lead to pressurized venting of gases and liquid electrolyte in a sudden spray event. The ignition risk of this spray is a major concern, as the heat released from alkyl carbonate electrolyte oxidation can be several times greater than the battery’s own energy content, significantly increasing fire hazards. The involvement of the active battery materials in the thermal runaway process through the above reactions is dependent on the battery being in the charged state. For this reason, regulations typically require batteries be transported, etc., in the discharged state, at least below some critical state of charge. If thermal energy is not dissipated quickly, the gas generation and exothermic reactions can lead to pressurized venting of gases and liquid electrolyte in a sudden spray event. The ignition risk of this spray is a major concern, as the heat released from alkyl carbonate electrolyte oxidation can be several times greater than the battery’s.
The conditions of various reactions mentioned previously clearly indicate that, once the battery temperature attains 80 °C, the SEI film initiates decomposition, generating heat. This marks the commencement of the battery’s self-heating process. Subsequently, as the battery temperature gradually escalates to 100 °C, the substances within the electrolyte start reacting, continuously producing heat [4]. Therefore, 80 °C can be theoretically regarded as the critical temperature for thermal runaway in lithium-ion batteries [4].
A lithium-ion battery can present risks throughout its lifetime if the electrolyte is damaged and does not perform its function of separating the anode and cathode. Whether due to mechanical damage, such as a fall or a heavy blow, overcharging or complete discharge, or temperatures outside the range recommended by the manufacturer, a hazardous situation can arise in which the so-called ‘Thermal Runaway’ (TR) or ‘Exothermic Reaction Out of Control’ is triggered. This is an extremely exothermic process that is impossible to stop; it releases flammable gases that can cause a metallic fire within a few minutes. A single faulty cell is enough to cause a chain reaction with severe consequences. When this chain reaction occurs, it cannot be stopped; the only solution is to contain the reaction so that it affects as few surrounding cells as possible.
Lithium-ion cells normally operate or behave safely in a temperature range not exceeding 100 °C without being affected. The temperature values to be considered are those above the maximum temperature to which the cells can be subjected, i.e., 60 °C; at 70 °C, the electrolyte starts to volatize. As can be seen in Figure 1, if the temperature exceeds this critical value of 100 °C, various decomposition reactions begin to take place inside the lithium-ion cells. For temperatures above 120 °C (approximately), decomposition of the solid electrolyte interface, SEI, occurs first. The SEI is a very thin layer of material that does not exist when the cell is manufactured; this layer is formed when the cell is first charged, it interposes itself between the anode and the electrolyte and its function is to prevent reactions between them. However, when the cell reaches 120 °C, the SEI decomposes, degrades and can allow the anode to contact the electrolyte, and an exothermic reaction can occur between the lithium intercalated in the anode and the electrolyte.
In principle, any severe abuse of a cell can lead to TR, so there are multiple methods to initiate TR. Some of the most used methods are heating (thermal failure), perforation of the cell (mechanical failure), and overcharge/over discharge (electrical failure). New methods of external heating have been developed, such as internally heating the cell by inserting a heating device in it or creating an external short circuit through a heating device. Studies [30] have shown that inductive heating can also be a useful method for analyzing TR.
The TR behavior of individual lithium-ion cells has been studied [31,32,33,34,35,36,37,38,39,40,41,42]. Typical responses include venting of battery gases, ejection of cell contents, extreme temperatures, and, in some cases, cell self-ignition and projection of battery/cell materials. The failure of a single cell does not pose much risk, but the thermal and electrical impact on other cells in the module can be sufficient to cause a cascading TR effect. Considering that the battery may be installed in an electric vehicle, we should consider the risk involved.
It is observed that cylindrical cells are less prone to propagation due to the limited contact between neighboring cells. Based on several studies [34], we conclude that the electrical connection is important, as the 10s1p arrangement showed no fault propagation through the module, while the 1s10p did have an energy leakage that consumed the module minutes after the onset of the fault.
In contrast, modules built with pouch cells show strong heat transfer between cells as there is a large surface area of cells in direct contact, allowing faults to propagate through the entire battery in all series or parallel configurations tested [43].
The spacing and arrangement of the cells in a battery pack have an influence on the thermal propagation in the batteries. TR and its propagation occur if the spacing reaches a certain critical value. If the test is performed in an enclosed space, the probability of thermal runaway propagation in the battery pack is higher than in the case of testing in an open space [44]. On the other hand, if the cells are placed in a vertical arrangement, the probability of TR propagation is higher than in the case of horizontal arrangement [44]. Experimental results [44] show that when the SoC of the cells is 100%, and the spacing is more than 2 mm in the horizontal direction and 8 mm in the vertical arrangement, thermal runaway propagation of the battery pack hardly occurs as the environment is open. In a closed environment, there is less chance of uncontrolled heat transfer in the batteries; when the horizontal spacing is greater than 4 mm or the vertical spacing between cells is greater than 8 mm, uncontrolled thermal runaway does not occur.
Several studies were carried out by researchers to analyze the behavior of lithium-ion cells under external heating conditions. Huang et al. [45] used an electric heater to heat three 50 Ah lithium-ion cells to different SoCs and concluded that the cell only ignited when the cell surface reached 112 to 121 °C. The cell response and TR characteristics depend on the SoC, and if the SoC is increased, the time from heating to ignition is gradually reduced [45,46,47], and the reactions become more dangerous.
Feng et al. [48] divided the internal chemical reactions occurring in lithium-ion cells into different stages depending on the temperature they reach. When lithium-ion cells overheat, their temperature gradually increases. The SEI, a passive layer that covers the negative electrode surface and is formed by electrolyte degradation, begins to decompose when the cell reaches a temperature between 90–130 °C [49]. As the SEI decomposes, the electrolyte reaches the graphite surface more easily and reacts readily with the intercalated lithium to release oxygen and generate more heat [50]. On the other hand, polyethylene (PE) can melt at 130–140 °C, causing an internal micro short-circuit, and thus a continuous increase in battery temperature [51].
When the temperature reaches about 200 °C, the cathode materials start to decompose and release oxygen [52]. In addition, the decomposition reaction of the SEI layer and the chemical reaction between the electrolyte and the metal oxide materials of the cathode is accelerated, as well as the reaction between the electrolyte and the negative active substances, which will produce more heat and gases [47] such as O2, CO, HF, and NO [53,54,55,56,57]. As the temperature increases, the internal chemical reaction of the cell becomes increasingly intense and complex, generating a large amount of heat and combustible gases [58]; then, a TR reaction occurs, causing the lithium-ion cell to catch fire or even explode. It is important to understand the risk/hazard of designing individual cells and battery packs, and create modules that avoid or minimize the impact of TR.
However, there are few studies on methods that can assess the safety of battery cells or modules.
Studies indicate that TR only occurs when the SoC is above 50%. On the other hand, the critical spacing that triggers TR is 4 and 6 mm for 80% and 100% SoC batteries, respectively [59]. Feng et al. [60] conducted a mechanical abuse (penetration) test that induced TR on a 6-cell module in series contact and concluded that the cell casing transfers the most heat and developed a thermally resistant layer between the cells to prevent TR propagation in the module [61].
Lopez et al. [62] analyzed the influence of cell spacing on TR and concluded that the spacing between cells in the battery pack greatly affects TR propagation. They analyzed different battery modules in series and concluded that the key to TR propagation is heat conduction.
Therefore, there are several studies on the propagation of TR in series-connected battery modules [60,61,62], but few studies analyze the propagation of TR in parallel-connected battery modules. Wilke et al. [63] showed that the temperature increase after TR in a parallel connected battery cell module is higher than if the cells in the module are connected in series. Lamb et al. [43] also found that the temperature rise in a module with cells connected in parallel was higher and the TR propagation accelerated.
Gao et al. [64] carried out a study of TR propagation in a large format battery module with parallel connections, 18 parallel pouch cells of 24 Ah, and observed that the undamaged cells transfer current to the cell experiencing TR, which causes it to experience 10 degrees higher compared to a module with the cells connected in series. The module with parallel connections is less safe.
Lithium ion batteries are very sensitive to temperature. BTMS (Battery Thermal Management System) plays a vital role as a major part of battery management system (BMS) in EV applications. Monitoring and controlling the thermal state of batteries is a direct contribution to improving the performance, health, and the safety of battery modules and vehicles. Various types of BTMS technologies are presented [65], and many are currently implemented in commercialized battery packs. Cooling BTMSs are classified into two main categories. Active cooling methods carry out heat transfer by employing a source of energy, and passive BTMS types deliver heat rejection independent of any form of external energy or force [65].
Implementation of the new advanced BTMSs and hybrid BTMSs should fit into the target of high-performance thermal management and meet the battery technology heat transfer efficiency and battery cell design requirements. Consequently, the advancement of battery technology and the optimization of BTMS have emerged as prominent focal points for future research endeavors. BTMS can be classified based on power consumption, heat transfer medium, contact with the battery surface, and the configuration of cells in battery packs. While conventional cooling methods for BTMS, including air, liquid, and PCM (Phase Change Material), have been extensively researched, new BTMS technologies can be explored by improving the conventional methods and proposing additional ones [66].
In conclusion, by implementing a hybrid BTMS with active and passive cooling mechanisms, real-time monitoring, and advanced material integration, EV manufacturers can mitigate the risk of thermal runaway, improve battery longevity, and enhance overall vehicle safety.
Therefore, comparative research on the thermal runaway behaviors of various batteries is essential. One study [67] investigates the thermal runaway characteristics of sodium-ion batteries (NIBs), lithium iron phosphate batteries (LFP), and lithium-ion batteries with NCM523 and NCM622 cathodes. The experiments were conducted in a nitrogen-filled constant-volume sealed chamber. The results show that the critical surface temperatures at the time of thermal runaway are as follows: LFP (346 °C) > NIBs (292 °C) > NCM523 (290 °C) > NCM622 (281 °C), with LFP batteries exhibiting the highest thermal runaway critical temperature. NIBs have the lowest thermal runaway triggering energy (158 kJ), while LFP has the highest (592.8 kJ). During the thermal runaway of all four battery types, the primary gases produced include carbon dioxide, hydrogen, carbon monoxide, methane, ethylene, propylene, and ethane. For NCM622 and NCM523, carbon monoxide is the dominant combustible gas, with volume fractions of 35% and 29%, respectively. In contrast, hydrogen is the main flammable gas for LFP and NIBs, with volume fractions of 44% and 30%, respectively. Among these, NIBs have the lowest lower flammability limit (LFL), indicating the highest explosion risk. The thermal runaway characteristics of 50 Ah batteries provide valuable insights for battery selection and design in energy storage applications.
After analyzing the existing state of the art, it is concluded that there are studies on TR propagation in series-connected battery modules, but few studies analyze TR propagation in parallel-connected battery modules.
These tests have always been performed at a controlled temperature, but what happens if an electric vehicle battery cell that is at room temperature, or very high temperatures or very low temperatures, is subjected to abuse? To fill this gap and reproduce what happens on a day-to-day basis, various tests have been carried out on thermal abuse, mechanical abuse, and overcharge abuse at room temperature, i.e., temperature is controlled. The aim of this study is to analyze the behavior of electric vehicle batteries in the event of different failures.
Therefore, the present study makes sufficient contributions to knowledge, as there is no study characterizing the damage of different types of cells subjected to different types of abuse depending on their arrangement and connection type (in parallel or in series) at room temperature. The behavior of lithium-ion batteries under adverse circumstances has been extensively studied and is well understood, but failures can also occur under normal operation conditions.

2. Materials and Methods

This section analyses the tests performed using different TR initiation methods: mechanical abuse tests, overcharge tests, and inductive heating tests. Different types of cells were used for this purpose: cylindrical cells for the thermal failure test and for the mechanical failure test, and pouch cells for the electrical failure test. Table 1 shows the properties of tested cells.
The pouch cell was chosen for the overload test because swelling can be visually observed, whereas cylindrical cells have a better heat dissipation capacity, less risk of leakage, less risk of swelling, and if the internal pressure increases abnormally, pouch cells are susceptible to rupture. Cylindrical cell was therefore selected for the mechanical and thermal abuse tests, while the pouch cell was selected for the electrical abuse test.
In all the tests carried out, the internal resistance of the cells (untested and tested) was measured with the battery tester BT3564 (HIOKI Corporate, Nagano, Japan). With this equipment, the internal resistance and open-circuit voltage of a battery up to 1000 V can be measured simultaneously, allowing the condition of high-voltage batteries in electric vehicles or plug-in hybrid vehicles to be checked.

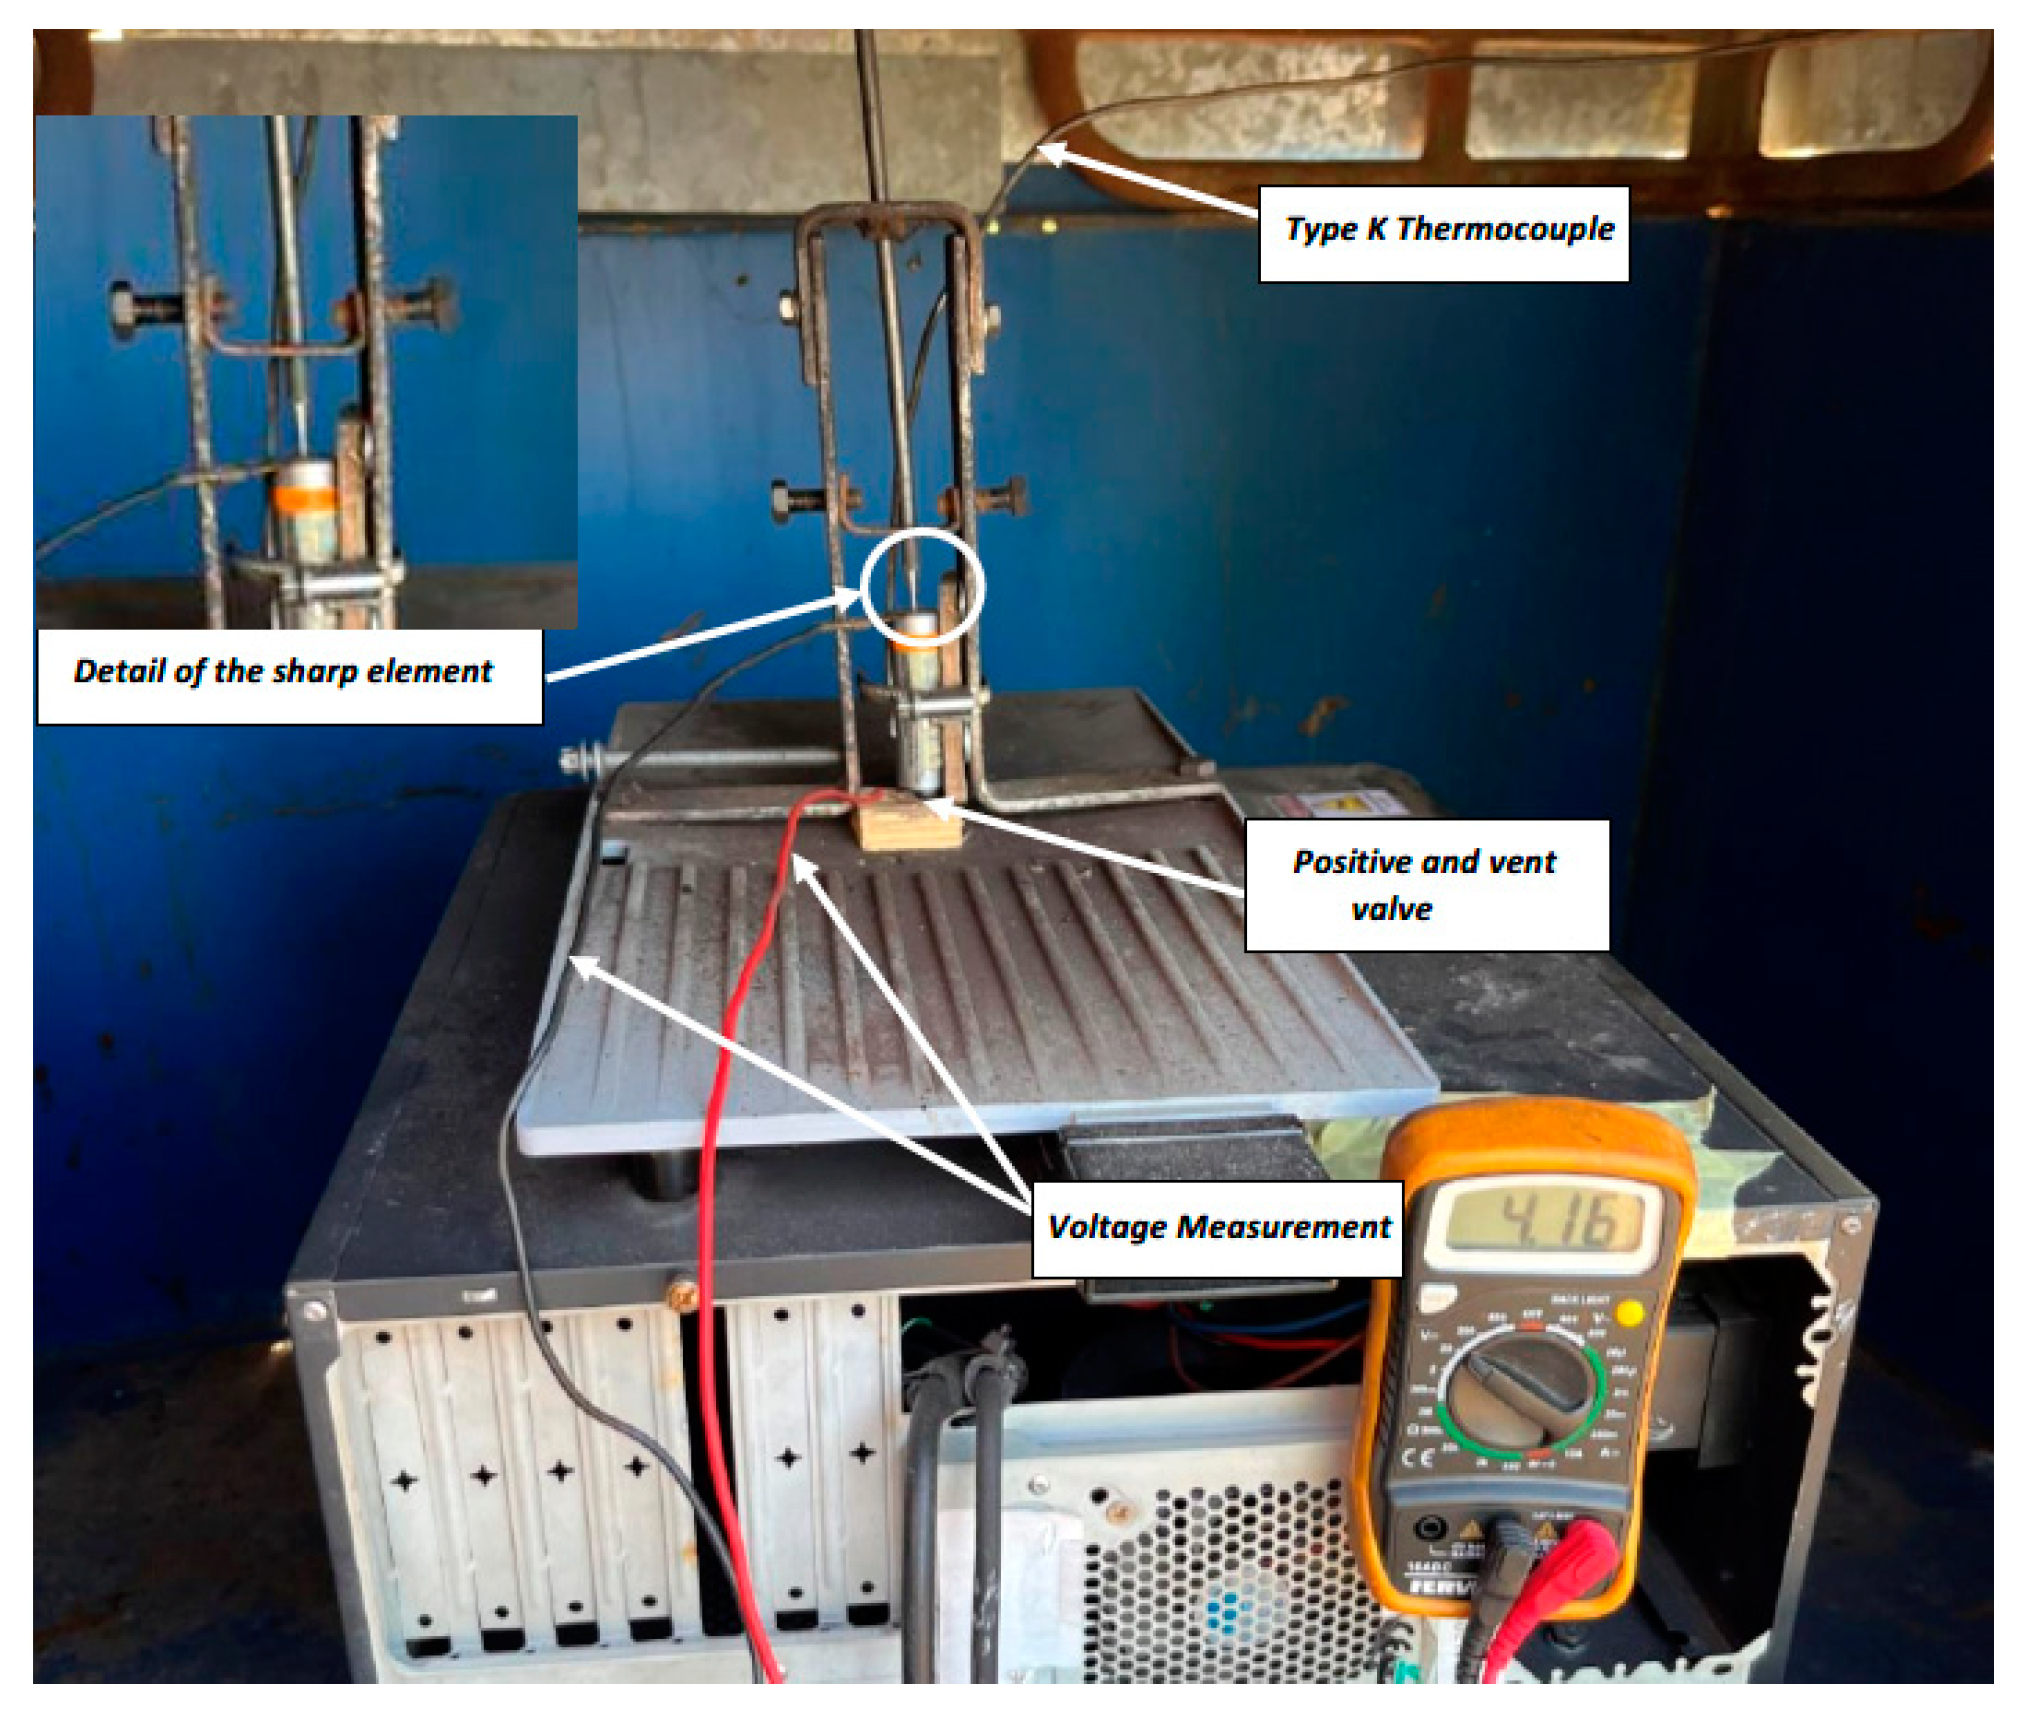
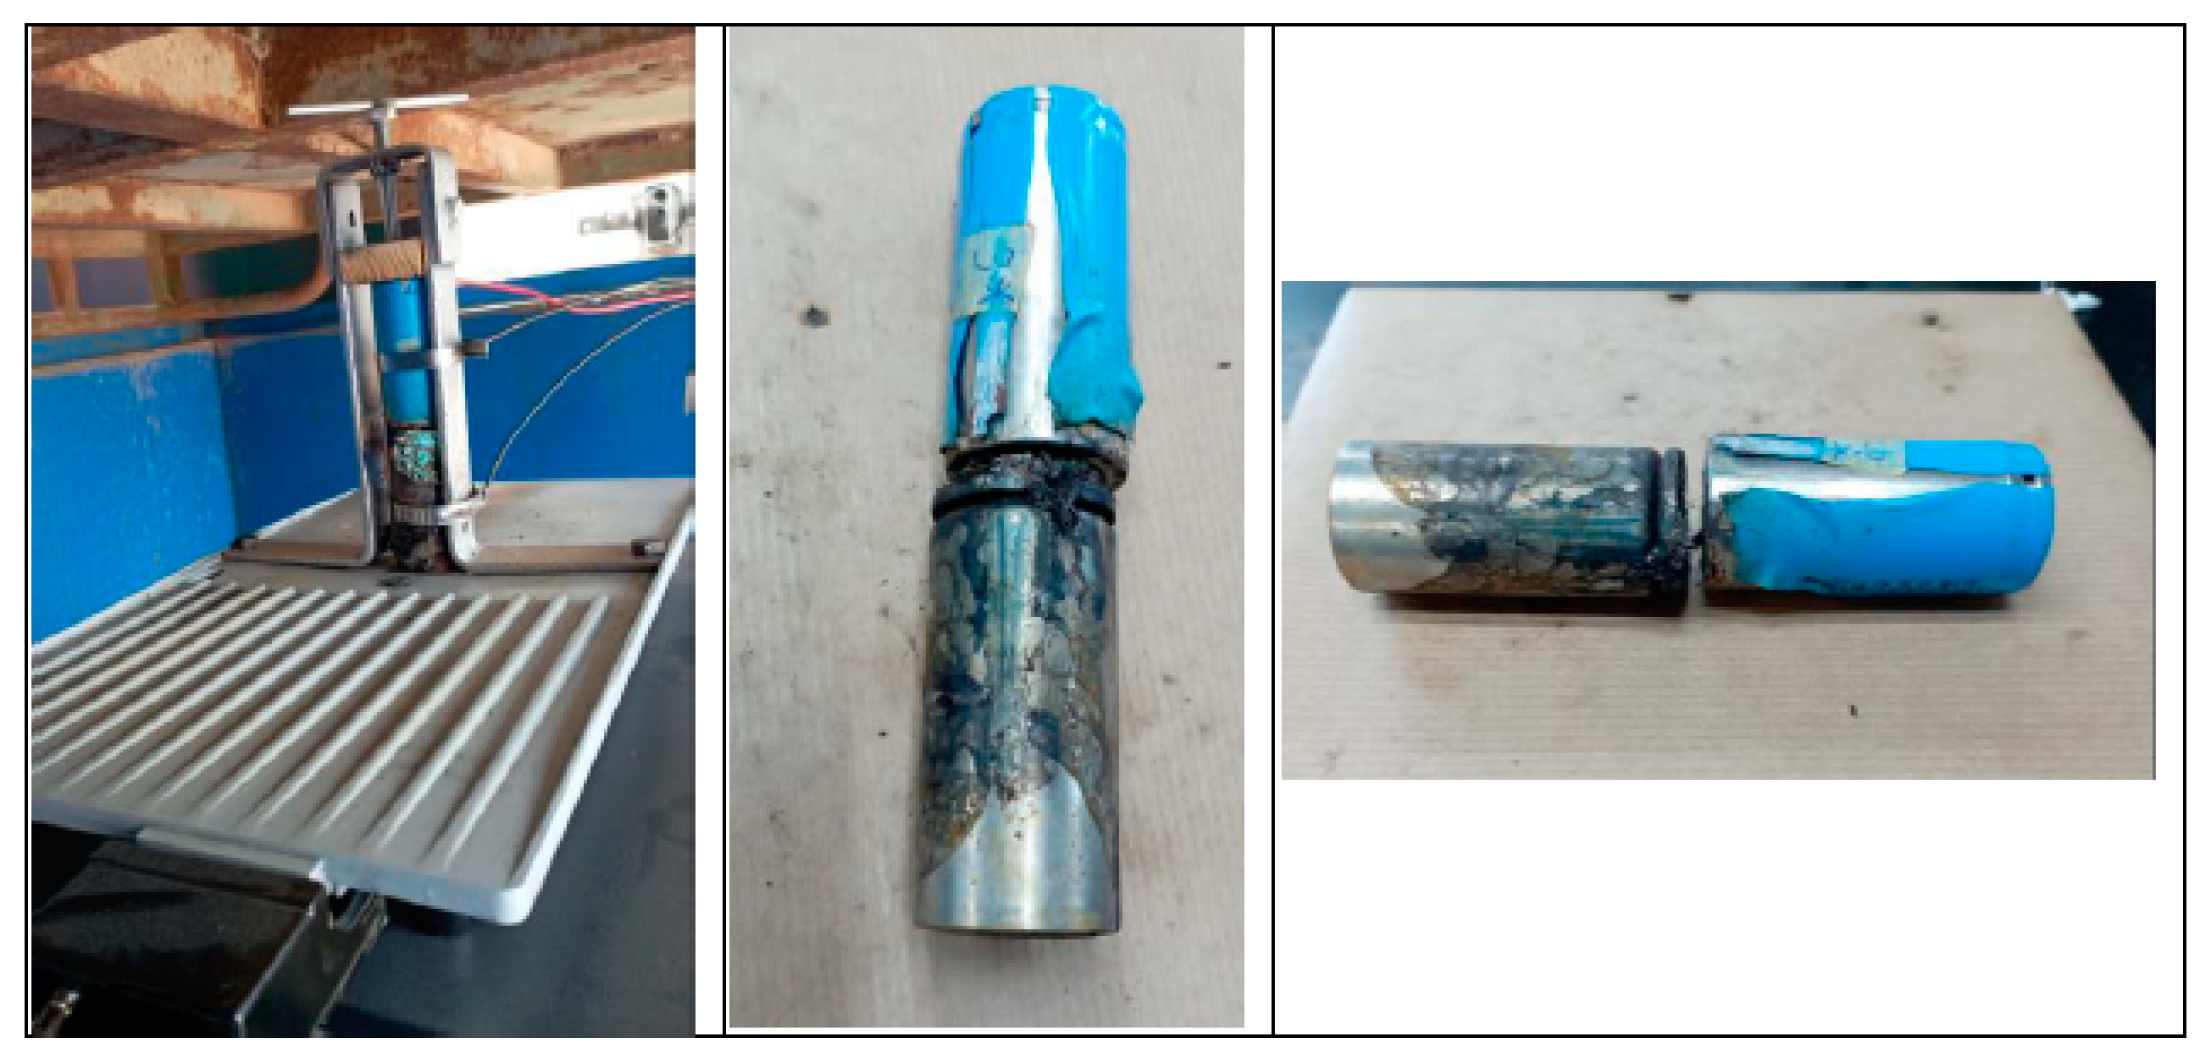
2.1. Mechanical Abuse Test

In mechanical abuse tests, an object penetrates or pierces the battery (breaking or weakening the mechanical integrity). For example, the extent to which nail penetration (internal short-circuit) or crushing (shock) affects the functionality and safety behavior of the battery is examined.
In this test, 32700 lithium-ion cylindrical cells are to be used, penetrated with a sharp object in the lateral area, i.e., pierced perpendicular to the longitudinal axis of the cell, until short-circuit is achieved, and in the upper area, i.e., pierced parallel to the longitudinal axis of the cell, until short-circuit is achieved. These tests will be repeated for different cell states of charge (SoC) (50% and 100%). The aim is to analyze how the cell structure influences the mechanical test and how its state of charge influences it. A table with the specifications of the tests to be carried out is shown below (Table 2).
The risk of TR occurring in a battery due to mechanical damage caused by a perforation or significant deformation of the battery can occur in electric or hybrid vehicles when the vehicle is involved in a collision of a certain intensity. The impact or collision between electric vehicles reaches tens or even hundreds of g, and the failure of the lithium-ion battery can cause TR, which can lead to a subsequent vehicle fire [68].
Through theoretical analysis and by performing calculations [68], the optimal design method of lithium-ion batteries is studied: it is concluded that increasing the separator thickness and increasing the elastic modulus can inhibit the voltage reduction of lithium-ion batteries under impact, we should note that increasing the elastic modulus will theoretically not affect the capacity of the battery, so it is the best option. The research [68] carried out an in-depth analysis of the failure phenomenon, mechanism, and modelling method of lithium-ion batteries under extremely strong impact conditions, which is of great importance for the design optimization of lithium-ion battery design and the improvement of lithium-ion battery design under extreme mechanical conditions.
Mechanical testing is a commonly used method to assess the safety of batteries. The blunt rod mechanical test method, as well as penetration with sharp nails, was carried out on commercially available cells. The evaluation was carried out on different cell types as well as varying test conditions [69]. The results obtained under ambient conditions differed little from traditional sharp nail penetration tests. When performed at elevated temperatures, the results were found to be highly dependent on the internal structure of the cell. Computed tomography images showed differences in behavior depending on whether a solid core was used in the cylindrical cell structure. Pouch cells were also tested and showed that complete penetration of the cell was necessary for failure to occur inside the cell.
According to the study carried out [69], the results of mechanical tests depend on the test conditions, the type of cell (structure) tested, and how these conditions interact with each other. It is important to note that the battery’s use conditions (vehicle, mobile phone, or other) will govern the mechanical abuse conditions to which the battery is subjected when assessing its safety. For example, a battery onboard a vehicle could be exposed to significant mechanical deformation during a road accident (Figure 2). Mechanical abuse techniques remain a widely accepted method for assessing the safety and abuse response of lithium-ion batteries/cells. However, changes in test conditions and even changes in cell construction can result in significantly different responses. Given the influence of these changes on the result of a mechanical test, it is important to understand how the results of standard test techniques can correlate with the safety of a given cell.
Due to the importance of understanding the failure behavior of lithium-ion batteries under mechanical abuse for the safety of electric vehicles, the failure behavior and mechanical properties of Lithium-ion Prismatic Batteries (LPB) under quasi-static and dynamic loads are investigated experimentally. For this purpose, a universal testing machine (2 mm/min) and a drop tower (1 m/s and 5 m/s) were used, respectively. The results show that the loading rate influences the failure behavior and mechanical properties of LPBs. The main failure behavior of the LPB under a cylindrical impactor acting in the X-direction is the fracture of the shell as well as the bulging of the jellyroll structure of the cell, while in the Y-direction, it is the wrinkling of the shell as well as the delamination and folding of the jellyroll structure.
The internal short-circuit of lithium-ion batteries could be triggered by the inevitable collision of the electric vehicle, posing serious threats to the safety and stability of the battery system. However, there is a lack of research on the internal short-circuit mechanism of lithium-ion batteries subjected to dynamic impact loads. There are studies [72] that define a coupled multi-physics model to describe the mechanical, electrical, and thermal response of this type of battery under dynamic loads. This model allows internal short-circuit occurrences to be predicted and analyses the evolution of the TR for different battery SoCs and for different impact energies. This model is only valid for small size batteries, and more research should be done to extend it to larger battery models.
In this study [49], three parameters are combined to describe the behavior of an internal short circuit in a lithium-ion battery under dynamic load. Voltage drop is the most intuitive for determining whether internal short-circuit occurs after the test, the magnitude of the voltage drop can be used to identify the internal short-circuit mode. Finally, strain is used as a criterion for triggering the internal short circuit in the battery model. On the other hand, the temperature can reflect the degree of danger involved. On the mechanical side, the maximum short-circuit deformation increases with impact energy and decreases with increasing SoC [72]. Comparing the effects of quasi-static and dynamic loading, it is observed that the short-circuit deformation when the battery is subjected to quasi-static loading is higher than when it is subjected to dynamic loading. The maximum TR temperature of a lithium-ion battery with 100% SoC in the drop-weight test (dynamic test) is 120 °C only, much lower than the temperature detected in the quasi-static compression test case. This is due to two key factors: the electrolyte jet and the chemical reaction time.
Most of the safety problems with lithium-ion batteries are due to mechanical failures, but their dynamic failure mechanism is still not very clear. In one study [73], a test-based computational battery model is established to analyze the mechanical response of the battery. Secondly, from this model, the dynamic response of the battery under different conditions is analyzed, factors such as end cap and battery SoC correlation are analyzed, also the failure behavior under high-speed load is analyzed. Future research will focus on dynamic impact testing using more mature and detailed numerical simulation models to study the mechanical behavior of batteries in a collision.
It should be noted that the energy released during the combustion of a lithium-ion cell is not the energy stored in the cell; there is an enhancement factor. Several studies conclude that the energy released in the combustion of lithium-ion batteries depends on several factors, such as: battery size and technology, state of charge, stored energy, and construction characteristics. A study conducted at the University of Science and Technology in Hefei (China) on the effect of state of charge on the TR of 18650 lithium-ion batteries [74] concludes that the energy released is increased by 2.5 times the energy stored in the battery. This study also concludes that as the SoC increases, the energy released also increases from 21.33 KJ for a new cell with a 25% SoC to 61.72 KJ for a new cell with a 100% SoC.
Another study carried out by the US Naval Research Laboratory [75] shows that depending on the material of the battery casing, it will contribute one or the other energy to the total combustion energy of the battery pack. Once the combustion energy has been adjusted for the casing material, it is concluded that the combustion energy usually has an increase factor of 6 with respect to the energy stored in the battery. Comparing the fire behavior of battery packs with different SoC states of charge [76], it is observed that gas venting, ignition, and material ejection occur earlier in the pack with higher SoC. In addition, the severity of ejection and combustion behavior worsens with increasing SoC, revealing that the battery pack with higher SoC has a higher fire behavior risk due to material instability.

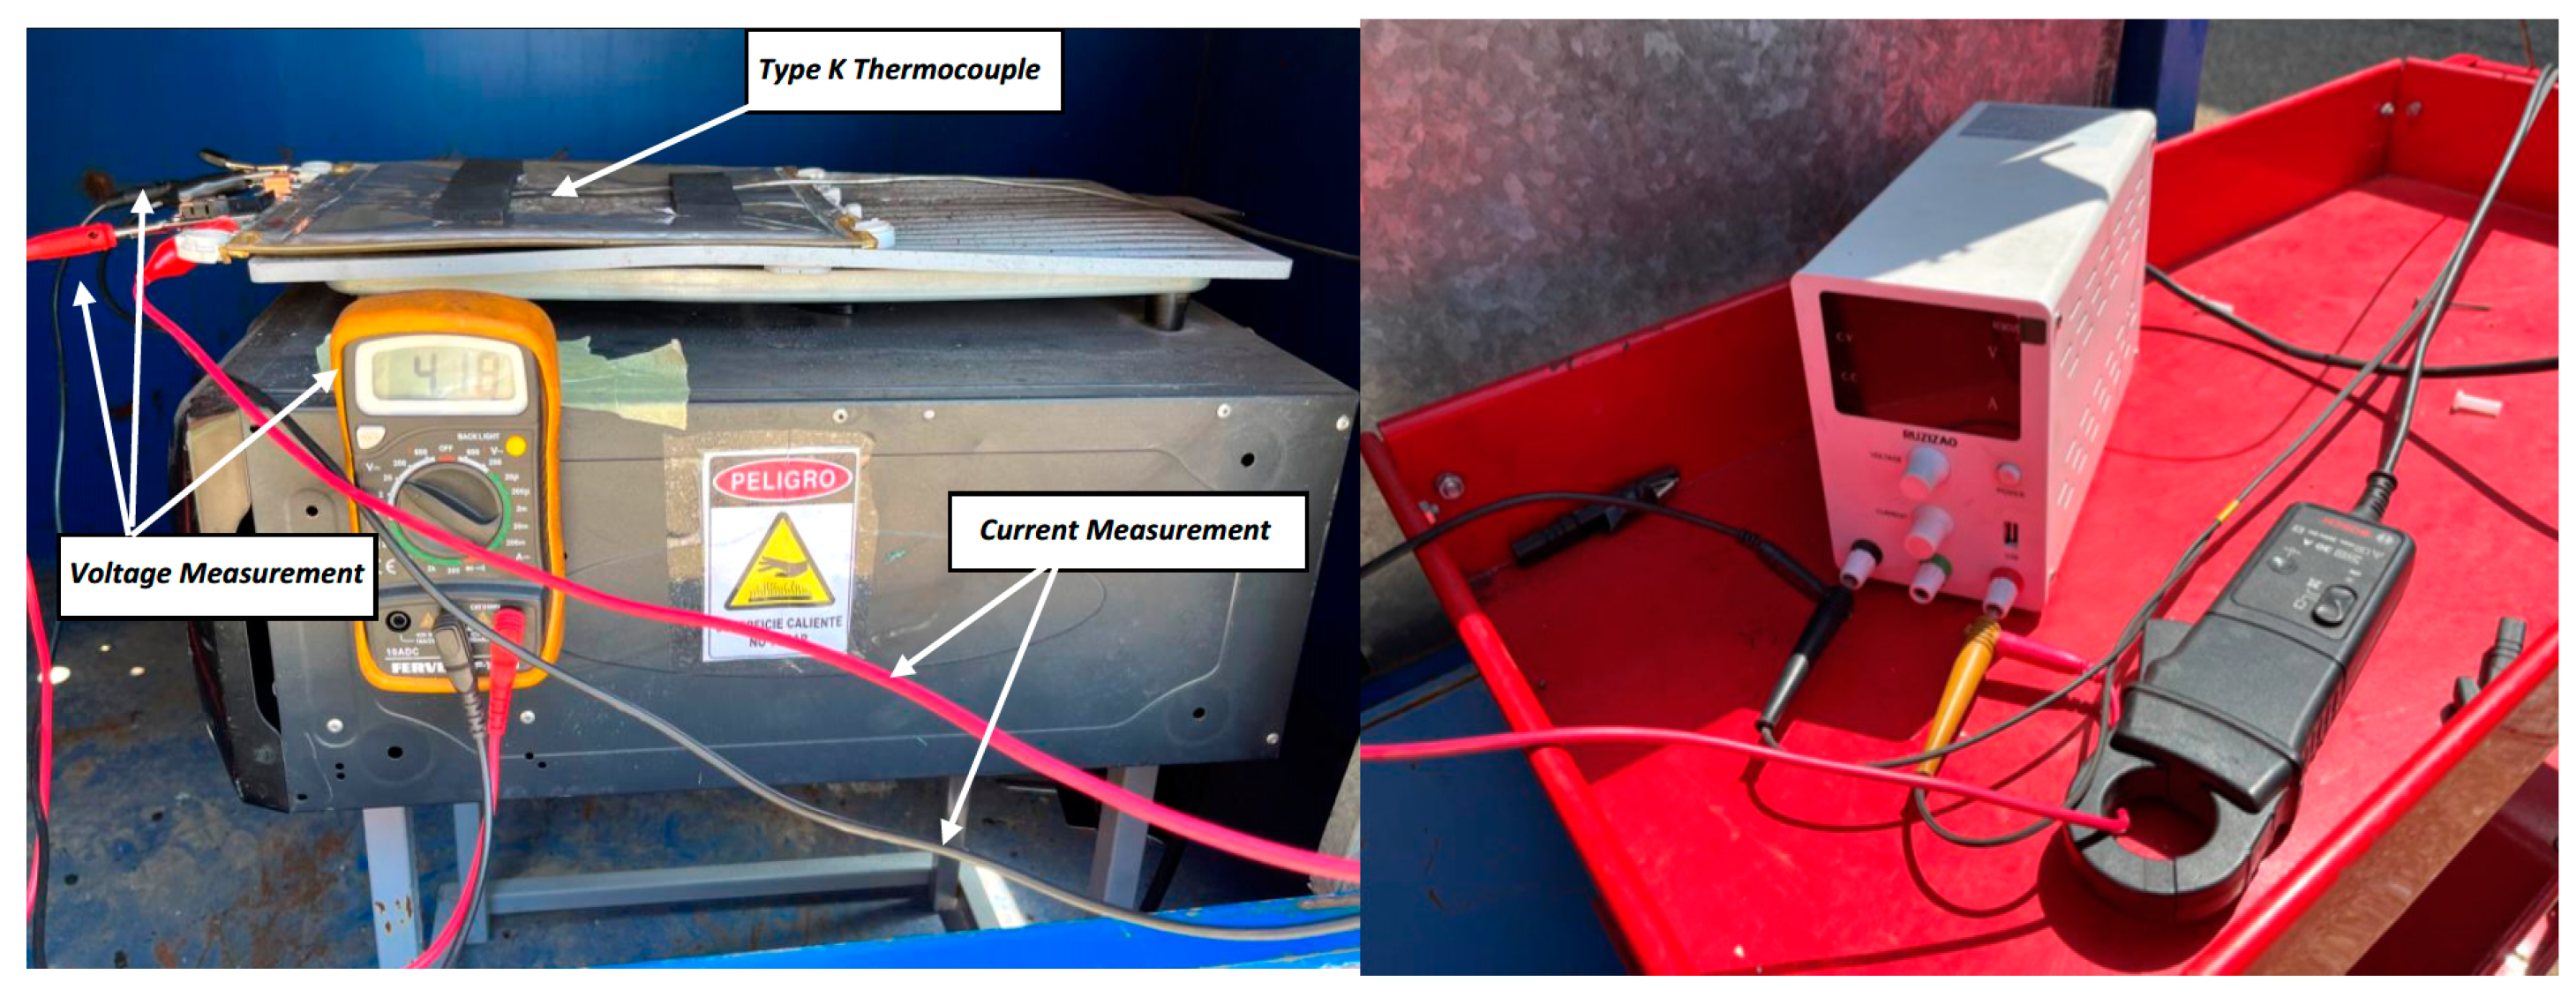
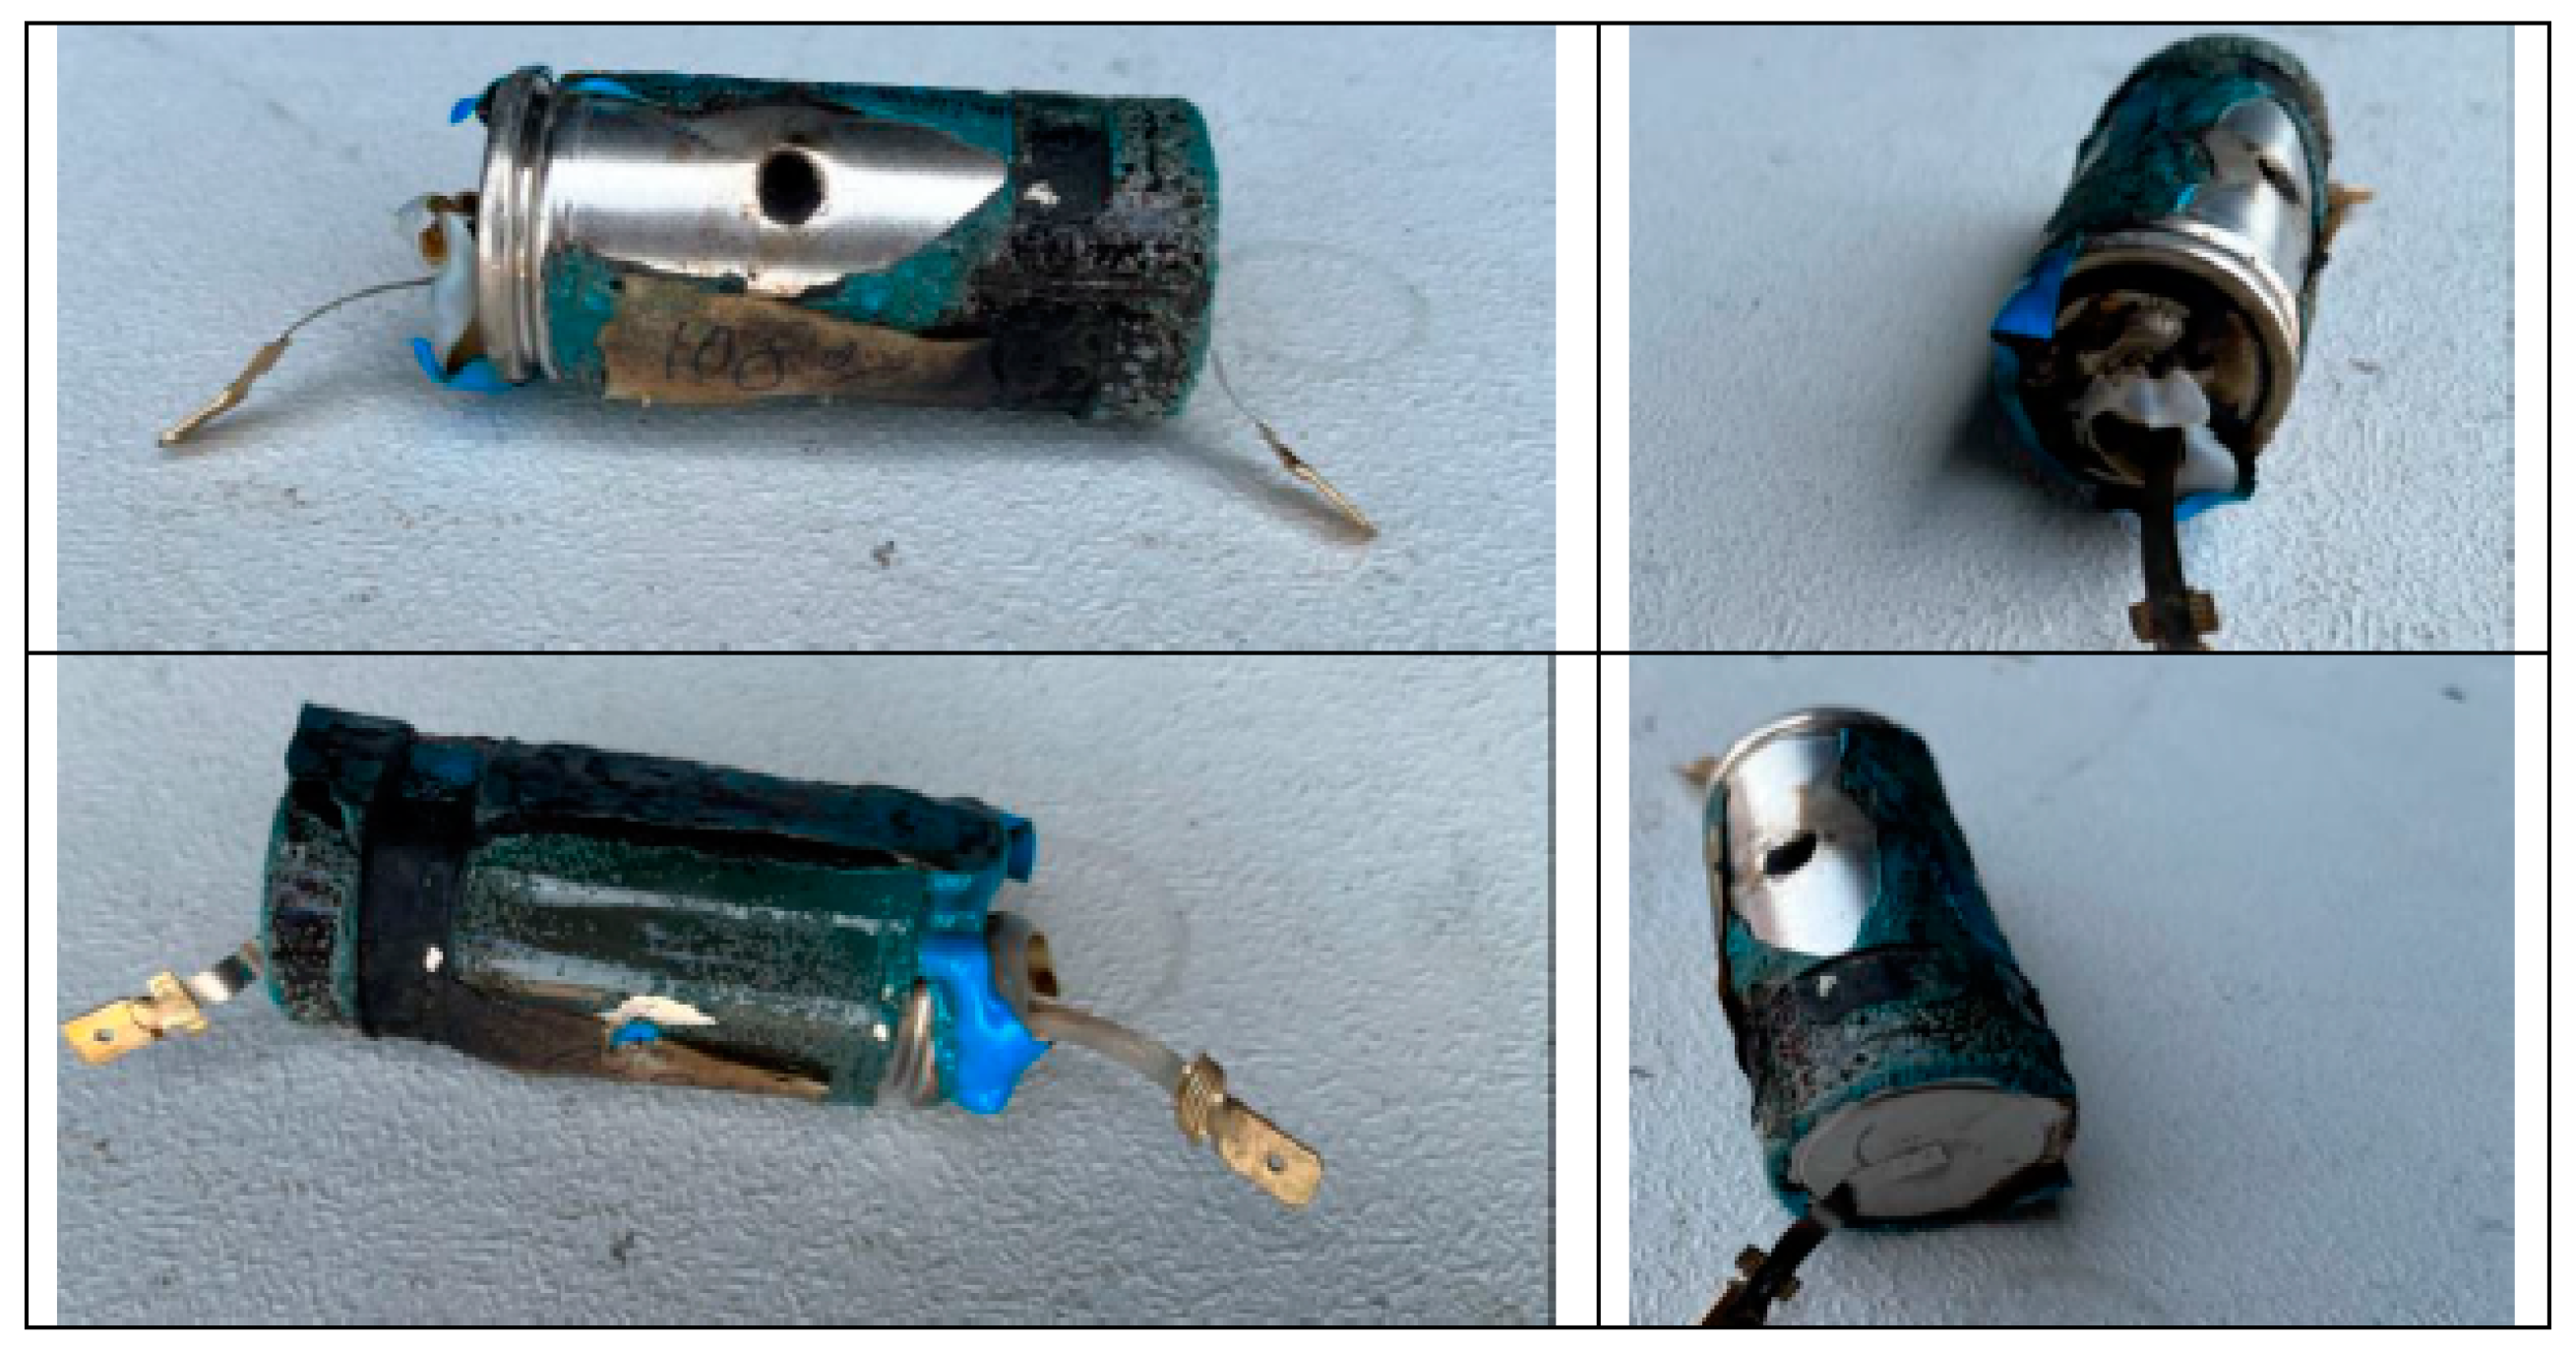
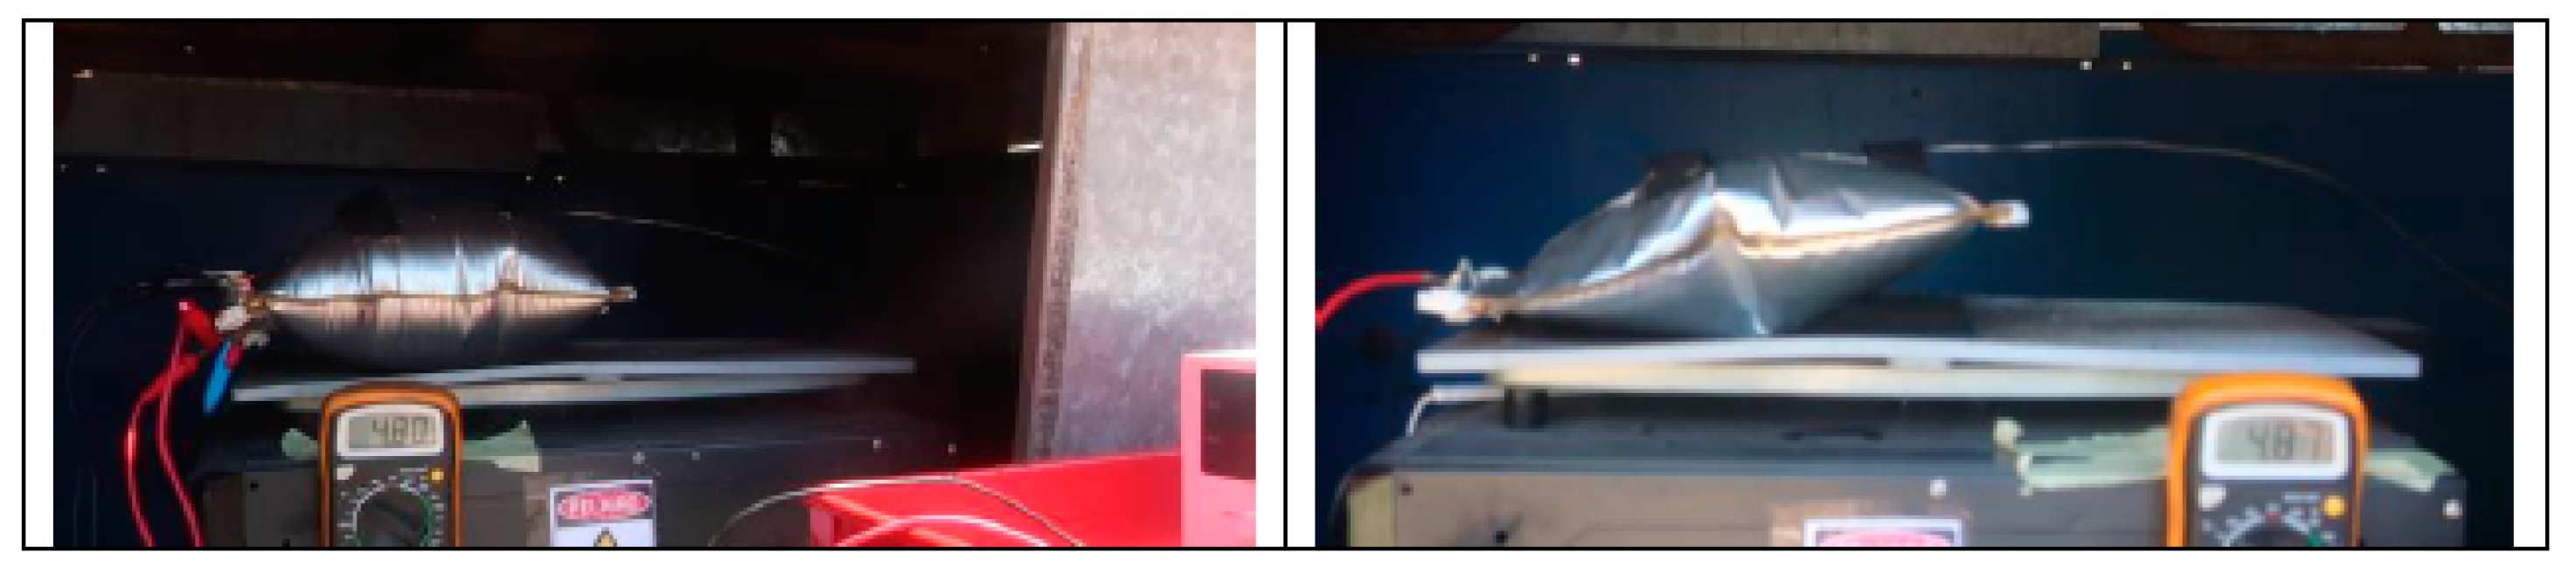
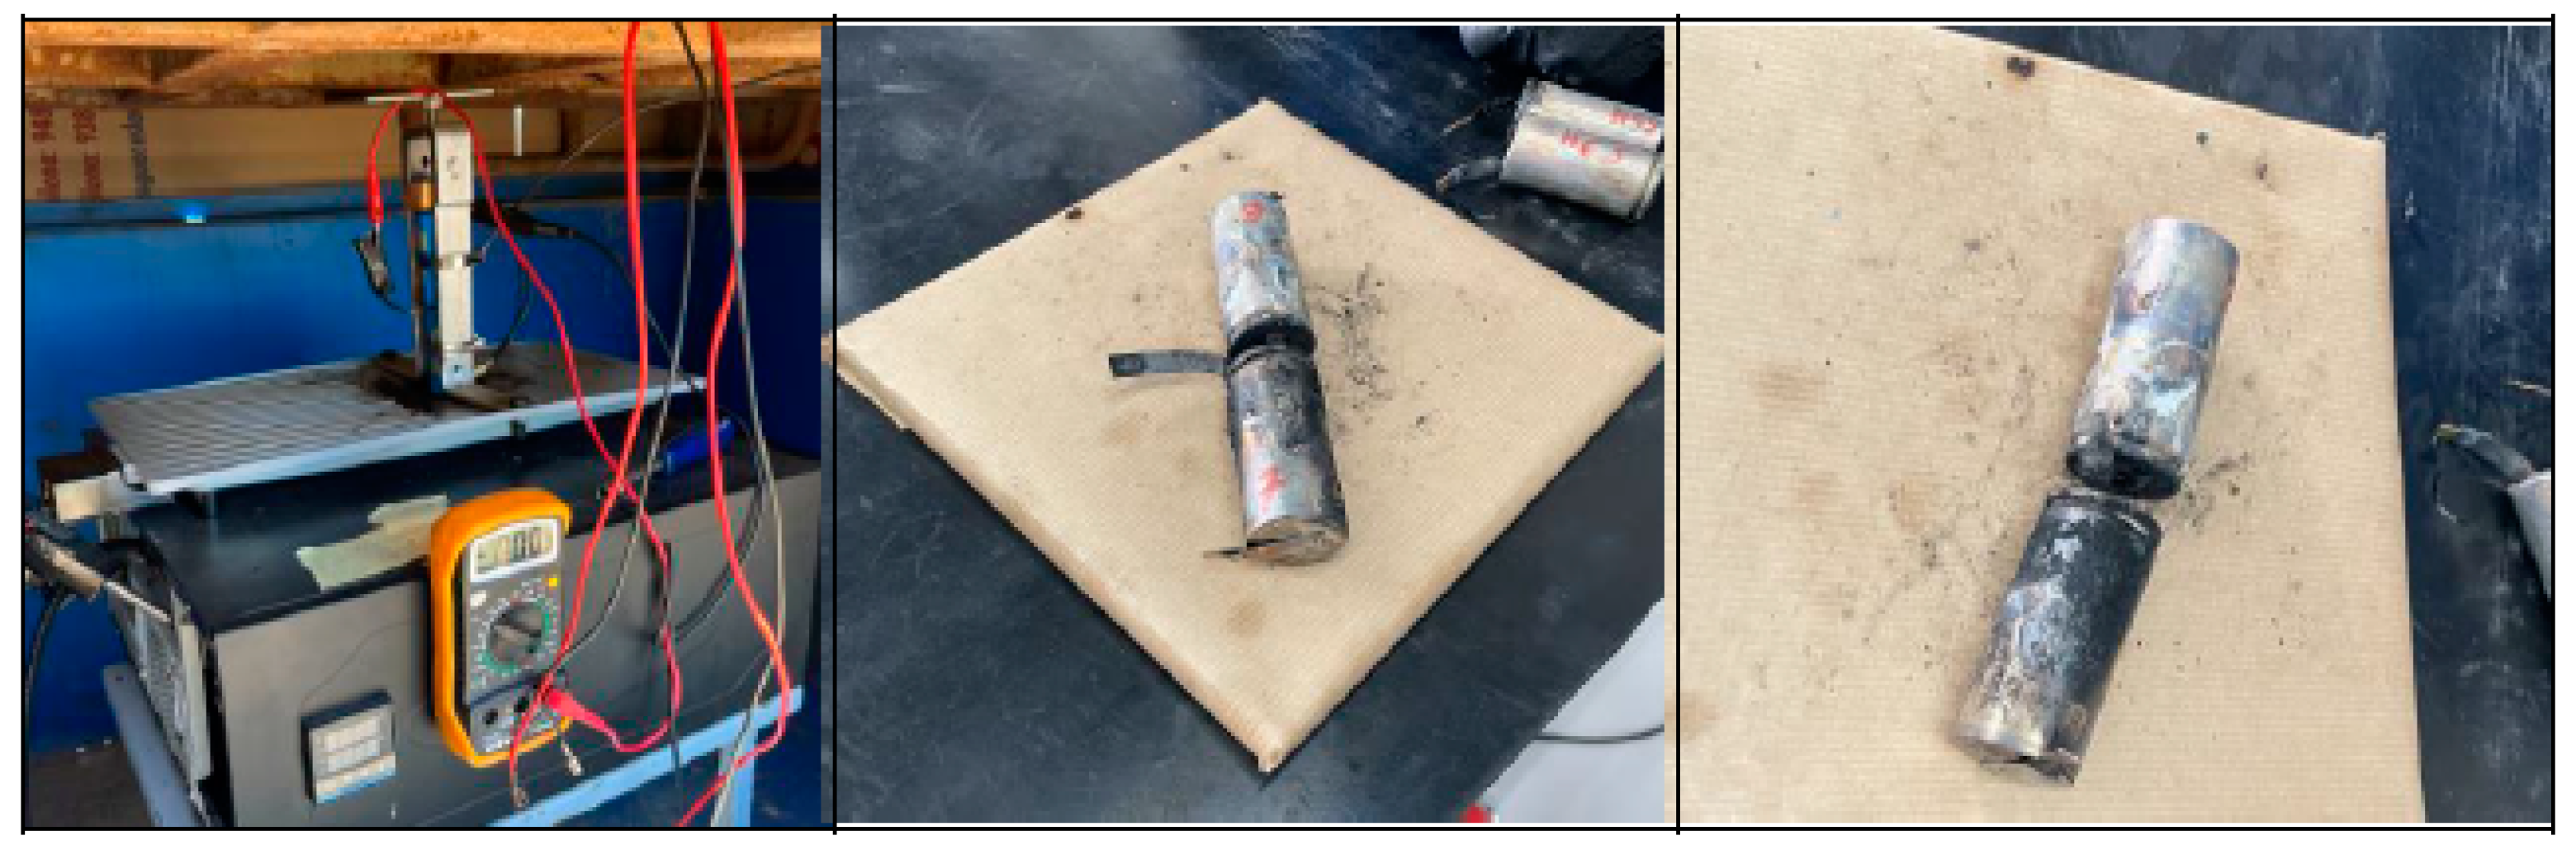
2.2. Electrical Abuse Test: Overcharge

In this type of test, the battery/cells are deliberately overcharged with a higher voltage level. As a result, the battery heats up until it rapidly enters a critical state, resulting in TR. The charging test is carried out by charging a cell with a direct current (DC) of I = 10 A (corresponds to 1/5.6C). A DC charger is used to carry out the overcharge, where 10 A is set as the supply data. The current, voltage and temperature will be measured throughout the test.
In this test, pouch cells with 100% load rate will be tested at different ambient temperatures (Table 3). It is expected that these tests will be extended in the future for different loading rates of these pouch cells. It should be borne in mind that the ambient temperature will vary as it is not controlled, because what we are trying to reproduce is a real overcharge condition of an electric vehicle.
When a cell is overcharged above 100% SOC, the cell is charged normally, as the electrodes are oversized, providing a safety margin [77]. Therefore, even if the voltage rises above the cut-off value no abnormal temperature increase is observed and a normal appearance is maintained. If the abuse conditions continue to move outside the safe ranges, then a series of unwanted reactions begin to occur between the internal components, which start to seriously compromise the safety of the battery. Continuous overcharging causes the delithiation of the cathode and lithiation of the anode beyond the safe operation limits of the electrode structures. Due to the excessive lithium intercalation, lithium plating occurs at the surface of the anode [78]. The metallic lithium reacts with the SEI layer and the electrolyte, resulting in increased heat generation [79]. In addition, the temperature increases more significantly because of electrolyte decomposition and oxidation [77], and the voltage of the cell increases faster due to the negative shift caused by lithium plating on the anode [80]. If the cell temperature reaches the onset temperature of the decomposition of the SEI layer, the decomposition and regeneration reactions occur simultaneously. The increasing rate of voltage slows down and even stops or becomes negative, producing a voltage plateau because of lithium consumption in the above reactions [80]. As a result of these reactions, gases are generated inside the cell. This causes it to swell and increases the distance between electrodes, which then increases the internal resistance. A rise in temperature may trigger the reactions identified in the overtemperature mechanism. However, the onset temperature of these reactions could be lower due to the instability of the electrodes because of the over-lithiation of the anode and delithiation of the cathode [81]. In this advanced state of overcharge, the cell voltage rises sharply to very high values because of a significant increase in resistance [77]. Consequently, internal short circuits may cause the cell voltage may drop and be reduced to 0 V. Finally, the occurrence of TR due to overcharging abuse leads to a more violent phenomenon, as the cell stores more energy to be released during the process, and a combination of several exothermic reactions takes place, involving the anode, cathode, and electrolyte [80].
The effect of the overcharge on the pouch cells tested will be analyzed by simulating their behavior in conditions where they can operate at ambient temperature and at a lower temperature. The aim is to analyze the behavior at room temperature of a pouch cell that fails due to overcharge since the behavior of lithium-ion batteries under adverse circumstances has been analyzed and is well known, but failures can also occur under normal conditions. For this reason, this test is performed while keeping the cell in its nominal operating temperature range. Figure 3 shows the set-up of the overcharge test carried out.
Nissan Leaf AESC cells (40 kWh) with a nominal capacity of 56.3 Ah will be tested. These cells have a medium-high capacity, so an overcharge failure can have significant consequences due to the high energy density of the cell.
The cathode of this type of cell is made of NMC 523 (LiNi0,50Mn0,20Co0,30O2) and the anode is composed of carbon/graphite. The nominal voltage of the cell is 3.65 V with a maximum charge voltage (DC-CV) of 4.2 V. It will be charged at 10 A, as indicated, which corresponds to 1/5.6 C, where C is the nominal capacity, in this case 56.3 Ah.
The controlled overcharge test consists of charging the cell with a constant current (DC) of 10 A up to 5.9 V with a current source, exceeding the maximum value indicated by the manufacturer of 4.2 V. During the test, the ambient temperature was measured, and the cell temperature was also measured using a type K thermocouple (Type K thermocouple AISI 310 Stainless Steel Sheath), which withstands temperature values of up to 1100 °C punctual and 1050 °C sustained, placed in the center of the cell. Voltage was measured by connecting the equipment to the cell terminals and determining the current measurement.
It should be noted that different studies [82] indicate that, in the case of cycling between extreme SoC levels, overdischarge and overcharge are the factors that contribute most to battery degradation; therefore, in future lines of research, these tests will be repeated on different SoCs to analyze how the state of charge influences overcharge abuse at different ambient temperatures.

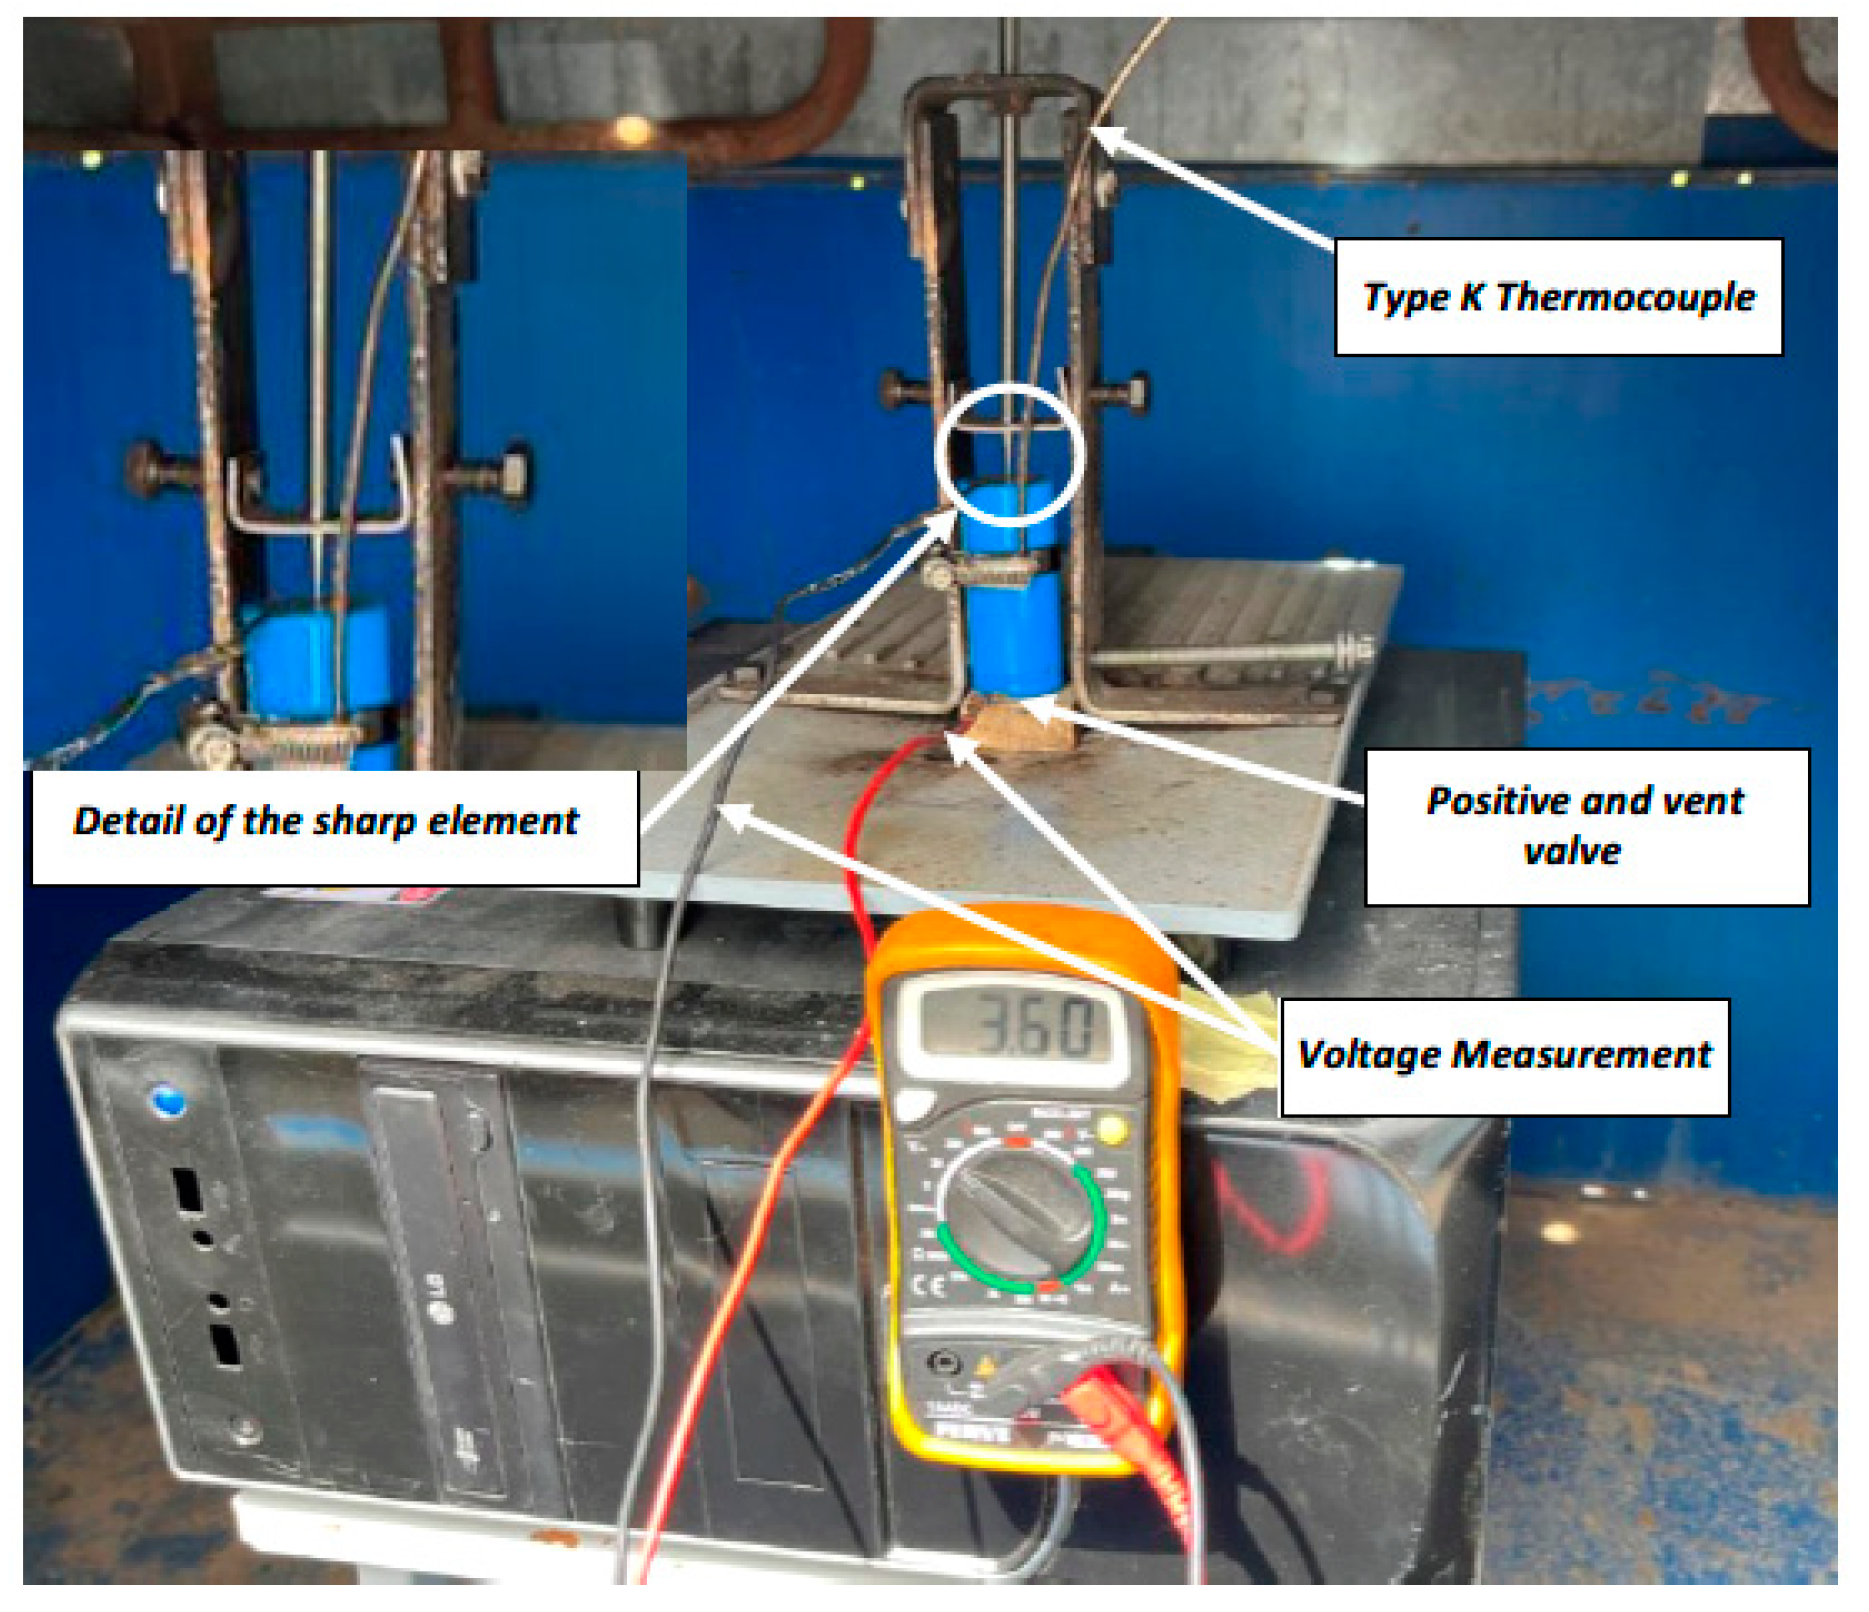
2.3. Thermal Abuse Test: Heating

During thermal tests, batteries/cells are subjected to ambient temperatures, either at low temperatures or at elevated temperatures, and tests performed at elevated temperatures in particular, lead to a TR in most cases. To perform heating tests, one of the tested cells will be instrumented in such a way that maximum information on the behavior of the cells can be obtained. For this purpose, type K thermocouples (Type K Thermocouple AISI 310 Stainless Steel Sheath), which withstand temperature values of up to 1100 °C punctual and 1050 °C sustained, are fixed to the cells on the outside of their casing or enclosure.
The cells are heated using an electric iron instrumented with a PID (proportional integral derivative control) thermostat. A thermographic camera will also be used to monitor the T of the cells, as well as a voltmeter that will indicate when the cell voltage drops, indicating that the cell is no longer functioning properly and that the TR reaction may have begun. It should be borne in mind that, as the cells are joined together to carry out the test, they are not a purchased module and therefore do not have a BMS to manage the behavior of the group of cells. Below is an image (Figure 4) of the equipment used to heat the cells.
Table 4 shows a summary of the test conditions and results obtained.

3. Results

In this section, we will analyze the results obtained in each of the tests carried out on the cells under study.

3.1. Mechanical Abuse Test Results

The results of the mechanical abuse tests carried out are shown below (Table 5).
The results obtained in each of the tests will be analyzed in depth to draw conclusions.

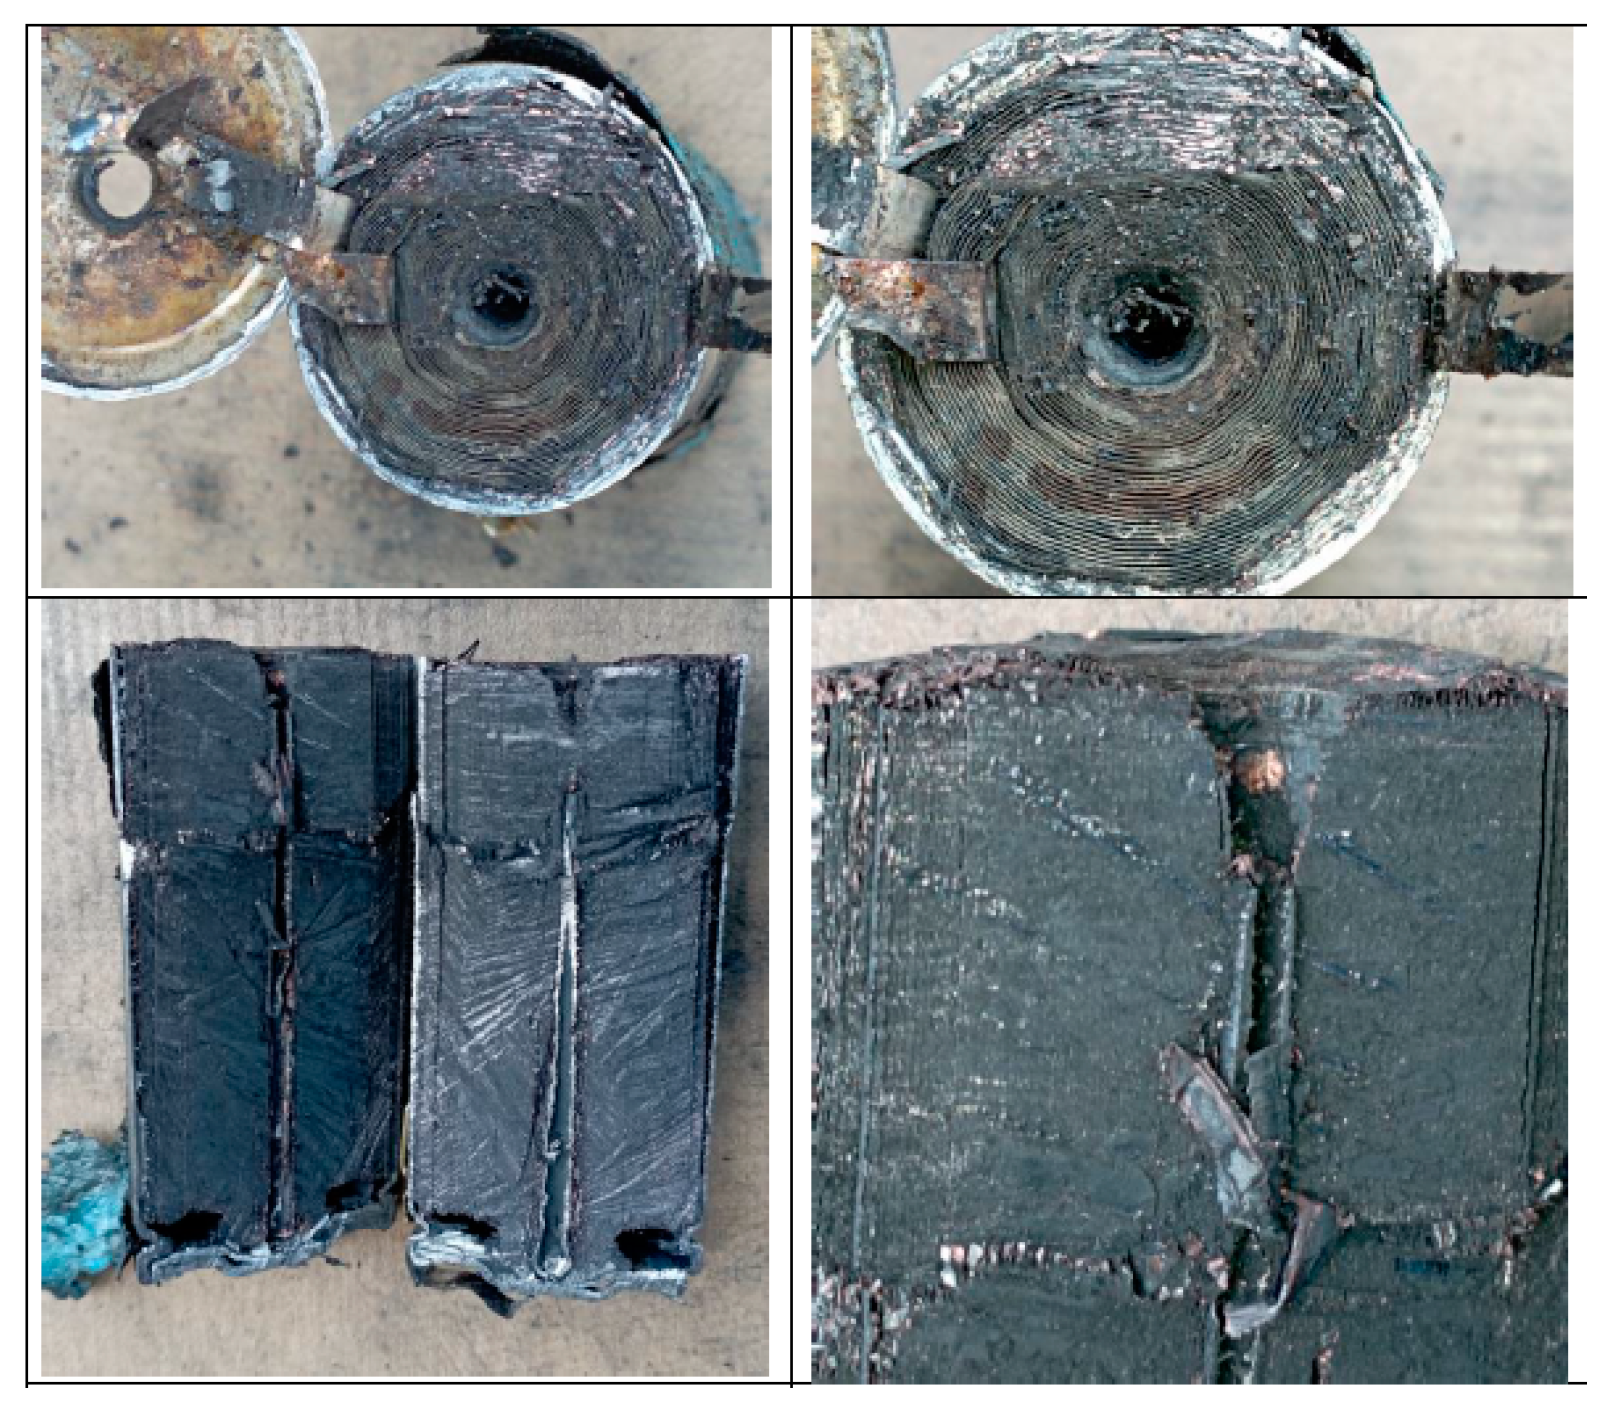
3.1.1. Test 1: Horizontal SoC 100% (Cell A)

The test is carried out on a 32700 cylindrical cell in a horizontal arrangement with an SoC of 100%. A type K thermocouple is placed on the cell to measure its temperature, and a voltmeter is used to measure the voltage during the test. A tool has been prepared to pierce the cell horizontally (perpendicular to the longitudinal axis of the cylindrical cell) with a sharp tool; the Figure 5 shows the test set-up.
Images of the state of cell A after the perforation test in the direction perpendicular to its longitudinal axis are shown below (Figure 6).
During the penetration test, where a rod penetrated the cell perpendicular to its longitudinal axis, it was observed that a certain penetration of the rod into the cell is necessary to trigger theTR process. The venting of the cell occurred through the vent valve located at the positive pole of the cell. It can be concluded that significant damage to the competent cell internals is necessary to trigger the TR process.
The cell reached a maximum temperature of 261 °C; when compared to other studies carried out on NMC cells [69], it is observed that the maximum temperature peak is lower in the case of LFP cells (tested) than in the case of NMC cells. In the following graph (Figure 7), the temperature reached by the A cell as well as the voltage behaviour is observed.
In Figure 7, when the TR process starts to occur, the voltage starts to drop, but not abruptly; at that point, a small voltage rise is visible which corresponds to a second event, followed by a drop to 0 V. This is identified by a more violent exit of the gases and the electrolyte. This small voltage peak also corresponds to a change in the slope of the cell temperature curve. The voltage drop is due to delamination of the electrodes. After the voltage drop, a temperature rise occurs as the rate of heat production is greater than the rate of release. Figure 7 shows that the short-circuit is not as abrupt as in the case of NMC lithium-ion batteries [82].
Below is an image (Figure 8) of the sectioned cell after undergoing the test, in which a significant perforation of the cell can be seen before the short-circuit occurs, as well as considerable damage to the electrodes in the perforation. It can also be observed that the central part of this type of cell is solid; in other types of cells, such as LG 2200 mAh cells, model ICR18650 S3, this space is empty.
In Figure 8, the image of the cell (left) shows significant damage to the electrode as a whole, with no collapse of the central cavity because it is solid. The detailed image of the perforation point (right) shows significant damage to the electrodes leading to the short circuit. No molten particles of the electrode materials are observed as the melting temperature of the aluminium (660 °C) and copper (1080 °C) is higher than the maximum temperature reached by the cell during the TR process.
Images of the test are shown in Figure 9, corresponding to the events identified as most significant during the mechanical abuse test carried out. Until the cell is perforated by a few millimeters, the effects of TR do not begin, even if the puncture is evident; it can be concluded that damage must take place of a certain level on the internal components of the cell (electrodes) for the short-circuit to occur. Venting of the cell gases takes place through the vent valve located on the positive pole. The generation of gases is due to reactions and evaporation of part of the electrolyte. After vapor venting, electrolyte venting is observed. In the case of the LFP cell analyzed, as the maximum temperature reached is lower than the melting temperature of the cathode aluminum, no traces of the cathode aluminum are observed.
Figure 9 shows how two distinct events are identified (also visible in Figure 7), and there is a total discharge of the cell at the end of the event, leaving it at 0 V.

3.1.2. Test 2: Horizontal SoC 50% (Cell D)

The test is carried out on a 32700 cylindrical cell in a horizontal arrangement with an SoC of 50%. As in the previous tests, a type K thermocouple is placed on the cell to measure its temperature, and a voltmeter is used to measure the voltage during the test. The cell is perforated in a direction perpendicular to its longitudinal axis with a sharp element.
Below are images of the state of cell D after the perforation test (Figure 10).
During the penetration test, it was observed that some penetration was required to trigger the TR process. It is concluded that cell D (SoC 50%) was less damaged than cell A (SoC 100%) when subjected to the same perforation test in the direction perpendicular to its longitudinal axis. In the case of cell D, the positive pole where the vent valve is located is hardly damaged, so it can be concluded that there is little or no gas volume coming out of the vent valve.
Cell D (SoC 50%) reached a maximum temperature of 118.26 °C, well below the 261 °C reached in the case of cell A (SoC 100%). The following graph (Figure 11) shows the temperature reached by cell D as well as the voltage behavior.
At first, there is a sharp voltage drop, but later, the voltage drop is gentler and causes a thermal runaway accompanied by venting of hot vapors through the vent valve at the positive pole of the cell, and electrolyte leakage was not observed. The voltage drop was not abrupt because the rod needed to be tapped several times before it penetrated far enough to produce the short circuit. When the short circuit occurs, the temperature rises more rapidly, indicating that TR occurs. In this case, the cell voltage does not reach 0 V, but remains at 0.45 V.
Figure 12 shows the cell sectioned after the test, in which a significant perforation of the cell can be observed before the short circuit occurred. However, there is no major damage to the electrodes, and the cell is not burnt.
In this case, the perforation is identified, but no major damage to the electrodes is observed other than what was caused by the perforation. Also, in this case, no remnants of the melted electrode material are observed.
In Figure 13, there are images from the test that correspond to the events identified as most significant during the mechanical abuse test carried out. Figure 13 shows that the events experienced by cell D are less intense than those experienced by cell A, and no electrolyte leakage occurred. It can therefore be concluded that cell D (SoC 50%) experiences milder exothermic reactions than those experienced by cell A (SoC 100%) when subjected to the same perforation test in a direction perpendicular to its longitudinal axis, so it can be stated that, given the same mechanical abuse by horizontal perforation, the behavior of the more heavily loaded cells will be more dangerous.

3.1.3. Test 2: Vertical SoC 100% (Cell C)

The test is performed on a 32700 cylindrical cell in vertical arrangement (with the vent valve at the bottom) with an SoC of 100%. As in the previous tests, a type K thermocouple is placed on the cell to measure its temperature, and a voltmeter is used to measure the voltage during the test. The cell is performed in the direction of its longitudinal axis with a sharp element; Figure 14 shows the set-up of the test.
In this test, a block of wood is placed to prevent the positive pole of the cell from short-circuiting with the cell, since the upper part of the cell is the negative pole and the rod with which it is perforated is also negatively charged. If the positive pole were to come into contact with the metal plate, a short-circuit would occur, since the plate would be negatively charged when it comes into contact with the cell casing (also negative). The following pictures (Figure 15) show the state of cell C after the perforation test.
During the penetration test, it was observed that some penetration was necessary to trigger the TR process. The venting of the cell took place through the cell vent valve located at the positive pole of the cell, which in this case is located at the bottom (depending on the arrangement of the cell during the test). It can be concluded that significant damage to the competent internals of the cell is necessary for failure to occur.
The cell reached a maximum temperature of 326.95 °C. Figure 16 shows the temperature reached by cell C, as well as the voltage behavior. The voltage drops to 2.43 V immediately after the cell being hit, but then rises again before the first explosion. The voltage then drops until it explodes again. Thermal Runaway occurs, and the voltage drops to 0 V as the temperature rises. In this test it can be clearly seen how the gases come out of the lower part of the cell (according to the layout of the test) where the vent valve is located.
The following images (Figure 17) show the state of the cell after the test. The first images show the state in the upper part (negative pole), where the cell is perforated. While the rest of images show the state of the cell in longitudinal direction, in which the damage produced by the perforation can be observed, as well as the state of calcination of the cell. Damage can also be seen in the transverse direction of the cell, but this was probably caused by the device used to hold the cell in place so that it would not move during the test.
Figure 18 shows the events identified as most significant during the mechanical abuse test.

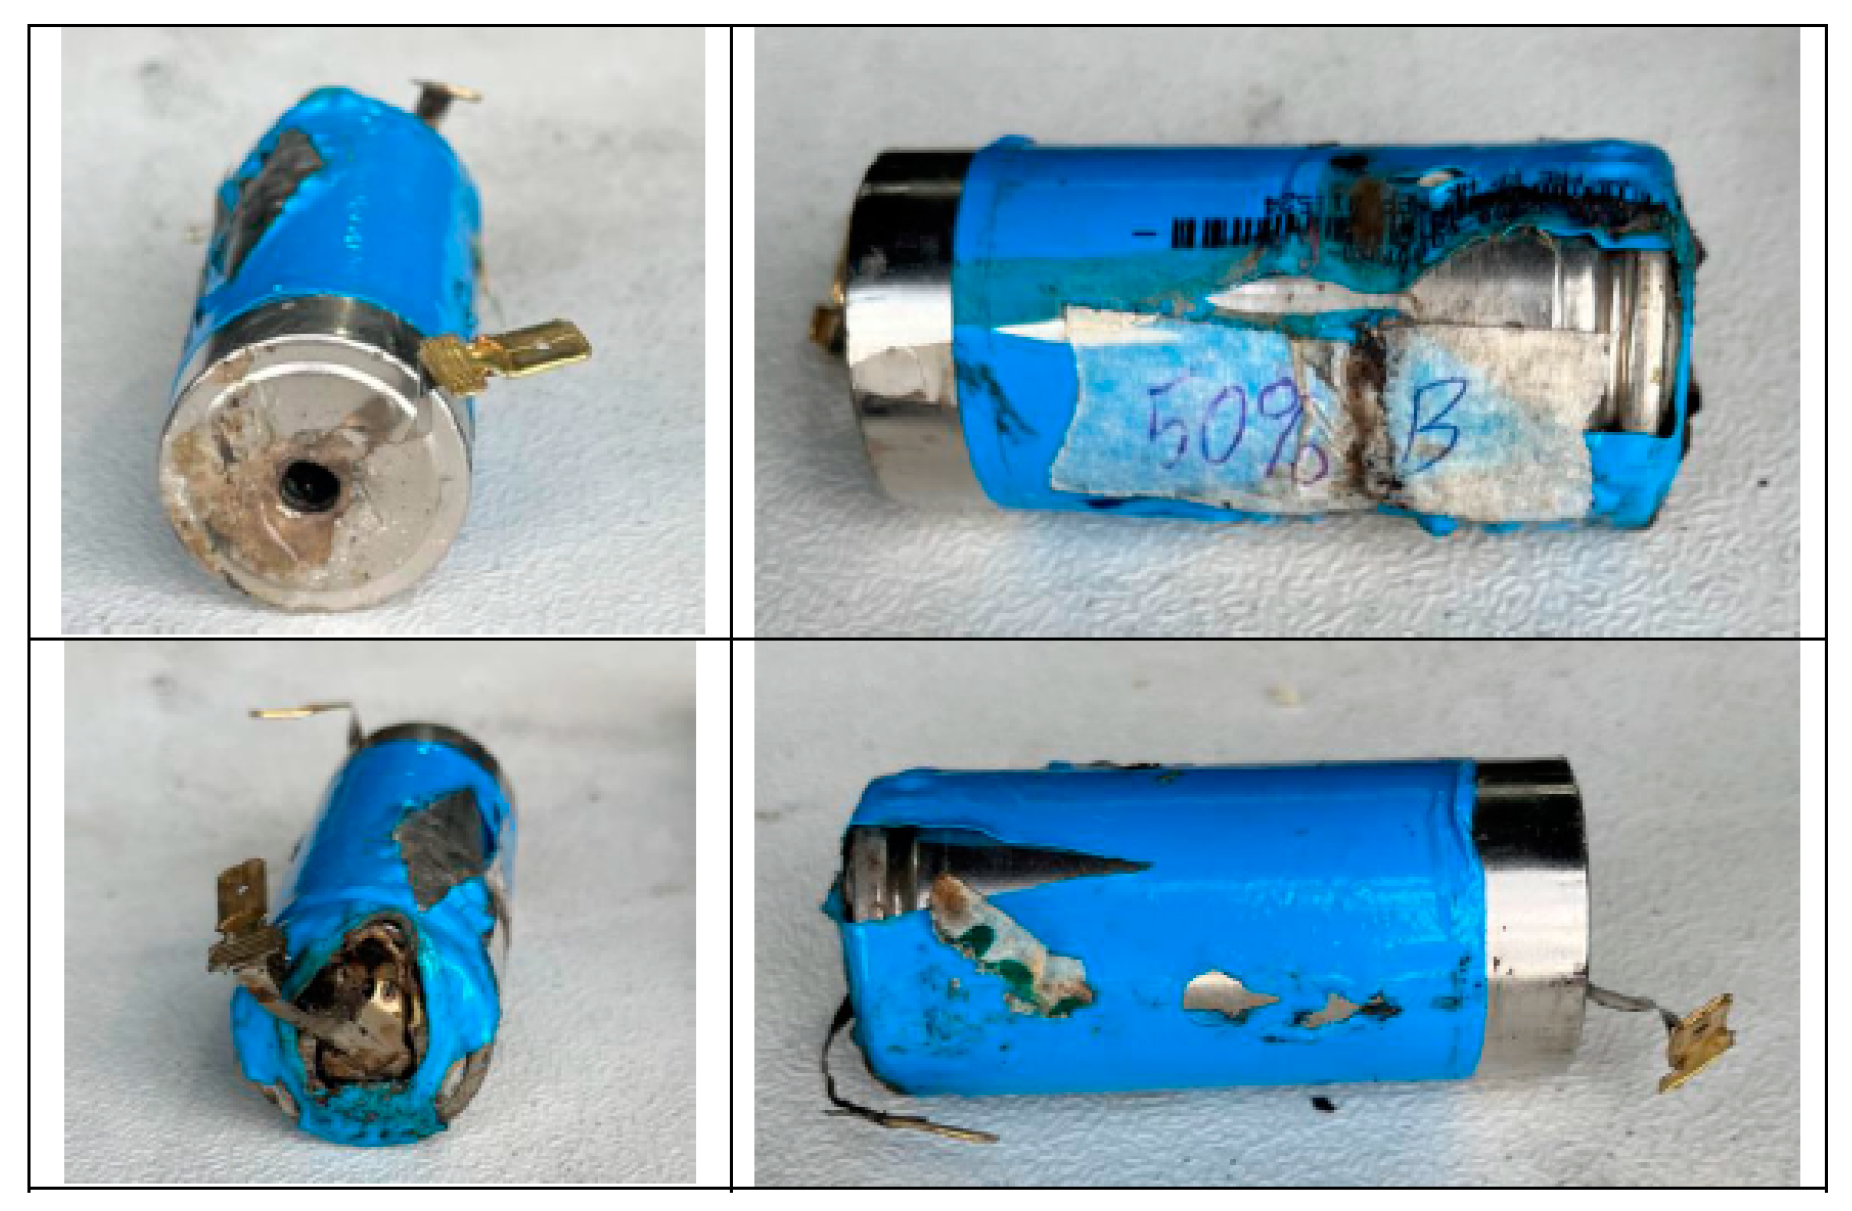
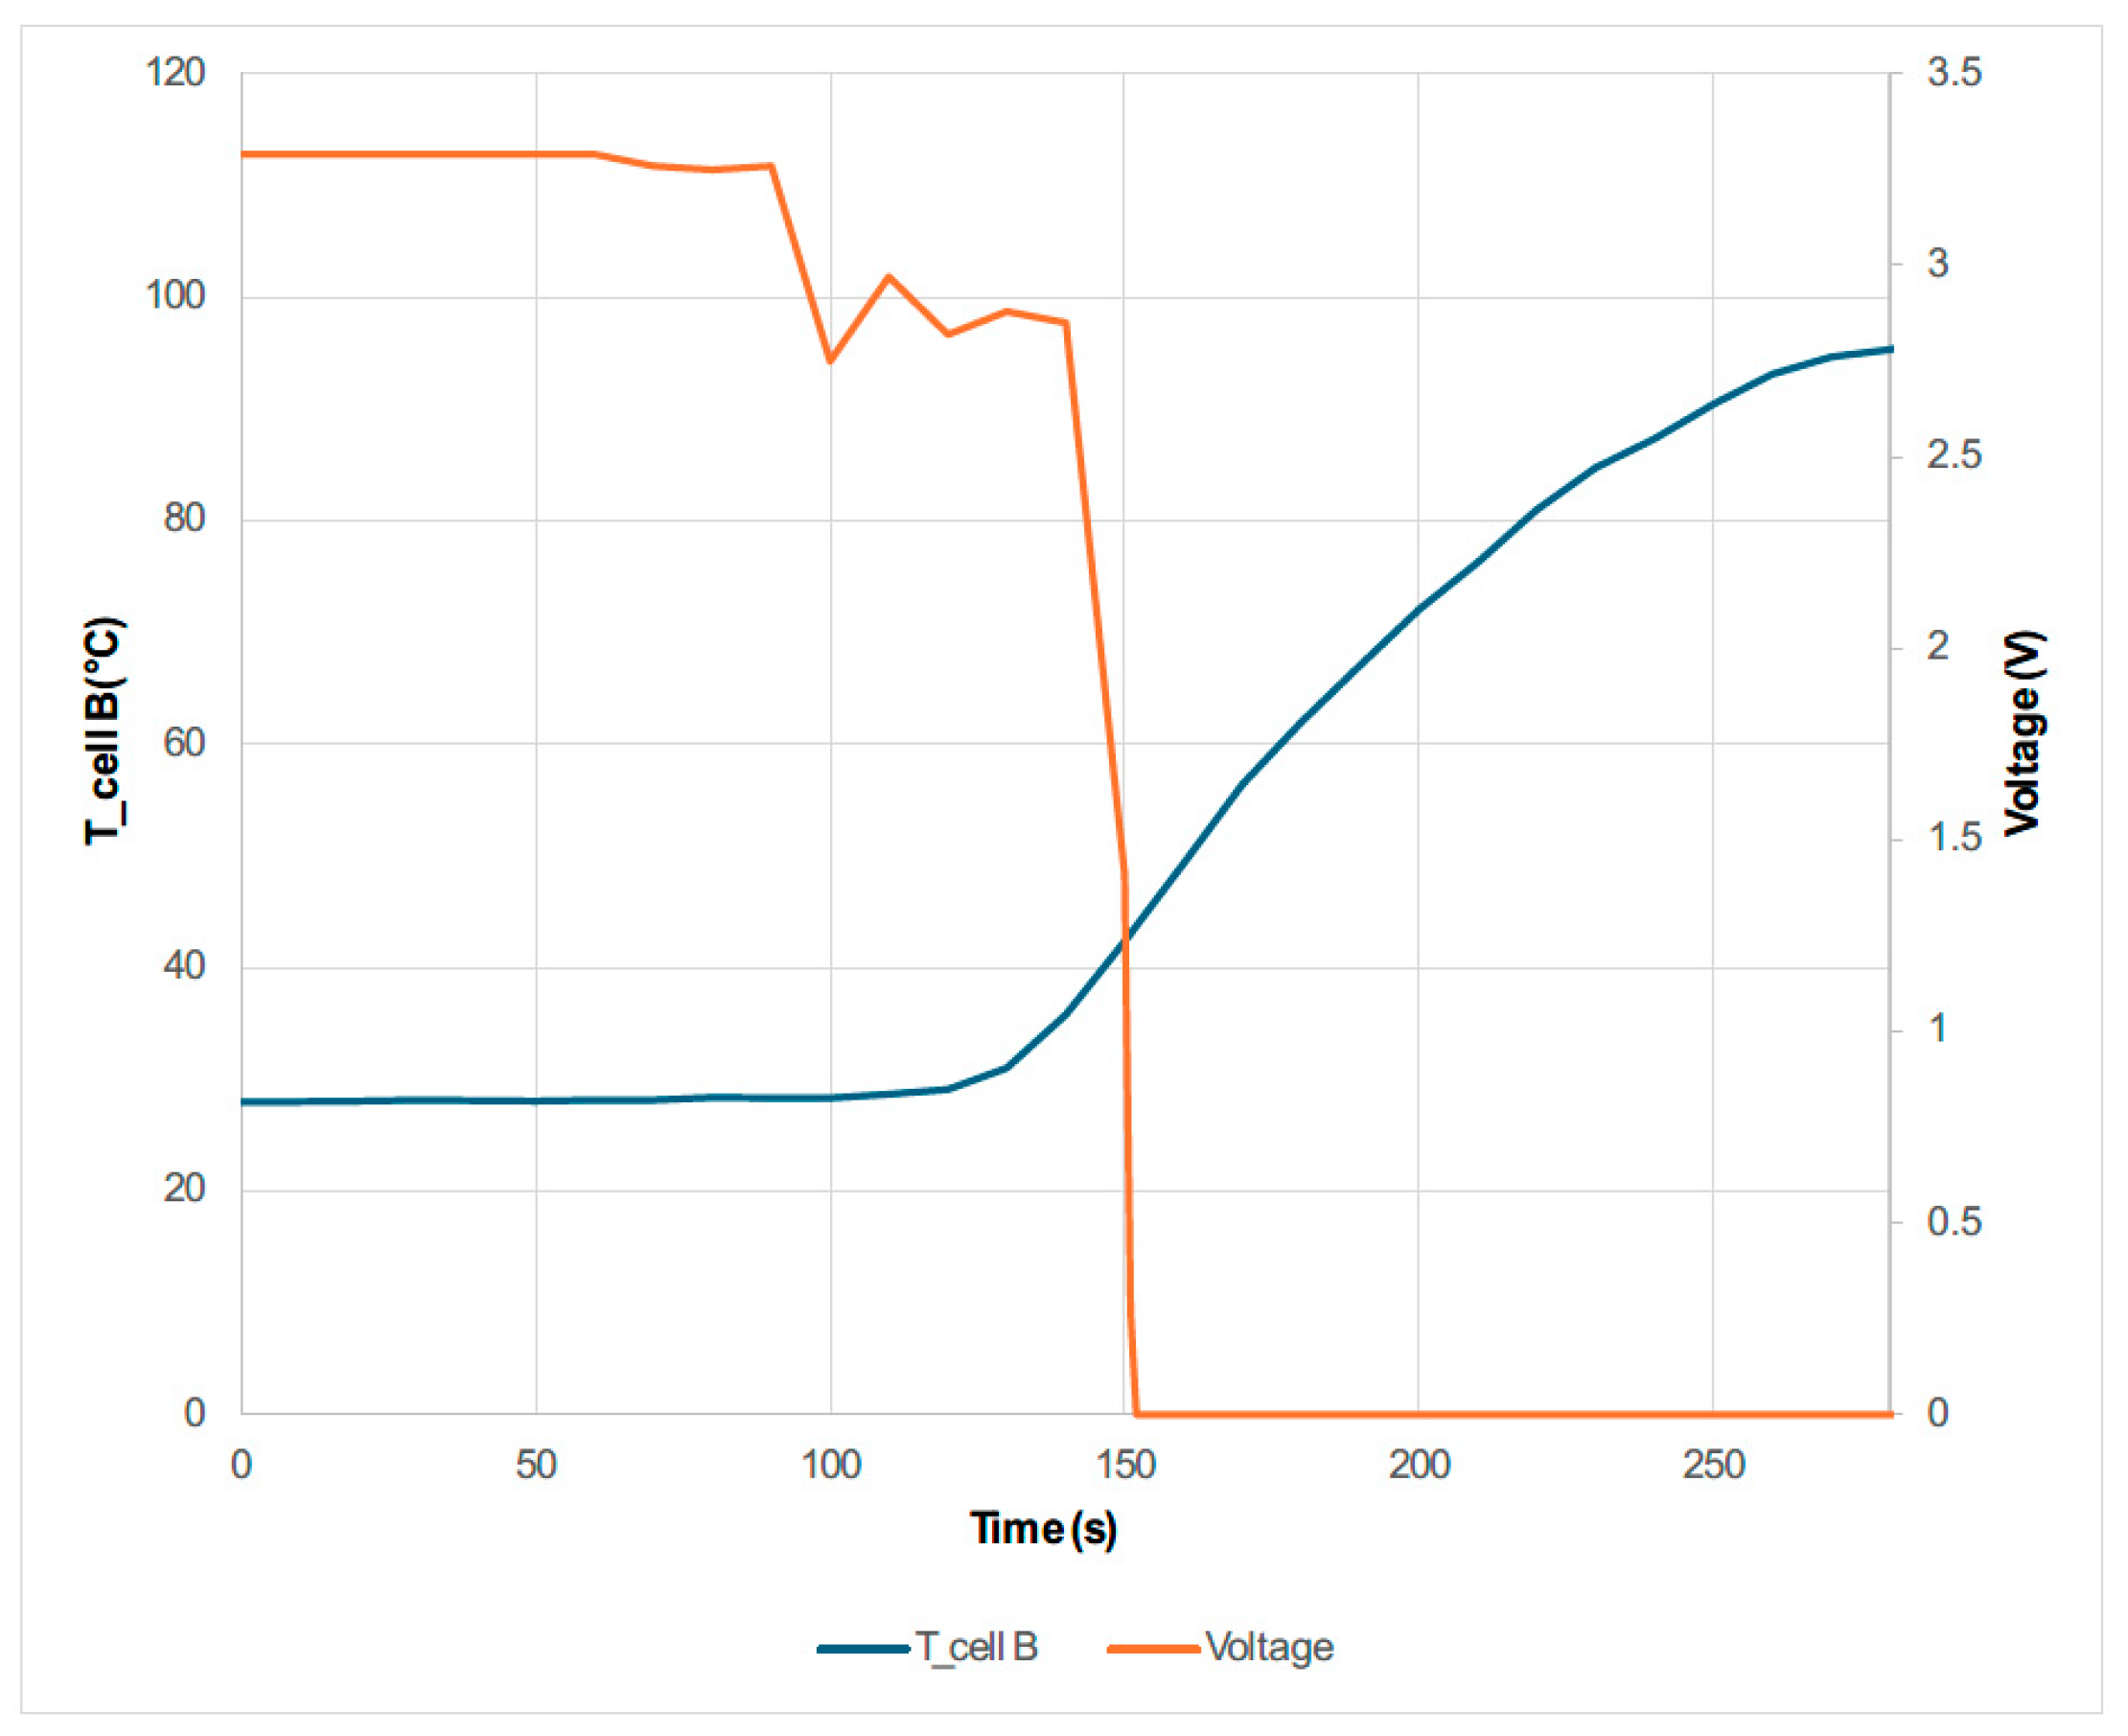
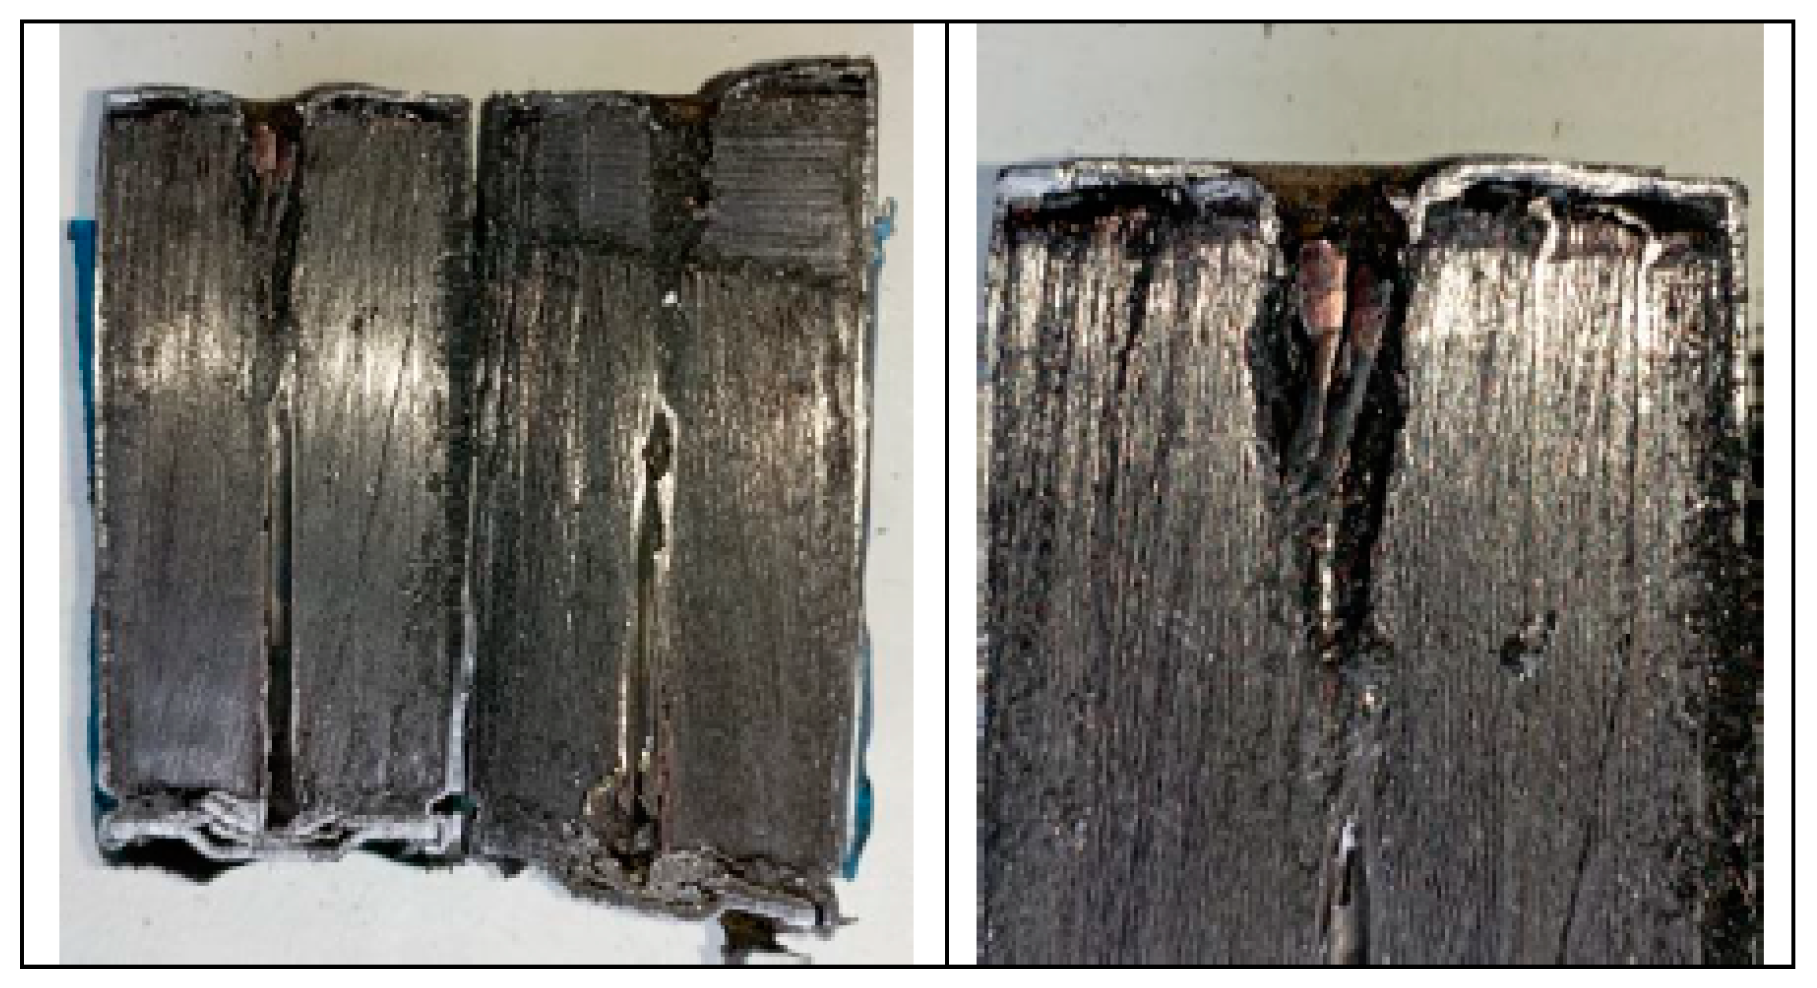
3.1.4. Test 4: Vertical SoC 50% (Cell B)

The test is performed on a 32700 cylindrical cell in vertical arrangement (with the vent valve at the bottom) with an SoC of 50%. As in the previous tests, a type K thermocouple is placed on the cell to measure its temperature, and a voltmeter is used to measure the voltage during the test. The cell is perforated in the direction of its longitudinal axis with a sharp element.
Below are images of the state of cell B after the perforation test (Figure 19).
In this penetration test, the cell with an SoC of 50%. It was observed that it was also necessary to penetrate the cell with an SoC of 50%, and that some penetration was necessary to trigger the TR process. The venting of the cell occurred through the cell vent valve located at the positive pole of the cell. It can be concluded that major damage to the competent cell internals is necessary for the failure to occur.
The cell reached a maximum temperature of 98.39 °C, which is much lower than the maximum temperature reached by cell C with 100% SoC (326.95 °C), which was subjected to the same test. Figure 20 shows the temperature reached by cell B as well as the voltage behavior.
As Figure 20 shows, when the TR process starts to occur, the voltage begins to fall, with no subsequent voltage rise until it reaches 0 V.
Figure 21 shows longitudinal images of the state of the cell after the test; both the damage produced by the perforation and the state of the electrodes can be observed. The damage is less than in the case of cell C (SoC 100% and perforated in the direction of the longitudinal axis of the cell), with more pronounced damage on the outside of the inner zone. Damage can also be seen in the transverse direction of the cell, as in the case of cell C, but this has probably been caused by the device used to hold the cell in place so that it did not move during the test. The images show that the copper collector of the anode is be less damaged than cell C after testing. No melted particles from the electrode materials are visible. The picture on the right shows the perforation point, and damage to the electrodes which led to the short-circuit can be observed. Figure 22 shows the events identified as most significant during the mechanical abuse test:
During this test, it is observed that the outflow of gases and electrolyte leakage takes place at the top, i.e., the area where the perforation takes place, instead of through the vent valve. In all the other mechanical abuse tests, the outflow of gases and electrolyte took place through the vent valve. It is observed that, in the case of perforation in the direction of the longitudinal axis when SoC 50%, the events experienced are less intense than in the case where the cell was charged to 100% (SoC 100%). To analyze the condition of the cells after the tests, the internal resistance of the cells was also measured before and after the test, and the following results were obtained (Table 6).
Table 6 shows that the cell with the highest final resistance after the test and the highest ΔDCIR (mΩ) is cell C, so only by measuring the internal resistance can we state that the cell that suffers the most damage and is the most degraded and deteriorated is the cell in test 3, i.e., cell C, which had a load state of 100% and was subjected to a perforation test in the direction of its longitudinal axis, in the area of the negative pole. The cell with the lowest internal resistance after the test and the lowest ΔDCIR (mΩ) was cell D, which was subjected to a perforation test in a direction perpendicular to the longitudinal axis of the cell, with a state of charge of 50%; it was the cell that suffered the least damage.
To complete the analysis, a qualitative comparison of the final state of the cells after the test is carried out, as shown in Figure 23. By analyzing the final state of the cells in their external area, it can be qualitatively concluded that the cells most affected are those with 100% state of charge, so the charge state is one of the most influential factors for producing Thermal Runaway after mechanical abuse by perforation. Regarding the area where the perforation is performed (in the direction perpendicular to the cell longitudinal axis or in the direction of the cell longitudinal axis), after analyzing the final state of the cells externally and internally (Figure 23 and Figure 24), as well as the maximum temperature reached after the Thermal Runaway (Figure 25), it is concluded that perforation in the direction of the cell longitudinal axis is more dangerous.
The following images show a comparison of the final state of the cells after the test, once they have been sectioned to analyze their interior (Figure 24).
Figure 25 shows a comparison of the temperature curves achieved by the different cells tested. The cell that reaches a higher temperature after the TR is cell C, which had an SoC of 100% and was subjected to a perforation test in the direction of the longitudinal axis. This corresponds to the results obtained when comparing the final state of the tested cells. The cell reaching the next highest temperature value is cell A, with an SoC of 100%, which was tested by perforation in a direction perpendicular to the longitudinal axis of the cell. If the two cells with an SoC of 50% (cell D (perforation in the direction perpendicular to the cell longitudinal axis) and cell B (perforation in the direction of the cell longitudinal axis)) are compared, they should show the same behavior. In this case, however, cell D showed a worse result. Therefore, no conclusions can be drawn as to which penetration direction is worse. As Table 5 shows, the ambient temperature was not controlled; it ranged from 28 °C to 45 °C, justifying that cell D had a higher temperature during testing than cell B; in the first case, the ambient temperature is almost 20 °C higher than in the second case. It is therefore concluded that the worst case scenario for a failure due to mechanical abuse by perforation is if the cell/battery is 100% charged and the perforation occurs in the direction of the longitudinal axis. It can also be seen in the Figure 23 that the first to reach the TR is cell C, followed by cell D, cell B and cell A, so it can be concluded that the start of the TR is strongly influenced by the ambient temperature.
Below is a graph (Figure 26) comparing the voltage behavior of each of the cells tested. After the test, the only cell that does not remain discharged at 0 V is cell D (SoC 50%), perforated in the direction transverse to the cell longitudinal axis. Cell C is the first cell in which the voltage drops, followed by cell D, cell B, and cell A. This corresponds to the behavior of the temperature curves, i.e., when the voltage starts to drop the temperature starts to rise.
Once it has been shown that the most dangerous arrangement and situation in the event of a perforation is the vertical cell with an SoC of 100%, a new test is carried out with a lithium ion NMC cell with an SoC of 100%, which had been subjected to a perforation test in the direction of the longitudinal axis of the cell. The aim is to compare the behavior of an LFP cell with an NMC cell, in the most dangerous arrangement under mechanical abuse by perforation. The specifications of the NMC cell to be tested are shown below (Table 7).

3.1.5. Test 5: Vertical SoC 50% (Lithium-Ion Cell NMC)

The test is performed on a cylindrical 18650 cell in vertical arrangement (with the vent valve at the bottom) with an SoC of 100%. As in the previous tests, a K-type thermocouple is placed on the cell to measure its temperature, and a voltmeter is used to measure the voltage during the test. The cell is perforated in the direction of its longitudinal axis with a sharp element, and Figure 27 shows the set-up of the test.
In this test, a block of wood is placed to prevent the positive pole of the cell from short-circuiting with the yield since the upper part of the cell is the negative pole and, as it is perforated, the rod with which it is perforated is also negatively charged, so that if the positive pole were to come into contact with the metal plate, a short-circuit would occur, since the plate would be negatively charged when it comes into contact with the cell casing (also negative).
During the test of penetration of a rod into the cell in the direction of its longitudinal axis, it was observed that some penetration of the rod was necessary to trigger the TR process, as was the case with the LFP cell. The major difference with the LFP cell is the behavior of the cell upon failure due to mechanical abuse. It first explodes at the top (negative pole), and the vent valve does not act first, as it did in the case of the LFP cell. On the other hand, after the first event, it does explode through the vent valve (positive pole) with such an intensity that the cell moves upwards; if it had not been clamped, it would have become a projectile during the test. It can be concluded that the LFP cell is safer than the NMC cell.
The voltage drops at the beginning, when the cell is abruptly hit; when the voltage drop occurred during the test, the black wire that was connected to the negative pole of the cell to measure the voltage was loosened, so the voltage behavior cannot be analyses in this test. From an analysis of the temperature, the TR starts at 102 s and the maximum temperature reached is 288.30 °C.
The following images (Figure 28) compare the state of the C cell (SoC 100%, perforation in the direction of the cell longitudinal axis and LFP chemistry) with the state of the NMC cell (SoC 100%, perforation in the direction of the cell longitudinal axis and NMC chemistry), both inside and outside.
It is observed that the LFP cell (Figure 28 right) is more damaged internally; visually, it is more calcined than the NMC cell (Figure 28 left), which may be attributable to the higher maximum temperature reached. However, to better characterize the damage, a more detailed analysis of the compounds generated during the reaction would have to be carried out. On the other hand, it can also be observed that although the rod is the same, the resulting hole is larger in the case of the NMC cell (Figure 28 left); this may be due to an explosion and fire occurring at the top. In addition, it can also be observed that the copper collector (of the negative anode) is more damaged in the case of the NMC cell than in the case of the LFP cell.
Figure 29 shows the events identified as most significant during the mechanical abuse test by perforation of the NMC cell. It can be seen how the NMC cell, when subjected to mechanical abuse by perforation, catches fire, while the LFP cell subjected to the same test does not catch fire, but only gases escape from the lower part of the cell (according to the layout of the test). A graph comparing the temperature reached by the LFP cell and the NMC cell is shown the Figure 30.
The LFP cell reaches a higher maximum temperature, and the thermal runaway reactions start earlier than in the case of the NMC cell, but it must be taken into account that when testing at ambient temperature and not in a climatic chamber in order to reproduce real mechanical abuse conditions, the ambient temperature was lower on the day of the NMC cell test than the ambient temperature on the LFP cell test day. The difference in the behavior of the two cells under the same mechanical abuse by perforation can be explained by the fact that nickel-manganese-cobalt (NMC) and lithium-iron-phosphate (LFP) batteries differ in several important respects. While NMC batteries offer higher energy density and specific power, LFP batteries stand out for their safety, thermal stability, and longer life.
LFP batteries have excellent thermal stability, which minimizes the risk of thermal runaway; this is a potentially catastrophic phenomenon in which the battery temperature rises rapidly, causing a fire or explosion. The chemical stability of LFP batteries contributes to their ability to withstand high temperatures without compromising safety. They are less prone to internal short circuits, which reduces the likelihood of critical failures.
To explain the differences seen in the comparison made, there is a study that analyses the TR of LFP cells of different diameters and concludes that the one with the largest diameter is the most dangerous one [83] due to its physical behavior. The hazards of the 26650 LiFePO4 cells are related to the excessive heat caused by internal short circuits above the critical temperature, which were largely attributed to the collapse of the separator integrity. Therefore, the danger of 26650 LFP cells is not due to chemical activity. As future lines of research, it is recommended the repetition of mechanical abuse tests to compare NMC cells and LFP cells of the same diameter.
The maximum temperature (Tmax) of an 18650 LFP cell is normally approximately 250 °C. TR in this type of cell occurs at temperatures above 210 °C. Therefore, the 18650 LFP cell is a safer battery under abuse compared to other cells [84,85,86].
Therefore, after comparing the NMC cell and the LFP cell subjected to the same mechanical abuse by perforation, it is concluded that the NMC cell catches fire while the LFP cell does not; however, the maximum temperature reached by the LFP cell is higher than that reached by the NMC cell. This may occur because the tests were carried out at ambient temperature, and the day the LFP cell was tested the ambient temperature was higher than the day the NMC cell was tested. However, the LFP cell may have had a lower maximum temperature reached than the NMC cell because cells tested by mechanical abuse using perforation have different diameters, and some studies [57,58,59] indicate that the size of the cells influences their behavior in the event of thermal runaway. Therefore, a comparison should be made between NMC and LFP cells of the same diameter, subjected to the same perforation mechanical abuse test to analyze the temperature profile reached.

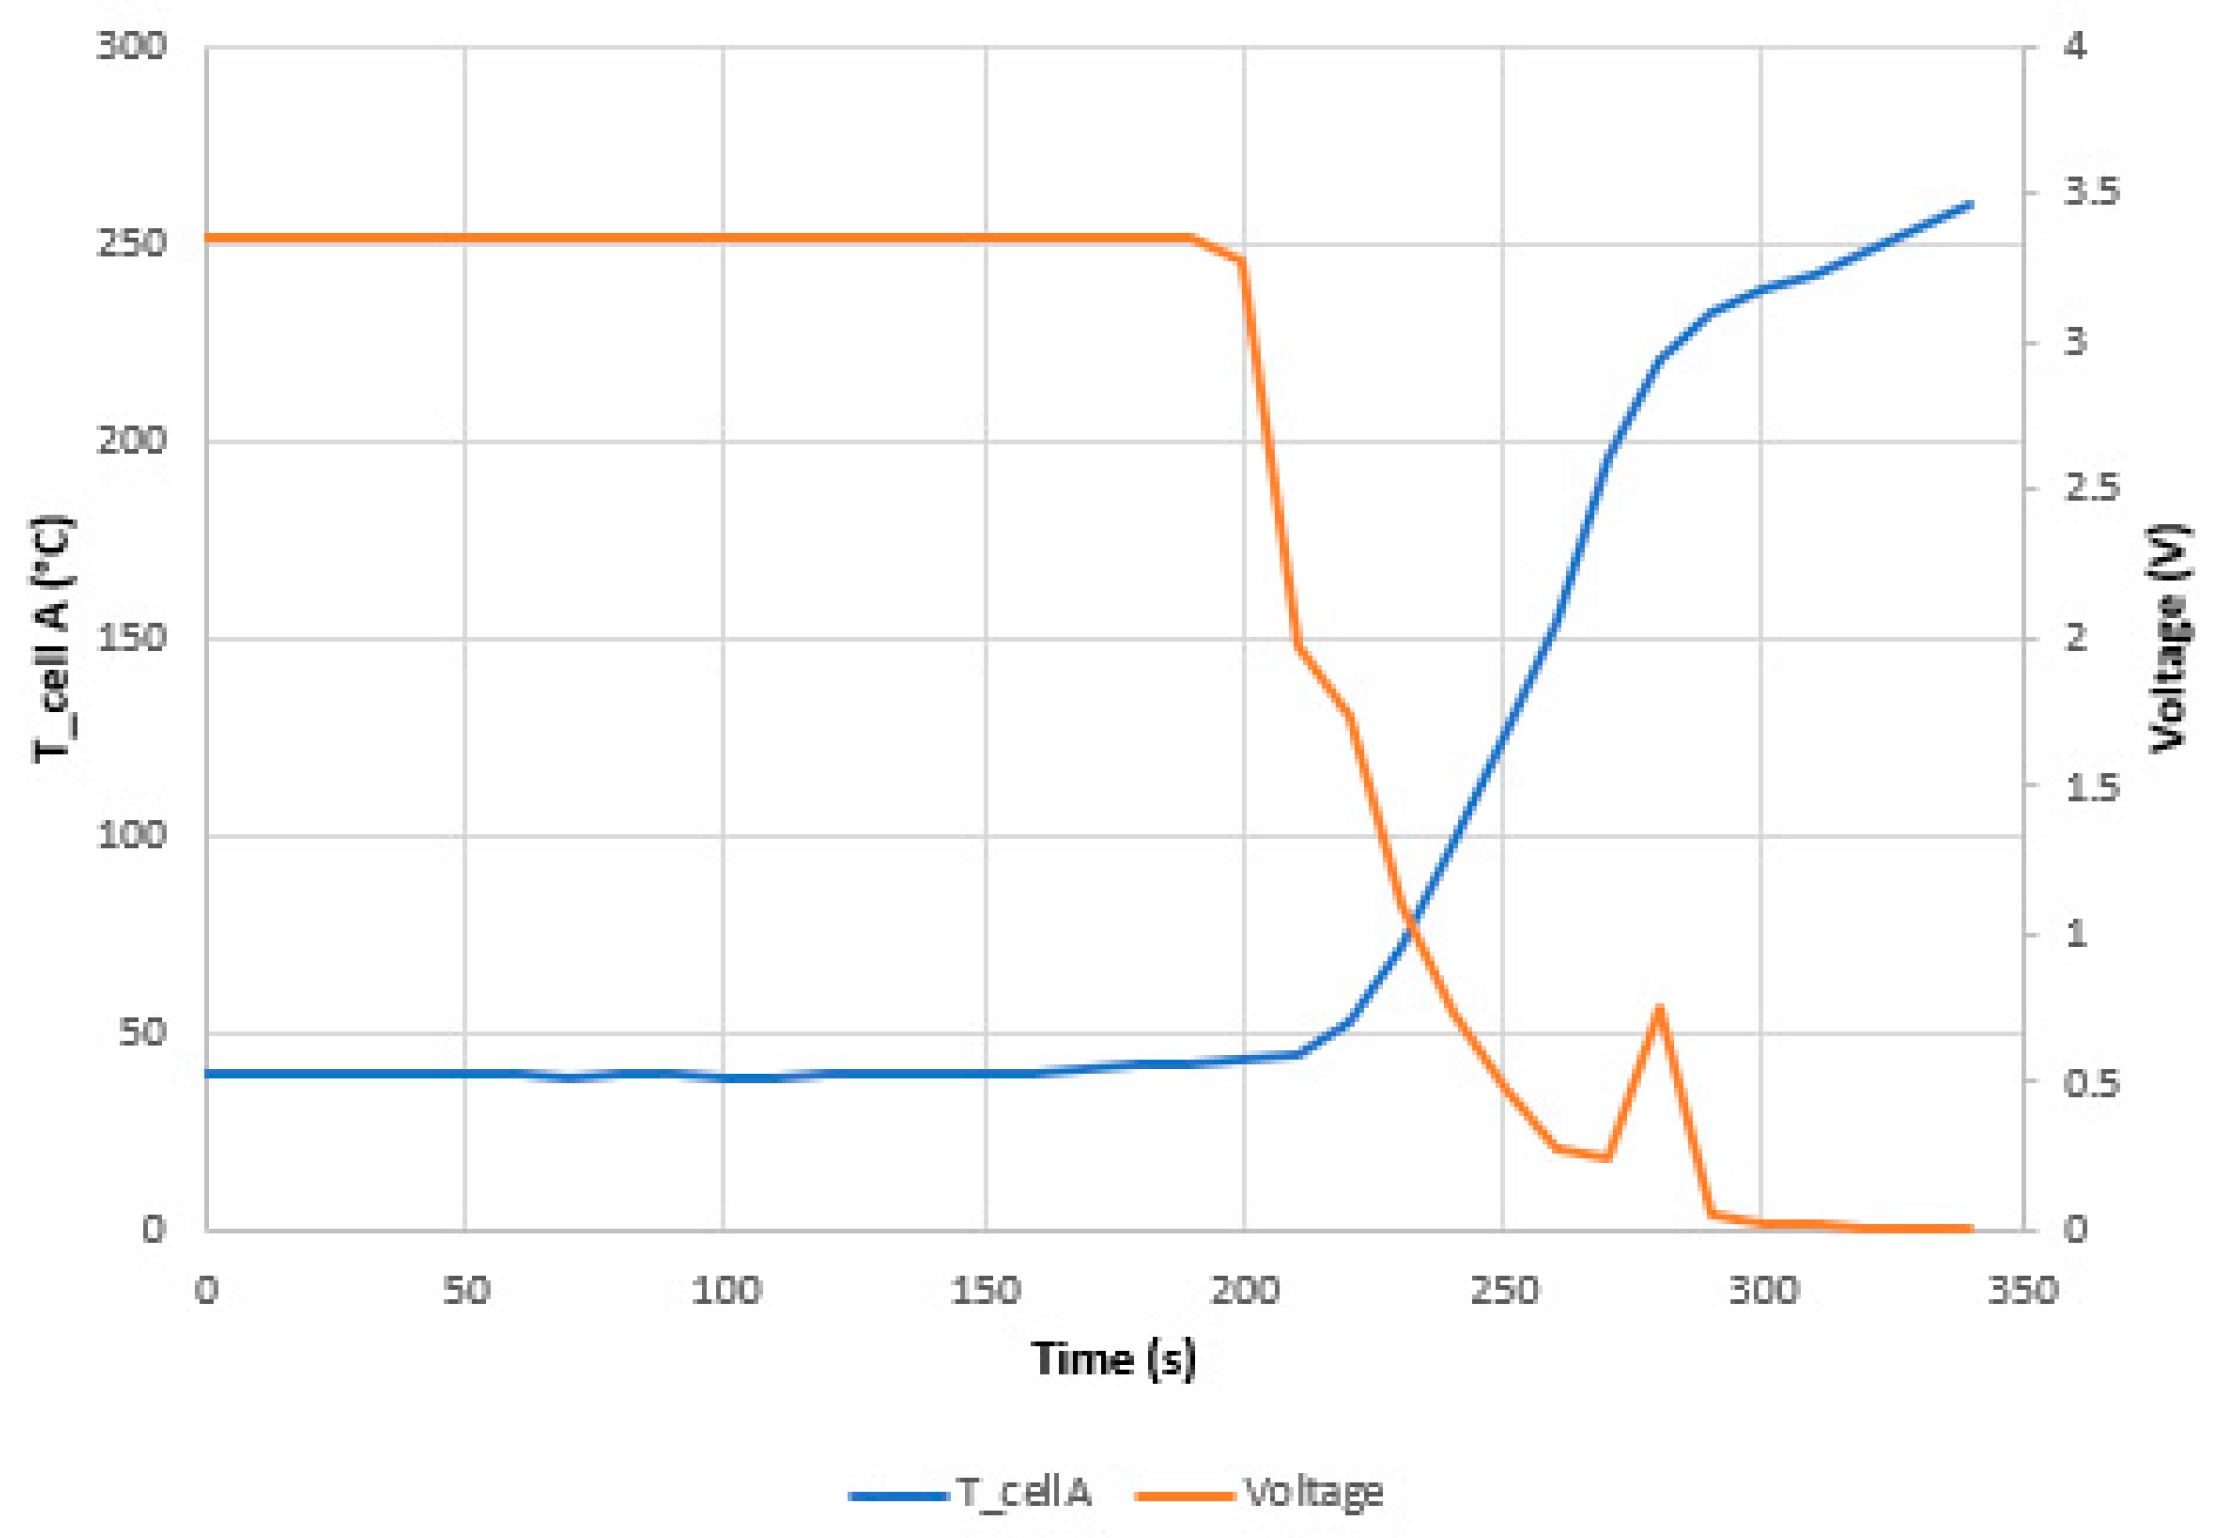
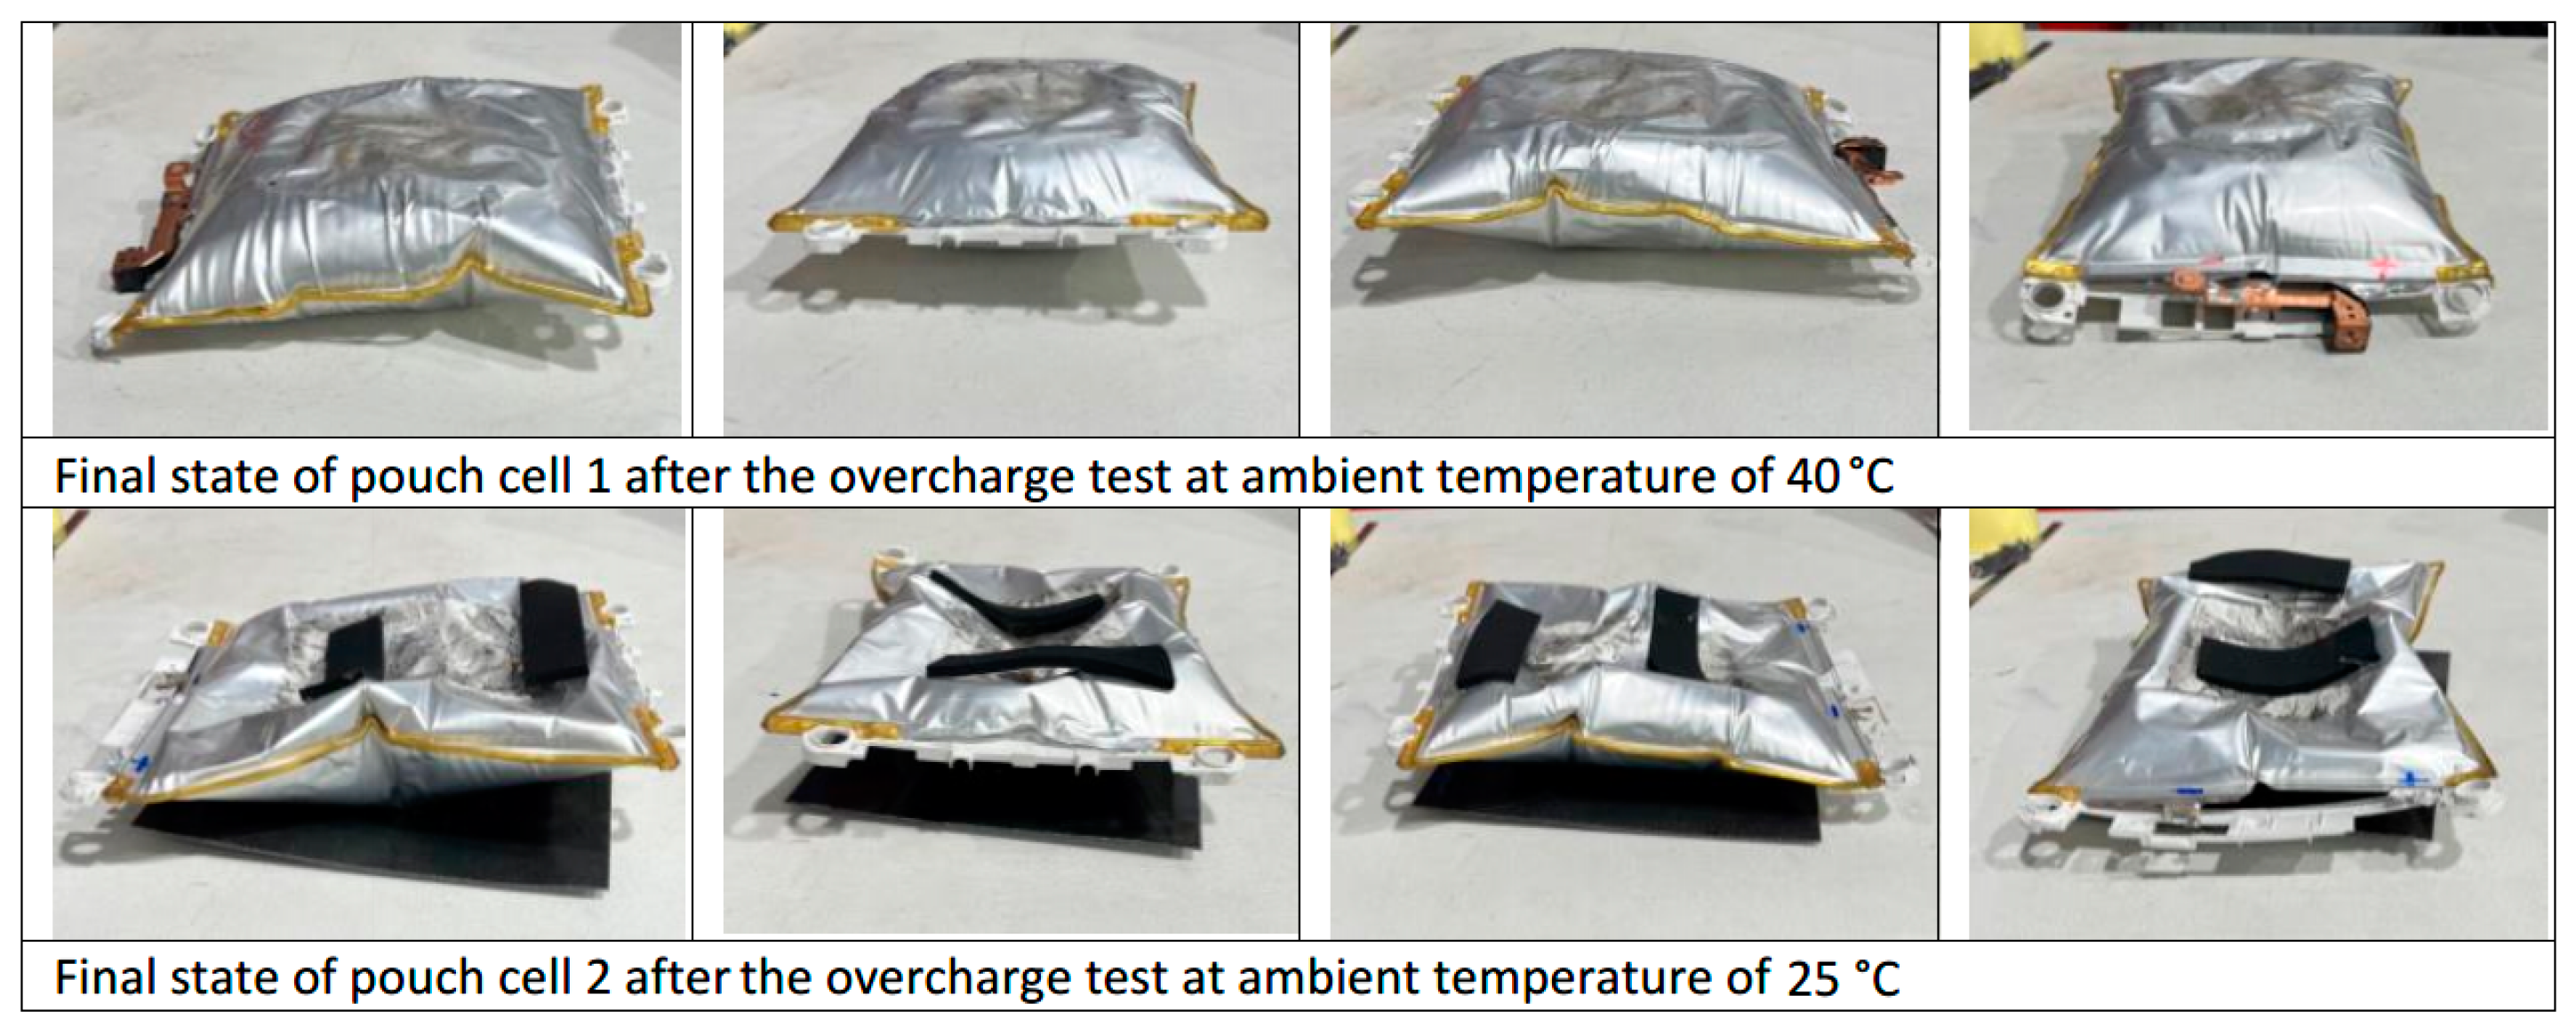
3.2. Electrical Abuse Test Results: Overcharge

The overcharge electrical abuse test was carried out on two pouch cells with a 100% State of Charge (SoC) at different initial ambient temperatures. These tests are carried out to evaluate the effects of overcharge on cells under different operating conditions without exceeding the maximum temperature indicated by the manufacturer. The specifications of the overcharge tests carried out are shown below (Table 8).
Figure 31 shows the temperature measured during the overcharge tests, i.e., after exceeding the nominal voltage of 4.2 V and reaching 7.94 V in the case of the first cell tested and 5.94 V in the case of the second cell tested. A rapid increase in cell temperature is observed (Figure 31), corresponding to cell swelling and the formation of gases inside the cells.
It can be deduced and verified that overcharging a battery results in an increase in the temperature of the battery, swelling due to the vaporization of the electrolyte, or even the loss of containment and the release of gases to the outside, as has been shown in other studies [87]. In the case of the pouch 1 cell tested at an elevated ambient temperature of approximately 40 °C, when significant swelling is reached and the power supply is turned off for safety, the voltage starts to drop; the swelling also drops, and after a few moments, a venting of gases takes place. If the battery does not have a disconnecting circuit, interrupting the current when it experiences a temperature above a set threshold (usually 90 °C), there is a possibility of battery fire or even explosion if no safety venting system is provided [88,89].
It is observed that, during the tests, none of the cells overheated above 60 °C, so the cells were kept below the accepted values (80–90 °C), which are the temperatures the first uncontrolled thermal runaway reactions occur [90]. However, gases are only produced under these mildly abusive conditions once the cut-off voltage, 4.2 V in this case, is reached.
It is concluded that if the ambient temperature is higher, the effects on the overcharged cell are more dangerous, as the cell temperature is higher. On the other hand, the temperature of the cell is seen to be increasing from the beginning of the test as the test is reproducing a load under normal conditions (uncontrolled ambient temperature conditions), i.e., the tests are not performed in a climatic chamber where the ambient temperature is controlled. In ambient temperature controlled tests, the temperature of the cell is not raised until the internal short-circuit occurs due to a fault. The ambient temperature was not controlled in this study because temperature-controlled tests have already been carried out, but tests that reproduce the actual conditions under which a load occurs have not.
After analyzing the two tests, it is concluded that, when the maximum voltage is reached due to the overcharge is when the maximum temperature is reached and when the maximum swelling of the two cells is reached. Gas venting occurs only in the case of the cell that is tested by overcharge at an ambient temperature of 40 °C; no gas venting occurs in cell tested at a lower ambient temperature (25 °C). It is also concluded that once the overcharge is over (the power supply is switched off), the reactions inside the cell continue to take place, causing the cells to swell again because gases are produced in the reactions that take place.
Figure 32 shows a reference cell in its original state before testing.
A comparison of the state of the tested pouch cells at different times of maximum swelling during the test is shown below (Figure 33).
Both Figure 33 and Figure 34 show that pouch cell 1 tested by overcharging at an ambient temperature of 40 °C is more swollen than pouch cell 2 tested by overcharging at an ambient temperature of 25 °C. In addition, the maximum voltage reached is higher in the case of pouch cell 1 before removing the power supply, despite using the same power supply in both tests. Figure 35 shows the state of the tested pouch cells one day after the test.
The state of the tested cells is analyzed the day after the test (Figure 35) to study the evolution of their state. It is concluded that once the tested cell is stable, the swelling of the pouch cell tested by overcharging at a higher temperature is greater than in the case of the pouch cell tested at a lower temperature.
Whether the cells are swollen is due to the amount of gas produced, and this amount of gas is directly related to the capacity, energy density, and SoC of the cell. Furthermore, increasing these parameters leads to more severe TR [91,92]. Also, the charging rate influences the magnitude of gas formation: the cell can explode at high current, while it only swells at low current [93].
With respect to literature data, we observed lower carbon dioxide concentrations, in favor of higher hydrogen concentrations, especially in the case of the overcharged cell at room temperature (14% and 69% for CO2 and H2, respectively). On the contrary, the results obtained for the cell supercharged at 50 °C (33% and 35% for CO2 and H2, respectively) [90] seem to be more in agreement with the values presented in previous works [9,94,95,96].
The internal resistance of the tested pouch cells, before the test and after the test, is shown below (Table 9); these data were used to analyze the increase in cell resistance as a function of the temperature at which the test was carried out.
As Table 9 shows, the difference in DCIR between the measurements at the beginning of the tests and at the end of the tests shows that the cell with the highest ΔDCIR is the cell subjected to the overcharge test at the highest ambient temperature, which coincides with the cell that has swollen the most.
Therefore, it can be concluded that the environmental conditions in which a cell operates can affect the severity of a failure.
For safety reasons, batteries, and therefore lithium-ion cells, should not be charged near flammable materials or objects. They should also not be charged in places where the temperature is high or where they are exposed to direct sunlight. On the other hand, it must be considered heat is generated when the cells are charging, so they should not be covered while charging.
The battery charging process is important, and the choice of battery type involves suitable operating conditions, vibrations, ensuring tightness through the design of a battery casing, and a suitable working temperature range by applying a suitable cooling system. In addition to the climatic conditions, the charging and discharging parameters must be adequate and compatible with the requirements set by the manufacturers. The BMS supervises the loading and unloading process, operating in conjunction with the on-board and off-board charger, but on occasion there may be a malfunction of the charger or the BMS, or a failure by design. It should also be noted that when the vehicle is running with a charged battery and regenerative braking is used, it could damage the by supplying a high current to an already charged battery and creating overcharging.
It is therefore concluded that the charging process of an electric vehicle battery is an important aspect to consider. The choice of one type of battery or another is based on the battery having the right operating conditions, requiring, among other things, the right charging and discharging parameters, which is taken care of by the BMS, but failures can occur that lead to overcharging.
These tests conclude that overcharging an electric vehicle with a pouch cell battery pack (tested cells) at elevated temperatures, for example on a summer day at midday, is critical and dangerous.
The same overcharge tests should be repeated at different ambient temperatures, with different cell types and with different SoCs.

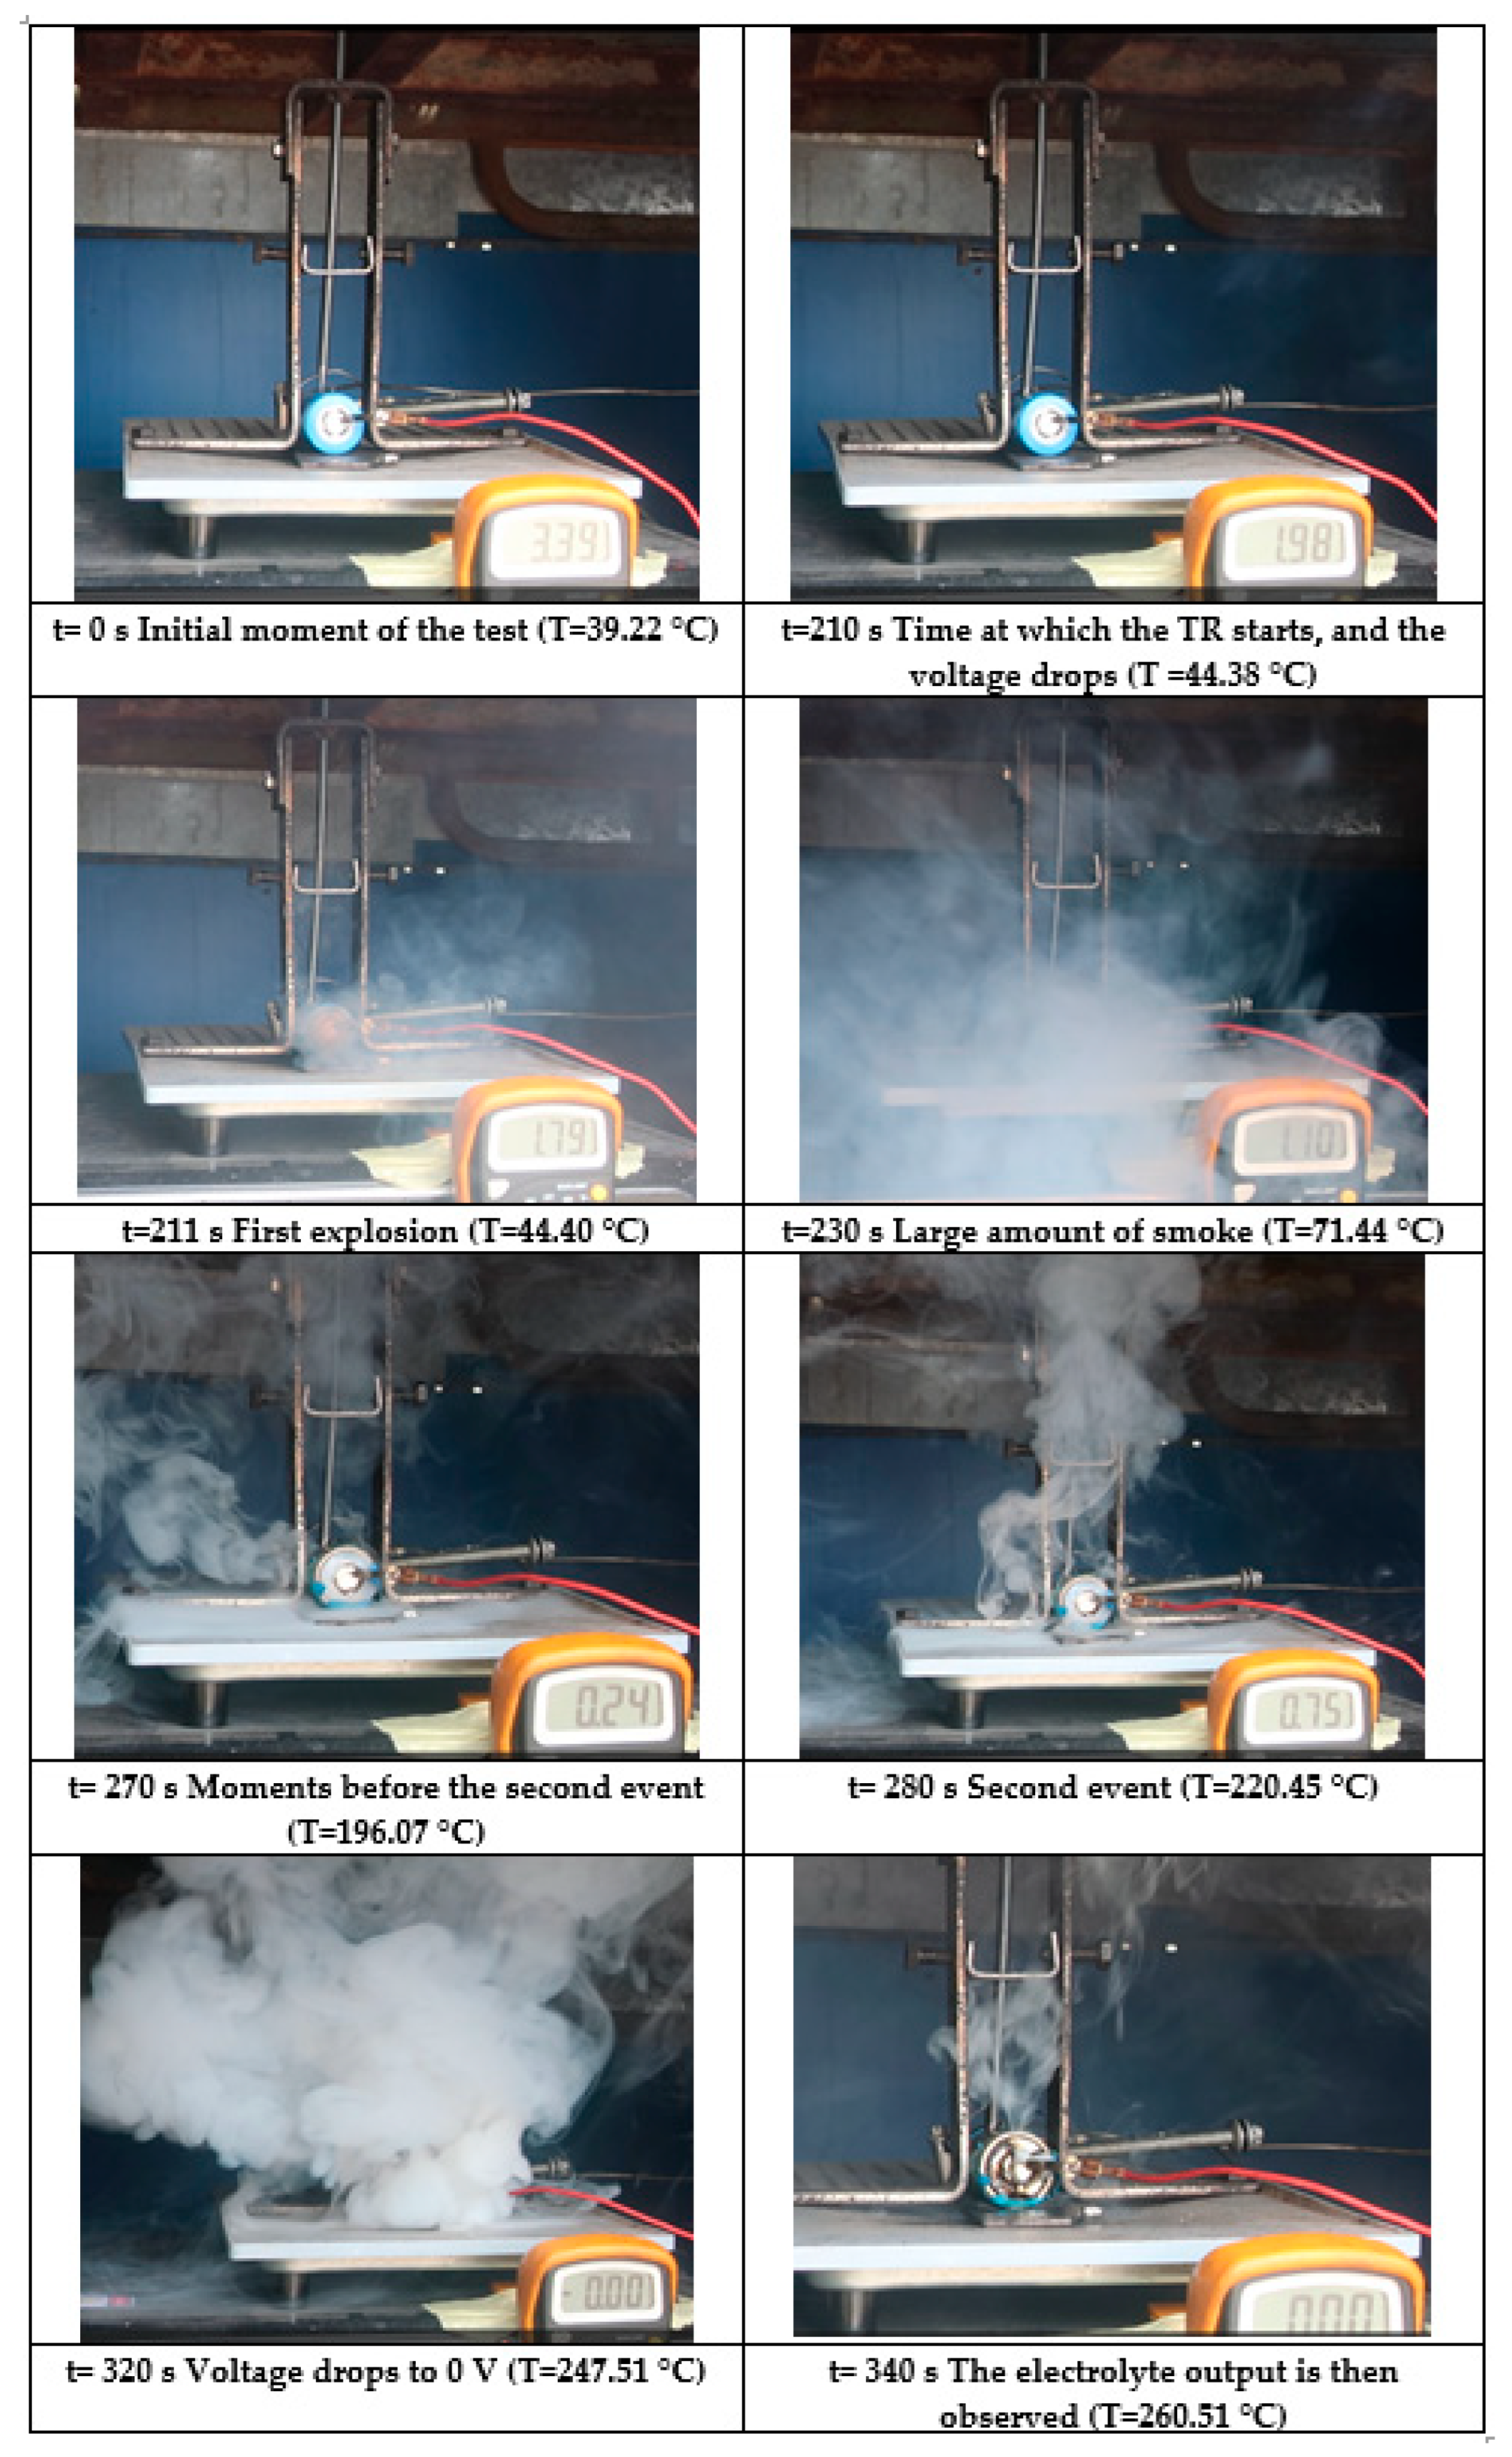
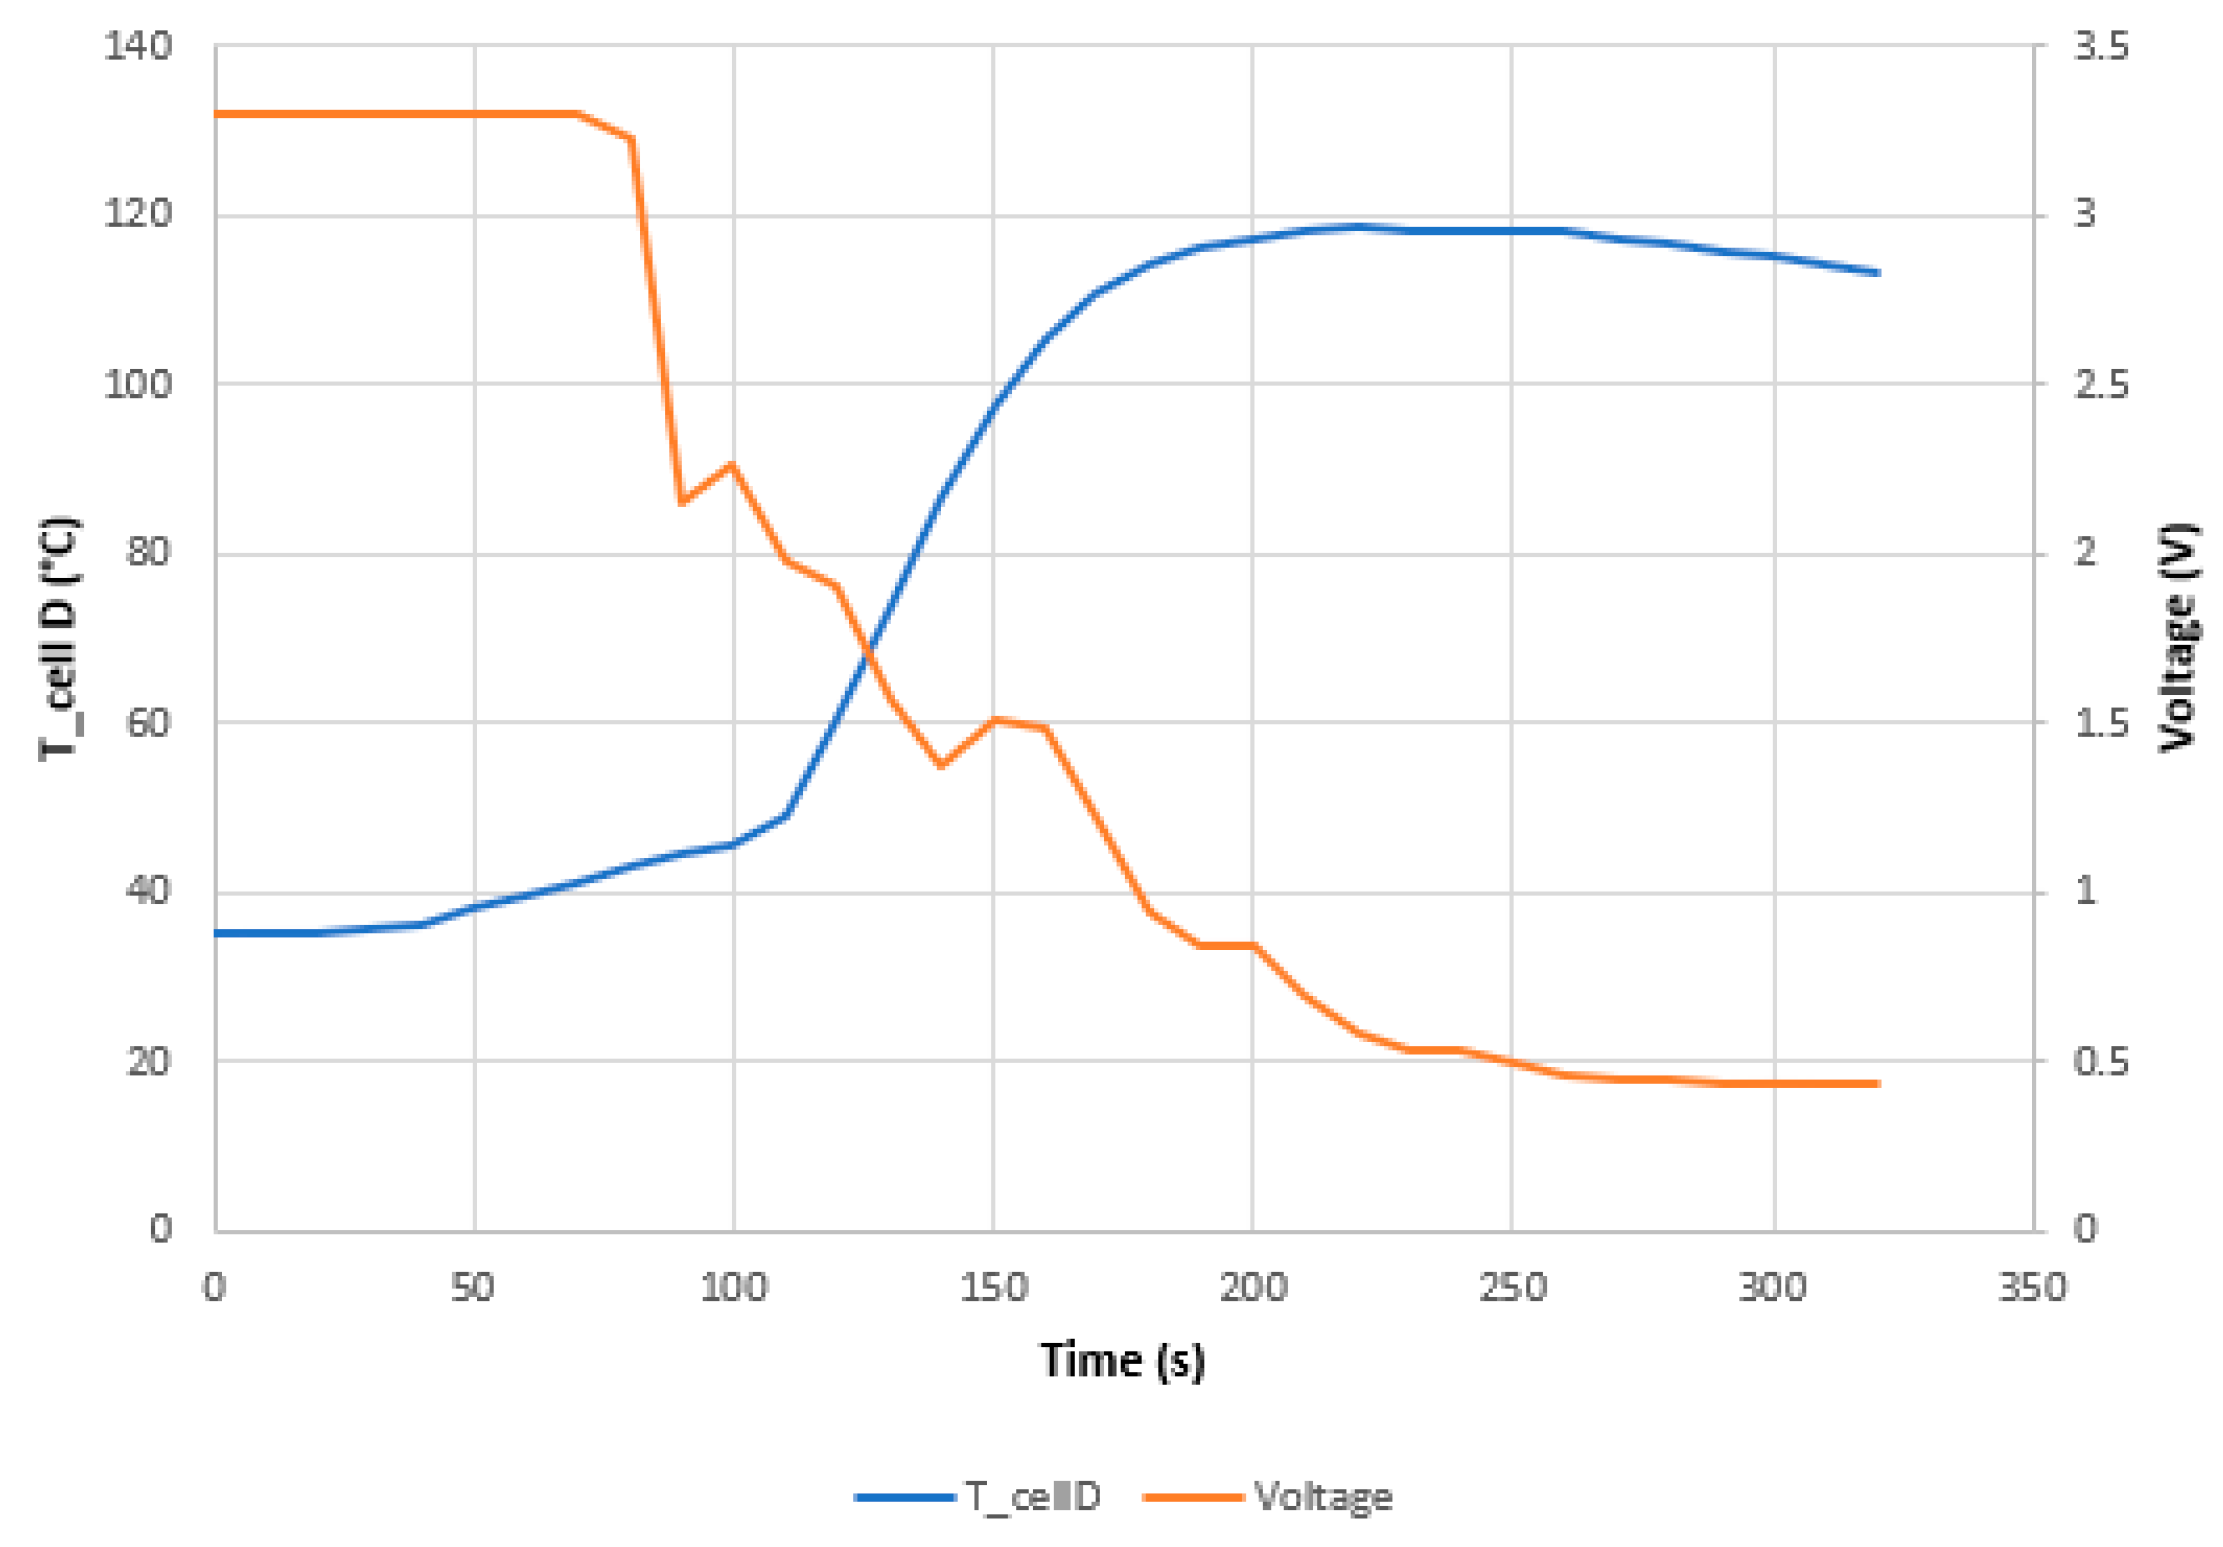
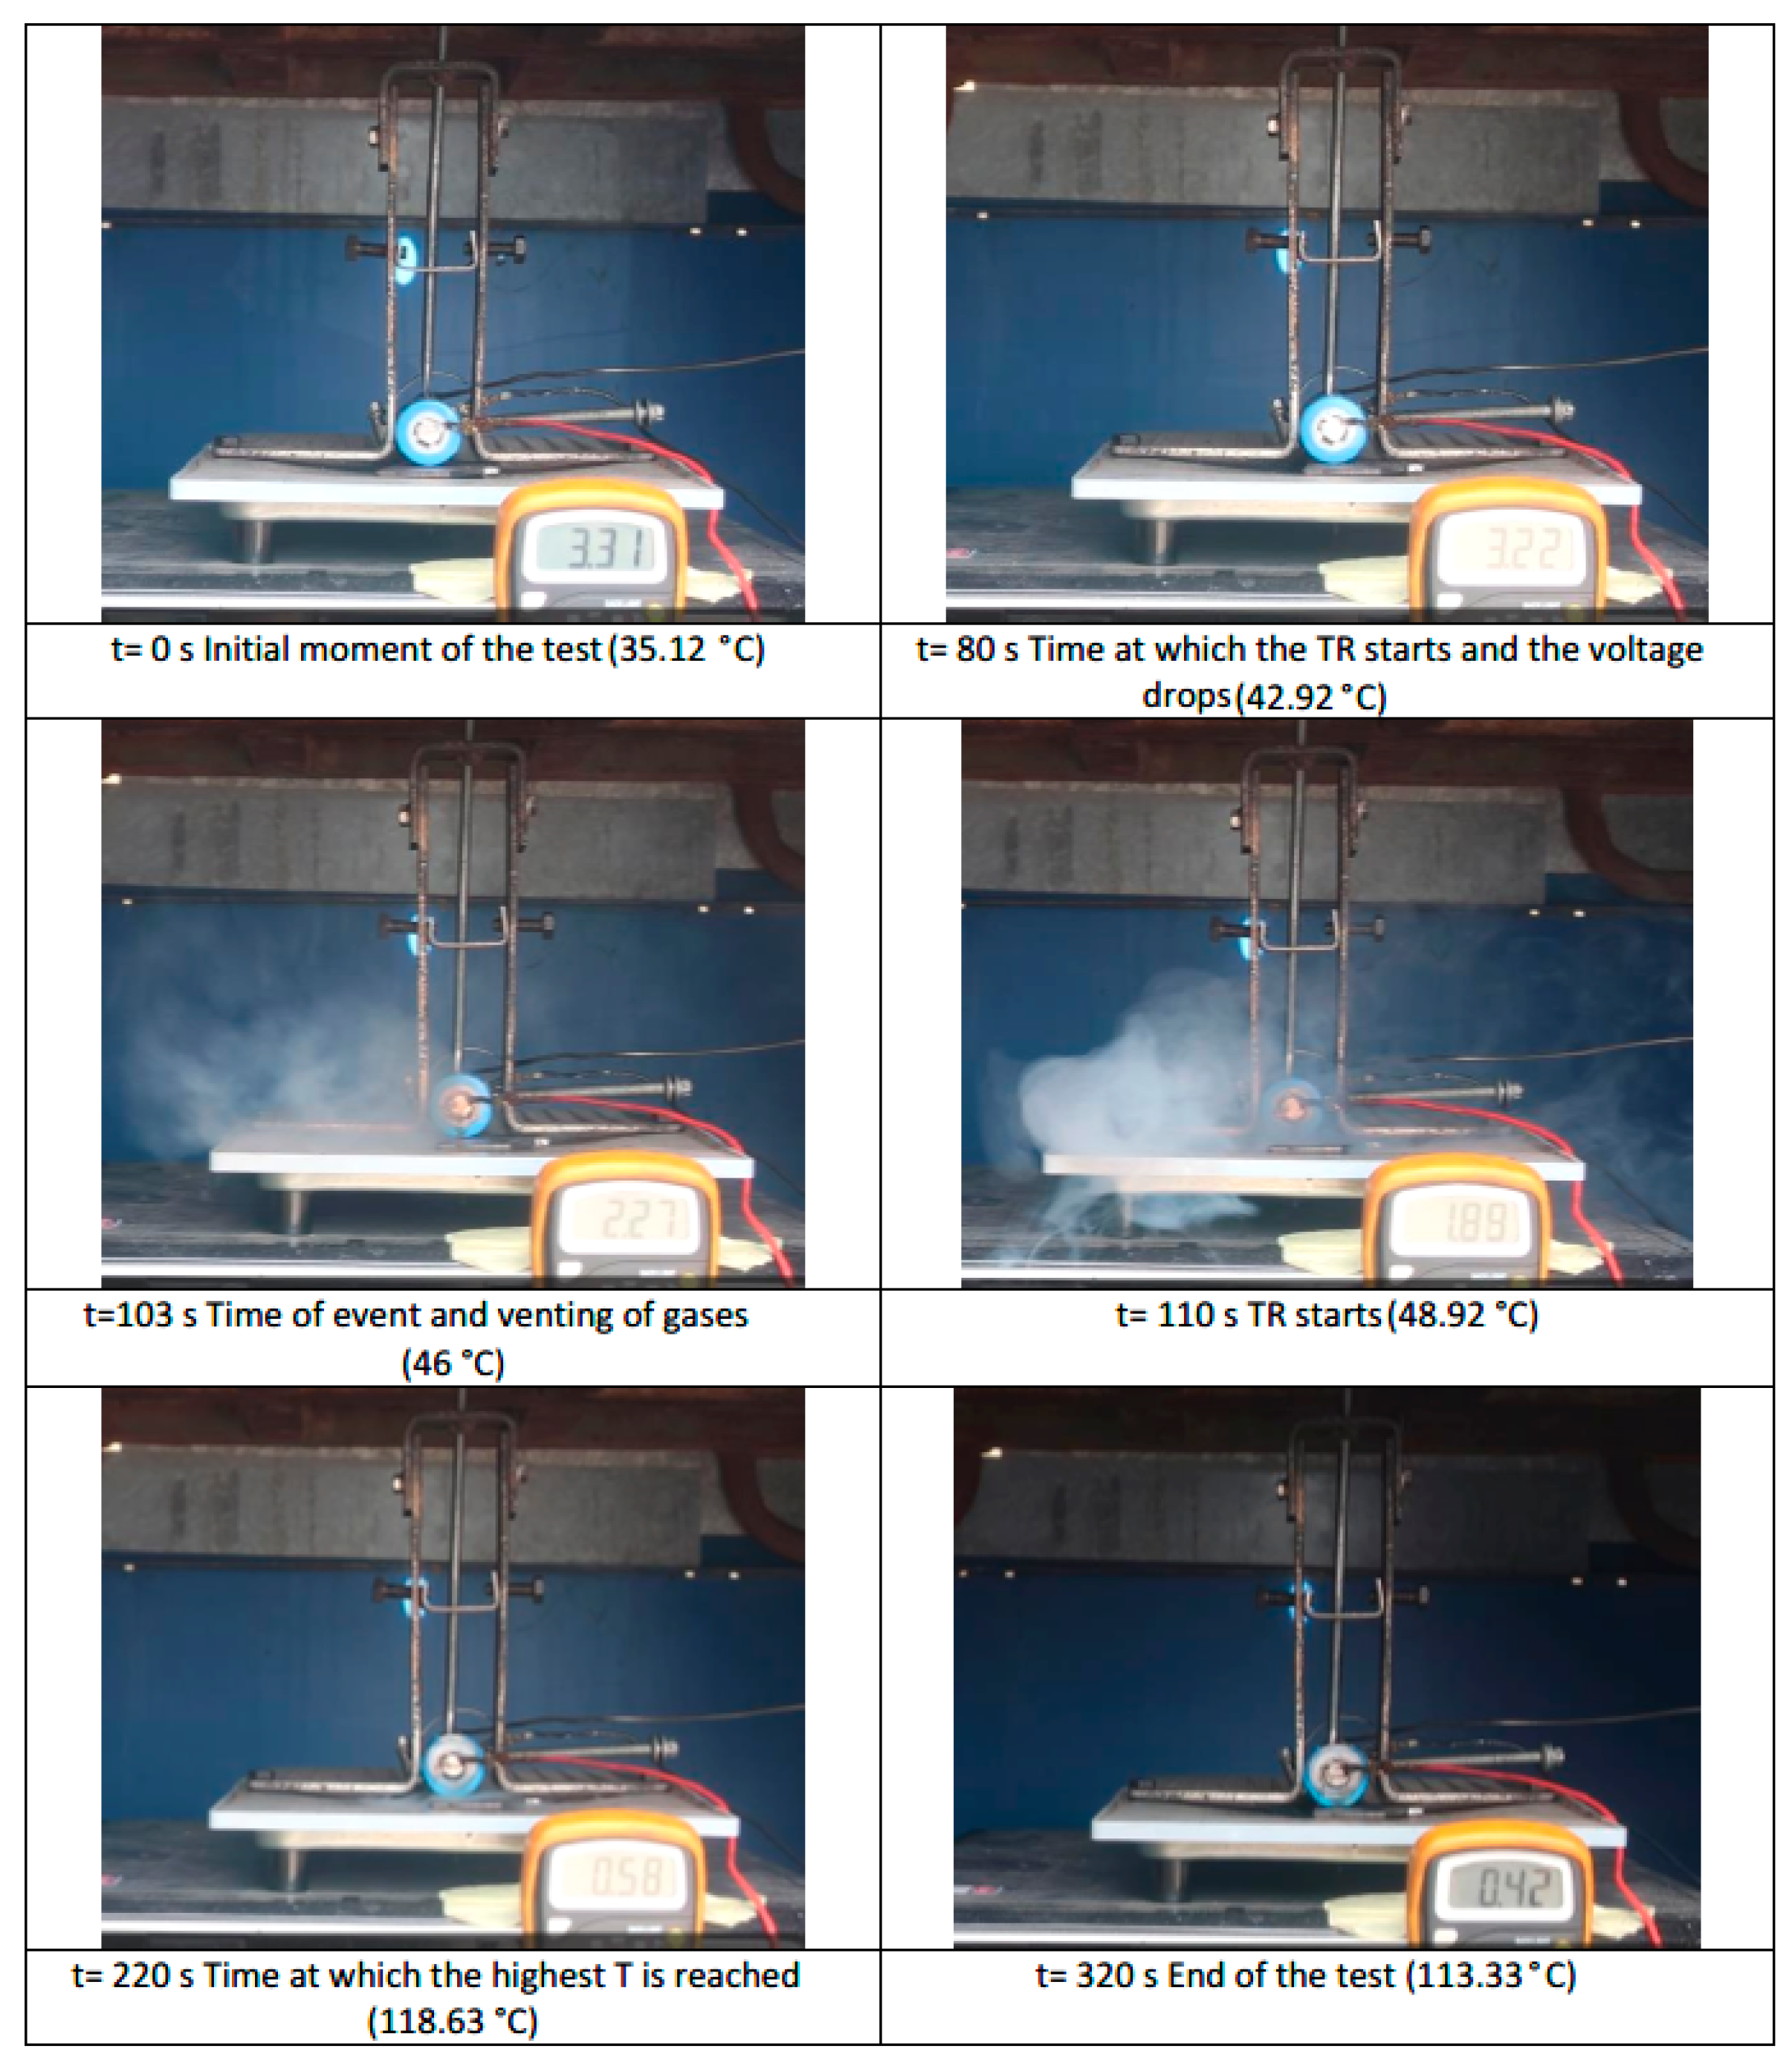
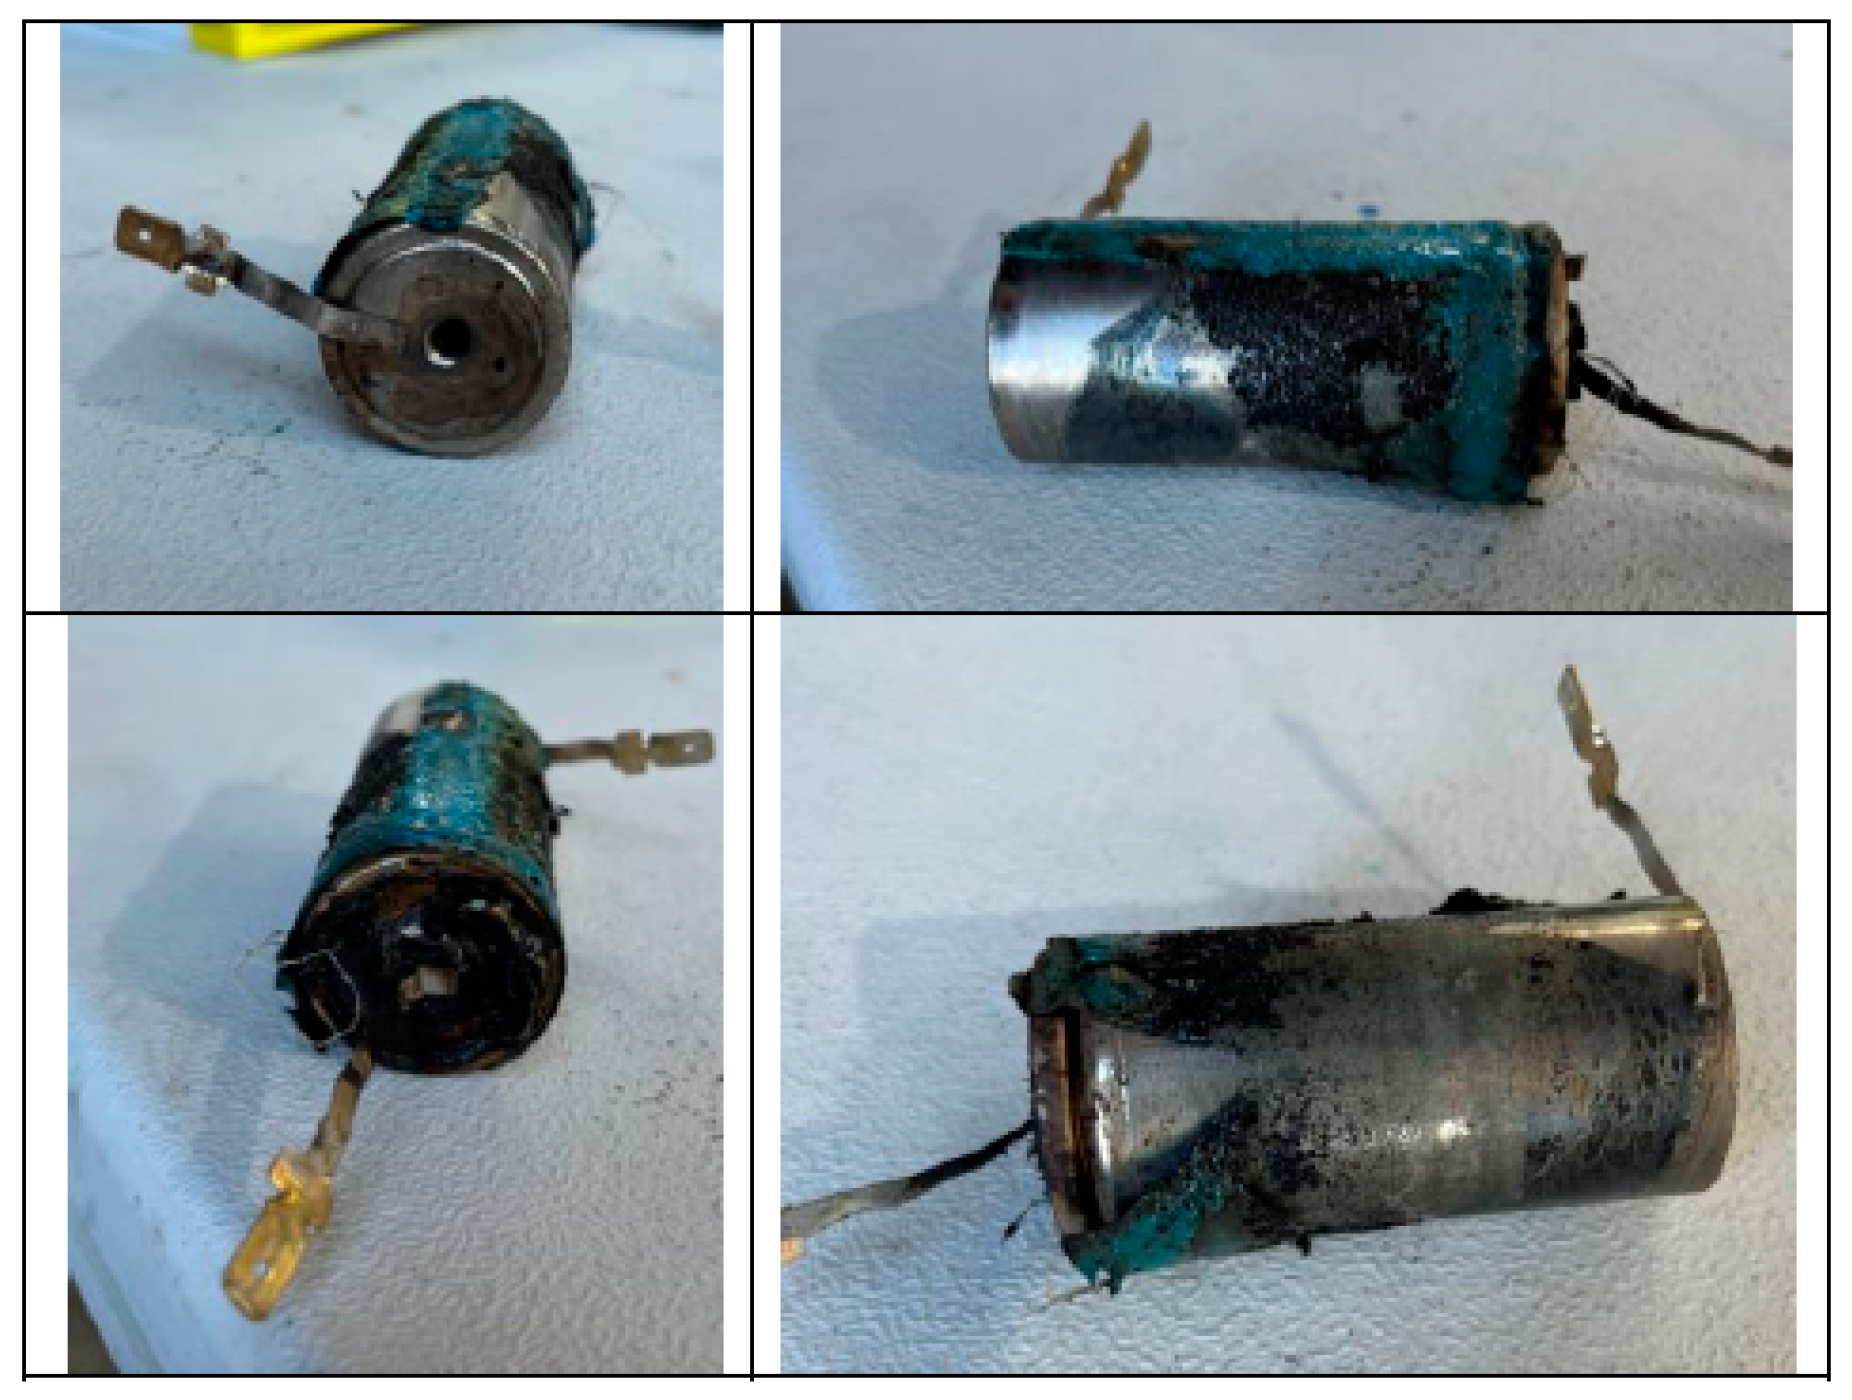
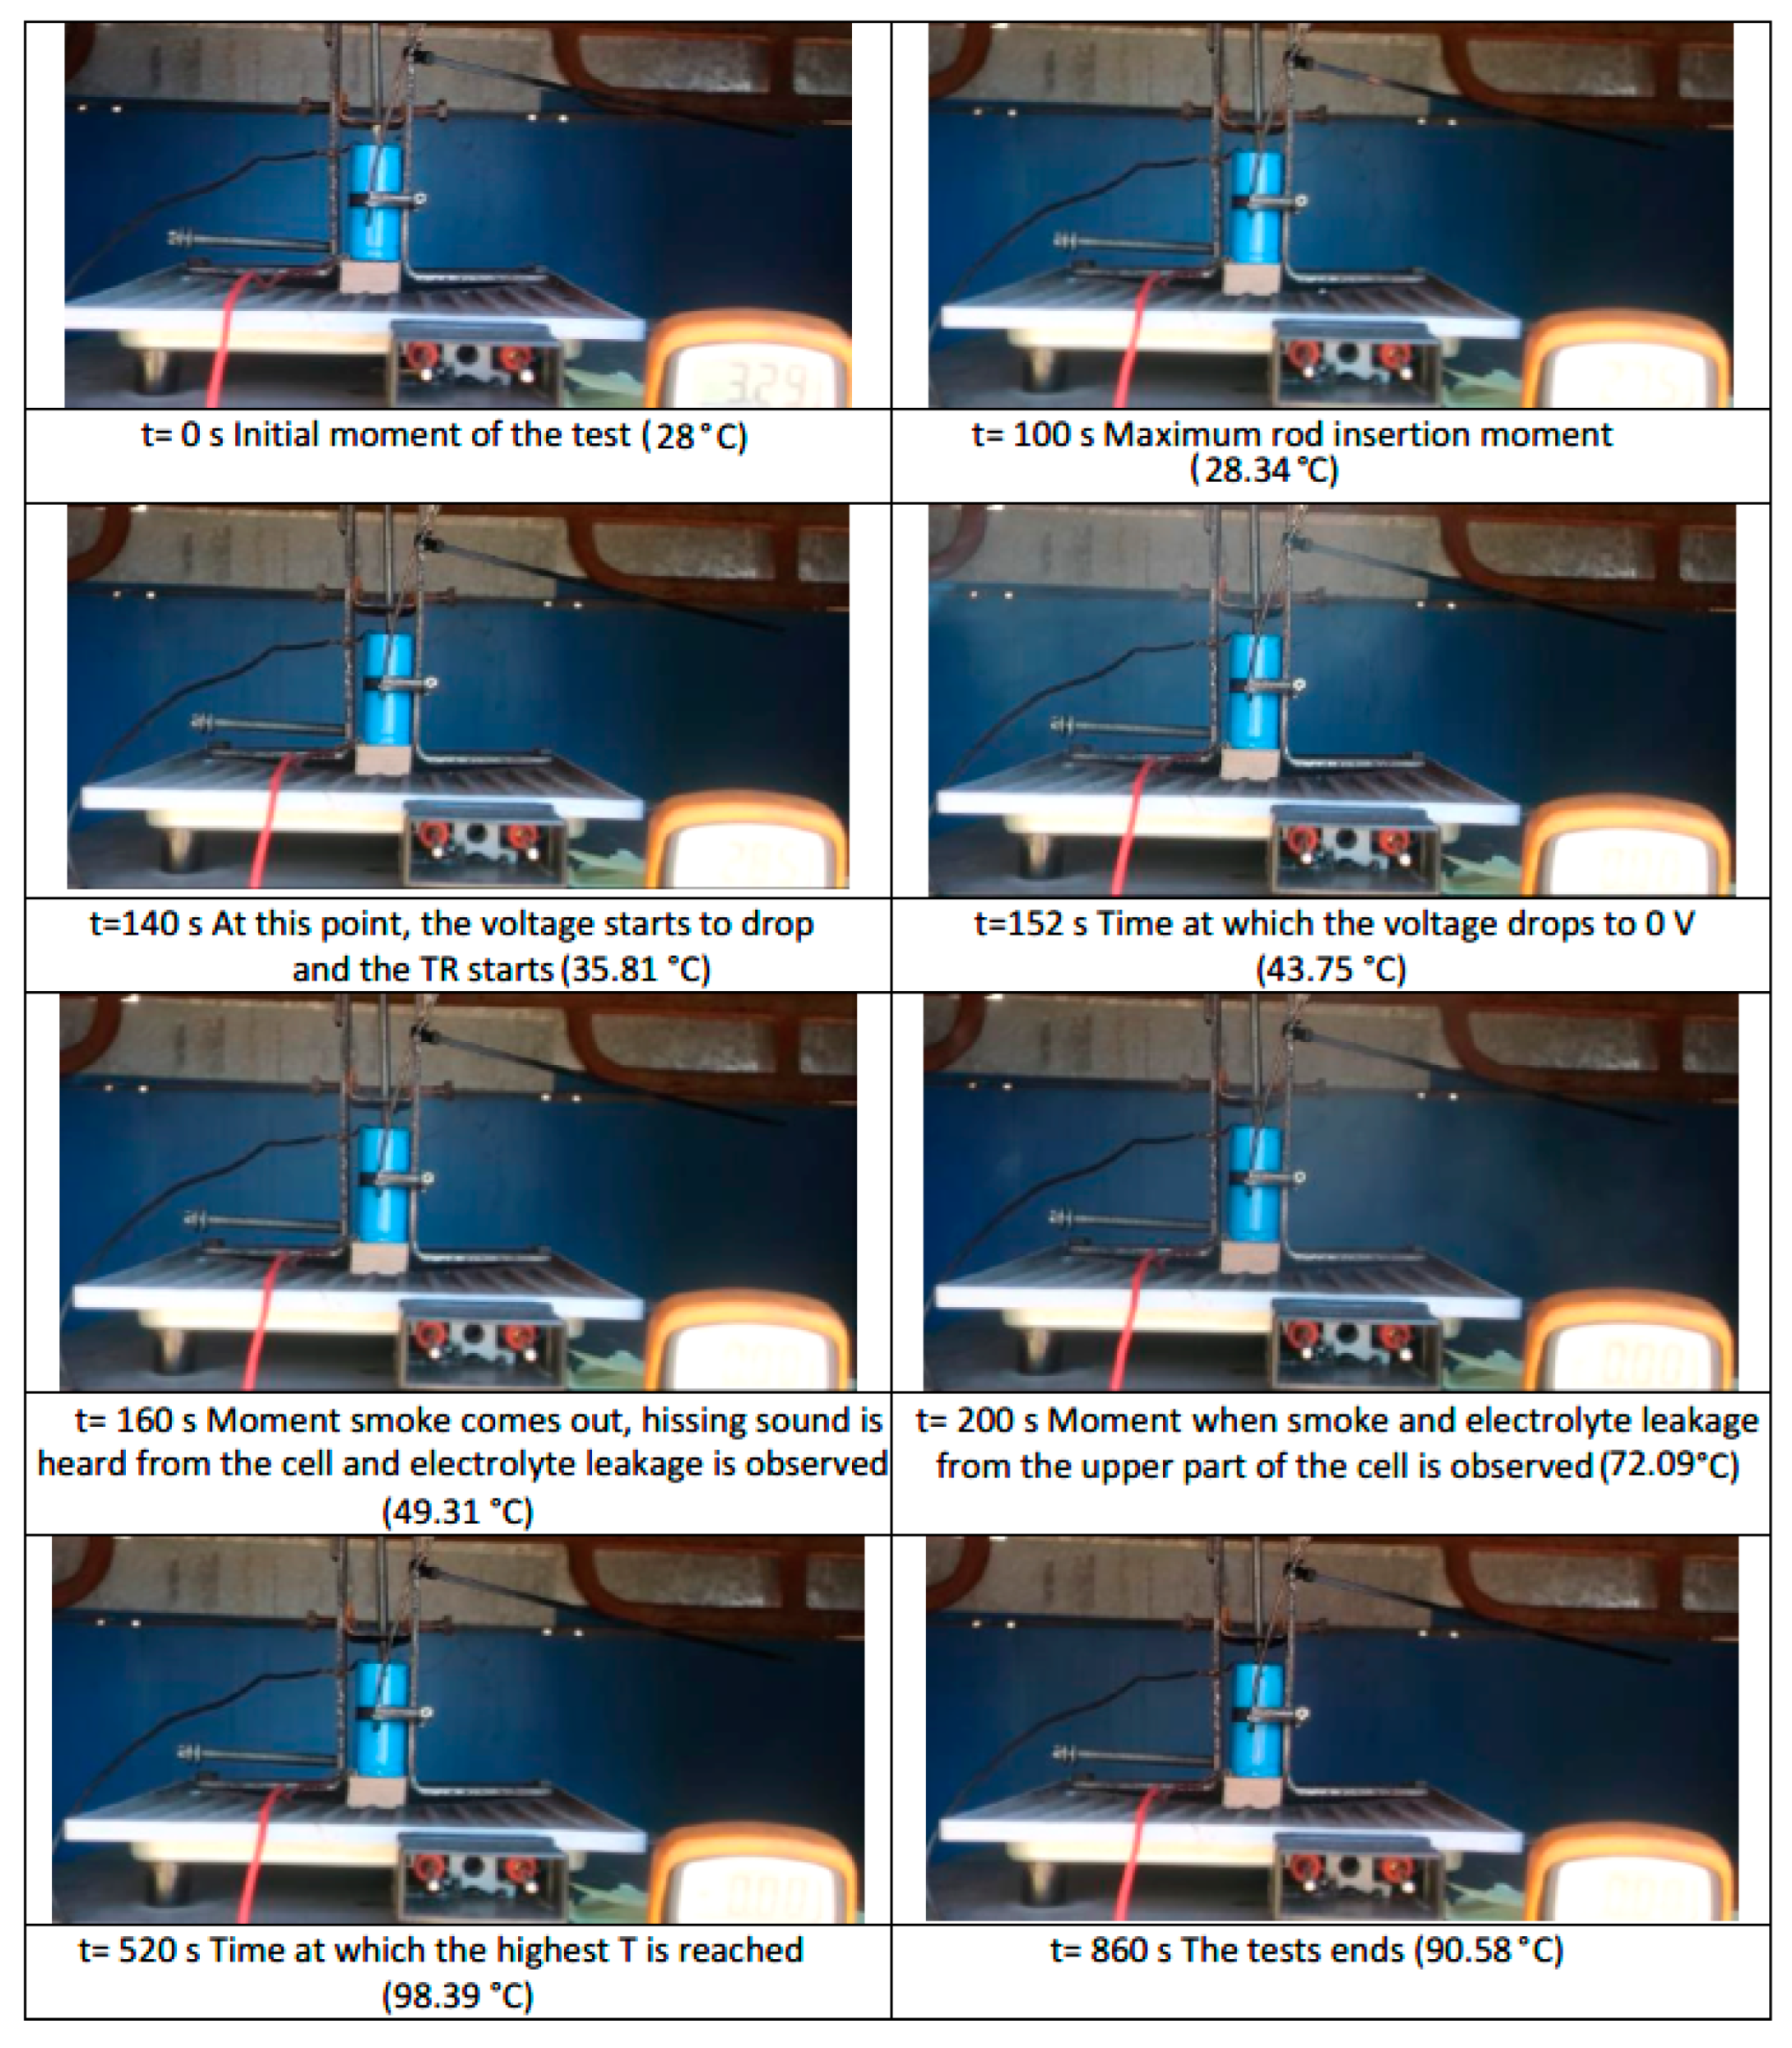
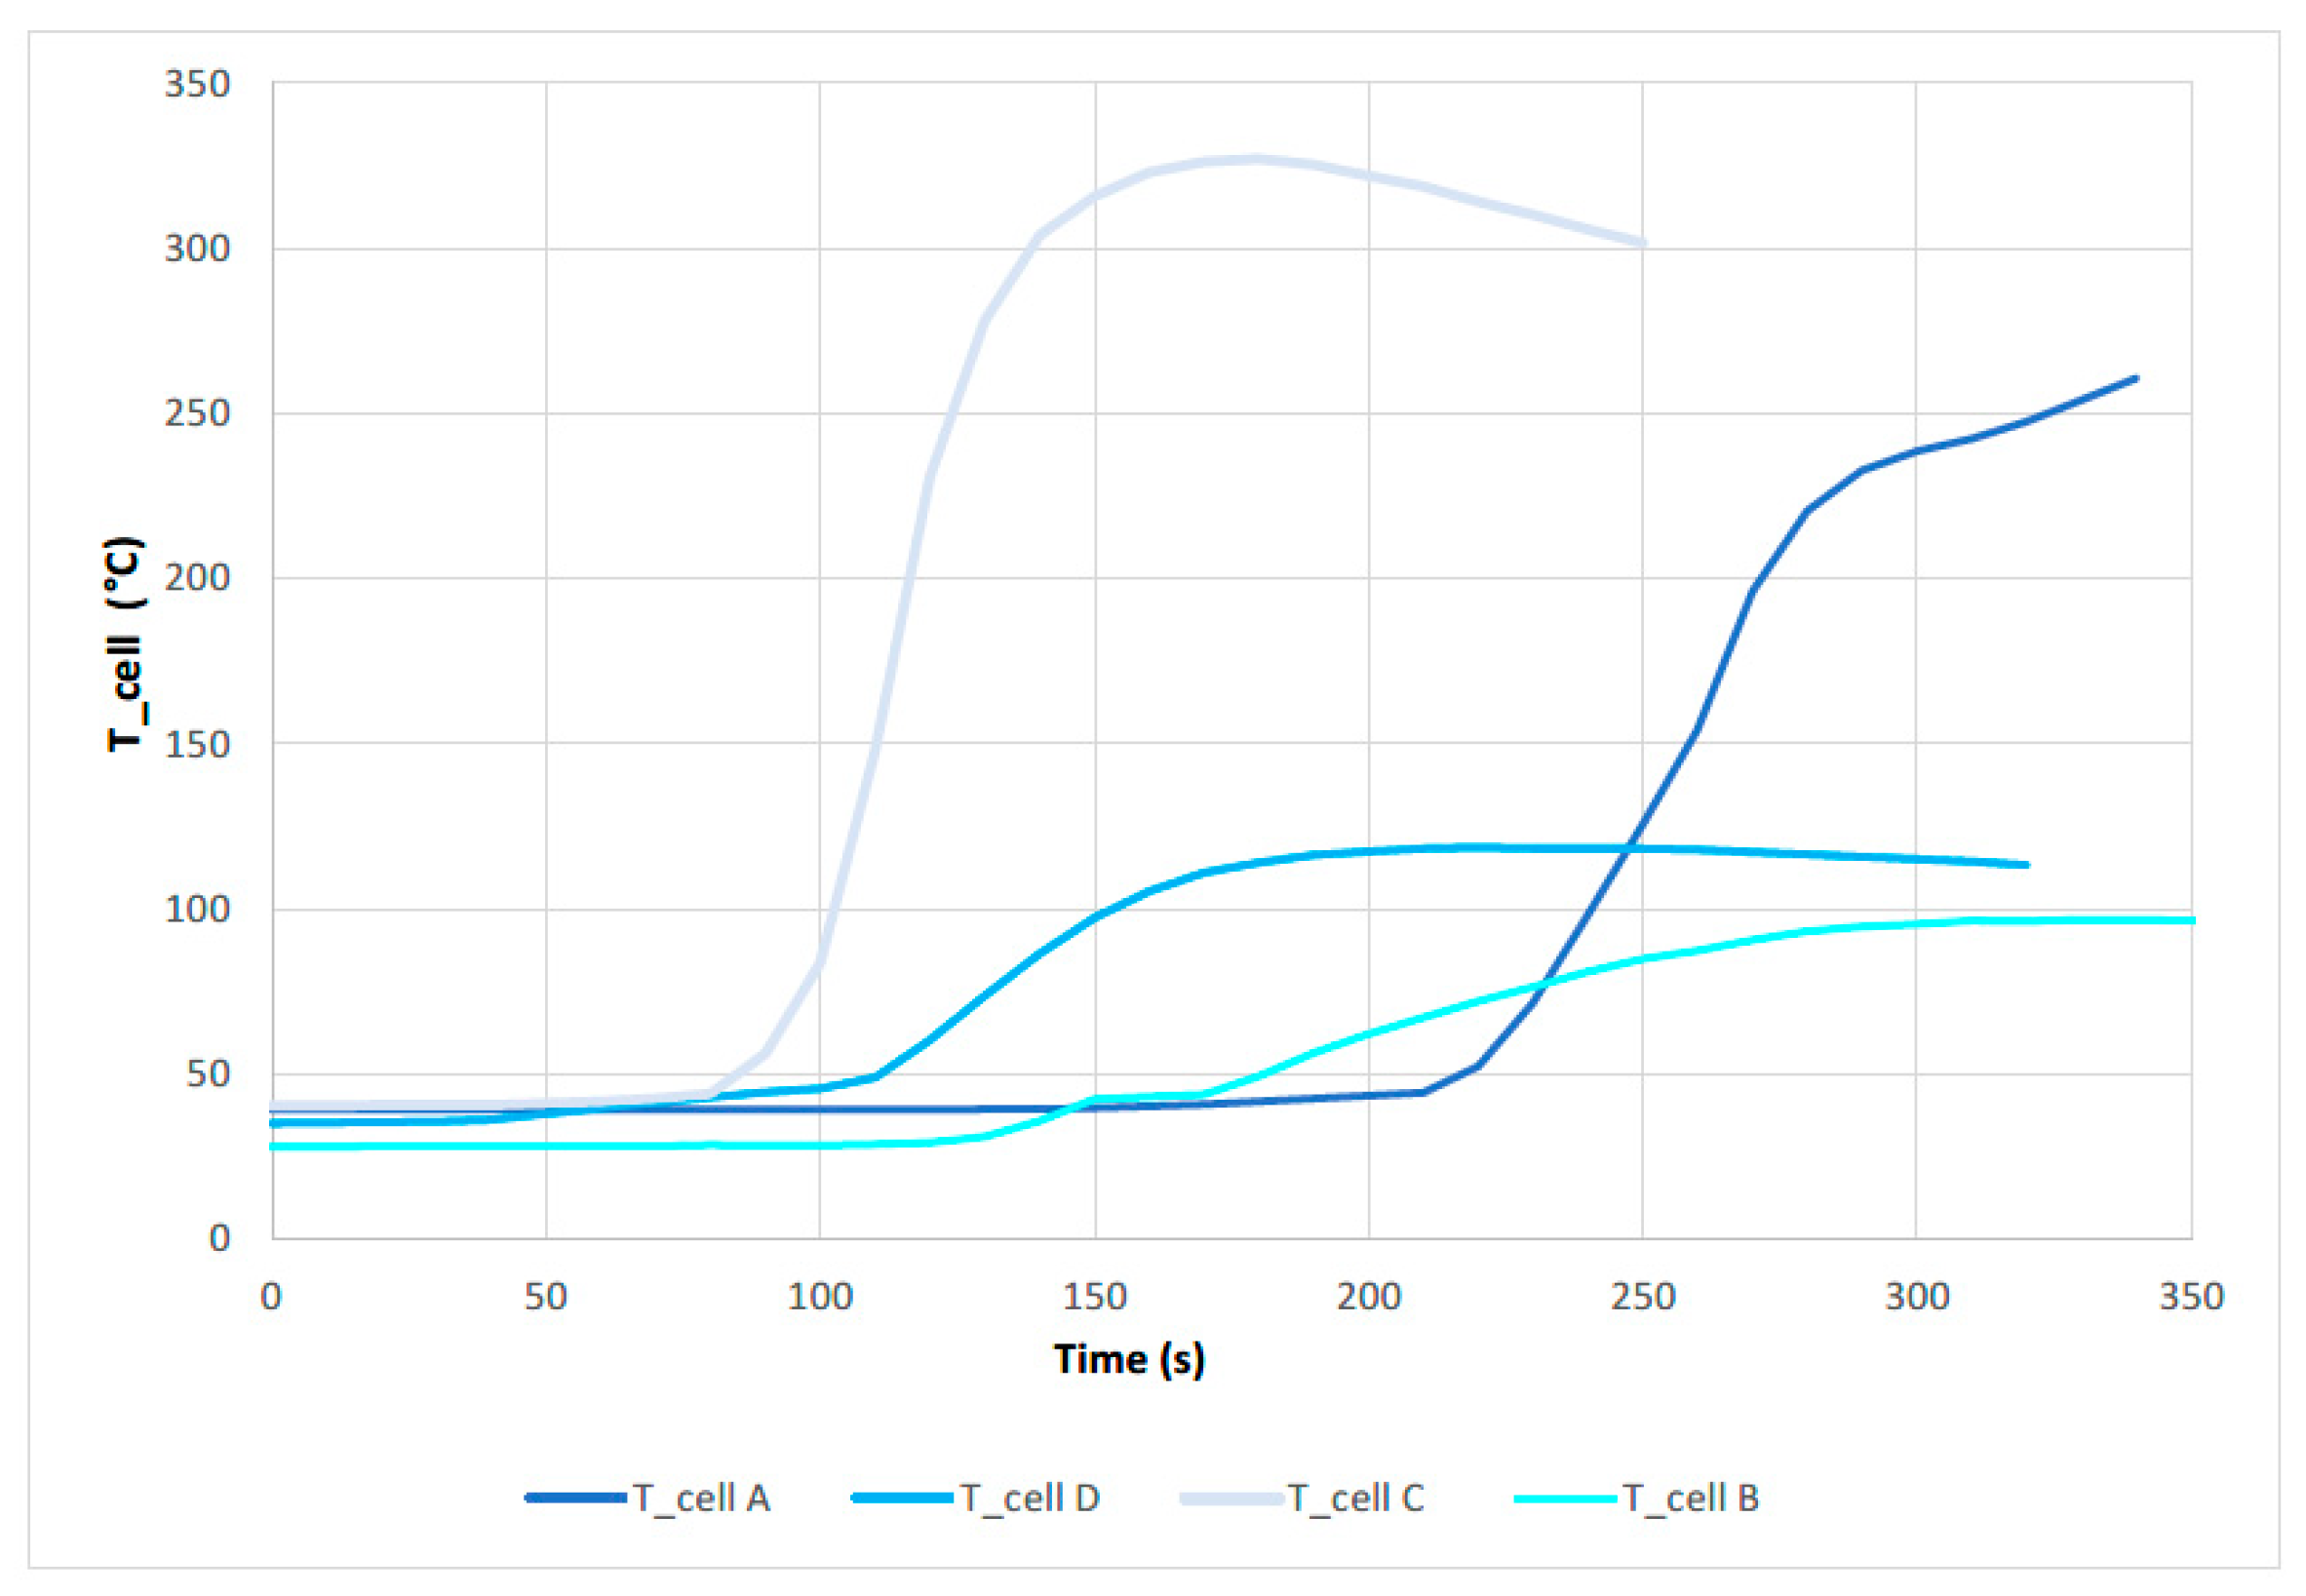
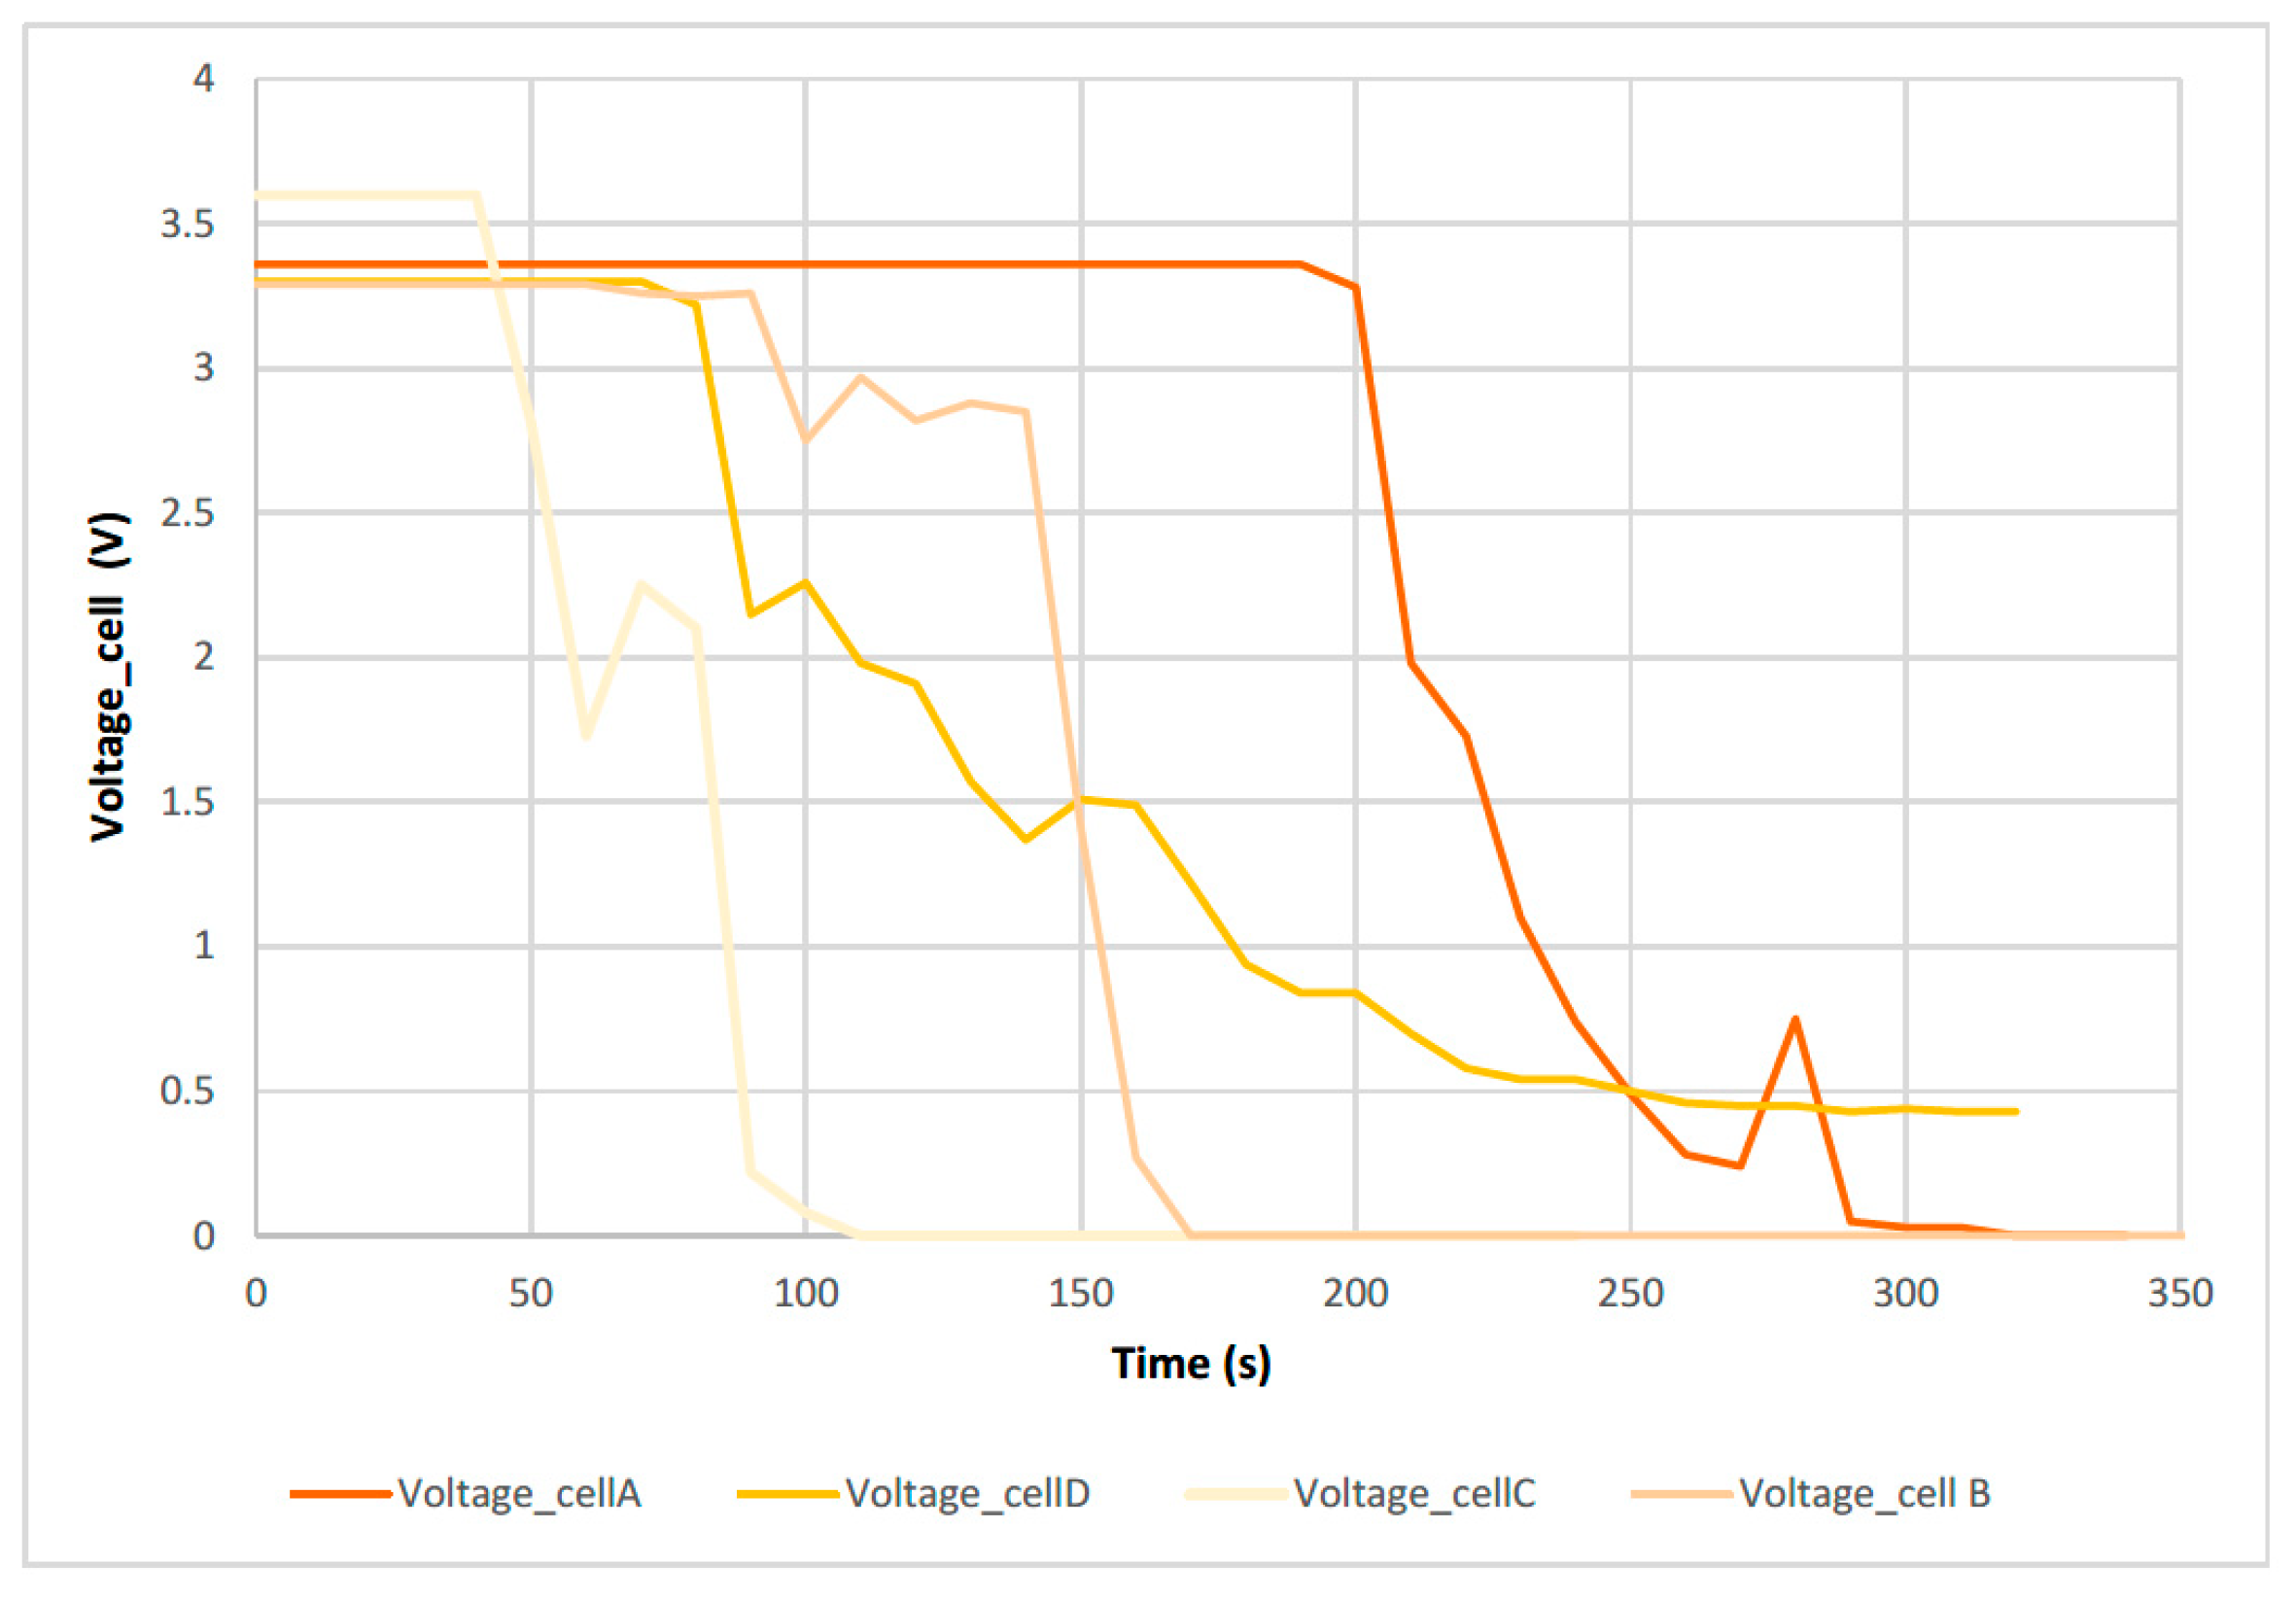
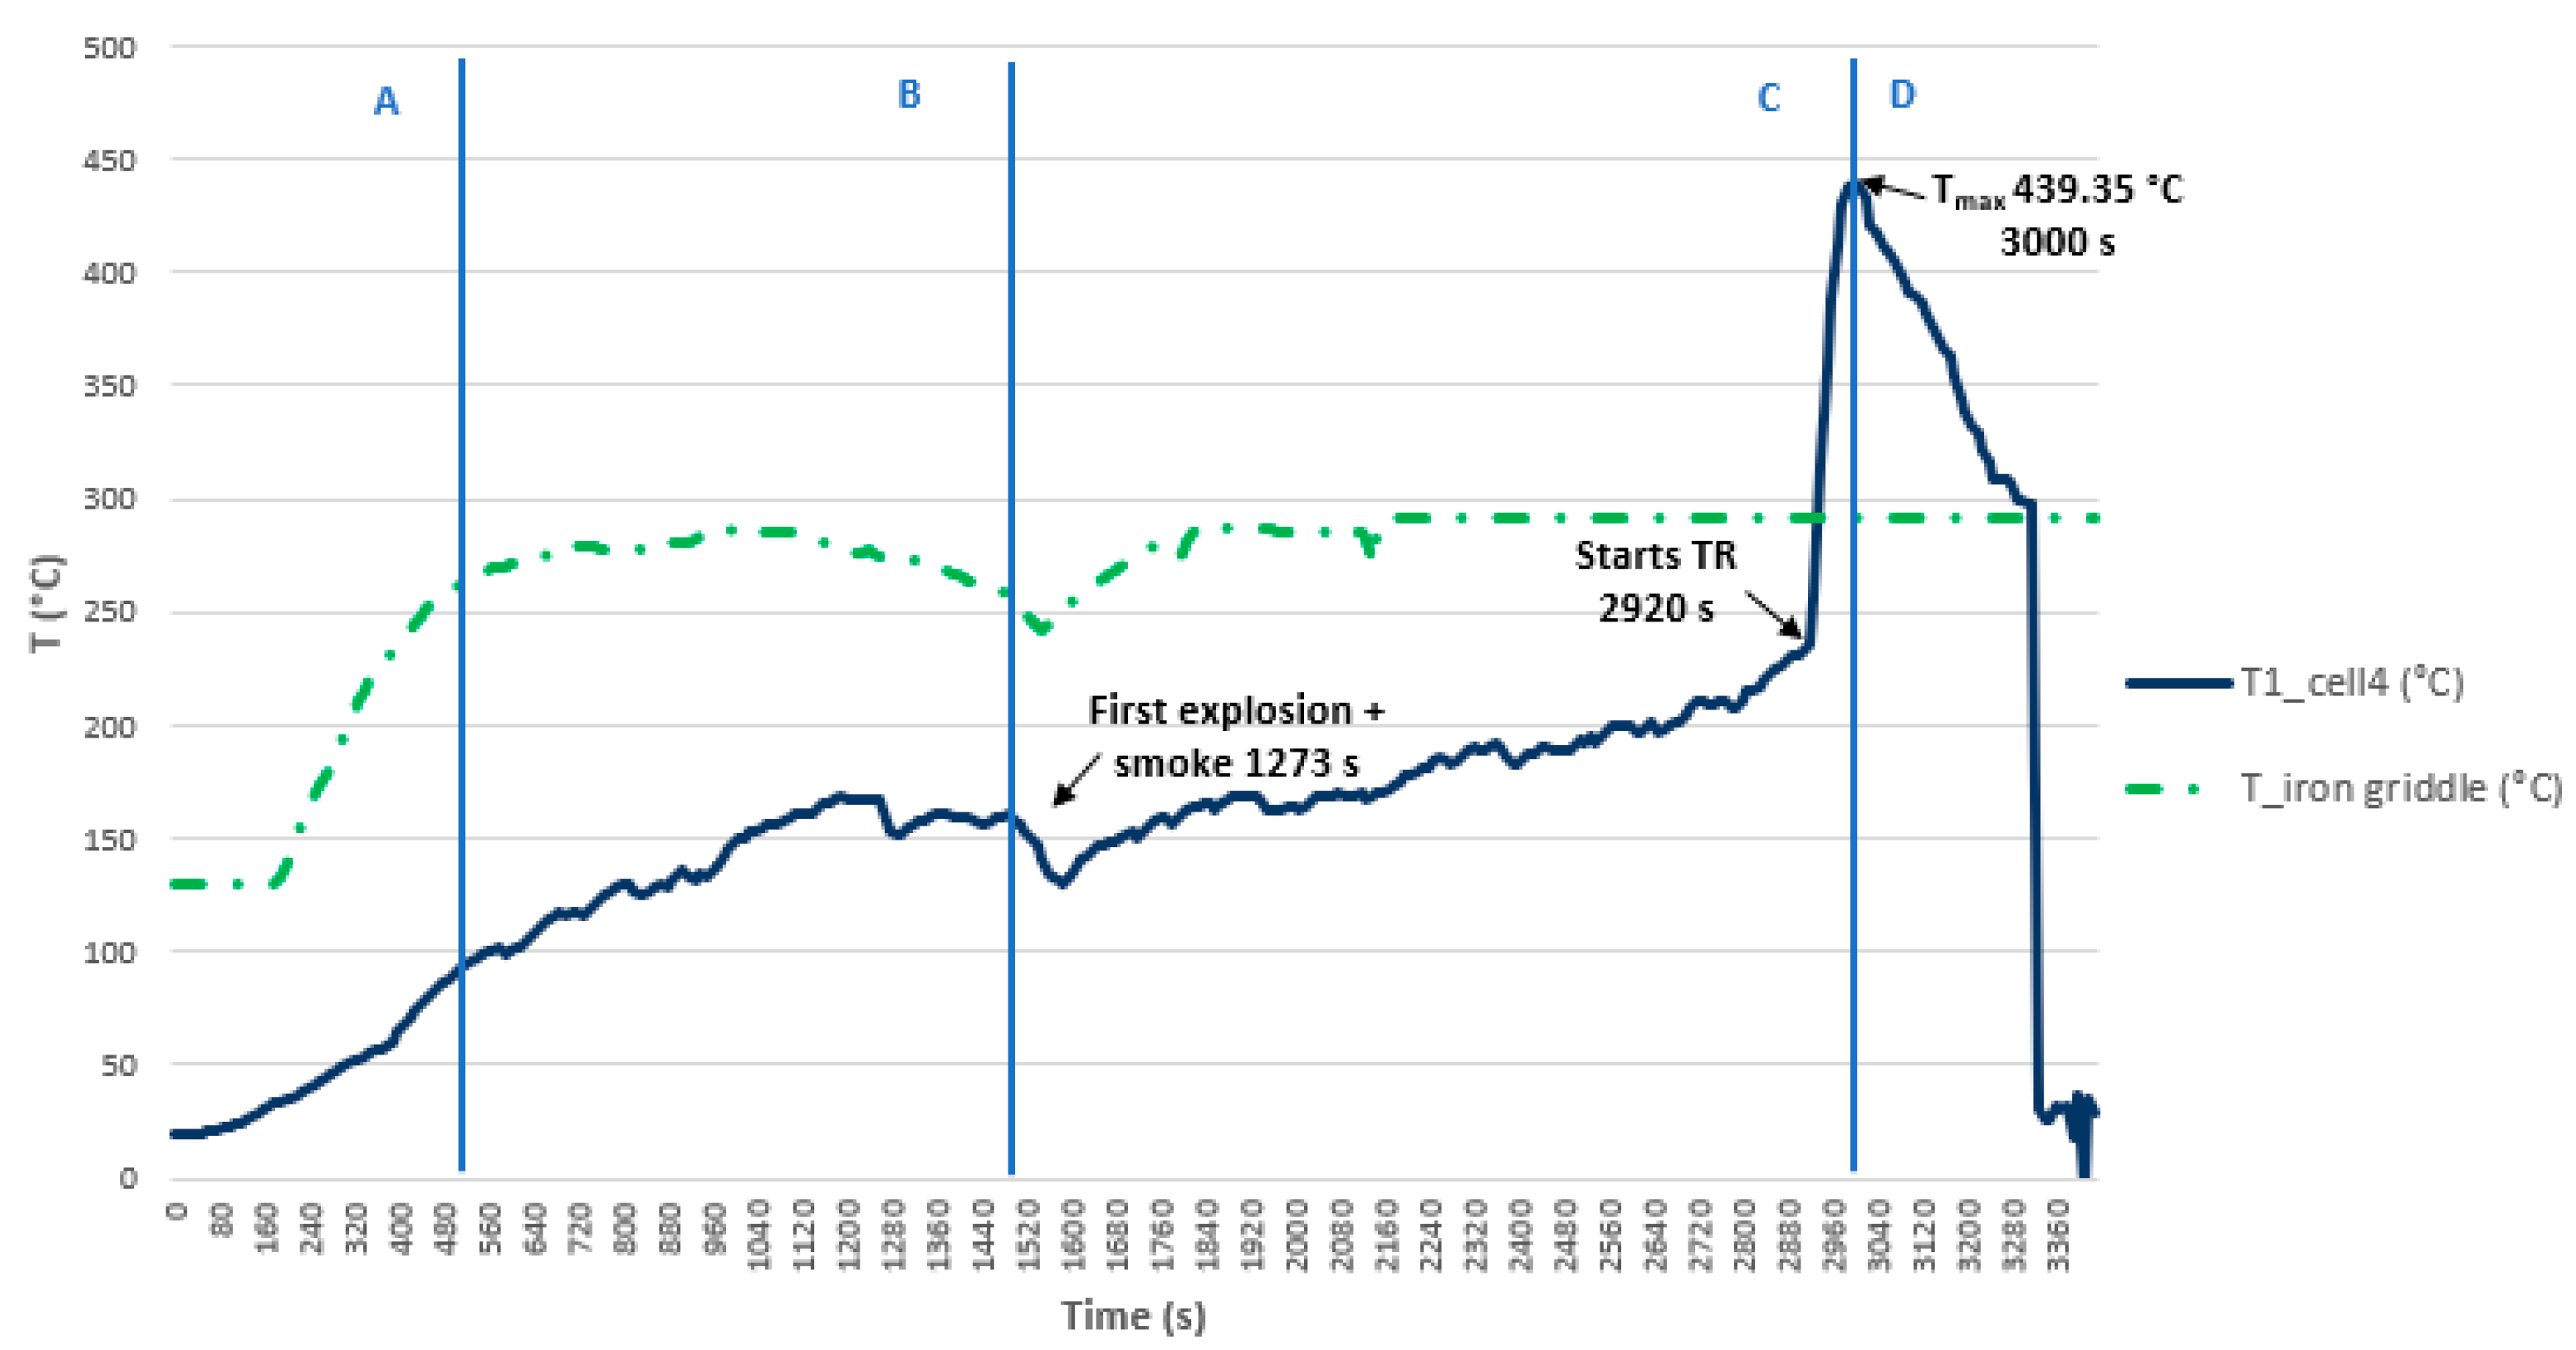
3.3. Thermal Abuse Test Result: Heating

In the thermal abuse by heating, using thermocouples, a thermographic camera, and voltmeters, the time and temperature at which the main events occur during this type of abuse on the cells tested were determined. According to studies carried out [46] with 18650 Lithium-ion cells, the following phases have been identified:
Initiation of TR with smoke production without flame.
Venting and ignition of the released gases, during which a flame is visible.
Catastrophic failure of the cell with the presence of flame.
The results of the various thermal abuse tests carried out on different cell arrangements in terms of position (vertical or horizontal) and connection (series or parallel connection), and on different states of charge are shown below.

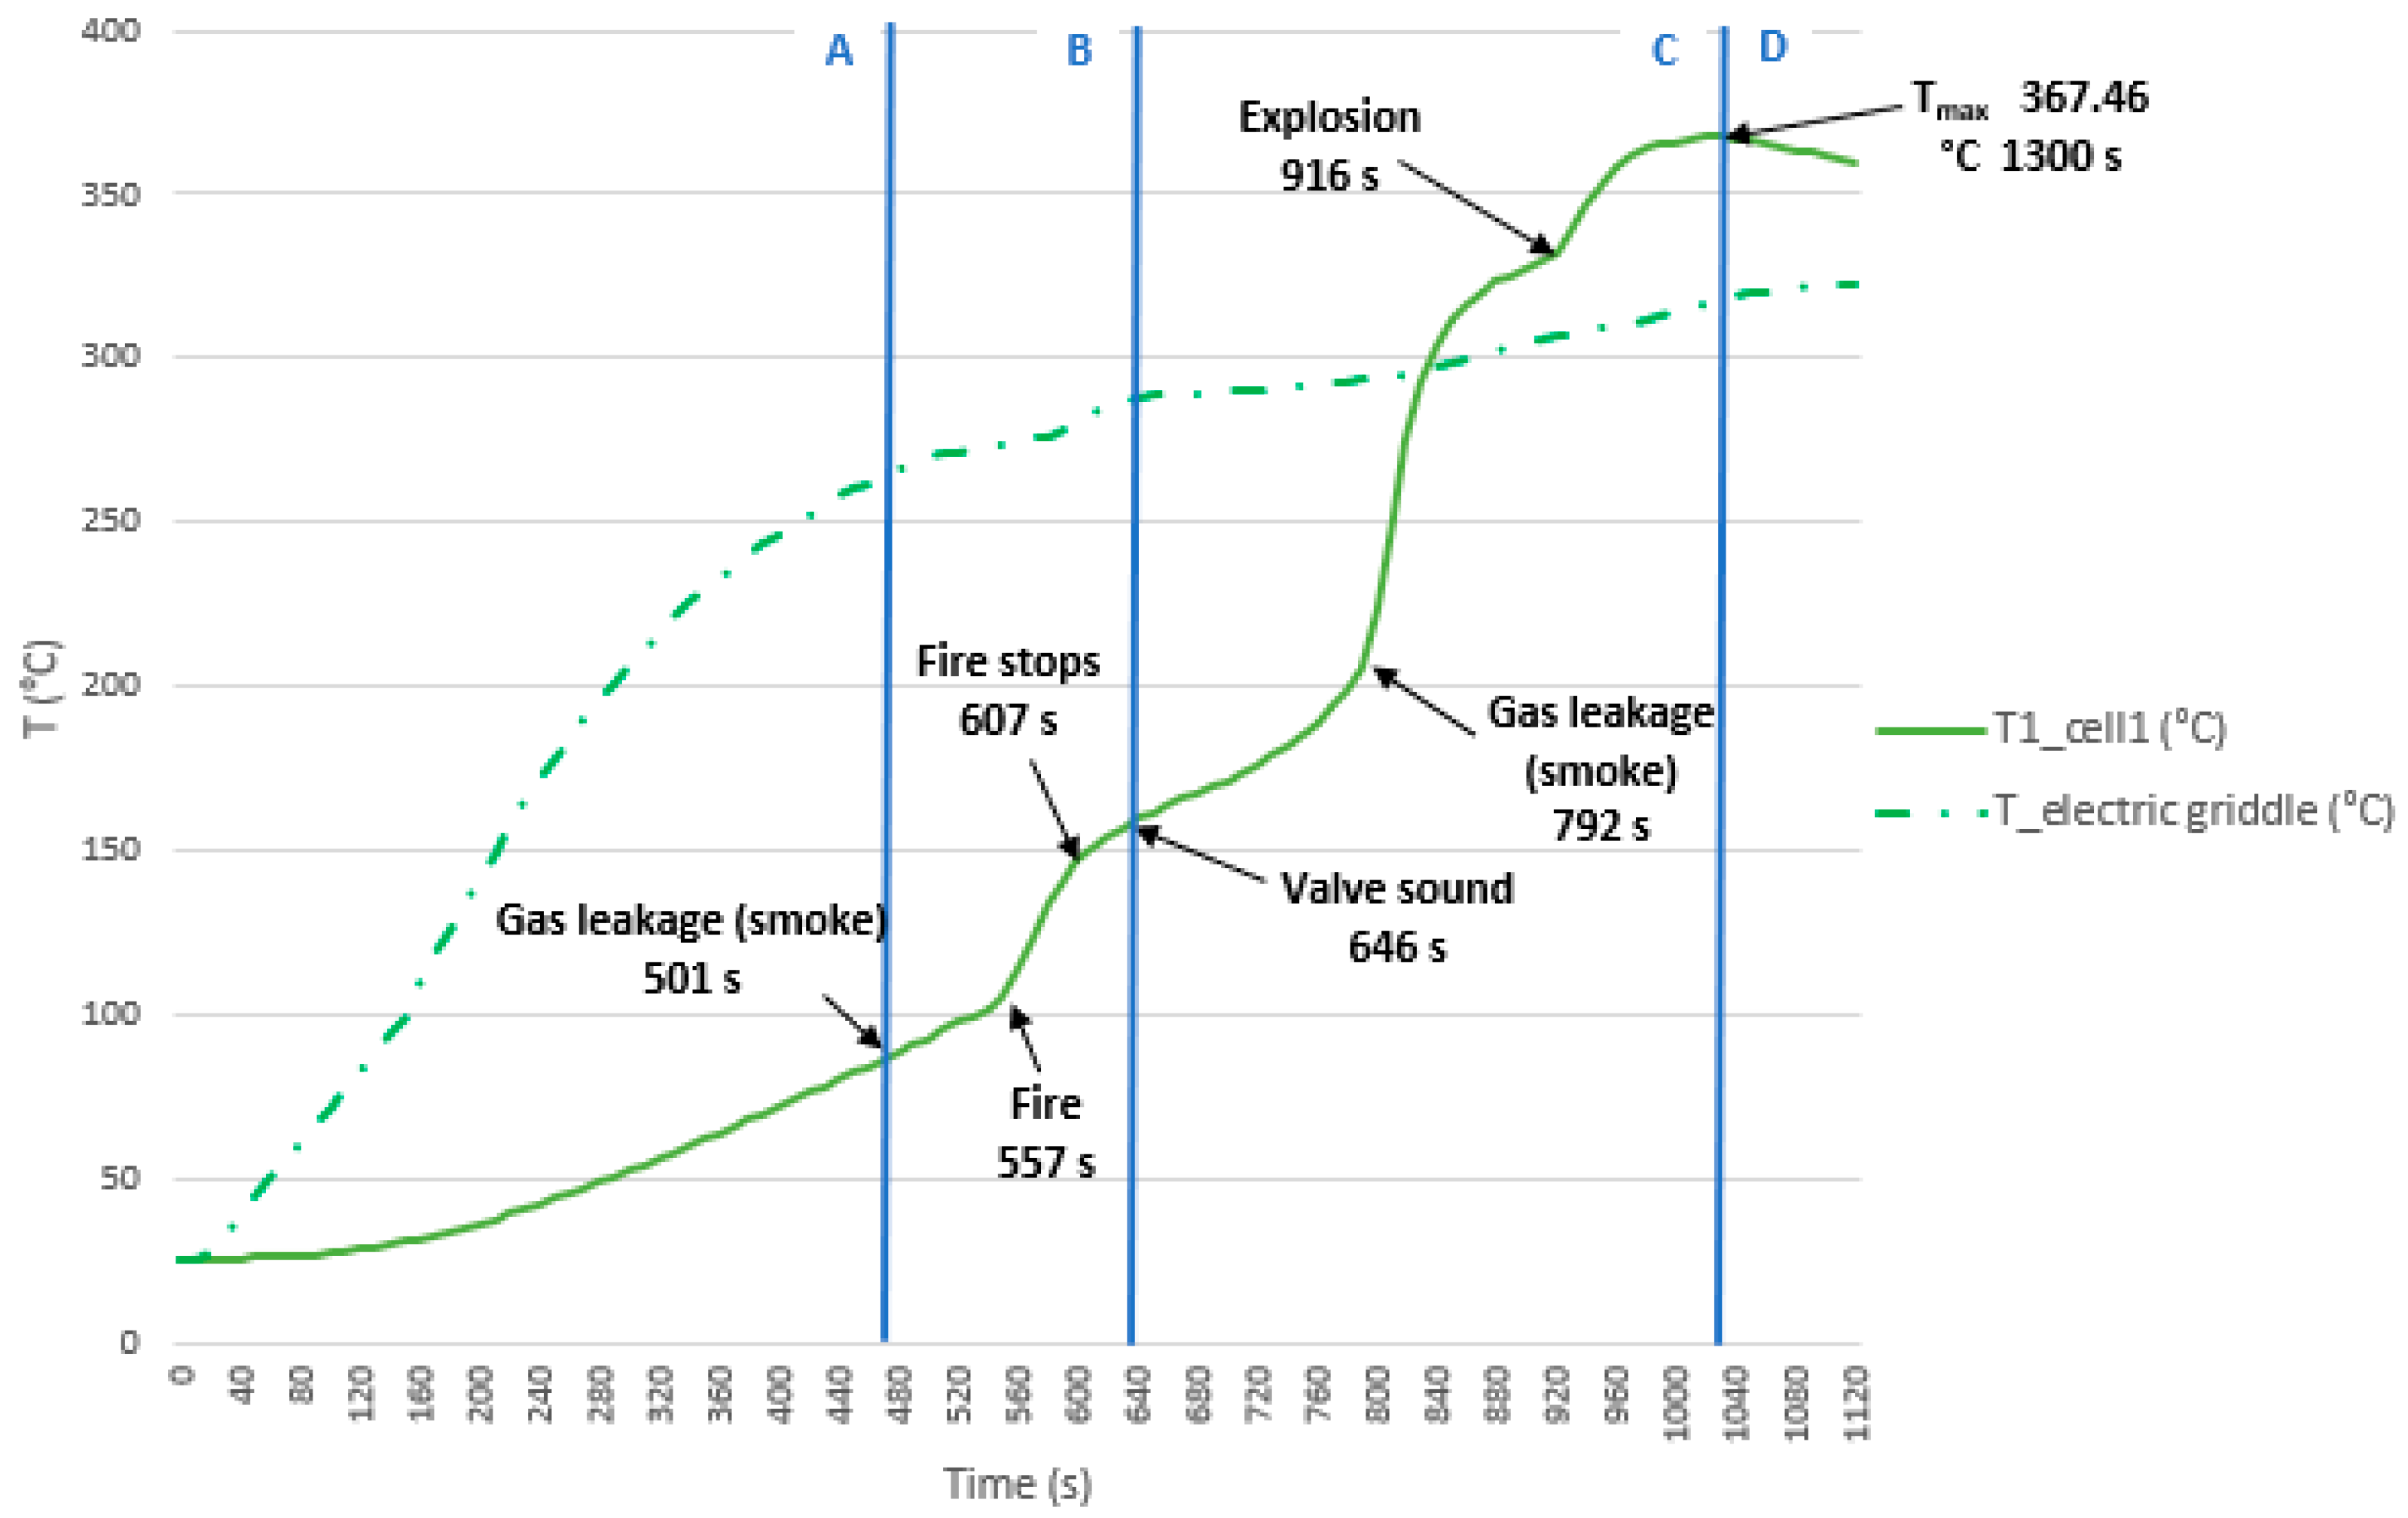
3.3.1. Test 1: Vertical, Series Connection and SoC 100% (Cell 4 Below and Cell 3 Above)

The test is carried out on two 32700 cylindrical cells in vertical arrangement connected in series, each having an SoC of 100%. The type K thermocouple is placed on cell 4 to measure the temperature reached during the test. Figure 36 shows the state of the cells after the heating test.
A graph showing the temperature reached by the electric griddle and the temperature reached by cell 4 during the test can be seen below, and the different phases through which the cell passes during the test are identified (Figure 37). In this test, it takes a long time to reach the TR because the area where the test was carried out in this case was not completely sheltered from the wind. The day of the test was windy, which meant that the plate did not raise the temperature quickly. Therefore, from this test we can keep the value of the maximum temperature reached (439.35 °C) during the Thermal Runaway process, but not the time in which the maximum temperature is reached.
The regions indicate the following: (A) cell surface temperature below 90 °C, only due to induction heating of the griddle, (B) cell temperature >90 °C, heating plus heating contribution due to internal cell reactions, (C) TR, and (D) cooling.

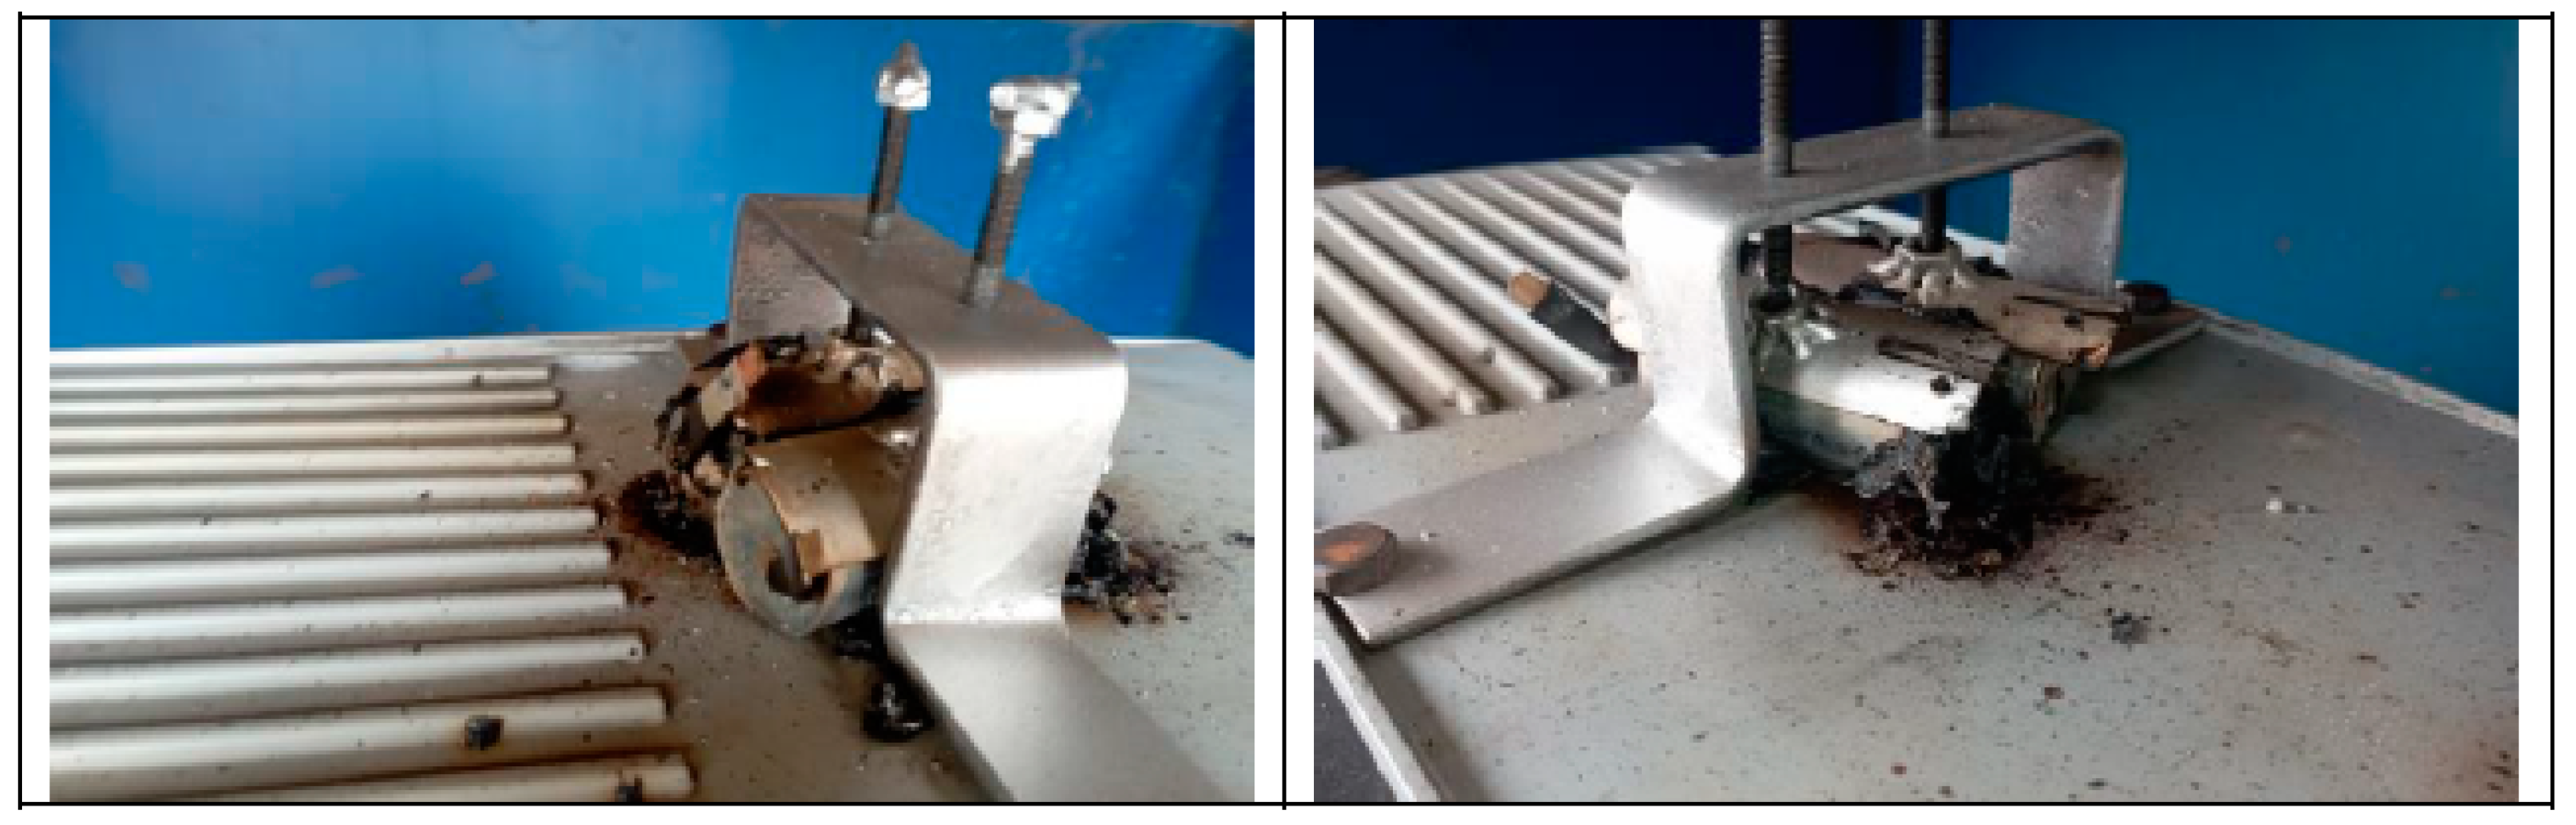
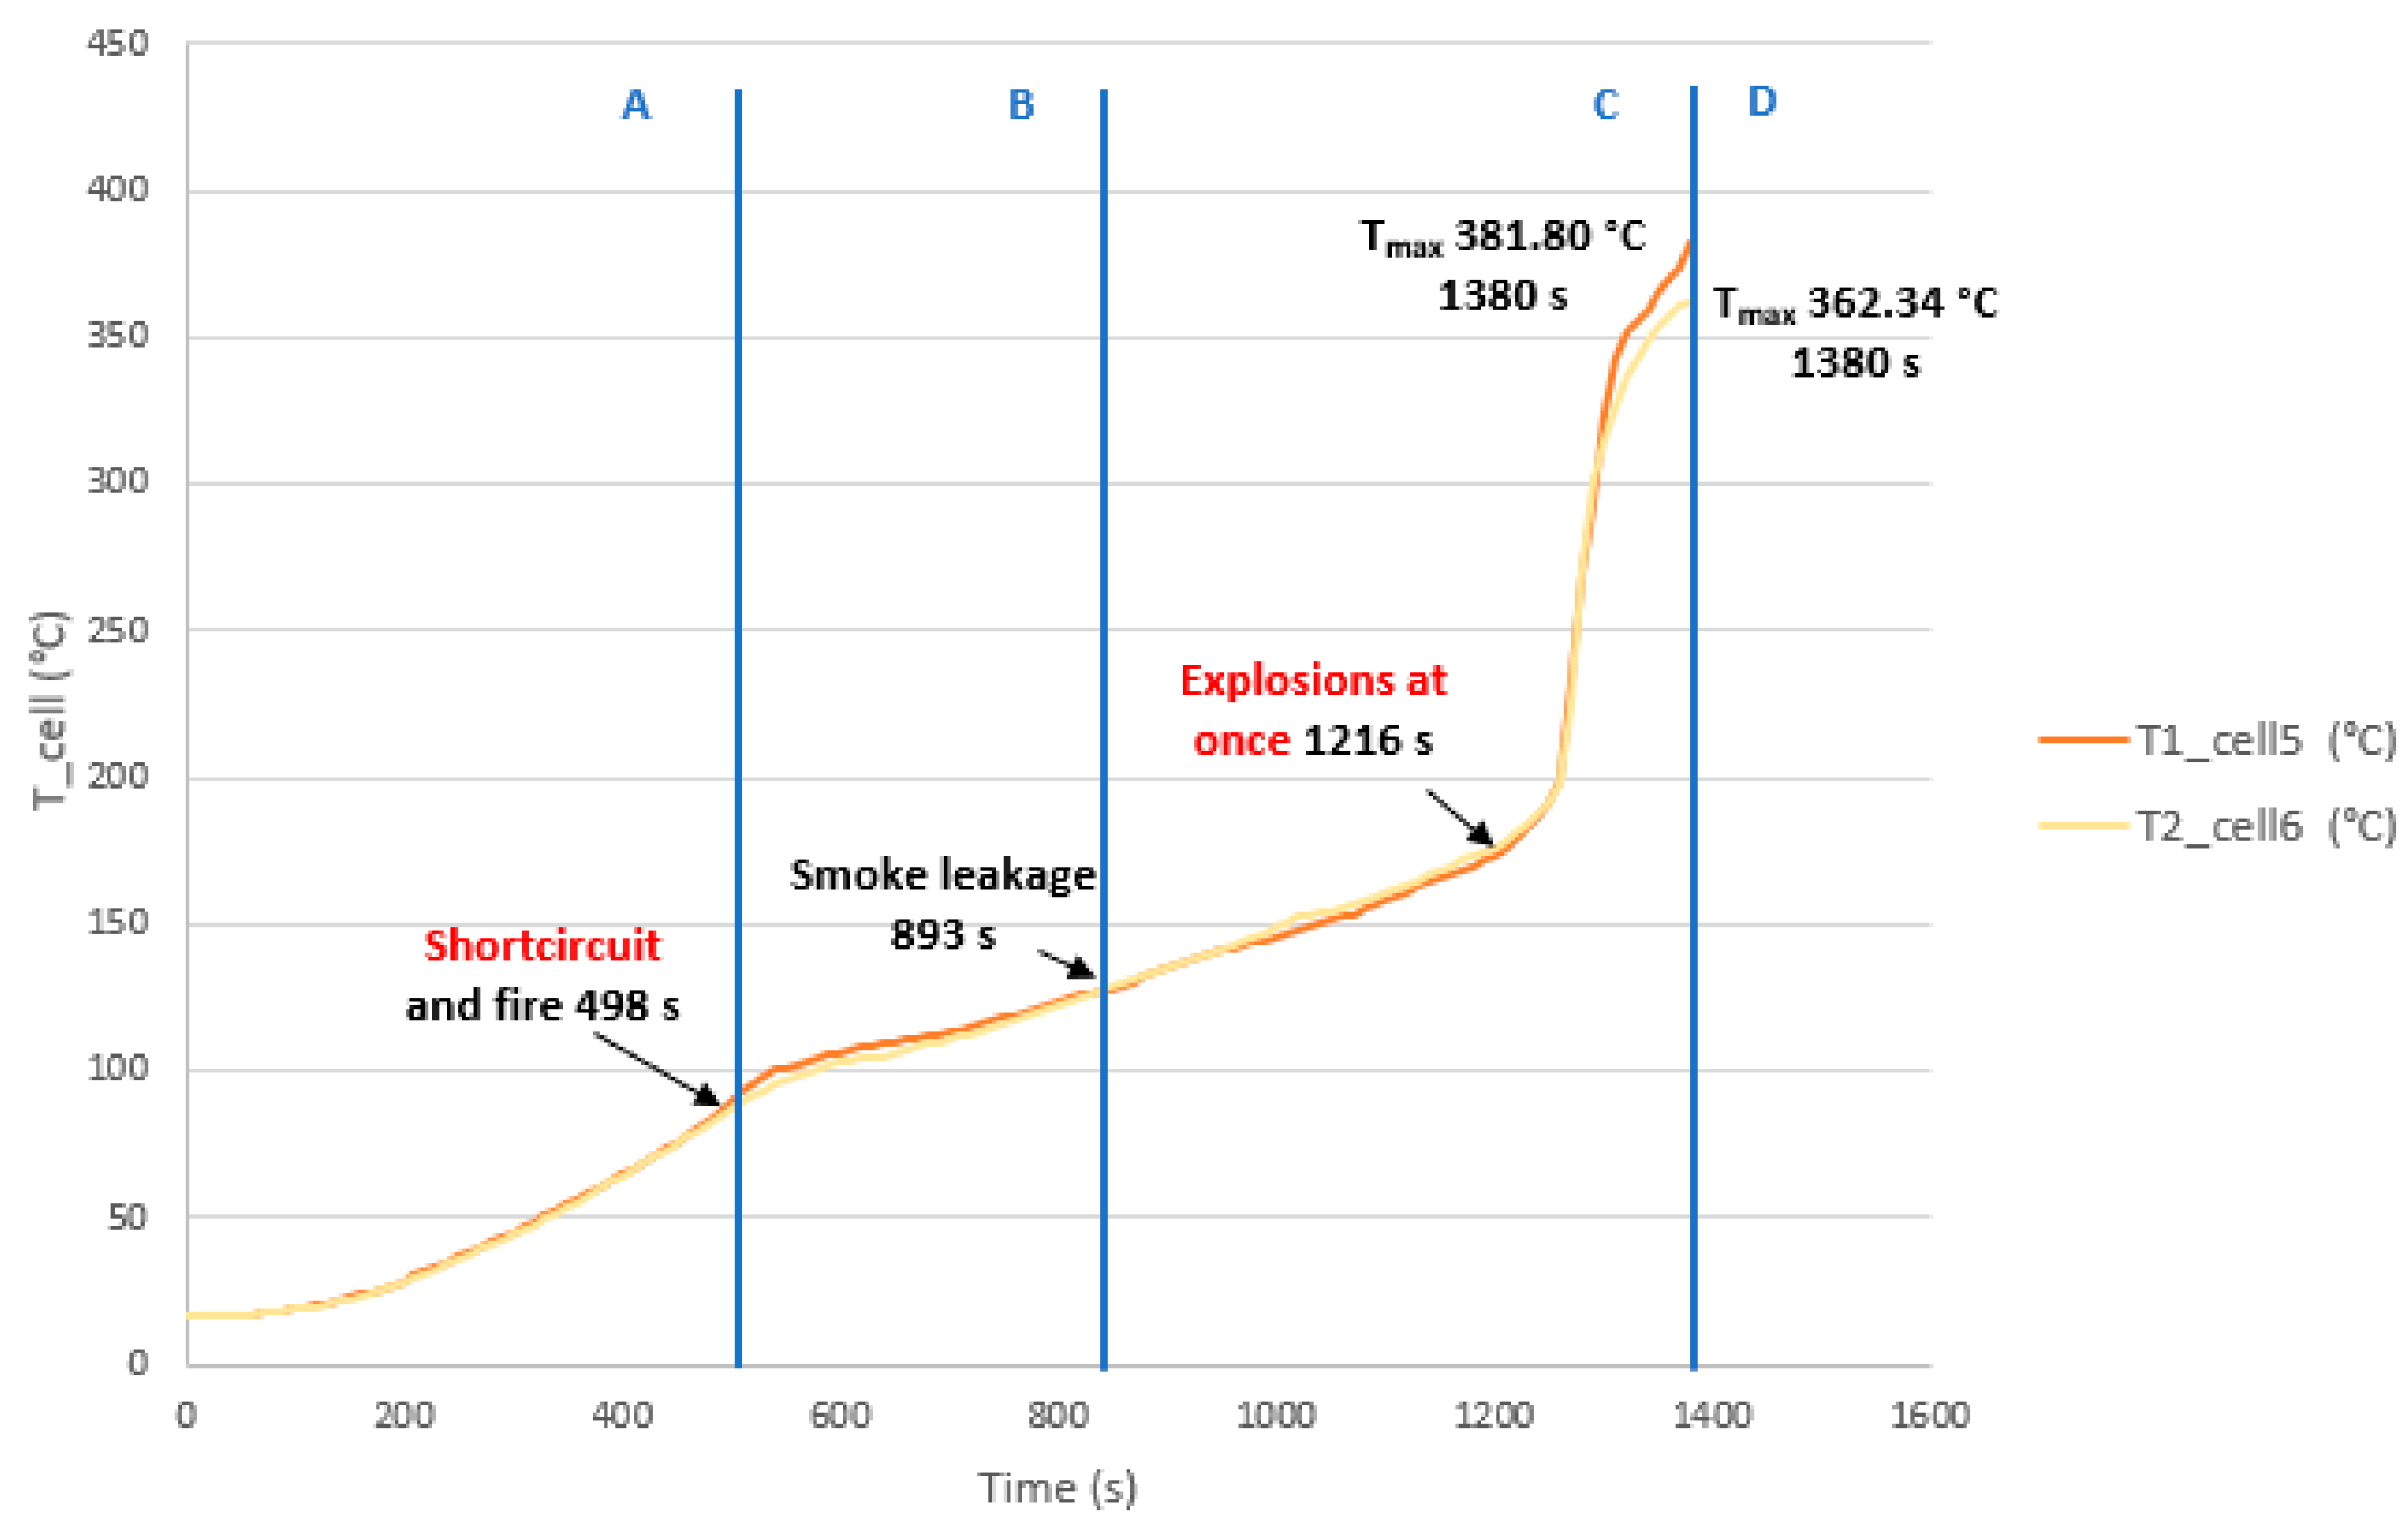
3.3.2. Test 2: Horizontal, Series Connection and SoC 100% (Cell 5 and Cell 6)

The second test is performed on two horizontally arranged 32700 cylindrical cells connected in series, each having an SoC of 100%. Two K-type thermocouples are placed on cell 5 and cell 6, respectively, to measure their temperature. Figure 38 shows the state of the cells after the heating test.
Figure 39 shows the temperature reached by the griddle and the temperature reached by cell 5 and cell 6, respectively; the graphs identify the different phases through which the cell passes during the test.
In this test, the TR is reached earlier because the area is already sheltered from the wind. It is observed that the temperature profile is similar for cell 5 and cell 6 as they are arranged horizontally on the heating plate. In this test, the maximum temperature value reached in the case of cell 5 is 381.80 °C, and in the case of cell 6, it is 362.24 °C during the Thermal Runaway process, although the cooling phase is not recorded.

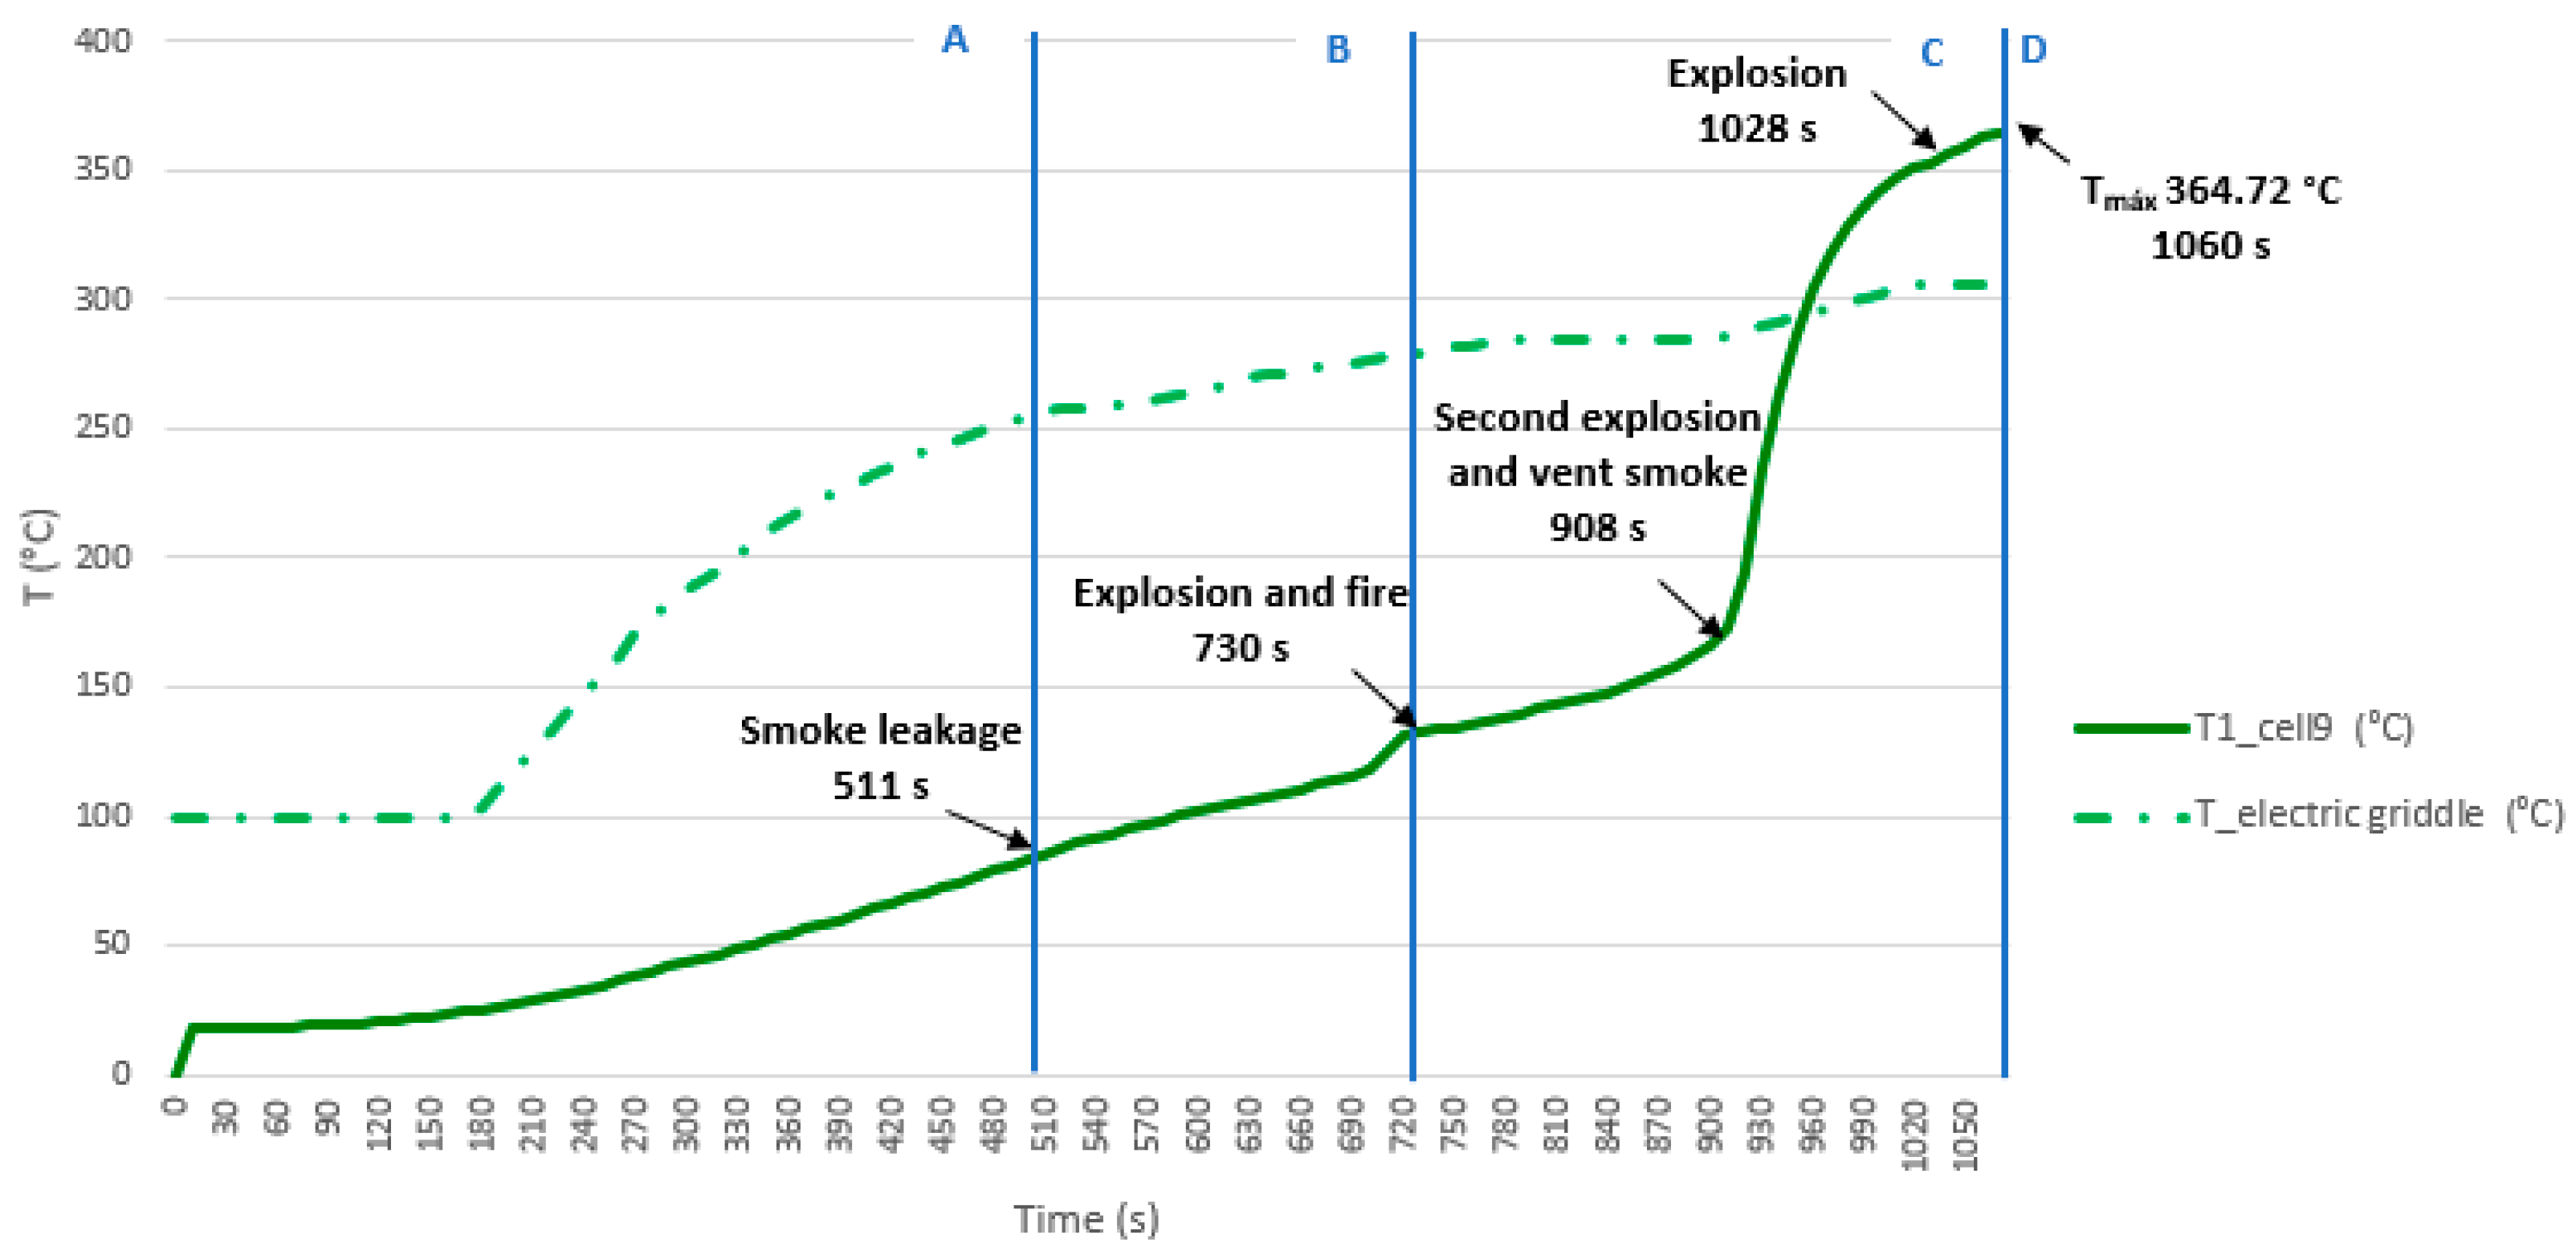
3.3.3. Test 3: Horizontal, Parallel Connection and SoC 100% (Cell 9 and Cell 10)

The third test is performed on two horizontally arranged 32700 cylindrical cells connected in parallel, each having an SoC of 100%. The K-type thermocouple is placed on cell 9 to measure its temperature. Figure 40 shows the state of the cells after the heating test.
Figure 41 shows the temperature reached by the electric griddle and the temperature reached by the cell 9, and the different phases through which the cell passes during the test are identified on the graphs. From the second test onwards, the tests are carried out in a space with a structure sheltered from the wind. It has already been observed in test 2 that the temperature profile of the two cells placed horizontally on the heating plate was similar; in this test, the thermocouple is only placed in one of the cells in the horizontal arrangement, specifically in cell 9. In this test, the maximum temperature value reached in the case of cell 9 is 364.72 °C during the TR process, although the cooling phase is not recorded during the test. It is observed that, in horizontal arrangement with the same SoC, the TR is reached earlier if the cells are connected in parallel.

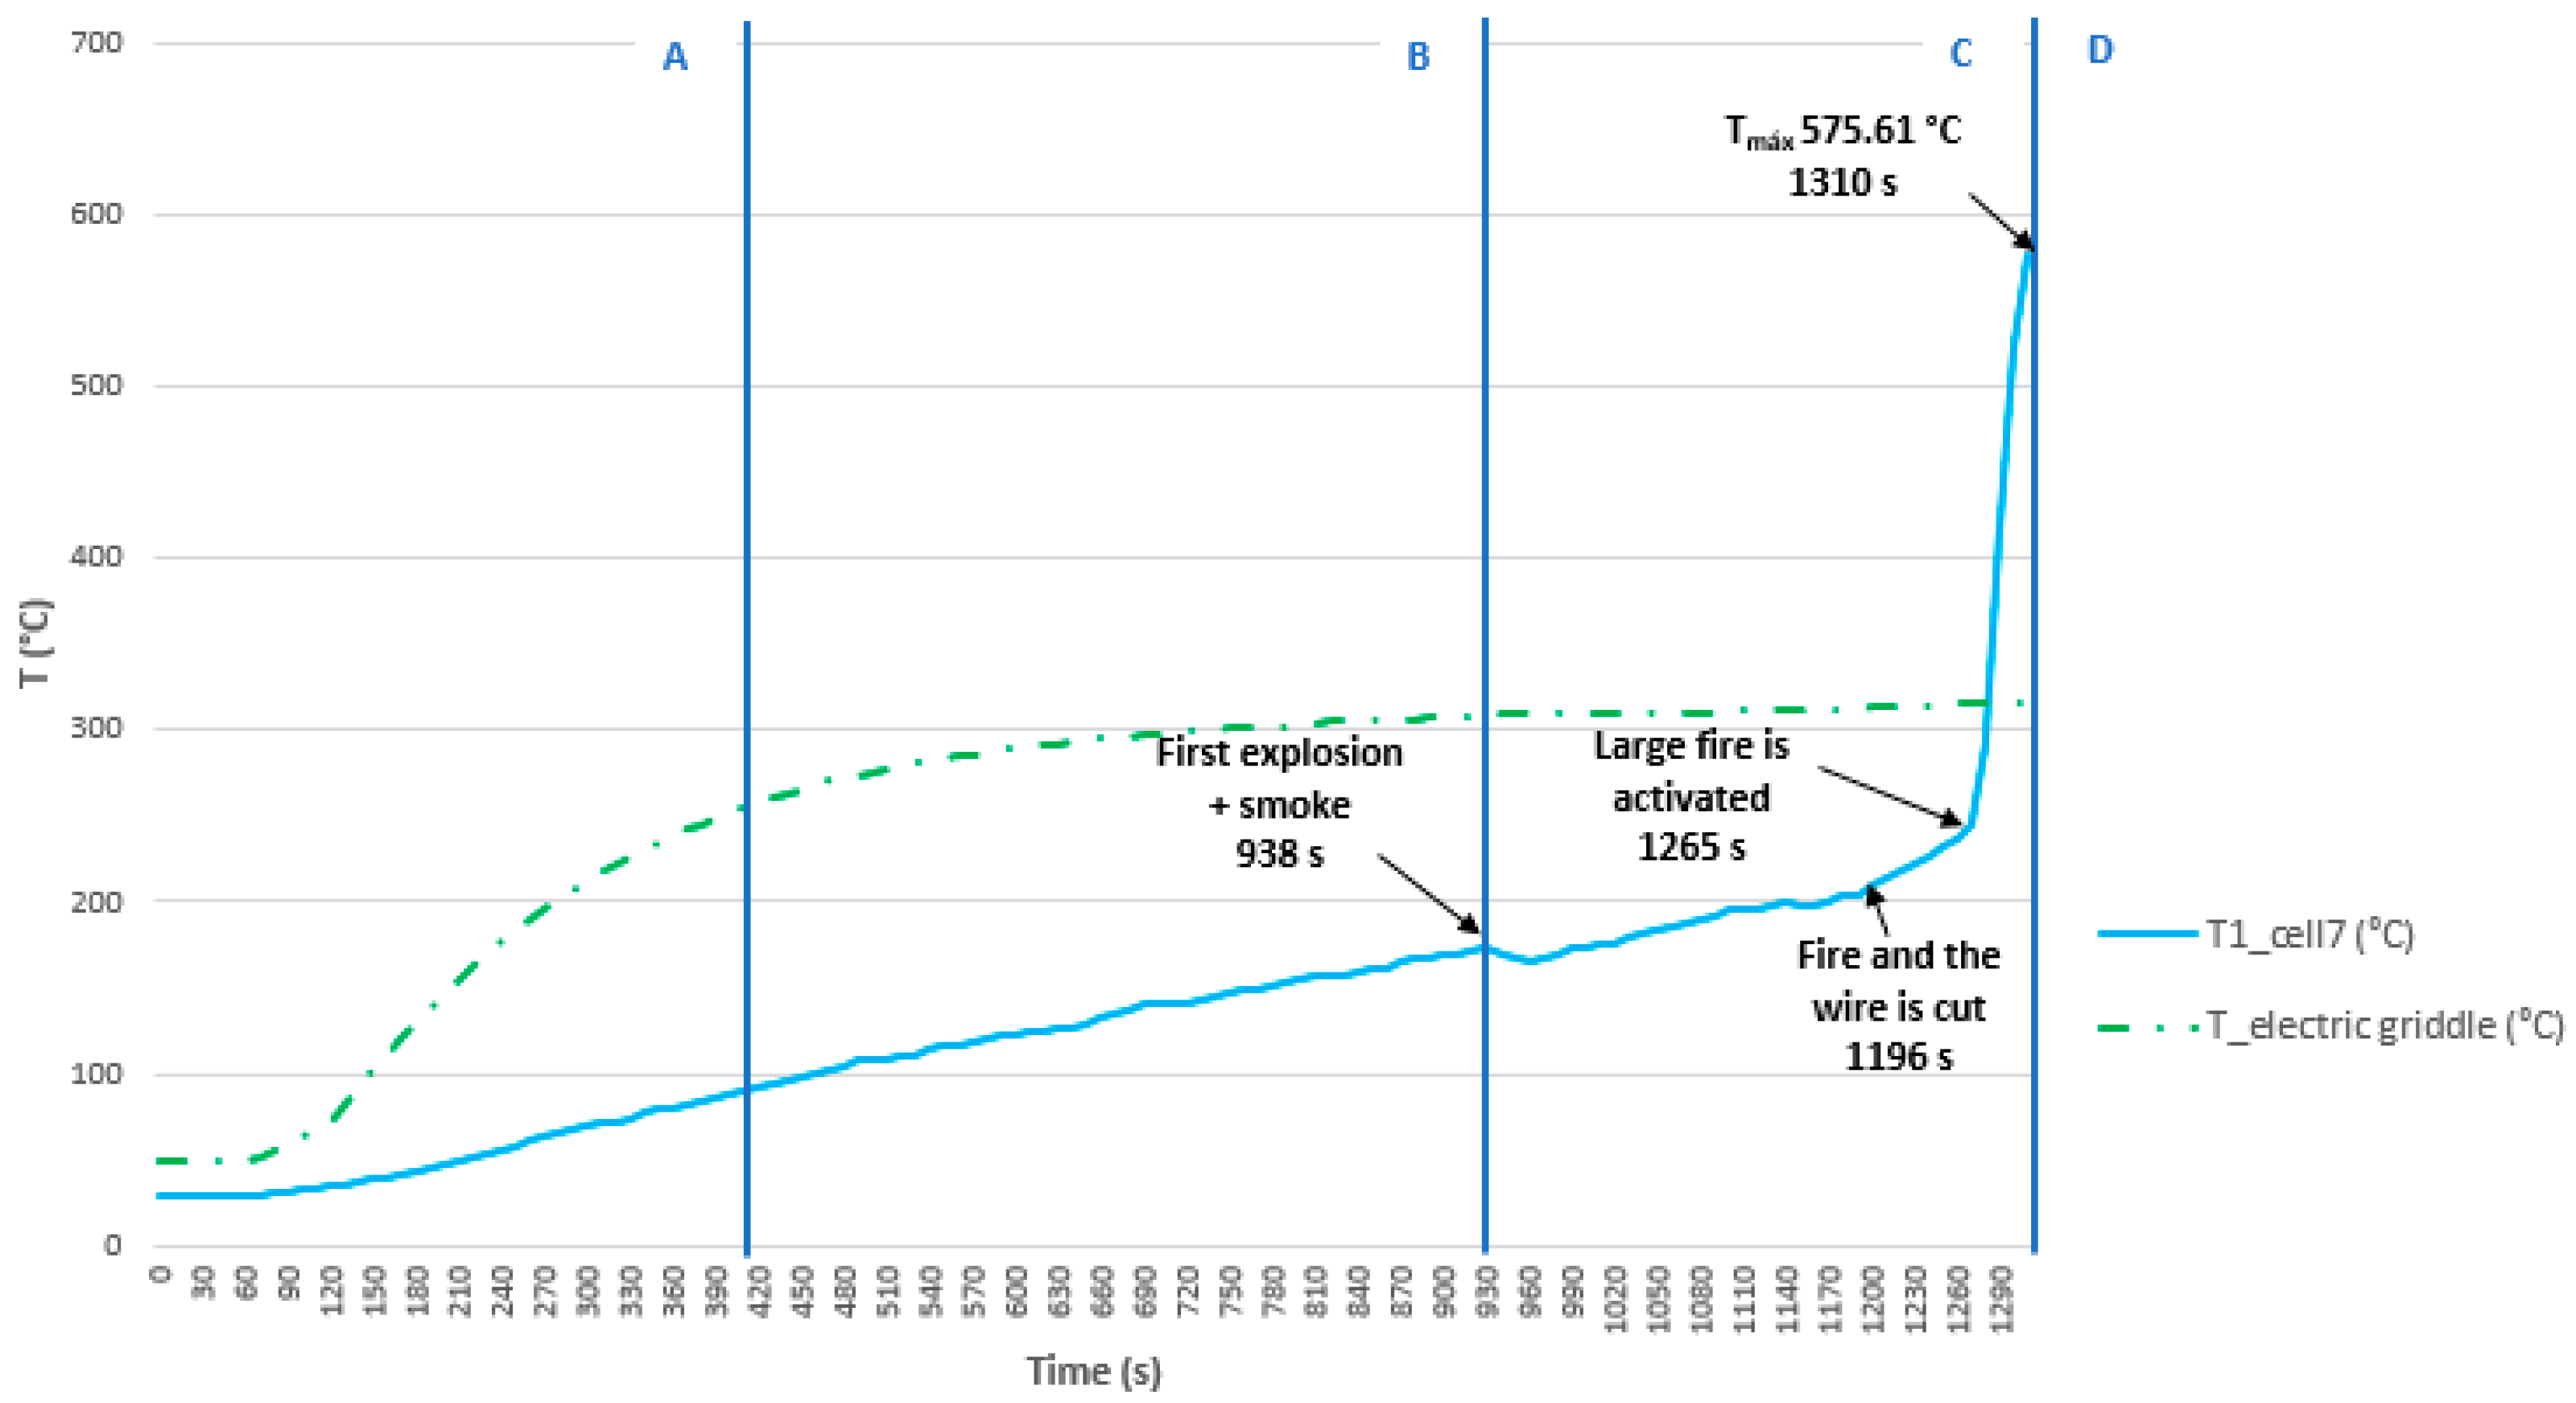
3.3.4. Test 4: Vertical, Parallel Connection and SoC 100% (Cell 7 (Below) and Cell 8)

The test is carried out on two 32700 cylindrical cells in vertical arrangement connected in parallel, and each having an SoC of 100%. The type K thermocouple is placed on cell 7 to measure its temperature; this cell is the one placed underneath and in contact with the electric griddle. Figure 42 shows the state of the cells after the heating test:
In Figure 42, cell 7 is more damaged than cell 8, as it is the one that is more exposed to heat and experiences TR. Figure 43 shows the temperature reached by the grill and the temperature reached by cell 7, the different phases through which the cell passes during the test are identified on the graphs. In this test, the maximum temperature reached in the case of cell 7 is 575.61 °C, during the Thermal Runaway process, although the cooling phase is not recorded during the test. It is observed that in vertical arrangement with identical SoC, in this case 100%, the maximum temperature reached in the Thermal Runaway process is higher when the cells were connected in parallel rather than in series.

3.3.5. Test 5: Vertical, Parallel Connection and SoC 50% (Cell 11 (Below) and Cell 12)

The test is carried out on two 32700 cylindrical cells in vertical arrangement connected in parallel, and each having an SoC of 50%. The type K thermocouple is placed on cell 11 to measure its temperature; this cell is the one placed underneath and in contact with the electric griddle. Figure 44 shows the equipment before the test is performed.
Figure 45 shows the state of the cells after carrying out the heating test.
In the previous images, cell 11 is more damaged than cell 12 since it is the one that is most exposed to heat and the one that experiences TR. Figure 46 shows the temperature reached by the electric griddle and the temperature reached by cell 11. In this test, the maximum temperature reached in the case of cell 11 is 499.24 °C during the TR process. If the temperature profile of this test is compared with the previous one, it is observed that as the SoC decreases, the maximum temperature reached is lower, and the time to reach the maximum temperature is longer.

3.3.6. Test 6: Horizontal, Parallel Connection and SoC 50% (Cell 1 and Cell 2)

The test is carried out on two 32700 cylindrical cells in horizontal arrangement connected in parallel, and each having an SoC of 50%. The type K thermocouple is placed on cell 1 to measure its temperature; this cell is the one placed underneath and in contact with the electric griddle. Figure 47 shows the equipment before the test is performed.
Figure 48 shows the state of the cells after carrying out the heating test; the cells are more damaged in the upper part since the vent valve was activated, and that is where the gases escape.
Figure 49 shows the temperature reached by the electric griddle and the temperature reached by cell 1.
In this test, the maximum temperature value reached in the case of cell 1 is 367.46 °C during the TR process. If it is compared with the horizontal arrangement test with parallel connection and 100% SoC, it is observed that the temperature is approximately the same in the case of 50% SoC, but as the SoC decreases, it takes longer to reach the maximum temperature.

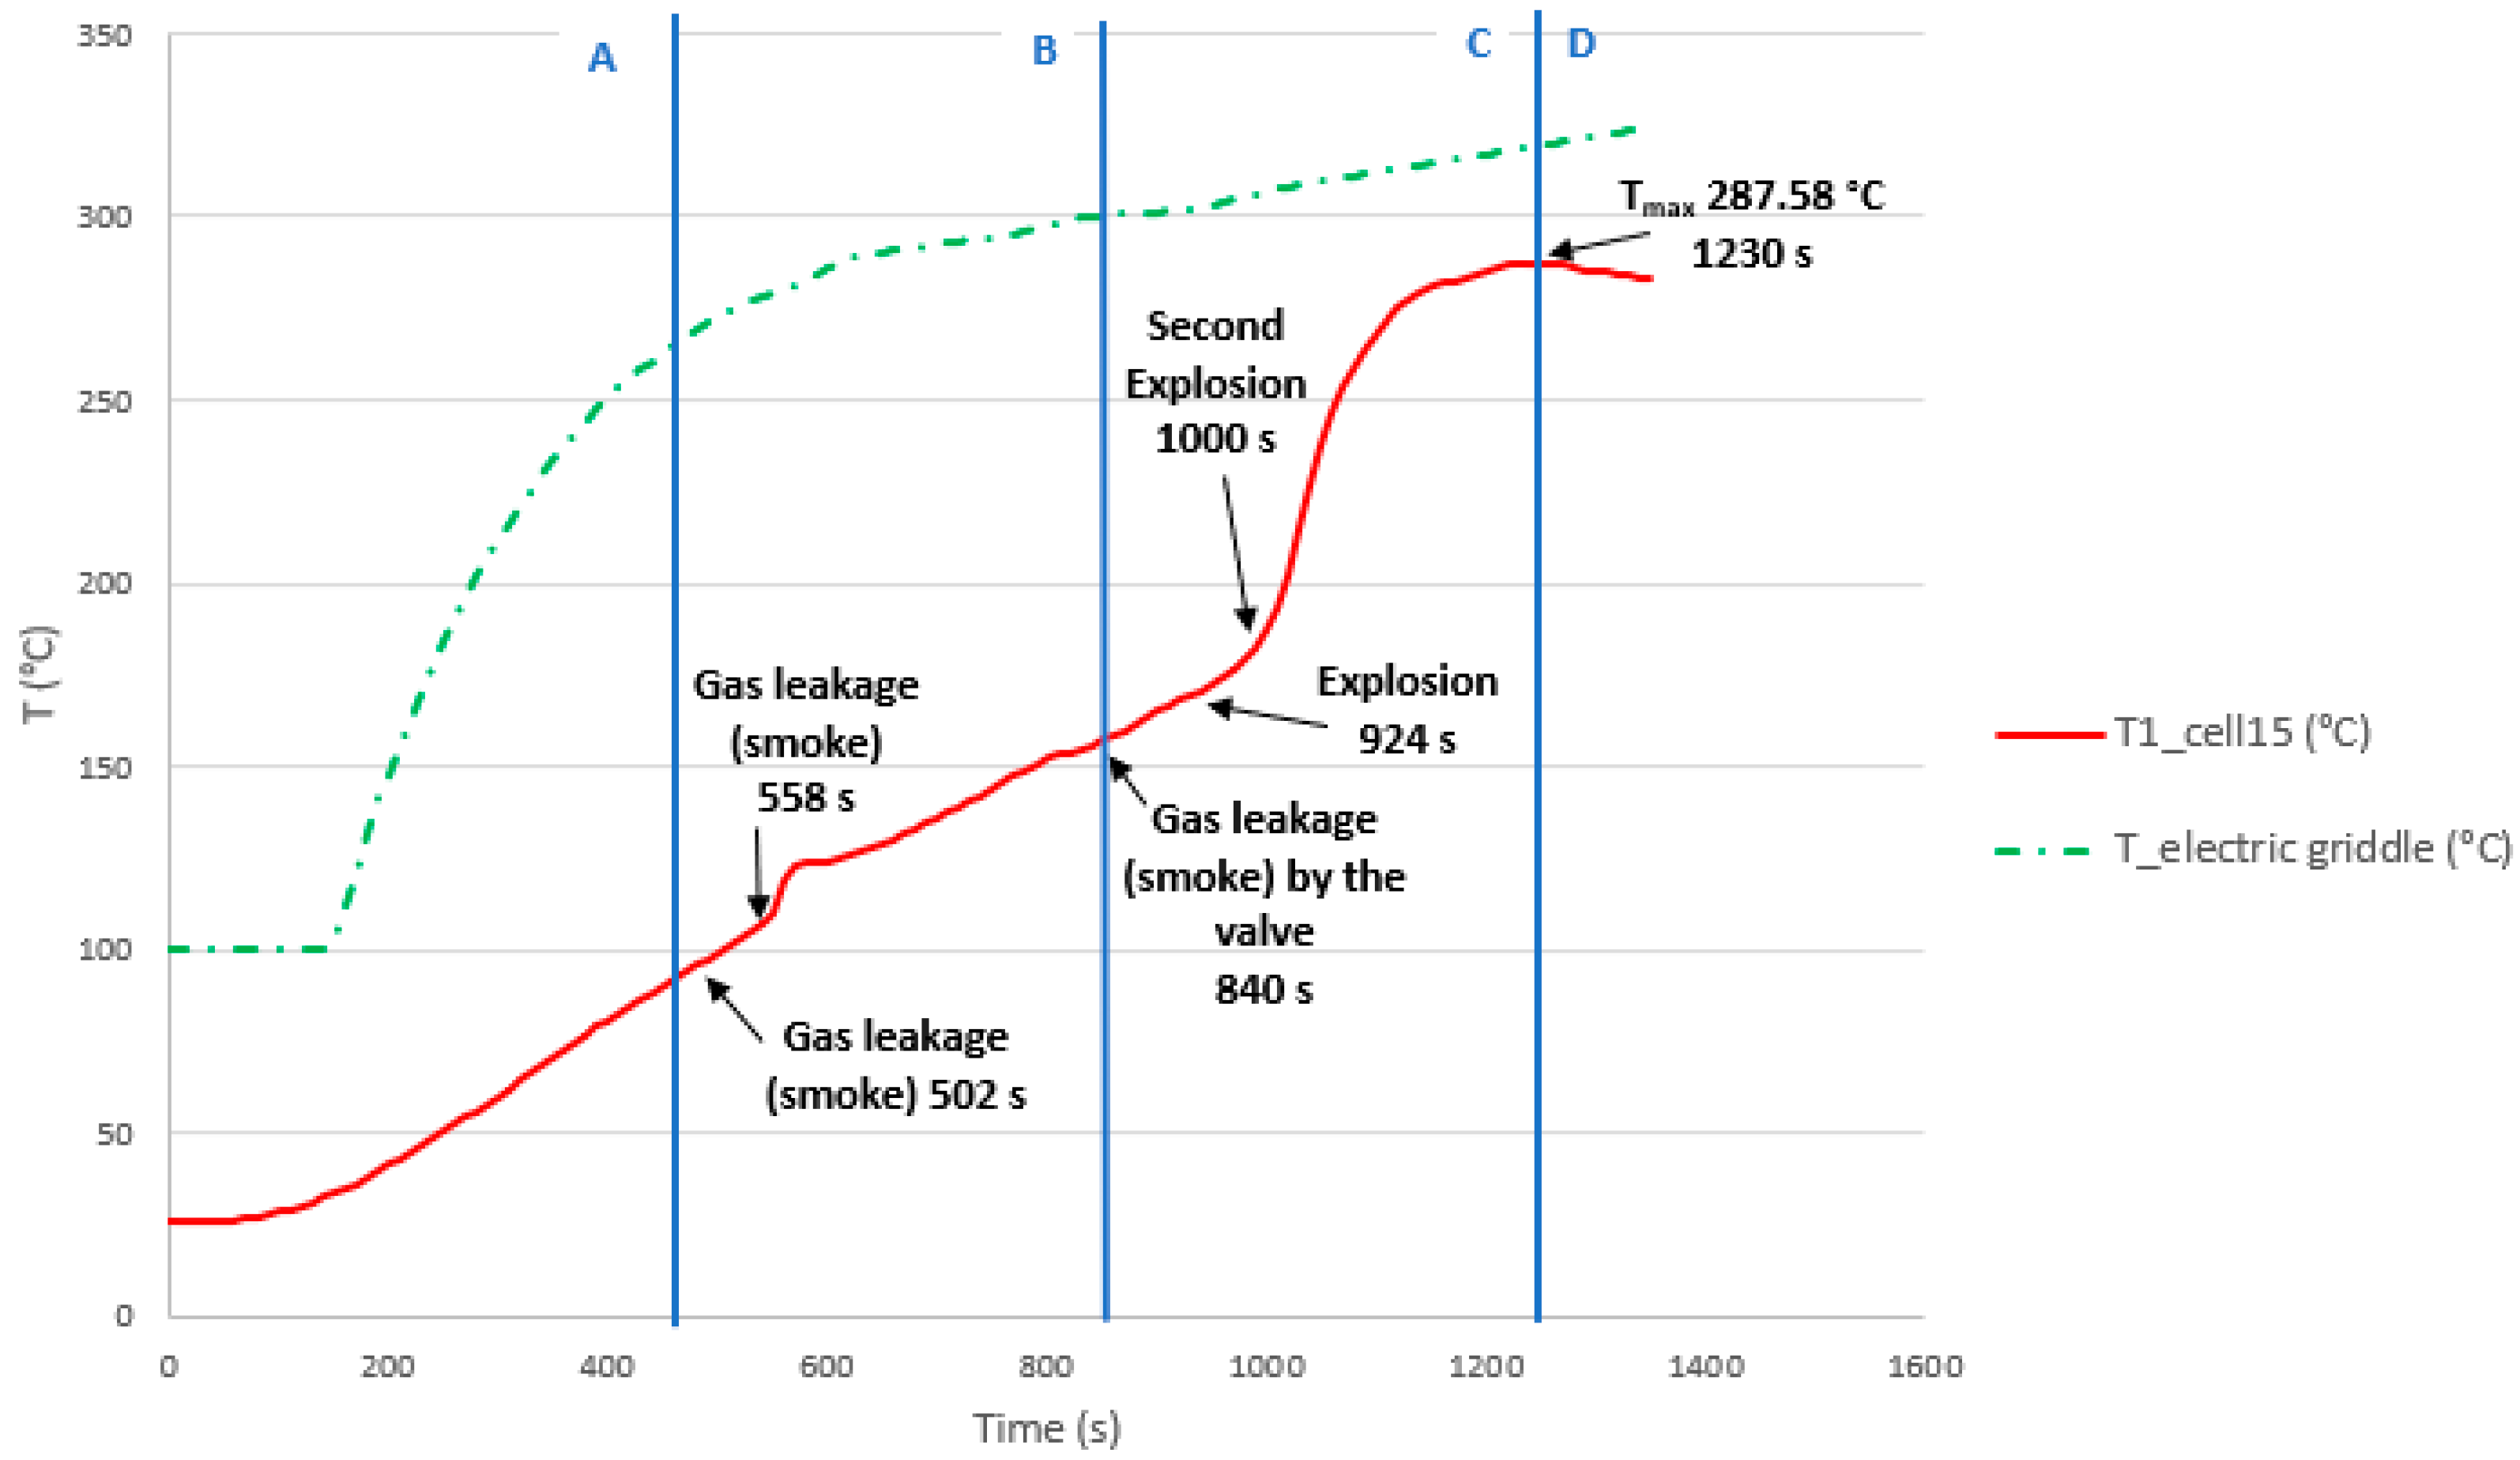
3.3.7. Test 7: Horizontal, Series Connection and SoC 50% (Cell 15 and Cell 14)

The test is carried out on two 32700 cylindrical cells in horizontal arrangement connected in series, and each having an SoC of 50%. The type K thermocouple is placed on cell 15 to measure its temperature. Figure 50 shows the state the cells after carrying out the heating test; the cells are more damaged in the upper part since that is where the valve is activated and the gases escape.
Figure 51 shows the temperature reached by the electric griddle and the temperature reached by cell 15. In this test, the maximum temperature reached in the case of cell 15 is 287.58 °C during the TR process. If this result is compared with the test carried out with the cells connected in series and horizontal arrangement, but with an SoC of 100%, it is observed that, as the SoC decreases, the maximum temperature reached decreases, and the moment at which the reaching the maximum temperature occurs sooner in the case of the SoC of 50%, but it must be considered that the tests are not carried out in a climatic chamber and that the ambient temperature has an influence. In the case of the 50% SoC test, the ambient temperature was higher, so this may be why the maximum TR temperature was reached earlier than in the case of the 100% SoC test, in which the ambient temperature was lower.

3.3.8. Test 8: Vertical, Series Connection and SoC 50% (Cell 13 (Below) and Cell 17)

The test is carried out on two 32700 cylindrical cells in vertical arrangement connected in series, and each having an SoC of 50%. The type K thermocouple is placed on cell 17 to measure its temperature. Figure 52 shows the state of the cells after carrying out the heating test; cell 13 is more damaged than cell 17 as cell 13 is the one that is most exposed to heat and experiences TR.
Figure 53 shows the temperature reached by the electric griddle and the temperature reached by cell 13. In this test, the maximum temperature reached in the case of cell 13 is 364.01 °C, during the TR process. When compared with the test in which the cells in a vertical arrangement connected in series have an SoC 100%, it is observed that in the case of SoC 100%, the maximum temperature reached is higher than in the case of SoC 50%.
A comparison of the temperature experienced by each of the cells tested shows that the cell with the highest temperature is cell 7 (test 4); therefore, the worst situation is that of test 4, vertical arrangement connected in parallel, and with an SoC of 100%. On the other hand, the cell that reaches the lowest temperature during the test is cell 5 (test 7), so the best situation is that of test 7, horizontal arrangement, connected in series, and with an SoC of 50%. As for the start of the TR, the first cell to start the TR is cell 11 (test 6) which is in horizontal arrangement, in parallel connection, and with an SoC of 50%. The cell that takes the longest to start the TR is cell 11 (test 5); cell 4 of test 1 is not considered as it was not carried out in the same conditions, i.e., it was not sheltered from the wind. because it was not carried out under the same conditions due to not being sheltered from the wind, is cell 11 of test 5, with vertical arrangement and parallel connection, with a SoC of 50%. Conclusions can be drawn regarding the maximum temperature reached in the TR, but not regarding the time in which it is reached, since, as the tests are carried out at ambient temperature, this will influence the time in which the TR is reached.
The same specific instants corresponding to the most significant events will be identified for each of the cells tested. It can be concluded that, in the same vertical arrangement and with the same SoC, the most dangerous connection is in parallel (the voltage is maintained, but the capacity is added), since the cell placed on the thermal plate catches fire when the cell is in parallel connection, but does not in a serial connection. On the other hand, regarding the influence of the state of charge, it can be deduced that in the same arrangement and with parallel connection, it is more dangerous for the cells to be at 100% SoC since, as has been observed in the tests analyzed, the fire is more intense in the case of 100% SoC than in the 50% state of charge.
On the other hand, it can be concluded that in the same horizontal arrangement and with the same SoC, the most dangerous connection is in parallel (the voltage is maintained, but the capacity is added), since, in the case of parallel connection, one of the cells catches fire, while in series connection it only catches fire in the case of a 100% SoC. Regarding the influence of the state of charge, a conclusion cannot be drawn for the horizontal arrangement as clearly as for the vertical arrangement.
The transition from an initial internal short-circuit prior to thermal runaway can be observed visually through the appearance of sparks and open-circuit voltage fluctuations. This internal progression provides valuable information on the failure mechanism of an individual cell after a short circuit, which facilitates the development of new approaches to mitigate thermal propagation.
The heating tests resulted in venting of the cells and release of hot electrolyte. It should be noted that of all the cells tested, cell 11 (test 5, vertical arrangement, parallel connection SoC 50%) and cell 7 (test 4, vertical arrangement, parallel connection SoC 100%) caught fire, and the fire in cell 7 was more intense as the SoC is greater, and therefore, the energy stored is greater. The cells in a horizontal arrangement also caught fire, but the fire was not as intense as in the vertical arrangement. Of the cells tested in horizontal arrangement, the one that experienced the most intense fire was cell 1 (test 6, horizontal arrangement, parallel connection SoC 50%).
The interior of a cylindrical cell consists of electrodes rolled up on themselves, thus making maximum use of space. In addition, they have a separator impregnated with electrolyte. When a lithium battery deteriorates internally, the chemical system inside it starts to form bubbles of oxygen, carbon dioxide, and other gases. Figure 52 shows the condition of the cells after the thermal abuse test.
It should be noted that, in the case of cylindrical cells, the temperature in the core of the battery is higher than on the surface. In the case of pouch cells or prismatic cells, the temperature is higher in the regions close to the flanges at the positive terminal because this terminal has a higher conductivity due to aluminum instead of copper; the heating then spreads over a large part of the battery [97].
The bottom one is selected vertically, and the one which is apparently more damaged on the outside is selected horizontally, but it is found to be the most damaged on the inside.
Figure 54 shows that the loss of internal material in the cells due to the tests varies according to different experimental conditions. It is observed that there is more internal material melted in the case of cells with 100% SoC than in the case of cells with 50% SoC. In the case of 100% SoC, material ejection occurs with complete detachment of solid internal material, whereas in the case of 50% SoC, the amount of molten aluminum is very small.
Results from several studies [98] show that gas venting and subsequent cell explosion occurs earlier for cells with higher SoC, while the energy released is slightly lower in cells with higher SoC. The earlier thermal runaway in the case of higher SoC may be due to the higher energy content in the cell and the higher amount of intercalated lithium available at the anode of the cell, where the first reactions take place. On the other hand, the lower energy release is due to incomplete reactions of the cell components.
Another study [46] shows that the SoC influences the combustion behavior of a lithium-ion cell, as the energy stored in the cell plays an important role in the combustion process. Therefore, fully charged lithium-ion cells are more dangerous than not fully charged lithium-ion cells. The study also concludes that the cell surface temperature and peak HRR (Heat Release Rate) increase as the incident heat flux increases, while the time to ignition and time to explosion decrease. This study proposes future work to focus on the thermal behavior of a set of cells in a module where TR is triggered by thermal abuse.
Of all the elements that make up the lithium-ion cell, the elements most sensitive to temperature rise are the separator and the electrolyte. As the temperature rises to 130–150 °C, these materials become unstable and can produce more heat. In the case of a lithium-ion cell, if subjected to more than 150 °C, the separator melts and additional heating occurs due to the short-circuit between the electrodes, and TR will start within minutes.
The severity of the TR depends on several factors, such as cell SoC, ambient temperature, cell chemistry and cell design (size, electrolyte volume, etc.). Therefore, the most severe thermal reaction will occur when the cell has an SoC of 100% as it will have the highest electrical energy content [98].
In the TR process, when there is a sharp drop in cell voltage, delamination of the electrodes occurs, followed by a sharp rise in the internal temperature of the cell, with the rate of heat production being greater than the rate of release. Charged lithium-ion cells can reach 600 °C. The temperature of LFP cells is typically lower [99]. This temperature increase is due to the reactions of electrodes with electrolytes and the release of stored energy. Some cathode materials decompose and may change structure resulting in the release of small amounts of oxygen which may be involved in internal cell reactions (leading for example to oxidation of the aluminum current collector). Any internal oxygen production will affect the internal reaction of the cell and the temperature of the cell housing but does not play a role in the flammability of the vent gases. The temperature increases lead to melting and decomposition of the separator, and usually to melting of the aluminum current collector, which occurs at 660 °C. The liquid aluminum can be alloyed with the exposed copper inside the cell. Some copper–aluminum alloys have melting points as low as 548 °C, so damage to the internal copper collectors is possible. The TR temperatures do not reach values that cause melting of pure copper (1080 °C), nickel, or steel. Figure 55 shows pictures of some of the cells tested which have undergone TR.
In the case of the vertical arrangement, the copper collector remains intact and is covered with active materials, and the aluminum collector disappears. In the case of the horizontal cell arrangement, the copper collector does not disappear, but it cannot be unwound in its entirety as in the vertical arrangement.
The onset temperature of the reactions for different chemistries and different cell charge states is the temperature at which the decomposition of the SEI begins and the cascade of reactions leading to TR takes place. It is observed that, the higher the SoC, the earlier the SEI decomposition reactions start and the lower the starting temperature. For SoC values between 80 and 100, the relationship is less clear, and the standard deviation is higher. In NMC cells, the decomposition starts earlier than in NCA. The LFP cells, the subject of the tests, do not have a clear trend of SoC influence; generally the decomposition reactions start at a higher temperature than in the rest of the chemistries, which is one reason why they are safer. For all SoCs tested and all cell chemistries tested, the average onset temperature of the decomposition reactions was 113 °C, and it ranged from 81 °C to 151 °C [100].
LFP cells react more slowly and at significantly higher temperatures to thermal abuse than other chemistries, making this cell chemistry considerably safer. LFP cells are less common but have recently gained prominence due to their increased safety [101], which is why these cells have been tested in this thesis for their behavior under thermal abuse.
LFP cells have a reaction rate three orders of magnitude lower than other chemistries due to limited oxygen production [86]. However, when an LFP cell is overcharged, the cathode does not have an overcharge reserve, like NMC and NCA cells, and is therefore irreversibly damaged earlier [101].
It is concluded that as the SoC increases, the TR gravity increases, and the stability of the cell decreases. The SoC of the cell influences the heat released in kW, so depending on the SoC of the cells, they exhibit different behaviors in the case of failures. The main problem for first responders is that the SoC of the battery cannot be known.

4. Conclusions

This article analyzed how the arrangement of the cells influences the evolution of the fire and the temperature gradient experienced by the cells. To this end, several controlled fire tests have been carried out at cell scale, which have enabled us to obtain the following conclusions depending on the type of test carried out.
The conclusions drawn from the tests carried out by mechanical abuse (perforation) are as follows:
-
The mechanical test of a cell does not faithfully reproduce the conditions of failure but shows the behavior of the cell under abusive conditions. It should be noted that cells are manufactured to be resistant or safe to some mechanical abuse, but it should be noted that a battery installed in a vehicle can suffer significant mechanical deformation during a traffic accident.
-
Mechanical abuse techniques remain a widely accepted method for safety and evaluation of the response of lithium-ion cells to abuse. However, it should be noted that changes in test conditions and even changes in cell construction can result in significantly different responses. Future lines of research should analyze the interdependence between test conditions and cell construction. Controlled and programmed mechanical abuse tests will be proposed to control certain test parameters.
-
The aim is to analyze how the cell structure influences the mechanical test and how the loading state of the cell influences the mechanical test.
-
In the case of mechanical abuse by perforation tests, it is concluded that a certain level of damage to the internal components of the cell (electrodes) is necessary for the short-circuit to occur.
-
It can be stated that, under the same mechanical abuse by perforation in a direction perpendicular to the longitudinal axis of the cell, the behavior of cells with higher SoC is more dangerous.
-
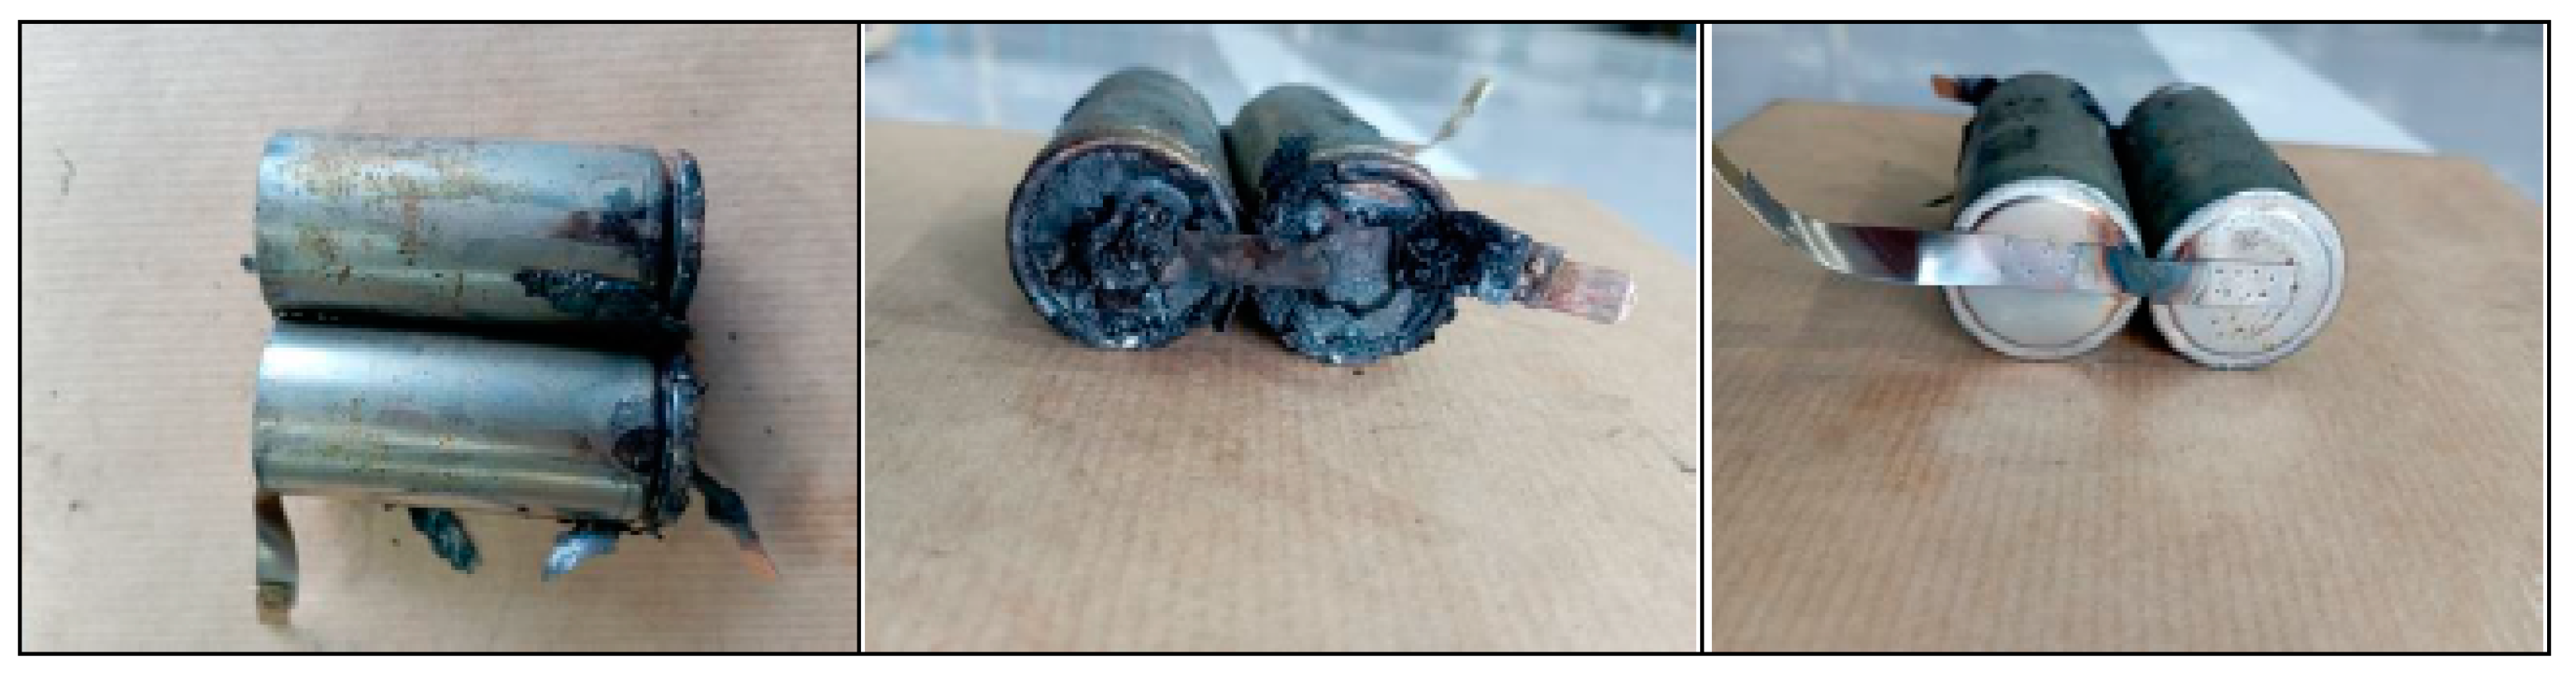
Both from the final state of the cell and from the analysis of the ΔDCIR (mΩ), it can be stated that the cell that suffers greater damage and is more degraded and deteriorated is the cell with an SoC of 100% subjected to a perforation test in the direction of the longitudinal axis of the cell, in the negative pole. The cell that suffers less damage and is less degraded is the cell subjected to a perforation test in the direction perpendicular to the longitudinal axis of the cell, with an SoC of 50%.
-
It is concluded that the loading condition is one of the most influential factors in the occurrence of Thermal Runaway after mechanical abuse by perforation.
-
It is therefore concluded that the worst case scenario for a failure due to mechanical abuse by perforation is that the cell/battery is 100% charged and the perforation occurs in the direction of the longitudinal axis.
-
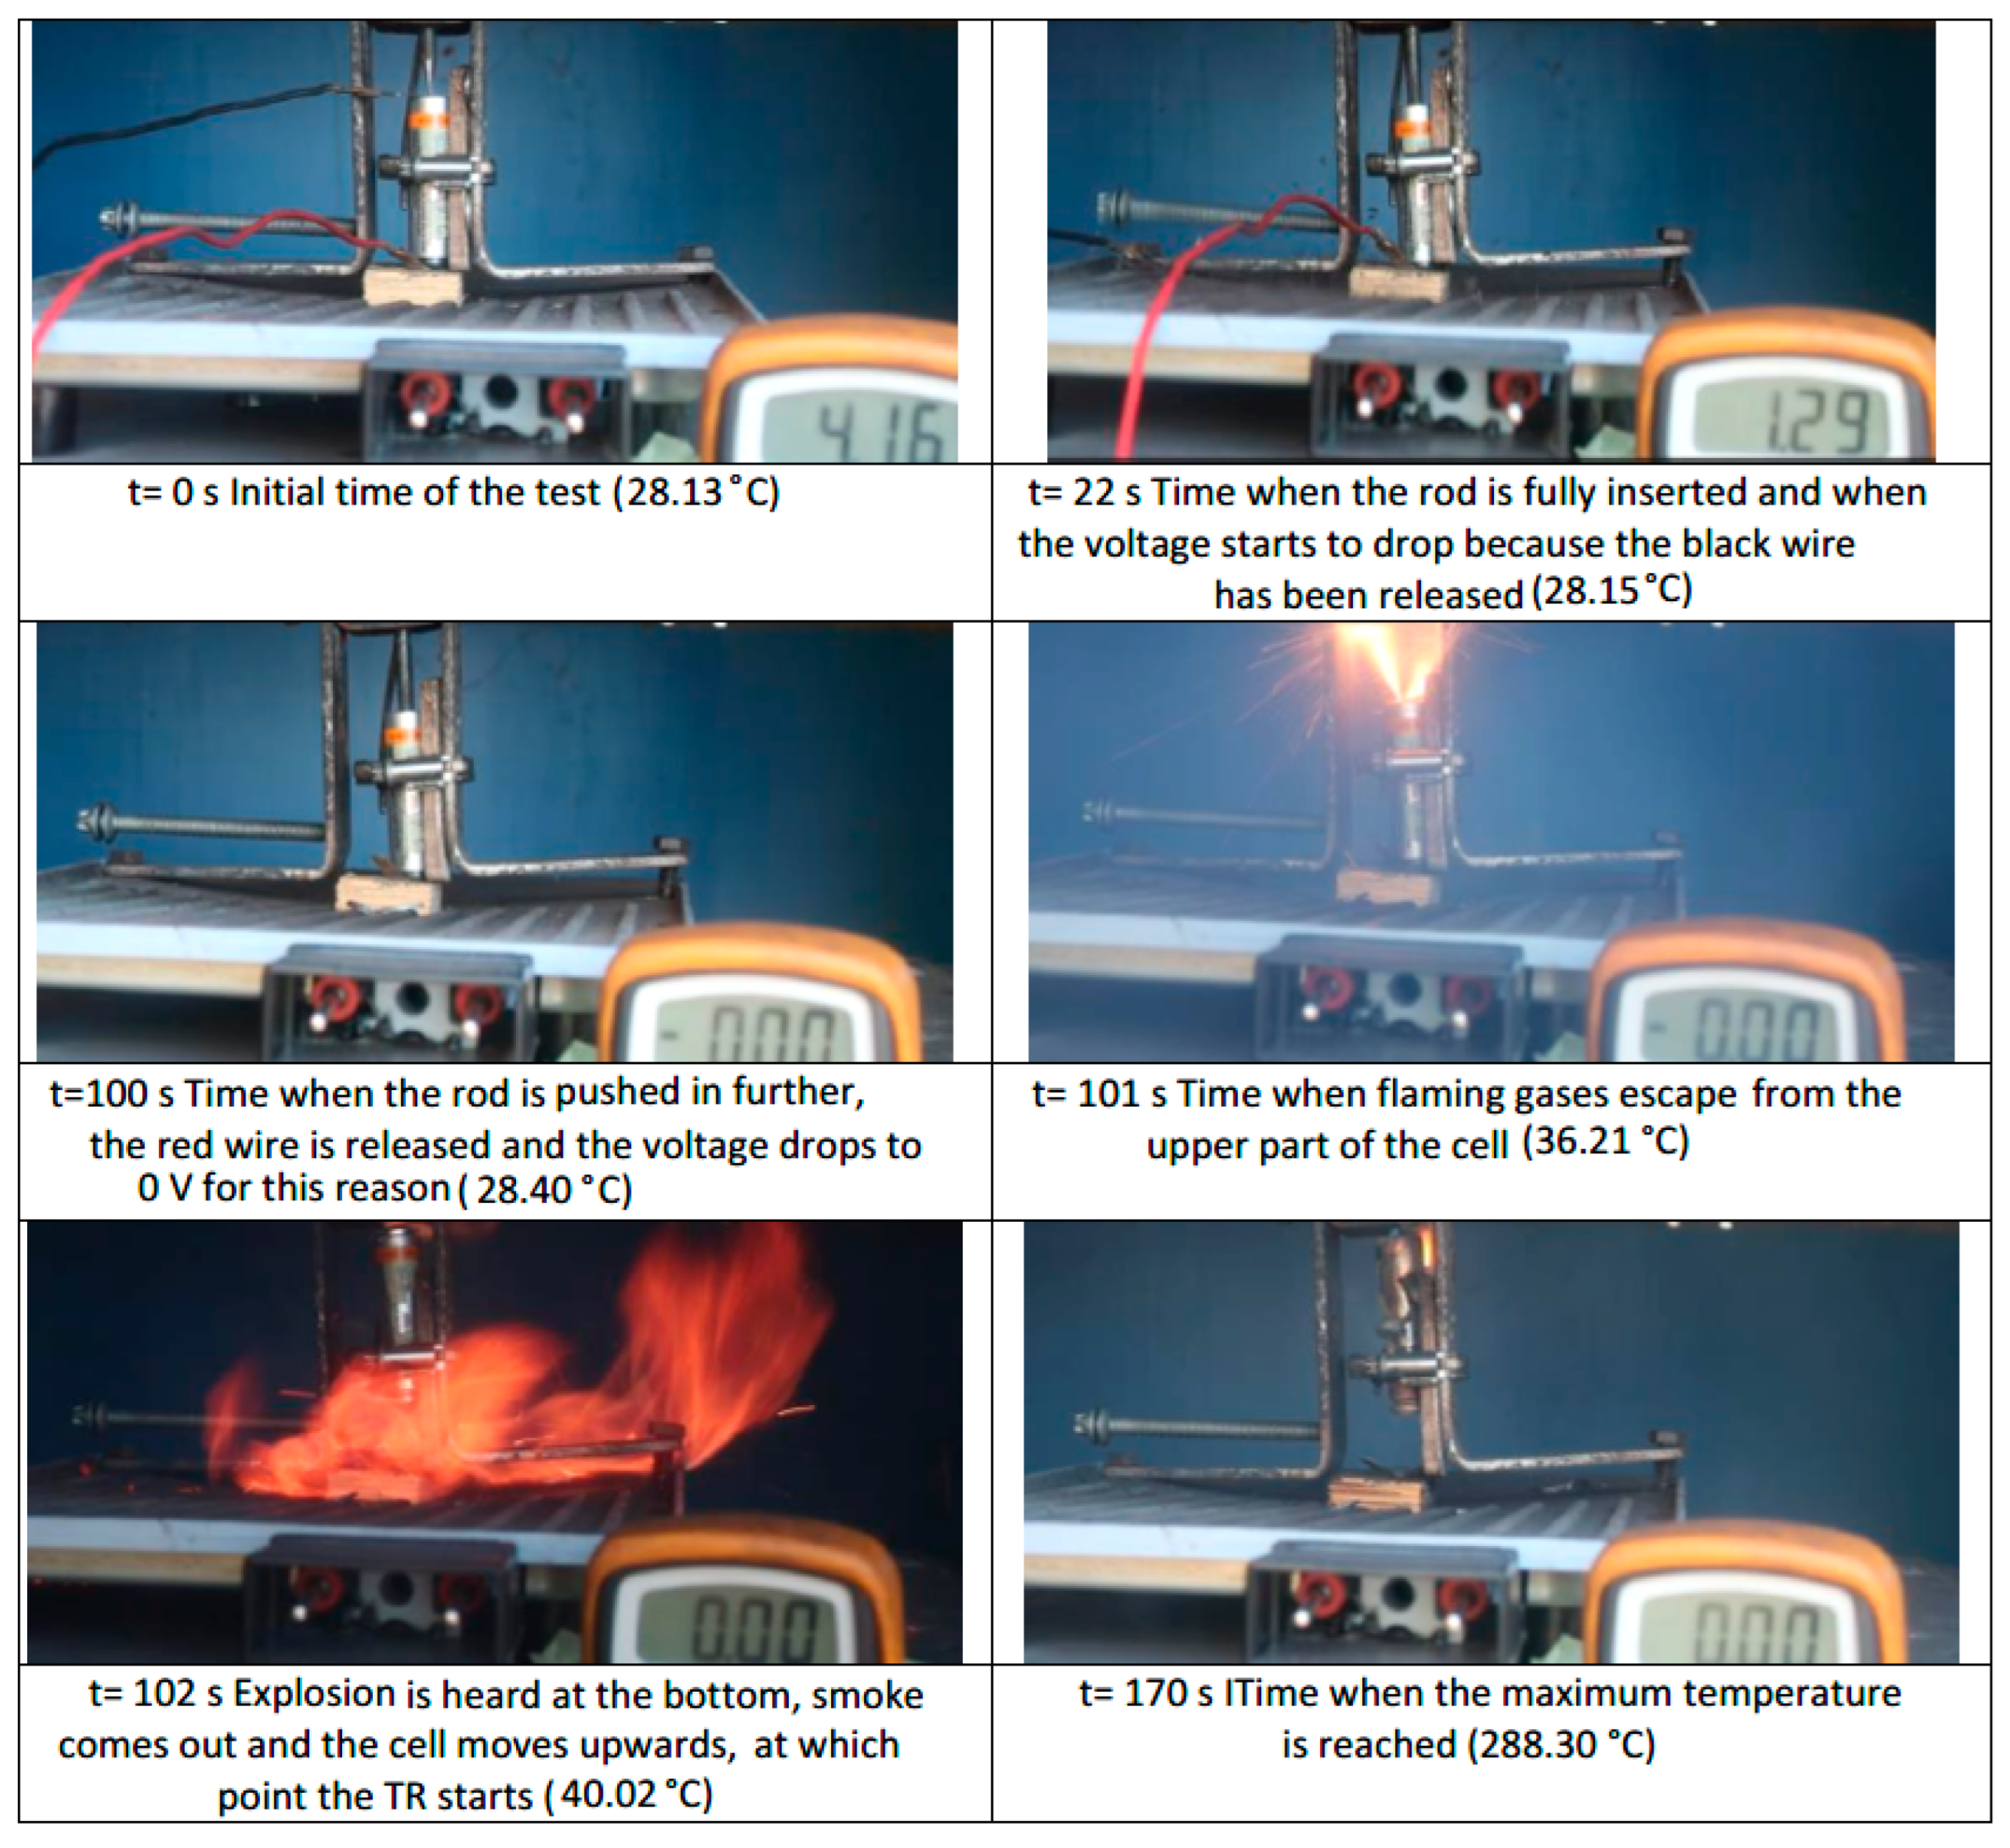
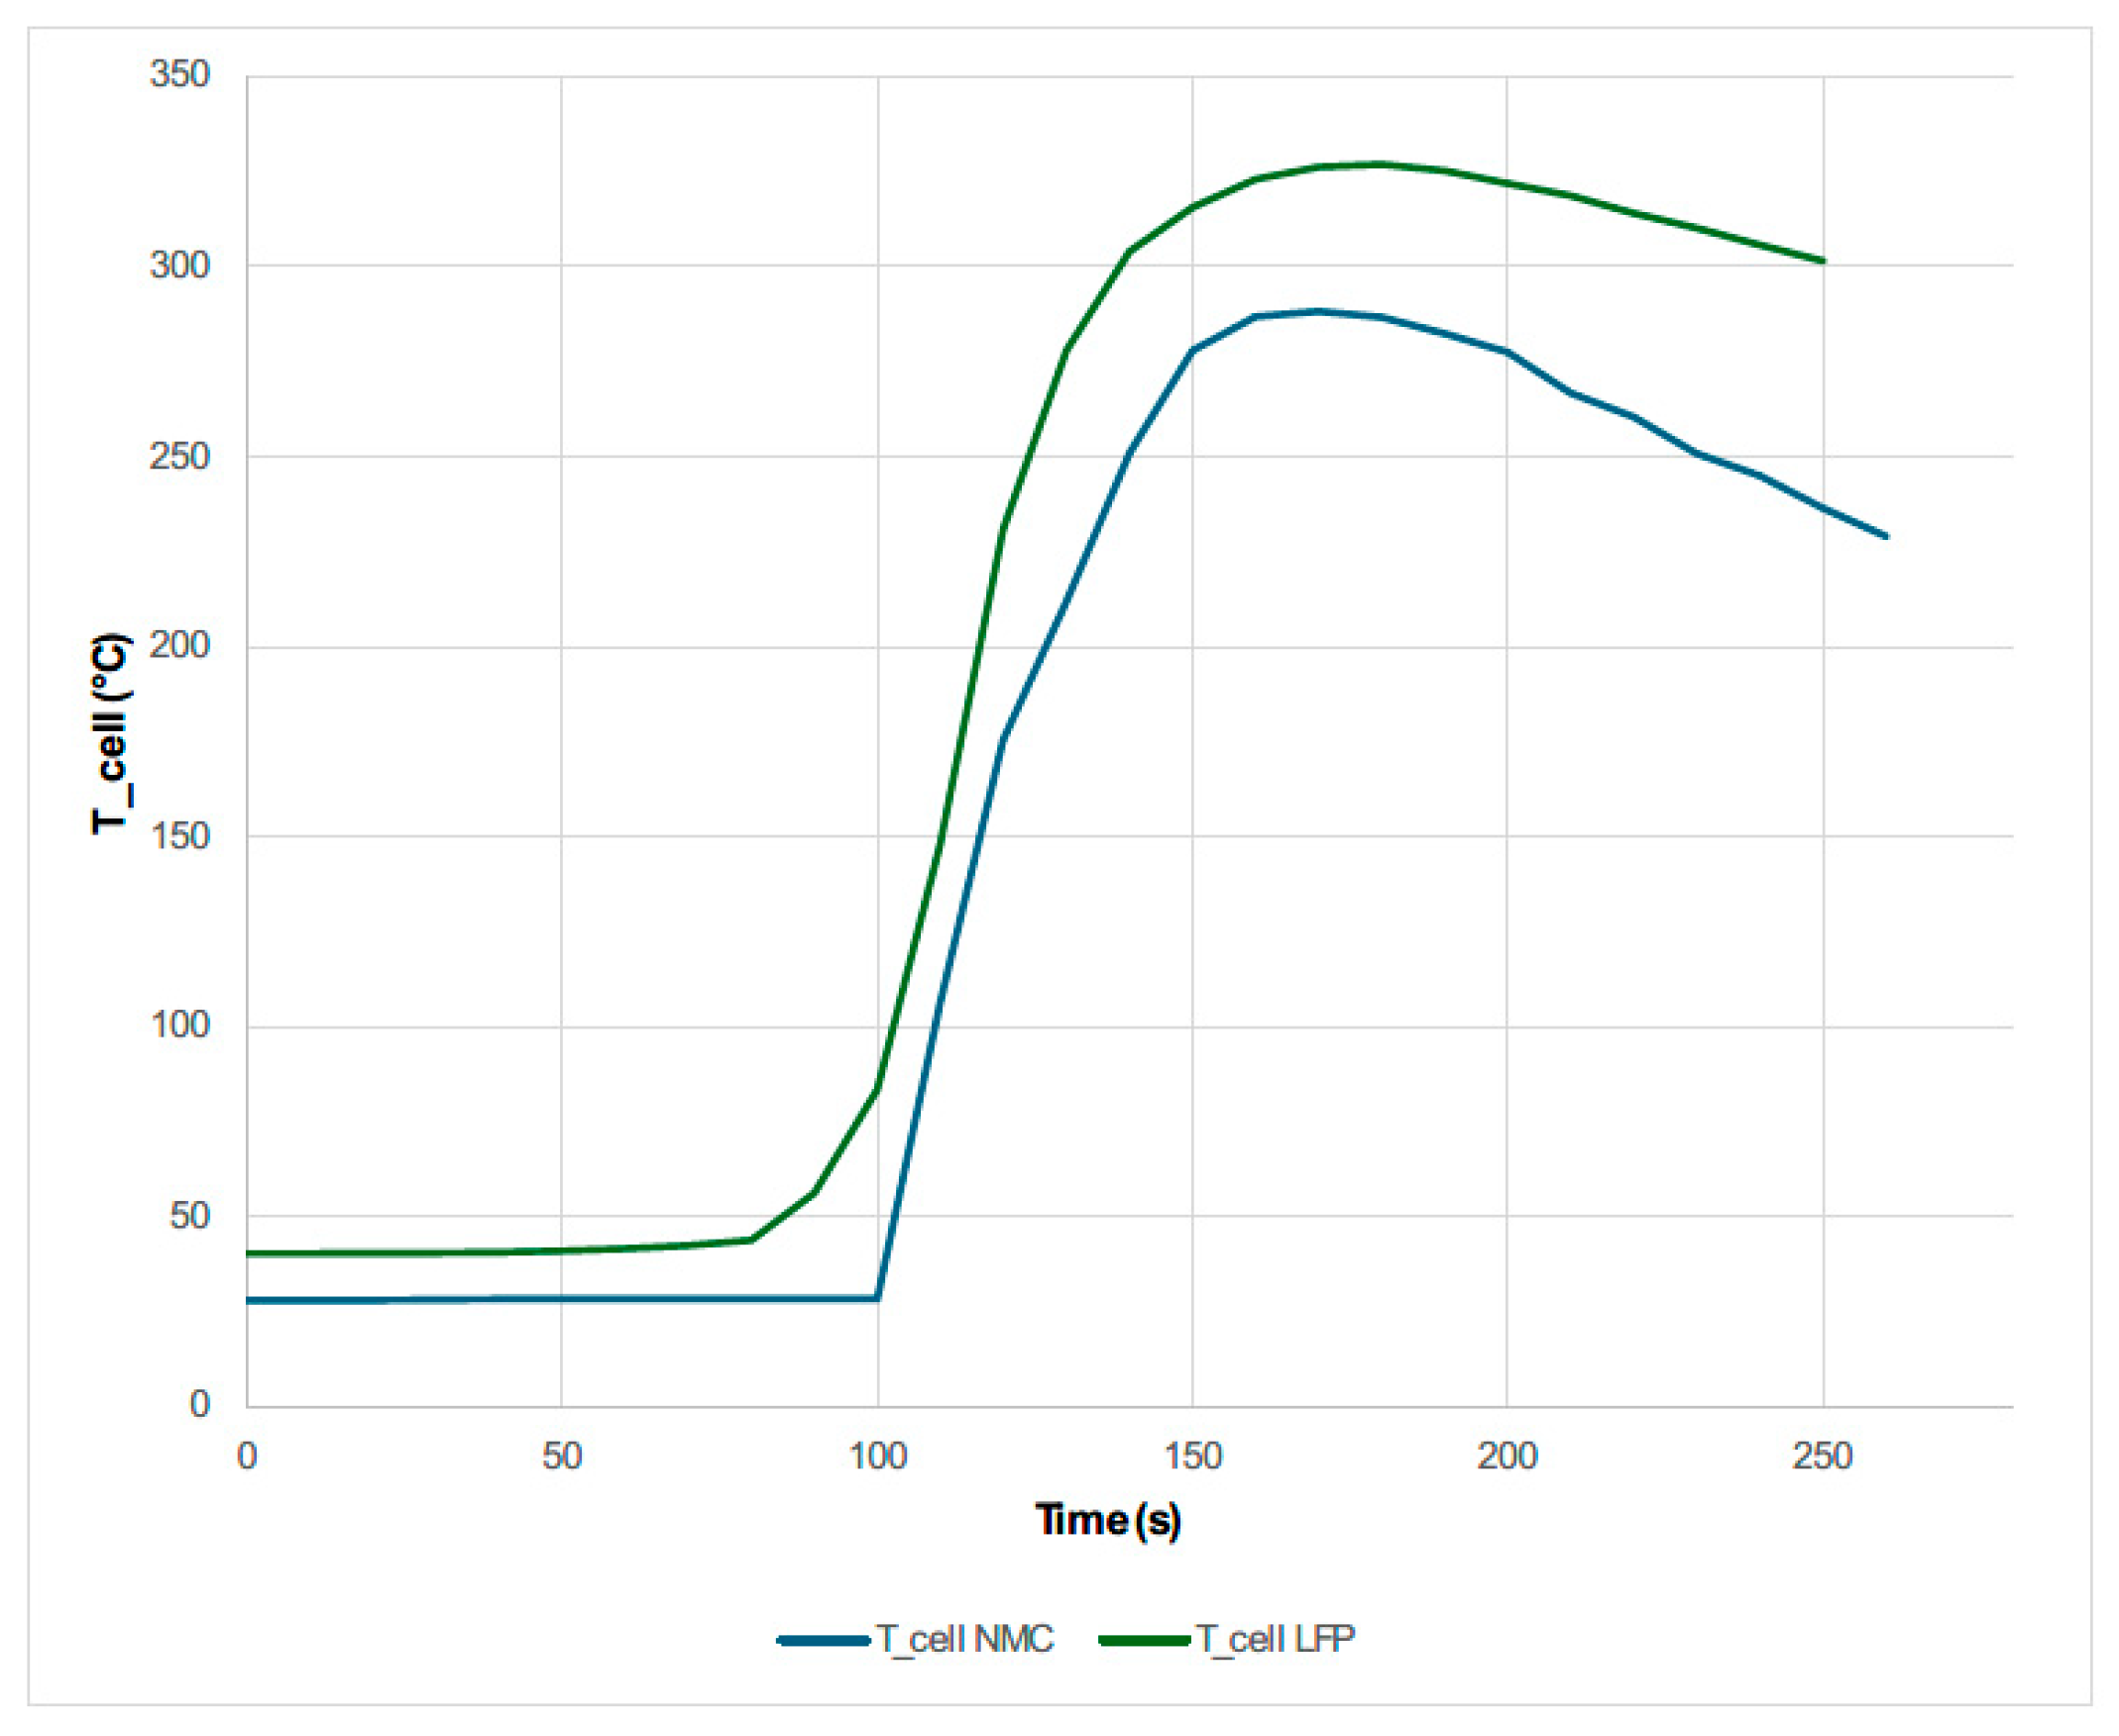
After comparing the NMC cell and the LFP cell subjected to the same mechanical abuse by perforation, it is concluded that the NMC cell catches fire while the LFP cell does not; however, the maximum temperature reached by the LFP cell is higher than that reached by the NMC cell. This may have occurred because the tests were carried out at room temperature, and on the day the LFP cell was tested, the ambient temperature was higher than when the NMC cell was tested. On the other hand, the fact that the maximum temperature reached is lower in the case of the LFP cell than in the case of the NMC cell could be since the cells tested by mechanical abuse by perforation have different diameters, and there are studies that indicate that the size of the cells influences their behavior in the event of a thermal release. Therefore, a comparison should be made between NMC and LFP cells of the same diameter, subjected to the same perforation mechanical abuse test to analyze the temperature profile reached.
The conclusions drawn from the electrical abuse (overcharge) tests are as follows:
-
Overcharging an electric vehicle with a pouch cell battery pack (tested cells) at high temperatures, for example on a summer day at midday, is critical and dangerous. The same overcharge tests should be repeated at different ambient temperatures and with different cell types.
-
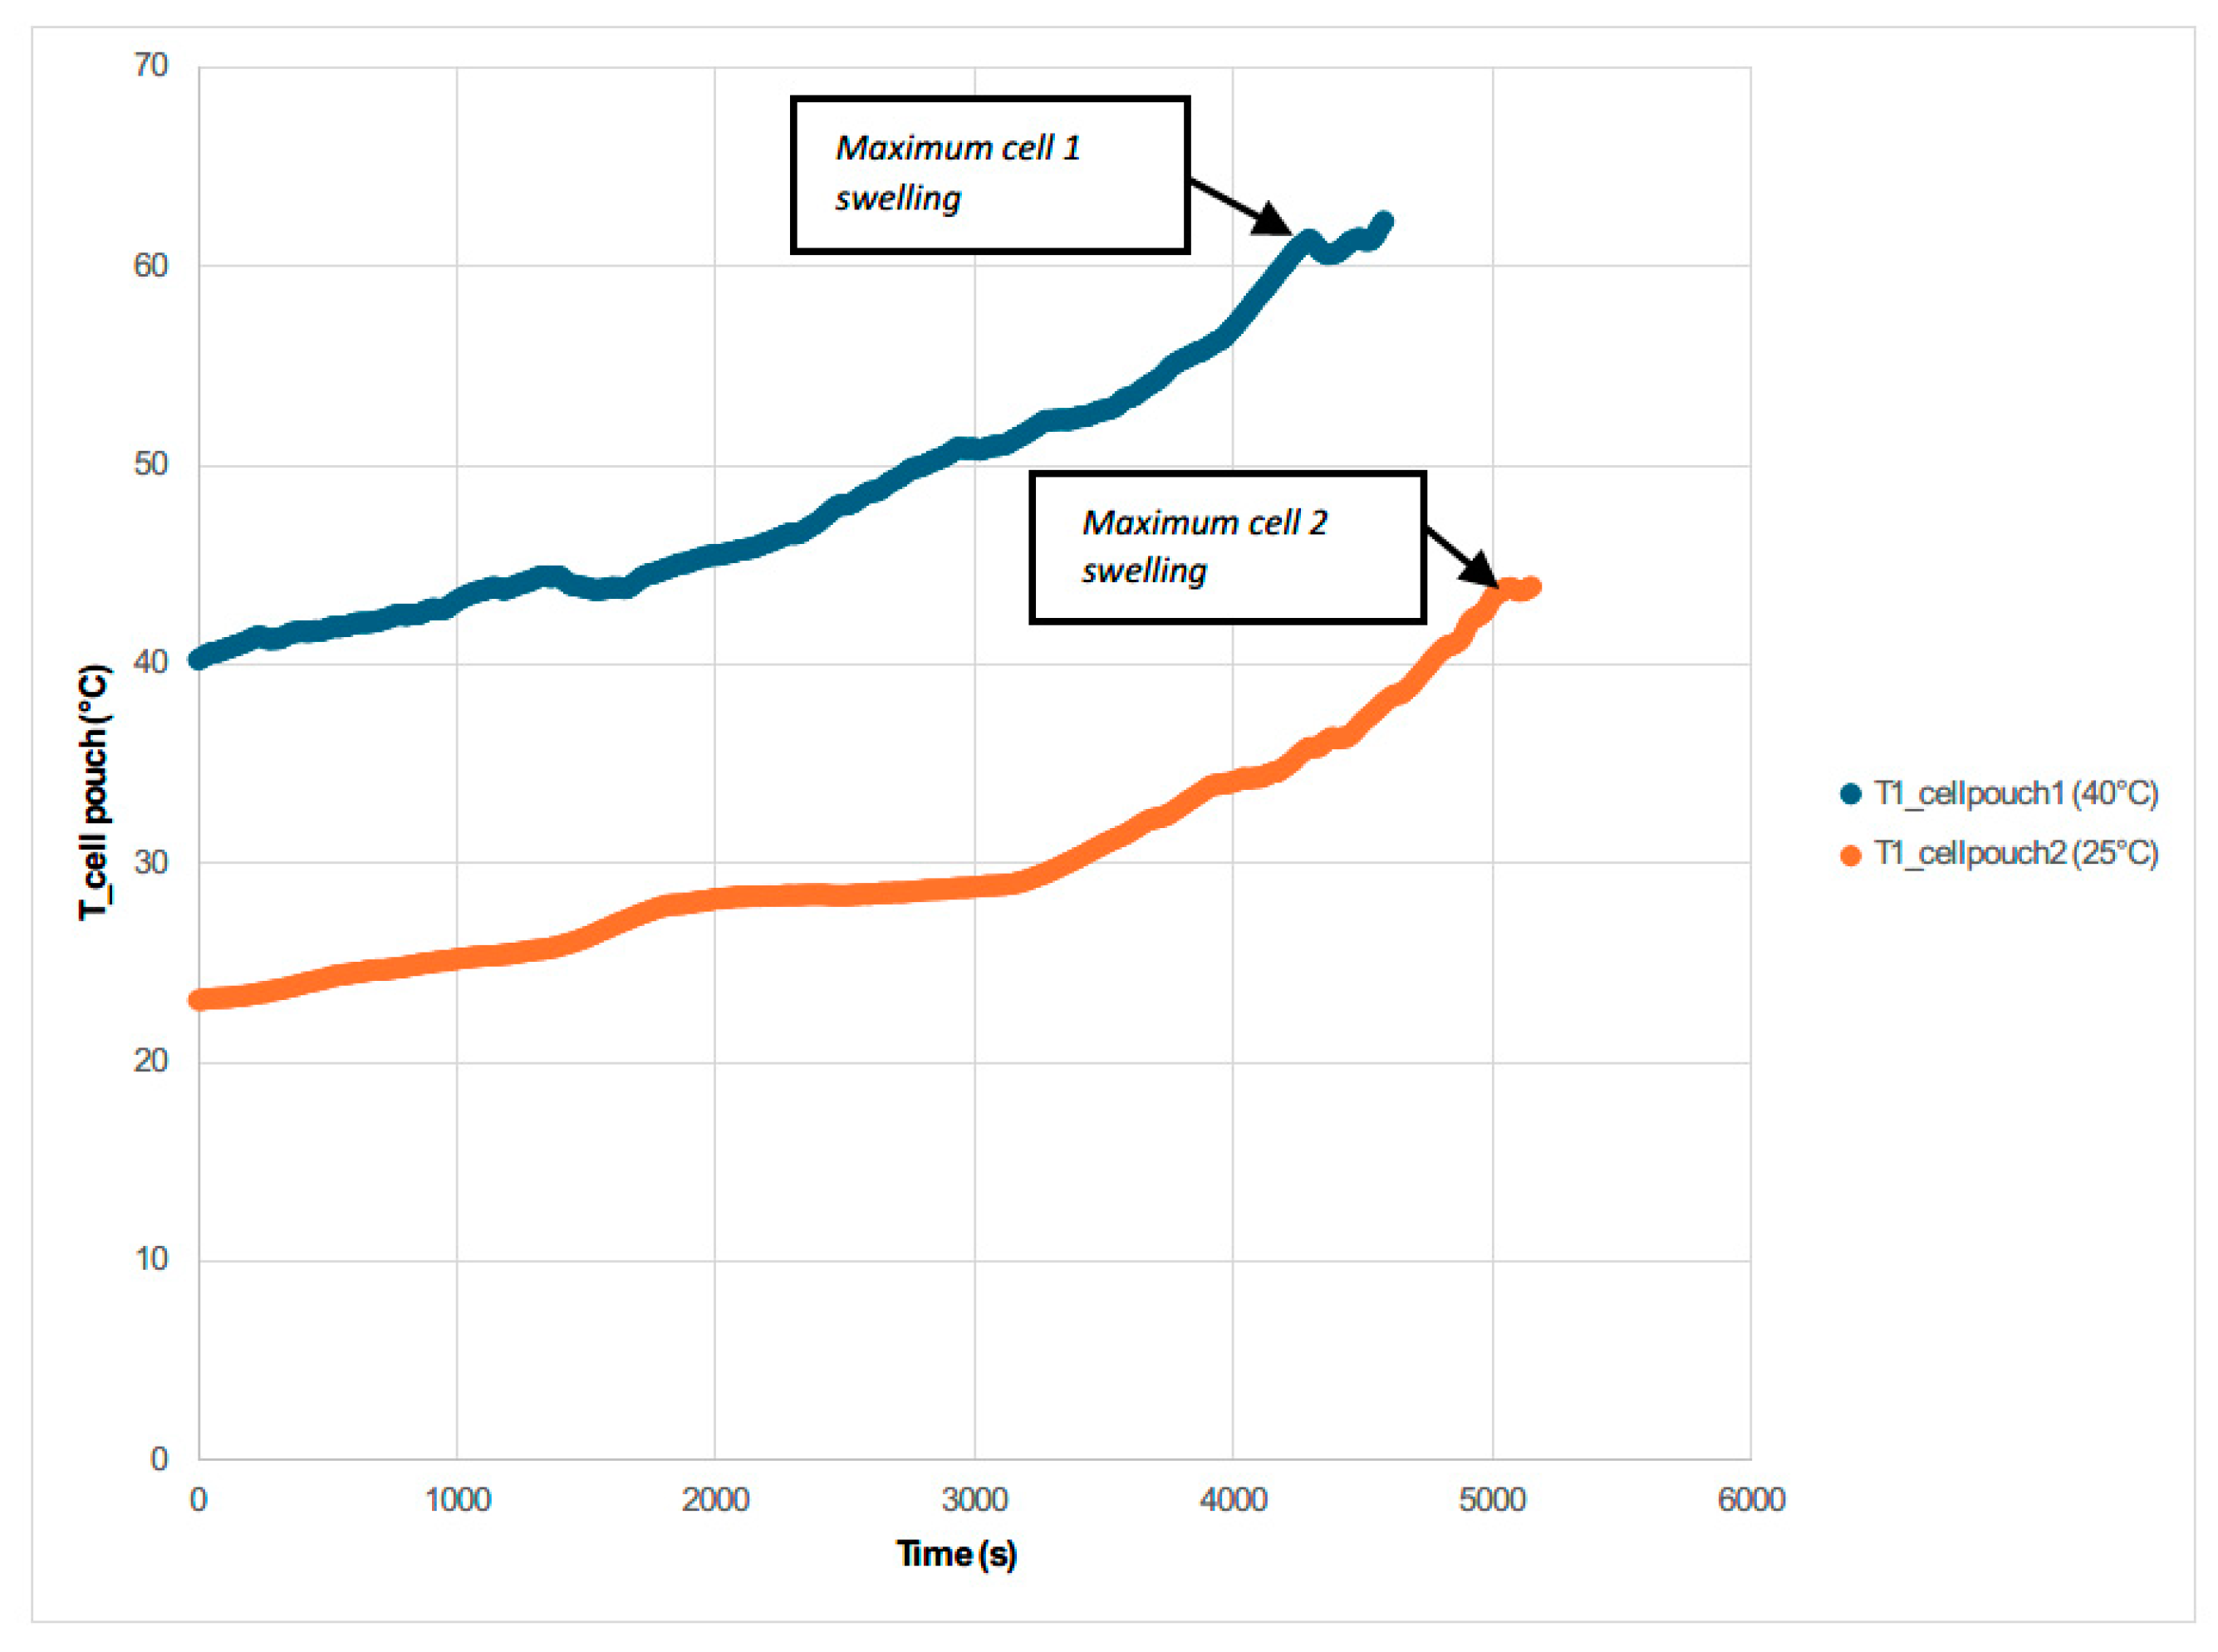
The maximum voltage is reached due to the overcharge is when the maximum temperature is reached and when the maximum swelling of the two cells is reached.
-
The results of the analysis of the overcharge tests with pouch cells give very important information from a safety point of view and can be useful to generate safe charging procedures for electric vehicle batteries to prevent possible dangerous misuse conditions.
The conclusions drawn from the tests carried out by thermal abuse (heating) are as follows:
-
The loss of internal material of the cells due to thermal tests by heating is variable according to different experimental conditions. It is observed that more internal material is melted in the case of cells with 100% SoC than in the case of cells with 50% SoC. In the case of 100% SoC, material ejection occurs with complete detachment of solid internal material, whereas in the case of 50% SoC, the amount of molten aluminum is very small.
-
The most dangerous situation for TR propagation due to thermal failure by heating is the vertical arrangement with the cells connected in parallel and with a 100% SoC. The safest situation is the horizontal arrangement with the cells connected in series and with an SoC of 50%.
-
The tests carried out allow conclusions about the maximum temperature reached during the TR, but not the time required to reach it, as they are conducted at ambient temperature. It is concluded that the ambient temperature influences TR propagation due to thermal failure by heating.
-
LFP cells react more slowly and at significantly higher temperatures to thermal abuse than other chemistries, making this cell chemistry considerably safer.
Therefore, it is concluded that temperature is a crucial parameter, as overheating the battery can cause an exothermic reaction and destroy it completely. Also, overcharging the cell can compromise its internal structure, which highlights the importance of a properly functioning battery management system (BMS).
The state of charge (SoC) of a cell directly influences the heat emitted during a reaction: the higher the SoC, the greater the heat generated. Some lines of research are focusing on improving cell safety by developing new types of electrolytes that, in the event of overheating or overcharging, do not emit toxic compounds.
It is essential to design batteries for electric vehicles that can withstand extreme temperatures, overheating, high charge and discharge currents, low voltage due to high discharge (DoD, Depth of Discharge), overvoltage caused by overcharging, as well as shocks and impacts during collisions.
Following proper charging and discharging procedures (within the temperature and voltage ranges recommended by the manufacturer) will prolong the life of the battery and help to avoid potential hazards.

Author Contributions

Conceptualization, A.O. and L.C.; data curation, A.O. and L.C.; formal analysis, A.O. and L.C.; funding acquisition, A.O. and L.C.; investigation, A.O. and L.C.; methodology, A.O. and L.C.; project administration, L.C.; resources, A.O. and L.C.; supervision, L.C.; writing—original draft, A.O. and L.C.; writing—review and editing, A.O. All authors have read and agreed to the published version of the manuscript.

Funding

University of Zaragoza: Industrial Doctorate (DI 4/2020).

Data Availability Statement

The data presented in this study are available on request from the corresponding author. The data are not publicly available due to privacy restrictions.

Acknowledgments

The authors are grateful for the support received through the Industrial Doctorate financed by the University of Zaragoza (DI 4/ 2020) and Instituto de Investigación sobre Vehículos, S.A. (Centro Zaragoza), in which the work presented in this article was framed.

Conflicts of Interest

The authors declare no conflict of interest.

Abbreviations

The following abbreviations are used in this manuscript:
MDPIMultidisciplinary Digital Publishing Institute
TRThermal Runaway
SoCState of Charge
BMS Battery Management System
SEISolid Electrolyte Interface
ECCyclic Ethylene Carbonate
PCPropylene Carbonate
BCButene Carbonate
DMCChain Dimethyl Carbonate
DECDiethyl Carbonate
EMCMethyl Ethyl Carbonate
PPPolypropylene
PEPolyethylene
BTMSBattery Thermal Management System
PCMPhase Change Material
NiBSodium-ion battery
LFPLithium-ion phosphate battery
LFLLower Flammability Limit
LPBLithium-ion Prismatic Batteries
DCDirect Current
CVConstant Voltage
PIDProportional Integral Derivative Control
DCIRDirect Current Internal Resistance

References

  1. Musk, E. Model S Fire; Tesla Blog: Austin, TX, USA, 2013; Available online: https://www.businessinsider.com/elon-musk-blog-post-on-tesla-fires-2013-11 (accessed on 30 January 2025).
  2. Voelcker, J.; Yanks, C. Plug-In Hybrid Test Fleet Off Roads, Will Replace Batteries, Green Car Reports. 2012. Available online: http://www.greencarreports.com/news/1079368_chrysler-yanks-plug-inhybrid-test-fleet-off-roads-will-replace-batteries (accessed on 30 January 2025).
  3. Lowy, J. Overcharging Batteries Eyed in Boeing 787 Mishaps; Phys.org: Douglas, GA, USA, 2013. [Google Scholar]
  4. He, D.; Wang, J.; Peng, Y.; Li, B.; Feng, C.; Shen, L.; Ma, S. Research advances on thermal runaway mechanism of lithium-ion batteries and safety improvement. Sustain. Mater. Technol. 2024, 410, e01017. [Google Scholar] [CrossRef]
  5. Richard, M.N.; Dahn, J.R. Accelerating Rate Calorimetry Study on the Thermal Stability of Lithium Intercalated Graphite in Electrolyte. I. Experimental. J. Electrochem. Soc. 1999, 146, 2068. [Google Scholar] [CrossRef]
  6. MacNeil, D.D.; Larcher, D.; Dahn, J.R. Comparison of the Reactivity of Various Carbon Electrode Materials with Electrolyte at Elevated Temperature. J. Electrochem. Soc. 2019, 146, 3596–3602. [Google Scholar] [CrossRef]
  7. Wang, Q.; Sun, J.; Yao, X.; Chen, C. Thermal stability of LiPF6/EC+DEC electrolyte with charged electrodes for lithium ion batteries. Thermochim. Acta 2005, 437, 12–16. [Google Scholar] [CrossRef]
  8. Golubkov, A.W.; Fuchs, D.; Wagner, J.; Wiltsche, H.; Stangl, C.; Fauler, G.; Voitic, G.; Thaler, A.; Hacker, V. Thermal-runaway experiments on consumer Li-ion batteries with metal-oxide and olivin-type cathodes. RSC Adv. 2013, 4, 3633–3642. [Google Scholar] [CrossRef]
  9. Golubkov, A.W.; Scheikl, S.; Planteu, R.; Voitic, G.; Wiltsche, H.; Stangl, C.; Fauler, G.; Thaler, A.; Hacker, V. Thermal runaway of commercial 18650 Li-ion batteries with LFP and NCA cathodes—Impact of state of charge and overcharge. RSC Adv. 2015, 5, 57171–57186. [Google Scholar] [CrossRef]
  10. Qin, P.; Jia, Z.; Wu, J.; Jin, K.; Duan, Q.; Jiang, L.; Sun, J.; Ding, J.; Shi, C.; Wang, Q. The thermal runaway analysis on LiFePO4 electrical energy storage packs with different venting areas and void volumes. Appl. Energy 2022, 313, 118767. [Google Scholar] [CrossRef]
  11. Wong, A.C.-Y.; Lam, F. Study of selected thermal characteristics of polypropylene/polyethylene binary blends using DSC and TGA. Polym. Test. 2002, 21, 691–696. [Google Scholar] [CrossRef]
  12. Zheng, S.; Wang, L.; Feng, X.; He, X. Probing the heat sources during thermal runaway process by thermal analysis of different battery chemistries. J. Power Sources 2018, 378, 527–536. [Google Scholar] [CrossRef]
  13. Choi, C.H.; Chung, M.W.; Park, S.H.; Woo, S.I. Additional doping of phosphorus and/or sulfur into nitrogen-doped carbon for efficient oxygen reduction reaction in acidic media. Phys. Chem. Chem. Phys. 2013, 15, 1802–1805. [Google Scholar] [CrossRef]
  14. Rui, X.; Feng, X.; Wang, H.; Yang, H.; Zhang, Y.; Wan, M.; Wei, Y.; Ouyang, M. Synergistic effect of insulation and liquid cooling on mitigating the thermal runaway propagation in lithium-ion battery module. Appl. Therm. Eng. 2021, 199, 117521. [Google Scholar] [CrossRef]
  15. Arora, P.; Zhang, Z.J. Battery Separators. Chem. Rev. 2004, 104, 4419–4462. [Google Scholar] [CrossRef] [PubMed]
  16. Hu, H.; Xiaoming, X.; Sun, X.; Li, R.; Zhang, Y.; Jiaqi, F. Numerical study on the inhibition control of Lithium-ion battery Thermal runaway. ACS Omega 2020, 5, 18254–18261. [Google Scholar] [CrossRef] [PubMed]
  17. Lu, L.; Han, X.; Li, J.; Hua, J.; Ouyang, M. A review on the key issues for lithium-ion battery management in electric vehicles. J. Power Sources 2013, 226, 272–288. [Google Scholar] [CrossRef]
  18. Sloop, S.E.; Kerr, J.B.; Kinoshita, K. The role of Li-ion battery electrolyte reactivity in performance decline and self-discharge. J. Power Sources 2003, 119–121, 330–337. [Google Scholar] [CrossRef]
  19. Yang, H.; Bang, H.; Amine, K.; Prakash, J. Investigations of the Exothermic Reactions of Natural Graphite Anode for Li-Ion Batteries during Thermal Runaway. J. Electrochem. Soc. 2004, 152, A73. [Google Scholar] [CrossRef]
  20. Yang, H.; Zhuang, G.V.; Ross, P.N. Thermal stability of LiPF6 salt and Li-ion battery electrolytes containing LiPF6. J. Power Sources 2006, 161, 573–579. [Google Scholar] [CrossRef]
  21. Mao, B.; Chen, H.; Cui, Z.; Tangqin, W.; Wang, Q. Failure mechanism of the lithium ion battery during nail penetration. Int. J. Heat Mass Transf. 2018, 122, 1103–1115. [Google Scholar] [CrossRef]
  22. Botte, G.G.; White, R.E.; Zhang, Z.J. Thermal stability of LiPF6-EC:EMC electrolyte for lithium ion batteries. J. Power Sources 2001, 97–98, 570–575. [Google Scholar] [CrossRef]
  23. Abd-El-Latif, A.A.; Sichler, P.; Kasper, M.; Waldmann, T.; Mehrens, M.W. Insights into thermal runaway of Li–ion cells by accelerating rate calorimetry coupled with external sensors and online gas analysis. Batter. Supercaps 2021, 4, 1135–1144. [Google Scholar] [CrossRef]
  24. Wu, K.; Yang, J.; Liu, Y.; Zhang, Y.; Wang, C.; Jinmei, X.; Ning, F.; Wang, D. Investigation on gas generation of Li4Ti5O12/LiNi1/3Co1/3Mn1/3O2 cells at elevated temperature. J. Power Sources 2013, 237, 285–290. [Google Scholar] [CrossRef]
  25. Wendel, C.H. Design and Analysis of Reversible Solid Oxide Cell Systems for Electrical Energy Storage. Ph.D. Thesis, Colorado School of Mines, Golden, CO, USA, 2015. [Google Scholar]
  26. Wang, Q.; Mao, B.; Stoliarov, S.I.; Sun, J. A Review of Lithium Ion Battery Failure Mechanisms and Fire Prevention Strategies. Prog. Energy Combust. Sci. 2019, 73, 95–131. [Google Scholar] [CrossRef]
  27. Yang, X.; Wang, H.; Li, M.; Li, Y.; Li, C.; Zhang, Y.; Chen, S.; Shen, H.; Qian, F.; Feng, X.; et al. Experimental study on Thermal runaway behavior of Lithium-ion battery and analysis of combustible limit of gas production. Batteries 2022, 8, 250. [Google Scholar] [CrossRef]
  28. Hewson, J.C.; Domino, S.P. Thermal Runaway of Lithium-Ion Batteries and Hazards of Abnormal Thermal Environments. In Proceedings of the 9th U.S. National Combustion Meeting, Cincinnati, OH, USA, 17–20 May 2015. [Google Scholar]
  29. Wang, Q.; Jiang, L.; Yu, Y.; Sun, J. Progress of enhancing the safety of lithium ion battery from the electrolyte aspect. Nano Energy 2019, 55, 93–114. [Google Scholar] [CrossRef]
  30. Kriston, A.; Kersys, A.; Antonelli, A.; Ripplinger, S.; Holmstrom, S.; Trischler, S.; Döring, H.; Pfrang, A. Initiation of thermal runaway in lithium-ion cells by inductive heating, 2020. J. Power Sources 2020, 454, 227914. [Google Scholar] [CrossRef]
  31. Chancelier, L.; Diallo, A.; Santini, C.; Marlair, G.; Gutel, T.; Mailley, S.; Len, C. Thermal Stability and Fire Safety of Ionic Liquid-Based Electrolytes for Lithium-Ion Batteries. ECS Meeting Abstracts 2014, MA2014-01, 41. [Google Scholar] [CrossRef]
  32. Mallick, S.; Gayen, D. Thermal behaviour and thermal runaway propagation in lithium-ion battery systems—A critical review. J. Energy Storage 2023, 62, 106894. [Google Scholar] [CrossRef]
  33. Hu, X.; Wang, Y.; Feng, X.; Wang, L.; Ouyang, M.; Zhang, Q. Thermal stability of ionic liquids for lithium-ion batteries: A review. Renew. Sustain. Energy Rev. 2024, 207, 114949. [Google Scholar] [CrossRef]
  34. Dahn, J.R.; Ehrlich, G.M. Linden’s Handbook of Batteries; Reddy, T.B., Ed.; McGraw Hill: New York, NY, USA, 2011; pp. 26.1–26.79. [Google Scholar]
  35. Chai, Z.; Liu, Z.; Xue, Q.; Xiao, Y.; Tan, P.; Qiu, M.; Li, J. Efficient coupled mechanical-electrical-thermal modeling and safety assessment of lithium-ion battery under mechanical abuse. J. Energy Storage 2025, 114, 115917. [Google Scholar] [CrossRef]
  36. Wang, Y.; Wang, X.; Gao, P.; Jiang, J.; Huang, A. Novel composite electrolyte additive for enhancing the thermal and cycling stability of SiO/C anode Li-ion battery. Process Saf. Environ. Prot. 2024, 189, 756–767. [Google Scholar] [CrossRef]
  37. Wang, H.; Lara-Curzio, E.; Rule, E.T.; Winchester, C.S. Mechanical abuse simulation and thermal runaway risks of large format Li-ion batteries. J. Power Sources 2017, 342, 913–920. [Google Scholar] [CrossRef]
  38. Jhu, C.-Y.; Wang, Y.-W.; Wen, C.-Y.; Chiang, C.-C.; Shu, C.-M. Self-reactive rating of thermal runaway hazards on 18650 lithium-ion batteries. J. Therm. Anal. Calorim. 2011, 106, 159–163. [Google Scholar] [CrossRef]
  39. Xiao, Y.; Yang, F.; Gao, Z.; Liu, M.; Wang, J.; Kou, Z.; Lin, Y.; Li, Y.; Gao, L.; Chen, Y.; et al. Review of mechanical abuse related thermal runaway models of lithium-ion batteries at different scales. J. Energy Storage 2023, 64, 107145. [Google Scholar] [CrossRef]
  40. Ruiz, V.; Pfrang, A.; Kirston, A.; Omar, N.; Van den Bossche, P.; Boon-Brett, L. A review of international abuse testing standards and regulations for lithium ion batteries in electric and hybrid electric vehicles. Renew. Sustain. Energy Rev. 2018, 81, 1427–1452. [Google Scholar] [CrossRef]
  41. Wang, J.; Jiang, Z.; Mei, M.; Qiu, H.; Wang, Y. Numerical simulation study on two-phase flow of thermal runaway evolution and jet fire of 18650 lithium-ion battery under thermal abuse. Case Stud. Therm. Eng. 2024, 53, 103726. [Google Scholar] [CrossRef]
  42. Xia, Q.; Ren, Y.; Wang, Z.; Yang, D.; Yan, P.; Wu, Z.; Sun, B.; Feng, Q.; Qian, C. Safety risk assessment method for thermal abuse of lithium-ion battery pack based on Multiphysics simulation and improved bisection method. Energy 2023, 264, 126228. [Google Scholar] [CrossRef]
  43. Lamb, J.; Orendorff, C.J.; Steele, L.A.M.; Spangler, S.W. Failure propagation in multi-cell lithium-ion batteries. J. Power Sources 2015, 283, 517–523. [Google Scholar] [CrossRef]
  44. Wang, Z.; Mao, N.; Jiang, F. Study of the effect on spacing on thermal runaway propagation for lithium-ion batteries. J. Therm. Anal. Calorim. 2020, 140, 2849–2863. [Google Scholar] [CrossRef]
  45. Huang, P.; Wang, Q.; Li, K.; Ping, P.; Sun, J. The combustion behavior of large scale lithium titanate battery. Sci. Rep. 2015, 5, 7788. [Google Scholar] [CrossRef]
  46. Fu, Y.; Lu, S.; Li, K.; Liu, C.; Cheng, X.; Zhang, H. An experimental study on burning behaviors of 18650 lithium ion batteries using a cone calorimeter. Power Sources 2015, 273, 216–222. [Google Scholar] [CrossRef]
  47. Chen, M.; Zhou, D.; Chen, X.; Zhang, W.; Liu, J.; Yuen, R.; Wang, J. Investigation on the thermal hazards of 18650 lithium ion batteries by fire calorimeter. J. Therm. Anal. Calorim. 2015, 122, 755–763. [Google Scholar] [CrossRef]
  48. Feng, X.; Fang, M.; He, X.; Ouyang, M.; Lu, L.; Wang, H.; Zhang, M. Thermal runaway features of large format prismatic lithium ion battery using extended volume accelerating rate calorimetry. J. Power Sources 2014, 255, 294–301. [Google Scholar] [CrossRef]
  49. Roth, E.P.; Doughty, D.H. Thermal abuse performance of high-power 18650 Li-ion cells. J. Power Sources 2004, 128, 308–318. [Google Scholar] [CrossRef]
  50. Wang, Q.; Sun, J.; Yao, X.; Chen, C. Thermal behavior of lithiated graphite with electrolyte in lithium-ion batteries. J. Electrochem. Soc. 2006, 153, A329–A333. [Google Scholar] [CrossRef]
  51. Ma, S.; Jiang, M.; Tao, P.; Song, C.; Wu, J.; Wang, J.; Deng, T.; Shang, W. Temperature effect and thermal impact in lithium-ion batteries: A review. Prog. Nat. Sci. Mater. Int. 2018, 28, 653–666. [Google Scholar] [CrossRef]
  52. Zhang, S. Problems and their origins of Ni-rich layered oxide cathode materials. Energy Storage Mater. 2020, 24, 247–254. [Google Scholar] [CrossRef]
  53. Peng, Y.; Yang, L.; Ju, X.; Liao, B.; Ye, K.; Li, L.; Cao, B.; Ni, Y. A comprehensive investigation on the thermal and toxic hazards of large format lithium-ion batteries with LiFePO4 cathode. J. Hazard. Mater. 2020, 381, 11. [Google Scholar] [CrossRef]
  54. Wang, Q.; Ping, P.; Zhao, X.; Chu, G.; Sun, J.; Chen, C. Thermal Runaway Caused Fire and Explosion of Lithium Ion Battery. J. Power Sources 2012, 208, 210–224. [Google Scholar] [CrossRef]
  55. Bai, F.; Chen, M.; Song, W.; Feng, Z.; Li, Y.; Ding, Y. Thermal management performances of PCM/water cooling-plate using for lithium-ion battery module based on non-uniform internal heat source. Appl. Therm. Eng. 2017, 126, 17–27. [Google Scholar] [CrossRef]
  56. Garg, M.; Tanim, T.R.; Rahn, C.D.; Bryngelsson, H.; Legnedahl, N. Elevated temperature for life extension of lithium ion power cells. Energy 2018, 159, 716–723. [Google Scholar] [CrossRef]
  57. Galushkin, N.E.; Yazvinskaya, N.N.; Galushkin, D.N. Mechanism of gases generation during lithium-ion batteries cycling. J. Electrochem. Soc. 2019, 166, A897–A908. [Google Scholar] [CrossRef]
  58. Wang, G.; Kong, D.; Ping, P.; He, X.; Lu, H.; Zhao, H.; Hong, W. Modeling venting behaviour of lithium-ion batteries during thermal runaway propagation by coupling cfd and thermal resistance network. Appl. Energy 2023, 334, 120660. [Google Scholar] [CrossRef]
  59. Fang, J.; Cai, J.; He, X. Experimental study on the vertical thermal runaway propagation in cylindrical Lithium-ion batteries: Effects of spacing and state of charge. Appl. Therm. Eng. 2021, 197, 11739. [Google Scholar] [CrossRef]
  60. Feng, X.; Sun, J.; Ouyang, M.; Wang, F.; He, X.; Lu, L.; Peng, H. Characterization of penetration induced thermal runaway propagation process within a large format lithium ion battery module. J. Power Source 2015, 275, 261–273. [Google Scholar] [CrossRef]
  61. Feng, X.; Lu, L.; Ouyang, M.; Li, J.; He, X. A 3D thermal runaway propagation model for a large format lithium ion battery module. Energy 2016, 115, 194–208. [Google Scholar] [CrossRef]
  62. Lopez, C.F.; Jeevarajan, J.A.; Mukherjee, P.P. Experimental analysis of thermal runaway and propagation in lithium-ion battery modules. J. Electrochem. Soc. 2015, 162, A1905–A1915. [Google Scholar] [CrossRef]
  63. Wilke, S.; Schweitzer, B.; Khateeb, S.; Al-Hallaj, S. Preventing thermal runaway propagation in lithium ion battery packs using a phase change composite material: An experimental study. J. Power Sources 2017, 340, 51–59. [Google Scholar] [CrossRef]
  64. Gao, S.; Feng, X.; Lu, L.; Kamyab, N.; Du, J.; Comsn, P.; White, R.E.; Ouyang, M. An experimental and analytical study of thermal runaway propagation in a large format lithium ion battery module with NMC pouch-cells in parallel. Int. J. Heat Mass Transf. 2019, 135, 93–103. [Google Scholar] [CrossRef]
  65. Gharehghani, A.; Rabiei, M.; Mehranfar, S.; Saeedipour, S.; Mahmoudzadeh-Andwari, A.; García, A.; Reche, C.M. Progress in battery thermal management systems technologies for electric vehicles. Renew. Sustain. Energy Rev. 2024, 202, 114654. [Google Scholar] [CrossRef]
  66. Zhao, Y.; Zhang, X.; Yang, B.; Cai, S. A review of battery thermal management systems using liquid cooling and PCM. J. Energy Storage 2024, 76, 109836. [Google Scholar] [CrossRef]
  67. Qi, C.; Wang, H.; Li, M.; Li, C.; Li, Y.; Shi, C.; Wei, N.; Wang, Y.; Zhang, H. Research on the Thermal Runaway Behavior and Flammability Limits of Sodium-Ion and Lithium-Ion Batteries. Batteries 2025, 11, 24. [Google Scholar] [CrossRef]
  68. Yu, D.; Ren, D.; Dai, K.; Zhang, H.; Zhang, J.; Yang, B.; Ma, S.; Wang, X.; You, Z. Failure mechanism and predictive model of lithium-ion batteries under extremely high transient impact. J. Energy Storage 2021, 43, 103191. [Google Scholar] [CrossRef]
  69. Lamb, J.; Orendorff, C.J. Evaluation of mechanical abuse techniques in lithium ion batteries. J. Power Sources 2014, 247, 189–196. [Google Scholar] [CrossRef]
  70. Available online: https://www.agu.ch/1.0/crashtest-datenbank/ (accessed on 15 April 2024).
  71. Available online: https://euroncap.newsmarket.com/images-and-videos/all/nio-el6---euro-ncap-2024-results---5-stars/s/71368fe6-5ad6-49d2-bc72-ca95a589c4c9 (accessed on 15 April 2024).
  72. Wang, L.; Li, J.; Chen, J.; Duan, X.; Li, B.; Li, J. Revealing the internal short circuit mechanisms in lithium-ion batteries upon dynamic loading based on Multiphysics simulation. Appl. Energy 2023, 351, 121790. [Google Scholar] [CrossRef]
  73. Xi, S.; Zhao, Q.; Chang, L.; Huang, X.; Cai, Z. The dynamic failure mechanism of a lithium-ion battery at different impact velocity. Eng. Fail. Anal. 2020, 116, 104747. [Google Scholar] [CrossRef]
  74. Zhao, C.; Sun, J.; Wang, Q. Thermal runaway hazards investigation on 18650 lithium-ion battery using extended volume accelerating rate calorimeter. J. Energy Storage 2020, 28, 101232. [Google Scholar] [CrossRef]
  75. Williams, F.W.; Back, G.G. Lithium Battery Fire Tests and Mitigation; Naval Research Laboratory: Washington, DC, USA, 2014. [Google Scholar]
  76. Ouyang, D.; Chen, M.; Wang, J. Fire behaviours study on 18650 batteries pack using cone-calorimeter. J. Therm. Anal. Calorim. 2018, 136, 2281–2294. [Google Scholar] [CrossRef]
  77. Wang, Z.; Yuan, J.; Zhu, X.; Wang, H.; Huang, L.; Wang, Y.; Xu, S. Overchargeto-thermal-runaway behavior and safety assessment of commercial lithium-ion cells with different cathode materials: A comparison study. J. Energy Chem. 2021, 55, 484–498. [Google Scholar] [CrossRef]
  78. Feng, X.; Ouyang, M.; Liu, X.; Lu, L.; Xia, Y.; He, X. Thermal runaway mechanism of lithium ion battery for electric vehicles: A review. Energy Storage Mater. 2018, 10, 246–267. [Google Scholar] [CrossRef]
  79. Liu, J.; Wang, Z.; Bai, J.; Gao, T.; Mao, N. Heat generation and thermal runaway mechanisms induced by overcharging of aged lithium-ion battery. Appl. Therm. Eng. 2022, 212, 118565. [Google Scholar] [CrossRef]
  80. Ye, J.; Chen, H.; Wang, Q.; Huang, P.; Sun, J.; Lo, S. Thermal behavior and failure mechanism of lithium ion cells during overcharge under adiabatic conditions. Appl. Energy 2016, 182, 464–474. [Google Scholar] [CrossRef]
  81. Lalinde, I.; Berrueta, A.; Valera, J.J.; Arza, J.; Sanchis, P.; Ursúa, A. Perspective Chapter: Thermal Runaway in Lithium-Ion Batteries. In Lithium-Ion Batteries—Recent Advanced and Emerging Topics; Lamblin, D.G., Ed.; IntechOpen: Rijeka, Croatia, 2022. [Google Scholar]
  82. Kemeny, M.; Ondrejka, P.; Mikolasek, M. Comprehensive Degradation Analysis of NCA Li-Ion Batteries via Methods of Electrochemical Characterisation for Various Stress-Inducing Scenarios. Batteries 2023, 9, 33. [Google Scholar] [CrossRef]
  83. Duh, Y.-S.; Theng, J.-H.; Chen, C.-C.; Kao, C.-S. Comparative study on thermal runaway of commercial 14500, 18650 and 26650 LiFePO4 batteries used in electric vehicles. J. Energy Storage 2020, 31, 101580. [Google Scholar] [CrossRef]
  84. Roth, E.P. Abuse response of 18650 Li-ion cells with different cathodes using EC:EMC/LiPF6 and EC:PC:DMC/LiPF6 Electrolytes. ECS Trans. 2008, 11, 19–41. [Google Scholar] [CrossRef]
  85. Lei, B.; Zhao, W.; Ziebert, C.; Uhlmann, N.; Rohde, M.; Seifert, H.J. Experimental analysis of thermal runaway in 18650 cylindrical Li-ion cells using an accelerating rate calorimeter. Batteries 2017, 3, 14. [Google Scholar] [CrossRef]
  86. Bugryniec, P.J.; Davidson, J.N.; Cumming, D.J.; Brown, S.F. Pursuing safer batteries: Thermal abuse of LiFePO4 cells. J. Power Sources 2019, 414, 557–568. [Google Scholar] [CrossRef]
  87. Lebkowski, A. Temperature, Overcharge and Short-Circuit Studies of Batteries Used in Electric Vehicles; Department of Ship Automation, Gdynia Maritime University: Gdynia, Poland, 2017. [Google Scholar] [CrossRef]
  88. Larsson, F.; Mellander, B.E. Abuse by External Heating, Overcharge and Short Circuiting of Commercial Lithium-Ion Battery Cells. J. Electrochem. Soc. 2014, 161, 1611–1617. [Google Scholar] [CrossRef]
  89. Feng, X.; Weng, C.; Ouyang, M.; Sun, J. Online internal short circuit detection for a large format lithium ion battery. Appl. Energy 2016, 161, 168–180. [Google Scholar] [CrossRef]
  90. Nedjalkov, A.; Meyer, J.; Kohring, M.; Doering, A.; Angelmahr, M.; Dahle, S.; Sander, A.; Fischer, A.; Schade, W. Toxic gas emissions from damaged lithium ion batteries, analysis and safety enhancement solution. Batteries 2016, 2, 5. [Google Scholar] [CrossRef]
  91. Koch, S.; Fill, A.; Birke, K.P. Comprehensive gas analysis on large scale automotive lithium-ion cells in thermal runaway. J. Power Sources 2018, 398, 106–112. [Google Scholar] [CrossRef]
  92. Perea, A.; Paolella, A.; Dubé, J.; Champagne, D.; Mauger, A.; Zaghib, K. State of charge influence on thermal reactions and abuse tests in commercial lithium-ion cells. J. Power Sources 2018, 399, 392–397. [Google Scholar] [CrossRef]
  93. Leising, R.A.; Palazzo, M.J.; Takeuchi, E.S.; Takeuchi, K.J. Abuse testing of lithium-ion batteries: Characterization of the overcharge reaction of LiCoO2/graphite cells. J. Electrochem. Soc. 2001, 148, A838–A844. [Google Scholar] [CrossRef]
  94. Fernandes, Y.; Bry, A.; De Persis, S. Identification and quantification of gases emitted during abuse tests by overcharge of a commercial Li-ion battery. J. Power Sources 2018, 389, 106–119. [Google Scholar] [CrossRef]
  95. Yuan, Q.F.; Zhao, F.; Wang, W.; Zhao, Y.; Linag, Z.; Yan, D. Overcharge failure investigation of lithium-ion batteries. Electrochim. Acta 2015, 178, 682–688. [Google Scholar] [CrossRef]
  96. Ohsaki, T.; Kishi, T.; Kuboki, T.; Takami, N.; Shimura, N.; Sato, Y.; Sekino, M.; Satoh, A. Overcharge reaction of lithium ion batteries. J. Power Sources 2005, 146, 97–100. [Google Scholar] [CrossRef]
  97. Tomaszewska, A.; Chu, Z.; Feng, X.; O’Kane, S.; Liu, X.; Chen, J.; Endler, E.; Li, R.; Liu, L.; Li, Y.; et al. Lithium-ion battery fast charging: A review. eTransportation 2019, 1, 100011. [Google Scholar] [CrossRef]
  98. Mele, M.L.; Bracciale, M.P.; Ubaldi, S.; Santarelli, M.L.; Mazzaro, M.; Di Bari, C.; Russo, P. Thermal Abuse Tests on 18650 Li-Ion Cells Using a Cone Calorimeter and Cell Residues Analysis. Energies 2022, 15, 2628. [Google Scholar] [CrossRef]
  99. Mikolajczak, C.; Kahn, M.; White, K.; Long, R.T. Lithium-Ion Batteries Hazard and Use Assessment. Exponent Failure Analysis Associates, Inc.: Menlo Park, CA, USA. Available online: https://content.nfpa.org/-/media/Project/Storefront/Catalog/Files/Research/Research-Foundation/Reports/Hazardous-materials/RFLithiumIonBatteriesPhaseIII.pdf?rev=a511861eecaa43b88a9cbc80d8395387 (accessed on 17 March 2024).
  100. Ohneseit, S.; Finster, P.; Floras, C.; Lubenau, N.; Uhlmann, N.; Seifert, H.J.; Ziebert, C. Thermal and Mechanical Safety Assessment of Type 21700 Lithium-Ion Batteries with NMC, NCA and LFP Cathodes–Investigation of Cell Abuse by Means of Accelerating Rate Calorimetry (ARC). Batteries 2023, 9, 237. [Google Scholar] [CrossRef]
  101. Brand, M.; Gläser, S.; Geder, J.; Menacher, S.; Obpacher, S.; Jossen, A.; Quinger, D. Electrical safety of commercial Li-ion cells based on NMC and NCA technology compared to LFP technology. World Electr. Veh. J. 2013, 6, 572–580. [Google Scholar] [CrossRef]
Figure 1. Schematic of the Thermal Runaway processes in a Lithium Cobalt Oxide (LCO)/graphite cell [29].
Processes 13 00889 g001
Figure 2. Images of various deformed electric vehicles in a crash test. Source: Renault Zoe (at the top) [70] and NIO EL6 (at the bottom) [71].
Processes 13 00889 g002
Figure 3. Images of the overcharge test set-up (left) and image of the charger used to supply 10 A (DC) (right).
Processes 13 00889 g003
Figure 4. Images of the electric griddle instrumented with a PID-controlled thermostat, used for the heating tests.
Processes 13 00889 g004
Figure 5. Image of the set-up of the perforation test with sharp element on the side of a cell with 100% SoC.
Processes 13 00889 g005
Figure 6. Images of the state of cell A after the test are shown, where the perforation it has undergone can be clearly seen.
Processes 13 00889 g006
Figure 7. Temperature and voltage of cell A (SoC 100%) as a function of time during the mechanical abuse test, in which the cell is subjected to perforation in a direction perpendicular to the longitudinal axis of the cell until a short circuit occurs.
Processes 13 00889 g007
Figure 8. Image of damage to A cell tested for mechanical abuse by perforation in the direction perpendicular to the longitudinal axis of the cell.
Processes 13 00889 g008
Figure 9. Images of the main events experienced by cell A (SoC 100%) during the mechanical abuse test (perforation in a direction perpendicular to the longitudinal axis of the cell).
Processes 13 00889 g009
Figure 10. Images of the state of cell D after the test are shown, where the perforation it has undergone can be clearly seen.
Processes 13 00889 g010
Figure 11. Temperature and voltage of cell D (SoC 50%) as a function of time during the mechanical abuse test, in which the cell is subjected to a perforation in a direction perpendicular to the longitudinal axis of the cell until a short circuit occurs.
Processes 13 00889 g011
Figure 12. Image of damage to cell D (SoC 50%), which was tested for mechanical abuse by perforation in the direction perpendicular to the longitudinal axis of the cell.
Processes 13 00889 g012
Figure 13. Images of the main events experienced by cell D (SoC 50%) during the mechanical abuse test (perforation in a direction perpendicular to the longitudinal axis of the cell).
Processes 13 00889 g013
Figure 14. Image of the set-up of the perforation test, with the sharp element on the negative pole of a cell with an SoC of 100%.
Processes 13 00889 g014
Figure 15. The state of cell C after the test, where the perforation it has undergone is clearly visible.
Processes 13 00889 g015
Figure 16. Temperature and voltage of cell C (SoC 0%) as a function of time, during the mechanical abuse test, in which it is subjected to a perforation in the direction of the longitudinal axis of the cell until a short circuit.
Processes 13 00889 g016
Figure 17. Image of the damage in cell C tested for mechanical abuse by perforation in the direction of the longitudinal axis of the cell.
Processes 13 00889 g017
Figure 18. The main events experienced by cell C (SoC 100%) during the mechanical abuse test (perforation in the direction of the longitudinal axis of the cell).
Processes 13 00889 g018
Figure 19. Image of the damage in cell B after the text; the perforation is clearly visible.
Processes 13 00889 g019
Figure 20. Temperature and voltage of cell B (SoC 50%) as a function of time during the mechanical abuse test, in which it is subjected to a perforation in a direction of the longitudinal axis of the cell until a short circuit occurs.
Processes 13 00889 g020
Figure 21. Image of the damage in cell B tested (SoC 50%) for mechanical abuse by perforation in the direction of the longitudinal axis of the cell.
Processes 13 00889 g021
Figure 22. Images of the main events experienced by cell B (SoC 50%) during the mechanical abuse test (perforation in the direction of the longitudinal axis of the cell).
Processes 13 00889 g022
Figure 23. Qualitative comparison of the final state of the tested cells (analyzing their exterior).
Processes 13 00889 g023
Figure 24. Qualitative comparison of the final state of the tested cells (analyzing their interior).
Processes 13 00889 g024
Figure 25. Comparison of the temperature reached by the cells during the tests to which they have been subjected.
Processes 13 00889 g025
Figure 26. Comparison of the voltage behavior of the cells during the tests to which they have been subjected.
Processes 13 00889 g026
Figure 27. Image of the set-up of the perforation test with sharp element on the negative pole of a cell NMC with an SoC of 100%.
Processes 13 00889 g027
Figure 28. Qualitative comparison of the damage in the NMC cell (left) with the damage in the LFP cell (cell C) (right), tested by mechanical abuse by perforation in the direction of the longitudinal axis of the cell.
Processes 13 00889 g028
Figure 29. Images of the main events experienced by the NMC cell (SoC 100%) during the mechanical abuse test (perforation in the direction of the cell longitudinal axis).
Processes 13 00889 g029
Figure 30. Temperature of NMC cell (SoC 100%) and cell C (LFP, SoC 100%) perforated in the direction of the longitudinal axis of the cell to the short-circuit.
Processes 13 00889 g030
Figure 31. Temperature profile reached by the pouch cells subjected to the overcharge test, for ambient temperature of 40 °C and 25 °C.
Processes 13 00889 g031
Figure 32. Image of the pouch cell in its original state to be used in the overcharge tests.
Processes 13 00889 g032
Figure 33. State of pouch cell 1 (left) and pouch cell 2 (right) at the instant of maximum swelling, when the power supply is switched off.
Processes 13 00889 g033
Figure 34. State of pouch cell 1 (left) and pouch cell 2 (right) at the instant of maximum swelling, after switching off the power supply.
Processes 13 00889 g034
Figure 35. Final steady state of the pouch 1 and pouch 2 cell one day after the overcharge test.
Processes 13 00889 g035
Figure 36. The first image shows the two cells with the tooling used to prevent them from moving during the test. The second and third images show the condition of the cells after test 1.
Processes 13 00889 g036
Figure 37. Cell 4 temperature (solid line) because of heating when placed on the electric griddle.
Processes 13 00889 g037
Figure 38. Images of the state of the cells after test 2, positioned with a fixture so that it does not move during test.
Processes 13 00889 g038
Figure 39. Temperature of cell 5 and cell 6 (solid lines) because of heating when placed on the electric griddle (Test 2).
Processes 13 00889 g039
Figure 40. The first image shows the two cells before the test with the tooling used to prevent the cells from moving during the test. The second and third images show the condition of the cells after test 3.
Processes 13 00889 g040
Figure 41. Temperature of cell 9 (solid line) because of heating when placed on the electric griddle (Test 3).
Processes 13 00889 g041
Figure 42. The first image shows the two cells on the electric griddle with the tooling used to prevent the cells from moving during the test. The second and third images show the condition of the cells after test 4.
Processes 13 00889 g042
Figure 43. Temperature of cell 7 (solid line) because of heating when placed on the electric griddle (Test 4).
Processes 13 00889 g043
Figure 44. Image of the cells with an SoC of 50%, placed with a tool in a vertical arrangement and connected in parallel on the electric griddle, before the starting the heating test.
Processes 13 00889 g044
Figure 45. The first image shows the two cells with the tooling used to prevent the cells from moving during the test. The second and third images show the state of the cells after test 5.
Processes 13 00889 g045
Figure 46. Temperature of cell 11 (solid line) because of heating when placed on the electric griddle (Test 5).
Processes 13 00889 g046
Figure 47. Image of the cells with an SoC of 50%, placed with a tool in a horizontal arrangement and connected in parallel on the electric griddle before the starting the heating test.
Processes 13 00889 g047
Figure 48. The first image shows the two cells seen from above, the second image shows the upper part of the cells (where the vent valve is located), and the third image shows the lower part of the cells.
Processes 13 00889 g048
Figure 49. Temperature of cell 1 (solid line) because of heating when placed on the electric griddle (Test 6).
Processes 13 00889 g049
Figure 50. The first image shows the two cells seen from above, the second image shows the upper part of one of the cells (where the vent valve is located), and the third image shows the upper part of another of the cells.
Processes 13 00889 g050
Figure 51. Temperature of cell 15 (solid line) because of heating when placed on the electric griddle (Test 7).
Processes 13 00889 g051
Figure 52. The first image shows the two cells seen from above, the second image shows the lower part of the cell 13, and the third image shows the upper part of cell 17 (where the vent valve is located).
Processes 13 00889 g052
Figure 53. Temperature of cell 13 (solid line) because of heating when placed on the electric griddle (Test 8).
Processes 13 00889 g053
Figure 54. Final state of the cells after thermal abuse tests by heating, after removal of the top cover.
Processes 13 00889 g054
Figure 55. Final state of tested cell 7 (Test 4: vertical arrangement parallel connection SoC 100%) (left) and final estate of tested cell 10 (Test 3: horizontal arrangement parallel connection SoC 100%) (right).
Processes 13 00889 g055
Table 1. Technical specifications of the cells used in the tests.
Cell TypeParametersImage
32700 Cylindrical cell6.0 Ah, LiFePO4
3.2 V
19.2 Wh
32700 Format
Manufacturer:
HAIDI
Processes 13 00889 i001
Pouch AESC
Nissan Leaf (2018)
Battery structure:
24 modules
8 cells for each module
56.3 Ah, NMC 523
3.65 V
205.49 Wh
Manufacturer:
Envision AESC
Processes 13 00889 i002
Table 2. Specifications of mechanical tests carried out on cylindrical cells with different load states and at different test points.
Cell TestedLocation of PerforationState of Charge, SoC (%)
32700 Cylindrical Lateral zone100
32700 CylindricalLateral zone50
32700 CylindricalUpper zone100
32700 CylindricalUpper zone50
Table 3. Specifications overcharge tests carried out on pouch cells with different ambient temperatures.
Cell TestedCrateSoC (%)Tamb (°C)
Pouch cell 1/5.6 C100Aprox 40 °C
Pouch cell1/5.6 C100Aprox 25 °C
Table 4. Specifications heating tests carried out on cylindrical cells at different states of charge with different types of connection.
Cell TestedLayoutType of ConnectionState of Charge (SoC %)
32700 CylindricalHorizontal2 connected in parallel100%
32700 CylindricalHorizontal2 connected in parallel50%
32700 CylindricalHorizontal2 connected in series100%
32700 CylindricalHorizontal2 connected in series50%
32700 CylindricalVertical2 connected in parallel100%
32700 CylindricalVertical2 connected in parallel50%
32700 CylindricalVertical2 connected in series100%
32700 CylindricalVertical2 connected in series50%
Table 5. Results of mechanical tests carried out on cylindrical cells with different charge states and at different test points.
Cell TestedPlace Where the Perforation Takes PlaceState of Charge (SoC %)Time in Which the TR Takes PlaceTemperature at Which the Test Is Carried Out (Tamb)
32700 Cylindrical
Cell A
Side area100210 s39 °C
32700 Cylindrical
Cell A
Side area5080 s45 °C
32700 Cylindrical
Cell C
Upper area10075 s44 °C
32700 Cylindrical
Cell B
Upper area50140 s28 °C
Table 6. Comparison of measured direct current internal resistance (DCIR) for cells subjected to mechanical abuse test.
TestStart of the Test (mΩ)End of the Test (mΩ)∆DCIR (mΩ)
Test 1_cell A Horizontal SoC 100%7.19911451137.80
Test 2_cell D Horizontal SoC 50%7.280953.3946.02
Test 3_cell C Vertical SoC 100%6.98623202313.014
Test 4_cell B Vertical SoC 50%7.50015051497.500
Table 7. Technical specification of the NMC cell used in the longitudinal direction perforation test of such a cell.
Type of CellParametersImage
Cylindrical 18650
BT-4000
4.0 Ah, NMC
4.2 V
16.8 Wh
18650 format
Manufacturer: DigiVolt
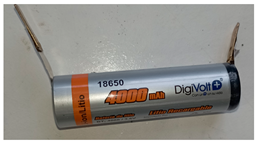
Processes 13 00889 i003
Table 8. Specifications overcharge tests carried out on pouch cells at different ambient temperatures.
Cell TestedCrateState of Charge (SoC %)TambMaximum Cell Temperature Tmax
Pouch Cell1/5.6 C10040 °C62.30 °C
Pouch Cell1/5.6 C10025 °C43.92 °C
Table 9. Comparison of the measured direct current internal resistance (DCIR) for pouch cells subjected to overcharge test.
TestStart of the Test (mΩ)End of the Test (mΩ)∆DCIR (mΩ)
Test 1_pouch cell 1
Tamb = 40 °C
1.61191.4189.79
Test 2_pouch cell 2
Tamb = 25 °C
1.5250.6249.10
Disclaimer/Publisher’s Note: The statements, opinions and data contained in all publications are solely those of the individual author(s) and contributor(s) and not of MDPI and/or the editor(s). MDPI and/or the editor(s) disclaim responsibility for any injury to people or property resulting from any ideas, methods, instructions or products referred to in the content.

