Abstract
This paper addresses the challenges of efficient electric vehicle (EV) charging integration in Direct Current (DC) microgrids (MGs), particularly the impact of intermittent EV loads on power sharing and voltage regulation. Traditional droop control methods suffer from inherent trade-offs between performance indices of parallel distributed energy resources (DERs), which in turn results in improper source utilization. We propose a novel decentralized piece-wise droop control (PDC) approach with voltage compensation for EV charging to overcome this limitation and to minimize the unequal cable resistance effect on power sharing. This strategy dynamically optimises the droop characteristics based on EV charging load profiles, partitioning the droop curve to optimize power sharing accuracy and voltage stability considering the constraints of maximum allowable voltage deviation and loading. Simulation and experimental results demonstrate significant improvements in power sharing, enhanced DER utilization, and voltage deviations consistently within 2.5% when compared with traditional strategies. PDC offers a robust solution for enabling efficient and reliable EV charging in MGs, as it is not sensitive for EV load prediction errors and measurement noise.
1. Introduction
In recent times, MGs have emerged as a sustainable solution to mitigate the climate change challenges associated with conventional electricity generation [1,2]. MGs integrate various distributed energy resources (DERs), such as solar and wind generators, along with energy storage devices. MGs can operate either in grid-connected mode or in an islanded mode [3,4]. When compared to Alternating Current (AC) MGs, DC MGs are advantageous [5,6,7,8] due to fewer power electronic conversion stages, the absence of frequency and skin effects, favourable source integration characteristics, and simple control circuitry [9]. In off-grid MG applications like EV charging, the integration of DERs promotes less dependency on the grid [10,11].
DERs are interfaced with MGs through power electronic converters and interconnecting cables. This offers advantages such as enhanced reliability and scalability [12,13]. However, the uncoordinated integration of DERs can introduce various operational challenges [14,15]. The presence of unequal cable resistance contributes to improper power sharing among the parallel sources of the MG, affecting system reliability [16,17] and leading to poor source utilization. To mitigate this, several droop control techniques have been discussed in the literature [18]. Hence, there is a need for a robust control strategy to eliminate the effect of unequal cable resistance on voltage regulation without compromising on the maximum utilization of sources.
The Linear Droop Control (LDC) strategy exhibits an inherent trade-off between voltage regulation and current sharing among multiple sources. To minimise this limitation, various non-linear control techniques have been presented in the literature. The Non-Linear Droop Control (NLDC) strategy investigated in [19,20,21] implemented a negative droop resistance for light load, and the droop coefficient for heavy loads was optimized. Curve fitting took care of the smooth transition between light and heavy load regions. Virtual impedance droop control, including resistance and capacitance, controlled the DC MG in [22]. However, to attain voltage regulation, a secondary loop was integrated into the DC MG, adding a communication link that exposed the system to communication failure. An improved mixed droop technique [23], along with a sliding mode controller, controlled the DC-DC converters. In [24], the difference between the squared reference voltage and the squared output voltage of the converter was used as the input to the droop control loop for better voltage regulation. An adaptive current sharing technique was also proposed to ensure proper load distribution. The method in [25] controlled virtual inductance and droop resistance to achieve effective power sharing among distributed generators. In [26], a low-bandwidth communication-based droop control strategy was proposed. The droop resistance value was fixed for all the load ranges in the above-mentioned techniques, which led to a trade-off between voltage regulation and power-sharing, leading to a mismatch in source utilization. The addition of communication circuitry is less economical, and it also reduces reliability by exposing the MG to communication failure.
The droop value needs to be optimized based on the load profile to maintain proper source utilization and voltage regulation without any communication. To achieve this, a piece-wise droop controller (PDC) is introduced in [27], in which the droop curve is divided into certain regions based on the load profile, and the droop coefficient is optimized adaptively. This enables improved current sharing during light load and improved voltage regulation in heavy load regions, which is not achievable with the above discussed techniques. A similar decentralized controller concept is implemented for multiterminal High Voltage DC (HVDC) systems in [28], where a single modification of the droop parameter eliminates the need for a centralized controller. However, one of the key challenges with PDC is to achieve a smooth transition between the regions. To address this, [29] proposed minimizing abrupt changes in control commands by limiting the step size of parameter changes. However, implementing such techniques for a small off-grid DC MG outweighs the benefits by increasing cost and complexity. In [30,31], PDC was introduced with adaptive droop resistance updates based on load profile; however, this method is not applicable when the load current follows a Gaussian distribution, limiting its generalizability.
The detailed review of the literature presented in Table 1 reveals that the strategies presented have left an unexplored research gap to address the efficacy of piece-wise droop controllers, particularly in handling intermittent loads such as electric vehicle charging applications, with proper utilization of multiple sources having unequal cable resistances in an off-grid DC MG. The proposed decentralized PDC not only reduces the complexity but also is economical by eliminating the need for a central controller.

Table 1.
Research gaps from literature.
The contributions of the proposed research work are as follows:
- It proposes a cost-effective piece-wise droop control technique, optimizing droop coefficients based on dynamic EV load steps along with unequal line resistance, suitable for intermittent loads like EV charging applications in an off-grid DC MG;
- It includes igorous analysis of the effect of unequal line resistance on the power sharing of DC MG under various line resistance ratios with a high scalability system of four DERs in parallel;
- It presents an extensive mathematical study of the proposed PDC for n regions and m converters, and derives generalized system performance equations;
- It conducts a sensitivity analysis for EV load prediction error and measurement noise, carried out in detail to analyse the robustness of the proposed PDC strategy;
- The proposed controller efficacy is tested with four parallel DERs to rule out any scalability concerns and prove its practical applicability in larger microgrids;
- This work also presents the experimental validation in RT-lab, and the latency metrics are presented. The inclusion of the utilization factors of the parallel sources and latency metrics supports the practical viability of the proposed work for real-world EV charging applications.
The workflow of the remainder of the paper is as follows. Section 2 discusses the proposed DC MG model for EV charging load. Section 3 presents a detailed study of the proposed control strategy. Section 4 demonstrates the performance of the DC MG with a wide range of EV load cases and line resistances. Section 5 consists of the experimental validation through the RT lab. Finally, Section 6 concludes the paper.
2. Off-Grid DC Microgrid for EV Charging Application
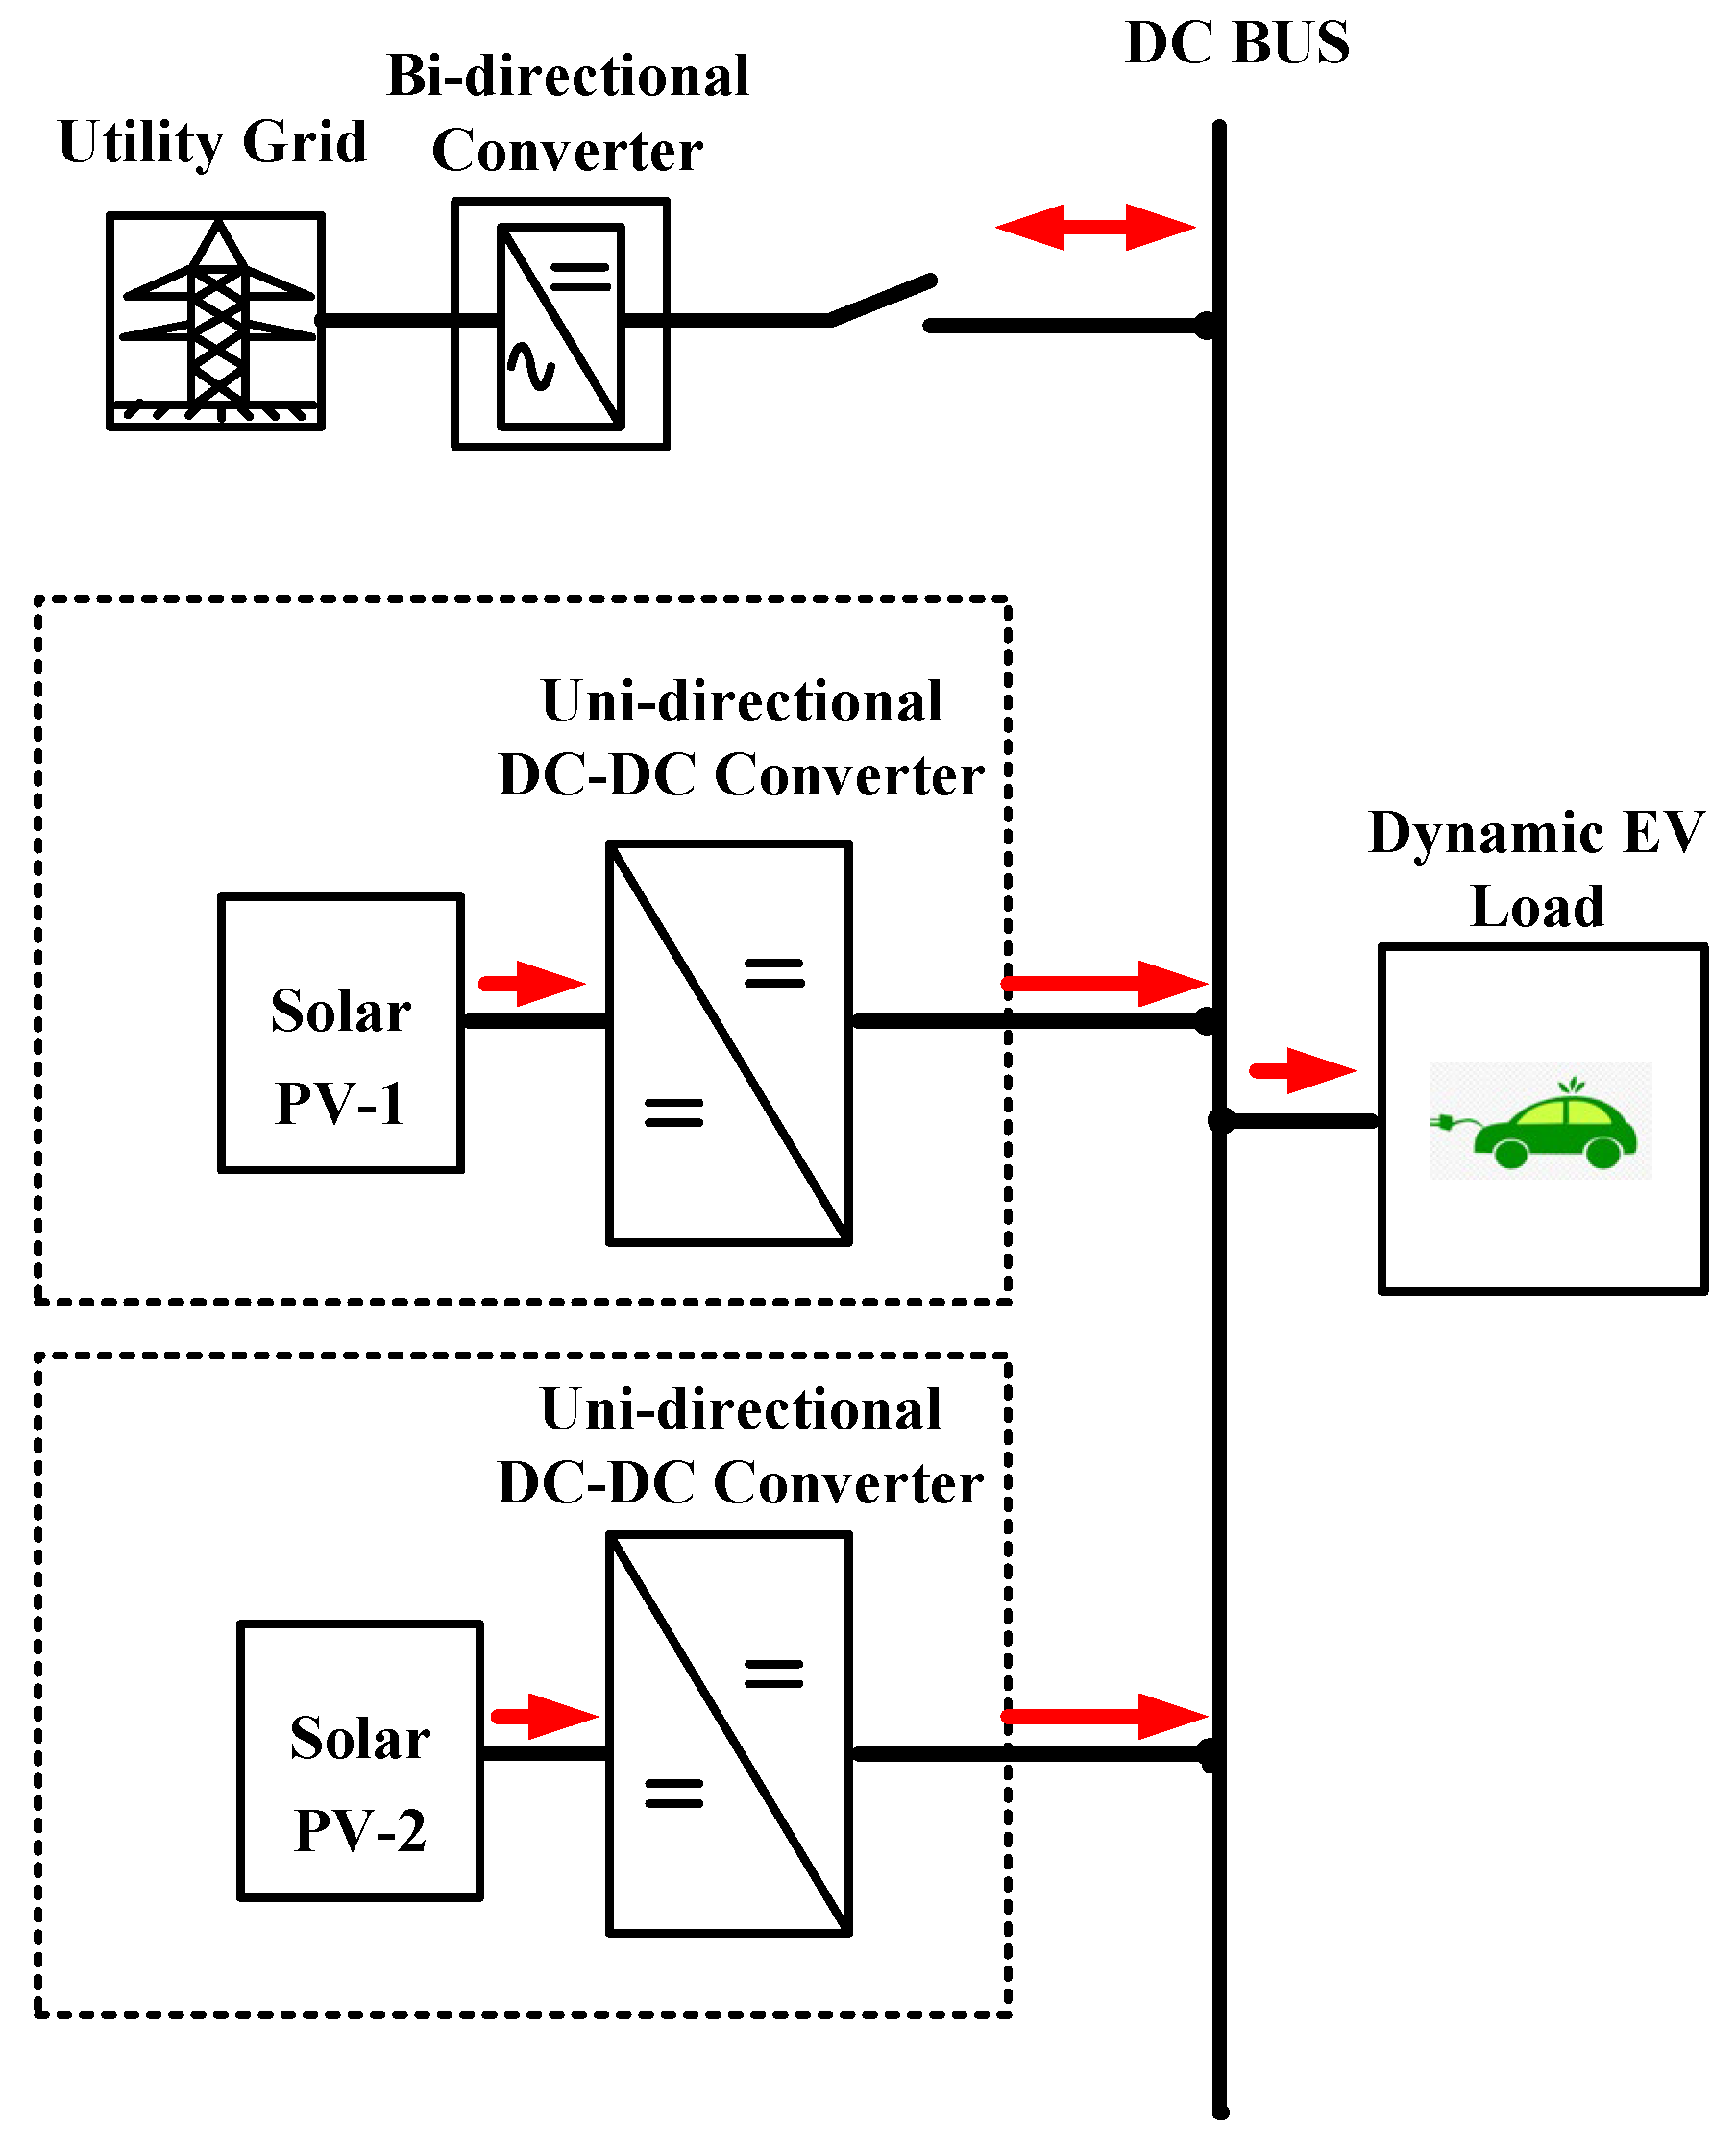
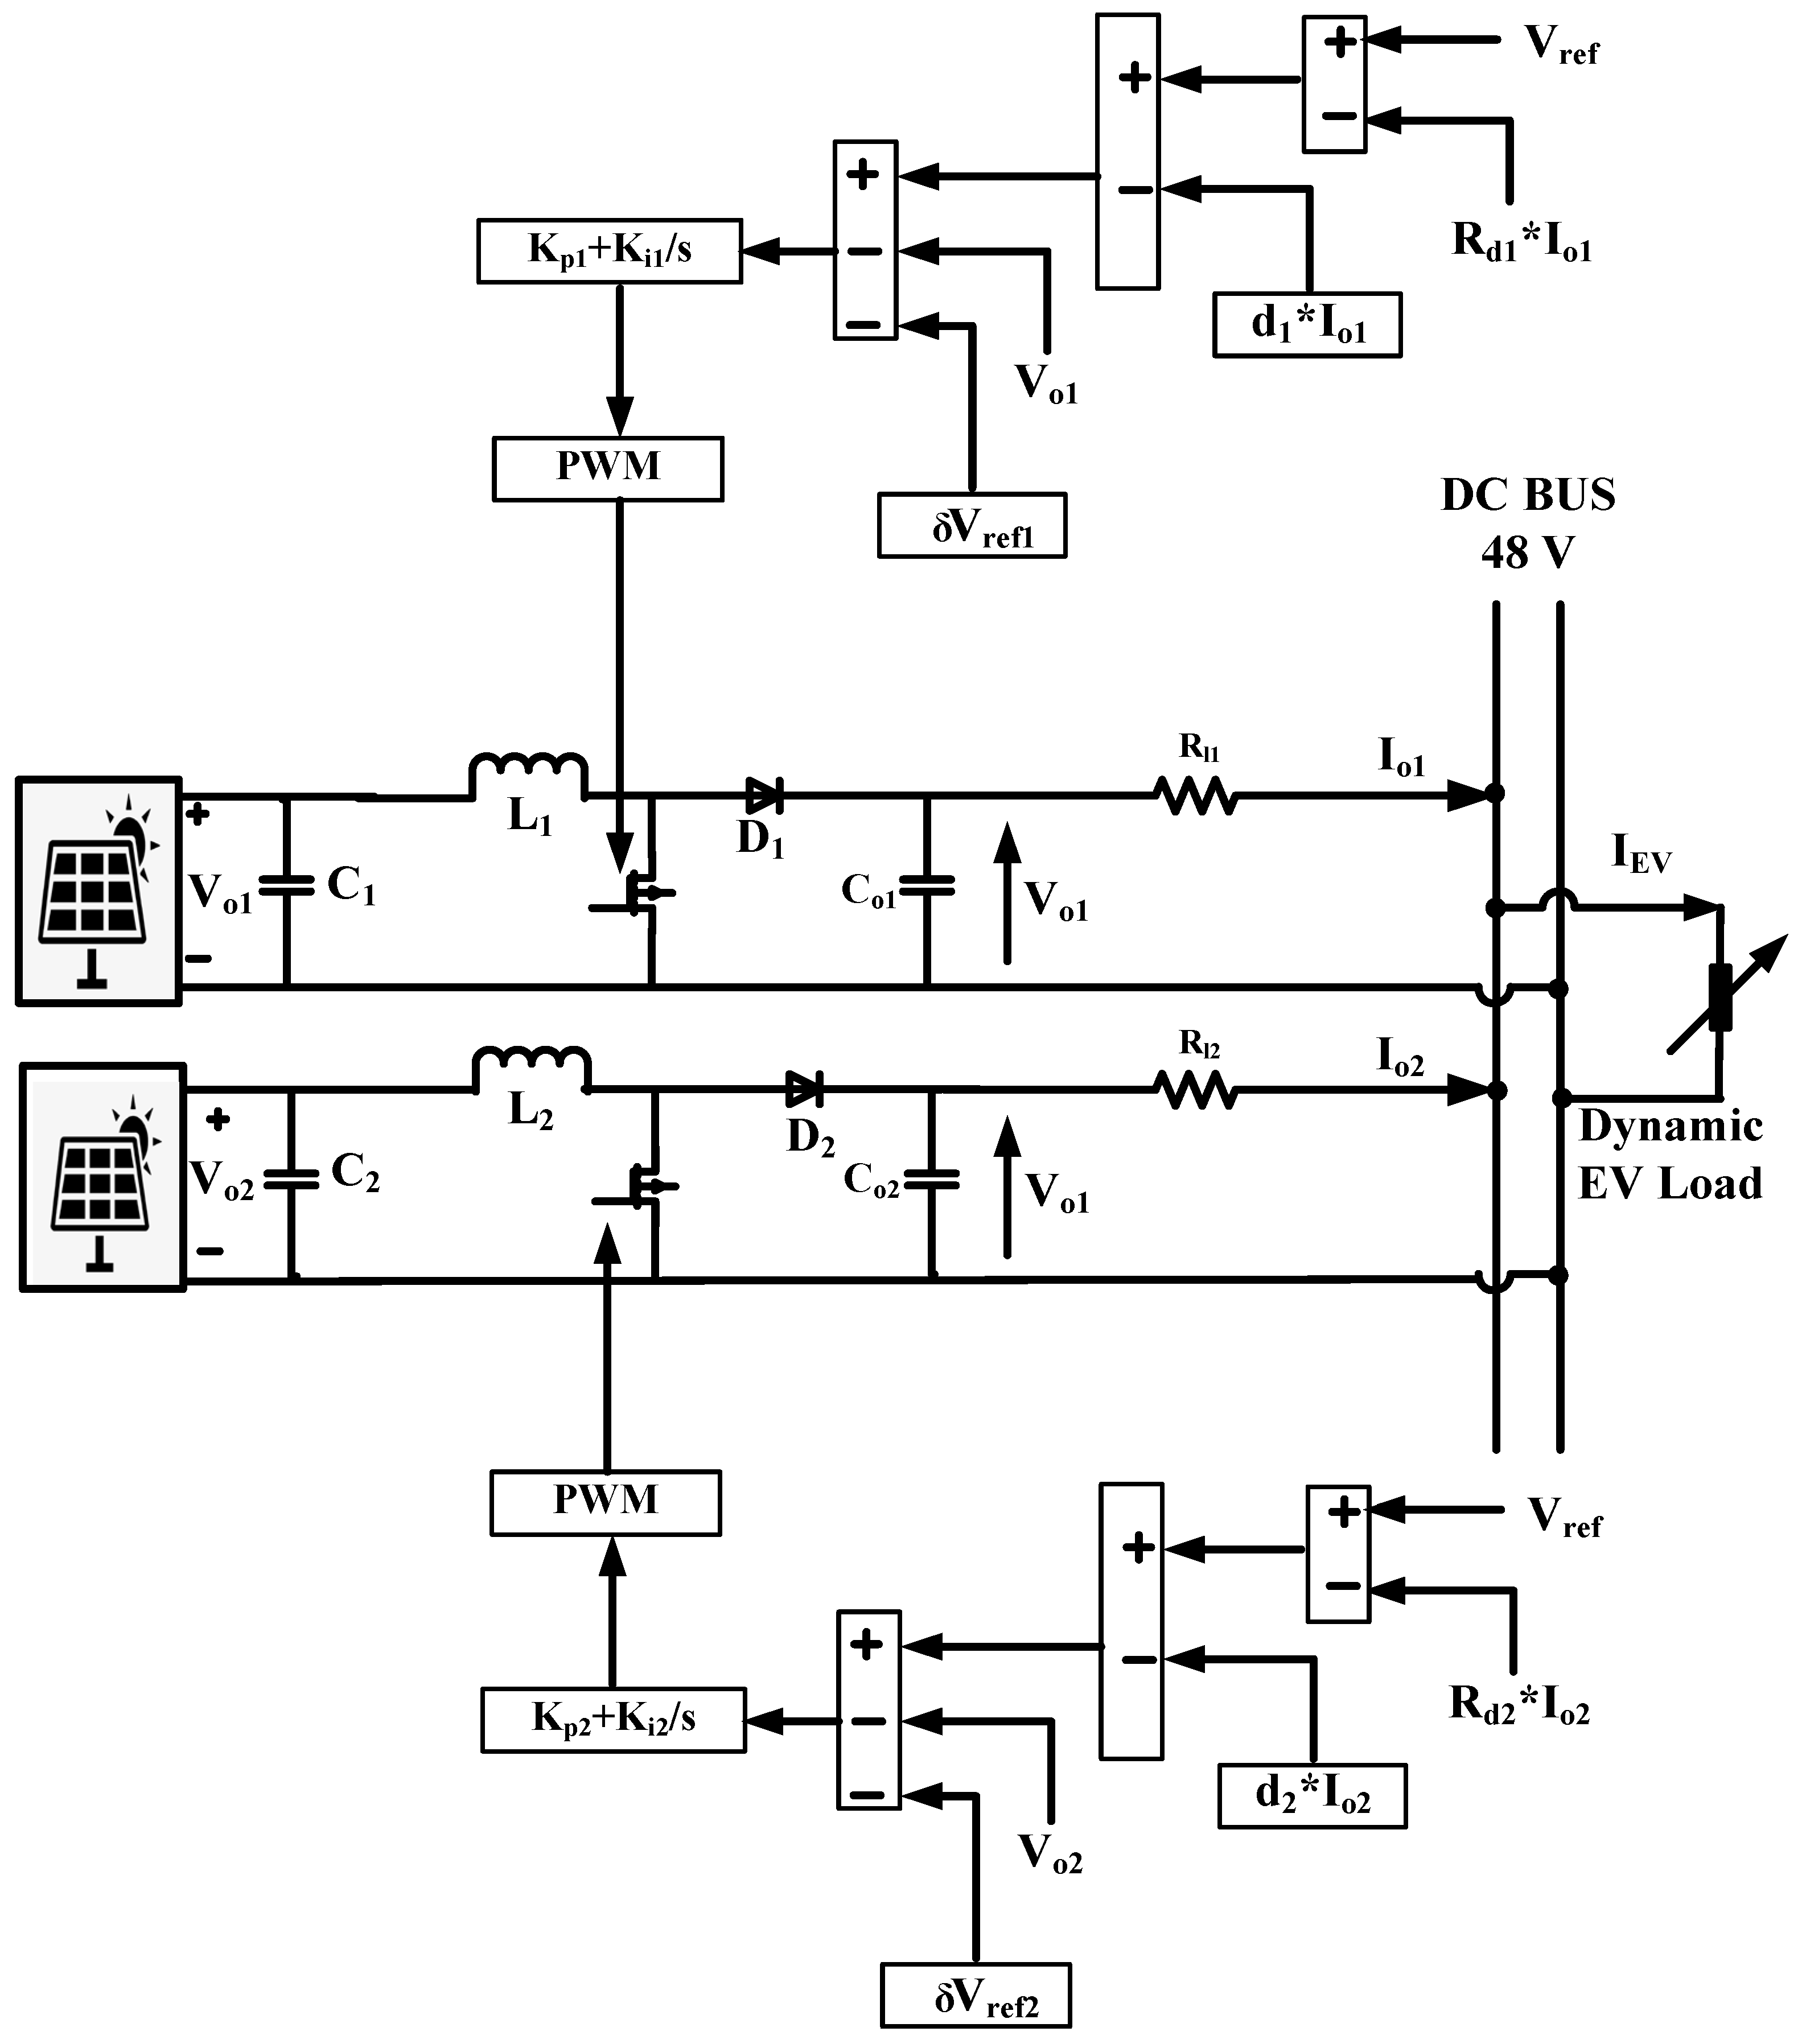
Figure 1 comprises a DC microgrid model in islanded mode integrated with two solar pvs in parallel to accommodate the dynamic EV charging load. Both sources are integrated with unidirectional DC-DC converters controlled by the proposed piece-wise droop controller and a voltage compensator to maintain stable bus voltage and ensure the proper utilization of the parallel sources. The DC bus voltage is considered 48 V in this work, suitable for low-power DC charging applications according to Indian standards. The proposed controller is designed to address the limitations of LDC and NLDC effectively. A dynamic step-wise EV charging load is integrated into the off-grid DC MG to test the proposed PDC’s robustness, dynamic stability, and maximize the sources’ utilization despite unequal line resistance, which is highly necessary for handling the intermittent EV charging load.

Figure 1.
DC microgrid with parallel solar pvs with a common EV charging load.
2.1. Effect of Line Resistance
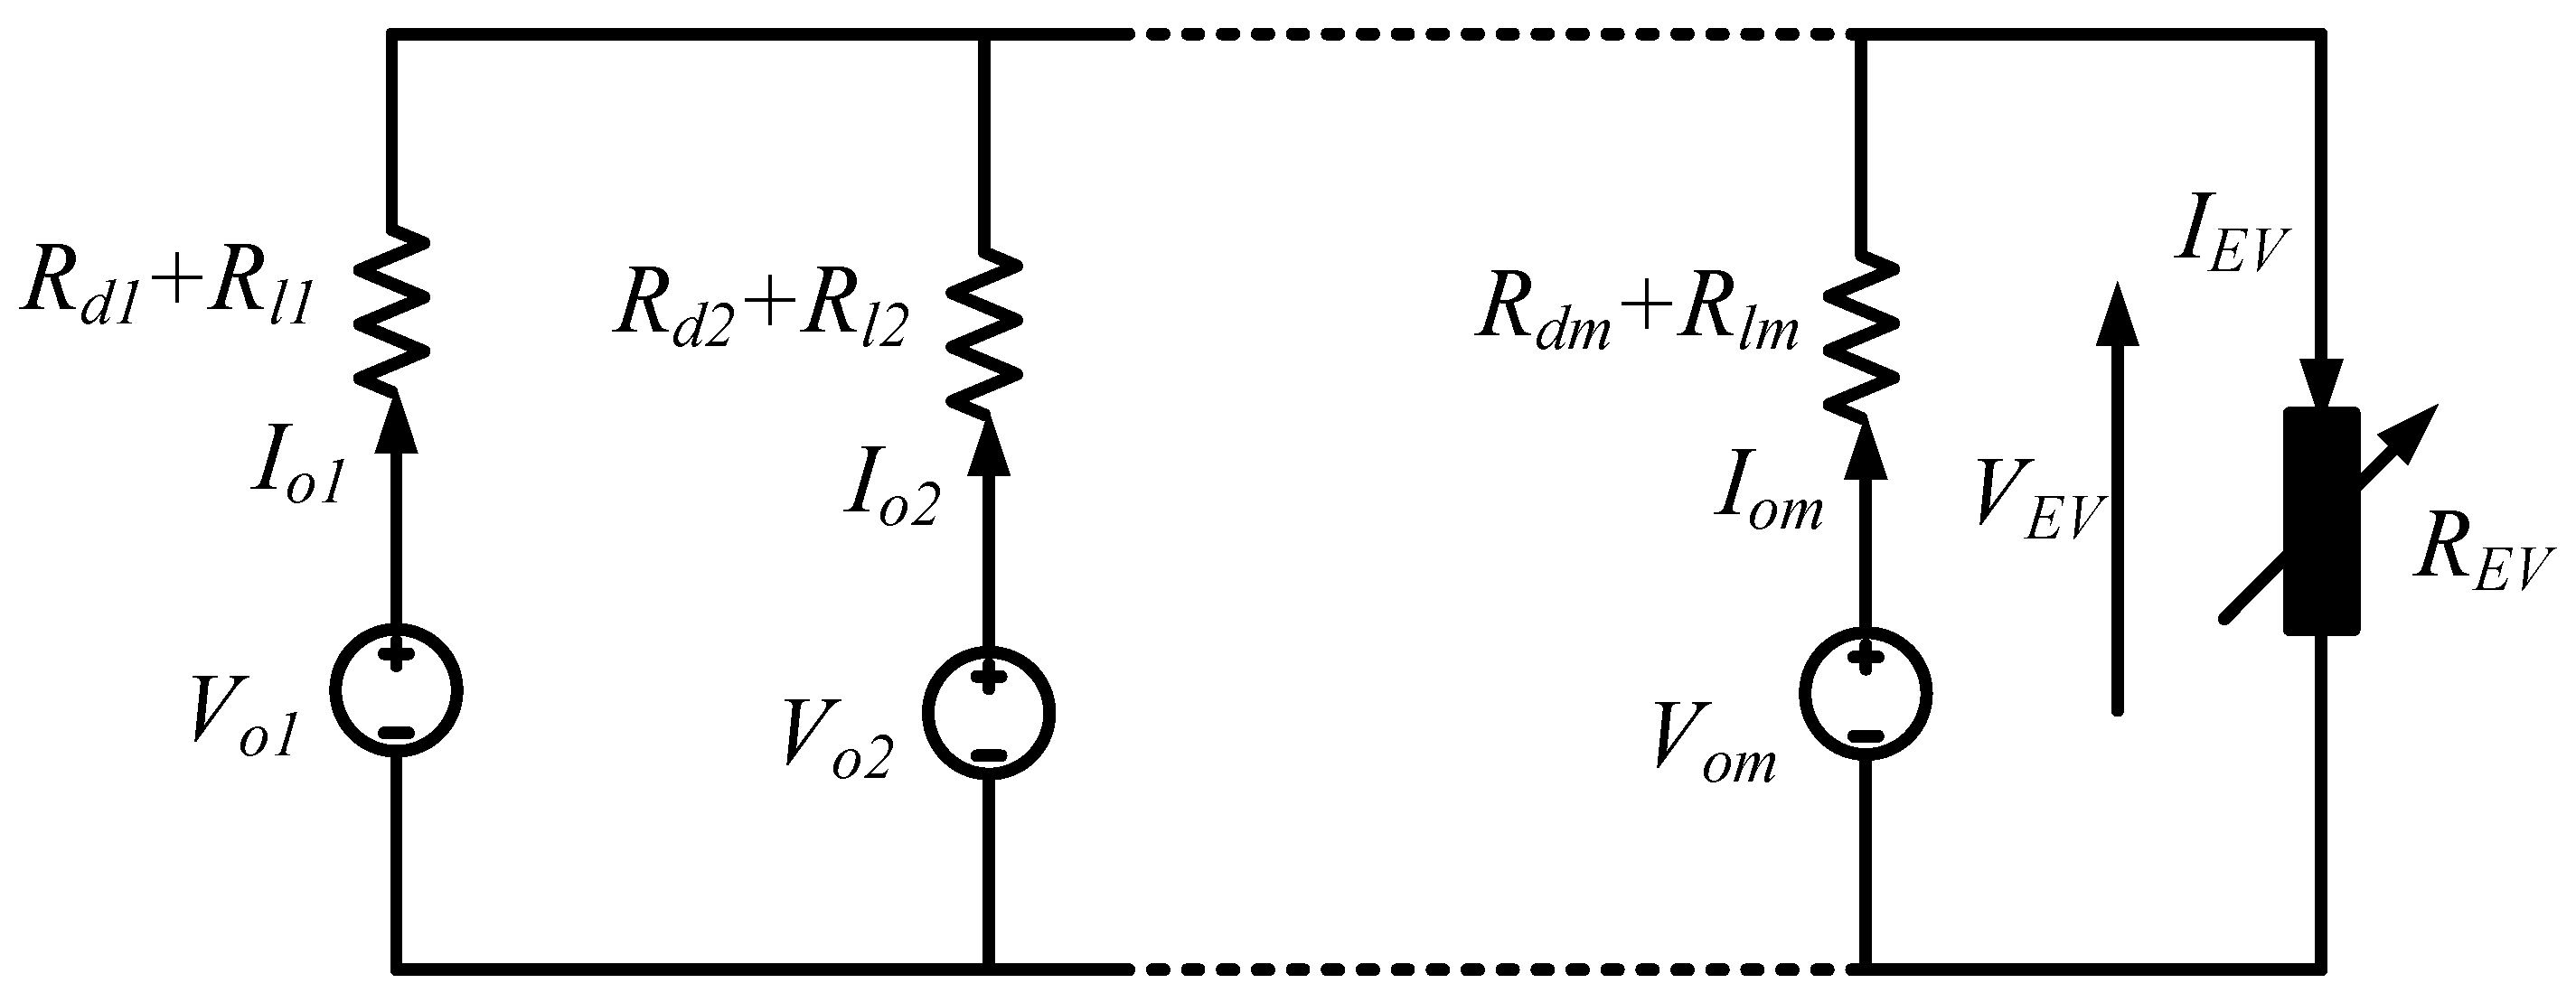
An electrical equivalent of the proposed DC MG with an EV charging load is depicted as follows in Figure 2 to study the role of line resistance in voltage deviation and source utilization.
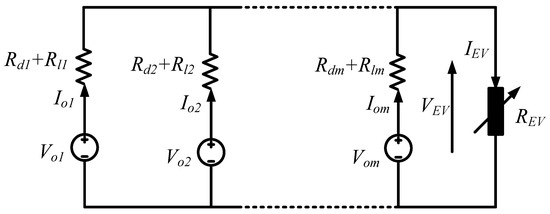
Figure 2.
Electrical equivalent circuit of two parallel converters for dynamic EV load.
is the output voltage, is the output current, is the droop resistance and is the line resistance of the converter, and . is the total load current supplied by the parallel sources to the common EV load. and are the voltage and current of the DC bus feeding the EV load. is the total EV load resistance. The output voltage of converter is defined as follows:
is the reference voltage. The current difference between the two converter currents is calculated as follows assuming droop resistance is zero [19].
where is the reference voltage for the converter as defined by Equation (3) for the LDC [3] and Equation (4) for the NLDC technique [13]:
where is an integer. In an ideal condition
The presence of distributive generative units and other sensor errors in the MG structure makes it very hard to achieve the above conditions. Hence, there exists a current difference, implying a mismatch in current sharing in parallel sources leading to over- or under-utilization of the sources, affecting the bus voltage in the MG structure. The current ratio of parallel converters with LDC for DC MGs having m parallel sources is given by Equation (7) and for NLDC is given by Equation (8):
From the above equations, it is inferred that proper current sharing is possible only if all the converters’ sum of droop and line resistances are equal. However, this condition could not be accomplished in practice. Therefore, to achieve the desired bus voltage and the proper source utilization, the droop value can be varied according to the load. The droop resistance acts as virtual resistance, impacting the converter’s output impedance, thereby impacting bus voltage and source utilization.
2.2. Limitations of LDC and NLDC
The general equation for a droop curve of an converter from no load to maximum load is given as follows:
where,
From the above equation, the droop resistance value is derived as follows:
where is the maximum output current of the converter. j = 1 indicates LDC. j > 1 indicates NLDC.
In a DC MG with two ideal sources with low droop value, the nearer source supplies more power, which is advantageous with a light load. However, this creates lower system utility in the case of a heavy load by under-utilizing the farther load. This situation is vice versa with a large droop value. For the proper utilization of parallel sources, the droop value should increase as the load increases. This leads to accurate power sharing among parallel sources without compromising the voltage regulation. Since the droop value is constant throughout the operation in LDC, there exists a trade-off between voltage regulation and power sharing, which is a limitation for loads like those at EV charging stations.
In NLDC, the droop constant is not fixed, but the droop curve gets steeper as the region progresses, resulting in a higher droop value than required, which leads to improper power sharing. With a smaller j value in Equation (11), power sharing is not accurate with a light load. Whereas with a higher j value, power sharing is not accurate with a heavy load. There exists a trade-off between voltage regulation and power sharing if the DC MG is controlled with NLDC.
3. Proposed PDC Strategy
To reduce the limitation of LDC and NLDC techniques, light EV load conditions require smaller droop values, and heavy EV load conditions require higher droop values, which can be obtained from the proposed piece-wise droop control technique. The droop curve is segmented into certain regions. A droop value is obtained such that it satisfies the conditions of good voltage regulation, proper power-sharing, and improved utilization of sources for the stable and reliable operation of a DC MG.
3.1. Piece Wise Droop Equations
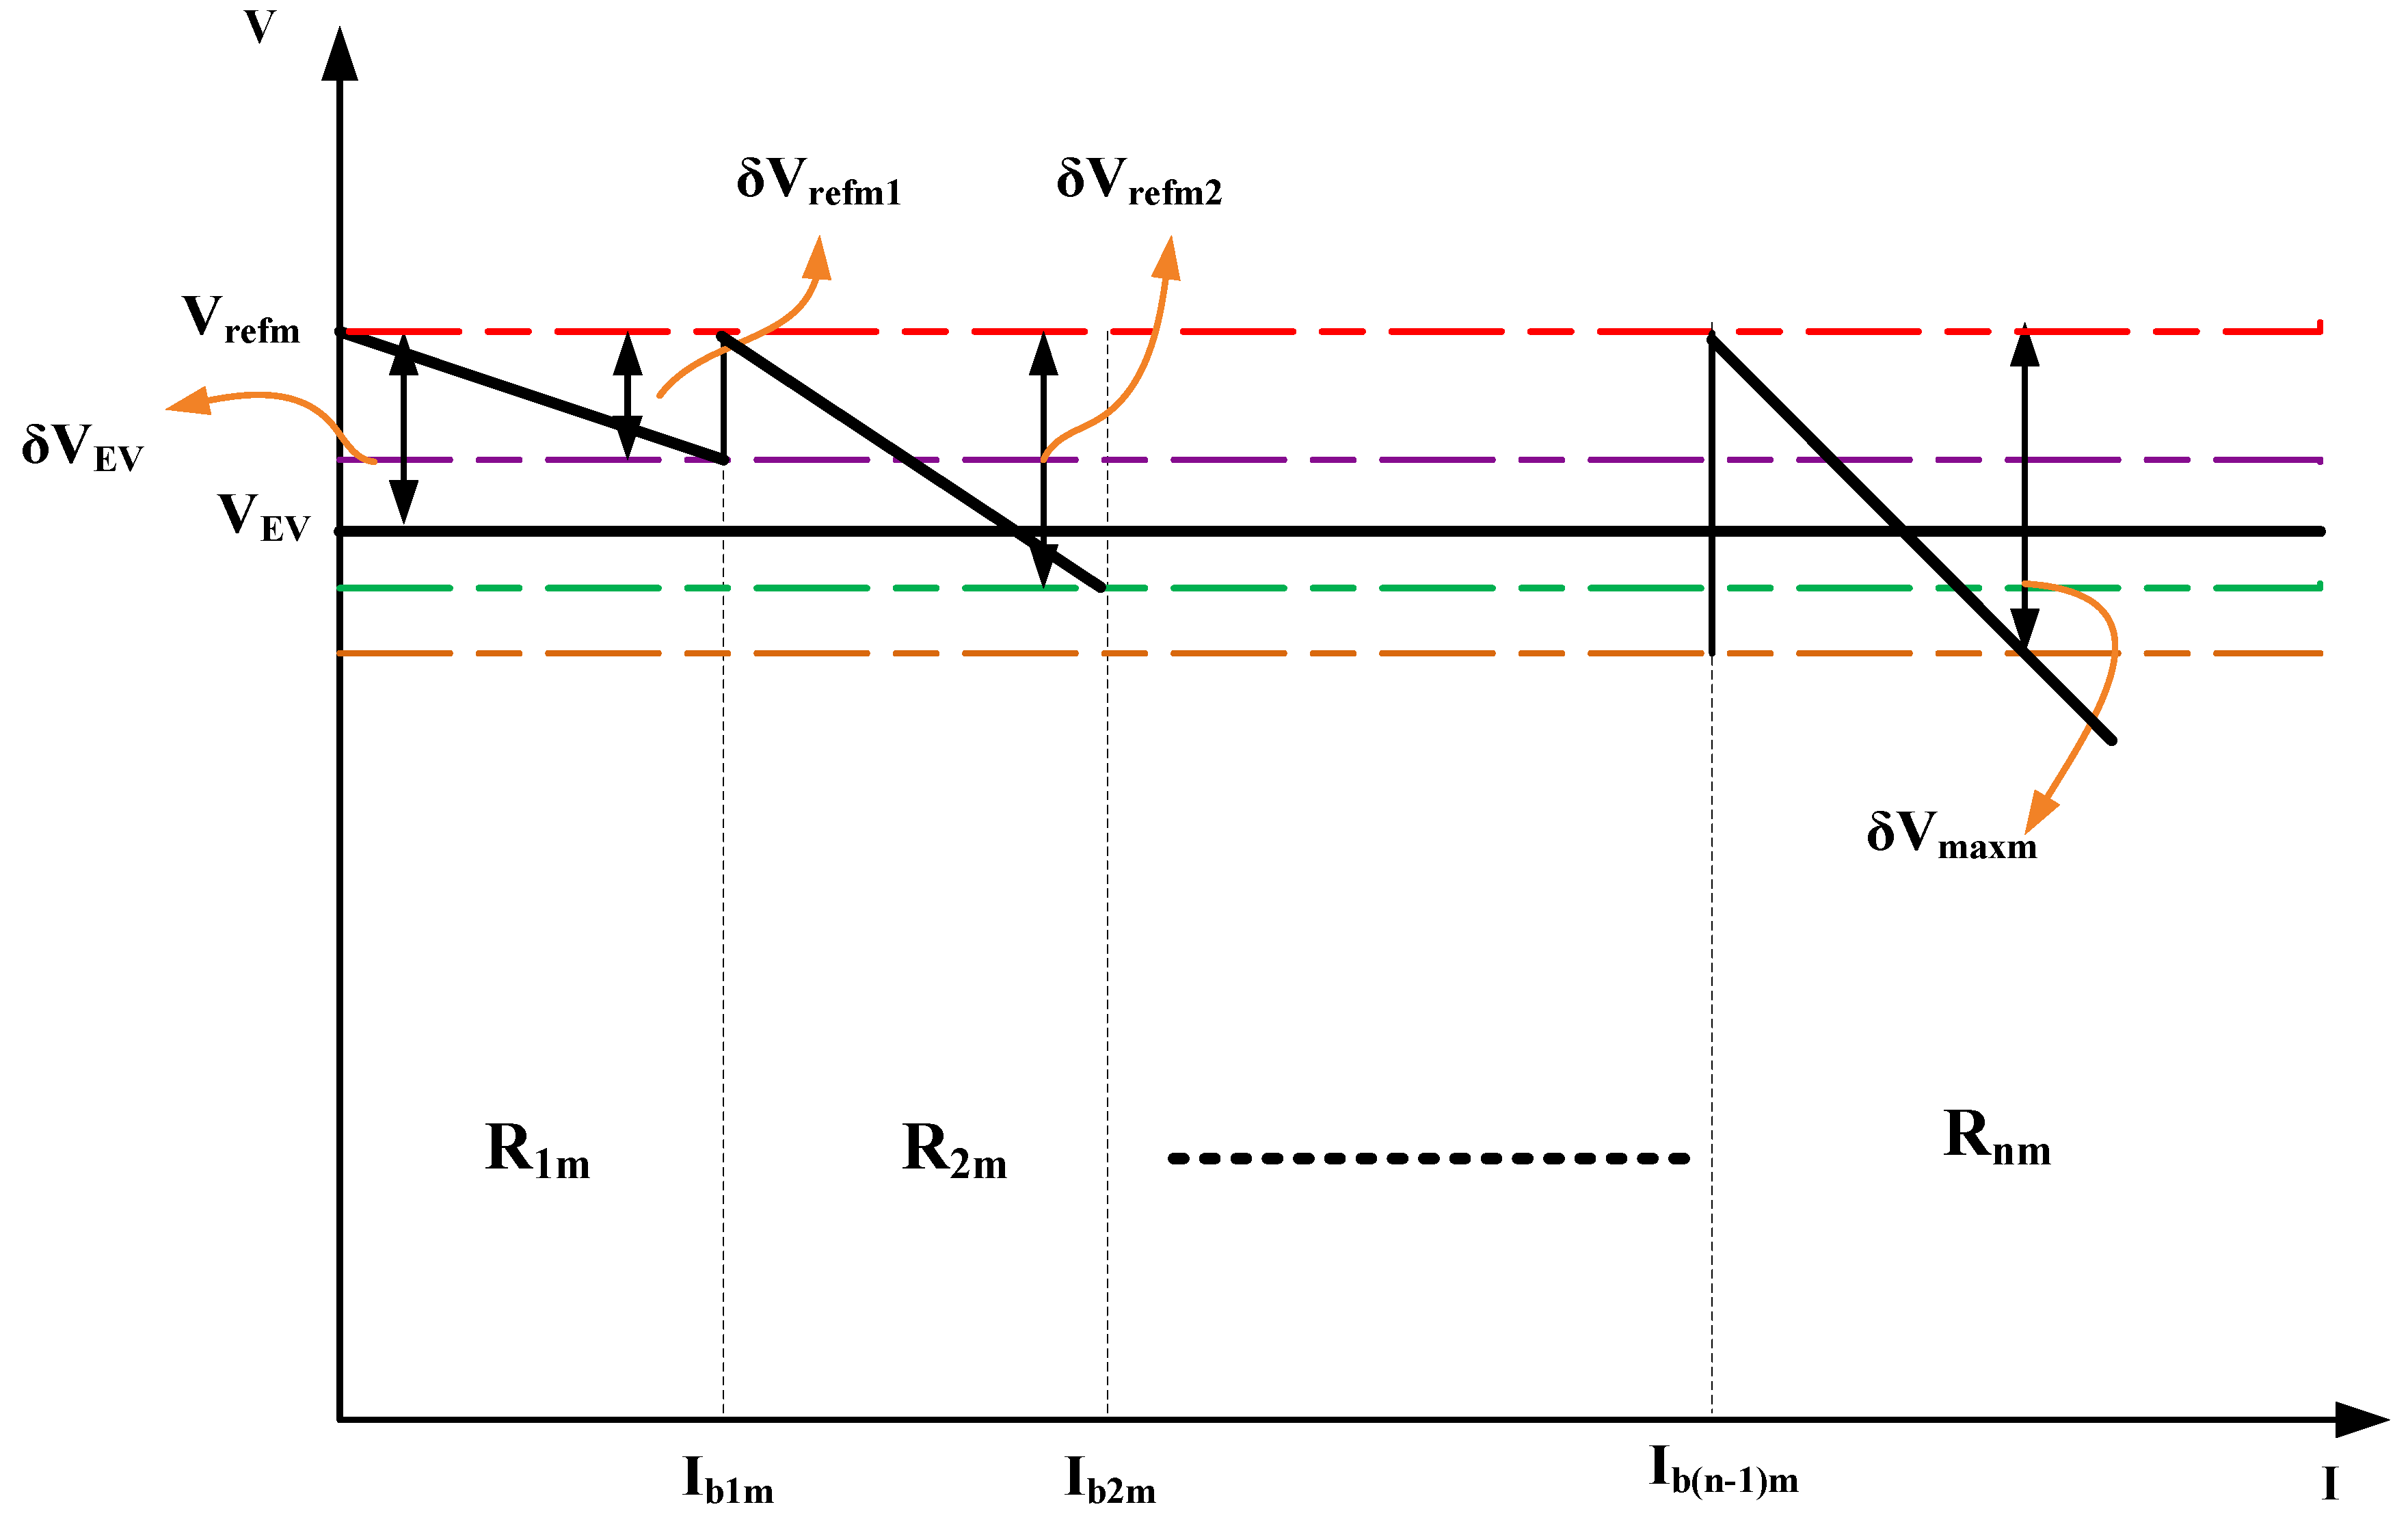
A droop curve is partitioned into several segments to configure the part of the curve in that segment such that the control parameters are flexible and varied to achieve better energy management with voltage regulation and proper source utilization simultaneously without any trade-off. The control parameters are the droop coefficient and the reference voltage in that particular segment. These are varied so that parallel sources are utilized properly to maintain a stable DC MG for highly intermittent EV charging load. A piece-wise droop curve is plotted in Figure 3, with (n − 1) boundary current values to divide the curve into n segments.
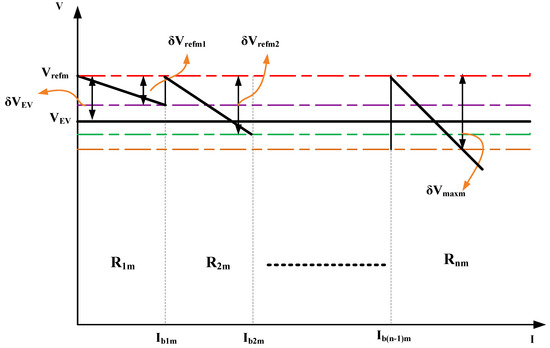
Figure 3.
Piece-wise droop curve with n regions for m-th converter.
The governing equations of this proposed piece-wise droop controller for n regions of the converter are as follows. For Region I, the load current falls under the light load condition. The droop control equation is given by Equation (12):
For Region II, the load current falls under the medium load category. The droop value needs to be steeper than the droop value of Region I. The droop equation of Region II from Figure 3 can be derived using the concept of a line equation, as follows:
In the above equation, the term is added to make the total droop constant larger than the Region I droop constant. But the increase in droop may result in a voltage dip. is added to compensate for the voltage deviation contributed by the adapted droop constant of Region II. By rearranging Equation (13) the droop equation of Region II is as follows:
Region III falls under the heavy load region, with maximum load on the DC MG. The droop value should be higher than the previous regions to mitigate the trade-off between the voltage regulation and power sharing.
The term makes the droop curve steeper than the previous regions and compensates for the voltage deviation contributed by the additional droop value. By rearranging Equation (15), the piece-wise droop value for Region III is given as follows:
For a DC MG with m parallel converters controlled by PDC with n regions, the generalized equation for the region with boundary currents of and is given by Equation (17), as follows:
3.2. Adaptive Piece-Wise Droop Calculation
The total load current of the DC MG is as follows:
For m converters sharing equal load ideally, the load on each converter is given as follows:
Substitute Equation (19) in Equation (17) and solve for the bus voltage, as follows:
The voltage difference () is defined as follows:
Substitute Equation (22) in the above equation:
The voltage deviation for the design of the PDC strategy is , which is the maximum allowable voltage deviation. Substitute in Equation (25) to solve for :
After solving the above equation, is given as follows:
The denominator of Equation (28) needs to be finite. An infinite denominator leads to a steep piece-wise droop curve, which affects the system’s stability. A factor of 2 is multiplied in the denominator of Equation (28) to make sure the denominator is not too small, causing a steeper droop curve. Also, at boundary currents, there exists a voltage drop due to both converters. It is ideal to inculcate this voltage drop at the boundary condition to maintain precise voltage regulation and power sharing.
The voltage drop () at the boundary condition due to the two converter currents is given as follows:
By adding the stability condition and voltage drop, the final value of is given as follows:
The voltage drop due to the droop value in n region for converter is given as follows:
For the region, the average current () is given as follows:
As the piece-wise droop curve gets steeper, the voltage drop increases. To compensate for this, an index of n is multiplied in Equation (31). Substituting Equation (32) in Equation (31) and adding the compensation factor gives the overall change in reference voltage that needs to be compensated in each region.
The piece-wise droop curve with n regions is divided equally. Hence, the current width () of all the regions is identical, which is represented by Equation (34):
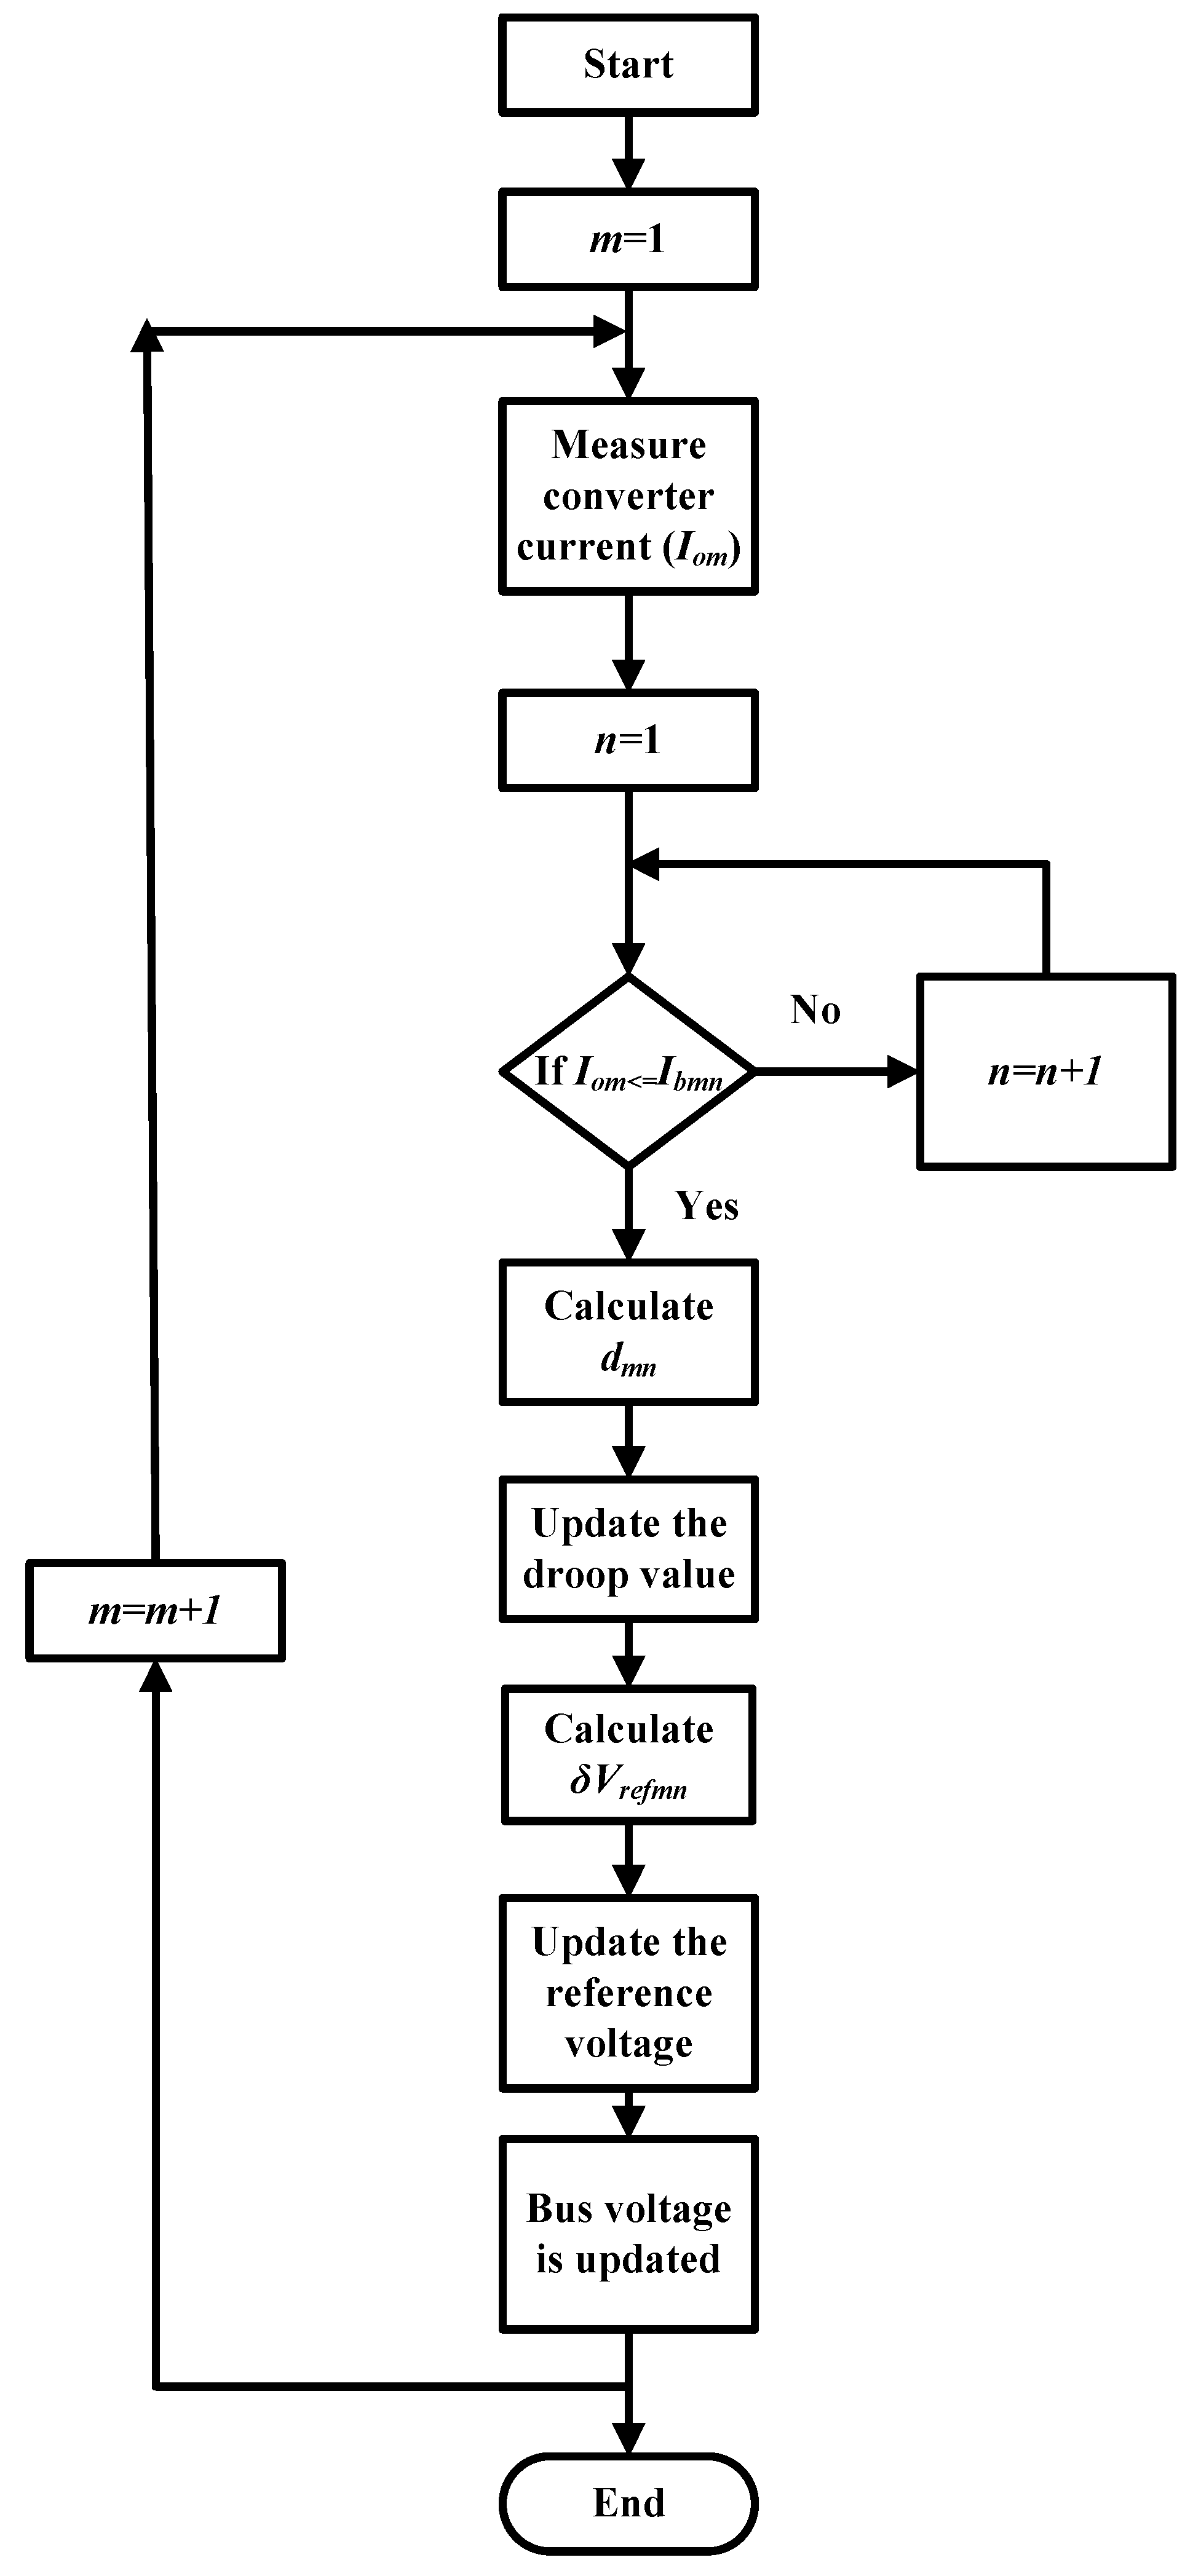
Figure 4 explains the proposed PDC with n segments for m parallel sources of a DC MG for EV charging applications. The converter current is measured and compared with the first boundary current value of the piece-wise droop curve. The droop constant and reference voltage values are updated based on the segment in which the load current falls. The bus voltage is finally updated using Equation (22) to improve voltage regulation and source utilization for dynamic EV charging load.

Figure 4.
Flowchart of piece-wise droop controller with n regions for m parallel sources for optimized energy management of DC MG.
3.3. Sensitivity Analysis
The two major possible disturbances in the DC MG are sensor noise and prediction error in EV load. To check the sensitivity and robustness of the proposed PDC to these disturbances, a state space model is developed.
The state space model of DER controlled with the proposed PDC can be defined as follows:
where is the state vector consisting of the bus voltage and inductor current of DER, and is the output vector consisting of the perturbation in bus voltage. is the perturbation in the output current due to uncertainty in EV load prediction. is the noise due to the measurement in the voltage sensor. are the state-space matrices of the system. The Laplace domain state equations are as follows:
Rearranging Equation (37) and substituting in Equation (38) gives the following:
From the above equation, the sensitivity transfer function for the EV load prediction noise is given as follows:
The sensitivity transfer function for the measurement noise is given as follows:
The small signal model of the converter based on the droop control equation in Equation (12) is derived as follows:
Substituting in Equation (43) gives the following:
Here,
The sensitivity function relative to EV load prediction error and measurement noise are as follows:
and
By further solving, these equations are reduced as follows:
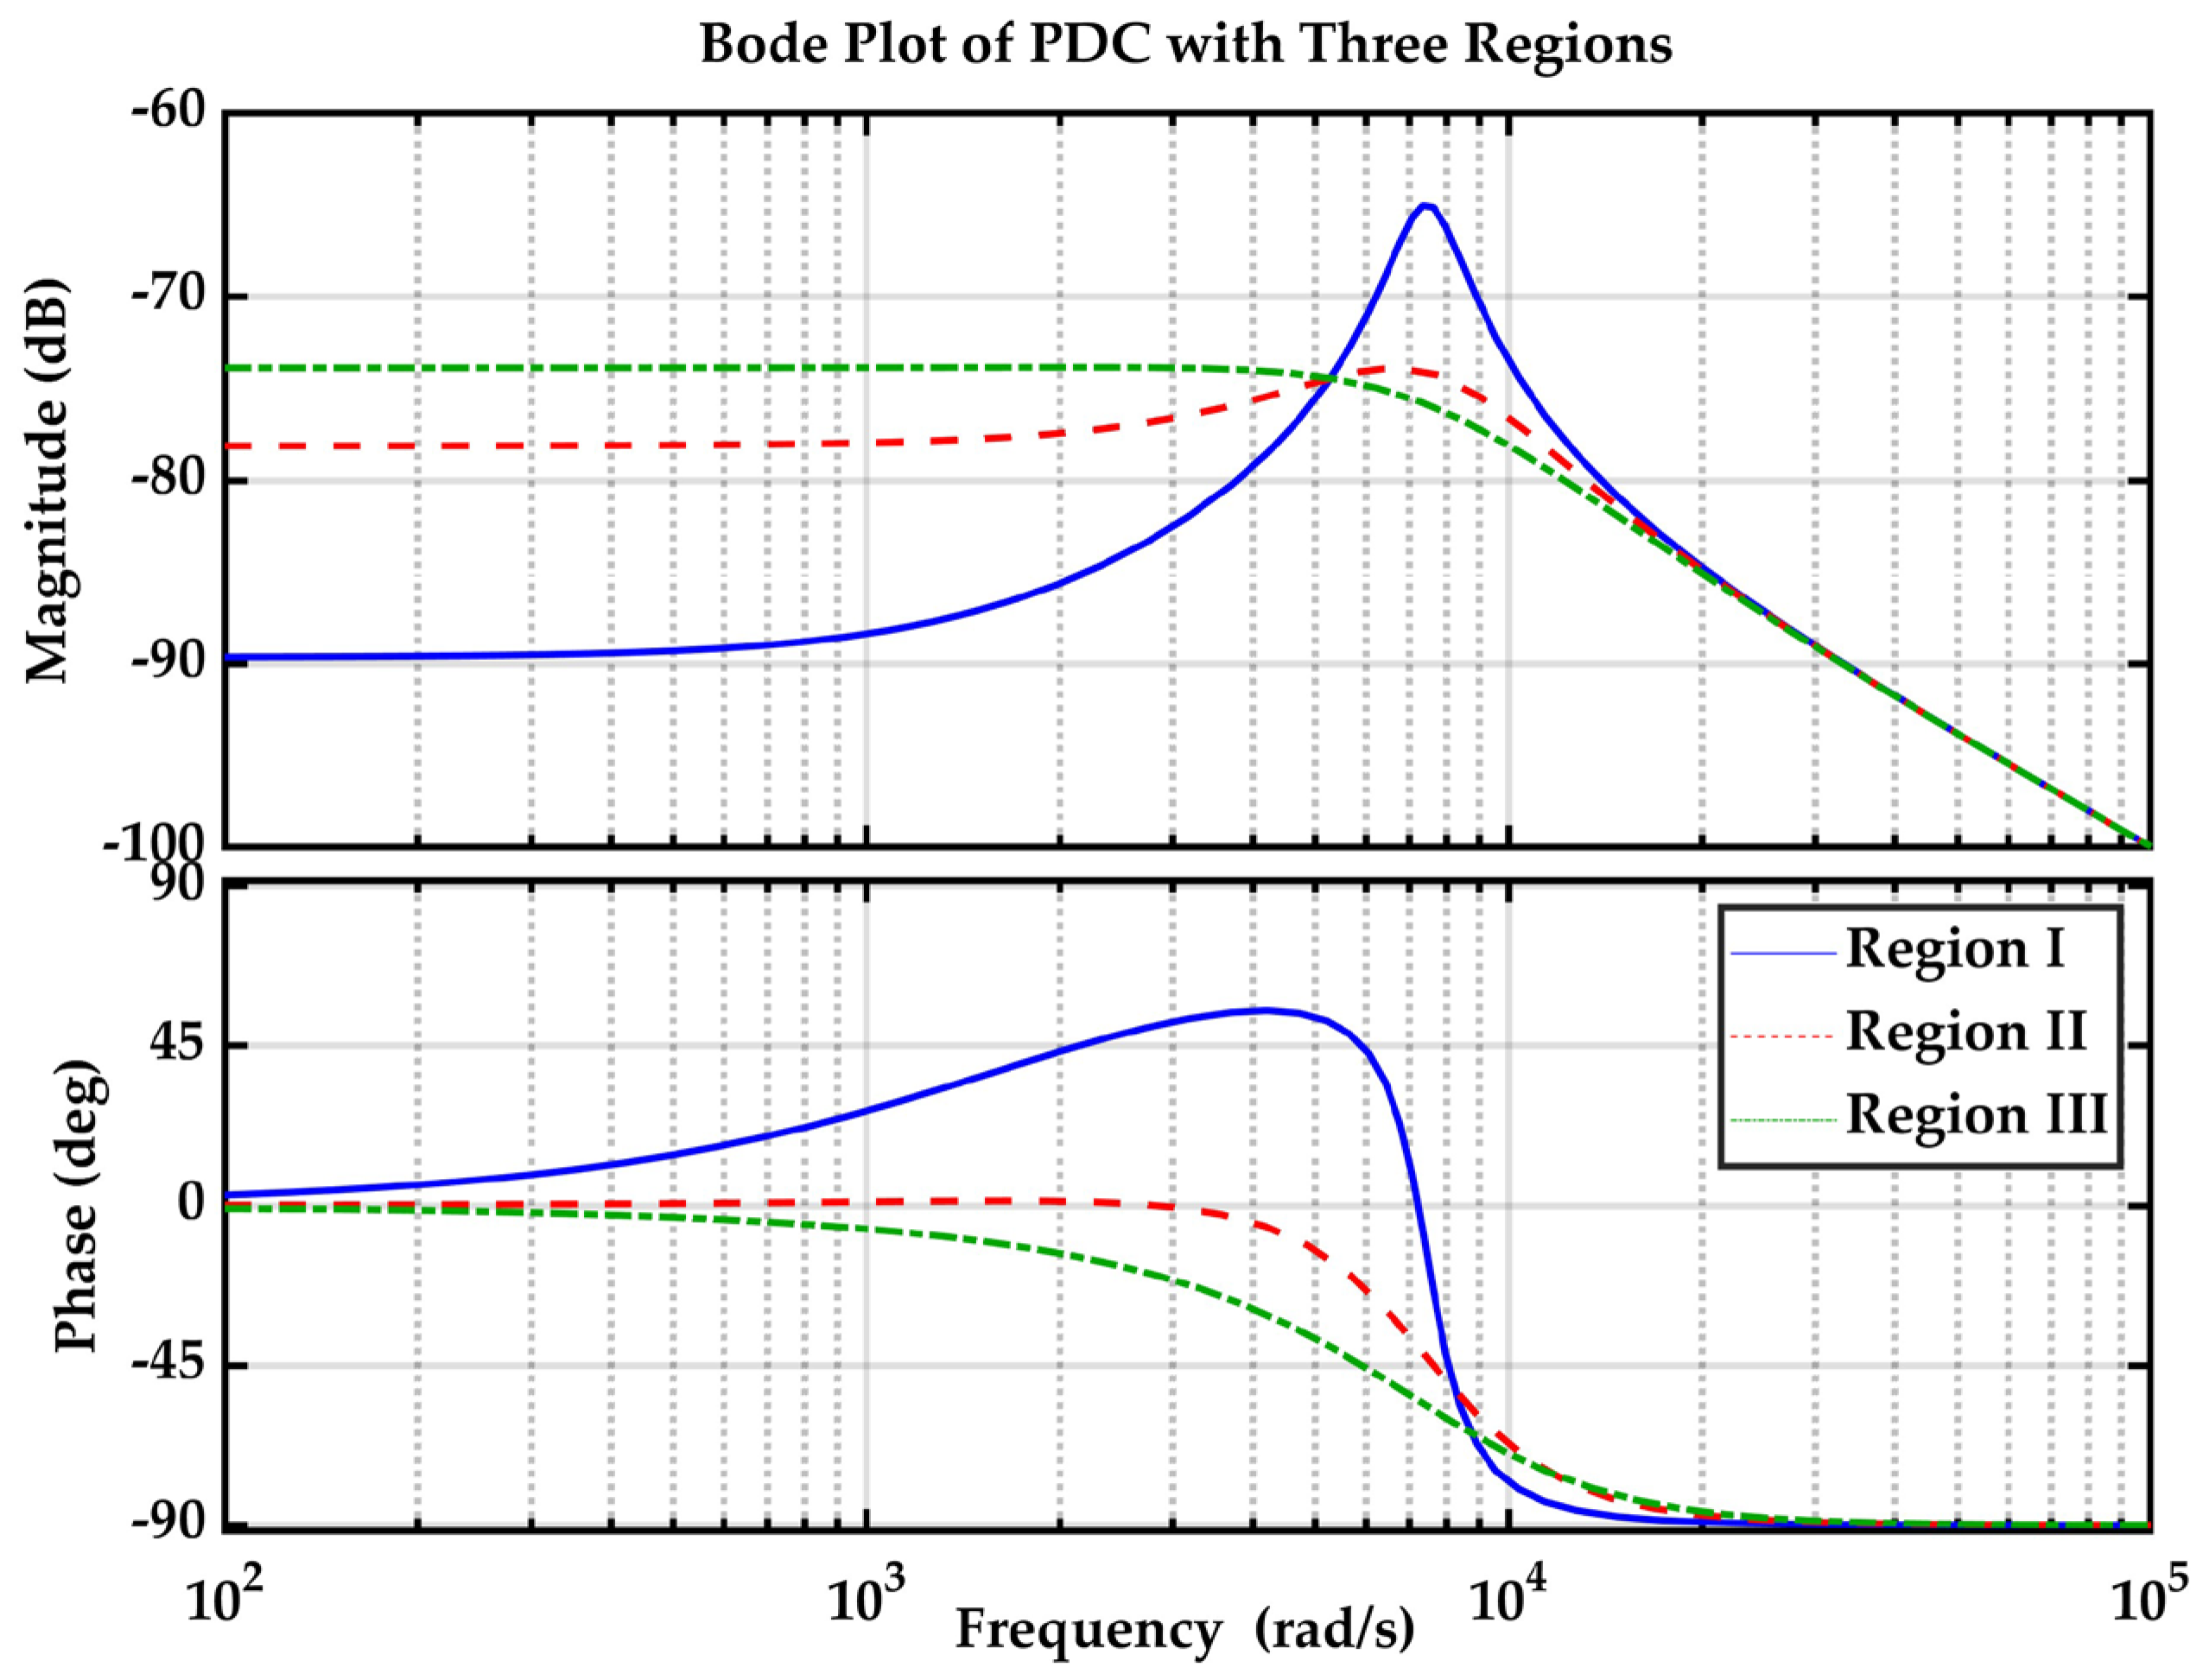
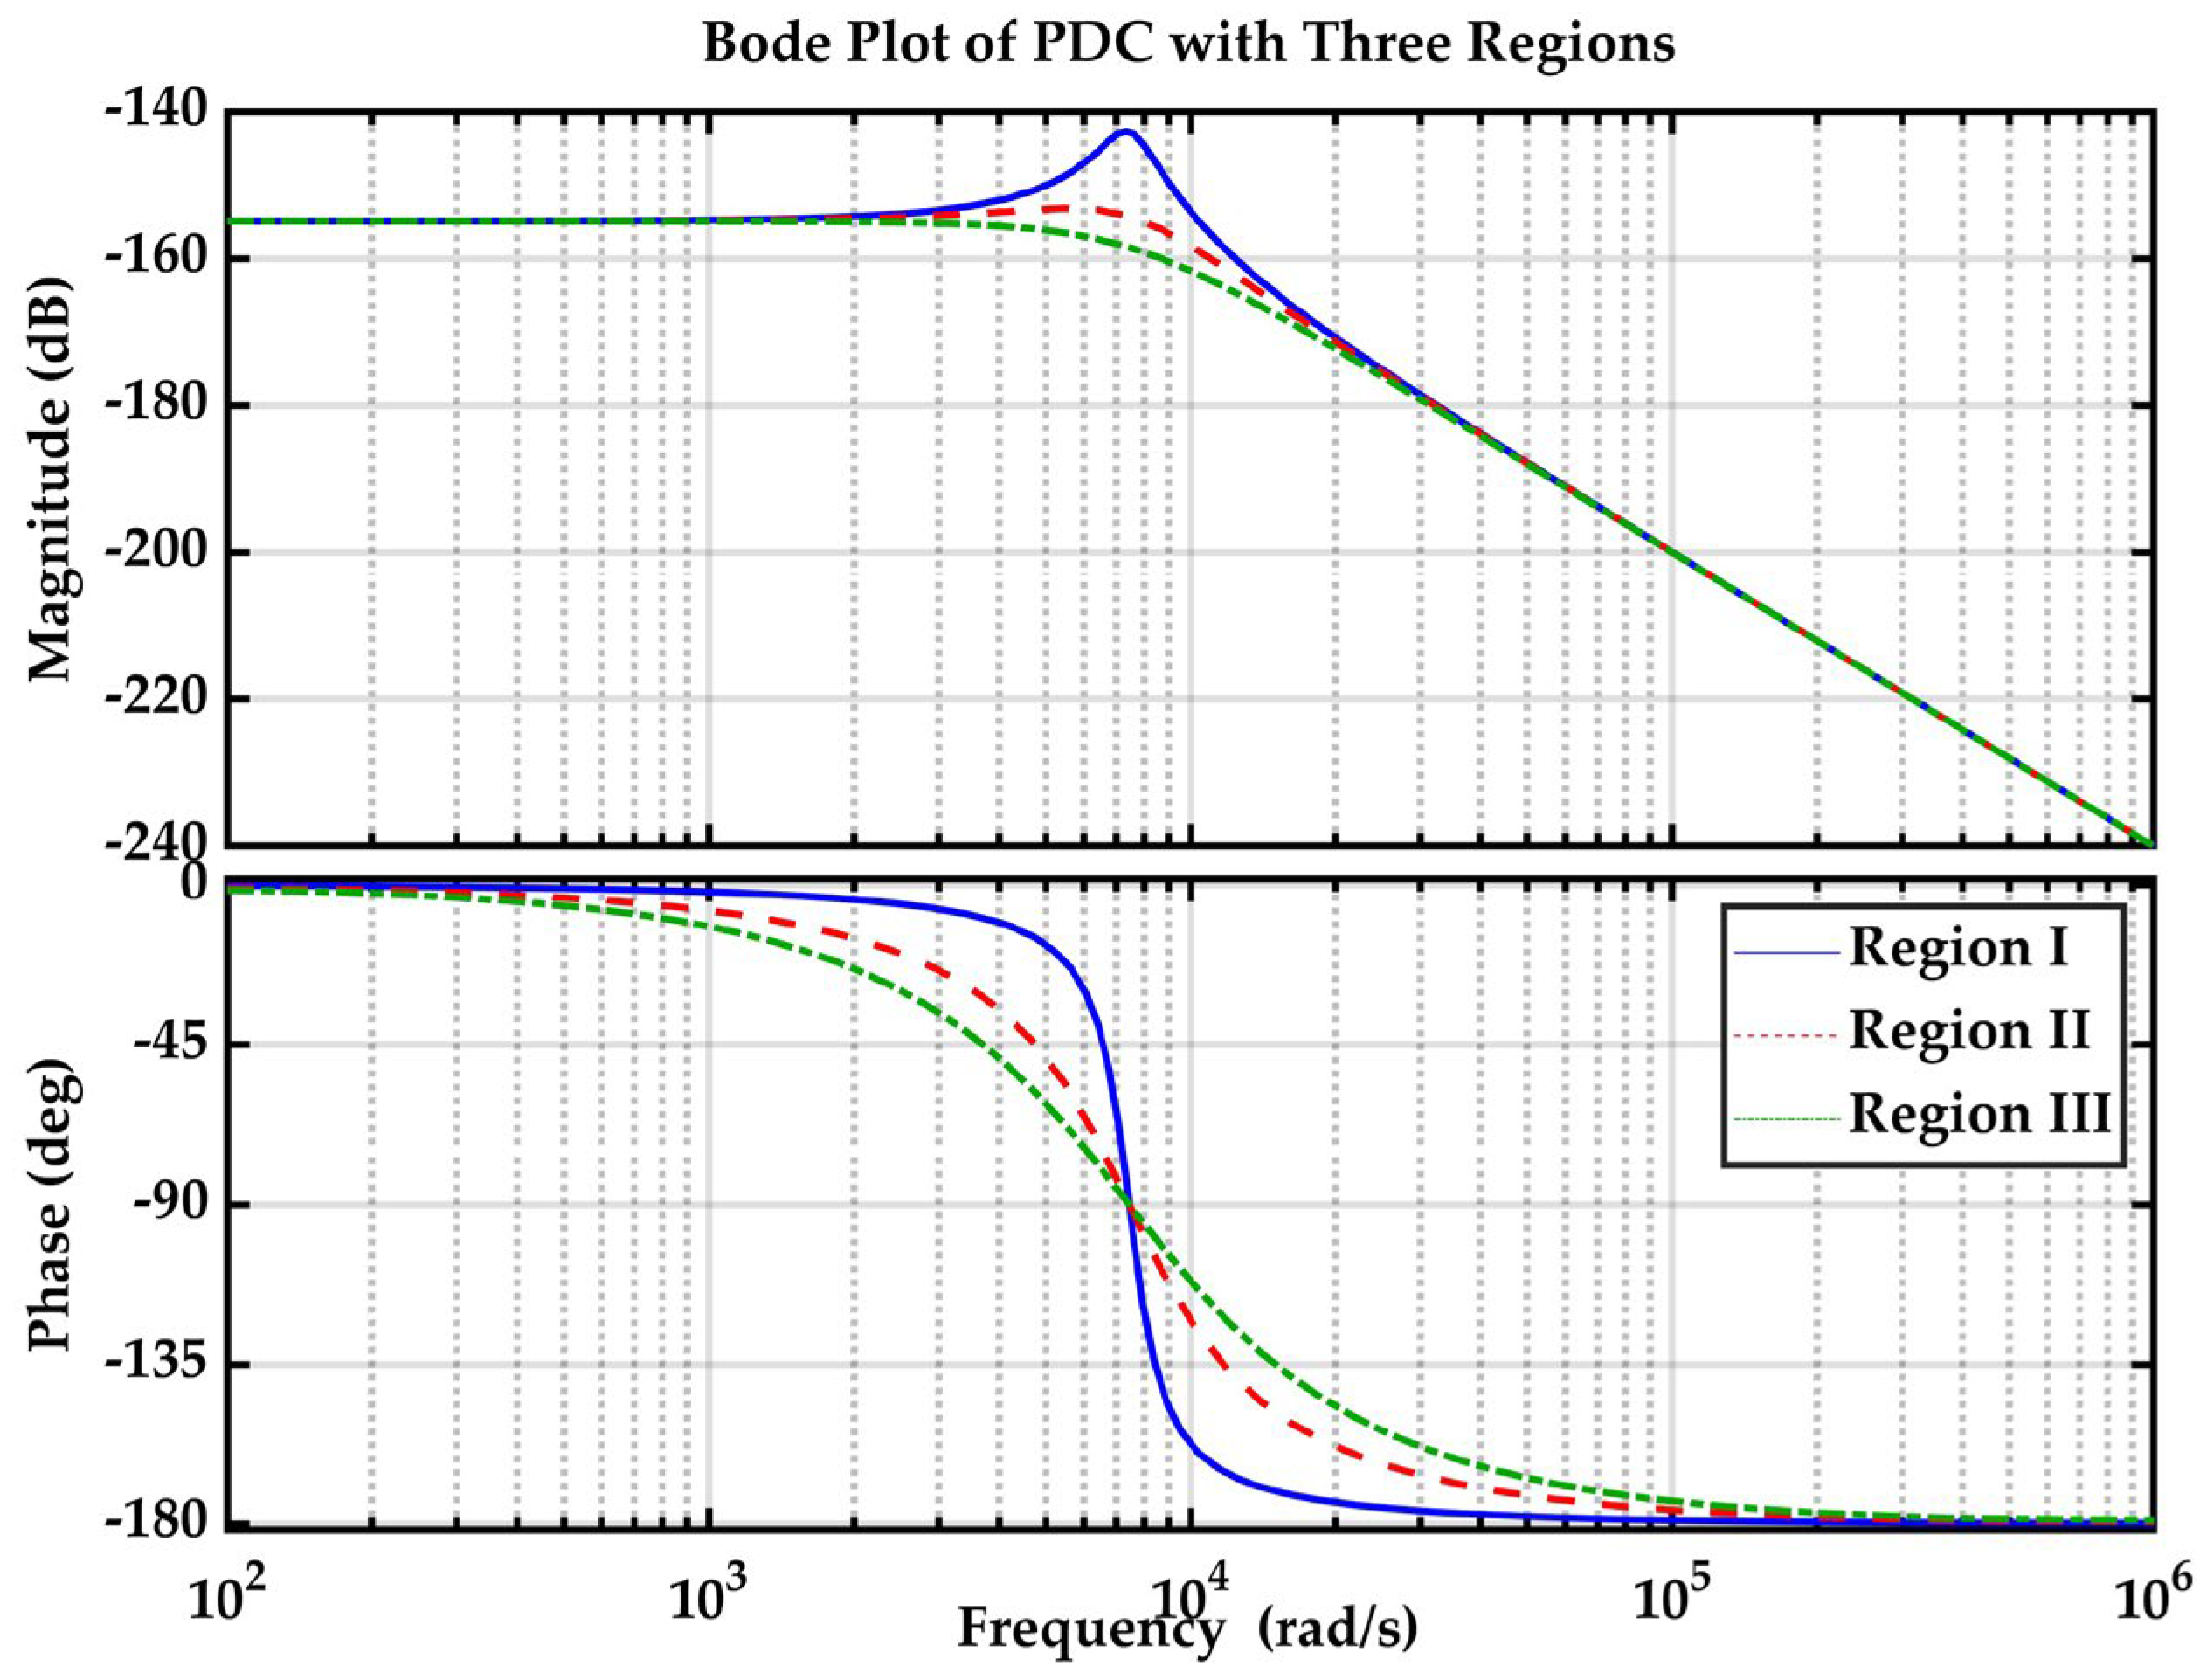
The Bode plot for Equation (50) is shown in Figure 5 and Equation (51) in Figure 6 for all three regions of the PDC strategy.
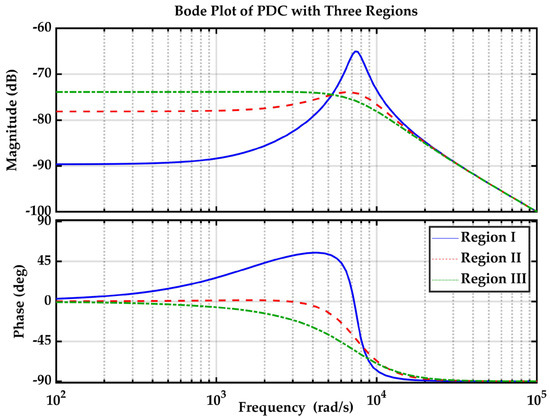
Figure 5.
Bode plot of proposed PDC strategy for EV load prediction error.
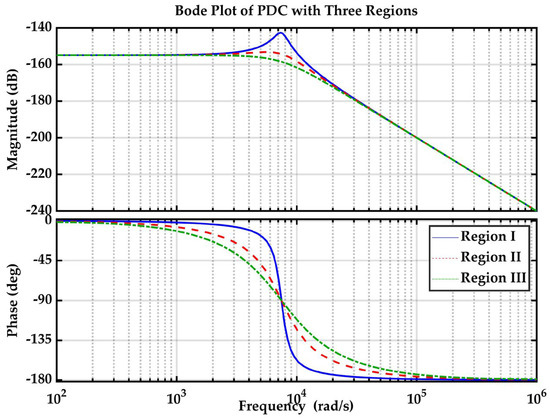
Figure 6.
Bode plot of proposed PDC strategy for Measurement noise.
The gain margin is infinite in all the regions, indicating the stability of the system. The phase margin of all the regions is within the desired limits, making it robust to EV load prediction errors and measurement noise.
4. System Performance Analysis for Dynamic Step-Wise EV Load
Figure 7 consists of two solar PVs in parallel connected to the DC bus through boost converters to supply a common EV load at 48 V. The converter gate pulses are generated with the proposed piece-wise droop controller with three regions [26]. The Simulink figure of the proposed DC MG with two parallel converters is shown in Figure A1 in Appendix A.

Figure 7.
DC microgrid integrated with solar PVs in parallel for EV charging applications.
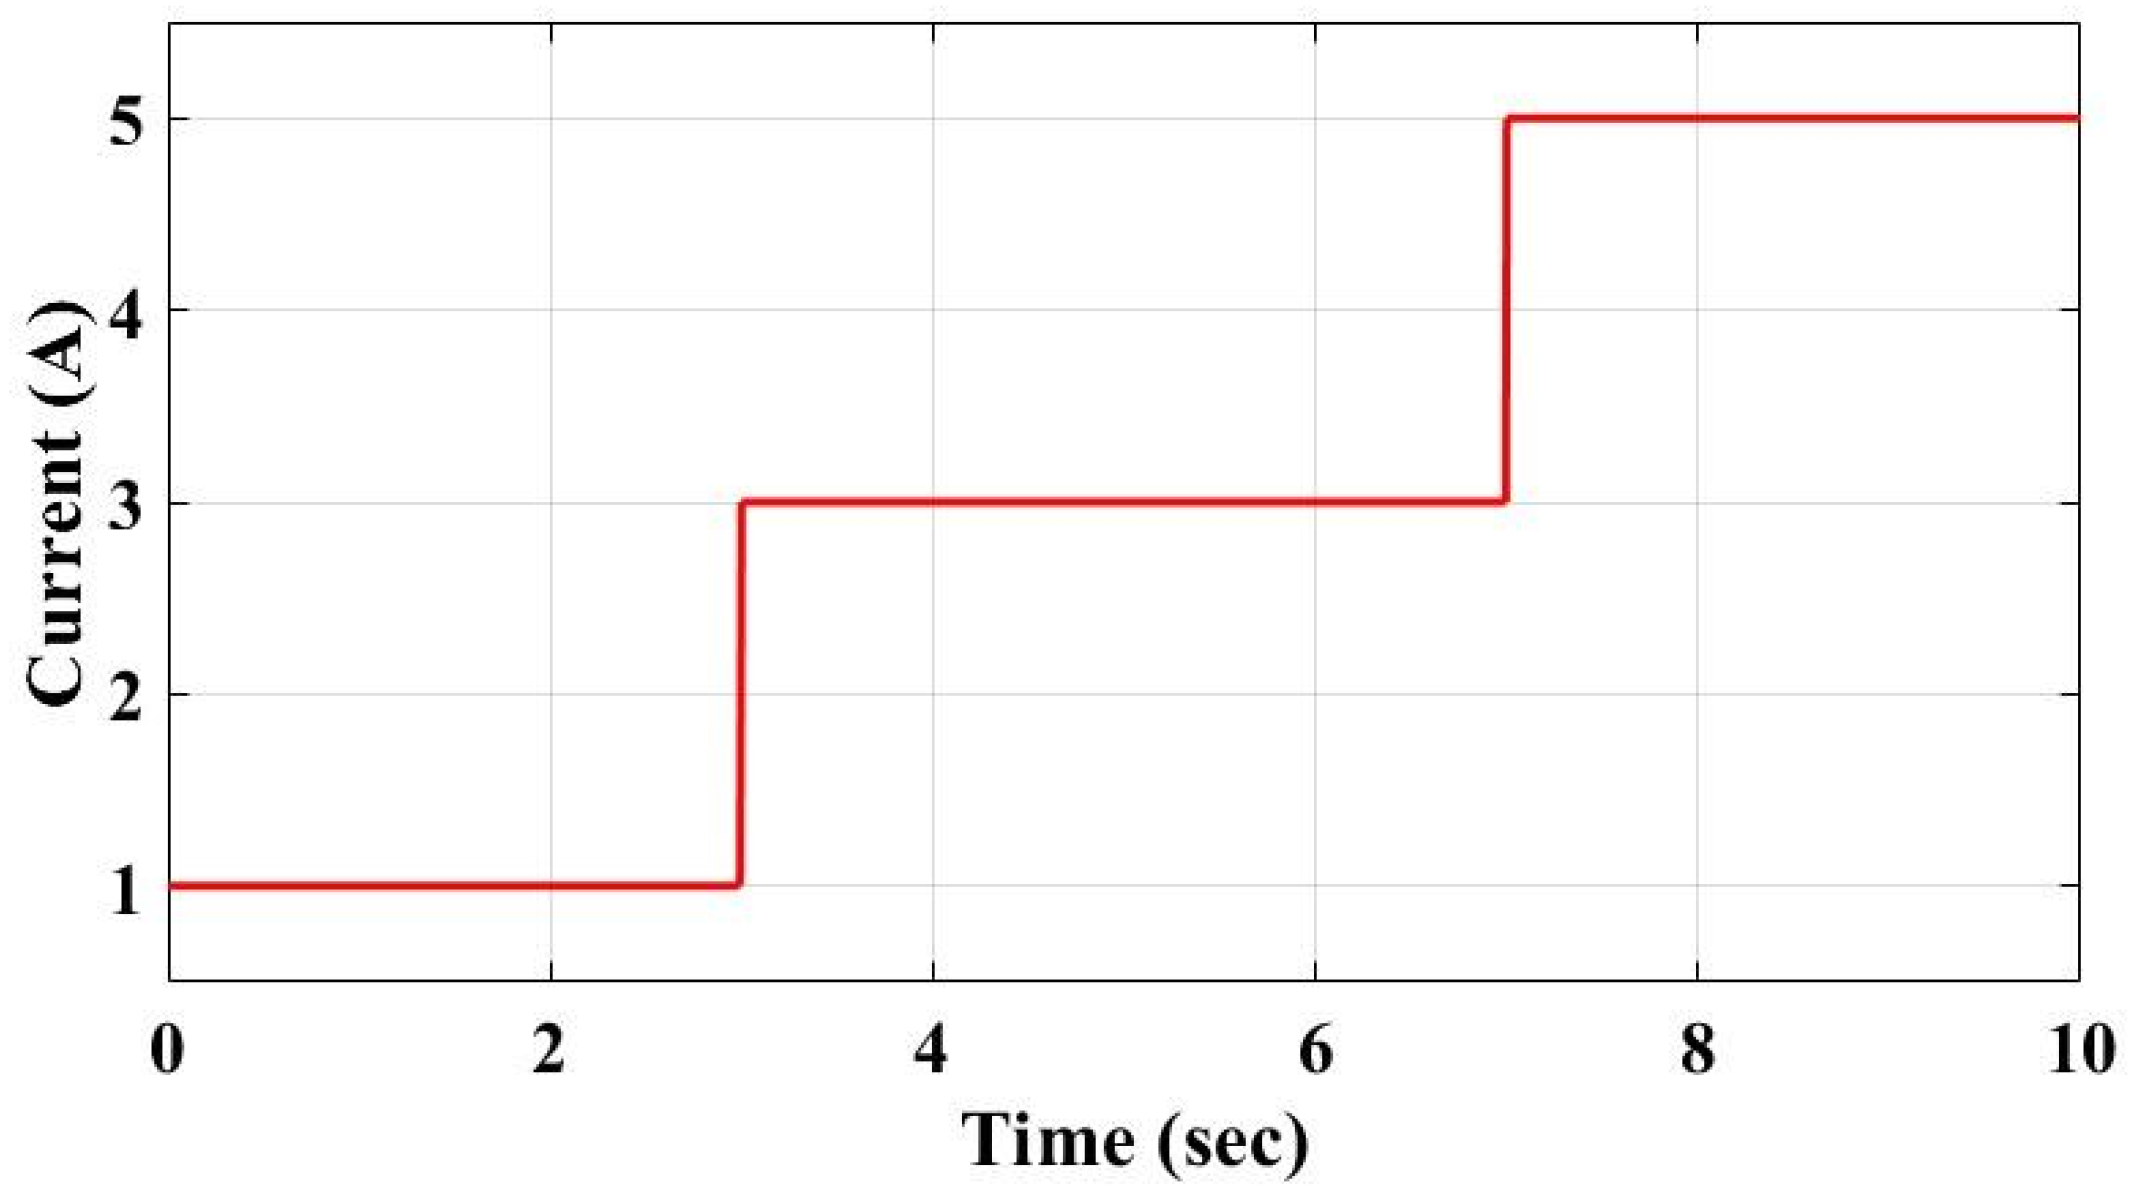
The effectiveness of the proposed controller is inspected with dynamically changing step-wise EV load and the same is compared with LDC and NLDC. The droop value () for the control loop of two sources is generated by the proposed PDC strategy and fed to piece-wise droop control loop. The error signal generated will be passed through a PI controller with proportional gain constants (, ) and integral gain constants (, ). The output of the PI controller is further passed to a PWM generator to generate pulses for their respective converters to obtain the desired output performance. The system parameters and the control parameters are listed in Appendix A, Table A1. The line resistances of the DC microgrid are taken in different ratios such as 1:2, 1:5, and 1:10 to demonstrate the effect of line resistance and the efficacy of the proposed controller in mitigating its effect on microgrid performance. To showcase the practicality for larger microgrids, the DC MG is integrated with four DERs with a line resistance ratio of 1:5:10:15 to improve the scalability and its performance is studied. The various ratios of the cable resistances are accounted for in the remote, small off-grid DC microgrid, in which sources can be far away from the charging station. From t = 0–3 s, the total demand for EV load is around 1 A, that is, 20% of the total load of the charging station of EV. From t = 3–7 s, the load demand is 3 A, which is 60% of the load demand, and from t = 7–10 s, the load demand is 5 A, which is the full load representing the dynamic EV load, with fluctuations over a small period indicating its intermittent nature, as shown in Figure 8. The bus voltage regulation and current sharing are the two parameters estimated to check the proper utilization of the parallel sources to supply the common load. The maximum allowable voltage variation () is 5% of the DC bus voltage (). The utilization factors of source-1 (), source-2 (), and voltage deviation () are calculated for all the cases and are listed in Table 2. The utilization factor and the voltage difference for the converter is defined by Equations (52) and (53), respectively.
where is the received output current and is the expected output current for the converter, respectively.
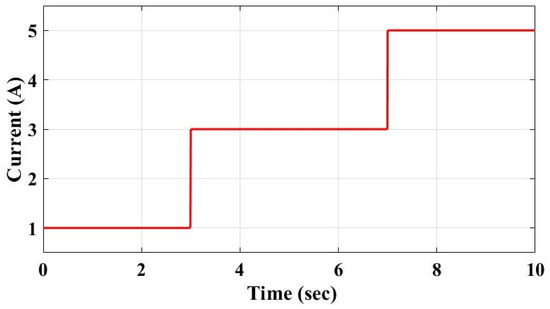
Figure 8.
EV charging load demand of DC MG.
Table 2.
Performance comparison of PDC with LDC and NLDC.
4.1. Case-i
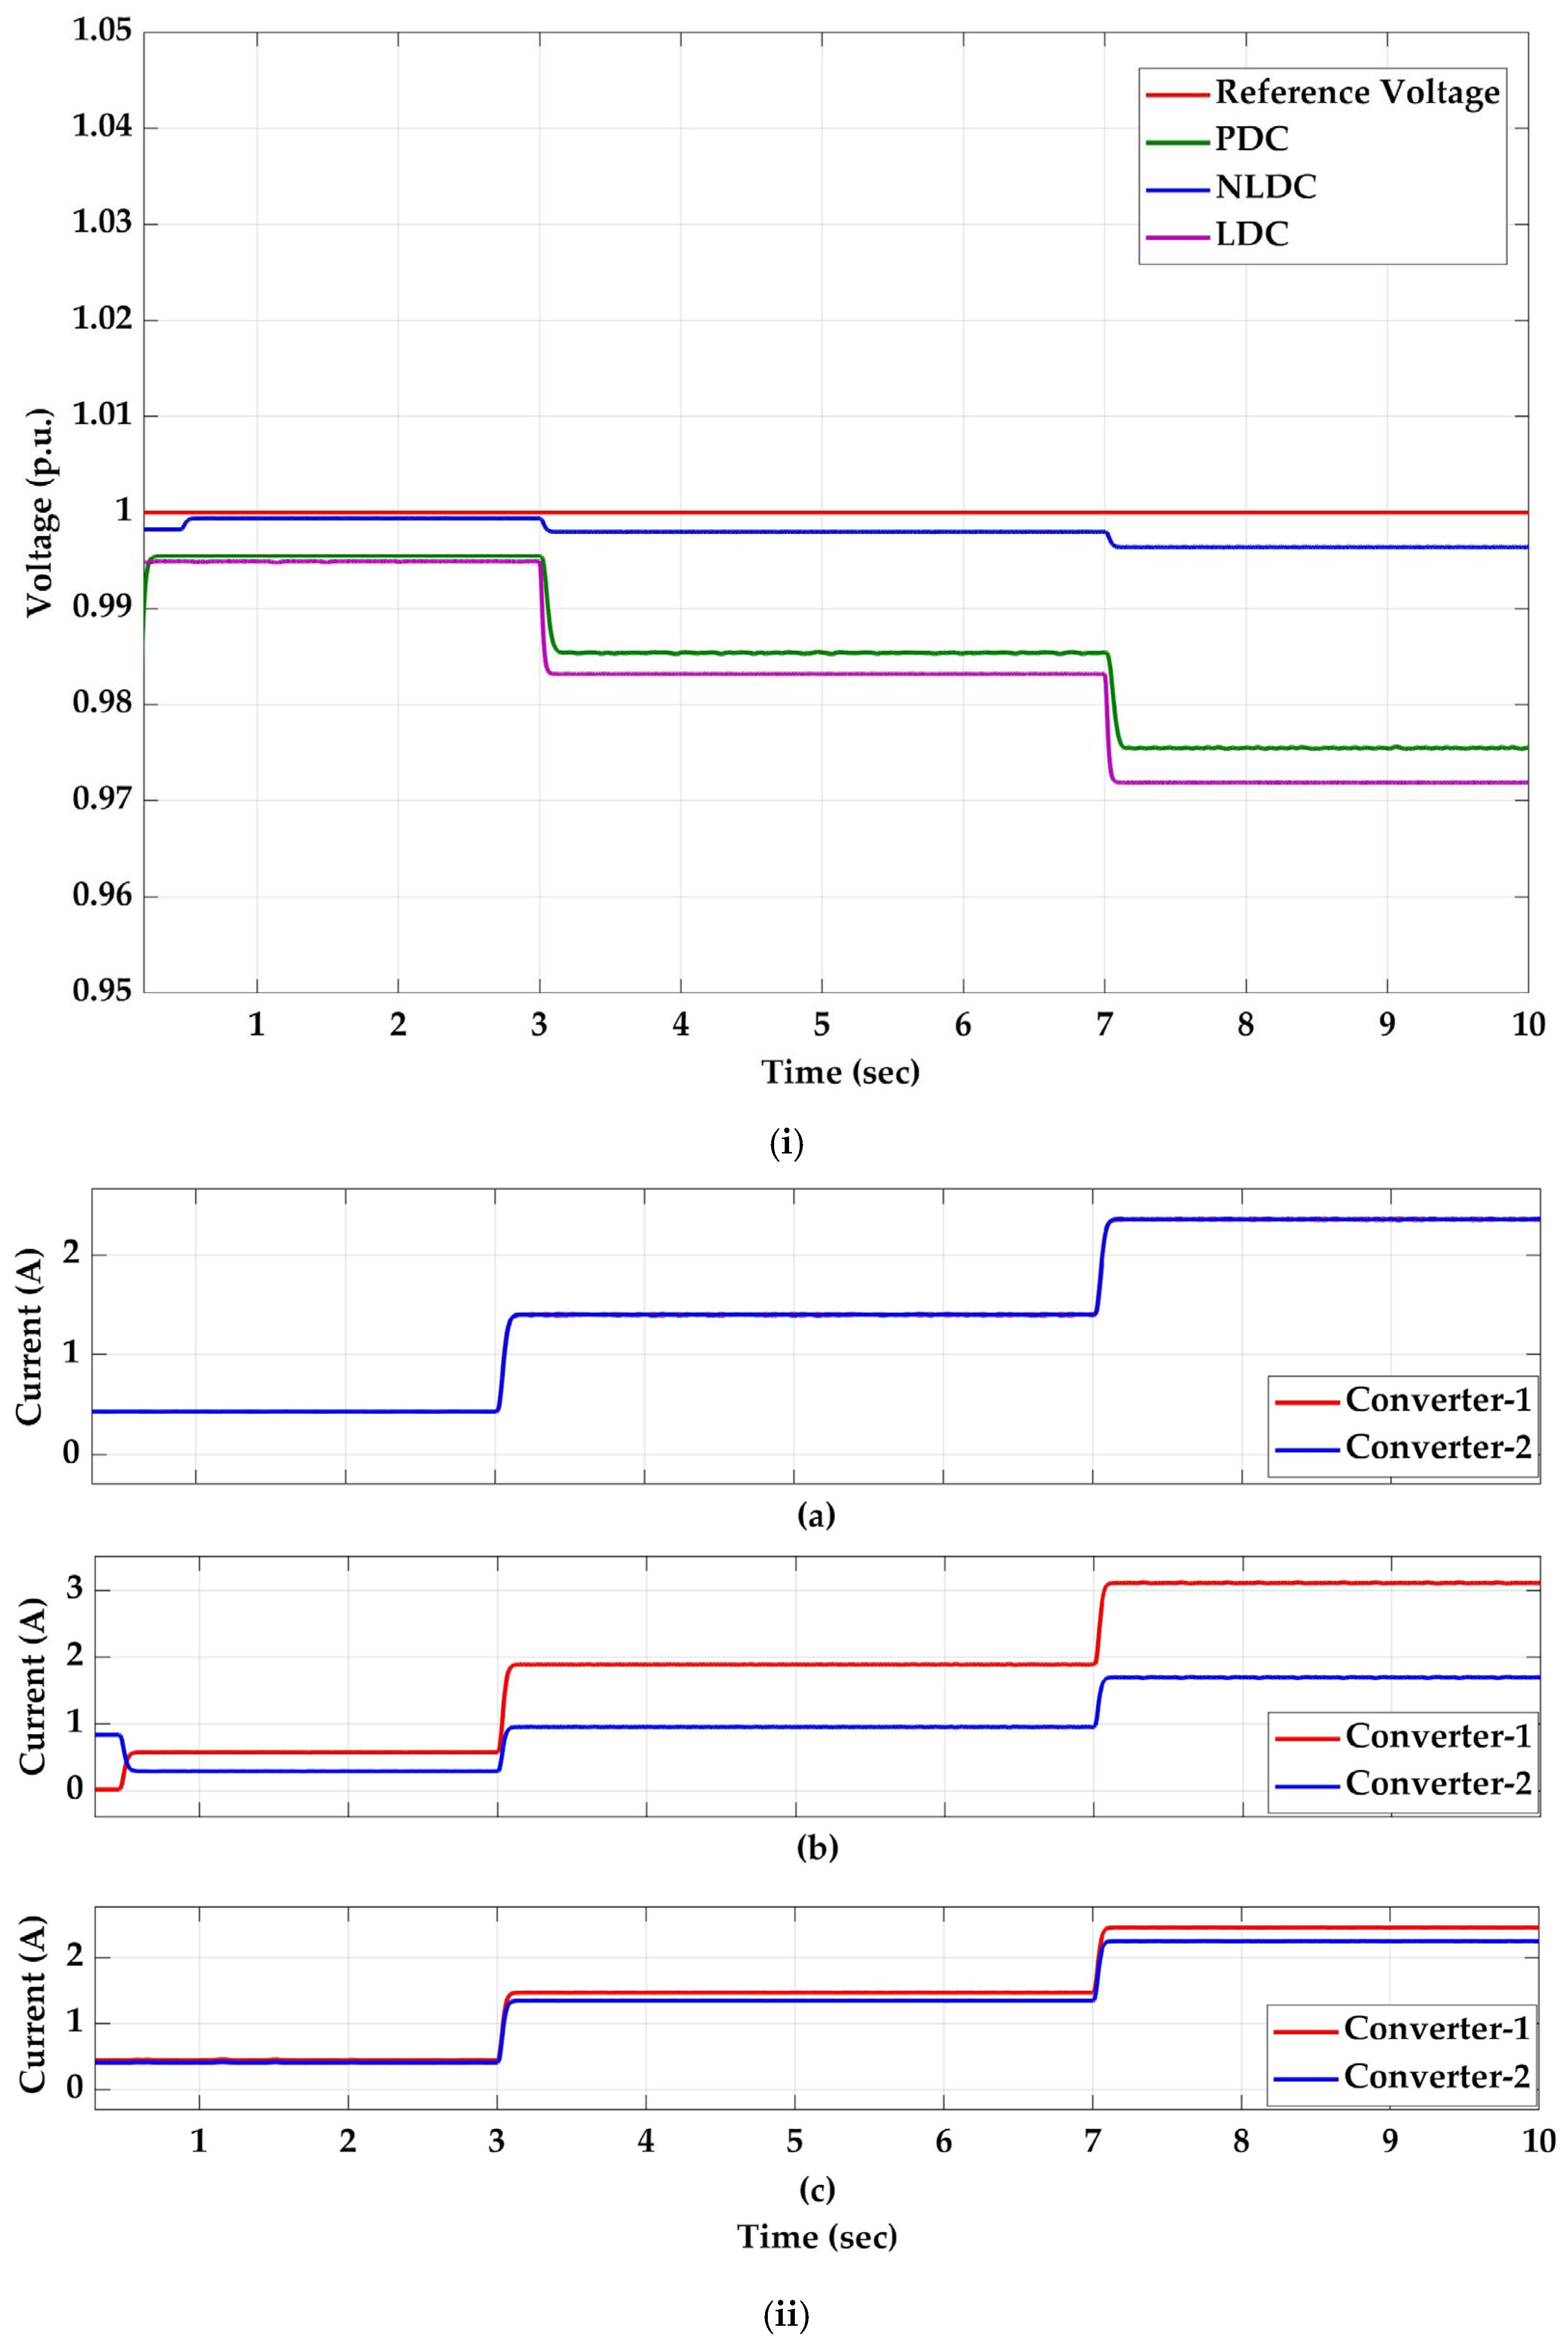
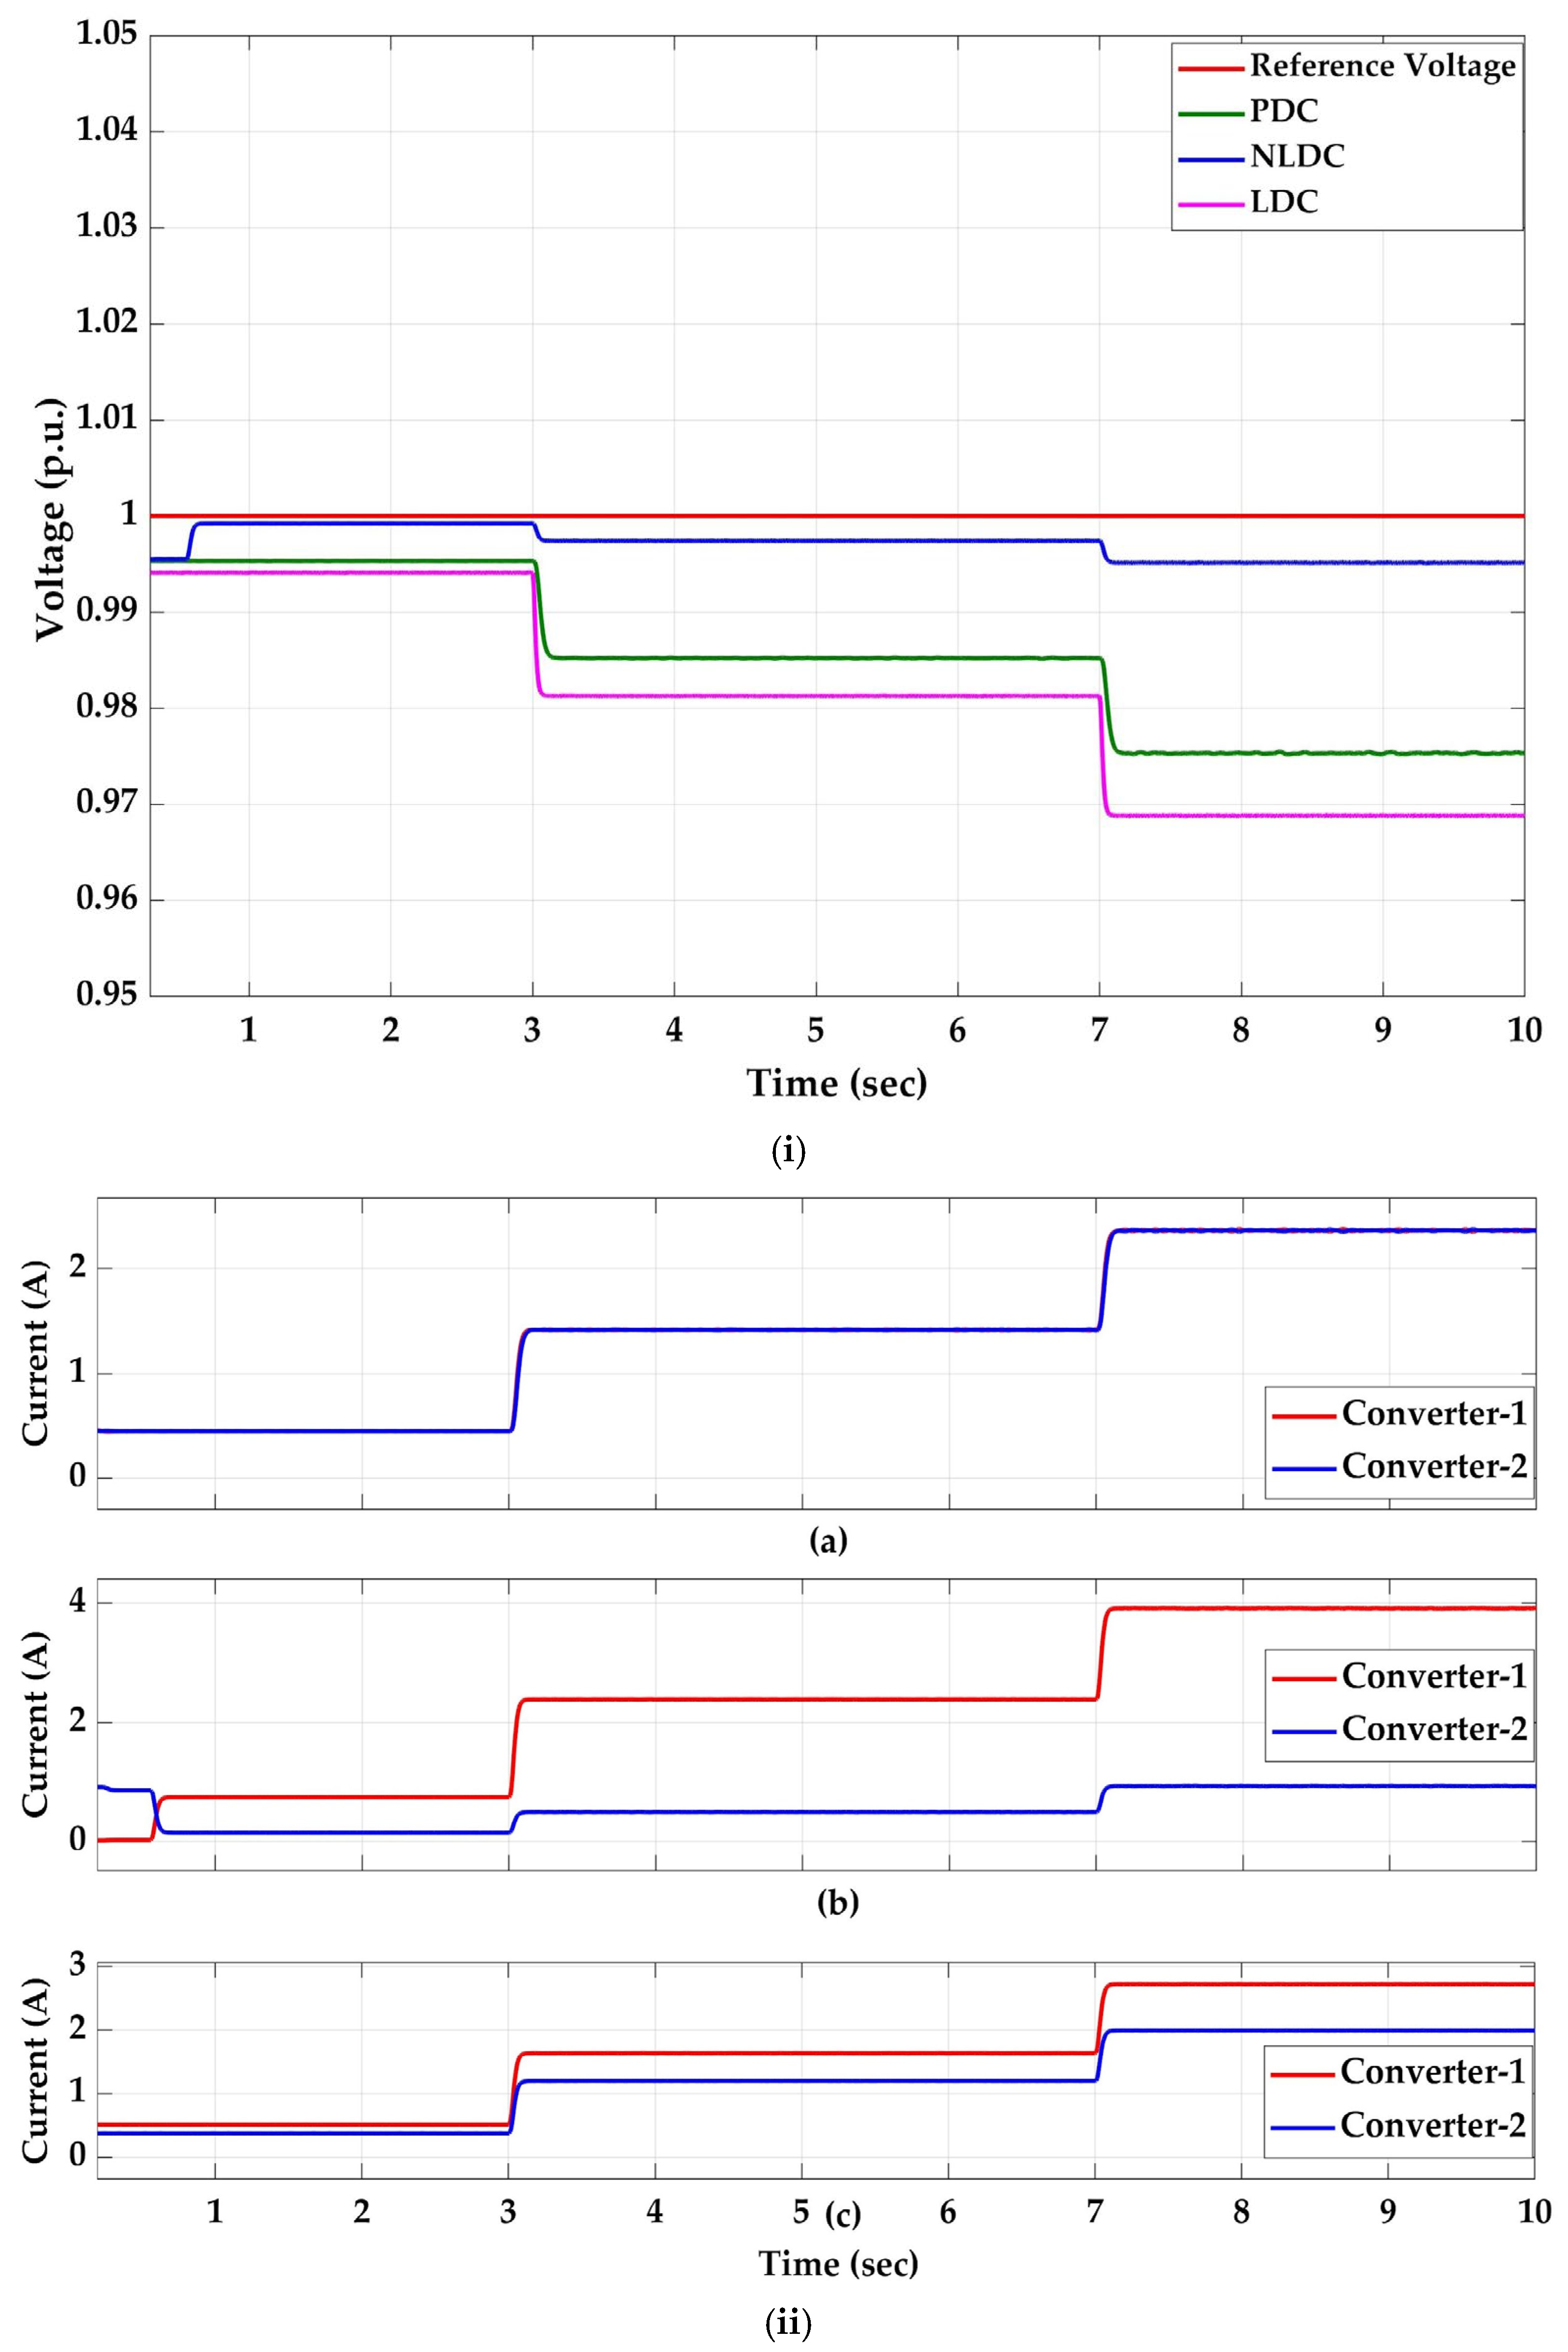
The line resistance of the converter integrated with solar pv-1 () is 0.05 Ω and for the converter integrated with solar pv-2 () is 0.1 Ω. In this case, the proposed DC microgrid model is studied with the line resistance ratio of 1:2. The DC-DC converters are controlled with the proposed three-segmented PDC with a voltage compensator. The current sharing and the DC bus voltage with the proposed controller are compared with LDC and NLDC.
The droop resistance () for LDC is considered 0.5 Ω. The p.u. bus voltage () obtained at 20% EV load is 0.9941 p.u. at t = 2 s, which is within the tolerable limit (Figure 9i). and are 0.5186 A and 0.4752 A, respectively, indicating a mismatch in sharing the common load, as shown in Figure 9ii(c). However, with the NLDC with , the p.u. is 0.9993 p.u., which is almost the rated p.u. bus voltage (Figure 9i), but the current sharing is highly improper, with and being 0.6670 A and 0.3334 A, respectively, as shown in Figure 9ii(b). The 20% load with load current () falls into of the piece-wise droop curve with the boundary current value () of 2 A. with the proposed controller is 0.9948 p.u., as shown in Figure 9i, which is in the tolerable range, and the currents and are 0.4342 A and 0.4343 A, respectively, indicating almost proper current sharing between the parallel sources (Figure 9ii(a)).
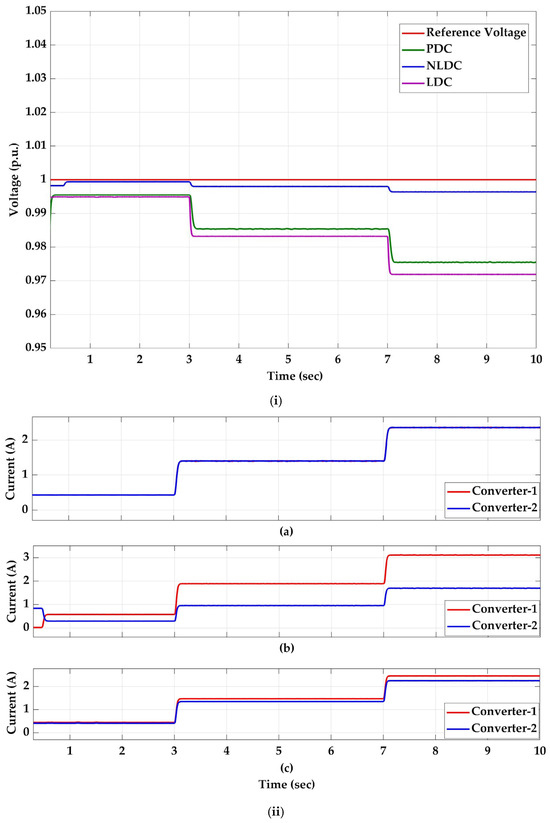
Figure 9.
Case-i: (i) p.u. bus voltage; (ii) Current sharing: (a) PDC, (b) NLDC, (c) LDC.
When the load is switched to 60%, the load current () is 3 A, which falls in of the piece-wise droop curve with and as 4 A for both the converters. The updated voltage reference with the voltage compensator for both the converters of is calculated as follows:
With the updated droop constant of 2.069 Ω and the reference voltage, the obtained is 0.9854 p.u. and at t = 5 s. Whereas with the LDC and NLDC, although the bus voltages are in a tolerable range, the current sharing difference is higher: 0.1370 A and 0.3300 A with LDC and NLDC, respectively.
For the full EV load from t = 7 s to t = 10 s, the total load current is 5 A, and it falls into region 3 () of the piece-wise droop curve. The change in the voltage reference value is calculated as follows.
, with the proposed controller, after updating the droop value to 3.375 Ω and the reference voltage, is 0.9756 p.u. at t = 8; with the LDC it is 0.9966 p.u. and with the NLDC it is 0.9712 p.u. Although the NLDC exhibits better voltage regulation than the other controllers, , which is very high when compared to the values of the PDC and LDC, which are 0.0010 A and 0.2100 A, respectively.
4.2. Case-ii
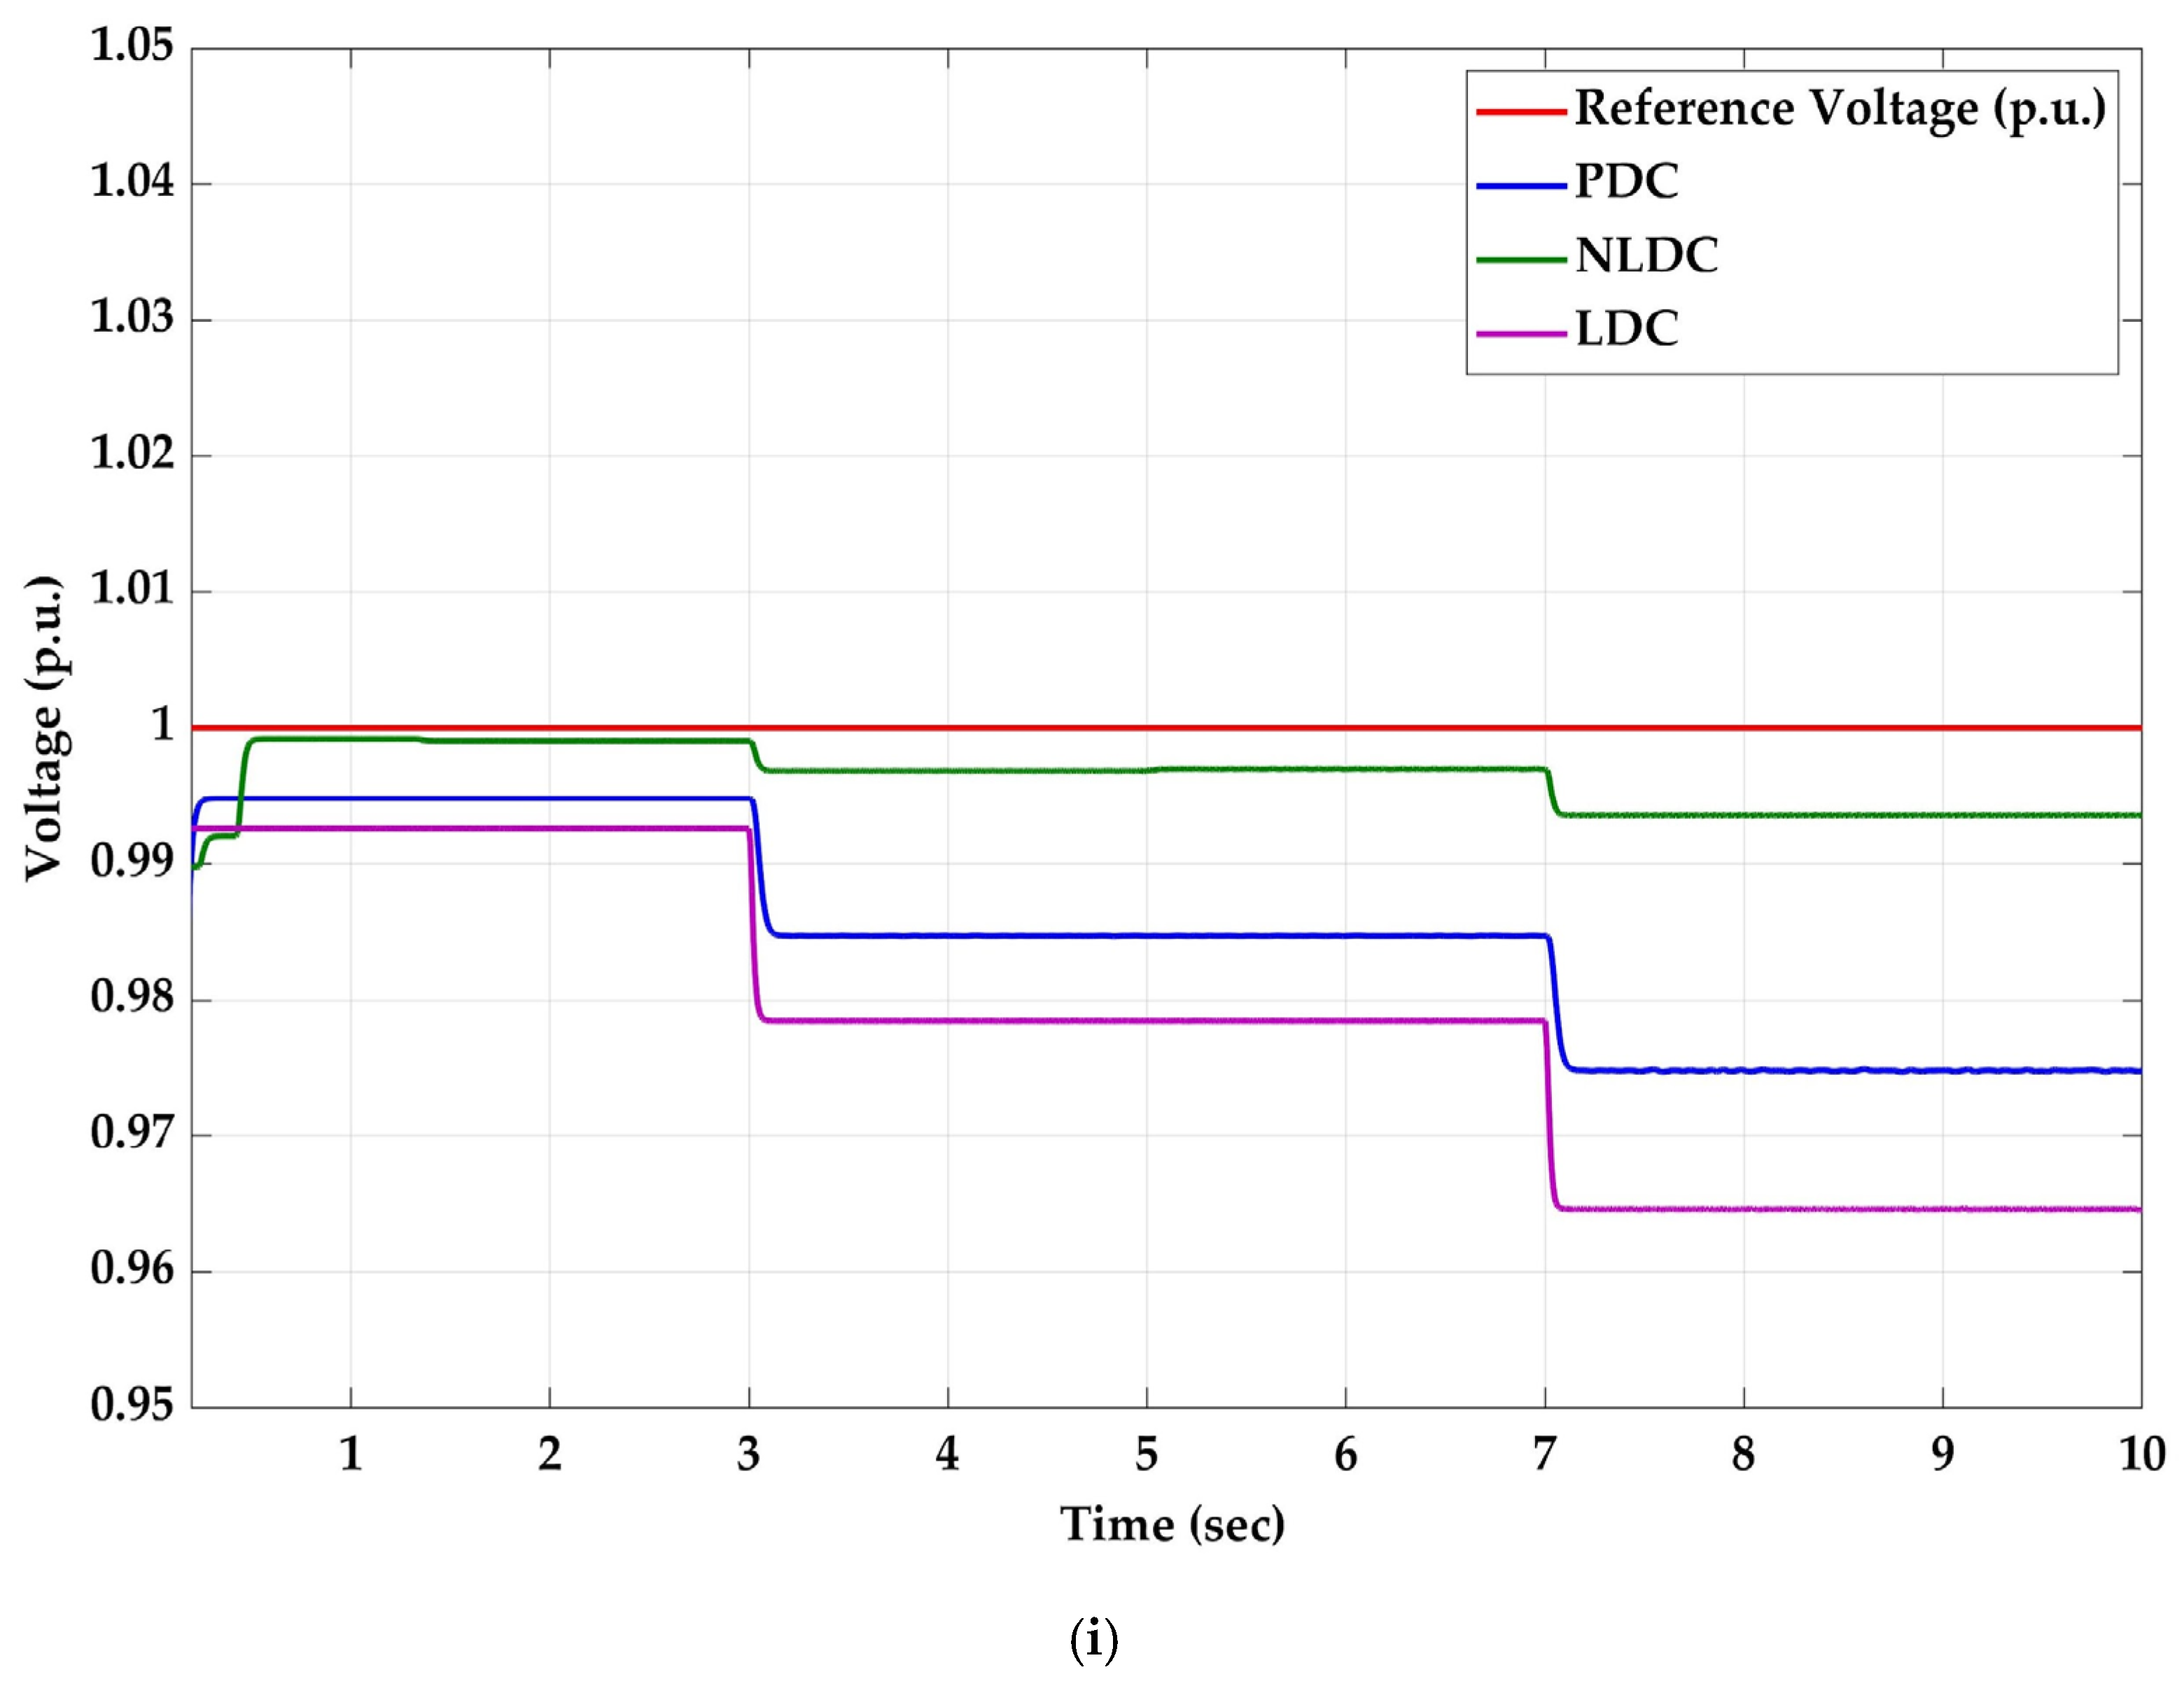
A similar analysis is performed with the line resistance ratio of 1:5, that is, and , to study the role of line resistance on current sharing and voltage regulation as well as the efficacy of the proposed controller in mitigating the effect of the increased difference in line resistances of the converters as depicted in Figure 10. is 0.9953 p.u. (Figure 10i) and is 0 (Figure 10ii(a)) at t = 2 s, which shows the supremacy of the proposed controller in mitigating the effect of line resistance on the performance of the DC microgrid. Whereas with LDC and NLDC, is 0.1531 A and 0.5400 A, which is higher than in case-i. In , after updating , , and for both controllers, is smaller, with PDC at t = 5 s with a value of 0.005 A. In , a very minimal of 0.006 A with PDC is achieved by updating the droop constant to −1.5115 Ω, and a of 0.0247 p.u. is obtained by updating the reference voltage to . Voltage deviation is minimal, which is p.u. with NLDC (Figure 10i), but there exists a trade-off for the current sharing (Figure 10ii(b)) which led to the over-utilization of solar PV-1 with and the under-utilization of solar pv-2 with , making this controller unsuitable for EV charging load with a DC microgrid. With LDC, the maximum obtained is 0.0312 p.u. (Figure 10i) and is 0.2100 A (Figure 10ii(c)) with a full load for case-ii, whereas this value is only 0.0288 p.u. and 0.7390 A, respectively, for case-i, which clearly shows the effect of line resistance.
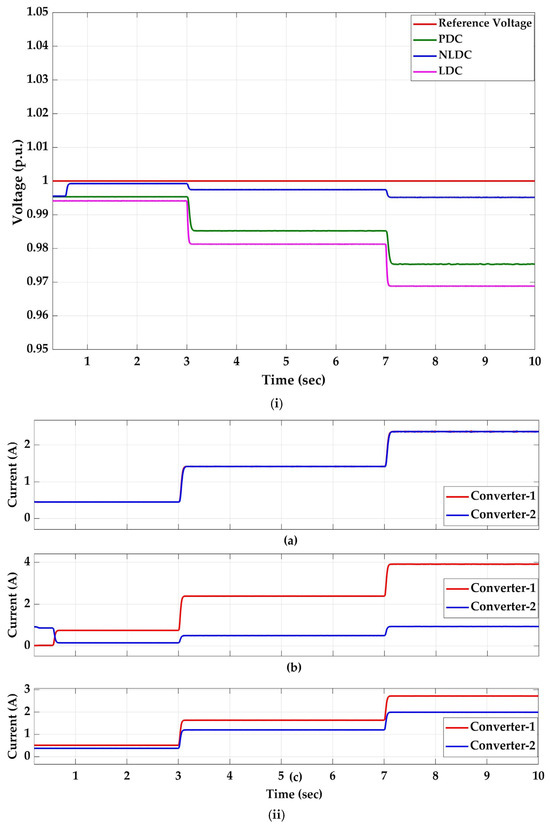
Figure 10.
Case-ii: (i) p.u. bus voltage; (ii) current sharing: (a) PDC, (b) NLDC, (c) LDC.
4.3. Case-iii
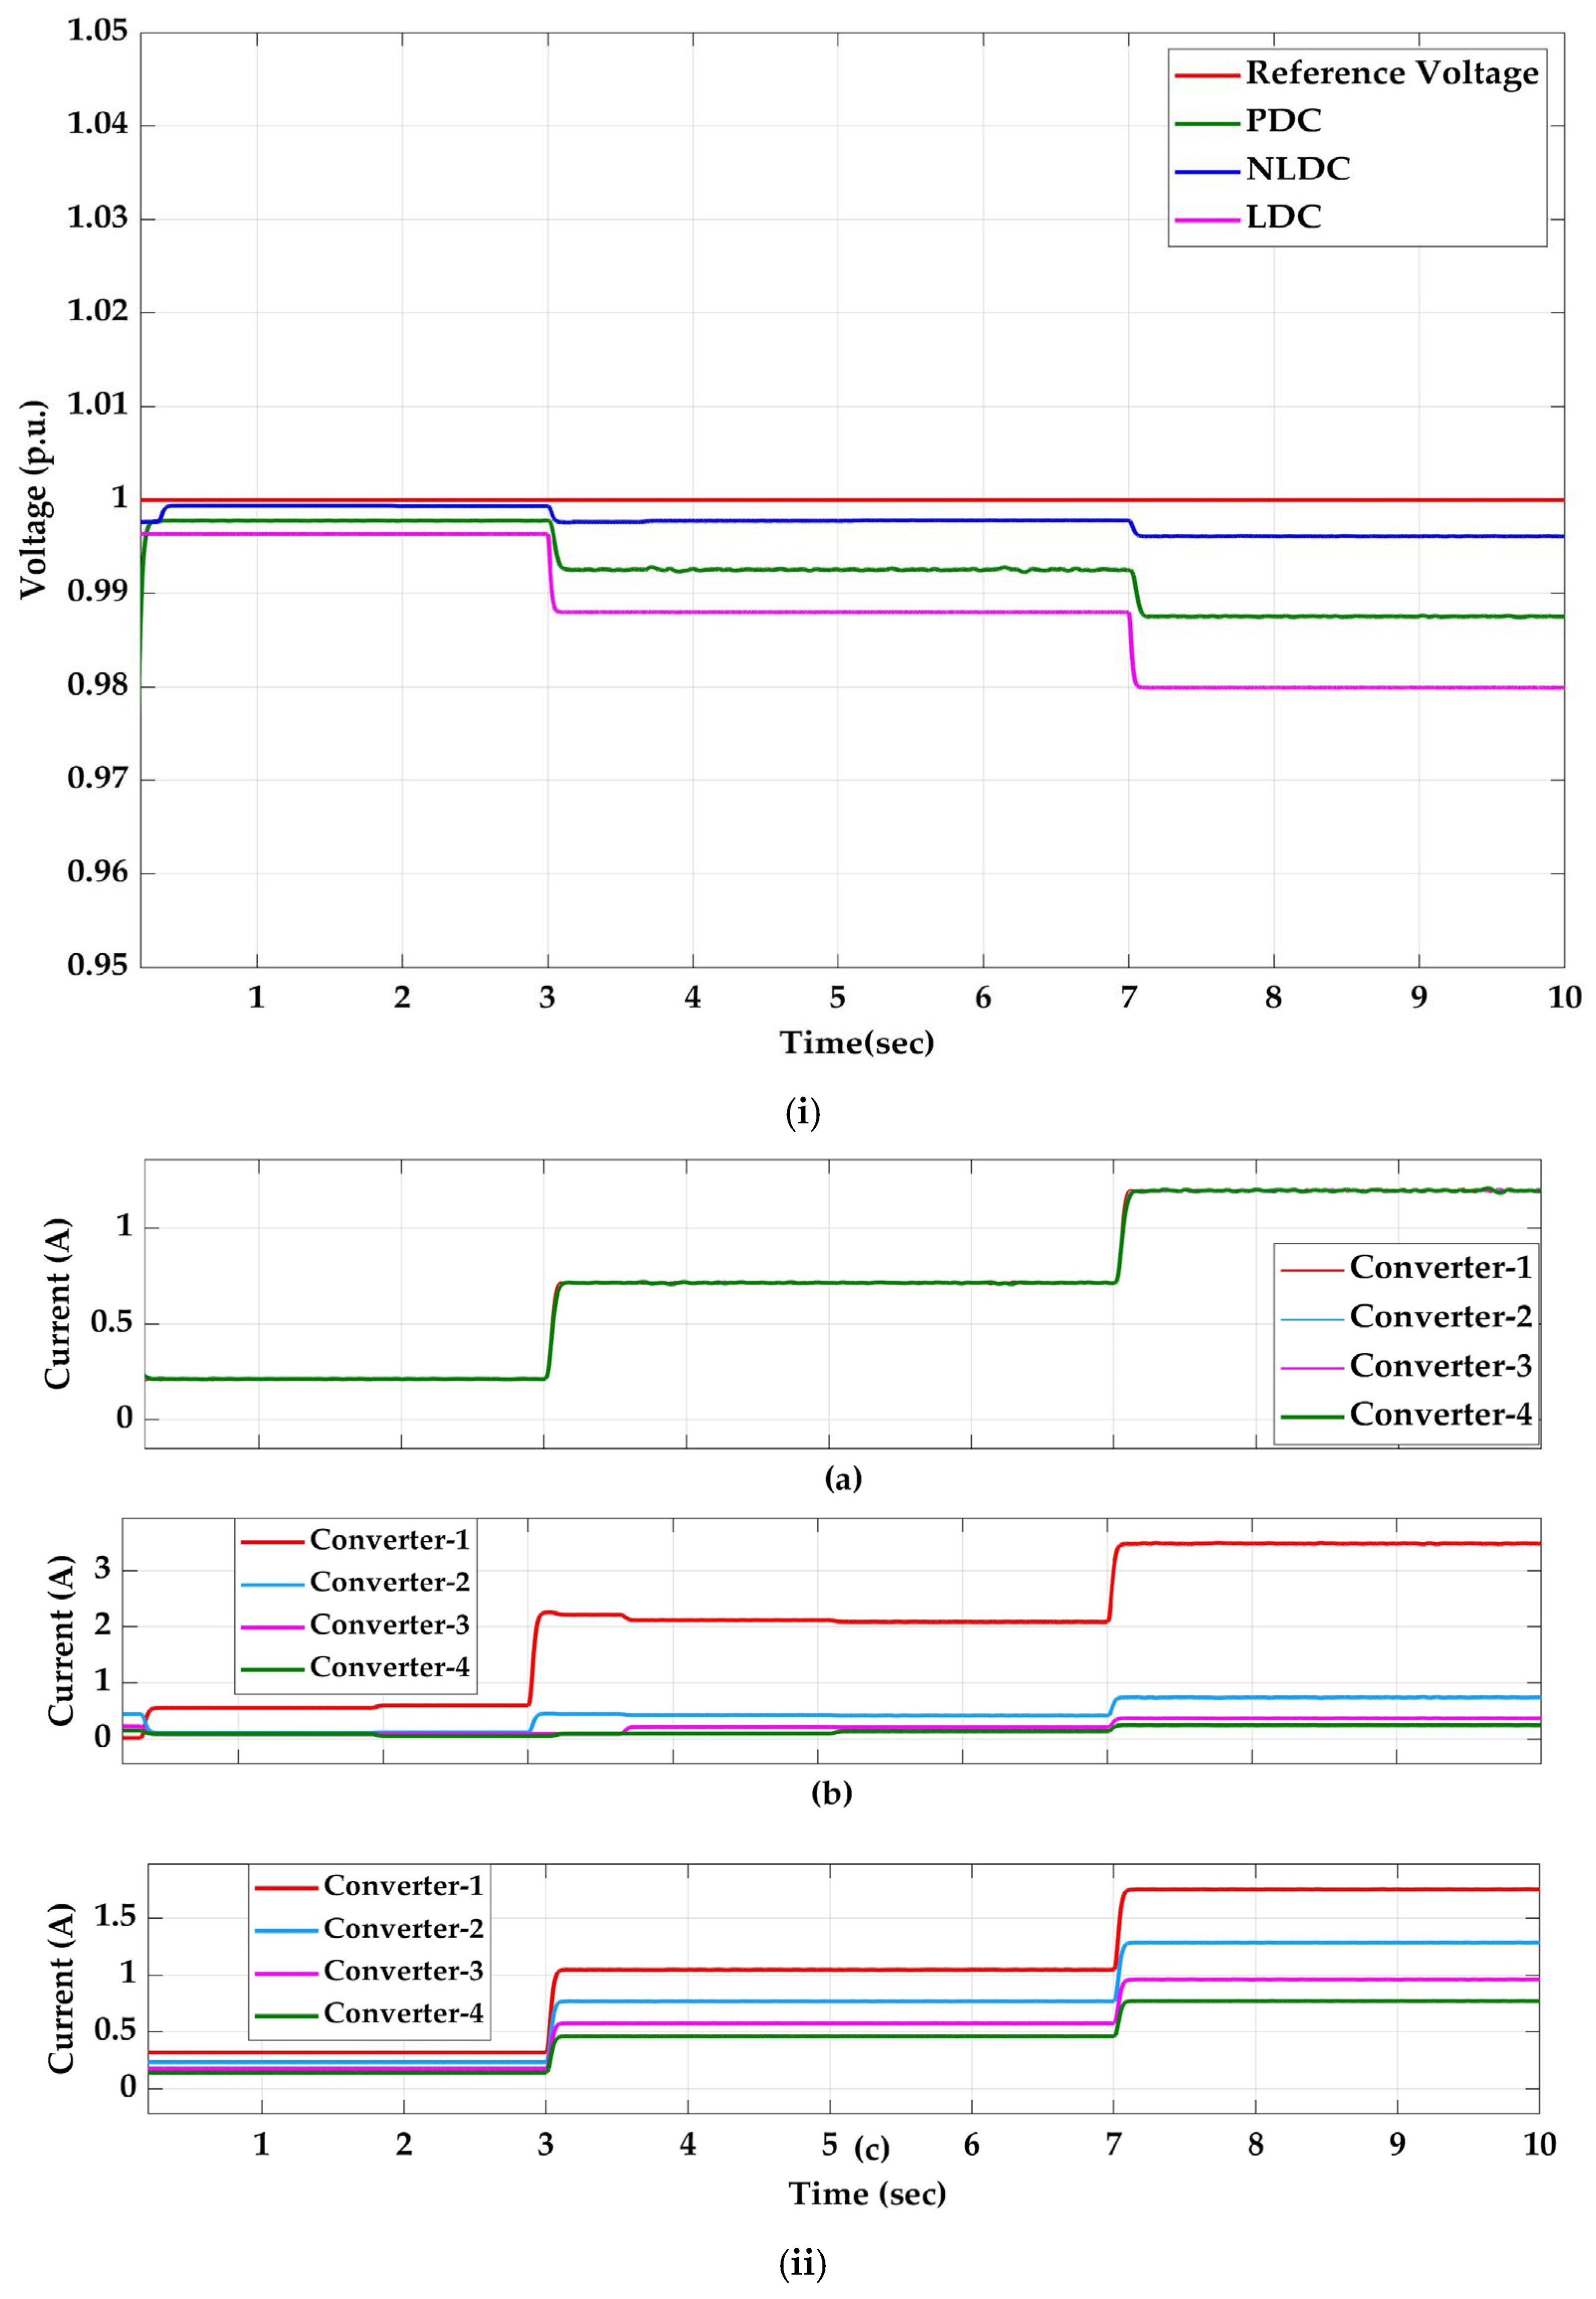
Figure 11 indicates the performance of the DC microgrid with a line resistance ratio of 1:10, that is, and . At t = 2 s, which is of the proposed PDC, the minimum obtained is 0.0009 A (Figure 9ii(a)), and the maximum obtained is 0.8179 A (Figure 9ii(b)); with the NLDC, though, it gives the best voltage of 0.9991 p.u (Figure 11i). At t = 5 s, when the load is 60%, the load currents fall into of the proposed controller and the obtained is 0.9790 p.u. (Figure 11i), with the updating of reference voltage by voltage compensator , and is 0.0040 A (Figure 11ii(a)) with PDC, obtained by updating the droop value as . At t = 8 s, i.e., in of the proposed controller, the obtained is 0.009 A, which is the lowest of all the other controllers, whereas the highest difference obtained is 3.6988 A with NLDC. with PDC is 0.9752 p.u., which is less than 5% of the maximum bus voltage. and with LDC are 0.0354 p.u. (Figure 11i) and 1.3880 A (Figure 11ii(c)), respectively, which shows the effect of increased line resistance difference when compared to cases i and ii. The effect of line resistance with NLDC is also evident from Figure 11ii(b), where is 2.4668 A for a 60% load change, whereas for case-i it is only 0.3300 A.
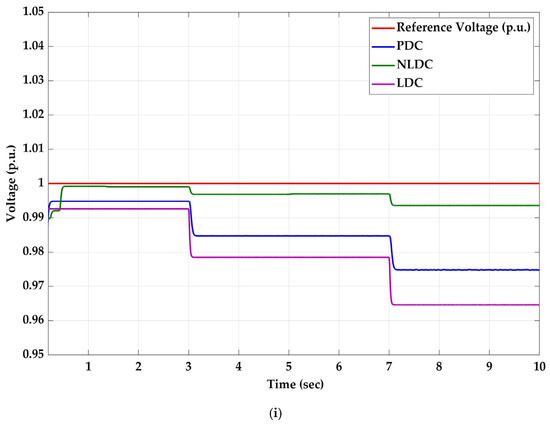
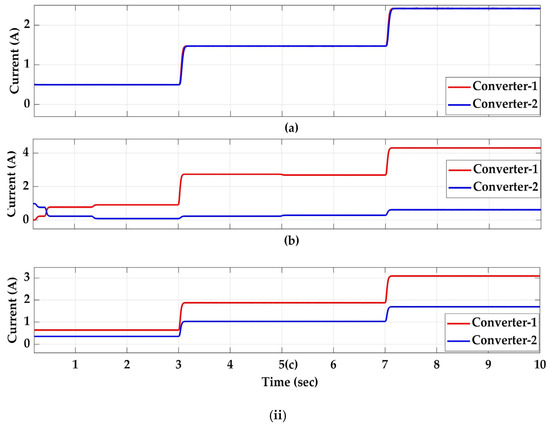
Figure 11.
Case-iii: (i) p.u. bus voltage (ii); current sharing: (a) PDC, (b) NLDC, (c) LDC.
4.4. Case-iv
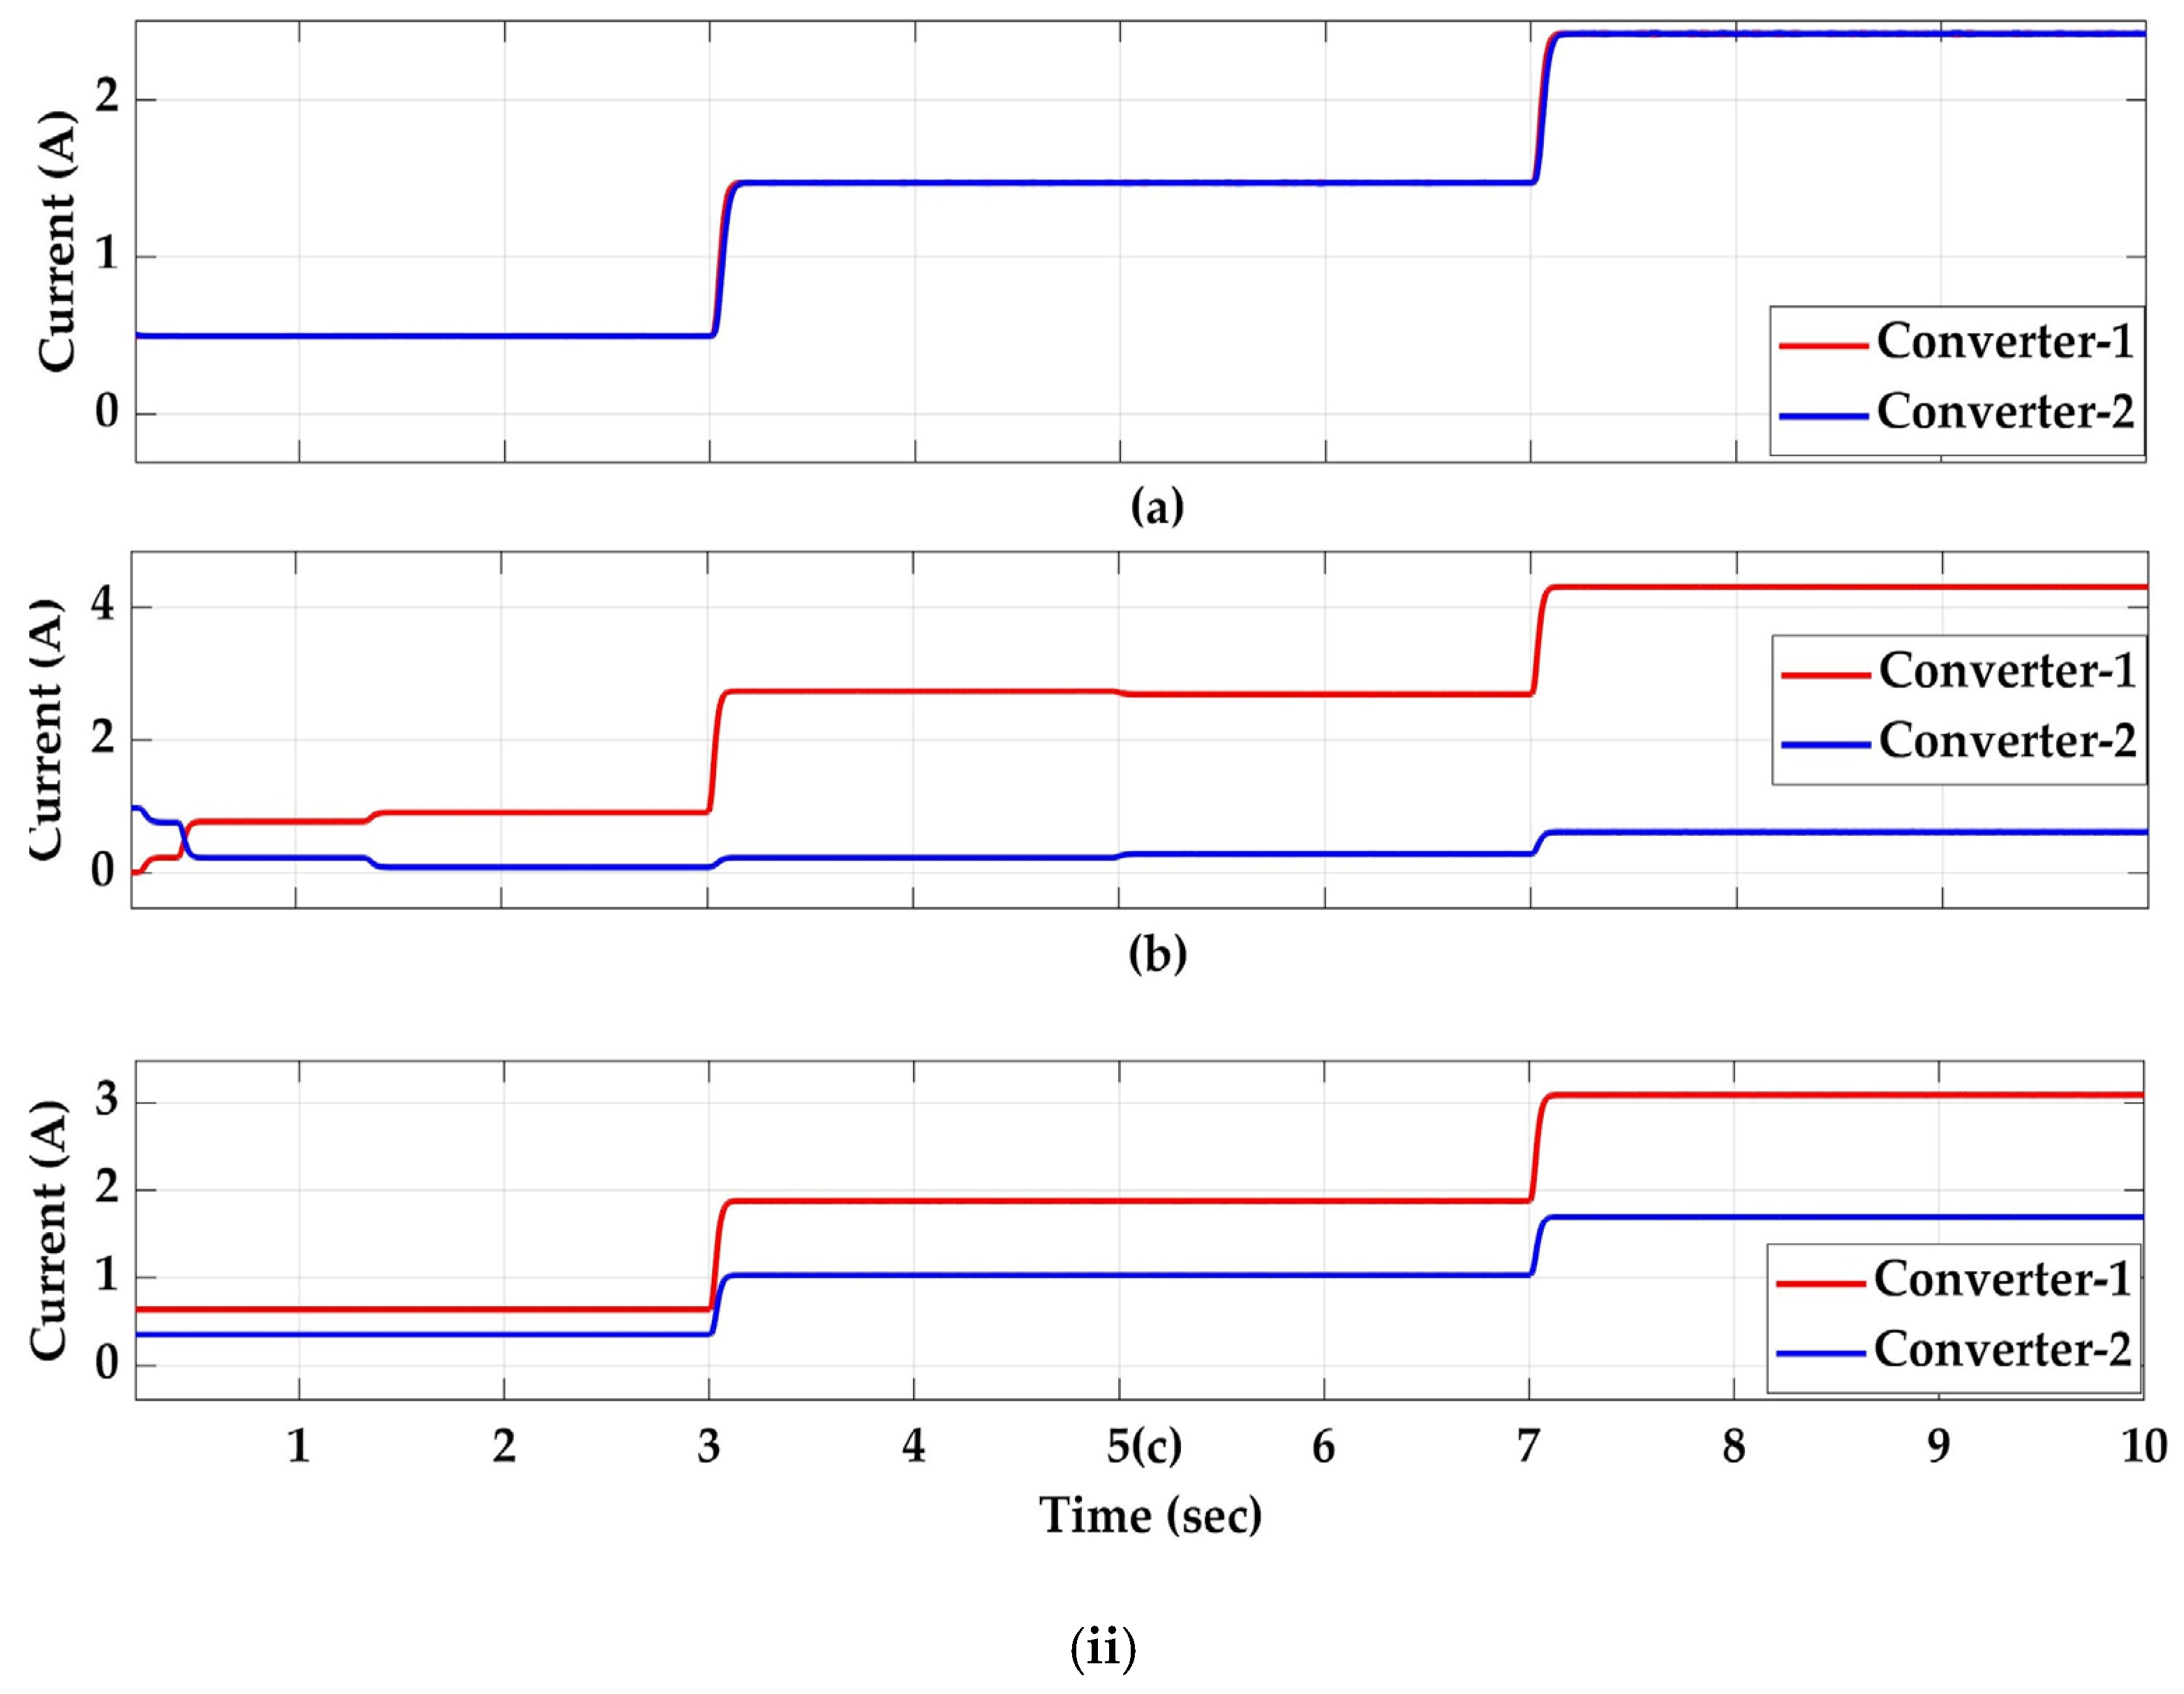
The DC MG is integrated with four ideal DERs with cable resistances of for DER 1, 2, 3, and 4, respectively. These resistances are in the ratio of 1:5:10:15. The system is studied with the proposed PDC and compared with LDC and NLDC strategies to show the effectiveness of the proposed strategy in eliminating the effect of line resistance when compared to LDC and NLDC. Figure 12i shows the voltage of the DC bus, and Figure 12ii shows the current sharing of all four DERs sharing a common load. The maximum voltage deviation () obtained by PDC, NLDC, and LDC is 1.25%, 0.39%, and 0.20% of the reference voltage, respectively. Although NLDC outperformed PDC in maintaining better voltage regulation, it utterly failed in current sharing among parallel DERs, which is evident from Figure 12ii. Equal current sharing is achieved with the proposed PDC, whereas the current sharing is worse with NLDC due to the trade-off limitation. This high-scale system analysis showcases the practicality of the proposed PDC technique and its application for larger MGs.
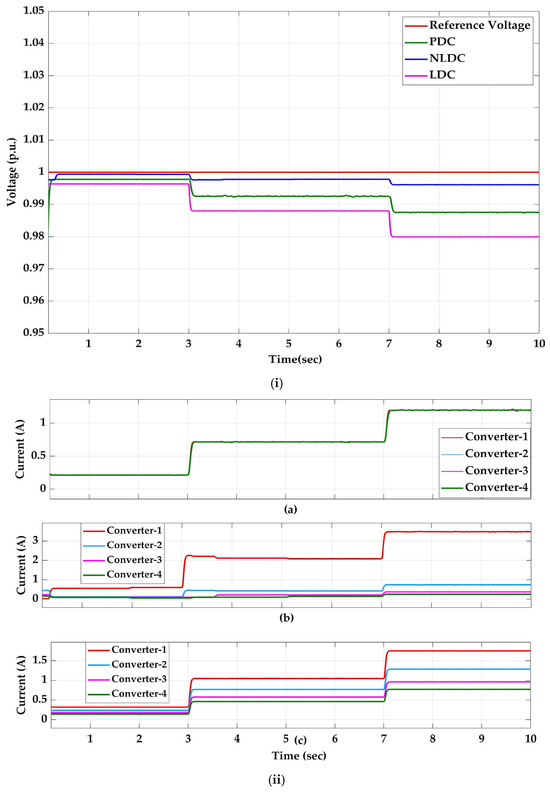
Figure 12.
Case-iv: (i) p.u. bus voltage; (ii) current sharing: (a) PDC, (b) NLDC, (c) LDC.
5. Experimental Validation
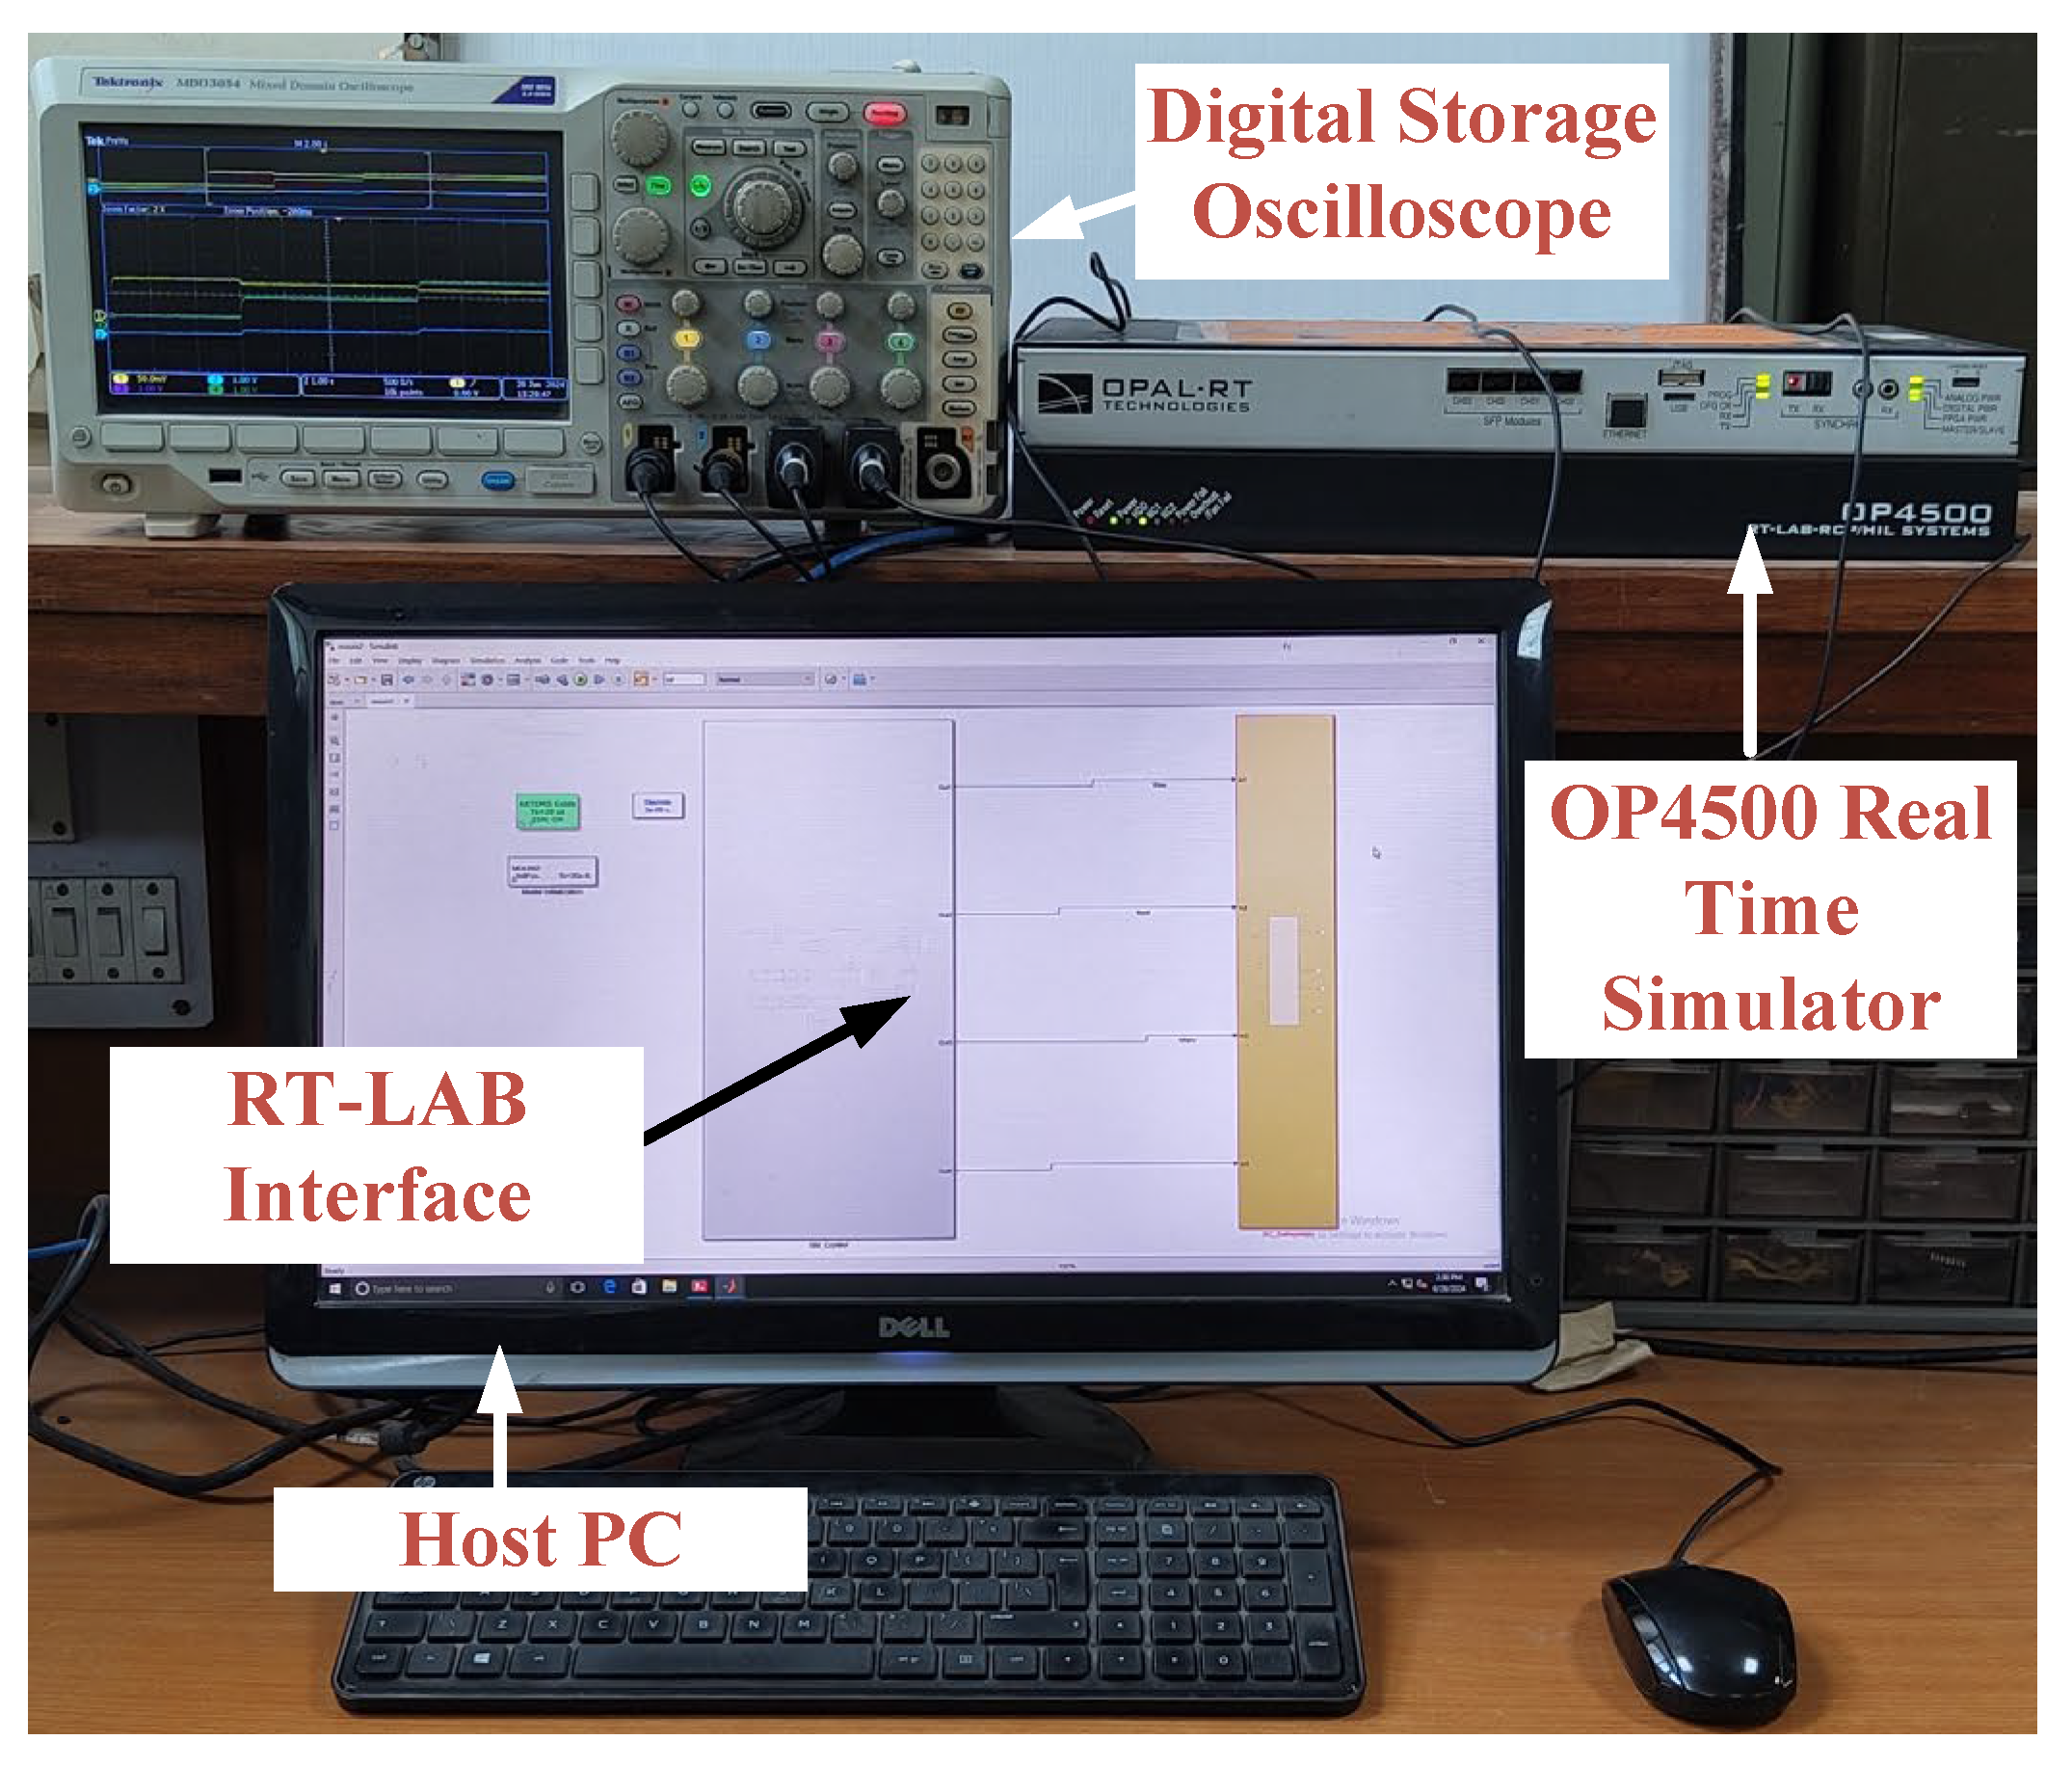
The real-time validation of the proposed DC MG for EV charging application controlled with PDC was executed in the RT-lab environment on the OP4500 real-time simulator, as shown in Figure 13. It consists of a XEON E3 processor and a Xilinx Kintex-7 FPGA co-processor. A sampling time of 20 µs is employed. The computation of droop and voltage compensation is distributed among four cores executing in parallel.
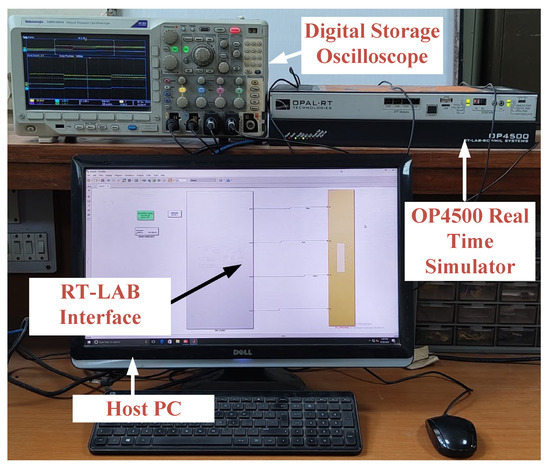
Figure 13.
Experimental test bench with OP4500.
The latency metrics for experimental validation is calculated as follows:
where is the total latency time, is the I/O latency, is the computation latency, and is the communication latency. Since OPAL 4500 is FPGA-based, is very minimal. For Kintex-7, . , due to parallel execution, is . The communication between the FPGA and the CPU is . Hence, , which is less than the sampling time, substantiating real-world applicability.
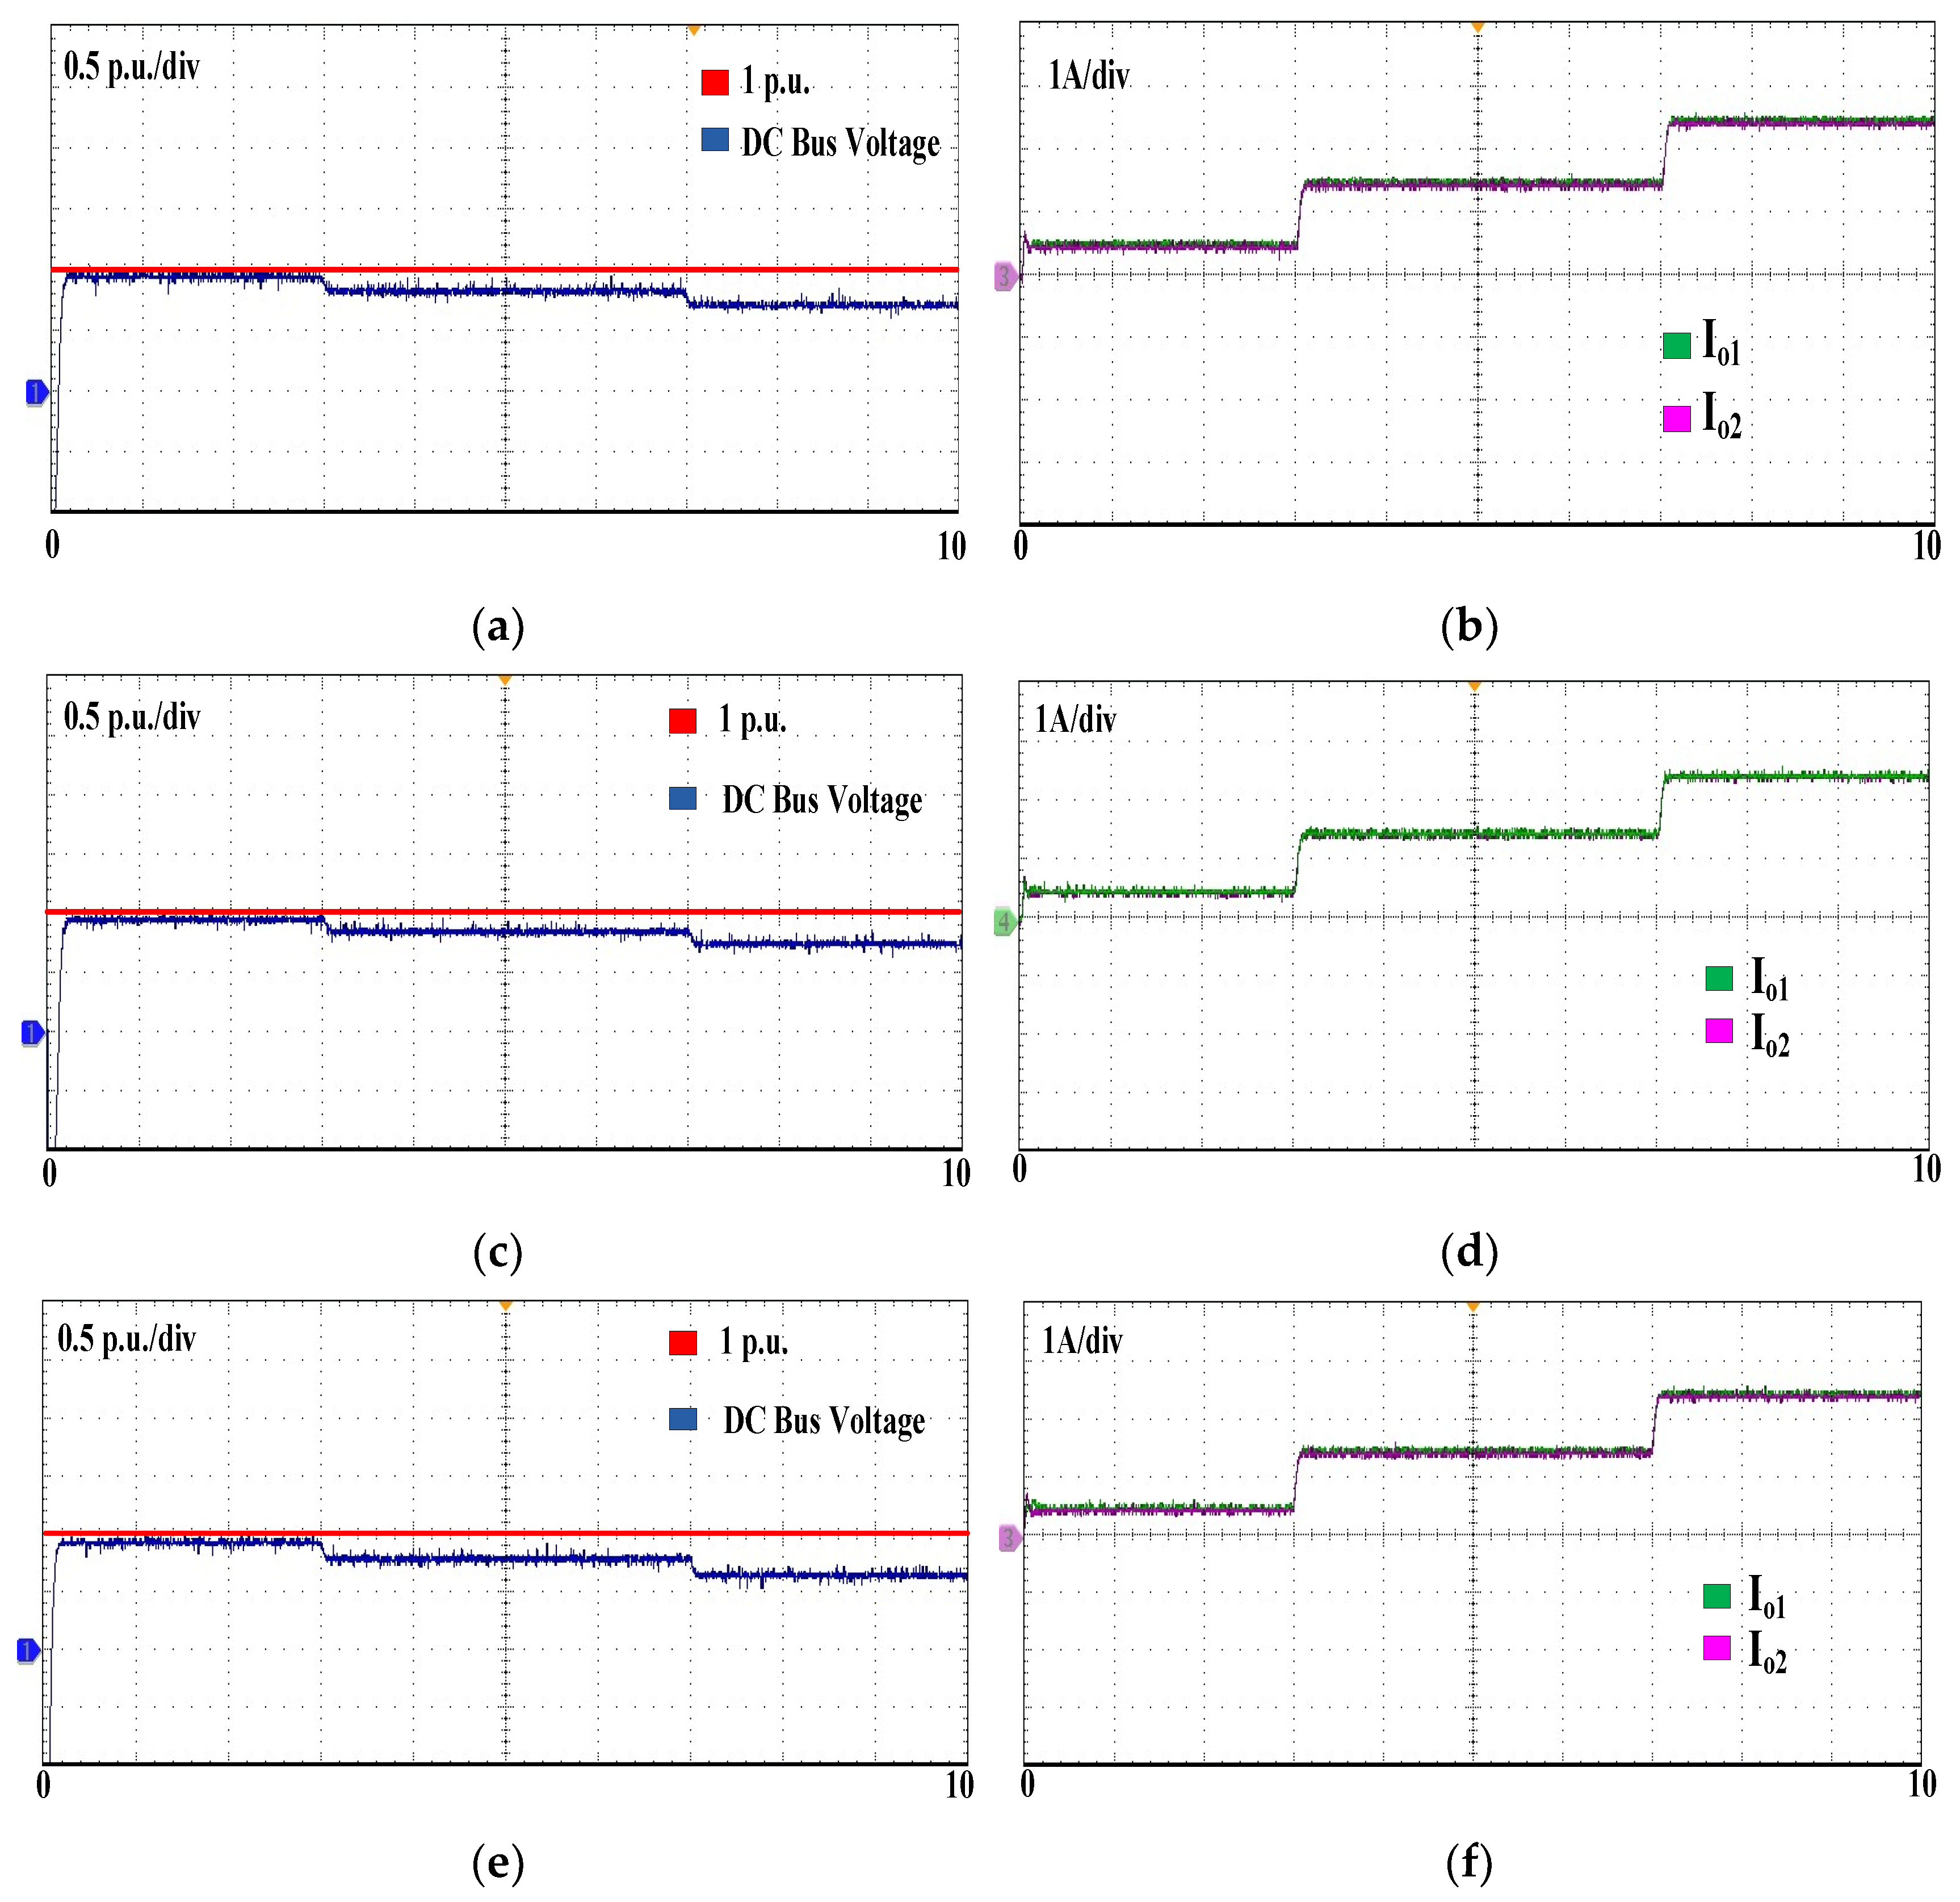
The bus voltage and current sharing of the DC microgrid sources that supply a common dynamic EV load with the proposed controller in real-time is depicted in Figure 14. The system performance is analyzed for three different line resistance ratios. The experimental results are in total agreement with the simulation results as listed in Table 3. The efficacy of the proposed controller in mitigating the line resistance effect on the bus voltage deviation () and source utilization () is presented. From Table 1, it is observed that with PDC, sources are properly utilized without any under- or over-utilization, maintaining voltage deviation in tolerable limits, thereby mitigating the drawback of both LDC and NLDC. for case-i with 20% load and PDC is 0.0045 p.u., whereas with LDC and NLDC, the value is 0.0059 p.u. and 0.0007 p.u., respectively. Although is lower with NLDC, the obtained is 0.3336 A, which is worse compared with the other controllers, leading to the over-utilization of the solar PV-1 with and under-utilization of solar PV-2 with . Similarly, when the load current falls in of the piece-wise droop curve, obtained with PDC is 0.0146 p.u., which is less than 0.05 p.u., and is 0.0150 A, which is the least among all other controllers. In case-ii , both LDC and NLDC exhibit a trade-off between and , whereas with PDC, proper utilization of the sources is obtained, which depicts almost equal utilization of the parallel sources despite the increased line resistance ratio, which is desirable for the proposed DC microgrid model in practical EV charging applications.
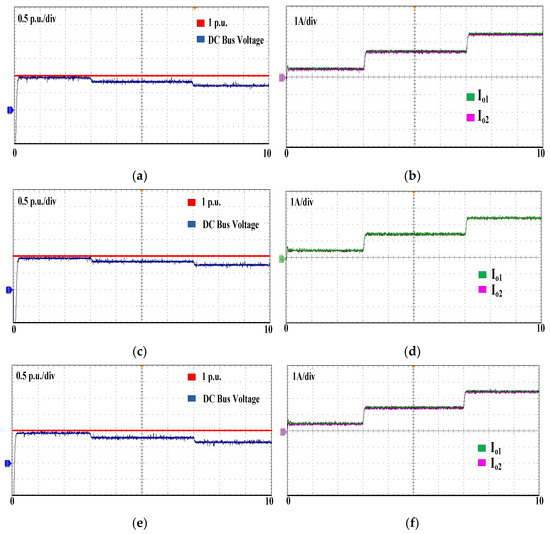
Figure 14.
RT Lab results with the proposed controller: (a) p.u. bus voltage for ; (b) current sharing for ; (c) p.u. bus voltage for ; (d) current sharing for ; (e) p.u. bus voltage for ; (f) current sharing for . —output current of DER1 controlled with PDC. —output current of DER2 controlled with PDC.
Table 3.
Simulation and experimental comparison of DC MG performance with PDC.
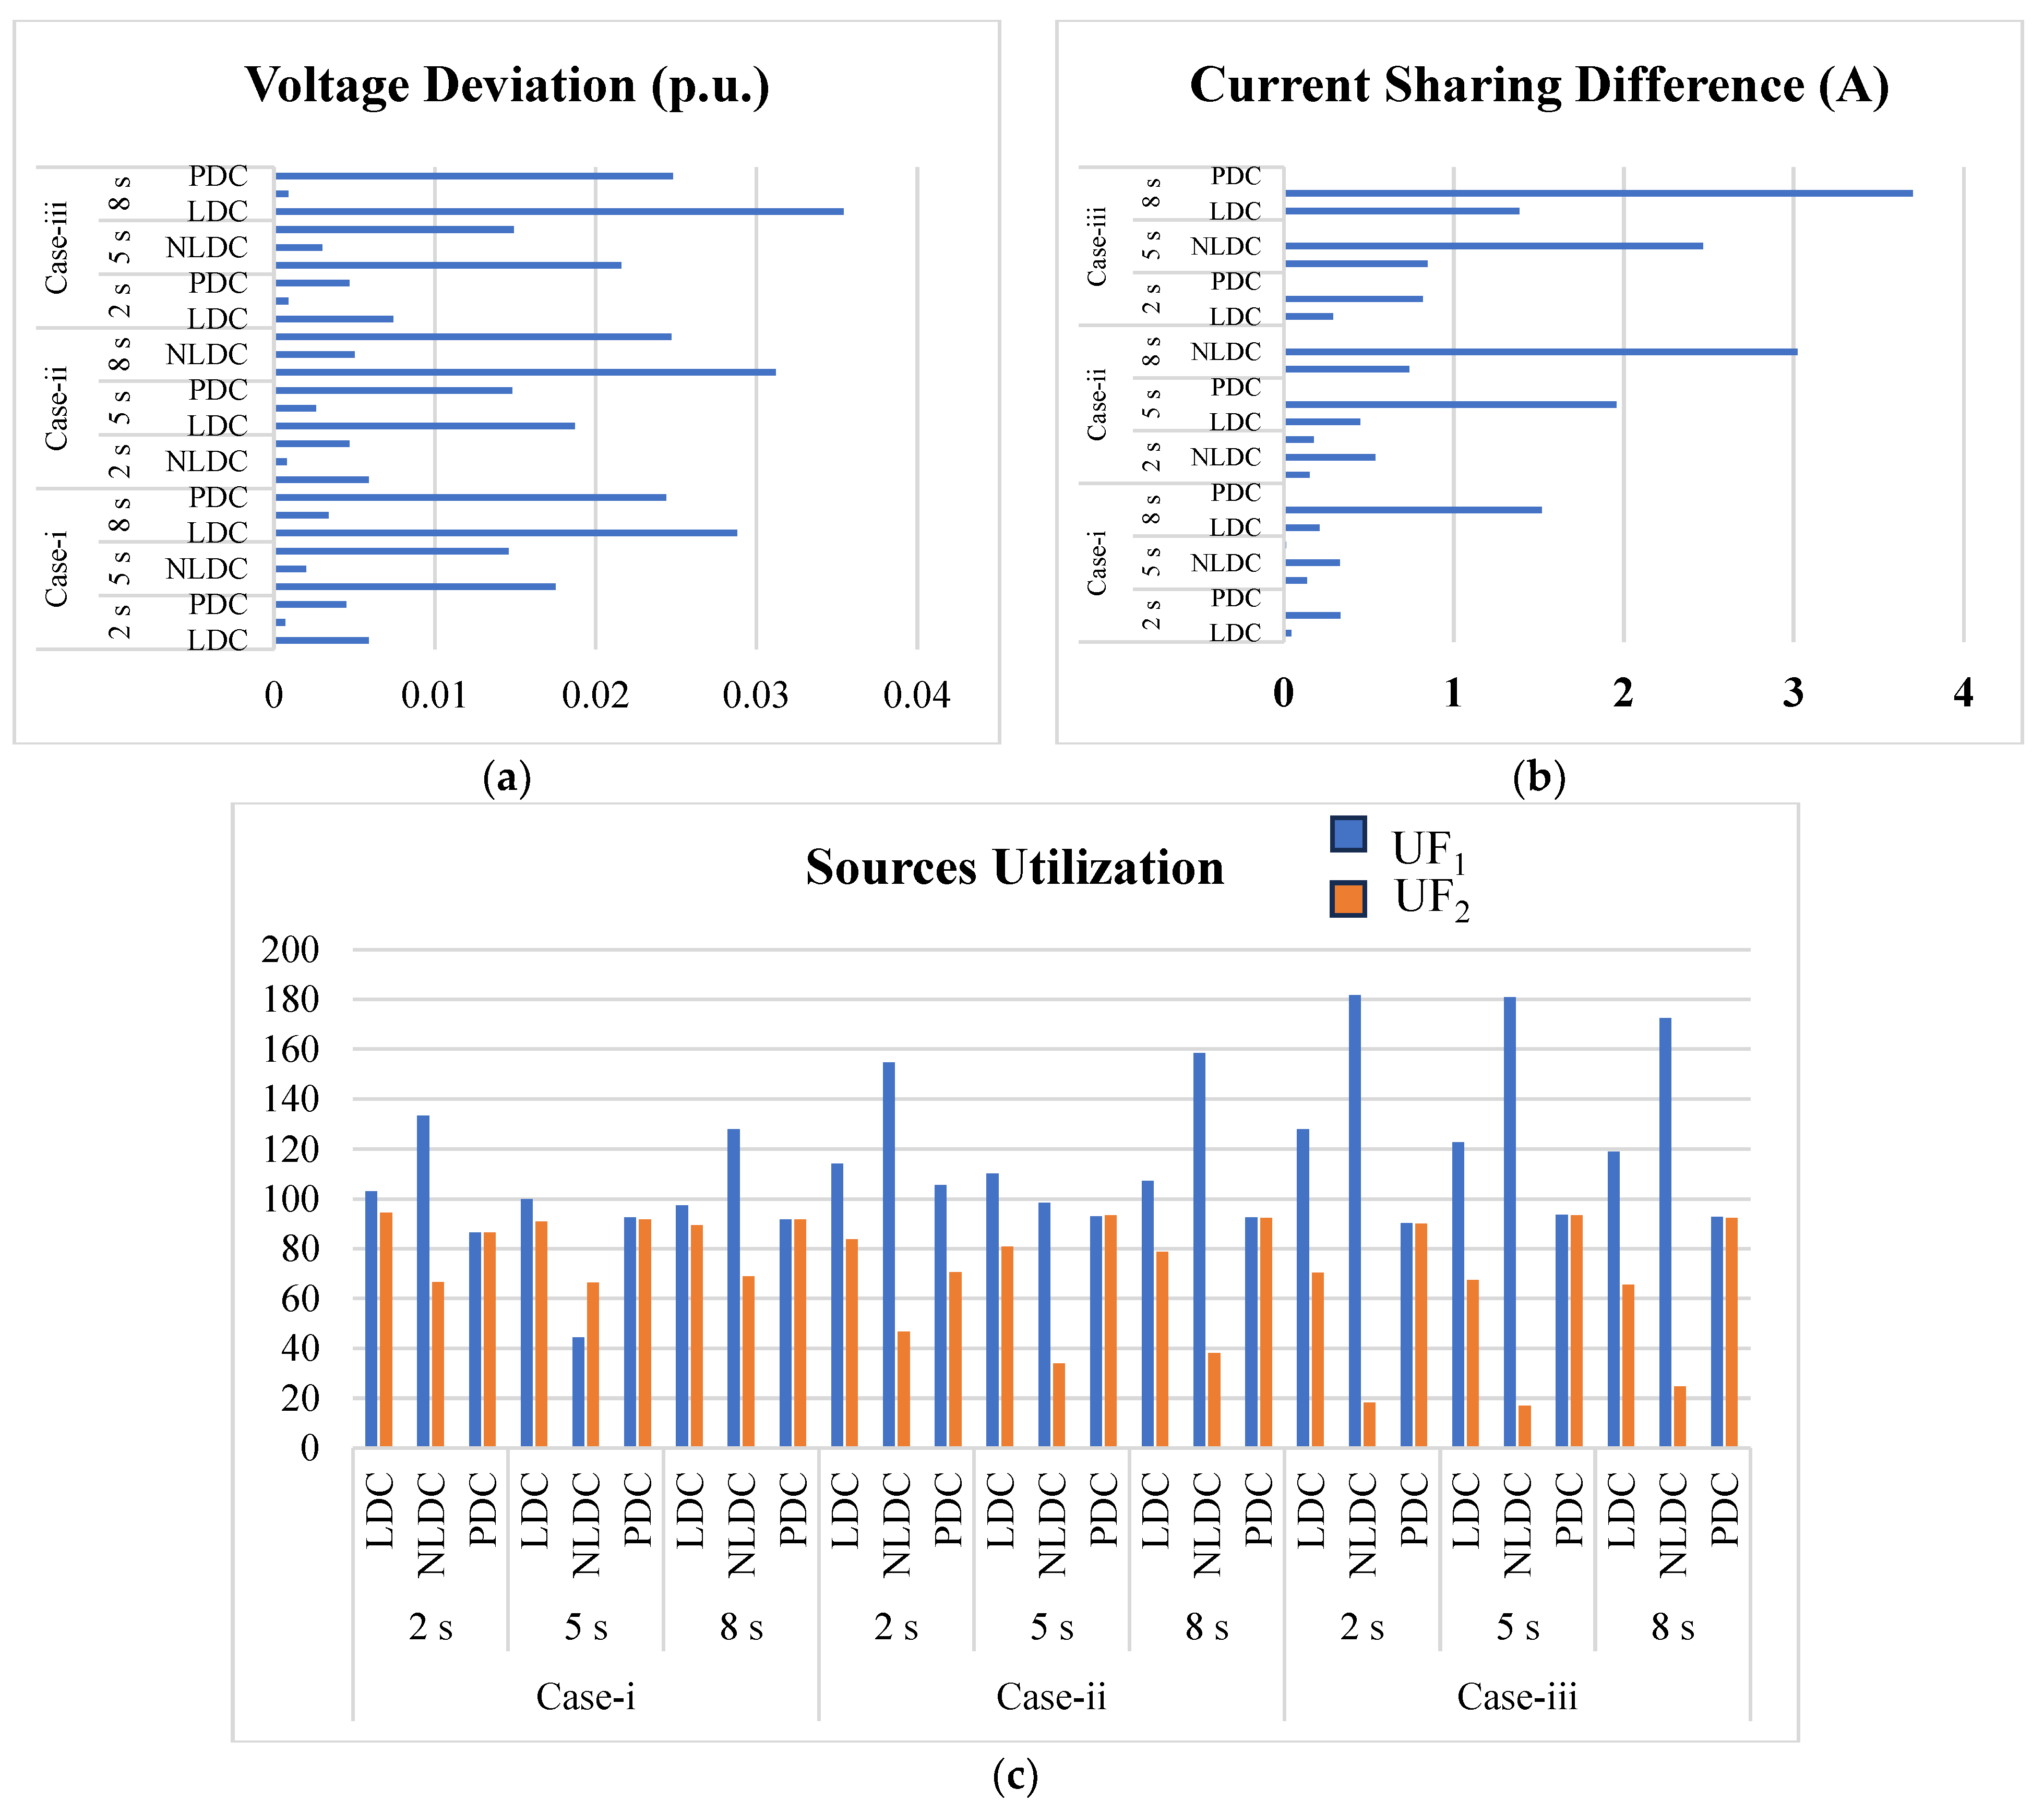
The voltage deviation and the utilization of sources of a DC microgrid for various case studies are represented pictorially in Figure 15.
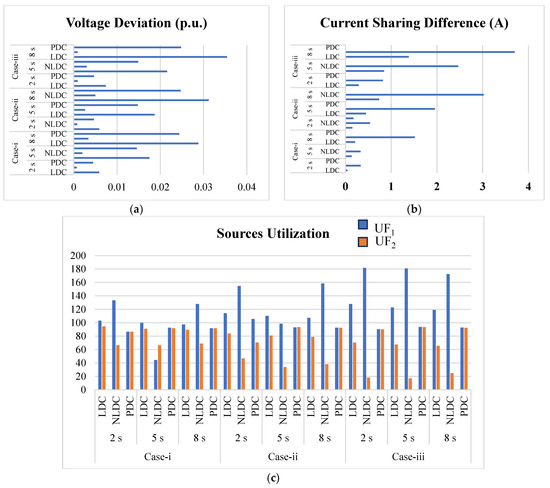
Figure 15.
Comparative graphs: (a) voltage deviation, (b) current sharing difference, (c) utilization of parallel sources.
With LDC, the utilization of sources is at a medium level, but the voltage deviation is high compared to other controllers, as listed in Table 4. With NLDC, almost all reference voltages are achieved, but all the sources are either over-utilized or under-utilized in all the cases, which shows the extreme trade-off limitation. With PDC, though the voltage deviation is medium, it is still in the tolerable range, and high utilization of sources is achieved irrespective of the line resistance ratio, which is highly stable and reliable for the operation of the DC microgrid for EV charging applications.
Table 4.
Performance assessment of DC microgrid with various controllers.
6. Conclusions and Future Scope
The proposed piece-wise droop controller (PDC) with voltage compensation demonstrates superior adaptability for EV charging applications by ensuring minimal voltage deviation and balanced power utilization across multiple sources in a DC MG, ensuring proper energy management among parallel connected sources. For case-i with full load, the voltage deviation of 84.72% of that obtained with LDC and current sharing of 0.06% of that obtained with NLDC is achieved with PDC. Source utilizations of 91.74% and 91.78% are obtained. In case-ii, the voltage deviation is only 0.0247 p.u., which is only 79.17% of the deviation obtained with LDC, and the current sharing difference is almost 0. In Case-iii, the PDC achieves 70.05% of the voltage deviation observed with LDC and a current sharing error of only 0.65% compared to that of NLDC, demonstrating the robustness of PDC against variations in line resistance”.
The DC MG with four parallel DERs integrated with PDC outperformed NLDC and LDC strategies in eliminating the effect of unequal line resistances on current sharing, indicating the practicality of the proposed control strategy for larger MGs. PDC exhibits gain and phase margins in the desirable range for all three regions, making it robust to any perturbations. The complete agreement of RT-Lab results with the simulation confirms the practical viability of PDC for EV charging loads. The future scope of this work includes the implementation of the proposed PDC strategy for hybrid MGs integrated with the utility grid, consisting of solar pv and energy storage units. PDC integrated with machine learning can be implemented to obtain proper power sharing among various renewable sources, which is pivotal for extending the life of storage units.
Author Contributions
Conceptualization, M.M. and B.A.R.; Formal analysis, M.M., M.L.K. and K.R.N.; Investigation, B.A.R. and M.L.K.; Methodology, M.M. and B.A.R.; Resources, B.A.R.; Software, M.M.; Supervision, B.A.R. and M.L.K.; Validation, M.M.; Visualization, M.L.K., K.R.N. and J.R.M.; Writing—original draft, M.M.; Writing—review and editing, B.A.R., M.L.K., K.R.N., J.R.M., S.K.K. and D.G. All authors have read and agreed to the published version of the manuscript.
Funding
This research received no external funding.
Data Availability Statement
The original contributions presented in this study are included in the article. Further inquiries can be directed to the corresponding author.
Conflicts of Interest
The authors declare no conflict of interest.
Appendix A
Table A1.
System design and control parameters.
Table A1.
System design and control parameters.
| Parameter | Value | Parameter | Value |
|---|---|---|---|
| 48 V | 2200 µF | ||
| 24 V | 2200 µF | ||
| 24 V | 20 KHz | ||
| 0.3 mH | 0.0155 | ||
| 11.46 µF | 1 |
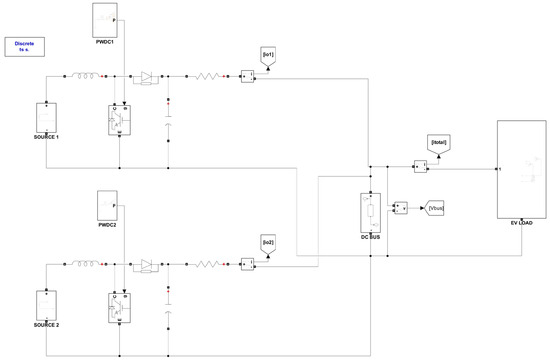
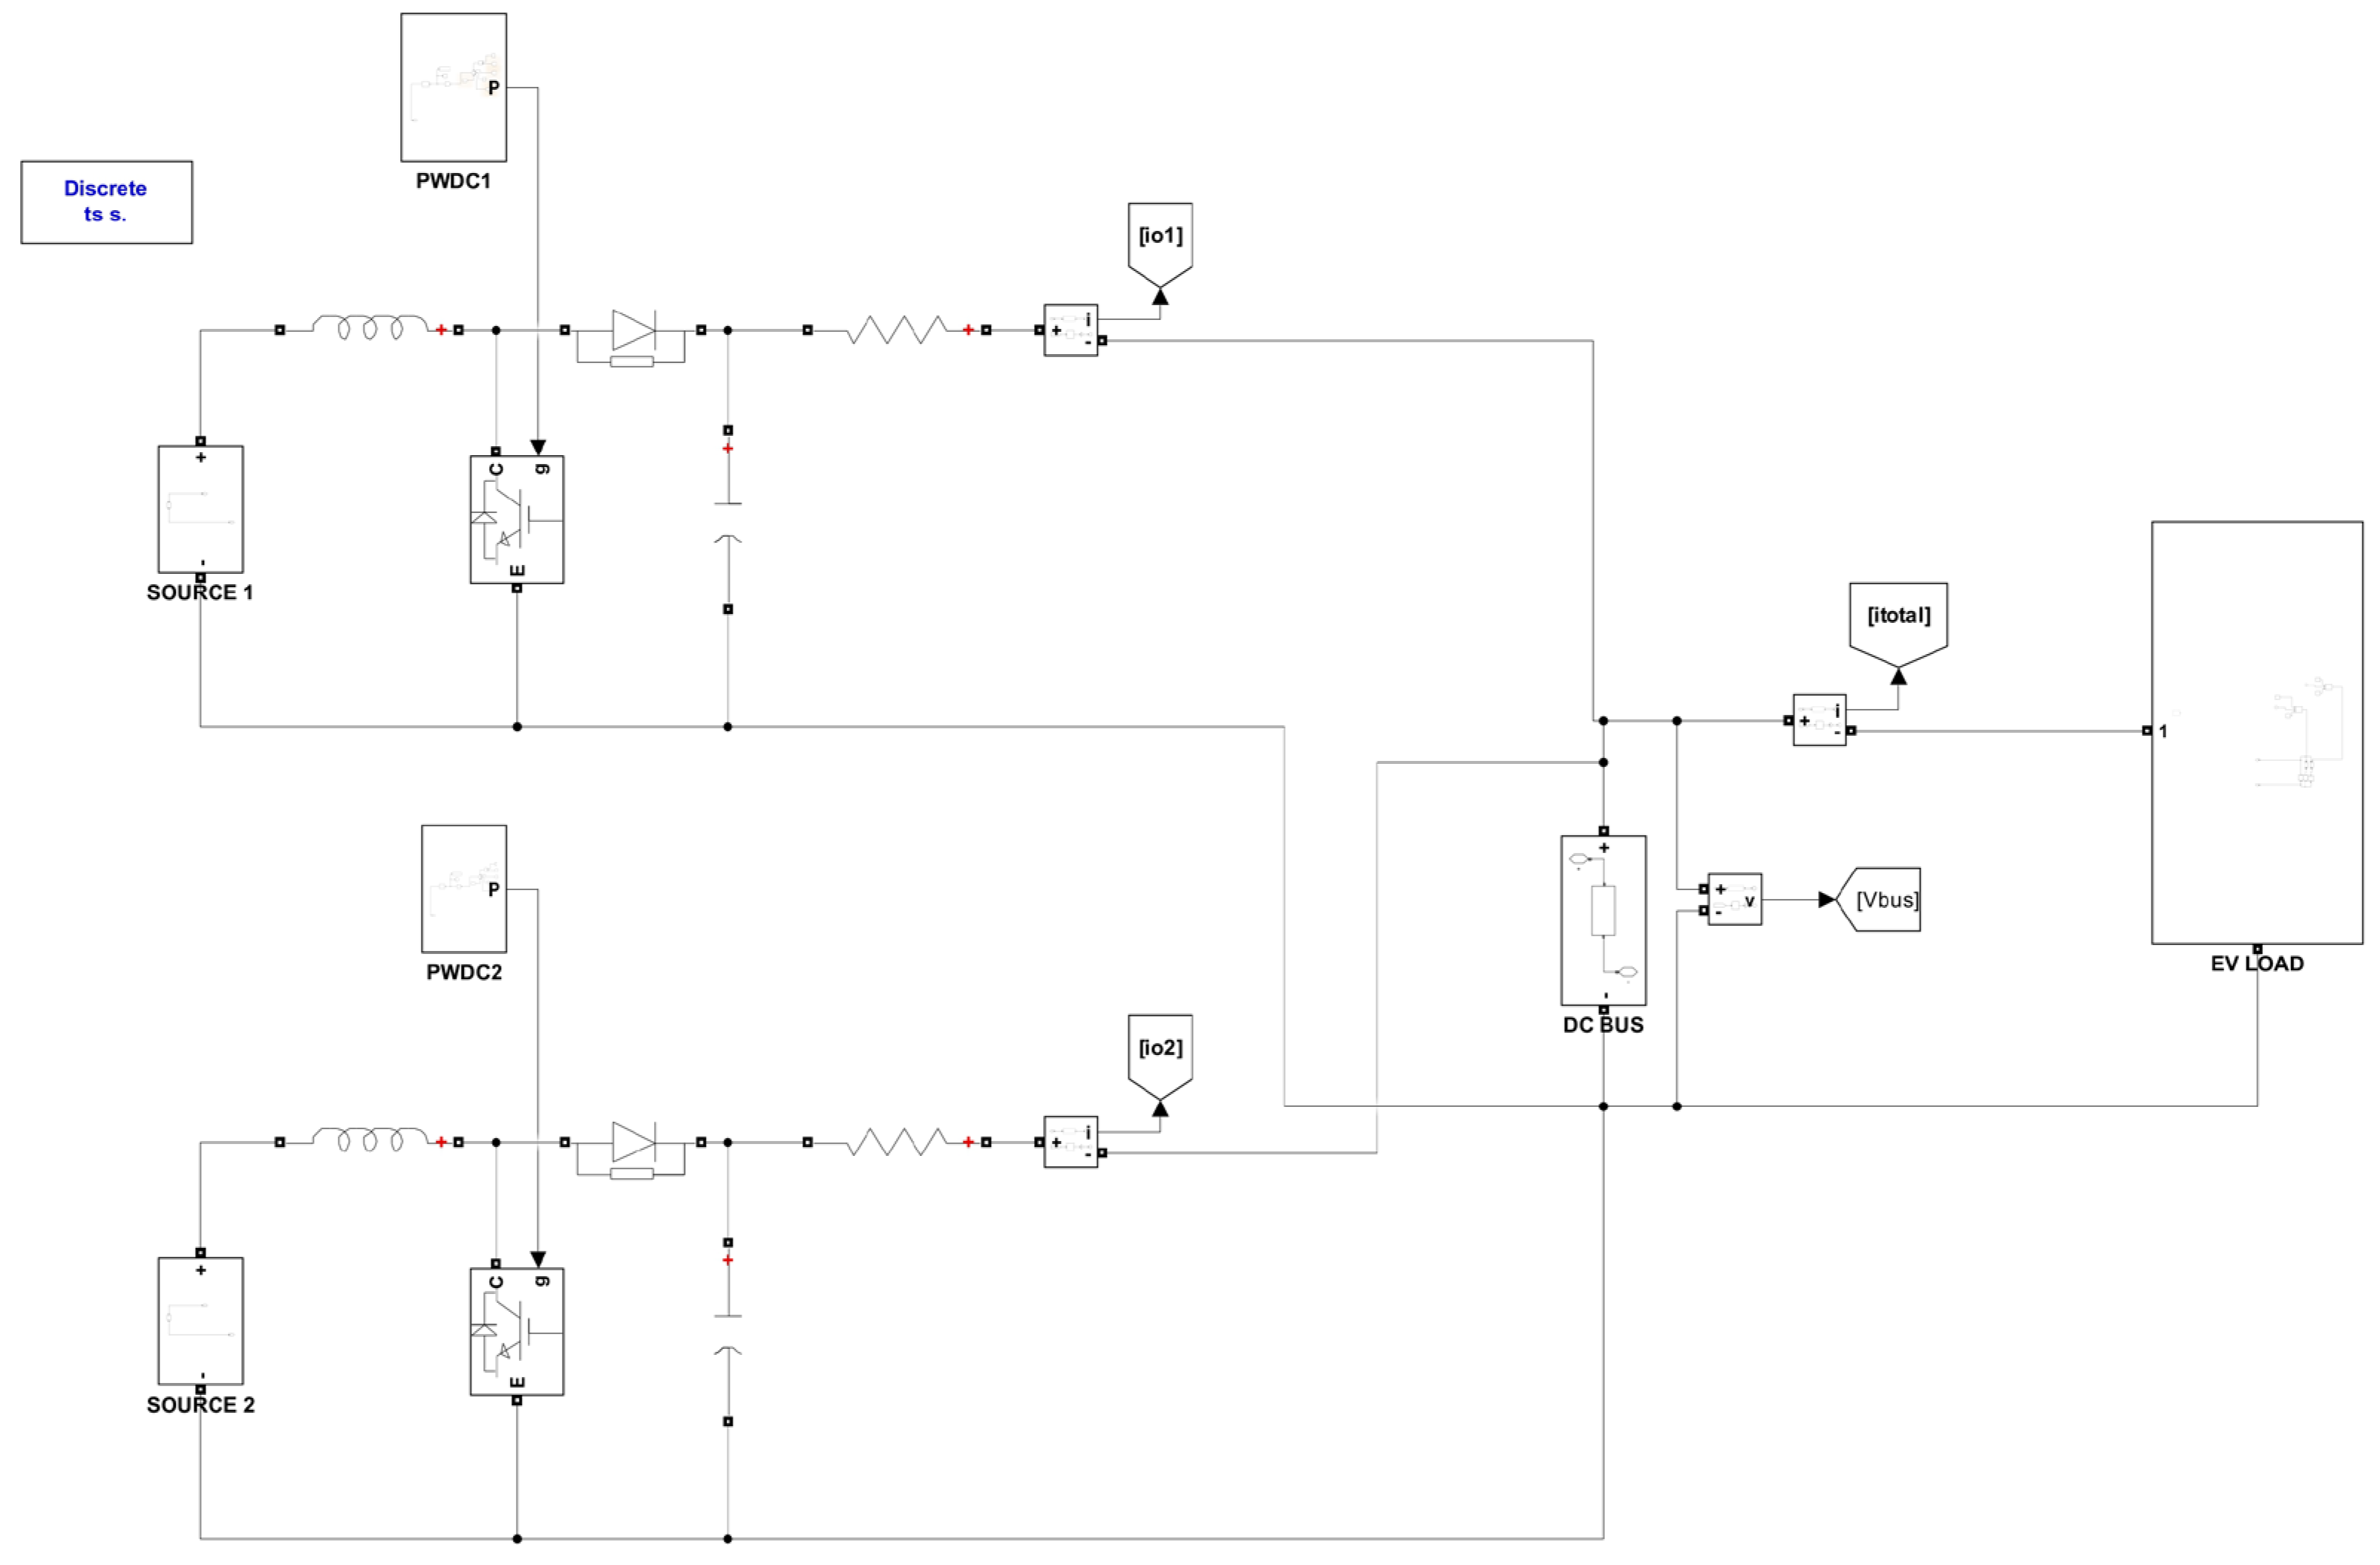
Figure A1.
Simulation block diagram of DC MG with two parallel converters ().
Figure A1.
Simulation block diagram of DC MG with two parallel converters ().
References
- Mounica, M.; Rajpathak, B.A.; Kolhe, M.L.; Naik, K.R.; Moparthi, J.R.; Kotha, S.K. Piece-Wise Droop Controller for Enhanced Stability in DC-Microgrid-Based Electric Vehicle Fast Charging Station. Processes 2024, 12, 892. [Google Scholar] [CrossRef]
- Shu, N.; Jiang, S.; Fan, Z.; Cao, X.; Zhang, Z. Energy management strategy of microgrid based on photovoltaic and energy storage system in construction area of Sichuan-Tibet Railway. Sci. Technol. Energy Transit. 2024, 79, 49. [Google Scholar] [CrossRef]
- Thogaru, R.B.; Mitra, A. Regulation of DC microgrid voltage using optimized droop index control-based high gain converters in the presence of static and dynamic loads. Electr. Eng. 2021, 104, 1649–1665. [Google Scholar] [CrossRef]
- Azibek, B.; Zhakiyev, N.; Kushekkaliyev, A.; Zhalgas, A.; Mukatov, B. Optimal Allocation of Storage Capacity in Distribution Network for Renewable Energy Expansion. Electr. Power Compon. Syst. 2023, 52, 1749–1762. [Google Scholar] [CrossRef]
- Aluisio, B.; Bruno, S.; De Bellis, L.; Dicorato, M.; Forte, G.; Trovato, M. DC-Microgrid operation planning for an electric vehicle supply infrastructure. Appl. Sci. 2019, 9, 2687. [Google Scholar] [CrossRef]
- Saponara, S.; Saletti, R.; Mihet-Popa, L. Recent trends in DC and hybrid microgrids: Opportunities from renewables sources, battery energy storages and bi-directional converters. Appl. Sci. 2020, 10, 4388. [Google Scholar] [CrossRef]
- Sousa, A.; Grasel, B.; Baptista, J. Stability Analysis of DC Microgrids: Insights for Enhancing Renewable Energy Integration, Efficiency and Power Quality. Appl. Sci. (2076-3417) 2024, 14, 11851. [Google Scholar] [CrossRef]
- Carrizosa, M.J.; Iovine, A.; Damm, G.; Alou, P. Droop-inspired nonlinear control of a DC microgrid for integration of electrical mobility providing ancillary services to the AC main grid. IEEE Trans. Smart Grid 2022, 13, 4113–4122. [Google Scholar] [CrossRef]
- Naik, K.R.; Rajpathak, B.; Mitra, A.; Kolhe, M. Renewable Energy Integrated DC Microgrid for EV Charging Station. In Proceedings of the 2021 IEEE Transportation Electrification Conference (ITEC-India), New Delhi, India, 16–19 December 2021; pp. 1–6. [Google Scholar]
- Espina, E.; Llanos, J.; Burgos-Mellado, C.; Cardenas-Dobson, R.; Martinez-Gomez, M.; Saez, D. Distributed control strategies for microgrids: An overview. IEEE Access 2020, 8, 193412–193448. [Google Scholar] [CrossRef]
- Naik, K.R.; Rajpathak, B.; Mitra, A.; Sadanala, C.; Kolhe, M.L. Power management scheme of DC micro-grid integrated with photovoltaic-Battery-Micro hydro power plant. J. Power Sources 2022, 525, 230988. [Google Scholar] [CrossRef]
- Abdelhady, S.; Shaban, A. A Simulation Modeling Approach for the Techno-Economic Analysis of the Integration of Electric Vehicle Charging Stations and Hybrid Renewable Energy Systems in Tourism Districts. Appl. Sci. 2024, 14, 4525. [Google Scholar] [CrossRef]
- Zentani, A.; Almaktoof, A.; Kahn, M.T. A comprehensive Review of developments in electric vehicles fast charging technology. Appl. Sci. 2024, 14, 4728. [Google Scholar] [CrossRef]
- Dragičević, T.; Lu, X.; Vasquez, J.C.; Guerrero, J.M. DC Microgrids–Part I: A review of control strategies and stabilization techniques. IEEE Trans. Power Electron. 2016, 31, 4876–4891. [Google Scholar]
- Al-Ismail, F.S. DC microgrid planning, operation, and control: A comprehensive review. IEEE Access 2021, 9, 36154–36172. [Google Scholar] [CrossRef]
- Augustine, S.; Mishra, M.K.; Lakshminarasamma, N. Adaptive droop control strategy for load sharing and circulating Current minimization in low-voltage standalone DC microgrid. IEEE Trans. Sustain. Energy 2015, 6, 132–141. [Google Scholar] [CrossRef]
- Nasir, M.; Iqbal, S.; Khan, H.A.; Vasquez, J.C.; Guerrero, J.M. Sustainable rural electrification through solar PV DC microgrids—An architecture-based assessment. Processes 2020, 8, 1417. [Google Scholar] [CrossRef]
- Saleh-Ahmadi, A.; Moattari, M.; Gahedi, A.; Pouresmaeil, E. Droop method development for microgrids control considering higher order sliding mode control approach and feeder impedance variation. Appl. Sci. 2021, 11, 967. [Google Scholar] [CrossRef]
- Zhang, Y.; Qu, X.; Tang, M.; Yao, R.; Chen, W. Design of nonlinear droop control in DC microgrid for desired voltage regulation and current sharing accuracy. IEEE J. Emerg. Sel. Top. Circuits Syst. 2021, 11, 168–175. [Google Scholar] [CrossRef]
- Mahmud, M.A.; Pota, H.R.; Hossain, M.J. Nonlinear current control scheme for a single-phase grid-connected photovoltaic system. IEEE Trans. Sustain. Energy 2013, 5, 218–227. [Google Scholar] [CrossRef]
- Chen, F.; Burgos, R.; Boroyevich, D.; Vasquez, J.C.; Guerrero, J.M. Investigation of nonlinear droop control in DC power distribution systems: Load sharing, voltage regulation, efficiency, and stability. IEEE Trans. Power Electron. 2019, 34, 9404–9421. [Google Scholar] [CrossRef]
- Shi, M.; Chen, X.; Zhou, J.; Chen, Y.; Wen, J.; He, H. Advanced secondary voltage recovery control for multiple HESSs in a droop-controlled DC microgrid. IEEE Trans. Smart Grid 2018, 10, 3828–3839. [Google Scholar] [CrossRef]
- Bharatee, A.; Ray, P.K.; Puhan, P.S. Implementation of Improved Mixed Droop Technique With Sliding-Mode Control for Active Power Distribution in a Grid-Interactive Microgrid. IEEE Trans. Ind. Inform. 2024, 20, 10750–10760. [Google Scholar] [CrossRef]
- Yang, C.; Gao, F.; Zhang, B. An improved nonlinear droop control strategy in DC microgrids. IEEE Trans. Power Electron. 2024, 39, 5058–5073. [Google Scholar] [CrossRef]
- Nakka, P.C.; Mishra, M.K. Droop characteristics based damping and inertia emulation of DC link in a hybrid microgrid. IET Renew. Power Gener. 2020, 14, 1044–1052. [Google Scholar] [CrossRef]
- Lu, X.; Guerrero, J.M.; Sun, K.; Vasquez, J.C. An improved droop control method for DC microgrids based on low bandwidth communication with DC bus voltage restoration and enhanced current sharing accuracy. IEEE Trans. Power Electron. 2013, 29, 1800–1812. [Google Scholar] [CrossRef]
- Hailu, T.; Ferreira, J.A. Piece-wise linear droop control for load sharing in low voltage DC distribution grid. In Proceedings of the 2017 IEEE Southern Power Electronics Conference (SPEC), Puerto Varas, Chile, 4–7 December 2017; pp. 1–6. [Google Scholar]
- D’Arco, S.; Suul, J.A. Generalized implementations of piecewise linear control characteristics for multiterminal hvdc. In Proceedings of the 2014 International Symposium on Power Electronics, Electrical Drives, Automation and Motion, Ischia, Italy, 18–20 June 2014; pp. 66–72. [Google Scholar]
- Zhao, P.; Liu, Z.; Liu, J. An adaptive discrete piecewise droop control in dc microgrids. IEEE Trans. Smart Grid 2023, 15, 1271–1288. [Google Scholar] [CrossRef]
- Lin, Y.; Xiao, W. Novel piecewise linear formation of droop strategy for DC microgrid. IEEE Trans. Smart Grid 2019, 10, 6747–6755. [Google Scholar] [CrossRef]
- Linh, T.T.H.; Nguyen, T.T.; Pham, D.M.; Dat, N.T.; Le, A.N.; Pham, T.D.Q. Load profile-based fine-tuning of piecewise droop control for enhanced DC microgrid performance. In Proceedings of the 2023 International Symposium on Electrical and Electronics Engineering (ISEE), Ho Chi Minh, Vietnam, 19–20 October 2023; pp. 150–155. [Google Scholar]
Disclaimer/Publisher’s Note: The statements, opinions and data contained in all publications are solely those of the individual author(s) and contributor(s) and not of MDPI and/or the editor(s). MDPI and/or the editor(s) disclaim responsibility for any injury to people or property resulting from any ideas, methods, instructions or products referred to in the content. |
© 2025 by the authors. Licensee MDPI, Basel, Switzerland. This article is an open access article distributed under the terms and conditions of the Creative Commons Attribution (CC BY) license (https://creativecommons.org/licenses/by/4.0/).