Article

Fracture System Characteristics and Their Control on Permeability Anisotropy in Bright and Dull Coal

1
China United Coalbed Methane National Engineering Research Center Co., Ltd., Beijing 100095, China
2
PetroChina Coalbed Methane Company Limited, Beijing 100028, China
3
Key Laboratory of Coalbed Methane Resources and Reservoir Formation Process, Ministry of Education, China University of Mining and Technology, Xuzhou 221008, China
*
Author to whom correspondence should be addressed.
Processes 2025, 13(5), 1509; https://doi.org/10.3390/pr13051509
Submission received: 23 March 2025 / Revised: 25 April 2025 / Accepted: 6 May 2025 / Published: 14 May 2025

Abstract

:
Coal permeability, a key parameter influencing coalbed methane production and geological storage, is strongly governed by the dual-porosity nature of coal and the stress-dependent evolution of its fracture network. This study investigates the development characteristics of filled and unfilled fractures, and the resulting permeability anisotropy, in typical bright and dull coals from the deep 8# coal seam of the Ordos Basin. Utilizing CT scanning and permeability anisotropy testing, we analyze how fracture development impacts coal permeability and its evolution under stress. Bright coal exhibits a grid-like distribution of mineral-filled fractures with good vertical connectivity, and a complex network of unfilled fractures. In contrast, dull coal displays a scattered distribution of mineral-filled fractures with poor vertical connectivity and a limited number of unfilled fractures. Results indicate an exponential decay trend in permeability with increasing confining pressure, strongly correlated with fracture system development. Permeability also demonstrates significant heterogeneity (face cleat > butt cleat > vertical). Bright coal exhibits a greater permeability decay rate than dull coal, indicating heightened stress sensitivity, while its permeability anisotropy is weaker, aligning with the observed fracture development patterns.

1. Introduction

China’s coalbed methane (CBM) resources are widely distributed, abundant, and have significant development potential. A preliminary assessment indicates that the CBM resources at a depth of 2000 m in China total 40.71 × 10¹² m3 [1], with 18.47 × 10¹² m3 found at depths between 2000 and 3000 m. Since 2019, PetroChina CBM Co., Ltd. has achieved a major breakthrough in deep CBM exploration within the 2000 m deep area of the Daning–Jixian block on the eastern margin of the Ordos Basin, where Well X1 produced an impressive 101,000 cubic meters of industrial gas per day [2]. This has led to the identification of China’s first deep CBM field exceeding 100 billion cubic meters, demonstrating the substantial potential for large-scale and efficient development of deep coalbed methane in the country.
The permeability of coal is a critical parameter that controls the production of coalbed methane, as it determines the ease with which gas flows from the reservoir to the production well [3]. Coal acts as a dual-porosity medium composed of fractures and matrix pores [4]. The forms of gas occurrence in coal primarily include adsorbed gas and free gas, with gas flow being influenced by the pore and fracture network structure within the coal [5]. During coalbed methane extraction, gas migration occurs through desorption, diffusion, and permeation. As extraction depth increases, temperature and pore pressure rise continuously, making their effects on coalbed gas migration increasingly pronounced. Therefore, conducting experiments on permeability under the effect of effective stress and studying related characteristics are crucial for enhancing coalbed gas exploration and development.
The characterization methods for fractures in coal seams can be classified into two categories [6,7]: observational description methods and physical experimental testing methods. Currently, the most commonly used observational methods include macroscopic and microscopic observation. Macroscopic observation involves visual assessment with the naked eye, while microscopic observation is conducted using optical electron microscopes. The predominant physical experimental testing methods include scanning electron microscopy (SEM) and computerized tomography scanning (X-CT scanning) [8,9]. These methods allow for the measurement of various parameters, including the com-position, structural types, and fracture types of coal, as well as the orientation, dip angle, length, and width of fractures in coal samples.
The permeability of coal reservoirs exhibits behavior similar to that of other fractured reservoirs concerning effective stress, demonstrating an exponential decrease as effective stress increases [10,11,12,13]. Evaluating the permeability of coal seams necessitates a detailed understanding of the primary and secondary fracture networks and their associated properties, such as aperture, length, and spacing [14,15,16]. Results from in situ X-ray tomography indicate that large fractures are rapidly compressed and isolated into smaller ones, leading to a significant reduction in porosity. As stress increases, the contact area of the fractures enlarges, resulting in decreased compressibility, which exhibits both exponential and linear trends [17]. Generally, two methods are employed to describe and simulate natural fracture networks [18]. The continuum approach assumes a representative volume element, where the effects of individual fractures are averaged [19,20,21]. Conversely, the Discrete Fracture Network (DFN) explicitly represents the geometric shapes and properties of discontinuous surfaces within the reservoir. The DFN model acknowledges that a finite number of discrete fractures are critical components of fluid flow in the rock at each scale, particularly for fractures with low matrix permeability [22].
Although numerous experimental and modeling studies have addressed coal permeability evolution, both internationally and within China, a critical gap persists: a systematic analysis of fracture development characteristics—specifically as controlled by different macroscopic coal lithotypes—and its integration into permeability model construction.

2. Experimental Method

The sample preparation and experimental techniques are described in the following sections.

2.1. Sample Information

The bright and dull coal samples used in the experiment were obtained by cutting from the core samples retrieved from a coalbed methane well, characterized by a burial depth of approximately 2278 m and a maximum vitrinite reflectance (Ro,max) of 2.50%, was sourced from the No. 8 coal seam of the carboniferous system within the Ordos Basin. There was an interval of one and a half months between the completion of core retrieval and the subsequent sample cutting and experimental investigation. During this period, the sample was preserved through multiple layers of plastic wrap and tin foil packaging for protection. The fundamental information was obtained through X-ray CT imaging. The proximate analysis results are shown in Table 1. A linear cutting machine processed borehole samples into cuboid coal samples measuring 2.5 × 2.5 × 2.5 cm3 to study the development characteristics of permeability anisotropy in deep coal samples, as shown in Figure 1.
Based on the development characteristics of macroscopic coal and rock types, two typical varieties—bright coal (Figure 2a) and dull coal (Figure 2b)—were selected for sample processing. The cube sample was divided into three orientations: horizontal direction 1, horizontal direction 2, and vertical direction 3, and permeability experiments were conducted in each direction, respectively.

2.2. Experimental Conditions

The gas phase permeability test was conducted after vacuum drying for 48 h at 85 °C. To analyze the permeability stress sensitivity of coal samples from the study area, the corresponding stress was applied based on geological data collected in the region, and the permeability test was performed using helium gas.

2.3. Experimental Setup

In this experiment, an unconventional natural gas rock-gas multi-process coupling test system was utilized, as illustrated in Figure 3. The experimental setup primarily consists of four components [23]: a core holder, air pressure control, a high-precision confining pressure control system, and a data acquisition system (Table 2, Figure 4). The sample’s seepage response can be dynamically tested, with relevant data automatically collected under triaxial stress conditions. The equipment was tested for airtightness before the experiment (Figure 5).

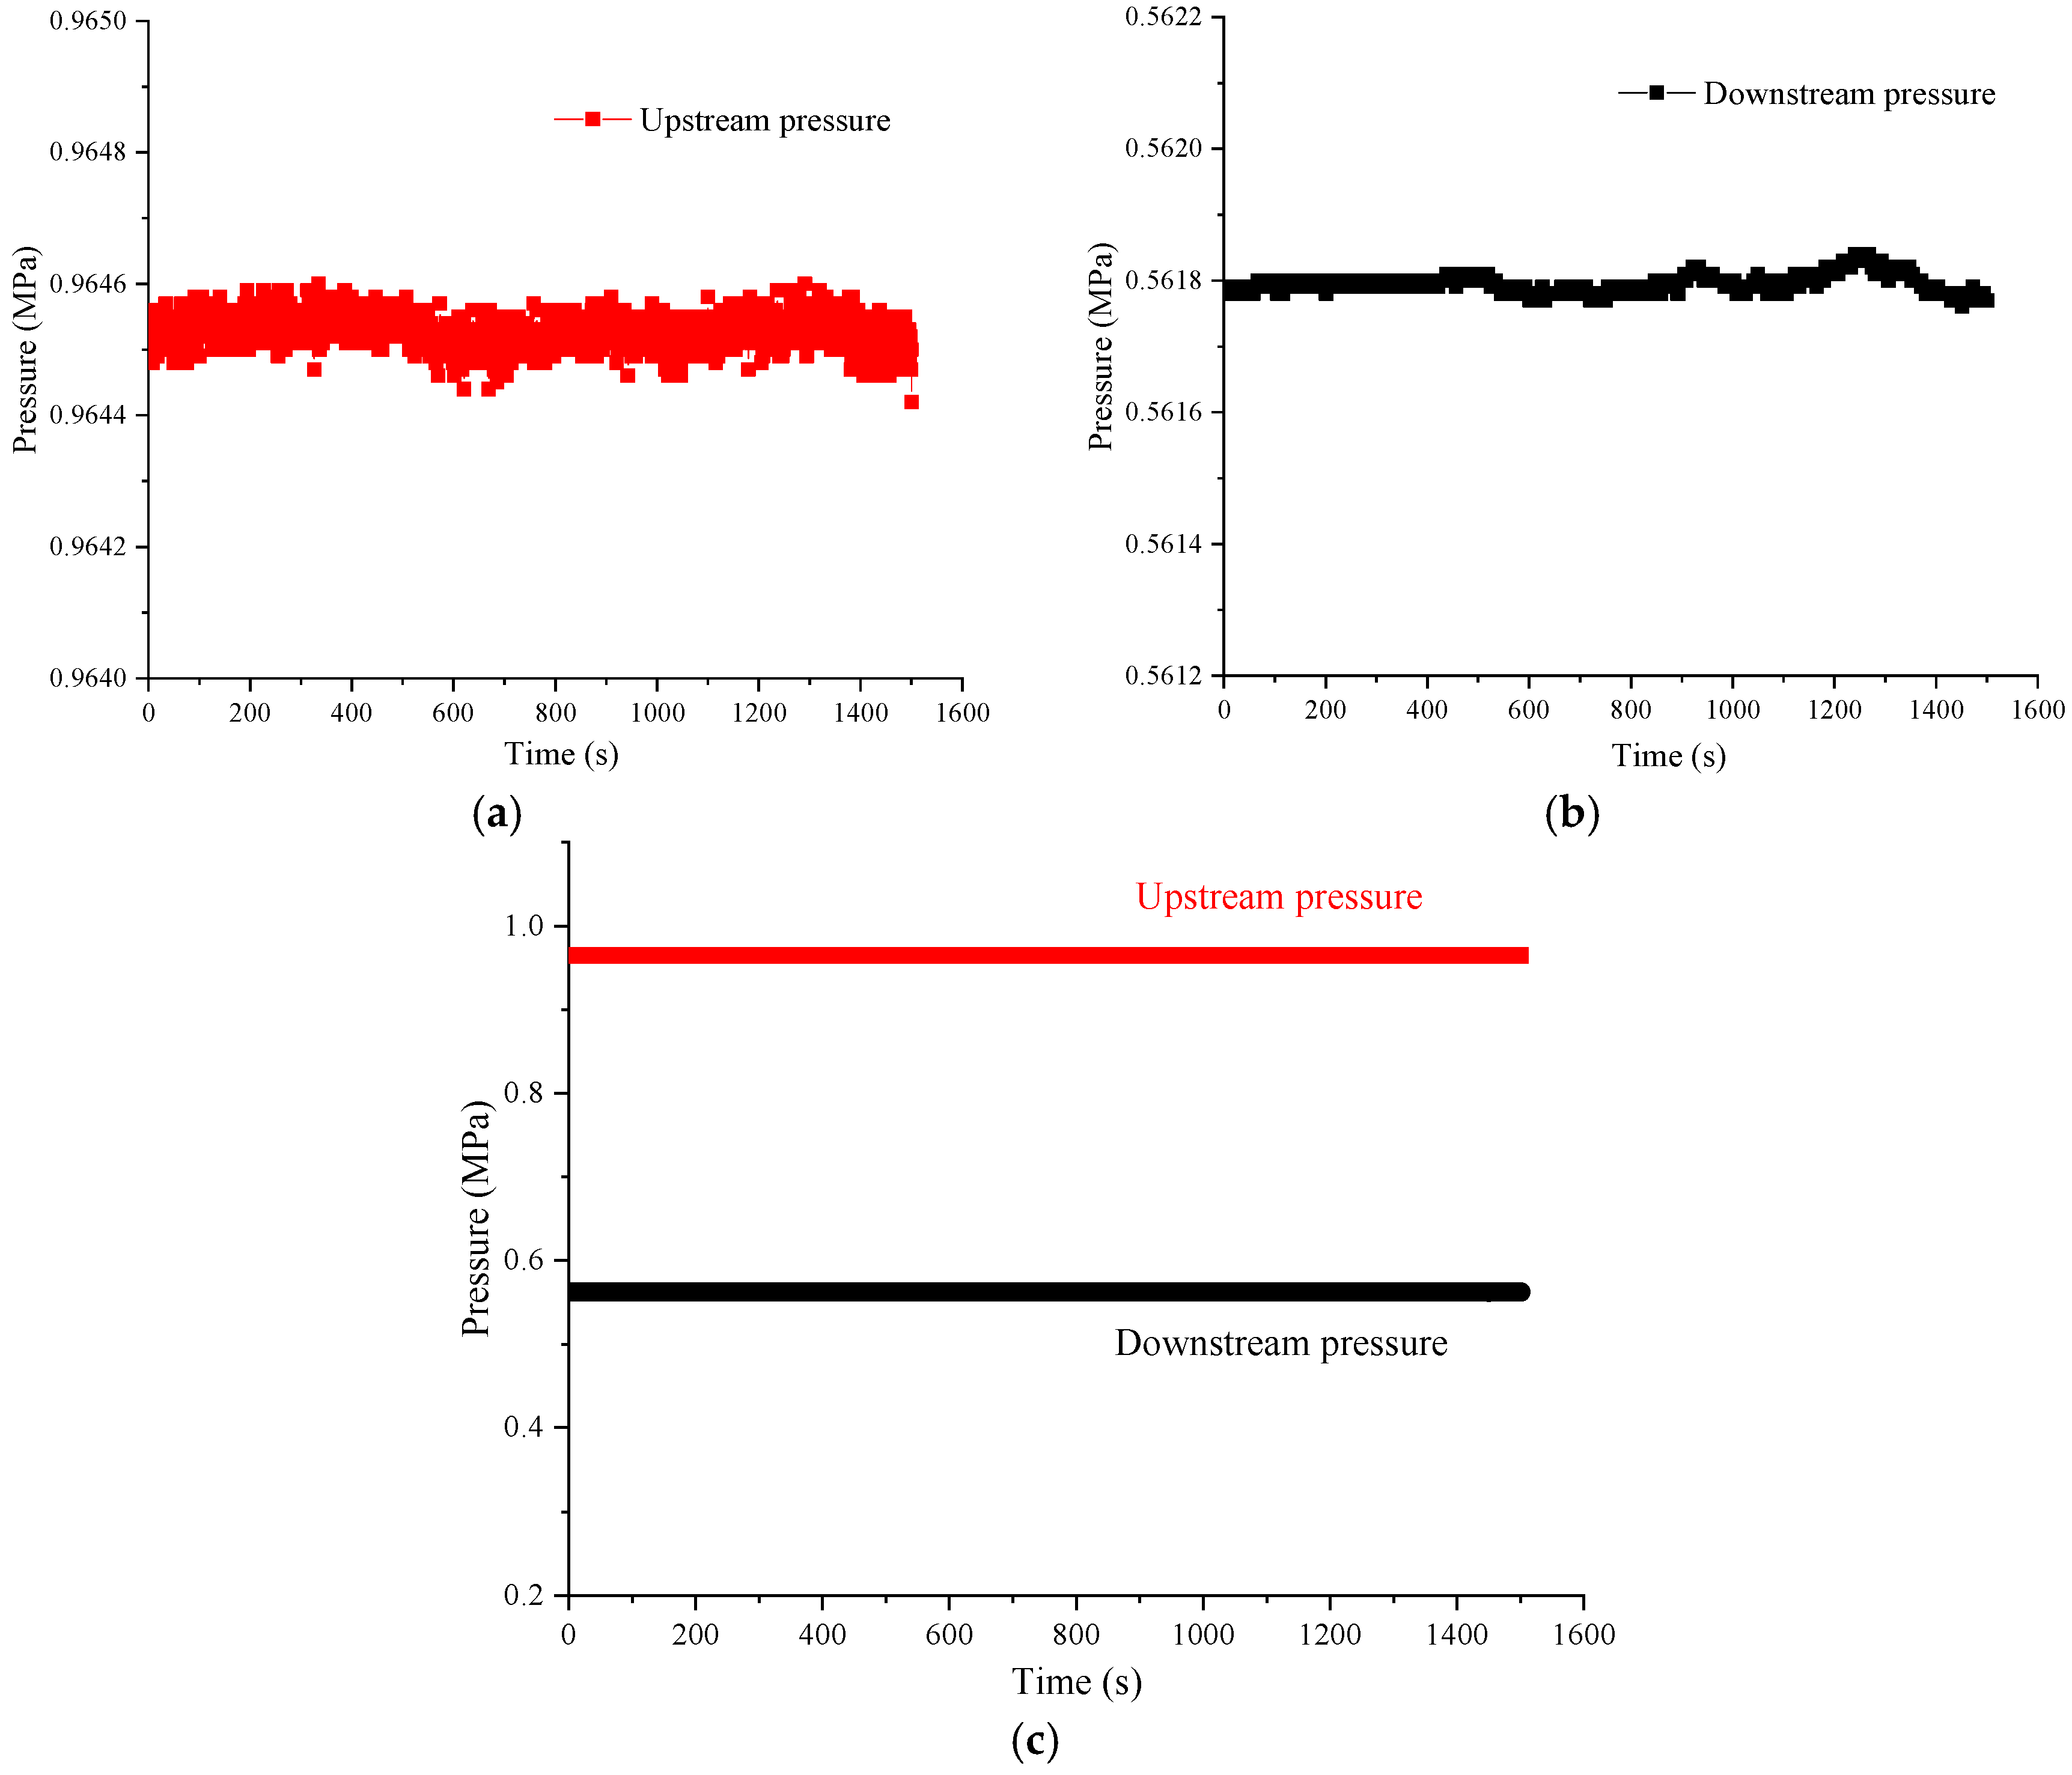
2.4. Permeability Calculation Method

In this study, the experimental gas permeability measurement methods include both steady-state and transient methods [24]. For the steady-state method, the permeability of the coal sample to gas was calculated based on the stable flow rate [25]. In contrast, the pressure transient method calculates permeability using the recorded changes in upstream and downstream pressure differences.

3. Experimental Results

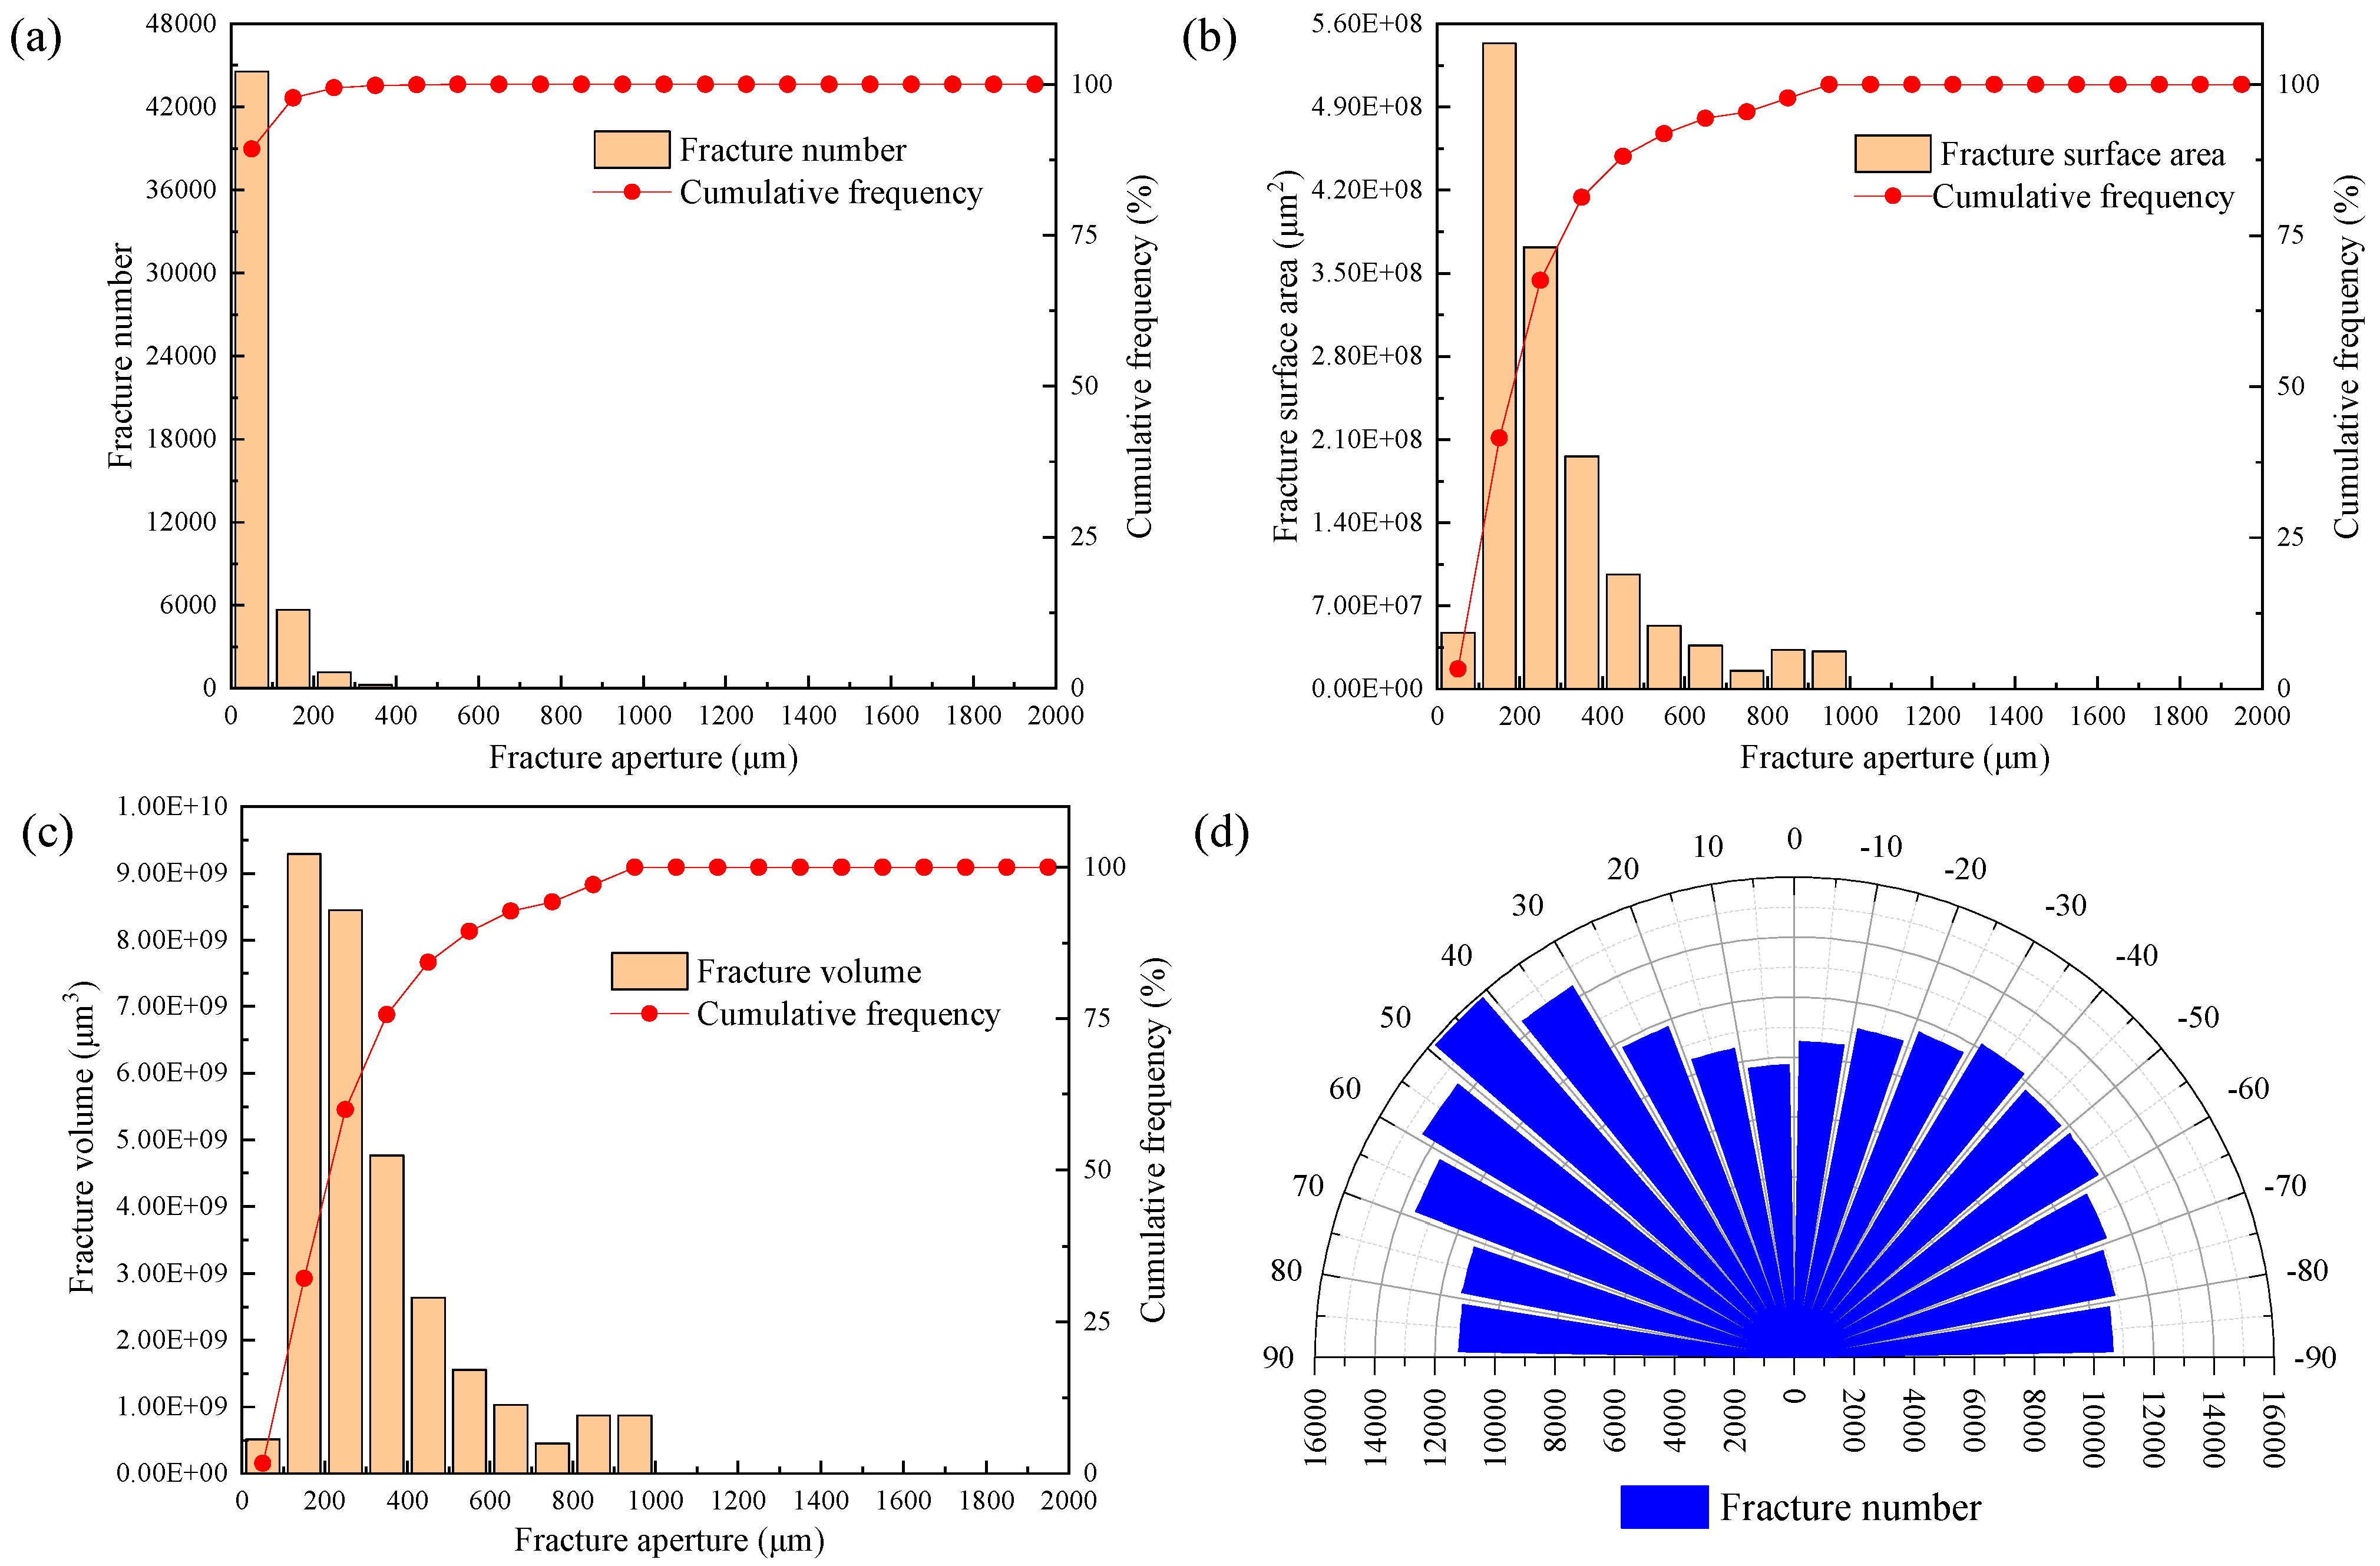
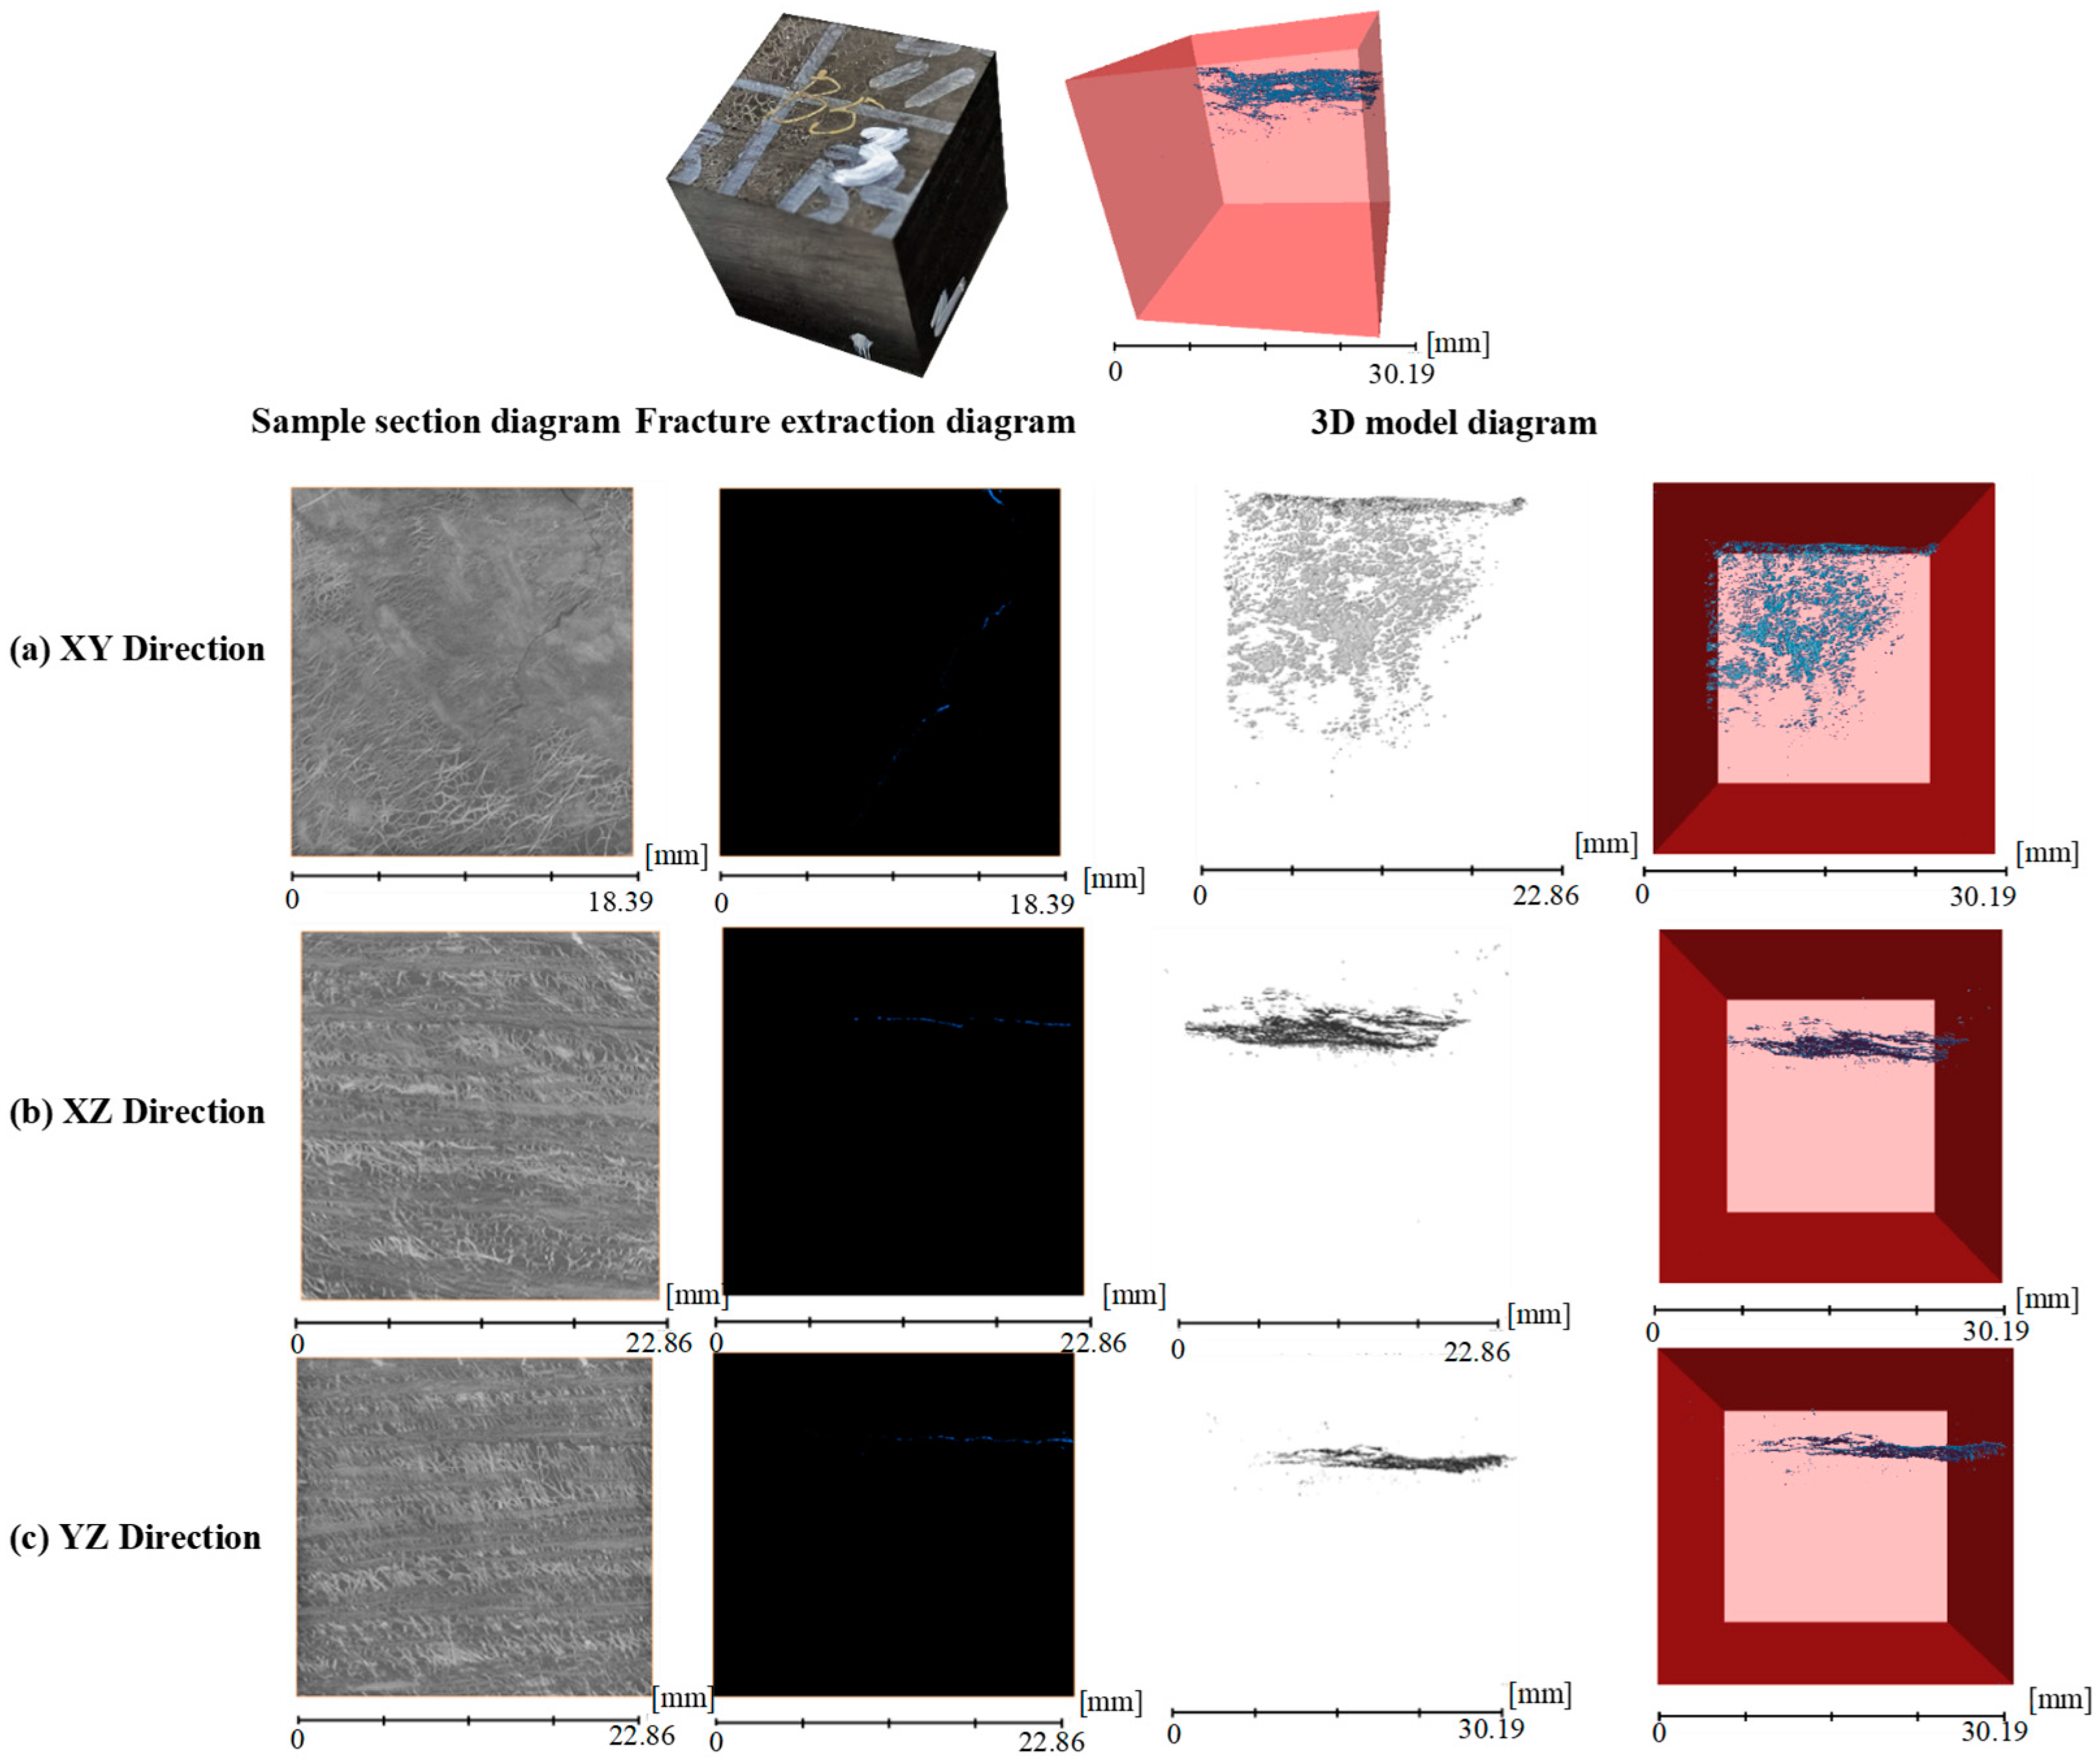
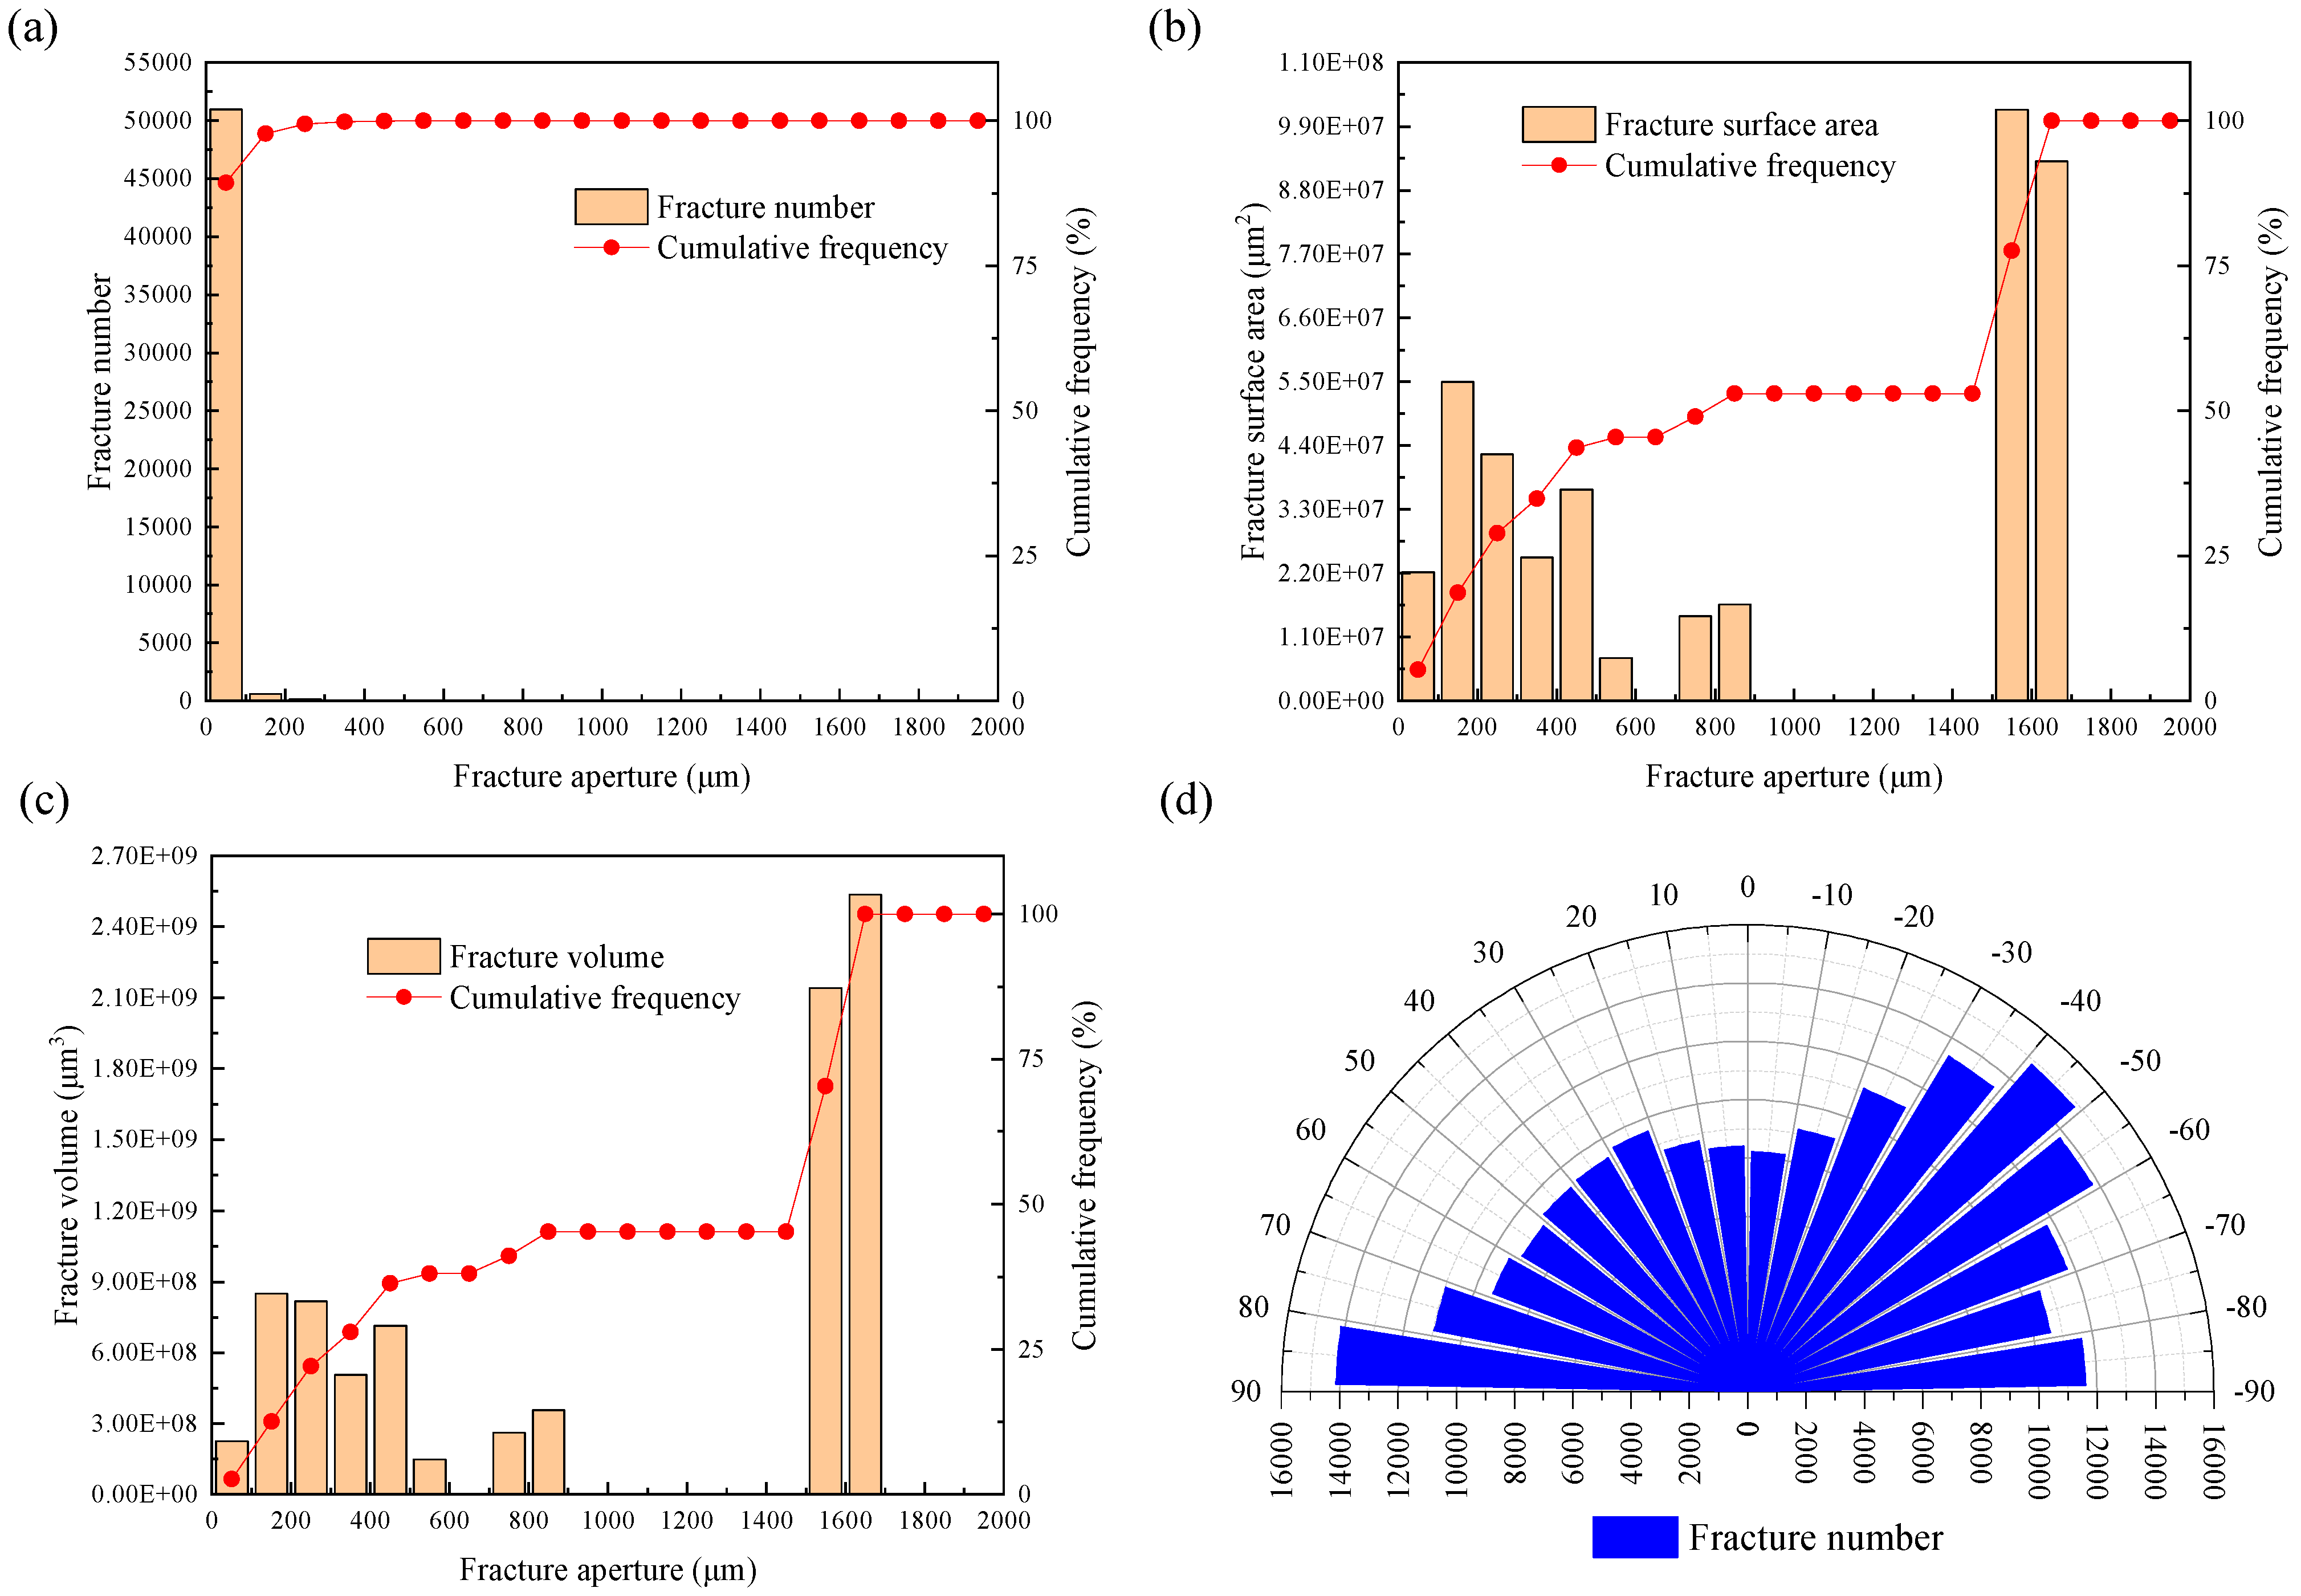
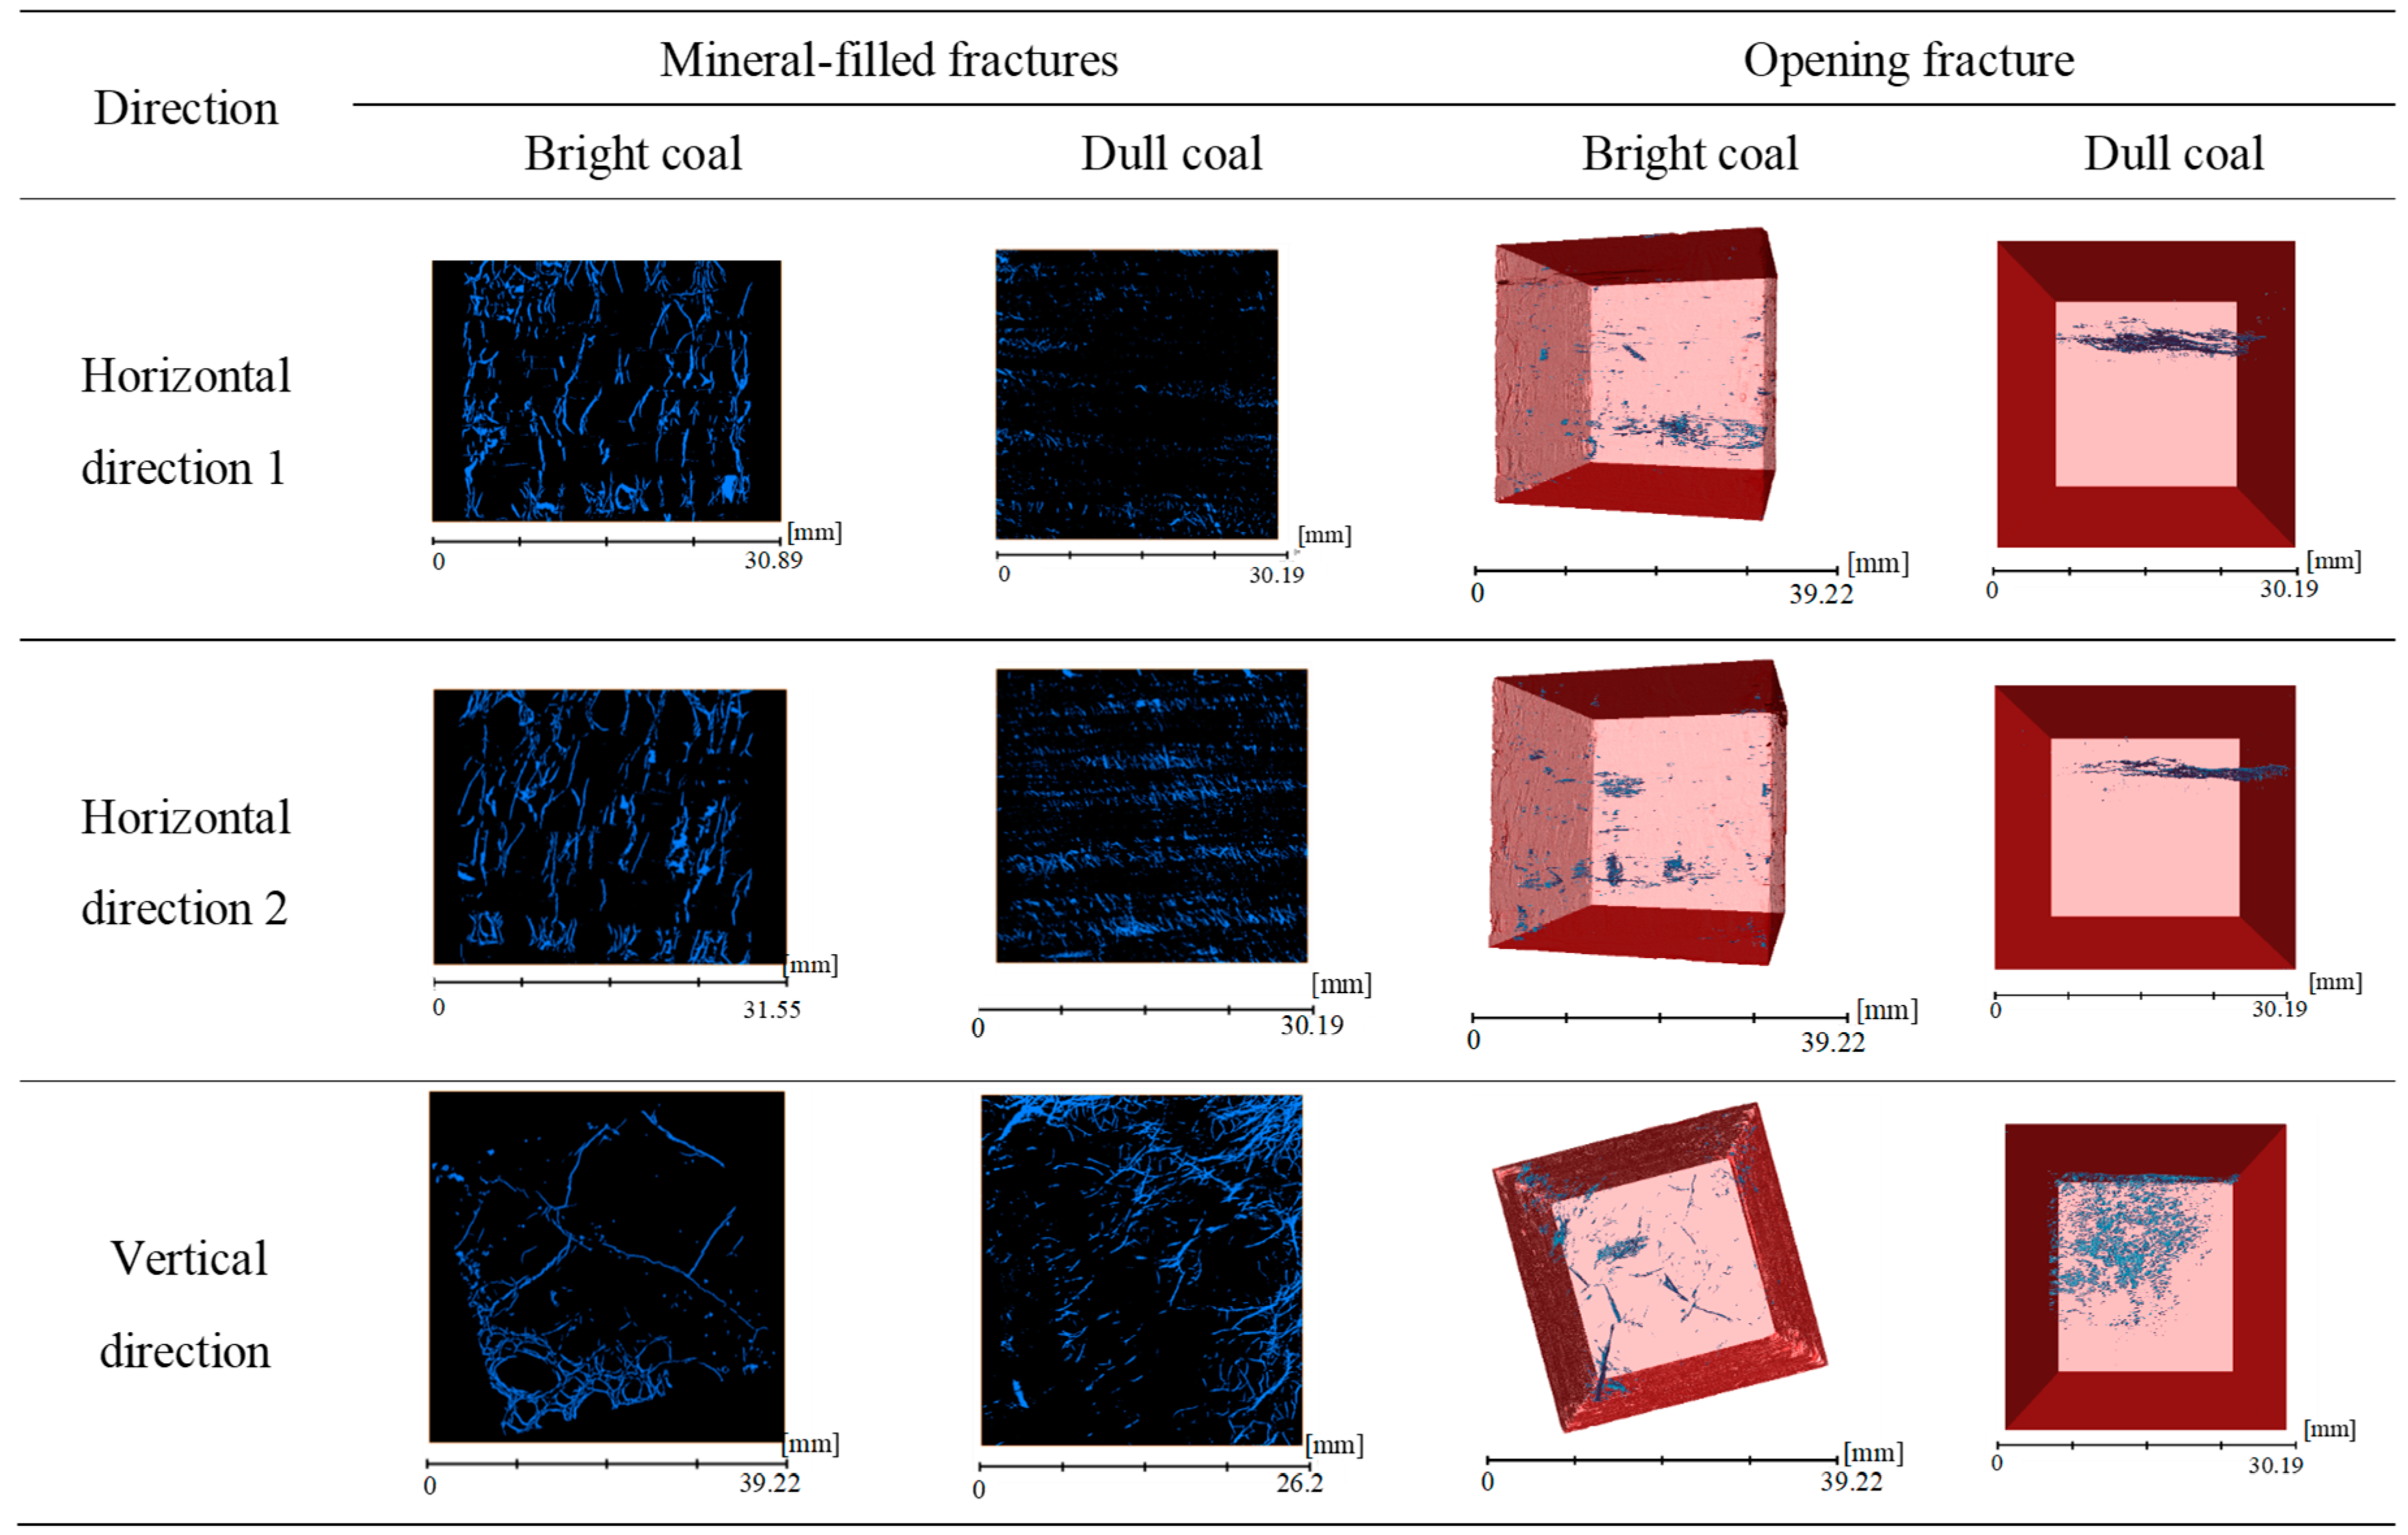
3.1. CT Scan Results of the Fracture System of the Sample

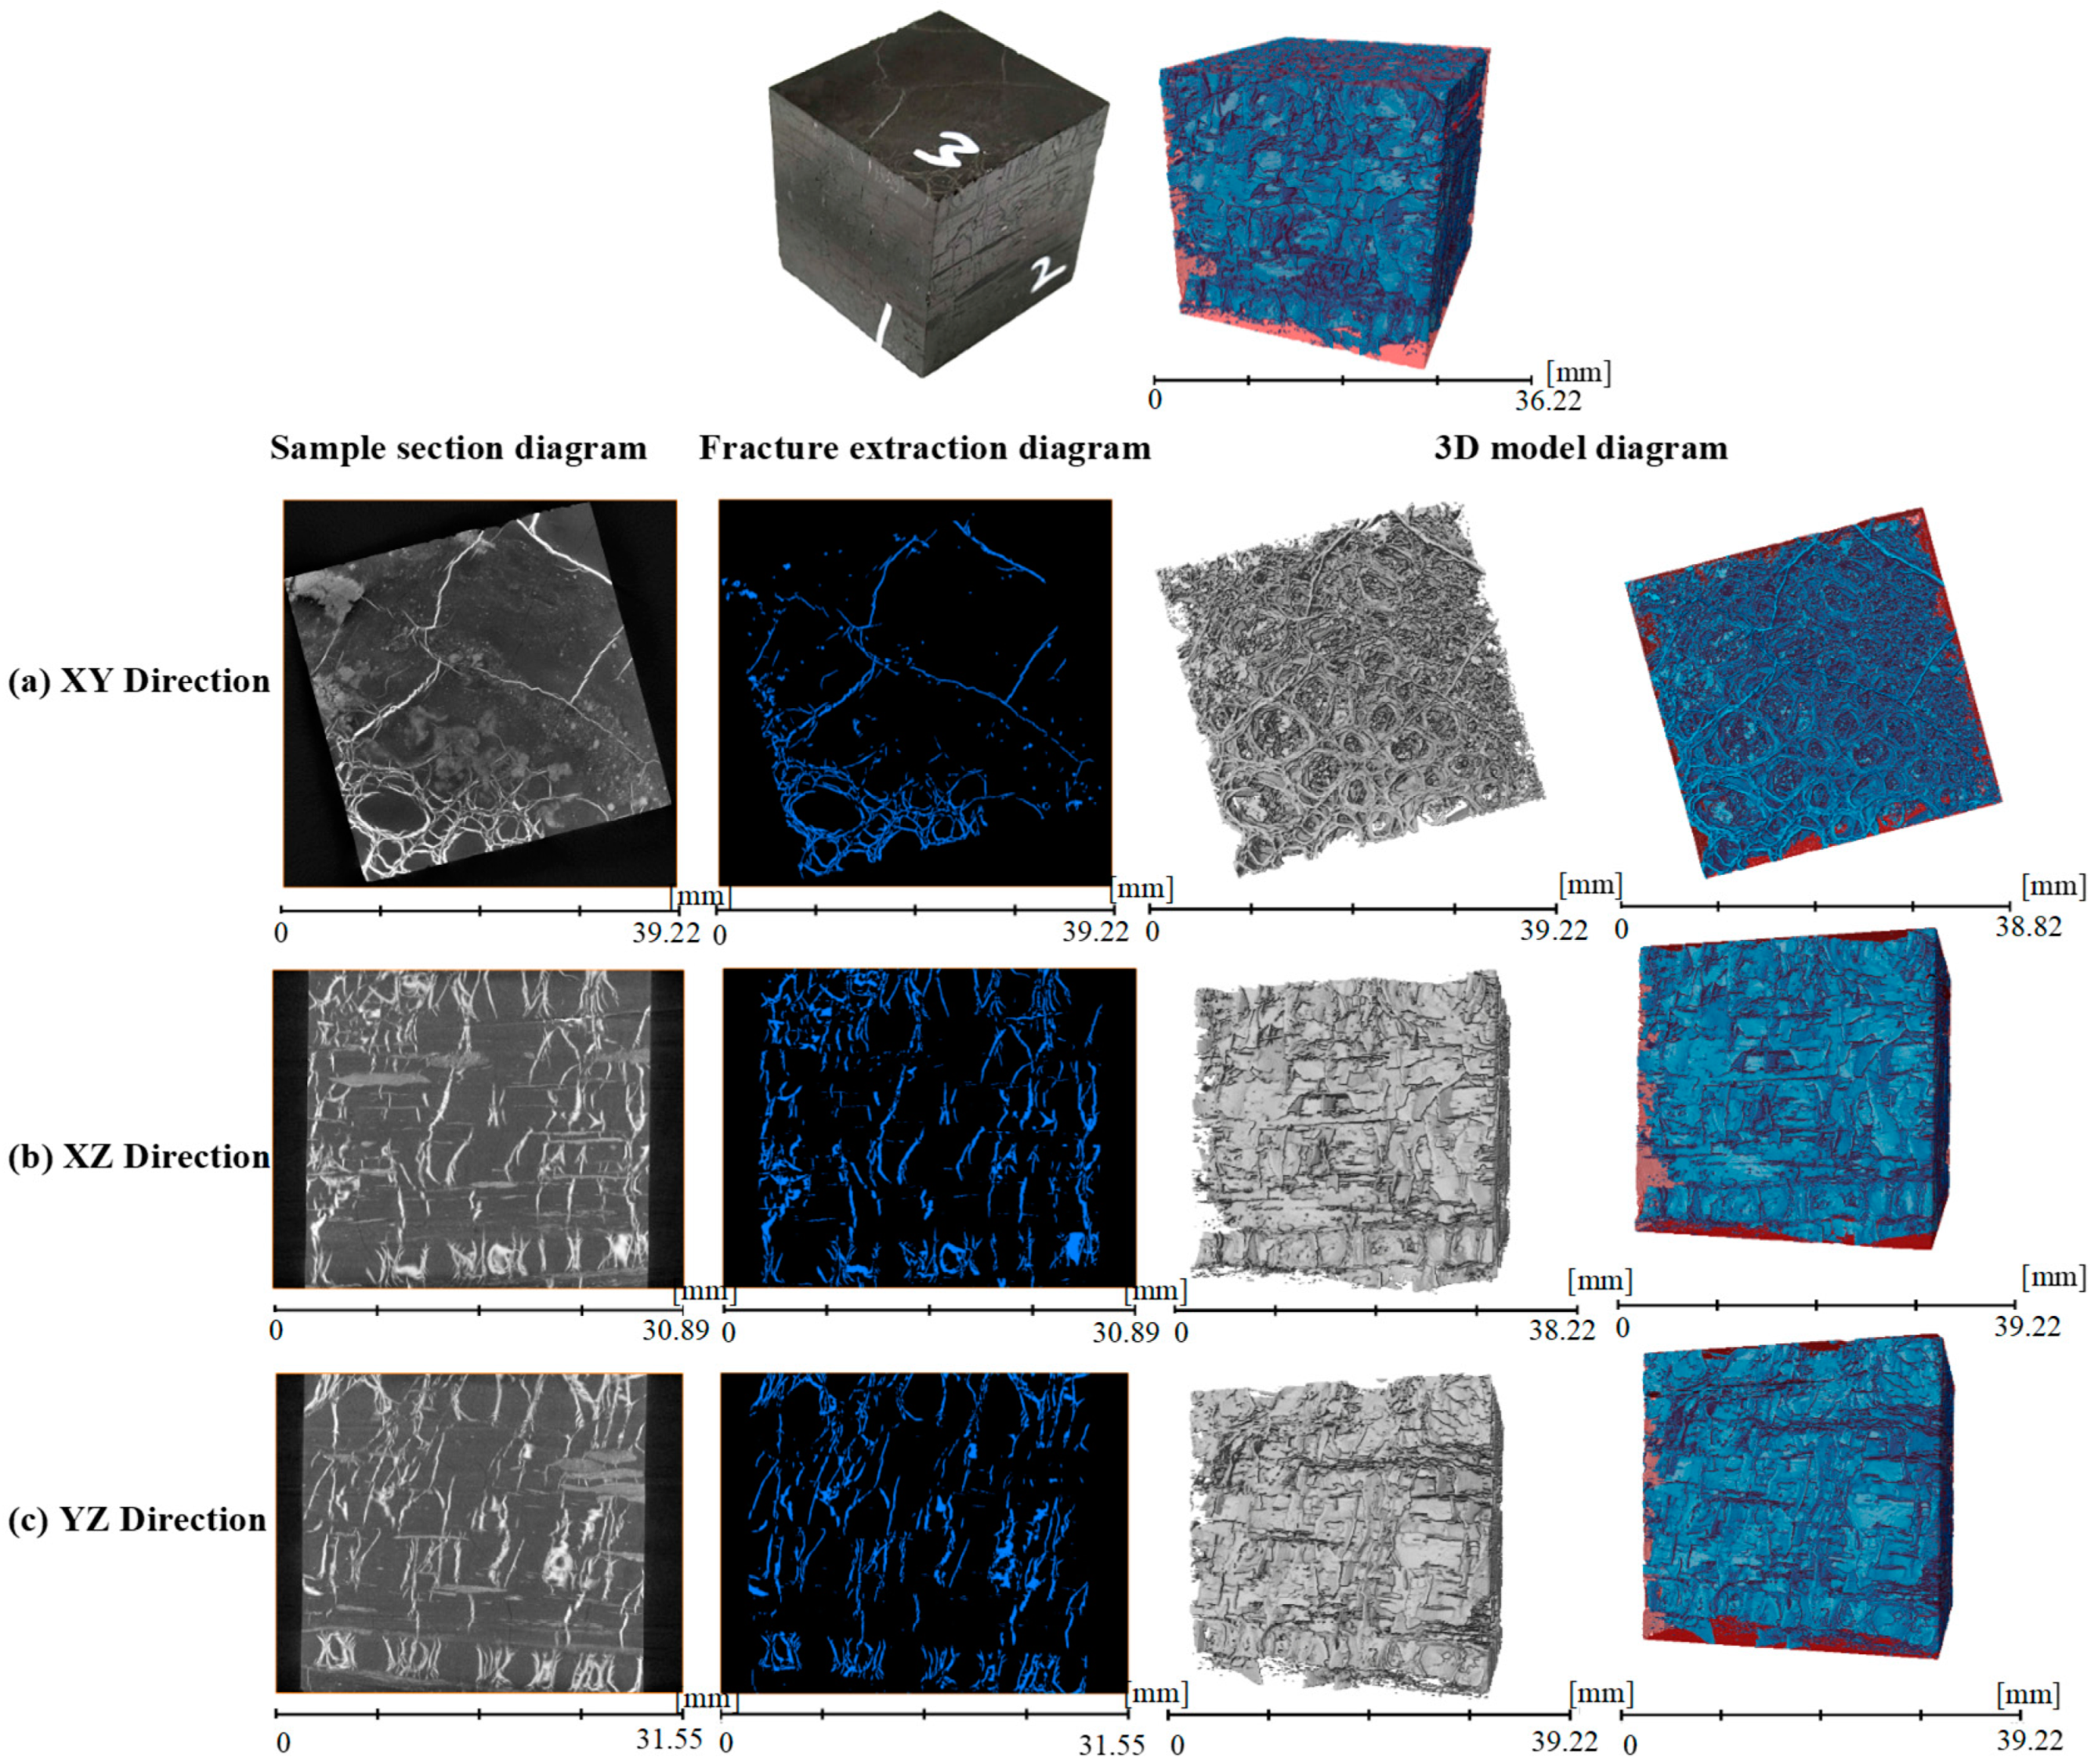
3.1.1. CT Scan Results of Bright Coal

(1) Filled fracture
The mineral-filled fractures of the bright coal sample exhibit a fine mesh distribution in the horizontal direction (which is consistent with the horizontal plane of the coal seam as it exists underground), with circular pores present between the meshes (Figure 6). In the vertical direction, the fractures appear more continuous, although a small number of layered phenomena are still observed. The mineral-filled fractures are distributed throughout the entire spatial range of the sample, indicating a broad distribution. After screening and cutting, the effective volume of the sample is determined to be 14,683.6 mm3, the volume of filled fractures is 1840.6 mm3, and the porosity of these filled fractures is 12.5%.
For coal reservoirs, the fracture aperture typically does not exceed 2000 μm. Consequently, during processing, it is assumed that portions with apertures greater than 2000 μm are removed, leading to the distribution of mineral-filled fractures, fracture volume, fracture surface area, and fracture angle distribution in the bright coal sample, as illustrated in Figure 7. The majority of fractures in the bright coal sample are concentrated in the size range of less than 400 μm. Fractures smaller than 400 μm contribute most significantly to both fracture volume and surface area. Few fractures develop between 400 μm and 1000 μm, and there are almost no fractures with apertures exceeding 1000 μm. The distribution of fracture angles is relatively uniform, although a distinct peak is observed between 30° and 70°.
(2) Opening fracture
The scanning results are presented in Figure 8. It can be observed that the opened fractures in the bright coal sample are not interlaced in the horizontal direction and are primarily concentrated in the lower part of the sample in the vertical direction, exhibiting a relatively narrow distribution. The content of opened fractures is extremely low. After screening and cutting, the effective volume of the sample is determined to be 14,683.6 mm3, the volume of opened fractures is 4.73 mm3, and the porosity of the opened fractures is 0.0322%.
Given the typical limitation of fracture apertures in coal reservoirs to values below 2000 μm, we applied a data-processing constraint, effectively removing features exceeding this aperture threshold. This resulted in the fracture characterization for the bright coal sample D2, specifically the distribution of open fractures, fracture volume, fracture surface area, and fracture angle distribution, as depicted in Figure 9. It can be observed that the majority of fractures in the bright coal D2 sample are concentrated in the portion smaller than 200 μm. While there are very few fractures larger than 200 μm, there are significant volumes and surface areas associated with fractures between 200 μm and 900 μm. Although numerous fractures exist within the range of less than 200 μm, their contributions to volume and surface area are relatively small, indicating the presence of a prominent long fracture between 200 μm and 900 μm. The distribution of fracture angles is relatively uniform, primarily ranging between −30° and −60°.

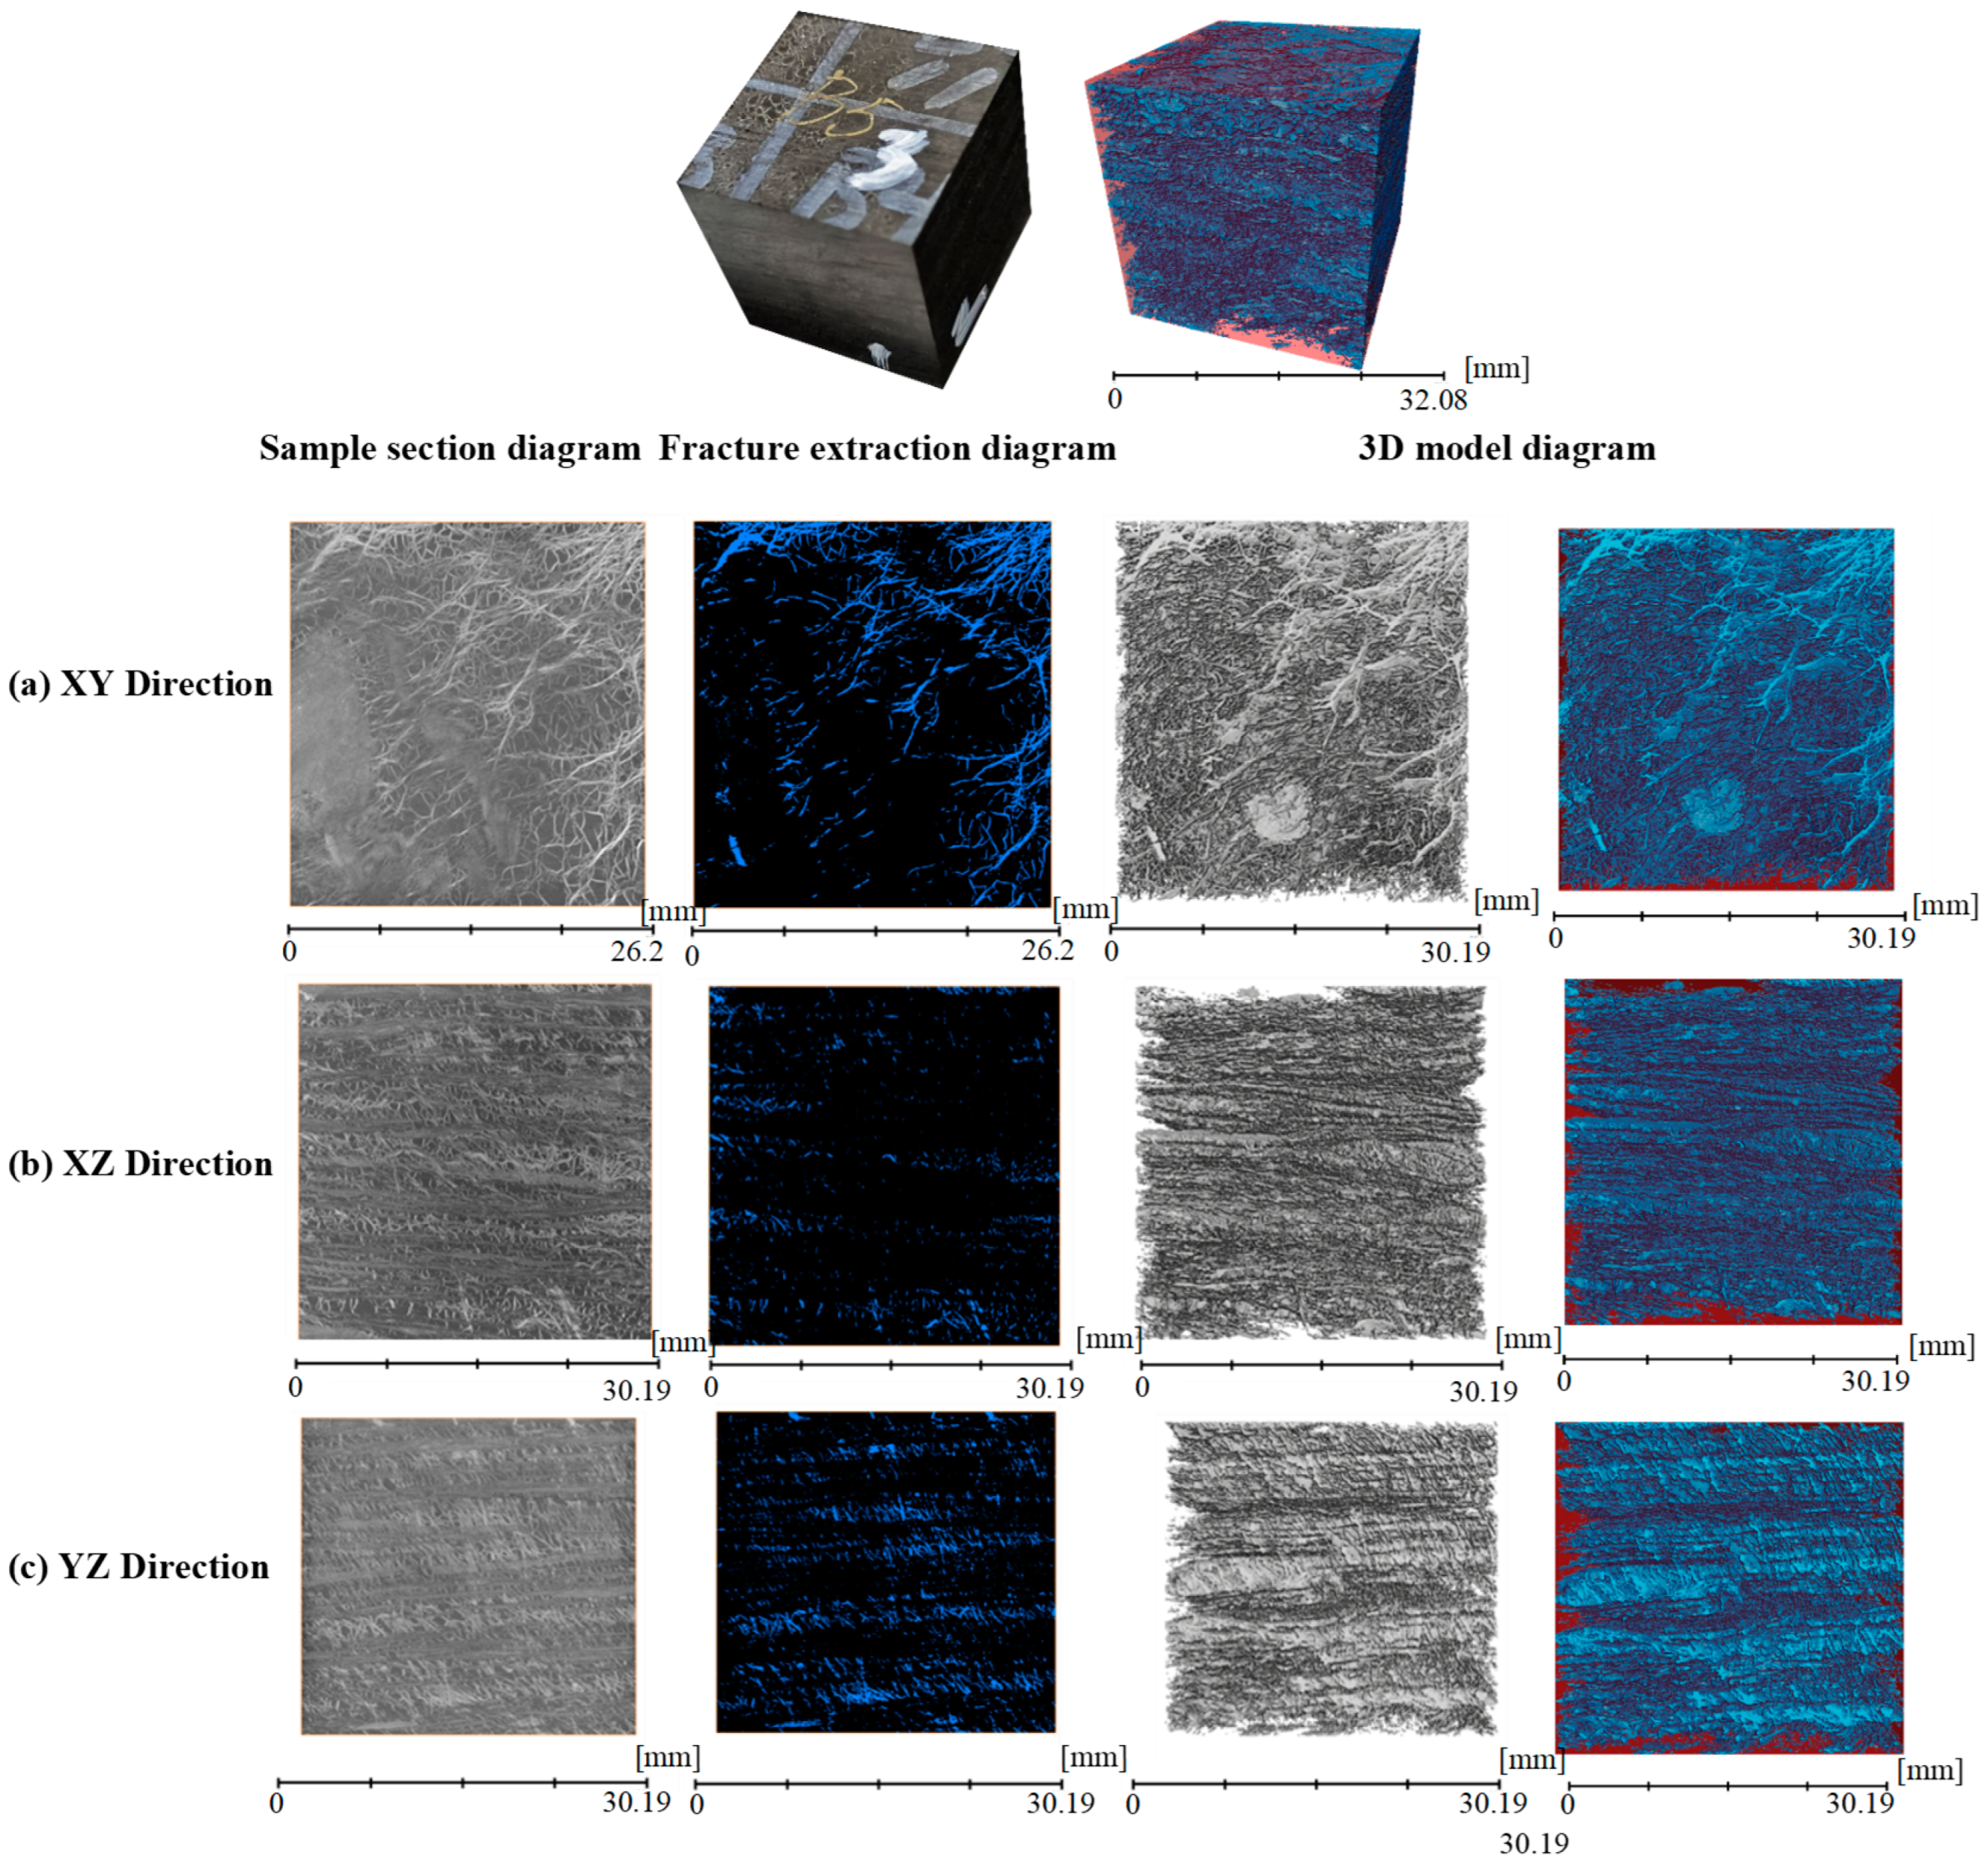
3.1.2. CT Scan Results of Dull Coal

(1) Filled fracture
The scanning results are presented in Figure 10, revealing that the mineral-filled fractures in the dim coal sample B5 exhibit a dendritic scattering distribution in the horizontal direction and a multi-layered phenomenon with short layers in the vertical direction. The mineral-filled fractures are distributed throughout the entire spatial range of the sample, demonstrating a relatively broad distribution. After screening and cutting, the effective volume of the sample is determined to be 12,038.7 mm3, the volume of filled fractures is 1354.63 mm3, and the porosity of the filled fractures is 11.2523%.
To ensure accurate representation of the fracture network, image processing included the exclusion of fractures with apertures greater than 2000 μm. This resulted in a detailed assessment of mineral-filled fractures in the dull coal sample, revealing the spatial distribution of fracture volume, surface area, and angular orientation (Figure 11). The data indicate that the majority of fractures in the dull coal sample are concentrated in the portion smaller than 400 μm, with very few fractures exceeding this size. The volume and surface area of these larger fractures are primarily confined within the range of 400 μm. Overall, the fracture volume and surface area for apertures greater than 400 μm are relatively small. The predominant range of fracture apertures is between 300 μm and 1000 μm, suggesting the presence of several large fractures. Additionally, the distribution of fracture angles is mainly concentrated between 0° and 90°.
(2) Opening fracture
Characterization of the dull coal B5 sample reveals a fracture network dominated by a single, laterally extensive, open fracture developed along the horizontal plane, exhibiting a bedding-parallel orientation. As illustrated in Figure 12, this fracture has a sheet-like geometry. Sparse, discontinuous microfractures are observed in the regions immediately adjacent to the main fracture, both above and below it. The effective sample volume, determined after screening and cutting, was 12,038.7 mm3, while the volume of open fractures was 8.55 mm3, yielding an open fracture porosity of 0.07%.
Applying a 2000 μm aperture threshold during image processing, we quantified the open fracture network in the dull coal sample. The resulting analysis revealed the distribution of fracture number, volume, surface area, and angular orientation, as shown in Figure 13. The data indicate that the majority of fractures in the dull coal sample are concentrated in sizes smaller than 500 μm; however, their volume and surface area are relatively small, suggesting the presence of numerous tiny individual fractures. Although there are numerous fractures, they have minimal impact on the overall volume and surface area. Fractures are almost absent below 900 μm and within the range of 900 to 1500 μm in aperture size. The largest contributions to volume and surface area occur within the range of 1500 to 1700 μm. The distribution of fracture angles is relatively uniform but primarily concentrated between −30° and −60°.

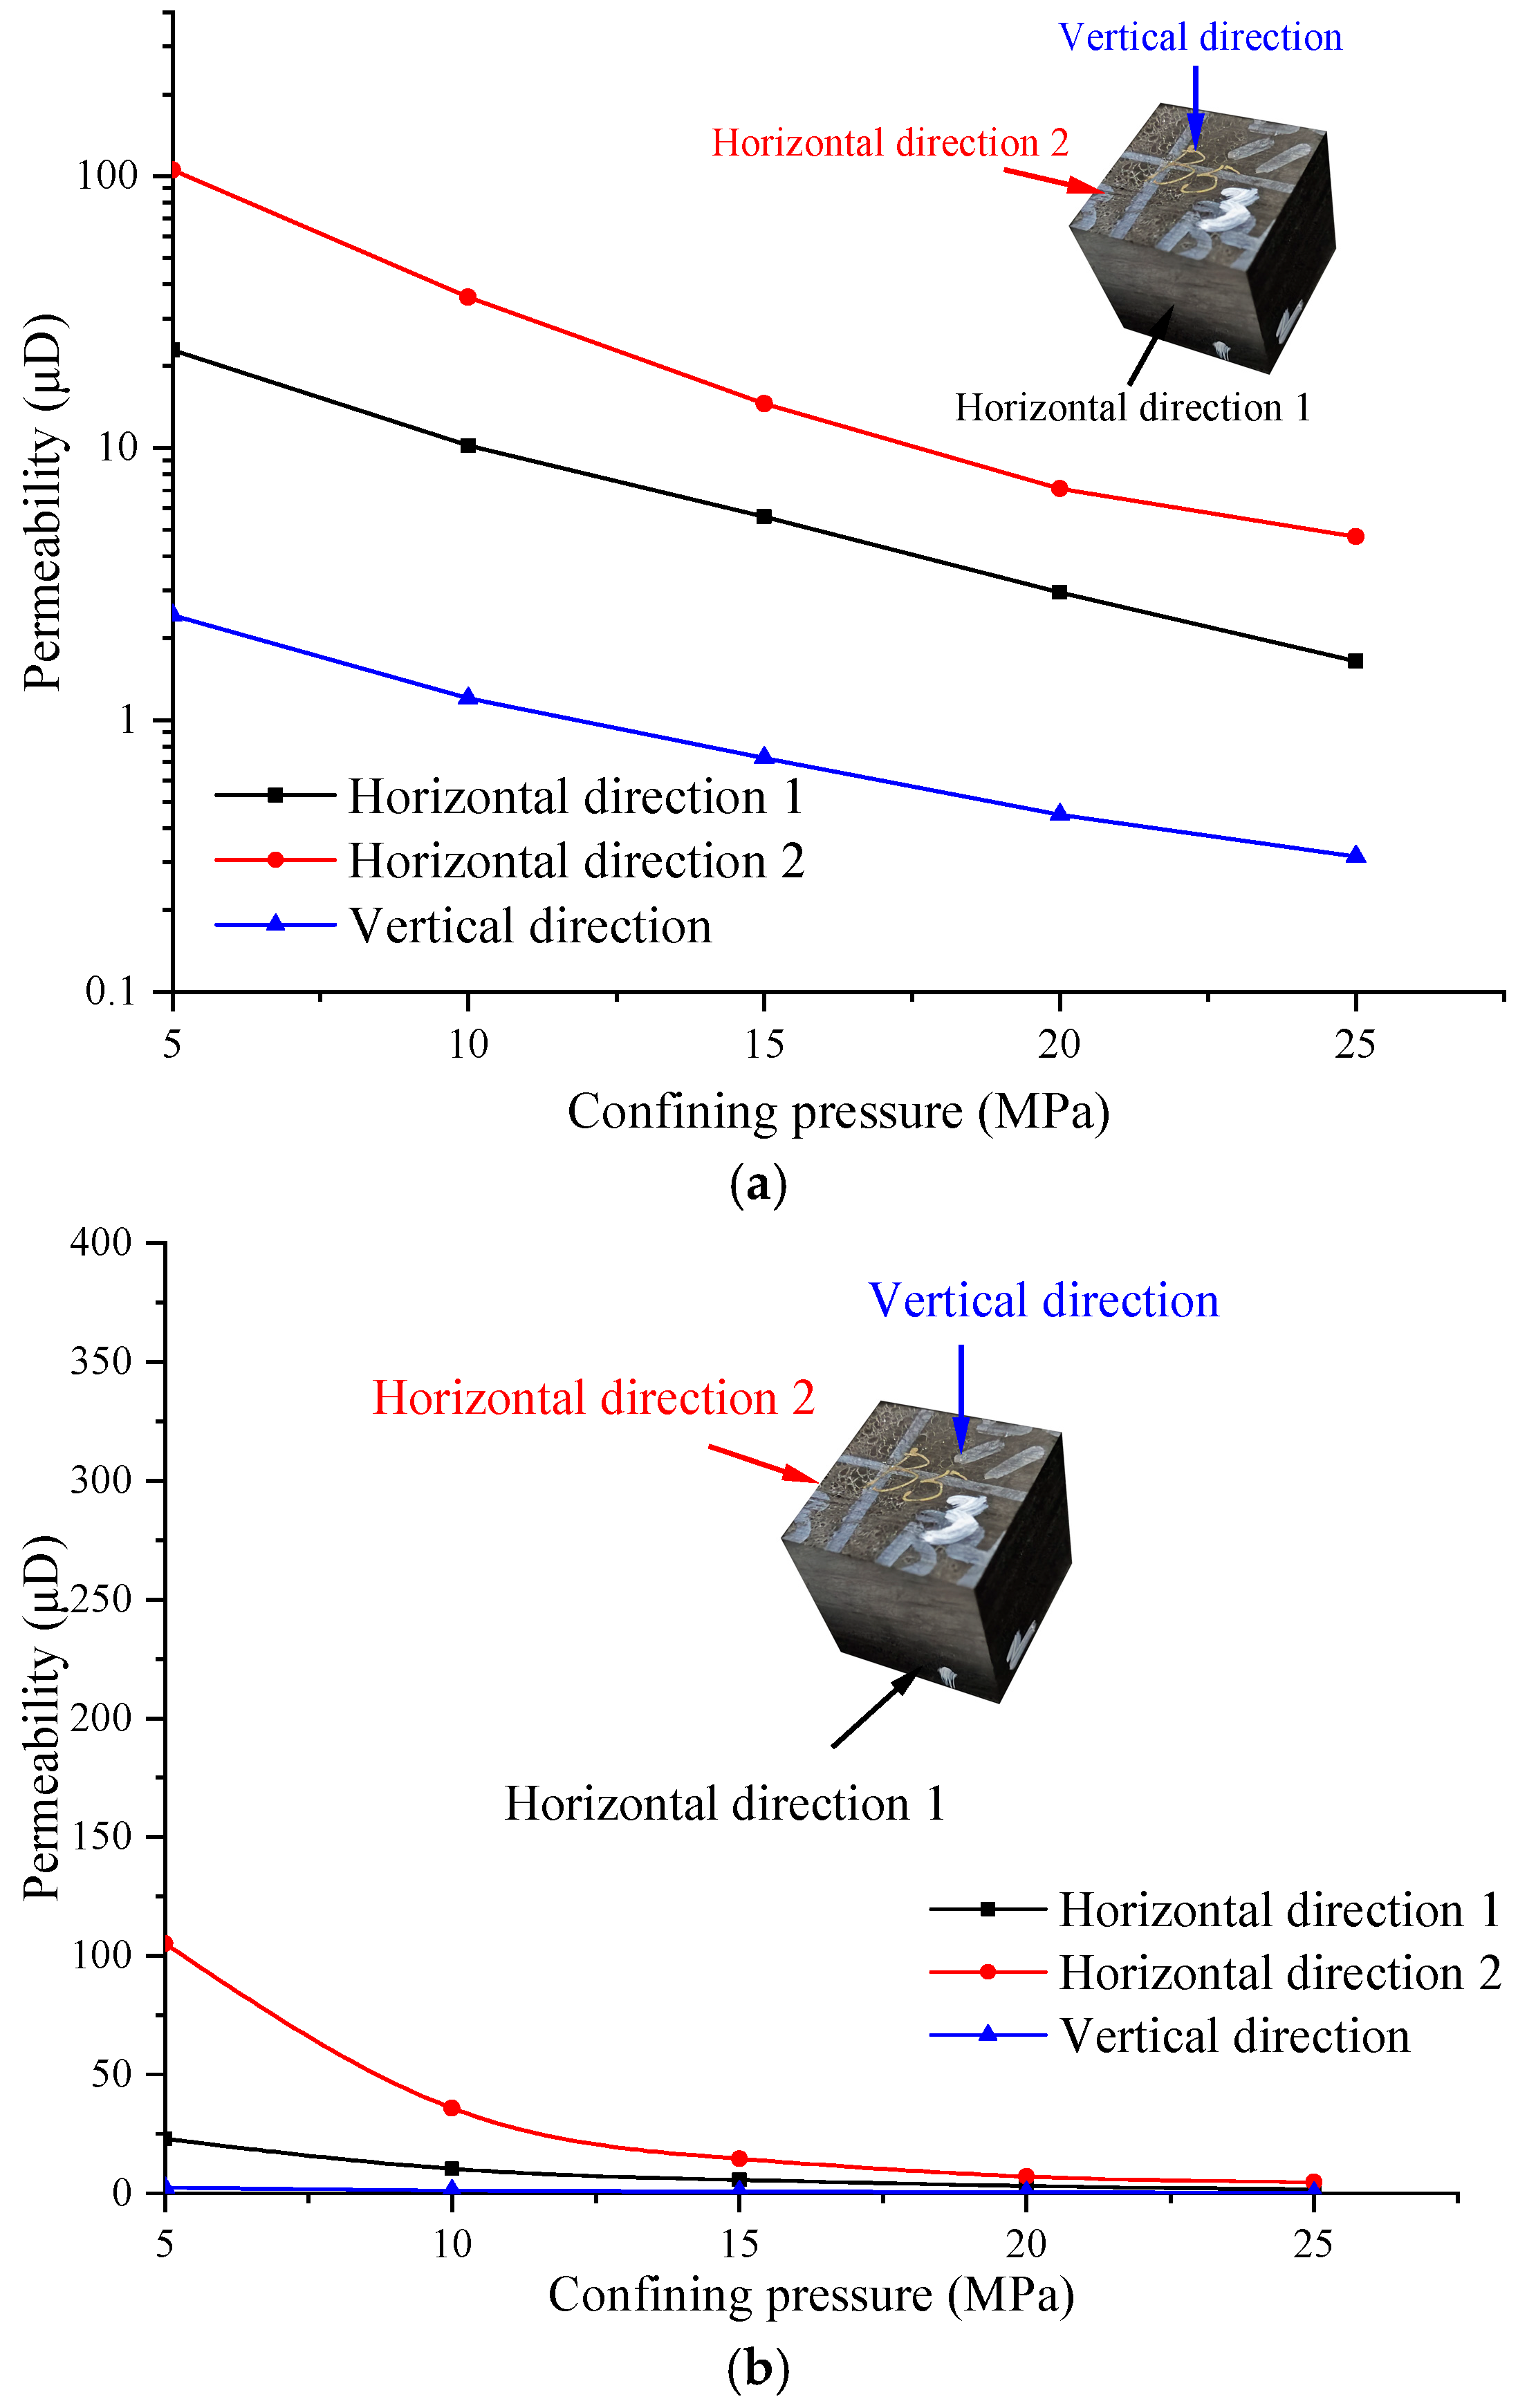
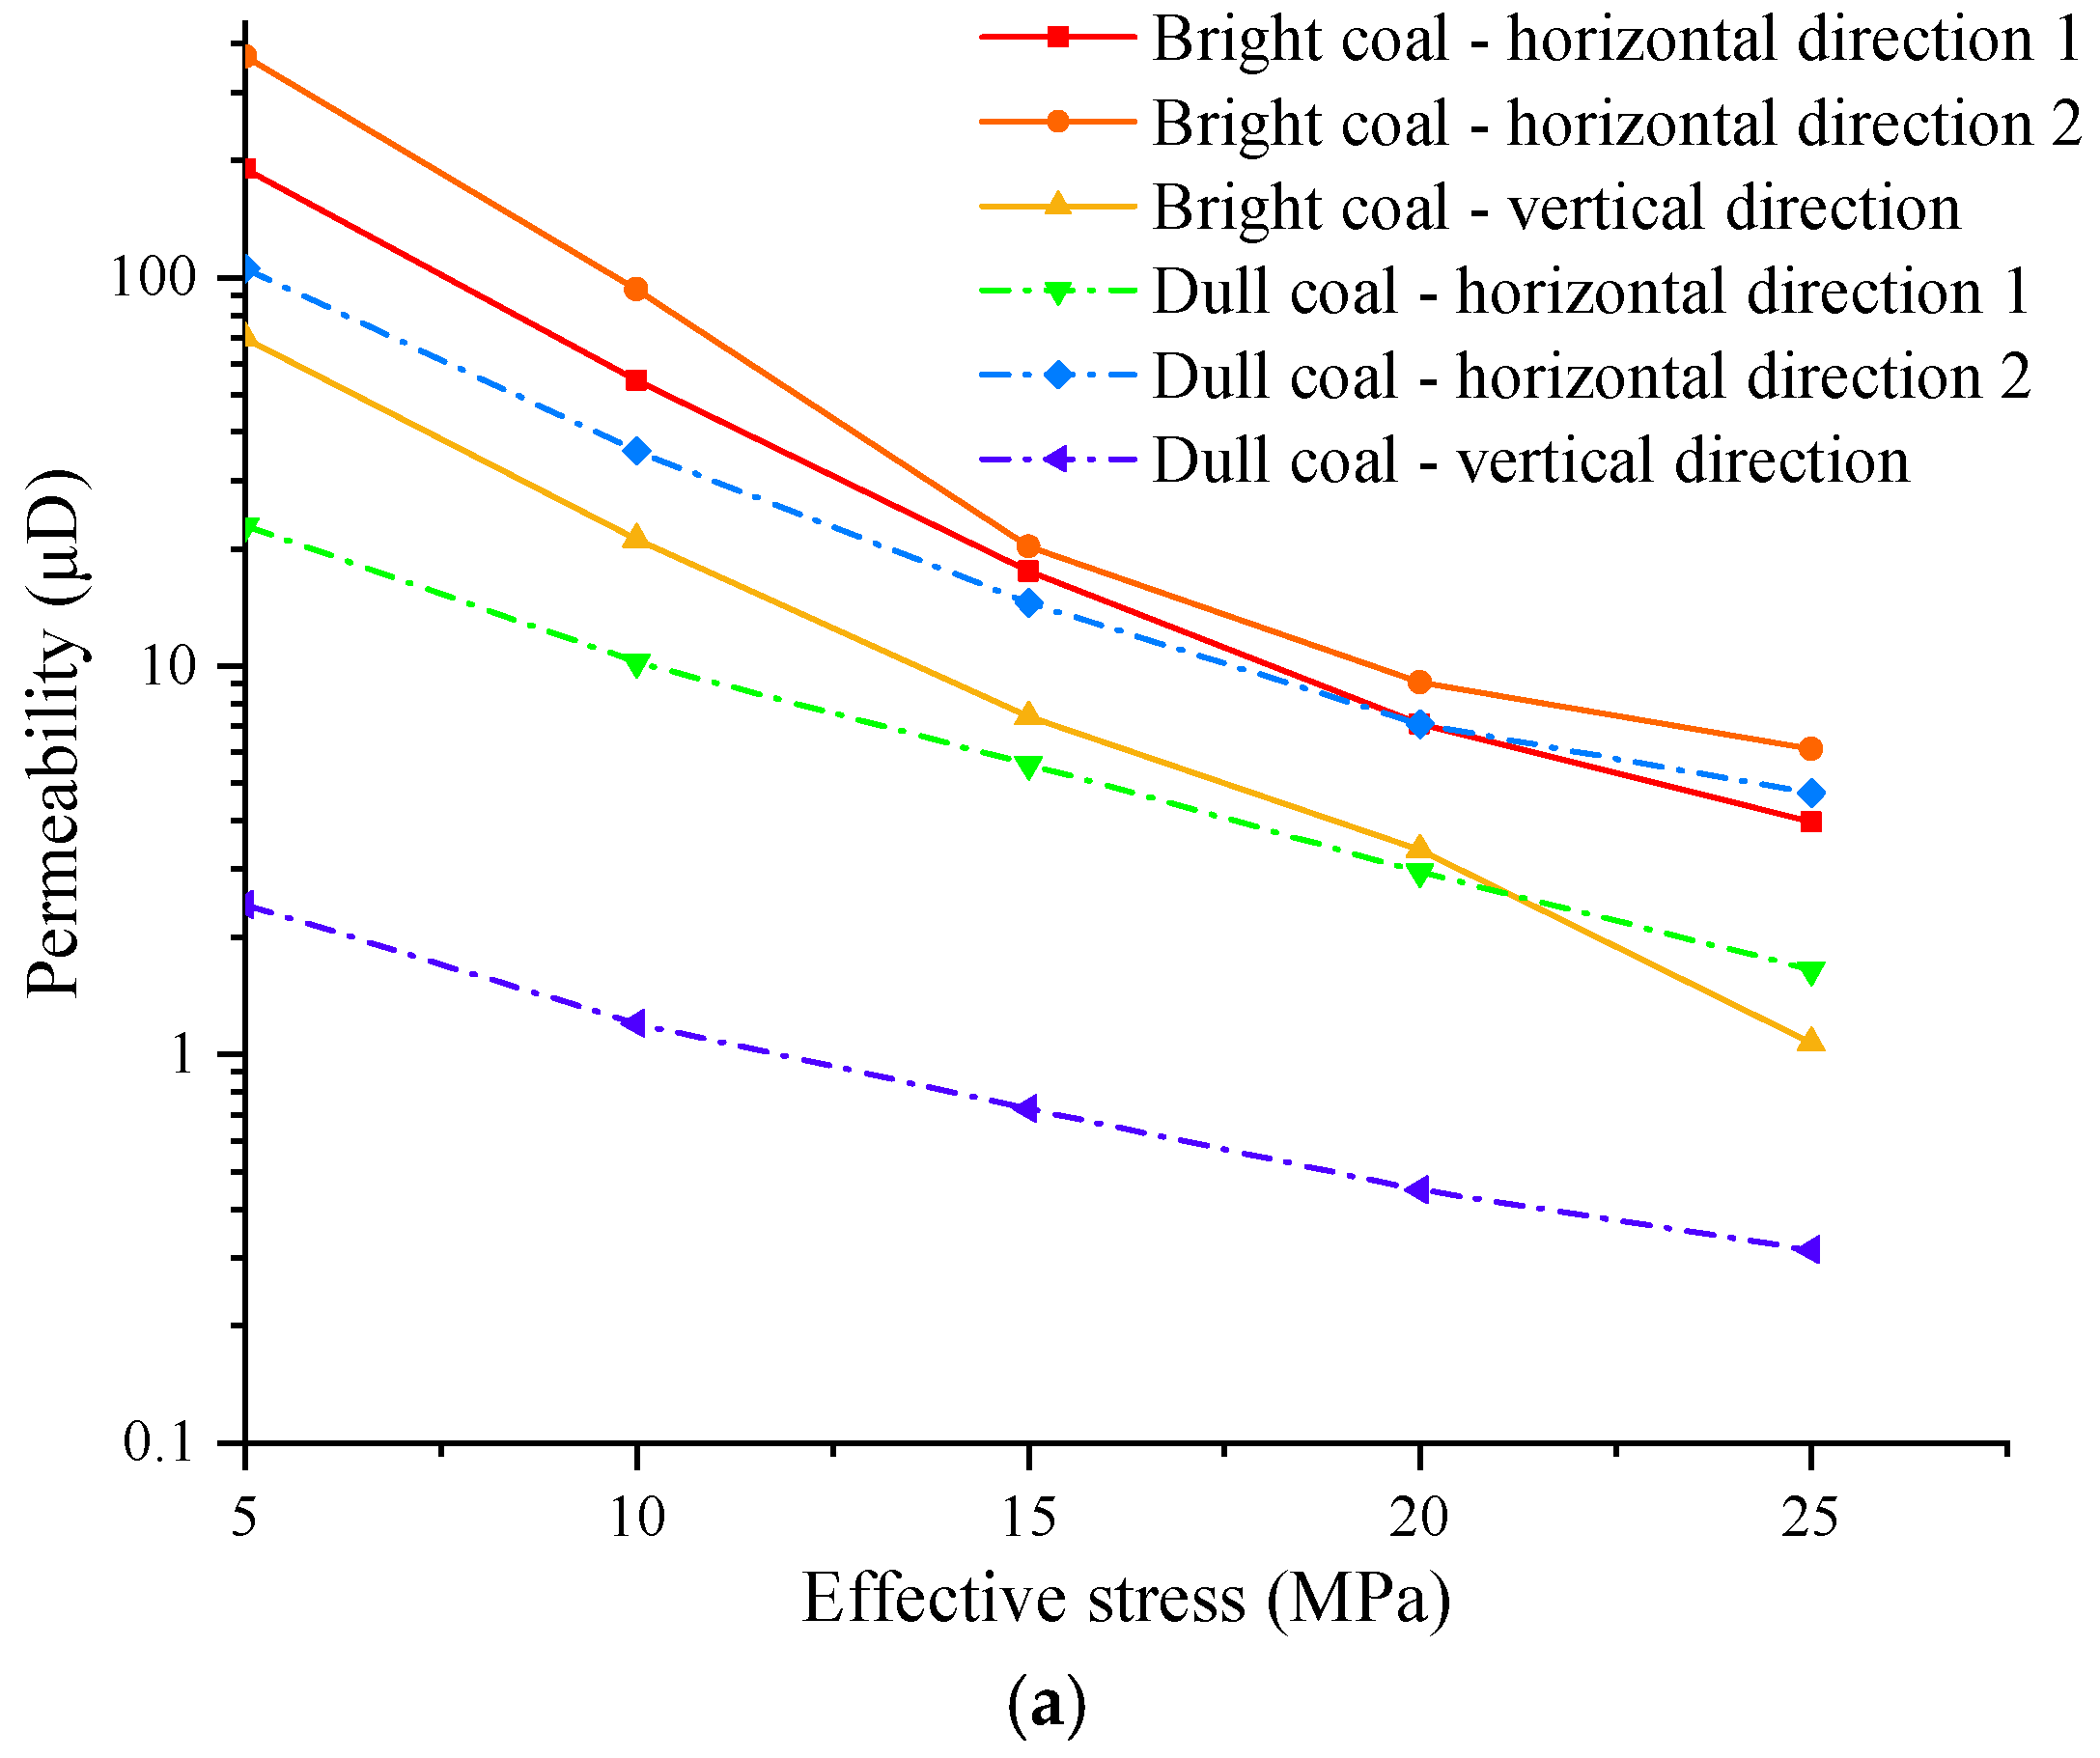
3.2. Anisotropic Permeability Test Results

3.2.1. Permeability Results of Bright Coal

The permeability of bright coal in various directions, along with the experimental test results under different pressure conditions, are presented in Table 3.
The evolution of permeability in different directions of bright coal as a function of effective stress is as follows: as the confining pressure increases from 5 MPa to 25 MPa, the permeability in horizontal direction 1 decreases from 189.71 μD to 3.97 μD, representing a decrease of 97.9%; in horizontal direction 2, permeability decreases from 369.52 μD to 6.11 μD, a reduction of 98.3%; and in the vertical direction, permeability decreases from 69.71 μD to 1.07 μD, amounting to a decrease of 98.5% (Figure 14). Overall, all three directions exhibit significant sensitivity to high stress.

3.2.2. Permeability Results of Dull Coal

The evolution of permeability in different directions of dull coal as a function of effective stress is illustrated in Figure 15. With confining pressure increases from 5 MPa to 25 MPa, the permeability in horizontal direction 1 decreases from 22.93 μD to 1.65 μD, representing a decrease of 92.8%; in horizontal direction 2, permeability decreases from 105.14 μD to 4.71 μD, a reduction of 95.5%; and in the vertical direction, permeability decreases from 2.43 μD to 0.31 μD, amounting to a decrease of 87.1% (Table 4). Overall, all three directions exhibit high-stress sensitivity, although the stress sensitivity of dull coal is generally lower than that of bright coal.

4. Discussion

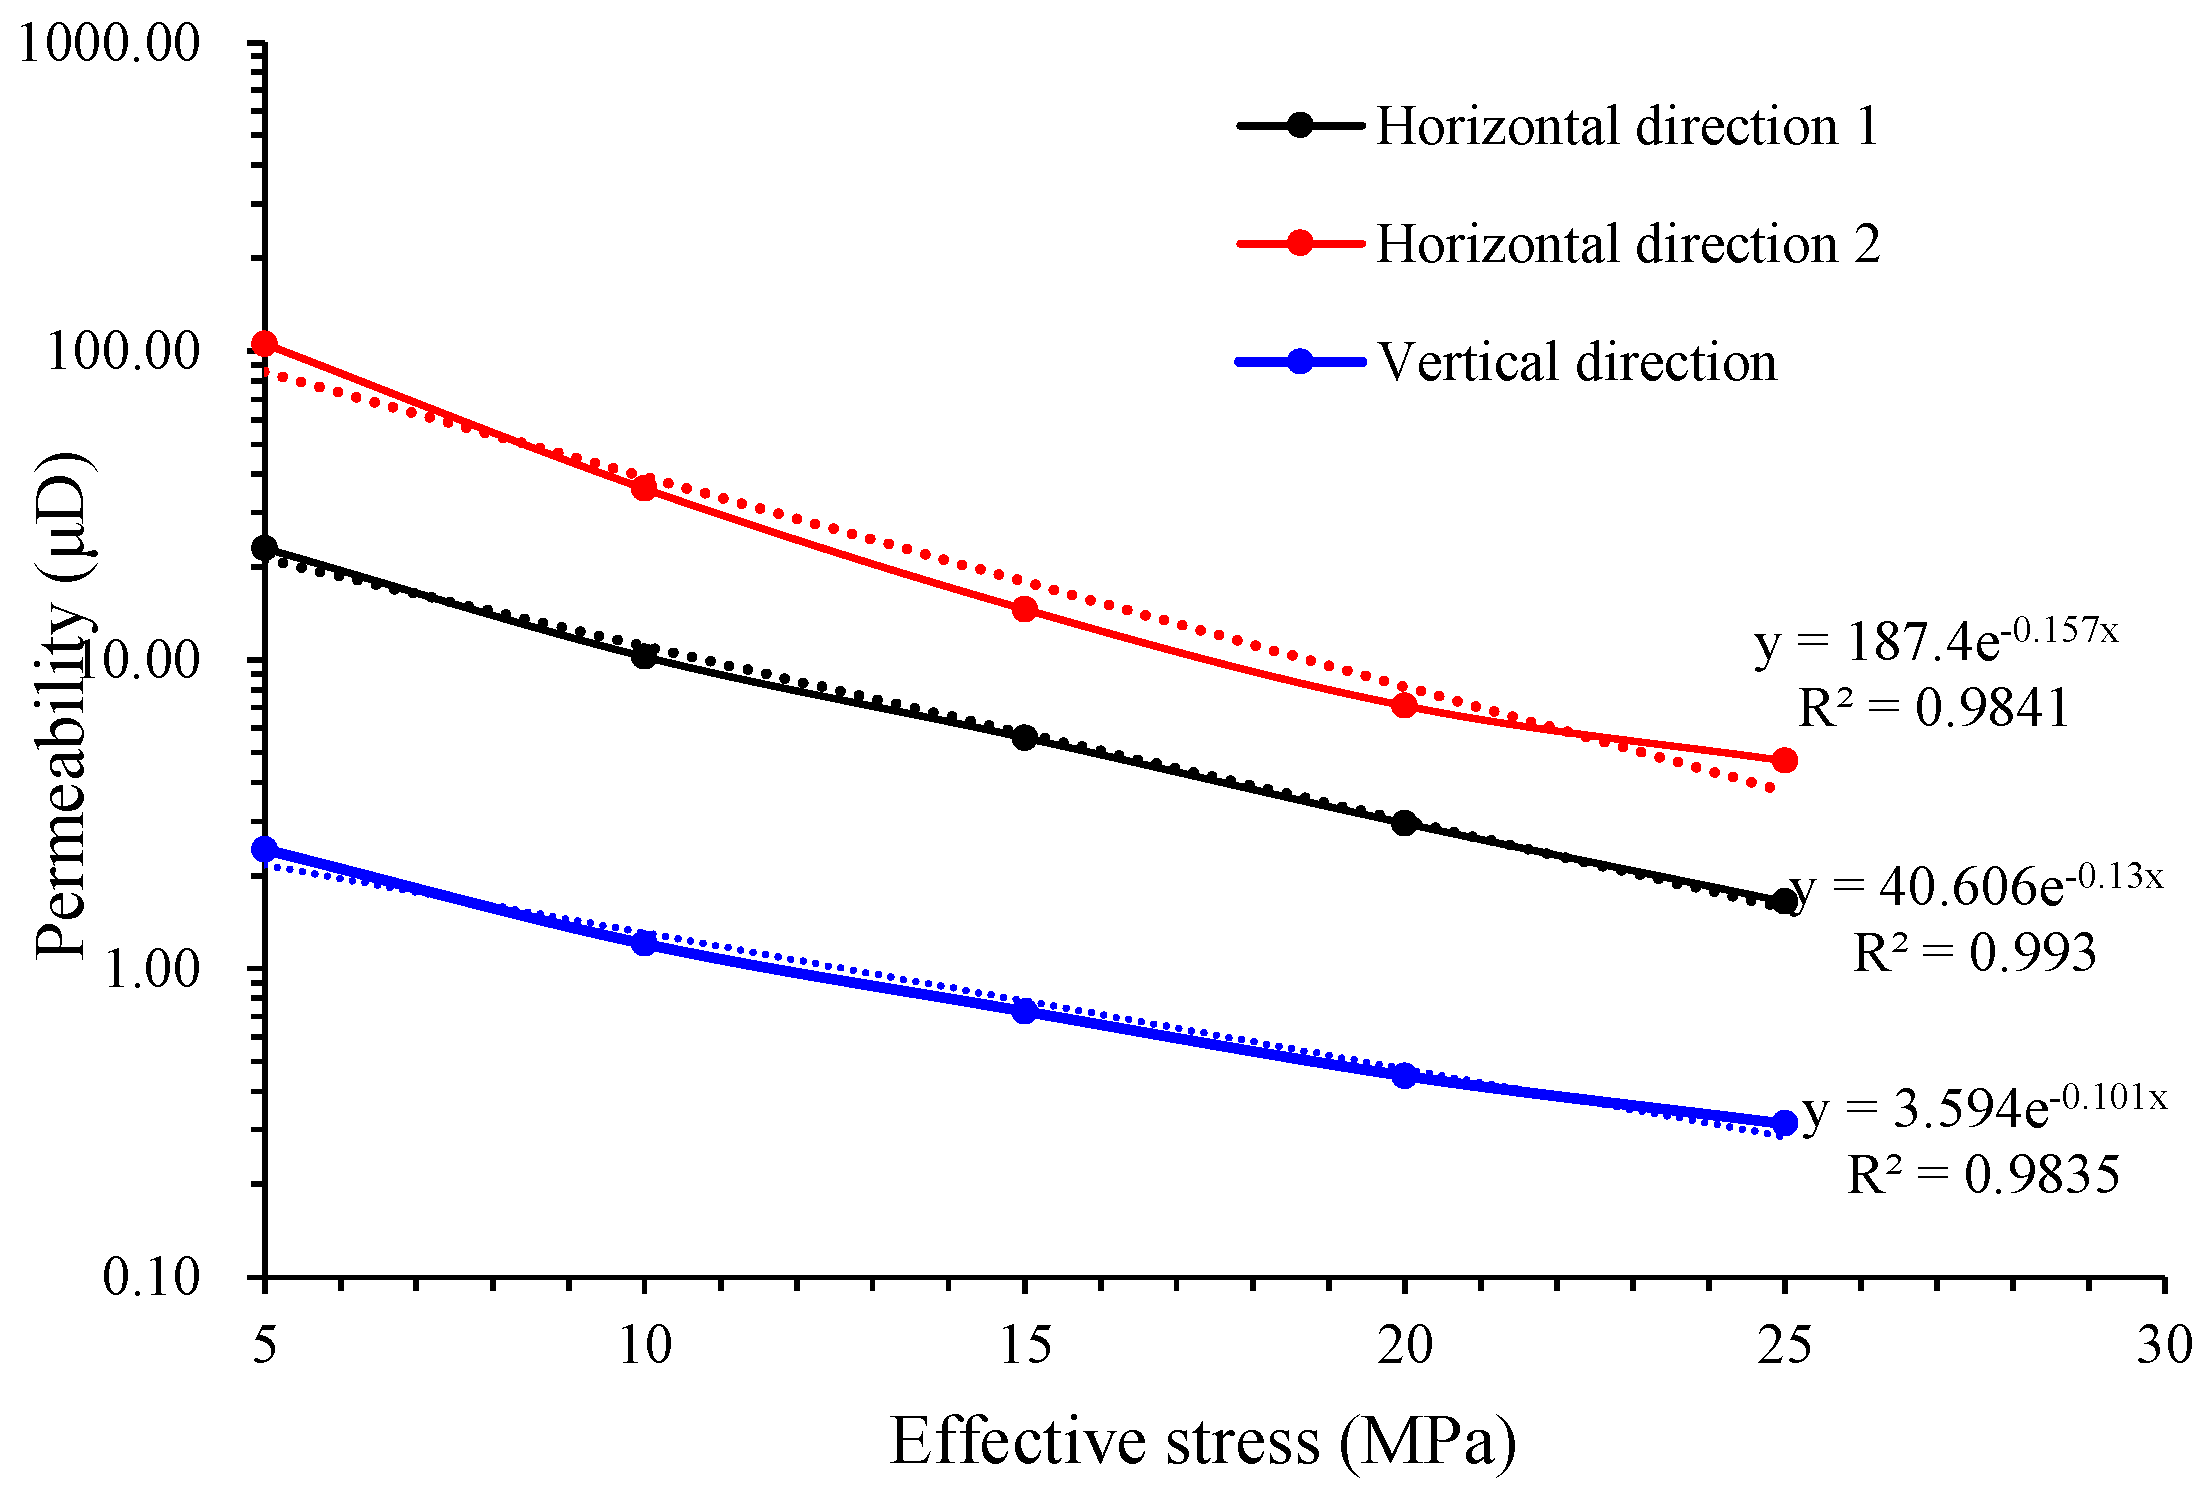
4.1. Fitting Analysis of Permeability Evolution Data

Coal reservoirs are characterized as typical dual-porosity systems, whereby permeability results from the combined effects of both the fracture system and the matrix system. Due to the significantly higher permeability of the fracture system compared to that of the matrix system, laboratory tests on coal-rock samples generally assume that Darcy flow primarily results from flow within the fracture system, while diffusion in the coal matrix is considered negligible [26]. Consequently, the permeability of coal seams is viewed as a function of their fracture system [10,27,28].
In high-pressure environments, the permeability of coal samples exhibits changes known as stress sensitivity. Specifically, under high-pressure conditions, fractures within the rock may experience compression, closure, or deformation, leading to alterations in permeability. Considering the evolution of permeability with effective stress in different directions and accounting for the influences of reservoir temperature and pressure conditions based on poroelastic theory, the equation for porosity is constructed as follows [29]:
ϕ ϕ 0 = exp C p σ σ σ 0 p p 0
where ϕ 0 represents the initial porosity of the fracture system, ϕ denotes the porosity of the fracture system, C p σ is the compressibility coefficient of the fractures, σ represents the magnitude of the stress, and p denotes the reservoir pressure.
The cubic law relationship between permeability and porosity can be expressed as follows [30]:
k k 0 = ϕ ϕ 0 3
Substituting Equation (1) into Equation (2) yields
k k 0 = ϕ ϕ 0 3 = exp 3 C p σ σ σ 0 p p 0
Therefore, the formula for the permeability of coal samples can be expressed as follows (Figure 16 and Figure 17; Table 5 and Table 6):
k = k 0 e 3 C p σ σ σ 0 p p 0

4.2. Influence of Fracture Development Characteristics on Permeability Evolution

The horizontal and vertical fractures in coal samples exhibit distinct differences in their development characteristics. In bright coal samples, the overall features and fracture development in different directions are as follows: mineral-filled fractures in the horizontal direction present a fine mesh distribution, whereas in the vertical direction, they appear as short, multiple layers primarily developed within the vitrinite bands, with insufficient connectivity between layers. Mineral-filled fractures are distributed throughout the sample, encompassing a wide spatial range, and the overall filled fracture porosity is 18.04%. Observations of the development characteristics of filled fractures under an electron microscope [31] (Figure 18) reveal that these fractures, while filled with minerals, are not completely closed and retain certain degrees of aperture and permeability.
The development characteristics of mineral-filled fractures in dull coal samples also exhibit significant anisotropy, as shown in Figure 19. In the horizontal direction, the mineral-filled fractures display a branching, scattered distribution, whereas in the vertical direction, they manifest as short, multi-layered structures. The poor connectivity between layers in the vertical direction results in markedly lower vertical permeability compared to other directions and to bright coal samples. Mineral-filled fractures are distributed throughout the spatial range of the sample, with a relatively wide distribution, and the mineral-filled fracture porosity is 11.25%. In bright coal, horizontal fractures primarily develop in a reticular pattern within the vitrain bands; however, in dull coal, the development of filled fractures within horizontal layers is less pronounced, although a set of opening fractures has developed. The degree of development of effectively interconnected vertical fractures follows the order of bright coal > dull coal. Bright coal fractures are mainly confined to within layers, whereas the development of effectively interconnected fractures in dull coal is the least pronounced.
By comparing the permeability evolution patterns of bright coal and dull coal, it is evident that, overall, the permeability of bright coal is significantly greater than that of dull coal. However, as the effective stress increases, the permeability difference between the two gradually diminishes (Figure 20). With increasing confining pressure, coal permeability exhibits an exponential decay trend. Additionally, coal permeability demonstrates strong heterogeneity, with permeability in the face cleat direction being greater than that in the butt cleat direction, which in turn is greater than the vertical permeability. The decay rate of permeability in bright coal exceeds that of dull coal, indicating its heightened sensitivity to stress. The anisotropy of bright coal is notably weaker than that of dull coal, aligning with the observed fracture development patterns. The evolution characteristics of sample permeability are primarily influenced by the morphology, size, and connectivity of the fractures [32].

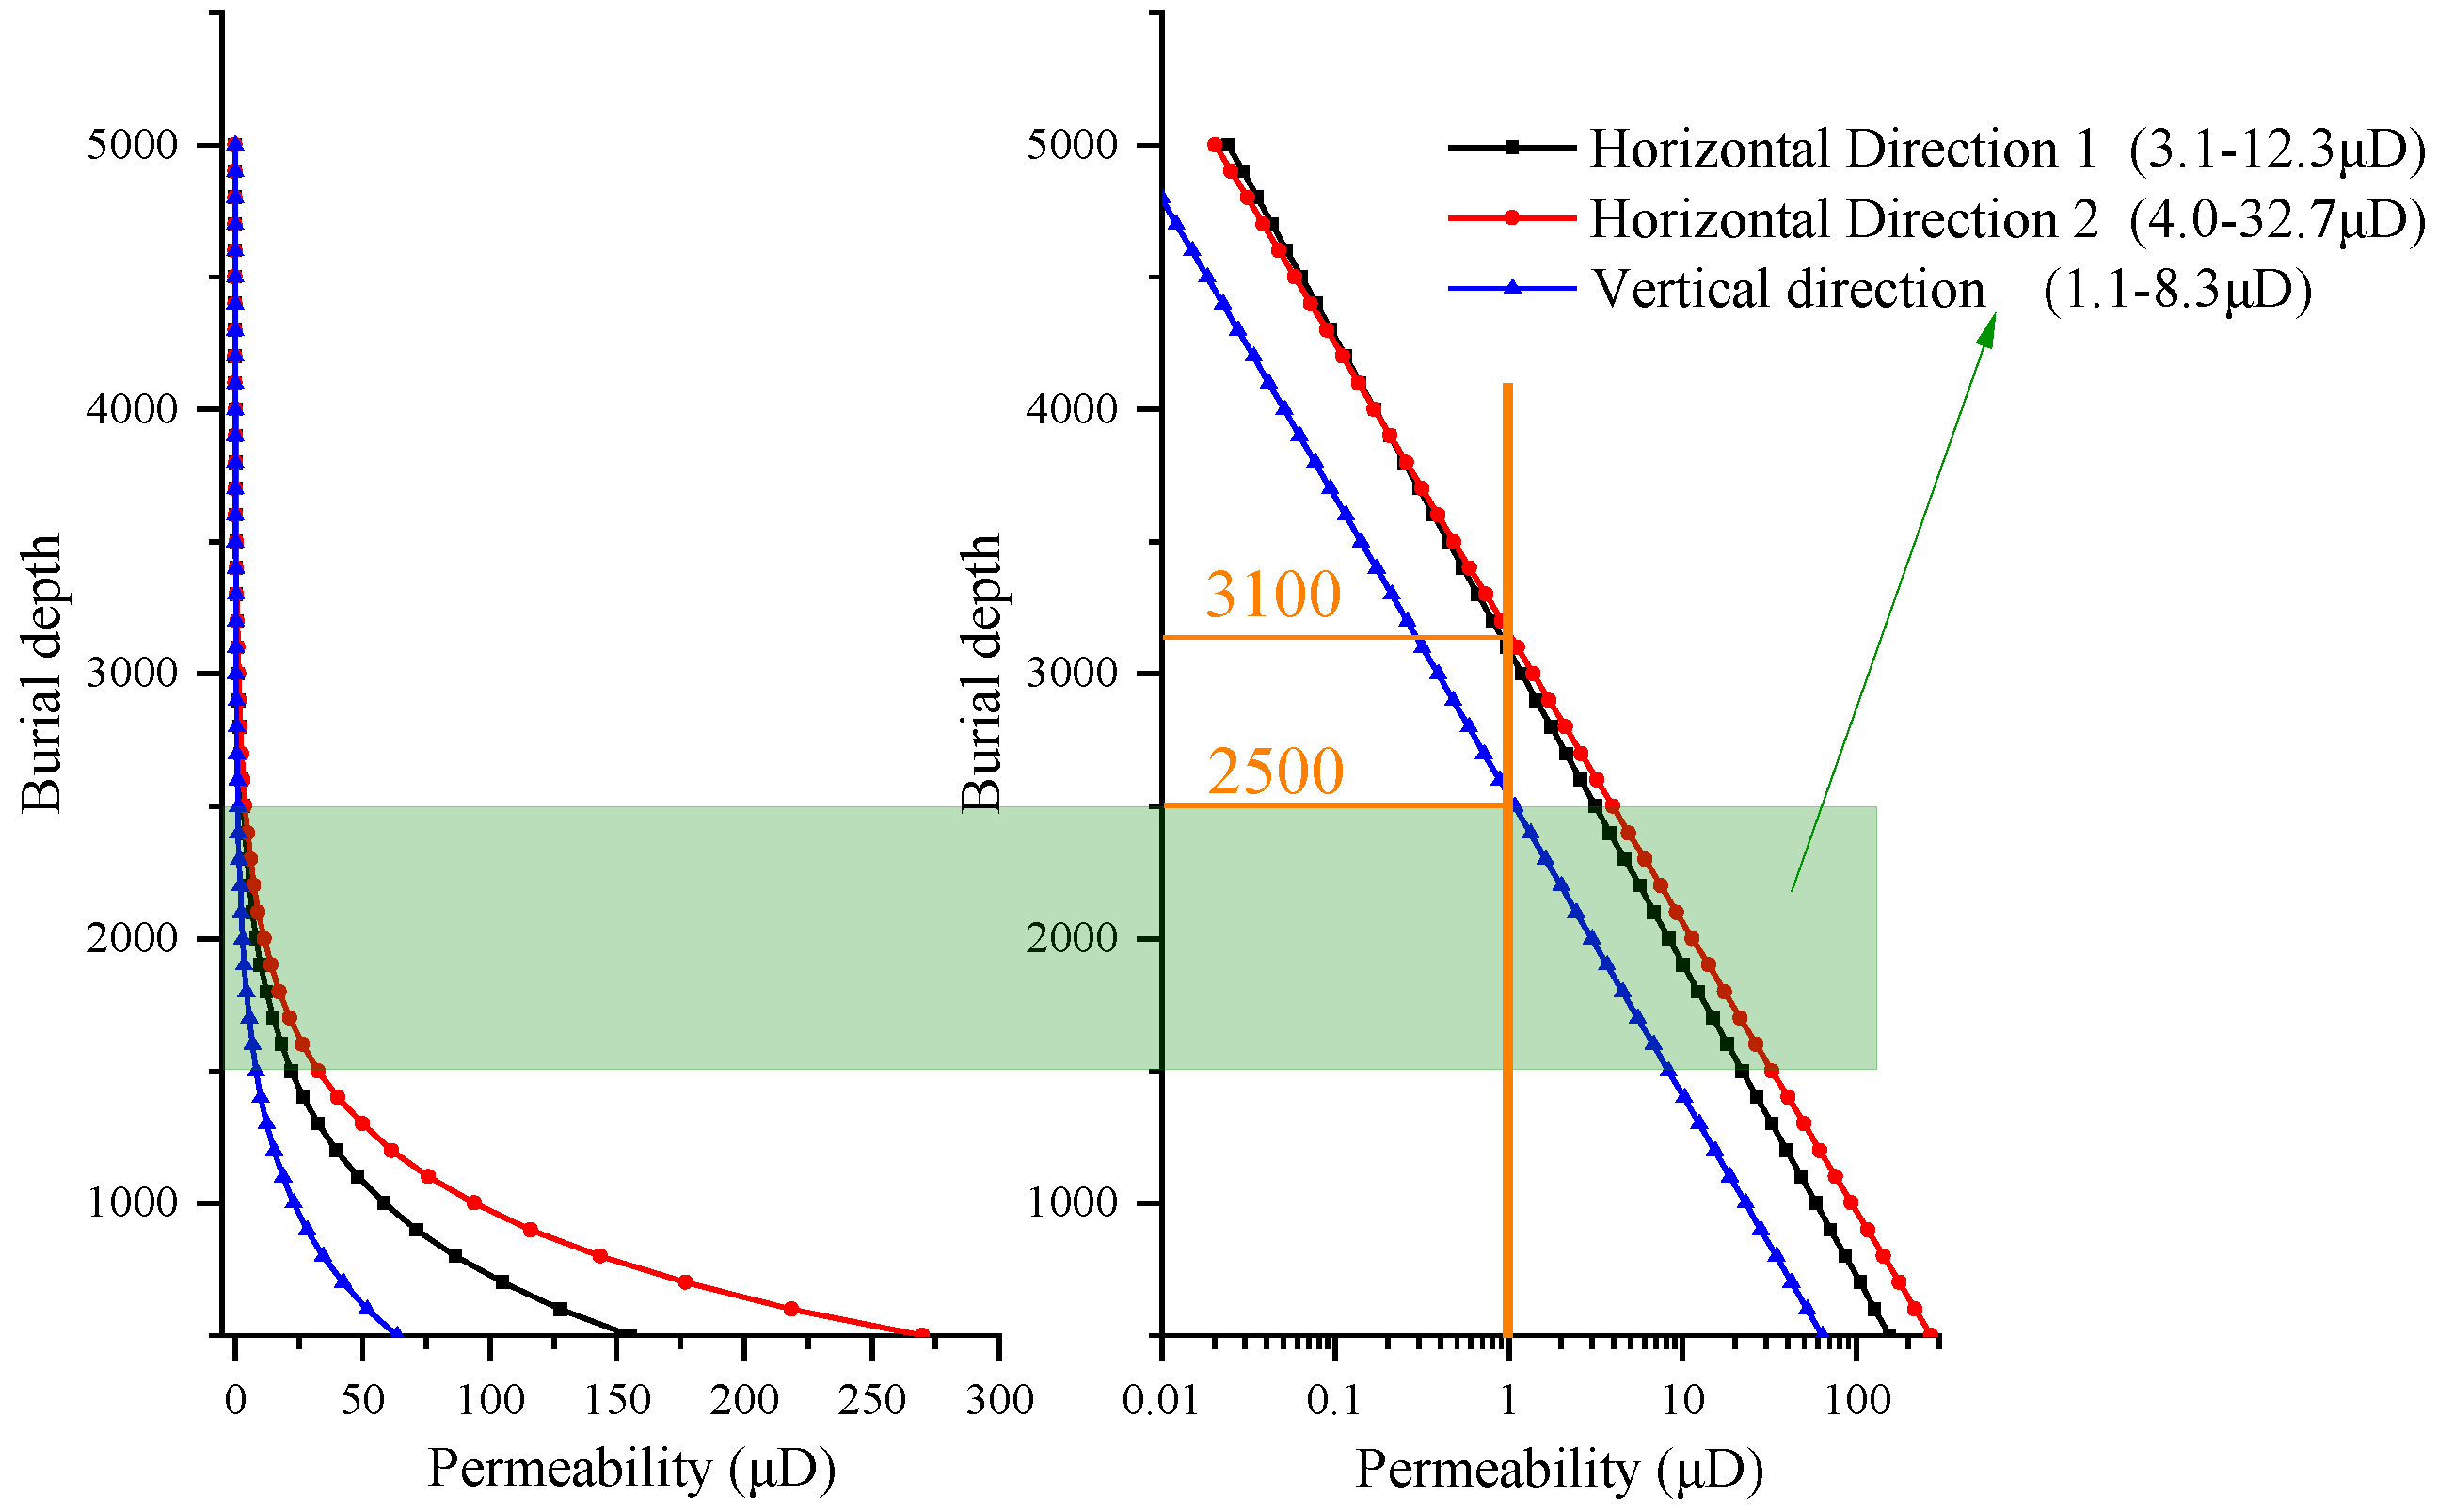
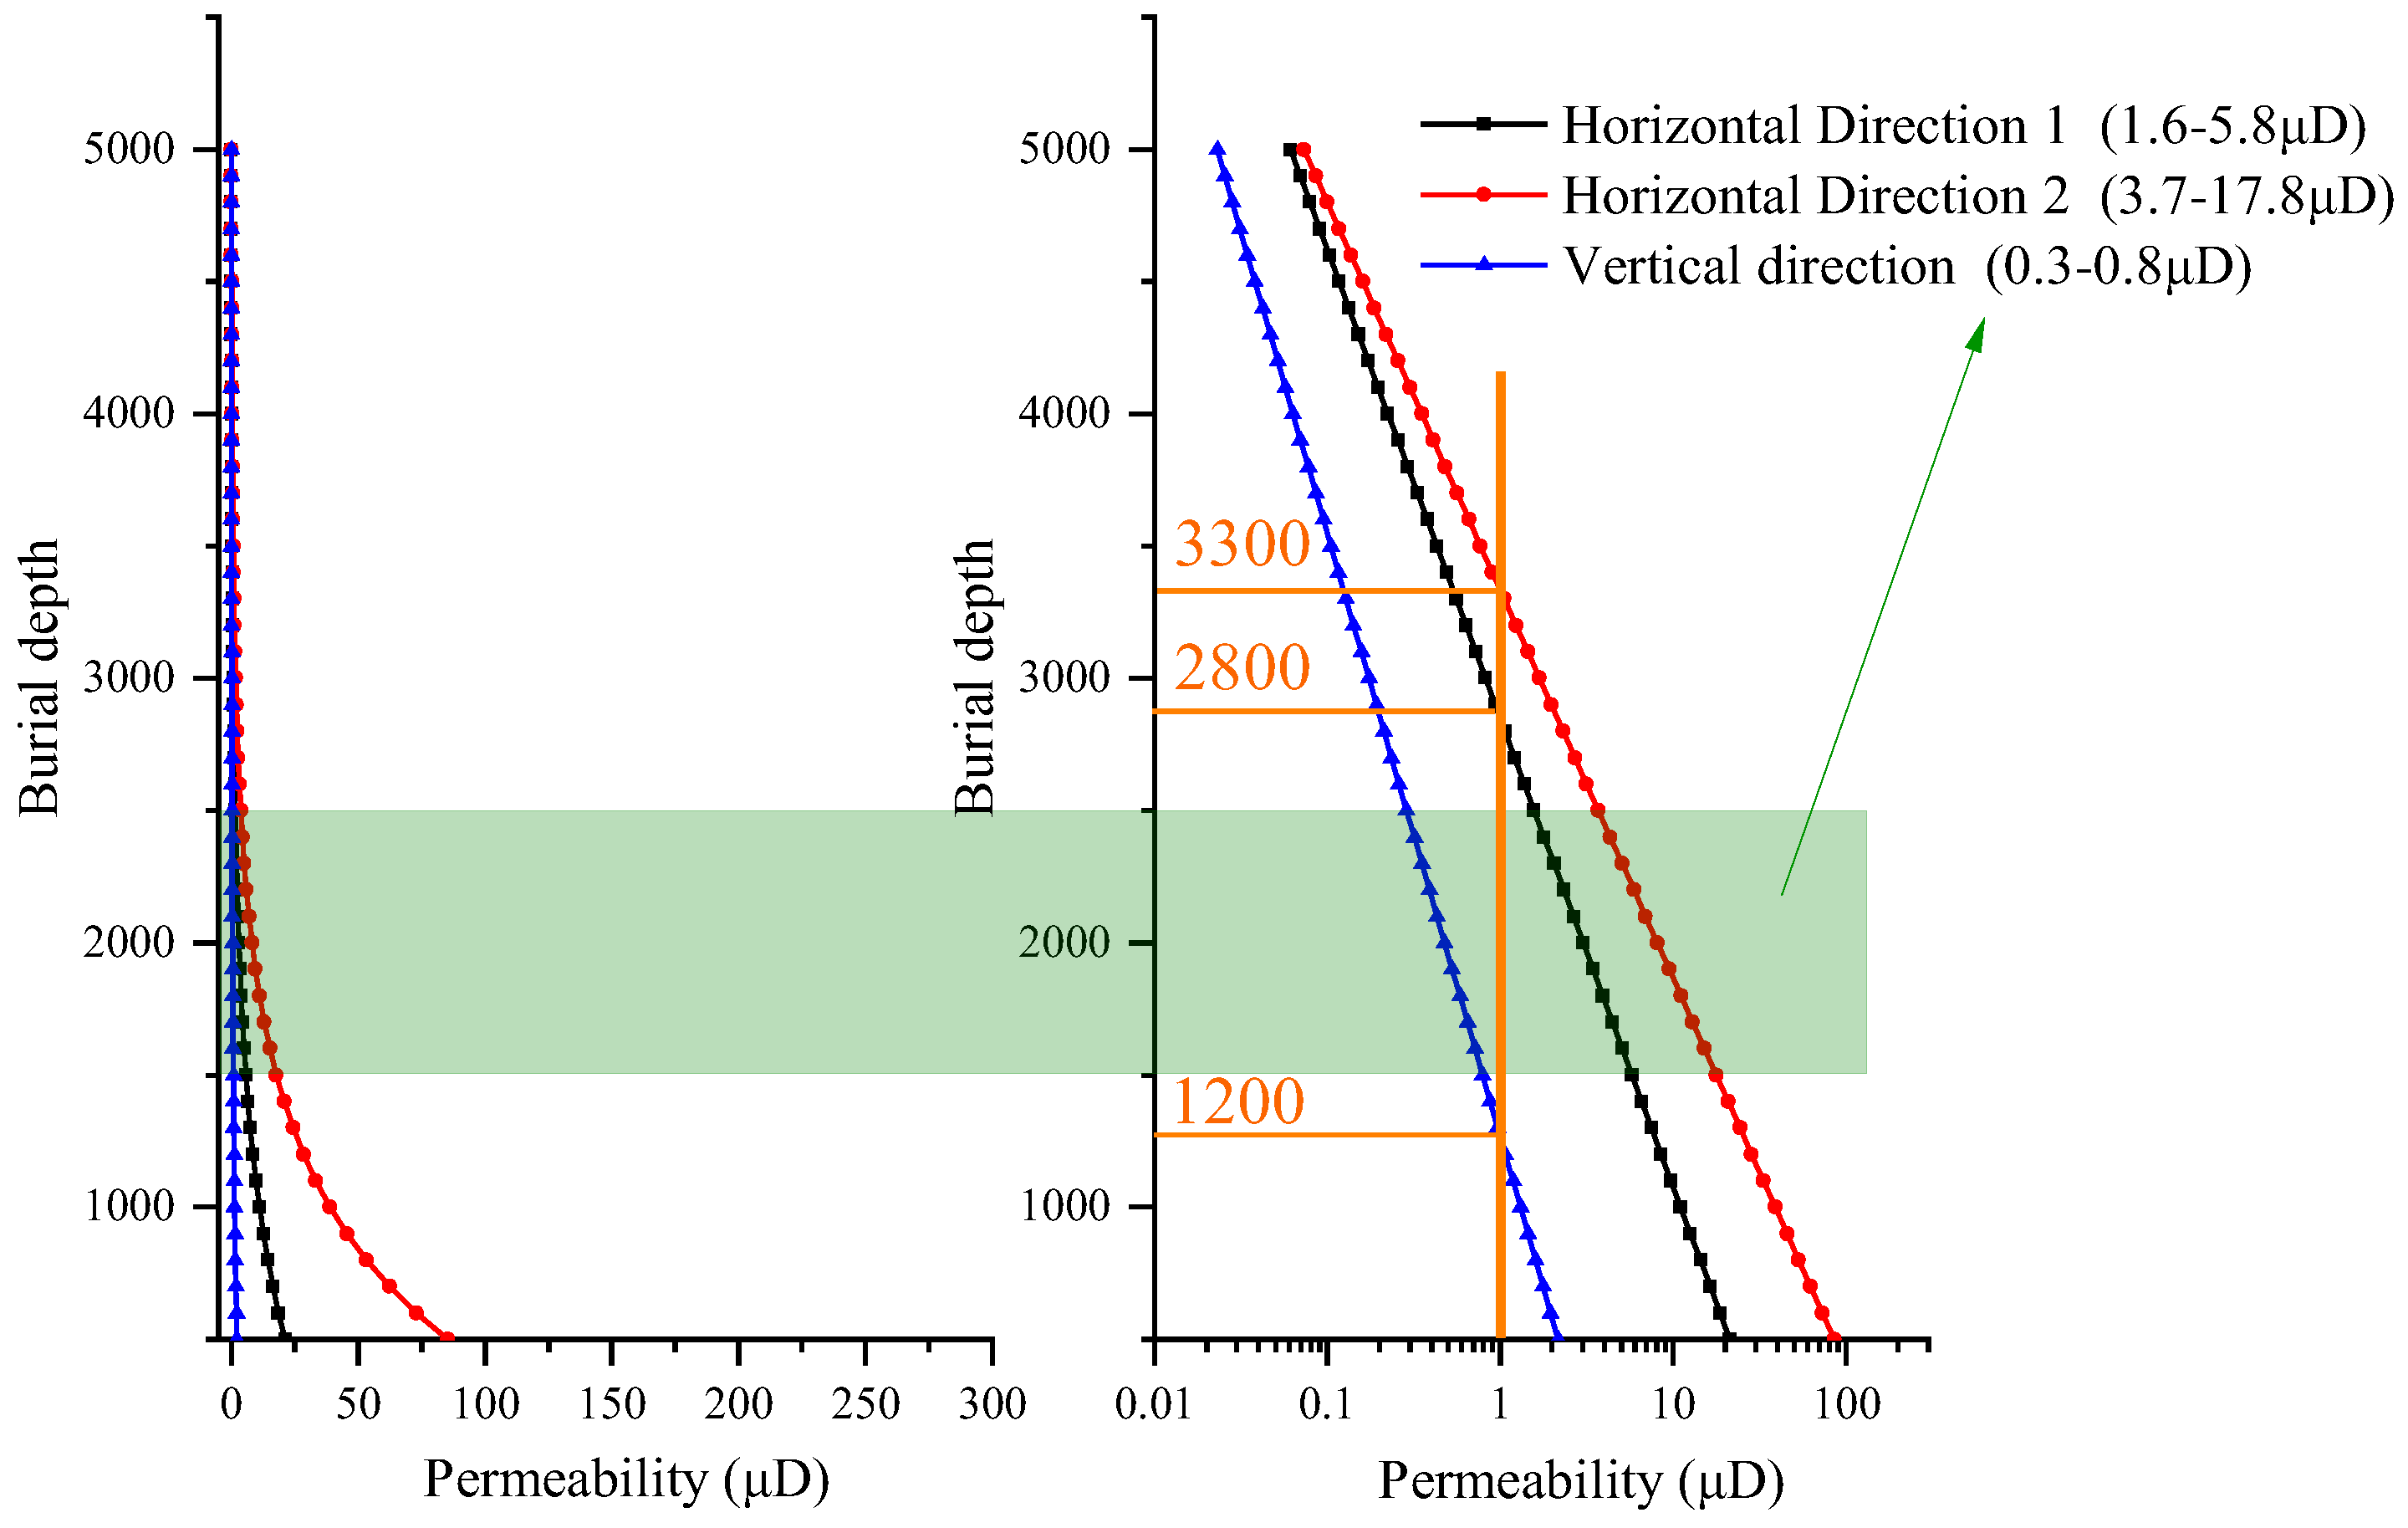
4.3. Permeability Prediction of Deep Coal Reservoir

The constructed permeability model categorizes coal into two types: good permeability (represented by bright coal) and poor permeability (represented by dull coal). Predictions of coal permeability under deep reservoir conditions have been conducted. The results indicate that permeability decreases exponentially with increasing burial depth. Using the current range of field construction techniques as a reference (burial depth of 1500–2500 m, highlighted in light green in the figure), an analysis was performed. For reservoirs with good permeability, the variation range in horizontal permeability (horizontal direction 1 and horizontal direction 2) is 3.1–32.7 μD, while the variation range in vertical permeability is 1.1–8.3 μD (Figure 21). In contrast, for reservoirs with poor permeability, the variation range in horizontal permeability (horizontal direction 1 and horizontal direction 2) is 1.6–17.8 μD, and the variation range in vertical permeability is 0.3–0.8 μD (Figure 22). If a threshold of 1 μD is used to delineate the reservoir depth boundary, it can be noted that for reservoirs with good permeability, the critical depth in the horizontal direction is 3100 m, while in the vertical direction, it is 2500 m. For reservoirs with poor permeability, the critical depth in the horizontal direction ranges from 2800 to 3300 m, and in the vertical direction, it is 1200 m.

5. Conclusions

This study uses typical bright coal and dull coal from the 8# coal seam in the eastern deep section of the Ordos Basin as examples. Based on the results of CT scanning and anisotropy testing of permeability, the study analyzes the development characteristics of filled and unfilled fractures in the coal samples, as well as the evolutionary patterns of permeability influenced by these fractures. The following conclusions can be drawn:
(1) Bright coal exhibits mineral-filled fractures arranged in a grid-like pattern horizontally, demonstrating strong vertical connectivity. In contrast, dull coal shows scattered mineral-filled fractures horizontally, with minimal vertical connectivity. Complex unfilled fractures develop within bright coal, whereas only a few unfilled fractures are present in dull coal.
(2) As confining pressure increases, coal permeability exhibits an exponential decay trend. The permeability of coal displays significant heterogeneity, with permeability in the face cleat direction being greater than that in the butt cleat direction, which in turn is greater than the vertical permeability.
(3) Bright coal has a faster permeability decay rate than dull coal, indicating greater sensitivity to stress. Furthermore, the anisotropy of bright coal is significantly weaker than that of dull coal, consistent with the observed fracture development patterns.

Author Contributions

L.B.: writing—original draft, supervision. Y.H.: writing—original draft, methodology. R.S.: conceptualization, writing—review and editing. L.J.: methodology, formal analysis. W.Z.: funding acquisition, resources. Z.M.: investigation, validation. P.W.: writing—review and editing, investigation. J.S.: writing—review and editing, funding acquisition. All authors have read and agreed to the published version of the manuscript.

Funding

This work was funded by the National Natural Science Foundation of China (42130802, 42272198), the research project “Study on the occurrence characteristics and formation mechanisms of deep coalbed methane” of China National Petroleum Corporation (2023ZZ18-02), tackling applied science and technology projects of China National Petroleum Corporation (2021DJ2303, 2023ZZ18).

Data Availability Statement

Data used in this study are available from the corresponding author upon reasonable request.

Conflicts of Interest

Authors Liheng Bian, Yanxiang He, Wei Zhang, Zhuang Ma and Peng Wu were employed by the company China United Coalbed Methane National Engineering Research Center Co., Ltd. Authors Liheng Bian, Yanxiang He, Liang Ji, Wei Zhang, Zhuang Ma and Peng Wu were employed by the company PetroChina Coalbed Methane Company Limited. The remaining authors declare that the research was conducted in the absence of any commercial or financial relationships that could be construed as a potential conflict of interest.

References

  1. Qin, Y.; Shen, J.; Shi, R. Strategic value and choice on construction of large CMG industry in China. J. China Coal Soc. 2022, 47, 371–387. [Google Scholar]
  2. Xu, F.; Wang, C.; Xiong, X.; Xu, B.; Wang, H.; Zhao, X.; Jiang, S.; Song, W.; Wang, Y.; Chen, G.; et al. Evolution law of deep coalbed methane reservoir formation and exploration anddevelopment practice in the eastern margin of Ordos Basin. Acta Pet. Sin. 2023, 44, 1764–1780. [Google Scholar]
  3. Shi, R.; Liu, J.; Wei, M.; Elsworth, D.; Wang, X. Mechanistic analysis of coal permeability evolution data under stress-controlled conditions. Int. J. Rock Mech. Min. Sci. 2018, 110, 36–47. [Google Scholar] [CrossRef]
  4. Li, Y.; Guo, X.; Song, D.; Liu, S.; Pan, J.; Wang, H. Expulsion of small molecule hydrocarbons and expansion of nanopores effect in tectonically deformed coal evolution. Fuel 2024, 357, 129961. [Google Scholar] [CrossRef]
  5. Wang, C.; Zhang, J.; Zang, Y.; Zhong, R.; Wang, J.; Wu, Y.; Jiang, Y.; Chen, Z. Time-dependent coal permeability: Impact of gas transport from coal cleats to matrices. J. Nat. Gas Sci. Eng. 2021, 88, 103806. [Google Scholar] [CrossRef]
  6. Wu, H.; Zhou, Y.; Yao, Y.; Wu, K. Imaged based fractal characterization of micro-fracture structure in coal. Fuel 2019, 239, 53–62. [Google Scholar] [CrossRef]
  7. Li, Y.; Wang, H.; Song, D.; Pan, J.; Wang, Z.; Guo, X. The evolution process of fractures and their modification effects on the liquid–solid interface during liquid nitrogen cyclic freeze–thaw of coal and shale. Fuel 2024, 362, 130877. [Google Scholar] [CrossRef]
  8. Sang, G.; Liu, S. Carbonate caprock–brine–carbon dioxide interaction: Alteration of hydromechanical properties and implications on carbon dioxide leakage. SPE J. 2021, 26, 2780–2792. [Google Scholar] [CrossRef]
  9. Shi, R.; Elsworth, D.; Wang, X.; Shen, J.; Liu, J.; Wang, Z. Multimodal Evolution of Coal Permeability due to Interior Deformations within a Triple Porosity System. SPE J. 2023, 28, 1945–1955. [Google Scholar] [CrossRef]
  10. Pan, Z.; Connell, L.D. Modelling permeability for coal reservoirs: A review of analytical models and testing data. Int. J. Coal Geol. 2012, 92, 1–44. [Google Scholar] [CrossRef]
  11. Zhang, H.; Liu, J.; Elsworth, D. How sorption-induced matrix deformation affects gas flow in coal seams: A new FE model. Int. J. Rock Mech. Min. Sci. 2008, 45, 1226–1236. [Google Scholar] [CrossRef]
  12. Li, J.; Li, B.; Wang, Z.; Ren, C.; Yang, K.; Gao, Z. A permeability model for anisotropic coal masses under different stress conditions. J. Pet. Sci. Eng. 2021, 198, 108197. [Google Scholar] [CrossRef]
  13. Yu, Y.; Meng, Z.; Gao, C.; Lu, Y.; Li, J. Experimental investigation of pore pressure effect on coal sample permeability under different temperatures. Nat. Resour. Res. 2022, 31, 1585–1599. [Google Scholar] [CrossRef]
  14. Laubach, S.; Marrett, R.; Olson, J.; Scott, A. Characteristics and origins of coal cleat: A review. Int. J. Coal Geol. 1998, 35, 175–207. [Google Scholar] [CrossRef]
  15. Liu, J.; Chen, Z.; Elsworth, D.; Qu, H.; Chen, D. Interactions of multiple processes during CBM extraction: A critical review. Int. J. Coal Geol. 2011, 87, 175–189. [Google Scholar] [CrossRef]
  16. Li, J.; Li, B.; Cheng, Q.; Gao, Z. Evolution of anisotropic coal permeability under the effect of heterogeneous deformation of fractures. Nat. Resour. Res. 2021, 30, 3623–3642. [Google Scholar] [CrossRef]
  17. Zhang, G.; Ranjith, P.; Liang, W.; Haque, A.; Perera, M.; Li, D. Stress-dependent fracture porosity and permeability of fractured coal: An in-situ X-ray tomography study. Int. J. Coal Geol. 2019, 213, 103279. [Google Scholar] [CrossRef]
  18. Bandyopadhyay, K.; Mallik, J. An optimum solution for coal permeability estimation from mesoscopic scale calibrated stochastic and deterministic discrete fracture network models. Fuel 2023, 331, 125626. [Google Scholar] [CrossRef]
  19. Jing, Y.; Armstrong, R.T.; Ramandi, H.L.; Mostaghimi, P. Coal cleat reconstruction using micro-computed tomography imaging. Fuel 2016, 181, 286–299. [Google Scholar] [CrossRef]
  20. Sakhaee-Pour, A.; Wheeler, M.F. Effective flow properties for cells containing fractures of arbitrary geometry. SPE J. 2016, 21, 0965–0980. [Google Scholar] [CrossRef]
  21. Li, J.; Li, B.; Pan, Z.; Wang, Z.; Yang, K.; Ren, C.; Xu, J. Coal permeability evolution under different water-bearing conditions. Nat. Resour. Res. 2020, 29, 2451–2465. [Google Scholar] [CrossRef]
  22. Somr, M.; Nežerka, V.; Kabele, P.; Švagera, O. Review of Discrete Fracture Network Modeling; SÚRAO: Prague, Czech Republic, 2016. [Google Scholar]
  23. Wei, M.; Liu, J.; Shi, R.; Elsworth, D.; Liu, Z. Long-Term Evolution of Coal Permeability Under Effective Stresses Gap Between Matrix and Fracture During CO2 Injection. Transp. Porous Media 2019, 130, 969–983. [Google Scholar] [CrossRef]
  24. Sander, R.; Pan, Z.; Connell, L.D. Laboratory measurement of low permeability unconventional gas reservoir rocks: A review of experimental methods. J. Nat. Gas Sci. Eng. 2017, 37, 248–279. [Google Scholar] [CrossRef]
  25. Wang, C.; Wang, H.; Elsworth, D.; Cui, G.; Li, B.; Zhou, M.; Li, W.; Zhang, J. Revaluating coal permeability-gas pressure relation under various gas pressure differential conditions. Int. J. Coal Sci. Technol. 2023, 10, 55. [Google Scholar] [CrossRef]
  26. Purl, R.; Evanoff, J.; Brugler, M. Measurement of coal cleat porosity and relative permeability characteristics. In Proceedings of the SPE Gas Technology Symposium, Houston, TX, USA, 22–24 January 1991. [Google Scholar]
  27. Palmer, I. Permeability changes in coal: Analytical modeling. Int. J. Coal Geol. 2009, 77, 119–126. [Google Scholar] [CrossRef]
  28. Sparks, D.; McLendon, T.; Saulsberry, J.; Lambert, S. The effects of stress on coalbed reservoir performance, Black Warrior Basin, USA. In Proceedings of the SPE Annual Technical Conference and Exhibition, Dallas, TX, USA, 22–25 October 1995; pp. 339–351. [Google Scholar]
  29. Cui, X.; Bustin, R.M. Volumetric strain associated with methane desorption and its impact on coalbed gas production from deep coal seams. AAPG Bull. 2005, 89, 1181–1202. [Google Scholar] [CrossRef]
  30. Palmer, I.; Mansoori, J. How permeability depends on stress and pore pressure in coalbeds: A new model. In Proceedings of the SPE Annual Technical Conference and Exhibition, Denver, CO, USA, 6–9 October 1996. [Google Scholar]
  31. Zhu, Z.; Zhao, B.; Tian, C.; Sheng, Q.; Li, Z.; Zhang, N.; Wang, J.; Yang, X. Polyaspartic acid, an eco-friendly regulator for the improvement of coking coal flotation: Applications and mechanism. Int. J. Coal Prep. Util. 2024, 44, 2180–2199. [Google Scholar] [CrossRef]
  32. Wang, S.; Elsworth, D.; Liu, J. Permeability evolution in fractured coal: The roles of fracture geometry and water-content. Int. J. Coal Geol. 2011, 87, 13–25. [Google Scholar] [CrossRef]
Figure 1. Permeability test sample processing steps.
Processes 13 01509 g001
Figure 2. Photo of permeability test samples. (a) Bright coal. (b) Dull coal.
Processes 13 01509 g002
Figure 3. Permeability anisotropy test equipment.
Processes 13 01509 g003
Figure 4. Experimental rubber sleeve (left) and standard steel sample (right).
Processes 13 01509 g004
Figure 5. Air tightness test of experimental equipment. (a) Upstream pressure change trend; (b) downstream pressure variation trend; (c) overall change trend of upstream and downstream pressure.
Processes 13 01509 g005
Figure 6. CT scan results of filled fracture for bright coal. (a) Development characteristics of fractures in the XY direction; (b) development characteristics of fractures in the XZ direction; (c) development characteristics of fractures in the YZ direction.
Processes 13 01509 g006
Figure 7. Fracture parameter distribution statistics of filled fracture for bright coal. (a) Distribution of fracture number with varying apertures; (b) distribution of fracture surface area with varying apertures; (c) distribution of fracture volume with varying apertures; (d) statistical results of fractures in different orientations.
Processes 13 01509 g007
Figure 8. CT scan results of opening fracture for bright coal. (a) Development characteristics of fractures in the XY direction; (b) development characteristics of fractures in the XZ direction; (c) development characteristics of fractures in the YZ direction.
Processes 13 01509 g008
Figure 9. Fracture parameter distribution statistics of opening fracture for bright coal. (a) Distribution of fracture number with varying apertures; (b) distribution of fracture surface area with varying apertures; (c) distribution of fracture volume with varying apertures; (d) statistical results of fractures in different orientations.
Processes 13 01509 g009
Figure 10. CT scan results of filled fracture for dull coal. (a) Development characteristics of fractures in the XY direction; (b) development characteristics of fractures in the XZ direction; (c) development characteristics of fractures in the YZ direction.
Processes 13 01509 g010
Figure 11. Fracture parameter distribution statistics of filled fracture for dull coal. (a) Distribution of fracture number with varying apertures; (b) distribution of fracture surface area with varying apertures; (c) distribution of fracture volume with varying apertures; (d) statistical results of fractures in different orientations.
Processes 13 01509 g011
Figure 12. CT scan results of opening fracture for dull coal. (a) Development characteristics of fractures in the XY direction; (b) development characteristics of fractures in the XZ direction; (c) development characteristics of fractures in the YZ direction.
Processes 13 01509 g012
Figure 13. Fracture parameter distribution statistics of opening fracture for dull coal. (a) Distribution of fracture number with varying apertures; (b) distribution of fracture surface area with varying apertures; (c) distribution of fracture volume with varying apertures; (d) statistical results of fractures in different orientations.
Processes 13 01509 g013
Figure 14. Evolution of permeability in different directions of bright coal with confining pressure. (a) Cartesian coordinate axis. (b) Logarithmic coordinate axis.
Processes 13 01509 g014
Figure 15. Evolution of permeability in different directions of dull coal with confining pressure. (a) Cartesian coordinate axis. (b) Logarithmic coordinate axis.
Processes 13 01509 g015
Figure 16. Fitting curve of permeability evolution with effective stress in different directions for bright coal.
Processes 13 01509 g016
Figure 17. Fitting curve of permeability evolution with effective stress in different directions for dull coal.
Processes 13 01509 g017
Figure 18. The development characteristics of mineral-filled fractures in coal.
Processes 13 01509 g018
Figure 19. Comparison chart of the development characteristics of bright coal and dull coal fractures.
Processes 13 01509 g019
Figure 20. The contrast in permeability disparities between bright coal and dull coal. (a) The disparity of permeability values. (b) Permeability decay rate. (c) Anisotropy of permeability.
Processes 13 01509 g020aProcesses 13 01509 g020b
Figure 21. Prediction of the variation pattern of permeability of bright coal with burial depth.
Processes 13 01509 g021
Figure 22. Prediction of the variation pattern of permeability of dull coal with burial depth.
Processes 13 01509 g022
Table 1. Proximate analysis results of coal samples.
Main ParameterBright CoalDull Coal
Mad0.630.49
Aad5.5320.59
Vdaf6.4314.75
FCad87.8267.29
Mad: moisture content (air-dried basis), %; Aad: Ash yield (air-dried basis), %; Vdaf: volatile content (dry, ash and free basis), %; FCad: fixed carbon content (air-dried basis), %.
Table 2. The main technical parameters and technical index of the permeability test device.
Main ParameterThe Distribution Range of Main Parameters
Maximum axial and confining pressureAxial 70 MPa, circumferential 50 MPa
Gas flow meter rangeFlow rate: ≤500 mL/min; Accuracy 0.001 mL/min
Maximum gas injection pressure20 MPa
Gas pressure sensor accuracyFull scale ± 0.25%
Table 3. Permeability values of bright coal in different directions.
Confining PressureHorizontal Direction 1Horizontal Direction 2Vertical Direction
MPaPermeability
(μD)
Rate of Decline
(%)
Permeability
(μD)
Rate of Decline
(%)
Permeability
(μD)
Rate of Decline
(%)
5189.71 0.0%369.52 0.0%69.71 0.0%
1054.40 71.3%92.95 74.8%21.18 69.6%
1517.52 90.8%20.27 94.5%7.39 89.4%
207.09 96.3%9.07 97.5%3.36 95.2%
253.97 97.9%6.11 98.3%1.07 98.5%
Table 4. Permeability values of dull coal in different directions.
Confining PressureHorizontal Direction 1Horizontal Direction 2Vertical Direction
MPaPermeability
(μD)
Rate of Decline
(%)
Permeability
(μD)
Rate of Decline
(%)
Permeability
(μD)
Rate of Decline
(%)
522.93 0.0%105.14 0.0%2.43 0.0%
1010.21 55.5%35.81 65.9%1.20 50.5%
155.59 75.6%14.55 86.2%0.73 70.1%
202.95 87.1%7.09 93.3%0.45 81.5%
251.65 92.8%4.71 95.5%0.31 87.1%
Table 5. Fitting function for permeability evolution in different directions for bright coal.
Direction of Seepage Flowk0Permeability Fitting FunctionCompressibility Coefficient of the Fractures (Cpσ)
Horizontal direction 1 k 01 = 411.58 k 1 = k 01 e 0.195 x 0.065
Horizontal direction 2 k 02 = 775.22 k 2 = k 02 e 0.211 x 0.070
Vertical direction k 03 = 176.59 k 3 = k 03 e 0.204 x 0.068
Table 6. Fitting function for permeability evolution in different directions for dull coal.
Direction of Seepage Flowk0Permeability Fitting FunctionCompressibility Coefficient of the Fractures (Cpσ)
Horizontal direction 1 k 01 = 40.61 k 1 = k 01 e 0.13 x 0.043
Horizontal direction 2 k 02 = 187.40 k 2 = k 02 e 0.157 x 0.052
Vertical direction k 03 = 3.59 k 3 = k 03 e 0.101 x 0.034
Disclaimer/Publisher’s Note: The statements, opinions and data contained in all publications are solely those of the individual author(s) and contributor(s) and not of MDPI and/or the editor(s). MDPI and/or the editor(s) disclaim responsibility for any injury to people or property resulting from any ideas, methods, instructions or products referred to in the content.

