Abstract
More efficient energy conversion systems operating with clean energy sources or utilizing waste heat are crucial to minimizing the negative environmental impact associated with conventional systems. This study presents the energy and exergy analysis of a modified heat pump capable of producing cooling and desalinated water using heat dissipated in the condenser. Six refrigerants were analyzed in the theoretical evaluation of the proposed system. These were selected based on their use in vapor compression systems and their thermodynamic properties. A parametric study considering operating temperatures and relative humidities determined that refrigerant R-123 achieved the greatest benefits in terms of the EER, the GOR, and . In contrast, the highest benefits in water desalination were obtained with refrigerant R-410a. For operating conditions of TE = 0 °C, TC = 34 °C, and TCA = 14 °C, the system using refrigerant R-123 achieved an EER, GOR, , DW, and IT of 0.82, 2.51, 0.35, 3.46 L/h, and 0.55 kW, respectively. Additionally, the dehumidifier and the evaporator were the components contributing the highest irreversibilities, accounting for approximately 24% and 19.3%, respectively.
1. Introduction
The United Nations Sustainable Development Goal No. 7 aims to ensure access to affordable, reliable, sustainable, and modern energy. However, conventional energy generation systems often fail to meet these criteria and significantly contribute to greenhouse gas emissions. Cooling systems are among the most widely used energy applications worldwide. In 2018, approximately 3.6 billion cooling devices were in use [1], yet by 2023, around 1.12 billion people were at high risk due to a lack of access to cooling [2]. This gap highlights the urgent need for more cooling solutions. Water security is another major global concern; currently, over one billion people face water scarcity, and in 2025, this number could rise to 3.5 billion [3]. Various strategies have been implemented to mitigate this crisis, including improved water management, smart agricultural systems, ecosystem restoration, public awareness campaigns, and technological innovations such as rainwater harvesting and seawater desalination. This last approach is particularly relevant for coastal regions with high cooling demand. Consequently, hybrid cooling and desalination systems have become a growing area of research. Current research on combined desalination and cooling systems focuses mainly on two methods: membrane-based methods, such as the widely used reverse osmosis (RO), and thermal methods, including multi-effect distillation (MED), multistage flash (MSF), and vapor compression (VC) [4]. RO, a well-established technology, filters saline water through a semipermeable membrane under high pressure, requiring 3.5–5.5 kWh of electricity per cubic meter of freshwater [5]. Thermal methods rely on phase change processes consuming 1.5–3.5 kWh of electricity plus ~80 kWh of thermal energy per cubic meter [6]. While thermal methods are more energy-intensive than RO, ongoing research aims to develop more efficient hybrid technologies and integrate alternative energy sources. The following paragraphs describe some of the strategies reported in the literature for simultaneous cooling and water desalination. Specifically, the reported research focuses on thermal methods for desalination, as these strategies are of greater relevance to the present work. This review is classified according to the method utilized for cooling production.
1.1. Compression Systems
Petersen et al. [7] investigated large-scale transcritical CO2 heat pumps integrated with thermal desalination for sustainable water production and district cooling. They found that hybrid thermal desalination powered by CO2 heat pumps consumed the same electricity as reverse osmosis (9.6 kWh/m3). A commercial 19 MW heat pump could produce 64,000 m3/day of potable water and deliver 75 MW of cooling. Abdulwahid et al. [4] performed a thermoeconomic comparison of two MED systems coupled with a transcritical CO2 cooling system, using compressor waste heat as the thermal source. They showed that a secondary booster module improved both thermodynamic and economic performance. Farsi et al. [8] studied a transcritical CO2 system combined with a Boosted-MED setup, achieving 57% lower energy use and reducing annual costs by 37.8% in Iran and 29.1% in Toronto compared to standalone systems. In another study, Farsi et al. [9] compared three configurations of supercritical CO2 refrigeration and MED systems, finding the recovery ratio to be the most sensitive parameter among the COP, the recovery ratio, and exergy efficiency. Similarly, Sahana et al. [10] proposed an integrated system utilizing geothermal heat from oilfield water, where a supercritical CO2 cycle generates power to drive a CO2 refrigeration compressor. The system produces cooling, and the rejected heat powers an HDH desalination unit. At an evaporator temperature of −15 °C, it achieved 380.32 kW of cooling and 0.349 kg/s of freshwater production.
Anand et al. [11] experimentally studied a combined cooling and desalination system based on a modified mechanical heat pump. Integrating an HDH unit into a VCR cycle, where the evaporative condenser acts as a humidifier and the evaporator as a dehumidifier, the system produced up to 2.94 L/h of freshwater and 4.39 kW of cooling, while offsetting 3.5 kW of urban heat island load per ton of refrigeration. By eliminating extra heat sources and power-consuming components, the system improved overall efficiency. Anand and Murugavelh [12] further enhanced the concept using an evaporative condenser in a VCR-HDH system, reducing condensing temperature and compressor workload. Their system reached a desalination yield of 7.35 L/h, cooling output of 1.89 kW, 39.34% exergy efficiency, and a desalination cost of USD 0.0096/L. Anand et al. [13] also developed a dual-mode heat pump system for water purification and cooling. In combined mode, it delivered 4.55 L/h of freshwater, 0.82 kWth of cooling, a gained output ratio of 3.79, and a COP of 0.75. In cooling-only mode, it provided 3.79 kWth with a COP of 3.82.
Delgado-Gonzaga et al. [14] analyzed a cogeneration system integrating a double-stage cascade VCR cycle with a desalination unit, utilizing waste heat. Using R-134a in the bottom cycle and R-123 in the top achieved extreme temperatures (−13 °C and 105 °C), but the best performance occurred with R-123 in both cycles.
Jabari et al. [15] proposed a biogas-powered system for simultaneous cooling, desalinated water production, and electricity generation. Using biogas (60% CH4, 40% CO2) as a clean fuel, the system reduces emissions and fossil fuel use. Waste heat from gas turbine flue gases is recovered for air preheating and to drive an HDH desalination process. Srinivas et al. [16] took advantage of the cooling and heating functions of a compression heat pump to simultaneously produce freshwater and cooling. The VC-HDH system was able to produce up to 5 LPH of freshwater and 6.5 kW of cooling, with an energy performance ratio of 3.8 at airflow of 1000 m3/h.
1.2. Sorption Systems
Thermal cooling systems, such as adsorption cooling, are ideal for integrating desalination. Recently, Ghazy et al. [17] published a state-of-the-art review of adsorption systems driven by solar energy for desalination purposes. Aspects such as hybrid systems, the progress of solar adsorption desalination systems, configuration improvements, and adsorbent materials were summarized and presented. Alsaman et al. [18] reported a review of various adsorbents—silica gel, zeolites, and activated carbon—and found that the pressure-to-saturation pressure ratio determines if desalination or cooling dominates. High ratios favor desalination; low ones favor cooling. Askalany [19] proposed a hybrid VC-adsorption system with two adsorption beds and a compressor operating in six semi-continuous phases, achieving better water production, COP, and cooling load than conventional systems. Albaik et al. [20] experimentally analyzed a hybrid adsorption system with a desalination and cooling unit. Activated carbon and zeolite were used as adsorbent materials for the removal of iron, lead, manganese, and nickel from ground water, while a coating form of aluminum fumarate Metal–Organic Framework adsorbent material was used in the adsorption heat pump for desalination and cooling. This system produced more than 260 L/day of distilled water and 6.9 kW of cooling power with a coefficient of performance of 0.26. Mohammed et al. [21] proposed a hybrid adsorption/absorption configuration for cooling and desalination, performing energy and exergy analyses considering that the system is driven by transient heat sources, finding that the execution of a transient heat source of a sinusoidal waveform enhanced the water production by up to 30% and the cooling of absorption and adsorption subsystems by 24% and 15%, respectively.
Harby et al. [22] analyzed an ACS-RO hybrid where the RO unit is coupled to the evaporator via energy recovery, enhancing water quality and reducing electricity use versus standalone RO. Elbassoussi et al. [23] investigated a single-double-effect AHP combined with HDH desalination, powered by natural gas and waste heat. The system yielded 110–225 L/day of freshwater at USD 0.0068/L, with a COP of 1.06 and a gain–output ratio of 4.15–8.5. Esfahani et al. [24] introduced a system combining a multi-effect evaporation AHP with a VCR cycle. It reduces electricity use by 57.12%, heat energy by 5.61%, and annual costs by 25.6% compared to standalone setups. On the other hand, Qasem et al. [25] introduced an HDH desalination system integrated with a double-effect ACS to produce freshwater and provide cooling for air conditioning simultaneously. In this system, the seawater stream of the desalination unit cools the condenser and absorber of the ACS, while the heat rejected from these components drives the desalination process.
Mehrpooya et al. [26] developed a solar-powered NH3-H2O absorption cooling system integrated with MED. Using 21,030 kW of thermal energy from parabolic dishes, the system produced 4632 kW of electricity, 820.8 kW of cooling, and 22.79 kg/s of freshwater, with 66.05% exergy and 80.70% thermal efficiency. Soares et al. [27] designed a biogas-powered trigeneration system producing 104.4 kW of power, 12 kW of cooling, and 0.1231 kg/s of freshwater, with an Energy Utilization Factor of 1.024. It integrates a LiBr/H2O ACS and an HDH unit for optimized energy use. Safder et al. [28] proposed a trigeneration setup using a Kalina cycle to drive an NH3-H2O ACS, coupled with a hydrocarbon-based ORC and RO desalination. The system delivered 1725 kW power, 665 kW cooling, and 3.42 m3/h freshwater.
Ghaebi et al. [29] developed a geothermal-powered multigeneration system combining a Kalina cycle, ACS, HDH desalination, and water heating, achieving 94.84% thermal efficiency, 47.89% exergy efficiency, and an SUCP of USD 89.95/GJ. Ghiasirad et al. [30] proposed a similar system with an AHT, ORC, ACS, an HDH unit, and space heating, producing 78.4 kW power, 92.1 m3/day freshwater, 6.25 MW heating, and 4.99 MW cooling. Calise et al. [31] designed a solar–geothermal polygeneration system for Pantelleria Island, delivering electricity, thermal energy, and freshwater. It showed high summer efficiency and strong economic viability with short payback periods under public funding.
Cao et al. [32] evaluated a ship-based trigeneration system using engine waste heat via a regenerative ORC, single-effect ACS, and HDH desalination. It achieved 783.9 kW of power, 959.8 kW cooling, and 98.1 m3/day freshwater, with 58.4% energy and 43.0% exergy efficiency, and an exergy cost of USD 0.1494/kWh. Ayou et al. [33] proposed a solar–biomass polygeneration system using CGMD and NH3/H2O ACS, delivering 41.4 m3/day of water, 130 kW of cooling, and 6.4 kW of power. CGMD reduced membrane area by 53% vs. PGMD. Anvari et al. [34] designed a gas turbine–ORC–ACS–AHT system generating 30.5 MW of power, 40.8 MW of heating, 1 MW of cooling, and 0.364 kg/s of water, with CO2 emissions of 0.163 kg/kWh.
1.3. Other Systems
Gholizadeh et al. [35] optimized a biogas-driven trigeneration system (gas turbine, ORC-ejector cooling, and HDH desalination), identifying Toluene as the best working fluid. Optimization improved electricity (2.58%), cooling (22.69%), TGOR (14.04%), and exergy efficiency (13.26%) and reduced cost by 6.71%. Sadeghi et al. [36] proposed a multigeneration system using a power cycle, ejector refrigeration, and HDH desalination with isobutane–pentane. It achieved 17.12% exergy efficiency, 57.03 kW of power, and 91.25 kW of cooling. Alkhulaifi et al. [37] developed an ejector cooling–HDH desalination system, comparing solar- and waste heat-driven versions. The waste heat setup had the lowest freshwater cost (USD 0.00167/kWh) due to continuous operation and heat reuse. Singh et al. [38] proposed a system for cooling and desalination that utilized the flash evaporation method (FEM) creating a sudden depressurization into a vertical tube containing water. The change in pressure was induced by varying the initial water temperature and back pressure of the vacuum tank. It was observed that the evaporation and cooling rates were both enhanced by increasing the initial pool temperature and were decreased by increasing the back pressure. It was reported that the evaporation rate was improved by 29.7% with an increase in initial water temperature of 5 °C and decreased by 152% with an increase in the back pressure of 10 kPa.
This literature review highlights various hybrid systems designed for simultaneous cooling and desalination. However, these systems vary significantly in the technologies used to achieve these effects. Table 1 summarizes the research reported in this section describing the methods employed for obtaining the main outputs—cooling and desalination—as well as other outputs as heating or power (electricity), thus providing a quick look at the methods used as well as the useful products offered by each research consulted. Most studies focus on utilizing energy sources such as geothermal power, solar power, biofuels, or waste heat from conventional processes. These approaches often rely on thermal systems like sorption-based cooling, which generally operate less efficiently than electrically powered VC systems. This study aims to improve the energy utilization of a VC heat pump by recovering condensation heat that is typically wasted. Unlike the system proposed by Anand et al. [13], this research not only examines the impact of key operational parameters on performance but also evaluates the system using various working fluids, whose selection includes both commonly used refrigerants and environmentally friendly alternatives with lower Global Warming Potential (GWP).

Table 1.
Summary of the research consulted: methods and products.
2. System Description
Figure 1 shows the proposed system’s components and distribution. Starting from the operating principle of a vapor compression refrigeration cycle, the refrigerant exits the evaporator as saturated vapor (State 1) and is compressed until it reaches superheated conditions (State 2). It then passes through a condenser/humidifier, where it is cooled (State 3), releasing a quantity of thermal energy, . When the refrigerant exits the condenser, it is throttled, reducing its pressure and temperature (State 4).
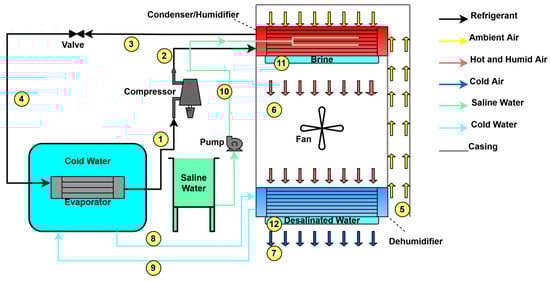
Figure 1.
A schematic diagram of a system for the simultaneous production of cooling and water desalination.
Simultaneously, during the refrigeration cycle’s operation, air in ambient conditions (State 5) enters the system; this air is humidified in the condenser/humidifier (State 6) and then dehumidified in a dehumidifier (State 7). The cooling effect generated by the refrigerant as it transitions from State 4 to State 1 is used to reduce the temperature of a volume of water. The resulting cold water is circulated through the dehumidifier (States 8 and 9), where it carries out the dehumidification process due to its low temperature.
For the humidification of the air entering the system, saline water is pumped (State 10) and droplets are sprayed over the condenser/humidifier, where is used to evaporate this water. The fraction that does not evaporate accumulates in a container with salinity levels higher than those in the initial conditions (State 11). Finally, the humid air produced passes through the dehumidifier, where cold water circulates, causing a portion of the humid air to condense, thereby collecting desalinated water from the process (State 12).
Although the system is based on modifying an air-conditioning window unit, it has the advantage that it could be sized at higher capacities. This can be performed by modifying the capacities of the compressor, fan, and heat exchangers. Compared to other systems, the proposed one has the advantage of simultaneously producing cooling and desalinated water. This is an advantage if the proposed system is installed, for instance, in fishing communities in which both services are necessary at a time. Nevertheless, it is important to take into account salinity since copper or steel heat exchangers will be corroded. Thus, stainless steel heat exchangers or other non-corrodible materials, such as carbon, would be necessary to use in zones where salt is present.
3. Refrigerants
Various factors influence the efficient operation of a refrigeration system, but the choice of refrigerant is crucial. To select an appropriate refrigerant, it must meet as many of the following criteria as possible [39]:
- Ozone- and environment-friendly.
- Low boiling temperature.
- Low volume of flow rate per unit capacity.
- Vaporization pressure lower than atmospheric pressure.
- High heat of vaporization.
- Nonflammable and nonexplosive.
- Noncorrosive and nontoxic.
- Nonreactive and nondepletive with lubricating oils of compressor.
- Nonacidic in case of mixture with water or air.
- Chemically stable.
- Suitable thermal and physical properties (e.g., thermal conductivity, viscosity).
- Commercially available.
- Easily detectable in case of leakage.
- Low cost.
The present study analyzed five refrigerants for the proposed system’s operation. These fluids were selected based on their reported thermodynamic benefits in the literature and their common use in commercial systems [14,40,41]. Table 2 shows some of the main thermodynamic, environmental, and safety characteristics.
Table 2.
Main characteristics of the refrigerants studied.
Among the refrigerants analyzed in Table 2, R-600a stands out as the most environmentally friendly option due to its very low GWP and ODP. As a natural hydrocarbon, it is one of the greenest refrigerants available. However, despite its environmental advantages, its flammability restricts its use to specific systems or operating conditions. R-123, on the other hand, has a low GWP, better than most synthetic refrigerants. However, it does have an ozone depletion potential, which is a significant drawback today as international efforts aim to phase out all ozone-depleting substances. Its use is currently restricted and being phased out under international agreements such as the Montreal Protocol and its amendments.
R-32 offers a moderate GWP (significantly lower than that of R-410a) and poses no threat to the ozone layer. While it is mildly flammable, this risk is considered manageable. Because of its balanced environmental and performance characteristics, R-32 is increasingly being adopted as a replacement for R-410a in various applications. R-245fa has no ODP, which is a positive trait; however, its high GWP makes it a significant contributor to climate change. It is more commonly used in Organic Rankine Cycle systems than in conventional refrigeration due to these characteristics.
Finally, R-410a has the worst environmental performance among the refrigerants considered. Although it does not harm the ozone layer, its extremely high GWP has led to its gradual phase-out in many countries. While it was once considered an improvement over ozone-depleting substances, it is now regarded as environmentally obsolete.
ASHRAE sets refrigerant safety codes, which consist of a combination of letters and numbers that indicate their toxicity and flammability. The classification consists of two parts: The letter (A or B) represents toxicity, where A stands for low toxicity and B for high toxicity. The number (1, 2, 2L, or 3) indicates flammability, with 1 being nonflammable, 2 slightly flammable, 2L a low flame propagation rate, and 3 highly flammable. For example, R-410a has an A1 classification, which means that it has low toxicity and is nonflammable, while R-600a is A3, which indicates low toxicity but high flammability.
4. Thermodynamic Model
Through mass, energy, and exergy balances in each system component, the equations used for the development of a computational algorithm in Matlab (Mathworks, Mexico City, Mexico, 9.14.0.2254940 (R2023a)) were determined and are presented in Table 3. Within the Matlab environment, an interface with Coolprop (v.6.8.0) was developed to use the subroutines for humid air and the different refrigerants selected in this study. The following considerations were considered in the computational algorithm:
Table 3.
Mass, energy, and exergy balances.
- The system operates in a steady state.
- Heat and pressure losses between the components are considered negligible.
- The cooling load of the air conditioning unit is 3.51 kW of refrigeration.
- The refrigerant leaving the evaporator and condenser/humidifier is in a saturated state.
To determine the amount of water desalinated by the system, Equation (1) is used, which is a function of the specific humidity of the air at the inlet and outlet of the heat exchanger used for dehumidification.
Equations (2) and (3) are parameters used to analyze the system performance. In Equation (2) the gain–output ratio (GOR) represents the amount of desalinated water produced to the total energy supplied to the system, while the energy efficiency ratio (EER) in Equation (3) is a measure of the cooling produced by the system to the net power supplied ().
where the net power () is determined by adding the power supplied to the fan (), the pumps (), and the compressor (). The power of the pumps and the fan were determined through the design of an experimental prototype of the proposed system, where the values obtained were 0.14 and 0.10 kW, respectively.
The exergy efficiency is calculated using Equation (4), which considers the exergy supplied to the process () and the total irreversibilities generated in the system (, both terms expressed in kW.
where
5. Model Validation
The subroutines and the model were validated by comparing them with a similar system reported by Anand and Murugavelh [12]. The system proposed in the literature is used for water desalination and air cooling, using the heat dissipated in the condenser and the cooling effect of the evaporator to perform humidification and dehumidification processes.
In the validation, both models were evaluated under the following operating conditions: TE = 5 °C; TC = 32.99 °C; TAir = 5 °C; and RH = 0.95.
Table 4 shows the main parameters obtained as well as the error percentage of the models.
Table 4.
Comparison of main results.
A second validation was carried out, comparing the thermal energy extracted from the air during the process for the model proposed by Anand et al. [13] and the present work. Table 5 shows the results obtained by both models for a TE = −2 °C; TCA = 14 °C; RH = 0.55; and an ambient temperature range from 23 to 35 °C. From the comparison of results, an average error of 2.21% and an R2 of 0.99 were obtained.
Table 5.
A comparison of thermal energy extracted from the air () with the model proposed by Anand et al. [13] and the present work.
6. Results
6.1. Influence of Condensation Temperature (TC)
Figure 2 shows the energy availability for water desalination () and the power supplied to the compressor as a function of TC. The condensation temperature is one of the main parameters determining the system’s performance. As can be seen, at higher temperatures, increased, causing the saline water sprayed on the evaporative condenser to easily evaporate. However, more energy had to be supplied to the compressor when TC increased.
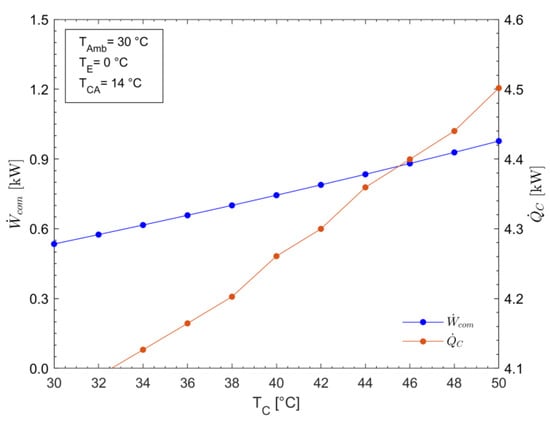
Figure 2.
and as a function of TC.
Figure 3 shows the EER as a function of Tc. It can be observed that for all the refrigerants, EER decreased with the increment in TC. This decrease occurred because of the increase in the power consumed by the compressor, as is seen in Figure 3. The highest EER values were obtained with R-123, which decreased from 0.91 to 0.58 when TC increased from 30 °C to 50 °C. The lowest EER values were obtained with the refrigerant R-410a, and these were about 10% lower than those obtained with R-123.
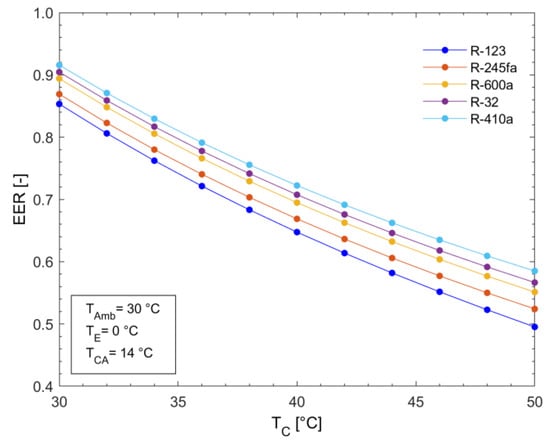
Figure 3.
EER as a function of TC.
Figure 4 shows that had a similar tendency to the EER for all refrigerants. This decrease occurred again due to the increase in the power supplied to the compressor. R-123 achieved the highest values compared to the rest of the refrigerants analyzed. Its highest value was 0.39 at TC = 30 °C, while R-410a achieved the lowest values, reaching just 0.21 at the same condenser temperature.
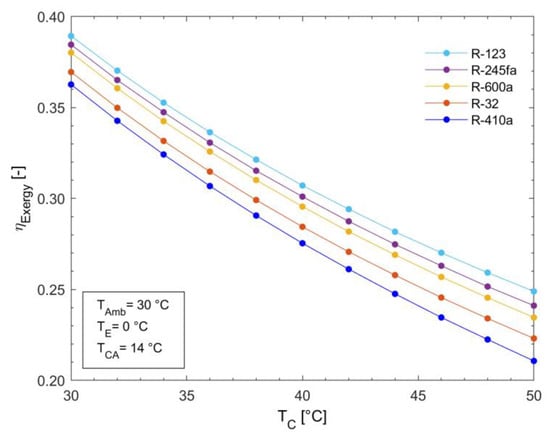
Figure 4.
as a function of TC.
On the other hand, from Figure 5, it is observed that the amount of desalinated water (DW) increased with the increment in Tc. This result was expected since, as is observed in Figure 2, the increase in TC caused an increment in the heat delivered by the condenser, thus increasing the availability of heat for the desalination process. In this case, the highest values of DW were obtained using R-410a, going from 3.44 L/h to 4.23 L/h when the condensation temperature increased from 30 to 50 °C. In the temperature range analyzed, all refrigerants produce between 3 and 4 L/h of desalinated water; the variation between one and another was very small. For instance, with R-123 at TC = 40 °C, the system produced 3.63 L/h; with R-410a, the value was 3.79 L/h, just 4.4% less.
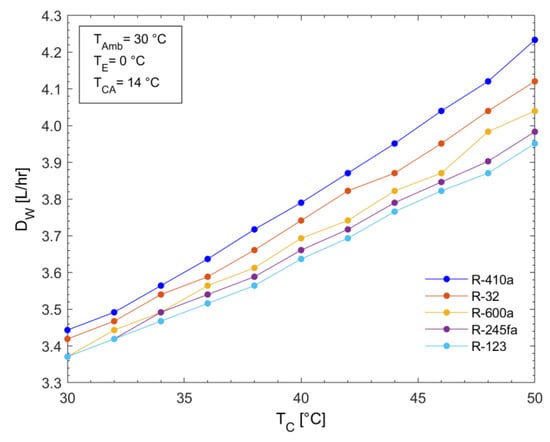
Figure 5.
DW as a function of TC.
Figure 6 shows that increasing the condensation temperature decreased the GOR for all the refrigerants. This occurred because of the increase in the power supply compared to the increase in desalinated water production. The highest GOR values were achieved with R-123; however, they considerably decreased, passing from 2.69 to 2.02 when TC increased from 30 °C to 50 °C. The second-best values were obtained with R-245fa, followed by R-600a, while the lowest values were again obtained with R-410a.
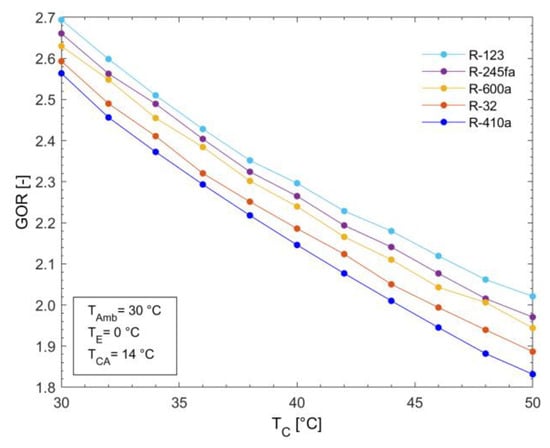
Figure 6.
The GOR as a function of TC.
The analysis of the system performance as a function of TC showed that the highest values of the EER, the GOR, and were obtained with R-123, although the distilled water production was the lowest. The opposite occurred with R-410a. These behaviors exclusively depended on the thermodynamic properties of the refrigerants since the same assumptions were made for all of them.
6.2. Influence of Ambient Temperature (TAmb)
As can be seen in Figure 7, using R-123 as an example, increased more rapidly than with the increment in TAmb. For instance, when TAmb increased from 25 to 29 °C, increased from 0.37 kW to 0.64 kW, which was a 73% increment, while for the same increment in TC, increased from 0.85 kW to 0.95 kW, which was just an 11.76% increment.
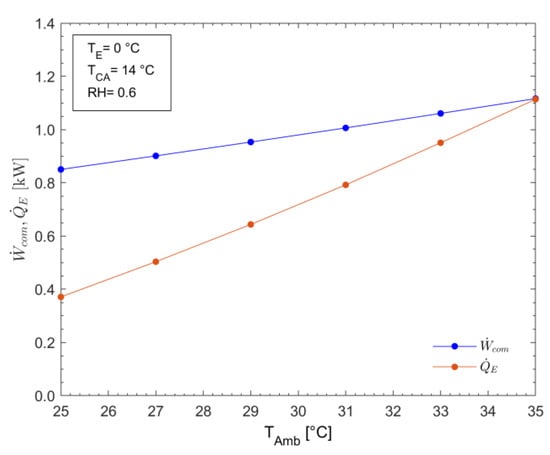
Figure 7.
and as a function of TAmb.
The temperature of the air entering the system was an important parameter for the analysis. The specific humidity changed as the temperature increased and the relative humidity (RH) remained constant.
As can be observed in Figure 8, the EER increased with the increment in TAmb. This tendency occurred since an increment in TAmb caused an enthalpy increase, and thus increased; and, since rose more rapidly than from Equation (3), it is clear that the EER increased. The highest EER was achieved with R-123 at a TAmb of 35 °C, for which the EER was 0.81, while the lowest value was obtained with R-410a achieving a value of 0.68, when TAmb was 35 °C.
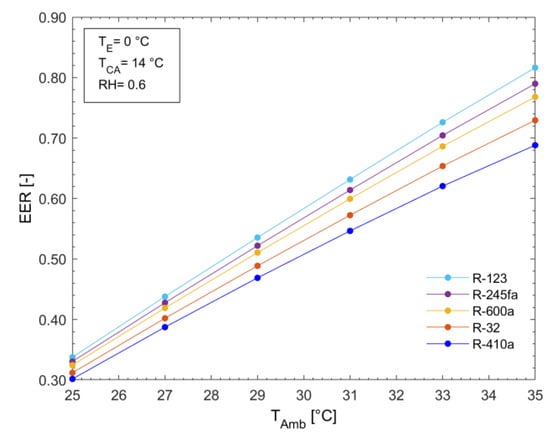
Figure 8.
The EER as a function of TAmb.
Figure 9 shows the variations in as a function of TAmb. It can be observed that by increasing TAmb and keeping the condensation and evaporation temperatures constant, the system improved its exergy efficiency for all the refrigerants. It can be seen that R-123 and R-245fa achieved the highest efficiency values, while the lowest values were obtained using R-32 and R-410a. Using R-123 as the working fluid at TAmb = 35 °C, was 4.17% better compared to that of R-245fa, while when compared to that of R-410a, this difference was 16.67%.
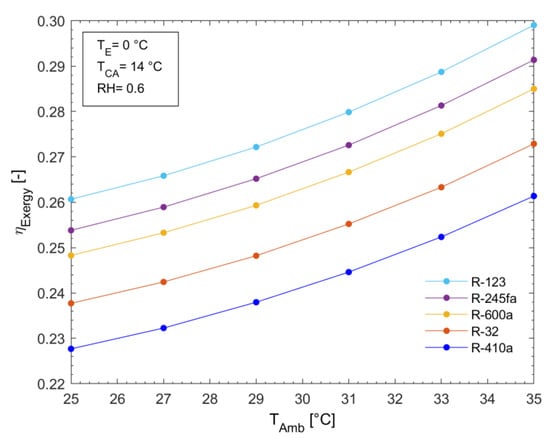
Figure 9.
as a function of TAmb.
Figure 9 shows the variation in as a function of TAmb. Equation (4) indicates that depends on the exergy supplied and the irreversibilities present in the process. As TAmb increased, the system tended to condense at higher temperatures and, therefore, at a higher pressure, causing an increase in and the exergy supplied to the system, thus decreasing . It can be observed that R-123 and R-245fa achieved the highest efficiency values, while the lowest were obtained using R-32 and R-410a. Using R-123 as the working fluid at TAmb = 35 °C, was 4.17% better compared to that of R-245fa, while when compared to that of R-410a, this difference was 16.67%.
During the humidification process, by establishing the relative humidity of State 6 and increasing the temperature of the air entering the system, a higher specific humidity was achieved. Therefore, the amount of water vapor in the air was greater, thus increasing the system’s capability to recover water during the dehumidification process. Figure 10 shows DW as a function of TAmb. It is seen that the greatest amount of desalinated water could be obtained using the R-410a refrigerant, achieving a maximum of 4.99 L/h at TAmb of 35 °C. The lowest values of DW were obtained with R-410a.
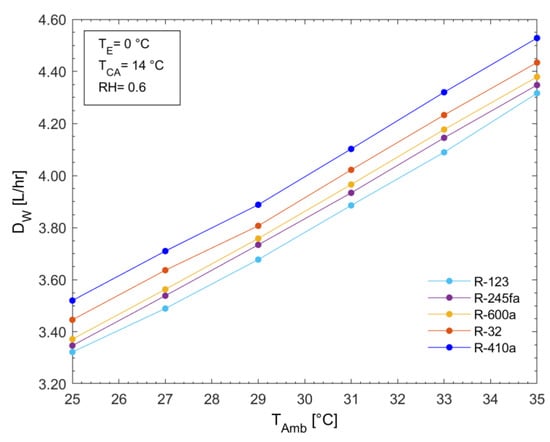
Figure 10.
DW as a function of TAmb.
Figure 11 shows the GOR trends as a function of TAmb. It can be observed that the GOR increased with the increment in TAmb for all the refrigerants. This increment occurred due to the increase in the desalinated water produced for the reasons mentioned in Figure 10. The highest GOR values were obtained with R-123 at TAmb = 35 °C, reaching up to 2.14, while the lowest values were obtained with R-410a.
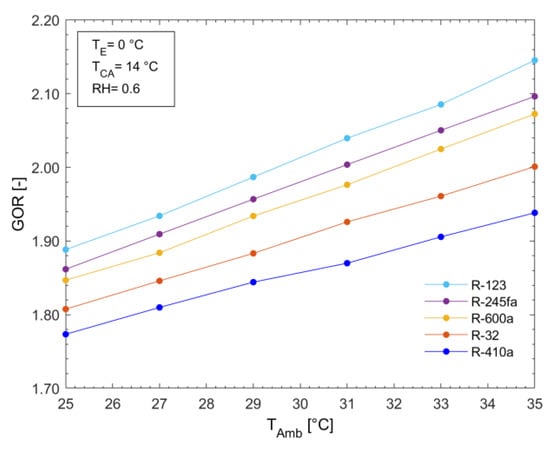
Figure 11.
GOR as a function of TAmb.
As was observed from the analysis, the ambient temperature was an important parameter that considerably affected the system’s performance. While the EER, DW, and the GOR increased with the increment in this parameter, decreased. As was mentioned, these behaviors occurred since the increment in TAmb caused an increase in the heat delivered in the condenser, which was used for desalinated water production, while decreased since the increase in TAmb caused an increment in the power and exergy supplied to the system.
6.3. Influence of Relative Humidity (RH)
Relative humidity was another important parameter to analyze since it was related to the system capacity of humidification and dehumidification and, therefore, of the desalinated water produced.
Figure 12 shows the system’s EER as a function of the RH of the air entering the system. As mentioned in the previous paragraph, the increase in relative humidity caused an increase in the enthalpy of the air–water mixture, which resulted in a greater difference in this property between the system’s inlet and outlet, thus increasing the EER. The highest values were again obtained using R-123, while the lowest values were obtained using R-410a. At RH = 0.60, the highest EER was 0.64, while the lowest value was 0.56 at the same RH using R-410a.
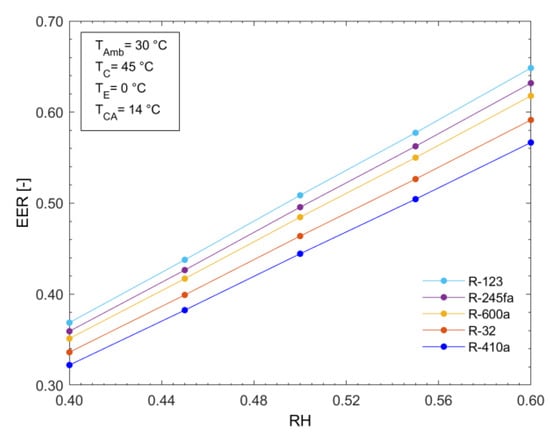
Figure 12.
EER as a function of RH.
Increasing the relative humidity of the air entering the system caused the exergy efficiency to increase for all the refrigerants. This tendency occurred because of the increment in the EER and also the increase in the desalinated water production, as can be seen in Figure 14. In Figure 13, it can be seen that the highest values were obtained using R-123 and R-245fa, while the lowest were obtained with R-32 and R-410a. The highest value achieved with R-123 was 0.272.
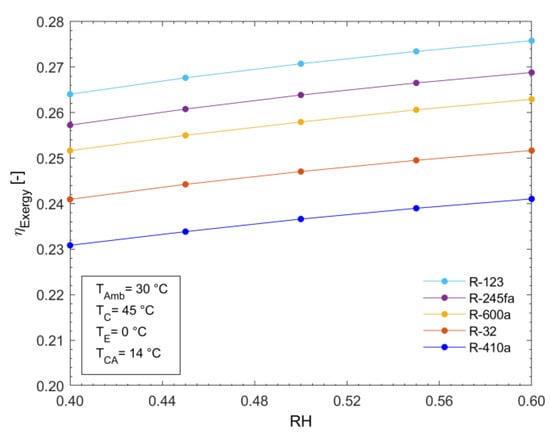
Figure 13.
as a function of RH.
By increasing the relative humidity of the air, its specific humidity was also increased, so during the dehumidification process, a greater quantity of water could be obtained. Figure 14 shows the variation in DW as a function of RH. It can be observed that the highest values of DW were achieved using R-410a, varying from 3.62 L/h to 3.98 L/h of water, in the range of 0.40 to 0.60 RH. If the amount of desalinated water produced using R-410a is compared to that produced using R-123, which is the refrigerant that showed the best benefits in terms of the EER and , it can be observed that there was higher production, close to 5.56%, since, for conditions of RH = 0.5, TAm = 30 °C, TE = 0 °C, and TC = 45 °C, the system with the R-123 refrigerant produced 3.6 L/h of water and that with R-410a produced 3.8 L/h.
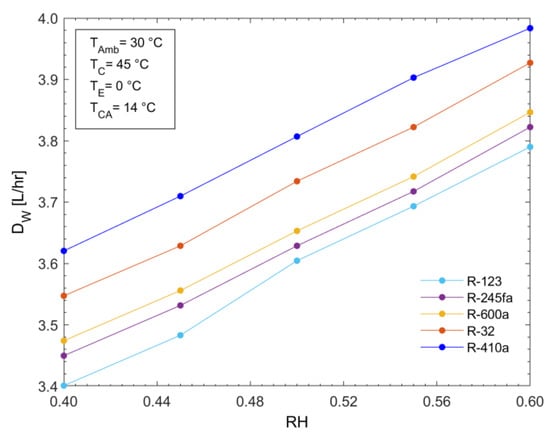
Figure 14.
DW as a function of RH.
By increasing the quantity of desalinated water produced due to the increment in RH in the air at the system inlet, the GOR parameter improved for all the refrigerants analyzed, as shown in Figure 15. The refrigerant with the highest GOR values within the relative humidity range of 0.40 to 0.60 was R-123, reaching a maximum value of 2.24 at an RH = 0.60. When comparing this GOR value with that of the refrigerant exhibiting the lowest performance (R-410a), an improvement of 12.5% in the GOR was observed, as the maximum value obtained when using R-410a was 1.96 under the same operating conditions.
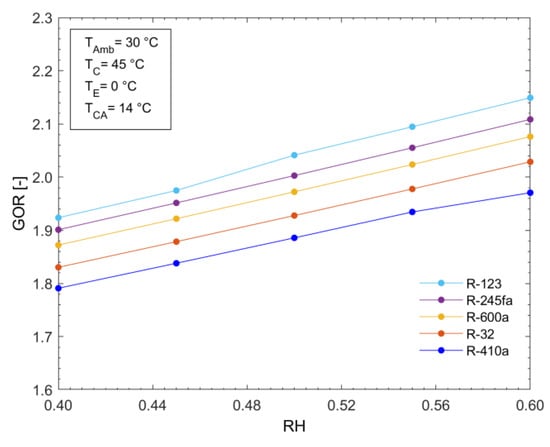
Figure 15.
The GOR as a function of RH.
6.4. Exergy Analysis
The sum of the irreversibilities produced with the proposed system in each component for all the analyzed refrigerants is shown in Figure 16. For the operating conditions of TAmb = 30 °C, TE = 0 °C, TC = 34 °C, TCA = 14 °C, and RH = 0.60, it was found that the lowest irreversibilities were obtained with R-123, obtaining values of 0.55 kW. The dehumidifier and the evaporator were the components with the highest irreversibilities, contributing 24.42% and 19.30%, respectively, using R-123. Under these same operating conditions, the refrigerant with the highest irreversibilities was R-410a, reaching 0.63 kW, 14.5% higher than those obtained with R-123.
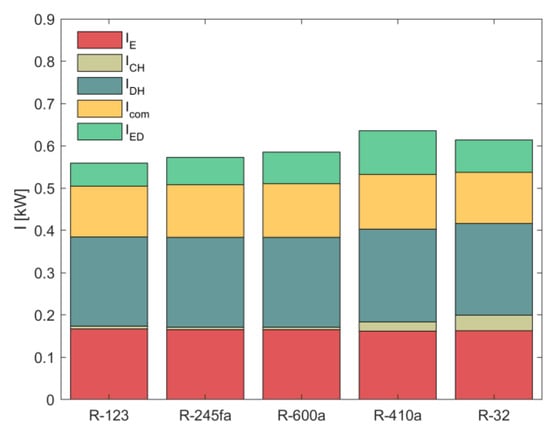
Figure 16.
Irreversibilities produced by components for each refrigerant.
The Grassmann diagram in Figure 17, using R-123 as a refrigerant, shows the total exergy input to the system and the irreversibilities presented in each component, as well as the exergy used, operating under the conditions described in the previous Figure 15. Table 6 also presents the properties of the system using R-123 for each specific state.
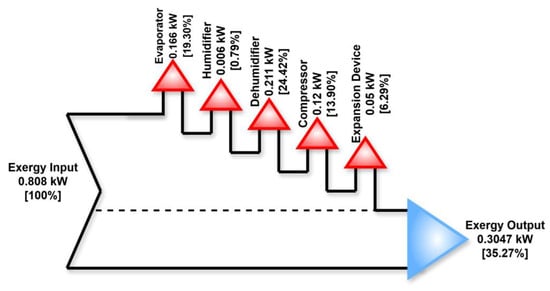
Figure 17.
Grassman diagram of system operating with R-123.
Table 6.
Properties of working fluids at the respective state points in the proposed system (using R-123 at TAmb = 30 °C; TE = 0 °C; TC = 34 °C; TCA = 14 °C; and RH = 0.60).
6.5. Summary of Results
Condensing temperature significantly affected the performance of the desalination and cooling system. A higher TC facilitated the evaporation of the saline water but also increased compressor power consumption, which reduced both the EER and . On the other hand, the GOR decreased with increasing TC due to a disproportionate increase in compressor power relative to the amount of desalinated water. Figure 6 shows that, for R-123, increasing the condensation temperature from 30 °C to 40 °C resulted in a 39.62% increase in compressor power but only a 7.72% increase in water production, which reduced the GOR from 2.69 to 2.27.
Ambient temperature also affected system performance. A higher TAmb increased the cooling load since the difference in air temperature between the inlet and outlet of the system was greater, which improved the EER as the cold air and evaporation conditions remained constant. It is important to mention that a higher TAmb improved humidification, which increased the water vapor content and enhanced water recovery. Figure 10 shows that R-410a achieved the highest desalination rate (4.99 L/h at 35 °C), 4.39% higher than the second-best refrigerant. Meanwhile, the GOR improved with increasing TAmb, and R-123 reached the highest value (2.14), 8.88% higher than that of R-410a (see Figure 11).
Relative humidity also played a key role. Increasing RH increased the specific humidity and enthalpy of the incoming air, leading to a higher cooling load and an improved EER. Figure 12 shows that at an RH of 0.60, R-123 achieved an EER of 0.64, outperforming R-600a (0.61). followed a similar trend, with R-123 and R-245fa presenting the highest values, while R-32 and R-410a exhibited lower performance.
The system irreversibilities, illustrated in Figure 16, show that R-123 presented the lowest irreversibilities (IT = 0.55 kW). In contrast, R-410a exhibited the highest irreversibilities (0.63 kW), 14.5% more than those of R-123 under the same operating conditions. The dehumidifier and evaporator were the components that contributed the most to the system’s irreversibilities, accounting for 24.42% and 19.30%, respectively. The fact that these components contributed the most to exergy destruction was expected since a phase change processes occurred inside these components.
As for the working fluids, based on the analysis of the different performance parameters evaluated in this section and under the given operating conditions, the best results in terms of the GOR, exergy efficiency, and the EER were obtained using R-123, followed by R-245fa and R-600a. From a purely technical perspective, R-123 is the most suitable refrigerant among those analyzed for operating the proposed system. However, considering environmental impact, R-123 stands out as the only refrigerant among the group with ozone depletion potential. Although its ODP is low, this remains an undesirable trait that has led to the global phase-out of similar substances under international environmental agreements.
The second-best performing refrigerant, R-245fa, does not contribute to ozone depletion but has a very high global warming potential, which raises concerns about its long-term sustainability in environmentally conscious applications. R-600a, while ranking third in technical performance, has the lowest environmental impact of all the analyzed refrigerants, with a GWP of just 3 and an ODP of 0. Although its use would result in a slight performance trade-off (approximately 6% lower EER, 5% lower exergy efficiency, and 3% lower GOR), it would yield a small improvement in desalinated water production. Additionally, this refrigerant has high flammability. So, as can be seen, there is no ideal refrigerant, and the choice of one for a real system should be made carefully considering environmental, safety, and thermodynamic performance.
7. Conclusions
An energy and exergy analysis of a system for the simultaneous production of cooling and water desalination using the refrigerants R-245fa, R-600a, R-123, R-410a, and R-32 was realized.
The results showed that the water production increased, while the energy efficiency ratio, the GOR, and the exergy efficiency decreased with an increment in the condenser temperature for all the refrigerants. Relative humidity was a very important parameter in the system performance since an increase in it produced a positive effect in all the system evaluating parameters. On the other hand, the increase in the ambient temperature improved the energy efficiency ratio and the desalinated water production but negatively affected the exergy efficiency due to the increase in the power supplied to the system.
From the comparison of the system operation using different refrigerants, it was found that the highest values of the GOR, energy efficiency ratio, and exergy efficiencies were obtained using the refrigerants R-123, R-245fa, and R-600a, while the lowest values were obtained with R-410a; however, the highest amount of desalinated water was obtained with this refrigerant.
From the exergy system analysis, it was found that the total irreversibilities were similar for all the refrigerants since the lowest value was 0.55 kW with R-123, while the highest were 0.62 kW using R-410a. From the analysis, it was also found that the highest irreversibilities occurred in the dehumidifier and the evaporator while the lowest occurred in the humidifier.
The refrigerant R-123 was the best-performing refrigerant, offering the highest exergy efficiency, energy efficiency ratio, and gain–output ratio but the lowest value of desalinated water production. On the other hand, despite the lower efficiencies, R-410a is the best choice for maximizing desalinated water production. These results suggest that the optimal refrigerant choice depends on whether efficiency or water production is prioritized, a decision that should be made based on the application’s specific needs.
Author Contributions
Conceptualization, A.P.-R. and W.R.; methodology, A.P.-R., W.R. and J.C.J.-G.; software, A.P.-R.; validation, A.P.-R. and W.R.; formal analysis, A.P.-R., W.R., J.C.J.-G. and J.D.-G.; investigation, J.C.J.-G.; data curation, J.D.-G.; writing—original draft preparation, A.P.-R., W.R., J.C.J.-G. and J.D.-G.; writing—review and editing, A.P.-R., W.R., J.C.J.-G. and J.D.-G.; visualization, A.P.-R. and J.D.-G.; supervision, W.R.; project administration, W.R. All authors have read and agreed to the published version of the manuscript.
Funding
This research received no external funding.
Data Availability Statement
The datasets are available from the authors upon request.
Acknowledgments
A. Pacheco-Reyes acknowledges the financial support provided by SECIHTI through the postdoctoral program. J. Delgado-Gonzaga acknowledges the postdoctoral fellowship funding support from SECIHTI and IER-UNAM for the facilities used to develop this work. W. Rivera acknowledges the financial support provided by SECIHTI through the sabbatical program “Estancias Sabáticas Vinculadas a la Consolidación de Grupos de Investigación”.
Conflicts of Interest
The authors declare no conflicts of interest.
Abbreviations
| Abbreviations | |
| ACS | Absorption Cooling System |
| AHT | Absorption Heat Transformer |
| CGMD | Conductive Gap Membrane Distillation |
| COP | Coefficient of Performance |
| EER | Energy Efficiency Ratio |
| GOR | Gain–Output Ratio |
| HC | Hydrocarbon |
| HCFC | Hydrochlorofluorocarbon |
| HDH | Humidification–Dehumidification |
| HFC | Hydrofluorocarbon |
| GWP | Global Warming Potential |
| MED | Multi-Effect Distillation |
| MSF | Multi-Stage Flash |
| ODP | Ozone Depletion Potential |
| ORC | Organic Rankine Cycle |
| PGMD | Permeate Gap Membrane Distillation |
| RH | Relative Humidity |
| RO | Reverse Osmosis |
| SUCP | Sum Unit Cost of Product |
| TGOR | Trigeneration-based GOR |
| VC | Vapor Compression |
| VCR | Vapor Compression Refrigeration |
| Letters and Subscripts | |
| Amb | Ambient |
| C | Condensation |
| CA | Cold Air |
| CH | Condenser/Humidifier |
| com | Compressor |
| CW | Cold Water |
| D | Dehumidifier |
| DW | Desalinated Water |
| DA | Dry Air |
| E | Evaporator |
| ED | Expansion Devise |
| F | Fan |
| I | Irreversibilities |
| P | Pump |
| R | Refrigerant |
| Symbol and Properties | |
| η | Efficiency |
| Mass Flow Rate (kg/s) | |
| Heat (kW) | |
| Power (kW) | |
| h | Specific Enthalpy (kJ/kg) |
| s | Specific Entropy (kJ/kg K) |
References
- University of Birmingham. A Cool World: Defining the Energy Conundrum of Cooling for All. 2018. Available online: https://www.birmingham.ac.uk/Documents/college-eps/energy/Publications/2018-clean-cold-report.pdf (accessed on 1 April 2025).
- Sustainable Energy for All [SEforAll] Cooling Access Gaps in 2023 by Risk Profile. Available online: https://www.seforall.org/chilling-prospects-access-to-cooling-gaps-2023/risk-profiles#1 (accessed on 14 August 2024).
- World Resources Institute. Water Security. Available online: https://www.wri.org/freshwater/water-security (accessed on 11 April 2025).
- Abdulwahid, A.A.; Zhao, H.; Wang, Z.; Liu, G.; Khalil, E.E.; Lai, Y.; Han, J. Thermo-Economic Comparison of Two Models of Combined Transcritical CO2 Refrigeration and Multi-Effect Desalination System. Appl. Energy 2022, 308, 118320. [Google Scholar] [CrossRef]
- Kim, J.; Park, K.; Yang, D.R.; Hong, S. A Comprehensive Review of Energy Consumption of Seawater Reverse Osmosis Desalination Plants. Appl. Energy 2019, 254, 113652. [Google Scholar] [CrossRef]
- Li, Y.; Chen, X.; Xu, Y.; Zhuo, Y.; Lu, G. Sustainable Thermal-Based Desalination with Low-Cost Energy Resources and Low-Carbon Footprints. Desalination 2021, 520, 115371. [Google Scholar] [CrossRef]
- Petersen, N.H.; Arras, M.; Wirsum, M.; Ma, L. Integration of Large-Scale Heat Pumps to Assist Sustainable Water Desalination and District Cooling. Energy 2024, 289, 129733. [Google Scholar] [CrossRef]
- Farsi, A.; Mohammadi, S.M.H.; Ameri, M. An Efficient Combination of Transcritical CO2 Refrigeration and Multi-Effect Desalination: Energy and Economic Analysis. Energy Convers. Manag. 2016, 127, 561–575. [Google Scholar] [CrossRef]
- Farsi, A.; Mohammadi, S.M.H.; Ameri, M. Thermo-Economic Comparison of Three Configurations of Combined Supercritical CO2 Refrigeration and Multi-Effect Desalination Systems. Appl. Therm. Eng. 2017, 112, 855–870. [Google Scholar] [CrossRef]
- Sahana, C.; De, S.; Mondal, S. Integration of CO2 Power and Refrigeration Cycles with a Desalination Unit to Recover Geothermal Heat in an Oilfield. Appl. Therm. Eng. 2021, 189, 116744. [Google Scholar] [CrossRef]
- Anand, B.; Murugavelh, S.; Shankar, R.; Phelan, P. Experimental Investigation on a Cooling Cum Desalination System Using a Modified Mechanical Heat Pump. Int. J. Refrig. 2022, 143, 138–147. [Google Scholar] [CrossRef]
- Anand, B.; Murugavelh, S. Performance Analysis of a Novel Augmented Desalination and Cooling System Using Modified Vapor Compression Refrigeration Integrated with Humidification-Dehumidification Desalination. J. Clean. Prod. 2020, 255, 120224. [Google Scholar] [CrossRef]
- Anand, B.; Shankar, R.; Jiménez-García, J.C.; Rivera, W. A Dual-Mode System for Water Purification and Cooling Using a Thermal Desalination Technique Coupled to a Heat Pump Unit. Appl. Therm. Eng. 2023, 224, 120096. [Google Scholar] [CrossRef]
- Delgado-Gonzaga, J.; Rivera, W.; Jiménez-García, J.C.; Pacheco-Reyes, A.; Juárez-Romero, D. Modeling of a Novel Cascade Cycle for the Simultaneous Production of Desalinated Water and Cooling Using Various Refrigerants. Processes 2025, 13, 166. [Google Scholar] [CrossRef]
- Jabari, F.; Mohammadi-ivatloo, B.; Ghaebi, H.; Bannae-sharifian, M.-B. Biogas Fueled Combined Cooling, Desalinated Water and Power Generation Systems. J. Clean. Prod. 2019, 219, 906–924. [Google Scholar] [CrossRef]
- Srinivas, T.; Saxena, A.; Baba, S.V.; Kukreja, R. Experimental and Simulation Studies on Heat Pump Integration Two Stage Desalination and Cooling System. Energy Nexus 2023, 11, 100221. [Google Scholar] [CrossRef]
- Ghazy, M.; Zohir, A.E.; Ali, E.S.; Alsaman, A.S.; Farid, A.M.; El-Ghetany, H.H.; Askalany, A.A. State-of-the-Art-Solar Energy-Driven Adsorption Desalination Systems. Energy Nexus 2024, 15, 100319. [Google Scholar] [CrossRef]
- Alsaman, A.S.; Ibrahim, E.M.M.; Ahmed, M.S.; Askalany, A.A. Composite Adsorbent Materials for Desalination and Cooling Applications: A State of the Art. Int. J. Energy Res. 2022, 46, 10345–10371. [Google Scholar] [CrossRef]
- Askalany, A.A. Innovative Mechanical Vapor Compression Adsorption Desalination (MVC-AD) System. Appl. Therm. Eng. 2016, 106, 286–292. [Google Scholar] [CrossRef]
- Albaik, I.; Diab, K.E.; Saleh, M.; Al-Dadah, R.; Mahmoud, S.; Elsheniti, M.B.; Solmaz, İ.; Salama, E.; Shokry Hassan, H.; Elkadi, M.F. MOF Based Coated Adsorption System for Water Desalination and Cooling Integrated with Pre-Treatment Unit. Sustain. Energy Technol. Assess. 2023, 56, 103006. [Google Scholar] [CrossRef]
- Mohammed, R.H.; Radwan, A.; Rezk, A.; Olabi, A.G.; Sharma, V.; Kalam Hossain, A.; Alaswad, A.; Abdelkareem, M.A. Energy and Exergy Study of the Integrated Adsorption-Absorption System Driven by Transient Heat Sources for Cooling and Desalination. Energy Convers. Manag. 2023, 277, 116614. [Google Scholar] [CrossRef]
- Harby, K.; Ali, E.S.; Almohammadi, K.M. A Novel Combined Reverse Osmosis and Hybrid Absorption Desalination-Cooling System to Increase Overall Water Recovery and Energy Efficiency. J. Clean. Prod. 2021, 287, 125014. [Google Scholar] [CrossRef]
- Elbassoussi, M.H.; Ahmed, M.A.; Zubair, S.M. On a Novel Integration of a Multistage Absorption Heat Pump with a Balanced Humidification-Dehumidification Desalination Unit. Energy Convers. Manag. X 2021, 12, 100128. [Google Scholar] [CrossRef]
- Janghorban Esfahani, I.; Kang, Y.T.; Yoo, C. A High Efficient Combined Multi-Effect Evaporation–Absorption Heat Pump and Vapor-Compression Refrigeration Part 1: Energy and Economic Modeling and Analysis. Energy 2014, 75, 312–326. [Google Scholar] [CrossRef]
- Qasem, N.A.A.; Zubair, S.M.; Abdallah, A.M.; Elbassoussi, M.H.; Ahmed, M.A. Novel and Efficient Integration of a Humidification-Dehumidification Desalination System with an Absorption Refrigeration System. Appl. Energy 2020, 263, 114659. [Google Scholar] [CrossRef]
- Mehrpooya, M.; Ghorbani, B.; Hosseini, S.S. Thermodynamic and Economic Evaluation of a Novel Concentrated Solar Power System Integrated with Absorption Refrigeration and Desalination Cycles. Energy Convers. Manag. 2018, 175, 337–356. [Google Scholar] [CrossRef]
- Soares, A.P.d.M.R.; de Araújo, H.V.; Dangelo, J.V.H. Thermodynamic Analysis and Optimization of a Biogas-Powered Trigeneration System to Produce Power, Cooling and Freshwater. Fluid Phase Equilib. 2023, 573, 113872. [Google Scholar] [CrossRef]
- Safder, U.; Rana, M.A.; Yoo, C. Feasibility Study and Performance Assessment of a New Tri-Generation Integrated System for Power, Cooling, and Freshwater Production. Desalination Water Treat. 2020, 183, 63–72. [Google Scholar] [CrossRef]
- Ghaebi, H.; Shekari Namin, A.; Rostamzadeh, H. Performance Assessment and Optimization of a Novel Multi-Generation System from Thermodynamic and Thermoeconomic Viewpoints. Energy Convers. Manag. 2018, 165, 419–439. [Google Scholar] [CrossRef]
- Ghiasirad, H.; Asgari, N.; Khoshbakhti Saray, R.; Mirmasoumi, S. Thermoeconomic Assessment of a Geothermal Based Combined Cooling, Heating, and Power System, Integrated with a Humidification-Dehumidification Desalination Unit and an Absorption Heat Transformer. Energy Convers. Manag. 2021, 235, 113969. [Google Scholar] [CrossRef]
- Calise, F.; Cipollina, A.; Dentice d’Accadia, M.; Piacentino, A. A Novel Renewable Polygeneration System for a Small Mediterranean Volcanic Island for the Combined Production of Energy and Water: Dynamic Simulation and Economic Assessment. Appl. Energy 2014, 135, 675–693. [Google Scholar] [CrossRef]
- Cao, Y.; Delpisheh, M.; Yousefiasl, S.; Athari, H.; El-Shorbagy, M.A.; Jarad, F.; Dahari, M.; Wae-hayee, M. Examination and Optimization of a Novel Auxiliary Trigeneration System for a Ship through Waste-to-Energy from Its Engine. Case Stud. Therm. Eng. 2022, 31, 101860. [Google Scholar] [CrossRef]
- Ayou, D.S.; Zaragoza, G.; Coronas, A. Small-Scale Renewable Polygeneration System for off-Grid Applications: Desalination, Power Generation and Space Cooling. Appl. Therm. Eng. 2021, 182, 116112. [Google Scholar] [CrossRef]
- Anvari, S.; Mahian, O.; Taghavifar, H.; Wongwises, S.; Desideri, U. 4E Analysis of a Modified Multigeneration System Designed for Power, Heating/Cooling, and Water Desalination. Appl. Energy 2020, 270, 115107. [Google Scholar] [CrossRef]
- Gholizadeh, T.; Vajdi, M.; Rostamzadeh, H. Exergoeconomic Optimization of a New Trigeneration System Driven by Biogas for Power, Cooling, and Freshwater Production. Energy Convers. Manag. 2020, 205, 112417. [Google Scholar] [CrossRef]
- Sadeghi, M.; Yari, M.; Mahmoudi, S.M.S.; Jafari, M. Thermodynamic Analysis and Optimization of a Novel Combined Power and Ejector Refrigeration Cycle—Desalination System. Appl. Energy 2017, 208, 239–251. [Google Scholar] [CrossRef]
- Alkhulaifi, Y.M.; Baata, E.; Al-Sulaiman, F.A.; Ibrahim, N.I.; Ben-Mansour, R. Performance and Exergoeconomic Assessment of a Novel Combined Ejector Cooling with Humidification-Dehumidification (HDH) Desalination System. Desalination 2021, 500, 114843. [Google Scholar] [CrossRef]
- Singh, S.; Chakraborty, P.R.; Kothadia, H.B. Flash Evaporation Method for Improved Desalination and Cooling Applications: An Experimental Study. Desalination 2023, 566, 116933. [Google Scholar] [CrossRef]
- Dincer, I.; Kanoglu, M. Refrigeration Systems and Applications, 2nd ed.; John Wiley and Sons, Ltd.: Hoboken, NJ, USA, 2010. [Google Scholar]
- Calm, J.M.; Hourahan, G. Refrigerant Data Update. Hpac Eng. 2007, 79, 50–64. [Google Scholar]
- Abas, N.; Kalair, A.R.; Khan, N.; Haider, A.; Saleem, Z.; Saleem, M.S. Natural and Synthetic Refrigerants, Global Warming: A Review. Renew. Sustain. Energy Rev. 2018, 90, 557–569. [Google Scholar] [CrossRef]
Disclaimer/Publisher’s Note: The statements, opinions and data contained in all publications are solely those of the individual author(s) and contributor(s) and not of MDPI and/or the editor(s). MDPI and/or the editor(s) disclaim responsibility for any injury to people or property resulting from any ideas, methods, instructions or products referred to in the content. |
© 2025 by the authors. Licensee MDPI, Basel, Switzerland. This article is an open access article distributed under the terms and conditions of the Creative Commons Attribution (CC BY) license (https://creativecommons.org/licenses/by/4.0/).