Article

Techno-Economic Analysis for the Costs of Drying Chickpeas: An Example Showing the Trade-Off Between Capital and Operating Costs for Different Inlet Air Temperatures †

Drying and Process Technology Research Group, School of Chemical and Biomolecular Engineering, The University of Sydney, Camperdown, NSW 2006, Australia
*
Author to whom correspondence should be addressed.
This paper is an extended version of our paper published in Langrish, T.; Cheng, S. Technico-Economic Analysis for the Costs of Drying Chickpeas: An Example Showing the Trade-off between Capital and Operating Costs for Different Inlet Air Temperatures. In Proceedings of the IDS 2024—23rd International Drying Symposium, Wuxi, China, 24 November 2024.
Processes 2025, 13(4), 1178; https://doi.org/10.3390/pr13041178
Submission received: 18 February 2025 / Revised: 29 March 2025 / Accepted: 9 April 2025 / Published: 13 April 2025
(This article belongs to the Special Issue Feature Papers in the "Food Process Engineering" Section)

Abstract

:
This study investigates the implementation of new drying schedules for chickpeas, a significant pulse, incorporating a techno-economic analysis. The research also explores the reduction in anti-nutritional factors, such as trypsin inhibitors, through fluidized-bed drying with an air recycling system. The processing cost per unit mass of chickpeas is predicted to decrease with an increasing recycling ratio, from over AUD 1.32/kg of chickpeas with no recycling down to AUD 0.0885/kg of chickpeas at a ratio of 99%. With no air recycling, the lowest inlet air temperature (40 °C) gives the lowest cost, but near the optimum recycling ratio, the highest inlet air temperature (80 °C) is best. This pattern is followed when considering equivalent carbon dioxide emissions, with the lowest emissions (over 0.259 kg CO2 (kg chickpeas)−1) corresponding to high recycling ratios and high inlet air temperatures. The use of air recycling should cause no significant challenges when implementing a drying schedule for trypsin inhibitor reduction in chickpeas.

1. Introduction

Chickpeas, lentils, and faba beans are the main types of pulses in Australia [1]. Recently, Cheng and Langrish have developed a drying schedule for chickpeas, with inlet air temperatures between 40 °C and 80 °C for various lengths of time, to reduce the concentrations of trypsin inhibitors during drying. By using a drying schedule, the denaturation of the pulse protein secondary structure was reduced. A total of 86% of the trypsin inhibitor was also removed at the target moisture content. The quality of the dried chickpeas from fluidized bed processing has been reported in previous work [2]. It is worth considering, from both financial and carbon emission perspectives, what the processing arrangements might be for implementing this schedule.
Techno-economic assessment of food processing is an established approach, with Olabode et al. [3] discussing different processing and marketing modes for potatoes under American conditions in the late 1970s. Their work accounted for the energy required for one serving of potatoes using ten different processing methods. Each of these different modes has various steps and requirements during processing, affecting the supply chain from production, warehouse storage, transport, and home usage. Similar energy accounting calculations have been performed for peas, snap beans, and corn by Rao [4]. Limitations of the calculations by Olabode et al. and Rao include the scope of accounted energy, ending with consumption in the home. Notwithstanding the long track record for the application of techno-economic analysis to food processing, the combined technical and economic analysis of drying technology continues to be seen as a relevant approach to assessing the value of investment in this type of processing.
Cheng and Langrish [5] compared the techno-economic assessment of shipping orange juice from Australia to China, or the juice concentrate, involving refrigeration, with spray drying the juice to form powder, then using non-refrigerated transport for the powder. They concluded that spray drying of juice was economically desirable compared with refrigerated transport. A techno-economic assessment of a hybrid solar/electric dryer has been performed by Nwakuba et al. [6], finding that the new dryer had a rapid payback time of 0.72 years and would save almost USD 1500 per year relative to a conventional electrically heated dryer. A greenhouse-type solar dryer has been studied by Philip et al. [7] using techno-economic analysis, again concluding that the greenhouse-type dryer was more economically beneficial than an electric dryer for agricultural produce, with a payback time of 1.5–2.1 years. Haque and Somerville [8] did a techno-economic analysis for biomass drying, comparing a fluidized bed, a rotary drum, a stationary bed, pneumatic conveying, and moving belt dryers with hot air, humidified air, and superheated steam as the drying media. The use of the dry biomass was recommended to reduce the overall carbon emissions from a typical black coal-fired power plant because of fuel switching. With the open-loop drying configurations that they studied, the carbon emissions were significant, being around 9.2–9.3 kg of CO2 equivalent per unit mass of biomass. Moving belt and rotary drum dryers were considered to be practical choices. The economic evaluation of the production of phenolic powder, by considering its properties, has been explored by Dian and Langrish [9], but without considering the costs of manufacture and the transportation of powder compared with refrigerated liquid juice.
Open research that considers the techno-economic merits of air recycling and uses techno-economic analysis in the optimization of the recycling ratio is relatively uncommon, possibly due to potential commercial sensitivities. This study addresses this gap by evaluating the techno-economic feasibility of fluidized-bed drying with air recycling for chickpea processing. In addition to reducing processing costs and minimizing carbon dioxide emissions, this drying method also helps lower trypsin inhibitor levels—an anti-nutritional factor present in chickpeas [2]. By systematically analyzing different air recycle ratios and inlet air temperatures, the objective of this research is to identify cost-effective and environmentally sustainable drying conditions for chickpea processing [10].

2. Materials and Methods

2.1. Capacity and Basis Calculations

The basis will be assumed to be a throughput of 60 kg h−1 total solids for (an assumed) 8000 operating hours per year, which would cover around 10% (480 t/year) of the export volume for chickpeas in Australia (450,276 t/year in 2020) [11].
We will assume that the initial moisture content is 55% on a dry basis (d.b.), with a final moisture content of 14% (d.b.) [2], and 0.5 kg water (kg dry solids)−1 or 0.33 kg water (kg total solids)−1 as an input to the calculations. The value of 55% is based on the study by Cheng and Langrish [2], which found that soaked chickpeas typically exhibit a moisture content ranging from 49% to 60%, with an average of 55%. Achieving a final moisture content of 14% after drying is essential for minimizing cracking and ensuring optimal storage stability [12].
Here, the evaporative load is given by the following calculation:
E v a p o r a t i v e   l o a d ( o v e r a l l   d r y i n g   r a t e ) = ( 55 % 14 % )   k g   w a t e r 100 %   k g   d r y   s o l i d × 60   k g   h 1   t o t a l   s o l i d s 1.55   k g   ( d r y   s o l i d + w a t e r ) ( k g   t o t a l   s o l i d ) 1 = 15.871   k g   w a t e r   h 1 = 0.00441   k g   w a t e r   s 1
This evaporative load is also the overall drying rate, which is relevant to the calculation of both the capital and operating costs.
The situation for a straight-through, open-loop, fluidized-bed drying system for chickpeas will be analyzed first, showing the need for the recycling of air to create a partially closed system that is more economical.

2.2. Optimization and Trade-Offs

The large airflow rates needed to fluidize a fluidized-bed dryer also mean that these high airflow rates must be heated. The thermal energy requirement to heat all the air to the inlet air drying temperature is much larger than both the energy required to evaporate the moisture and the energy required to fluidize the bed. Any natural gas costs are likely to be dominated by the air heating requirements, so the operating costs for energy alone are likely to be very significant.
These features mean that operating a fluidized bed for drying chickpeas may benefit from a consideration of exhaust air recycling to minimize the amount of air that must be heated, which may then involve drying the chickpeas at higher gas humidities. The basic problem is that fluidization requires high air velocities, resulting in high airflow rates, which are not intrinsically required for the mass-transfer process of drying.

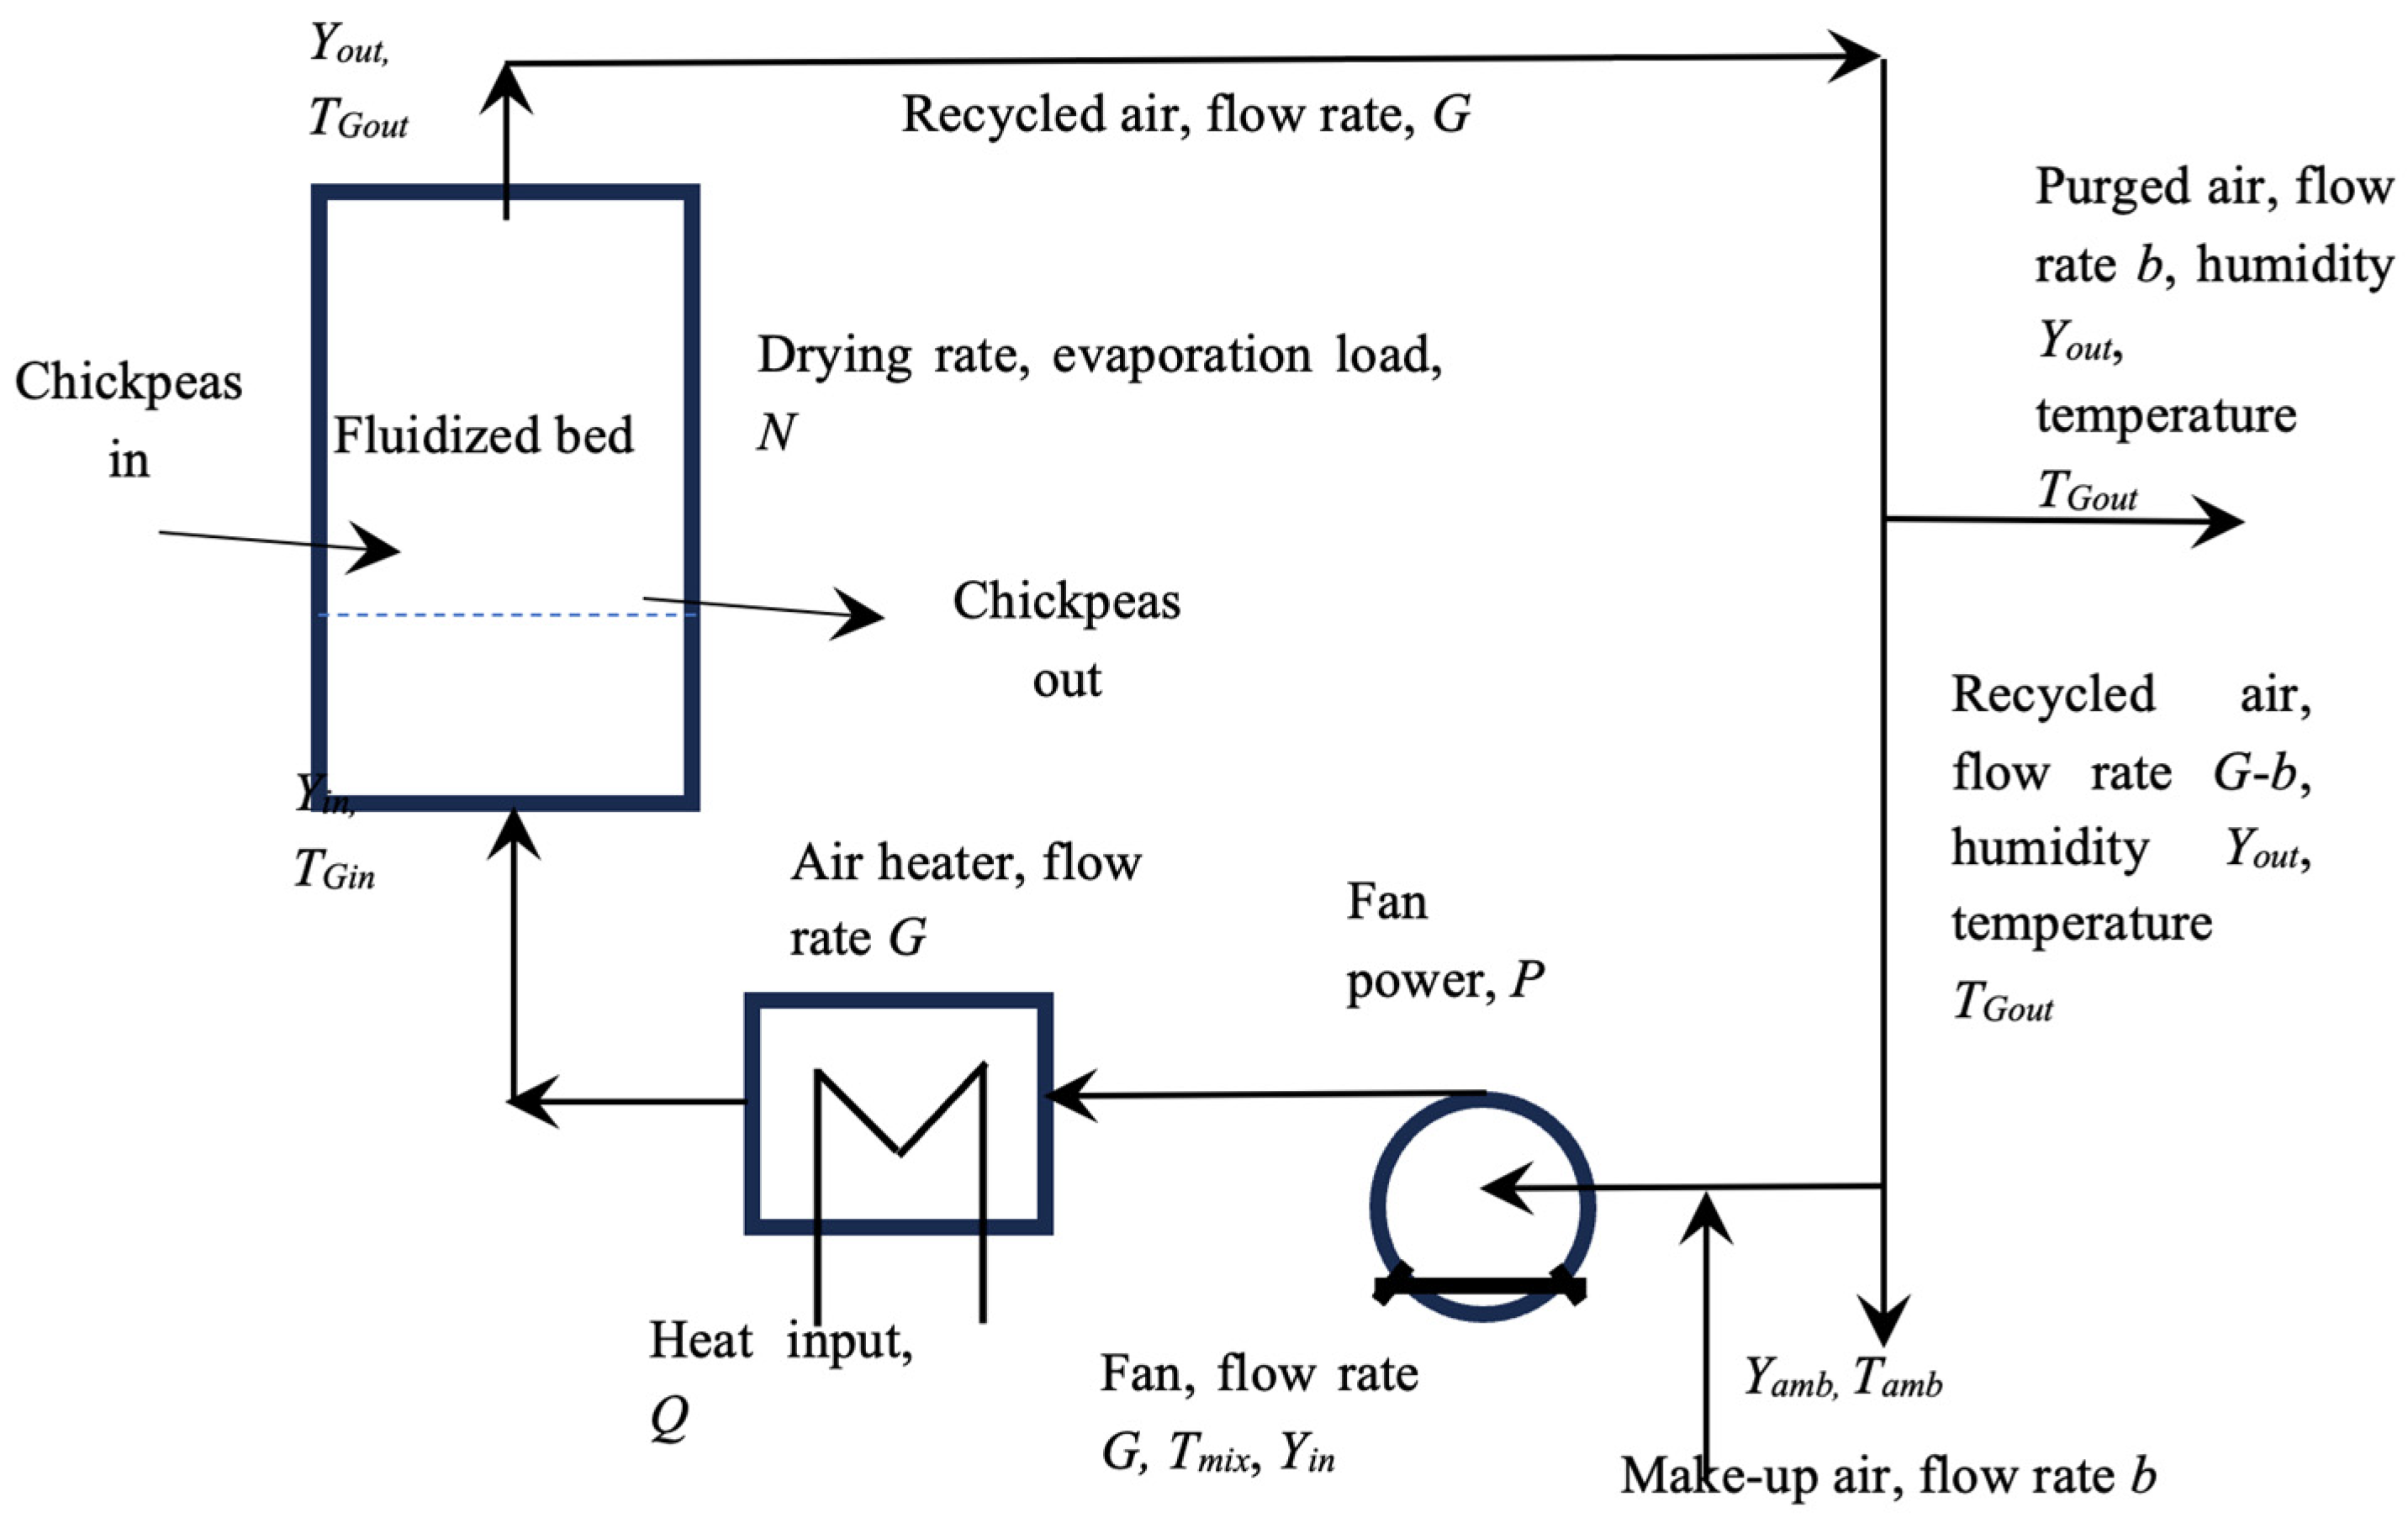
2.3. The Use of Air Recycling

Reducing the energy requirements for air heating leads to a conceptual scheme for operating the fluidized bed with a partial recycling of air, as shown in Figure 1. In this system, the air heater is required to heat the new make-up air, provide energy for evaporation, and compensate for heat losses from the whole system. Increasing the amount of recycling then increases the gas humidity, reducing the drying rate, thereby increasing the required bed cross-sectional area, increasing the capital cost. However, it also decreases the amount of air that must be heated, reducing the air heating costs. In addition, when air is recirculated, the increase in humidity raises both the wet-bulb temperature and the drying time relative to the original conditions.
The configuration of the system includes the following features. The purged air is drawn out of the system after the dryer, with a temperature and humidity equal to the values of those variables leaving the dryer, TGout and Yout, respectively. The make-up air comes from the ambient atmosphere at a temperature and humidity of Tamb and Yamb, respectively.

2.4. Method of Techno-Economic Analysis

This study conducted a techno-economic analysis by evaluating both capital and operational costs in the processing, including the drying of dehulled faba beans. The following key factors were included in the analysis:
  • Purchased Equipment Cost (PEC): The capital costs of each piece of the fluidized-bed dryers used in the processing were evaluated. These individual equipment costs formed the foundation for determining the overall Process Plant Cost.
  • Process Plant Cost (PPC): The total cost of setting up the processing plant was estimated using the Lang factor, which scales the Purchased Equipment Cost (PEC) to reflect the full plant cost. According to Towler et al. [13], PPC is generally 3 to 4 times the PEC. This study uses a Lang factor of 4 to account for additional costs, including equipment installation, piping, electrical connections, and control systems.
  • Capital Recovery Factor (CRF): The Capital Recovery Factor was applied to calculate the annualized capital expenditure. This factor accounts for the cost of recovering the initial capital investment over the equipment’s lifespan and incorporating both interest rates [14]. The CRF is a critical component for assessing the long-term financial sustainability and payback period of the processing facility.

2.5. Experimental Design

This study analyzes the capital cost (Purchased Equipment Cost, PEC) and Process Plant Cost (PPC) associated with fluidized-bed drying within an inlet air temperature range of 40 °C to 80 °C under constant drying conditions in an open-loop system. The drying kinetics are based on the study by Cheng and Langrish [2]. Additionally, the study evaluates both capital and utility costs. To enhance cost efficiency and reduce carbon dioxide emissions, an air recycle system is incorporated into the fluidized-bed drying process, optimizing energy consumption and sustainability.

3. Results and Discussion

3.1. Open Loop

3.1.1. Drying Rate, Drying Flux, and Fluidized Bed Sizing Calculations

The drying data from Cheng and Langrish [2] show that 200 g of chickpeas can be dried in a 0.1 m diameter fluidized bed at various inlet air temperatures in different drying times from an initial moisture content of 55% to a final moisture content of 14%. Then, the scaling (drying) model assessed by Cheng and Langrish [2] (and found to be valid) allows for the effects of different air inlet temperatures (TG) over a range from 40 °C to 80 °C as follows:
Z = τ 2 τ 1 = ( T G 1 T w b 1 ) ( T G 2 T w b 2 )
where subscripts 1 and 2 refer to different drying conditions, Z is the normalization scaling factor [2], and Δτ is the drying time. The model accounts for the effects of varying air humidities through the effect of humidity on the wet-bulb temperature (Twb). The wet-bulb temperature (Twin) for the (TG) 60 °C experiment in Cheng and Langrish was 26.5 °C, giving a drying time of 3 h [2], corresponding to an inlet air humidity of 0.0077 kg kg−1.
Equation (2) may be rewritten for the drying time (Δτ) for a range of wet-bulb depressions (TG − Twb) as follows:
τ = ( 3 h ) ( 60   ° C     26.5   ° C ) ( T G T w b ) = 100.5   K h ( T G T w b )
In terms of the drying flux, this equation may be used as follows [15]:
D r y i n g   f l u x = ( 55 % 14 % ) 100 % × 200   g 1000   g k g × 1 τ × 1 π 4 ( 0.1   m ) 2 = 10.44 τ   k g   m 2 h 1          = 10.44 100.5 ( T G T w b )   k g   m 2 h 1   = 0.1039 ( T G T w b )   k g   m 2 h 1
This equation then gives the required fluidized bed cross-sectional area (A, m2) for the required drying rate of 15.9 kg h−1:
A = 15.871   k g   w a t e r   h 1 0.1039 ( T G T w b ) k g   m 2 h 1 = 152.77 ( T G T w b ) m 2
The drying time, drying (evaporation) flux, and full-scale fluidized bed sizing calculations for chickpeas, based on the drying data of Cheng and Langrish for 200 g of chickpeas [2], from an initial moisture content of 55% (dry basis) to a final moisture content of 14% (d.b.) are shown in Table 1 for air temperatures between 40 °C and 80 °C.
These required fluidized bed cross-sectional areas (fluidized bed sizing) reflect the decreasing size of higher temperatures.

3.1.2. Capital Costs

Turton et al. (2018) have produced a computer program, Capcost_2017.xlsm, which contains capital cost estimates for dryers, including tray, rotary, and spray dryers [15]. This program gives typical capital costs in United States dollars for equipment built from mild steel as purchased equipment costs (PEC). The fluidized bed sizes in Table 1 have been used to predict the costs of the fluidized beds in Table 2, assuming that the costs of the fluidized beds are similar to those of tray dryers.
The basic capital cost of the equipment (PEC), as a function of cross-sectional area (A, m2), may be represented by the following equation [15,16]:
P E C = $ 6350   A 0.587
With the multipliers (Lang factor, stainless steel, dollar conversion), the equation for the Process Plant Cost (PPC, in Australian dollars) becomes:
P P C = A U D 49,529   A 0.587
An adjustment, called the Lang factor, is always made between Purchased Equipment Costs (PECs) and Process Plant Costs (PPCs), which is a multiplier of 3–4 (taken here as 4). The extra costs include allowances for site preparation, foundations and support structures, piping, instrumentation, control and monitoring equipment, electrical connections, painting, insulation, installation costs and overheads, and other purchase costs [13]. Towler and Sinnott also suggest that plant costs showed very minor changes between 2013 and 2022 [13], so there is no need to scale the costs over time. An allowance should be made for the relative costs between carbon steel (material factor 1.0) and stainless steel (material factor 1.3, since the final equipment is for food applications) [13]. The conversion factor between the United States dollar and the Australian one has been assumed to be AUD 1.5 = USD 1. Table 2 therefore also allows for these extra multipliers (Lang factor, 4; stainless steel costs, 1.3; Australian dollar to US dollar conversion, 1.5).

3.1.3. Capital Costs Over Time: The Time Value of Money

The time value of money means that the initial capital costs must be recovered over time, and these costs may be added to the operating costs to give the overall cost of manufacturing the final product. These costs are capital recovery costs and are estimated by multiplying the total initial capital cost by a Capital Recovery Factor to give an annual capital recovery cost. The Capital Recovery Factor (CRF 0–1, dimensionless) is defined [14] as follows:
C R F = i   ( 1 + i ) n ( 1 + i ) n 1
Here, i is the interest rate (fractional), and n is the number of repayments.
If i = 10% (0.1) and n = 10 (years), then the CRF = 0.163, and these values of the expected interest rate (10%) and capital recovery period (10 years) will be assumed here. This factor is multiplied by the Process Plant Cost (PPC, in Australian dollars) to give the annual capital recovery costs in Table 2.

3.1.4. Operating Costs

The main operating costs for the drying of chickpeas in a fluidized bed are the costs to heat and pump the air required for fluidization and drying and the costs of compensating for heat losses, which are connected with utilities costs. Other ongoing costs include labor and personnel.
Labor costs per person are quoted in Brennan as being AUD 80,000 per year per person [14], with a typical multiplication cost of 3.8 due to supervision expenses, payroll, plant and laboratory overheads, and the costs of operating supplies. Allowing for selling expenses and the costs associated with research and development and administration, Brennan also suggests that the overall (total) operating costs should be multiplied by a factor of 1.2 [14].
The following calculations and discussion focus first on the utility operating costs, since the costs of the utilities for heating are often very significant for drying applications [17]. A fundamental assumption is that the ambient air temperature is 25 °C and that the ambient humidity is 0.0077 kg kg−1.
The air mass flow rate through the fluidized bed (G, kg s−1) may be limited by either the requirement for maintaining a sufficient driving force for drying or by the need to maintain bed fluidization. The fluidization velocity (uf) used by Cheng and Langrish was 9.5 m s−1 [2], giving the following airflow rates to meet the need for maintaining bed fluidization:
G , A i r   m a s s   f l o w   r a t e = ρ   A   u f = 9.5   ρ   A
where the air density is ρ (kg m−3), and A is the cross-sectional area of the fluidized bed (Table 1). The density of the air may be estimated from the ideal gas equation as follows:
ρ = P M R T
Here, P is the air pressure (101,325 Pa at sea level), M is the molecular weight (29 × 10−3 kg mol−1 for air), R is the gas constant (8.314 J mol−1 K−1), and T is the absolute air temperature (K). With these constant parameters, the air density at the inlet to the fluidized bed is given by the following equation:
ρ = 101,325 × 29 × 10 3 8.314 ( T G i n + 273.15 ) = 353.4 ( T G i n + 273.15 )
From a basic mass balance, as described by Pakowski and Mujumdar [18], there is the following equation across the fluidized bed:
Y o u t = Y i n + Y = Y i n + m ˙ G
Here, m ˙ is the drying rate or evaporative load, 0.00441 kg s−1 from Equation (1), Yout is the gas humidity out of the dryer (kg kg−1), Yin is the gas humidity into the dryer (kg kg−1), ΔY is the change in gas humidity across the dryer (kg kg−1), and G is the air mass flow rate (kg s−1).
The following equation is given by Pakowski and Mujumdar [18], representing an energy balance for an adiabatic dryer:
T G o u t = T G i n + T G = T G i n H v w C P Y Y
In this equation, TGout is the gas temperature out of the dryer (K), TGin is the gas temperature into the dryer (K), ΔTG is the change in gas temperature across the dryer (K), ΔHvw is the latent heat of vaporization for water (around 2200 kJ kg−1), CPY is the specific heat capacity of the gas (around 1000 J kg−1 K−1 for air), and ΔY has been defined above.
Table 3 shows the predicted airflow rates for maintaining fluidization, the predicted changes in air humidity and temperature across the fluidized bed during drying, and the outlet air humidities and temperatures for each of the inlet air drying temperatures. It is noteworthy that the changes in gas temperature and humidity across the fluidized bed in one pass are very small compared with the inlet air drying temperature and humidity.
Given that the drying rate is constant at 0.00441 kg s−1 for all inlet air temperatures, the energy flow rate required for evaporation or drying is the same at 9.7 kW. However, the thermal energy required for heating the air (Q, W) to the inlet air temperature is equal to the product of the air mass flow rate, the specific heat capacity of the air (CPY), and the difference between the drying air temperature (TGin) and the ambient temperature (Tamb, i.e., how much the air must be heated up), as shown in the following equation:
Q = G C P Y ( T G i n T a m b )
The pressure drop (Δp, Pa) for the air across the fluidized bed used for the laboratory scale experiments of Cheng and Langrish [2] was less than 100 Pa, and the power (P, W) required for pumping the air required for fluidization may be calculated by the following equation:
P = p G ρ = 0.1 G ρ
For the heat losses, the exposed surface area of the equipment is likely to be proportional to the bed surface area, since the bed surface area determines the overall size of the equipment. The exposed area consists of the top, bottom, and sides of the equipment, together with an associated pipework, so the exposed surface area for heat losses will be taken as five times the bed surface area for estimating the heat losses.
Heat losses are normally limited by natural convection, for which typical natural convection heat-transfer coefficients are around 1–10 W m−2 K−1 [19], and they will be taken as 10 W m−2 K−1 here as an initial estimate.
Then, the heat-transfer rate for heat loss may be estimated from the following equation:
Q L = U   A ( T G i n T a m b )
Here, QL (W) is the heat loss rate, U is the natural convection heat-transfer coefficient (10 W m−2 K−1), and A is the exposed surface area (m2, five times the bed area). The temperature driving force has been estimated to be the difference between the inlet air drying temperature (TGin) and the ambient temperature (Tamb).
Table 4 shows these predicted thermal and pumping energy requirements and predicted heat losses for the different air inlet temperatures.
Given that the drying rate is constant at 0.00441 kg s−1 for all inlet air temperatures, the energy flow rate required for evaporation or drying is the same, at about 10 kW. The pumping costs will be electrically driven, while the energy requirements for air heating, evaporation of moisture, and compensation for heat losses will be assumed to be supplied by natural gas.
The costs of electricity in the third quarter of 2023 [20] were AUD 31 to AUD 114/MWh or AUD 8.61 to AUD 31.67/GJ, compared with gas at AUD 10.23 to AUD 10.80/GJ, so gas prices were generally lower per unit of energy than electricity ones. The cost for thermal energy (Q) here will be taken as AUD 10.80/GJ, while the cost for the electricity used for blowing the air (P) will be taken as AUD 20/GJ. Assuming that the process is operated for 8000 h/year, the gas and electricity costs are given in Table 4 for this situation (60 kg h−1 of chickpeas).
For example, consider the figures for an inlet air temperature of 40 °C, where Q = 1295.6 kW, QL = 6.0 kW, QEV = 9.7 kW, and the calculations of the gas heating costs are as follows:
G a s   c o s t = $ 10.80 / G J × ( 1295.6 + 6.0        + 9.7 ) k W × 8000   h / y e a r / ( 1000   k W h / M W h ) × 3.6   G J        / M W h = $ 407,900 / y e a r
For the electricity cost, we have the following calculation:
E l e c t r i c i t y   c o s t = $ 20 / G J × 7.7   k W × 8000   h / y e a r / ( 1000 k W h M W h ) × 3.6   G J   / M W h = $ 4410 / y e a r
The utilities cost per unit mass of chickpeas can then be calculated as follows:
U t i l i t i e s   c o s t   p e r u n i t   m a s s   o f   c h i c k p e a s = ( $ 407,900 + $ 4410 ) / y e a r / ( 60 k g h × 8000 h y e a r ) = $ 0.86 / k g
For this drying condition and the other conditions, Table 5 summarizes the utilities costs. Labor costs will be neglected here, since the dryer will be assumed to be operated, together with other operating and packaging equipment, using automated process control systems. The utilities cost has, however, been multiplied by 1.2, as suggested by Brennan [14], to give the total operating costs, allowing for the inclusion of the selling expenses and the costs associated with research and development and administration, as also shown in Table 5. The annual cost of capital has been addressed in Table 4 by multiplying the Process Plant Cost in Australian dollars (PPC, as predicted by Equation (7)) by the Capital Recovery Factor (CRF) as shown in Equation (8). Combining the annual cost of capital with the total operating costs and dividing by the throughput (60 kg h−1 × 8000 h/year) gives the total capital and operating costs per unit mass in Table 5.

3.1.5. Raw Material Considerations

The cost of processing (shown in Table 5) adds to the raw material costs, so it is appropriate to consider the relative size of the processing costs relative to the raw material ones so as to assess the cost addition from processing. The current retail prices in Australia for chickpeas range from AUD 1.45 to AUD 4.36/kg [11], but export prices have declined from AUD 4.6/kg in 2012 to AUD 8.30/kg in 2022 as chickpea supplies have increased. Increased use of chickpeas is likely to increase prices, while increases in the availability of chickpeas may decrease the prices [21]. The processing costs in Table 4 are in the same order of magnitude as the raw material costs, which effectively double the underlying costs of the processed chickpeas compared with the costs of the raw material.

3.2. Closed-Loop Air Recycling

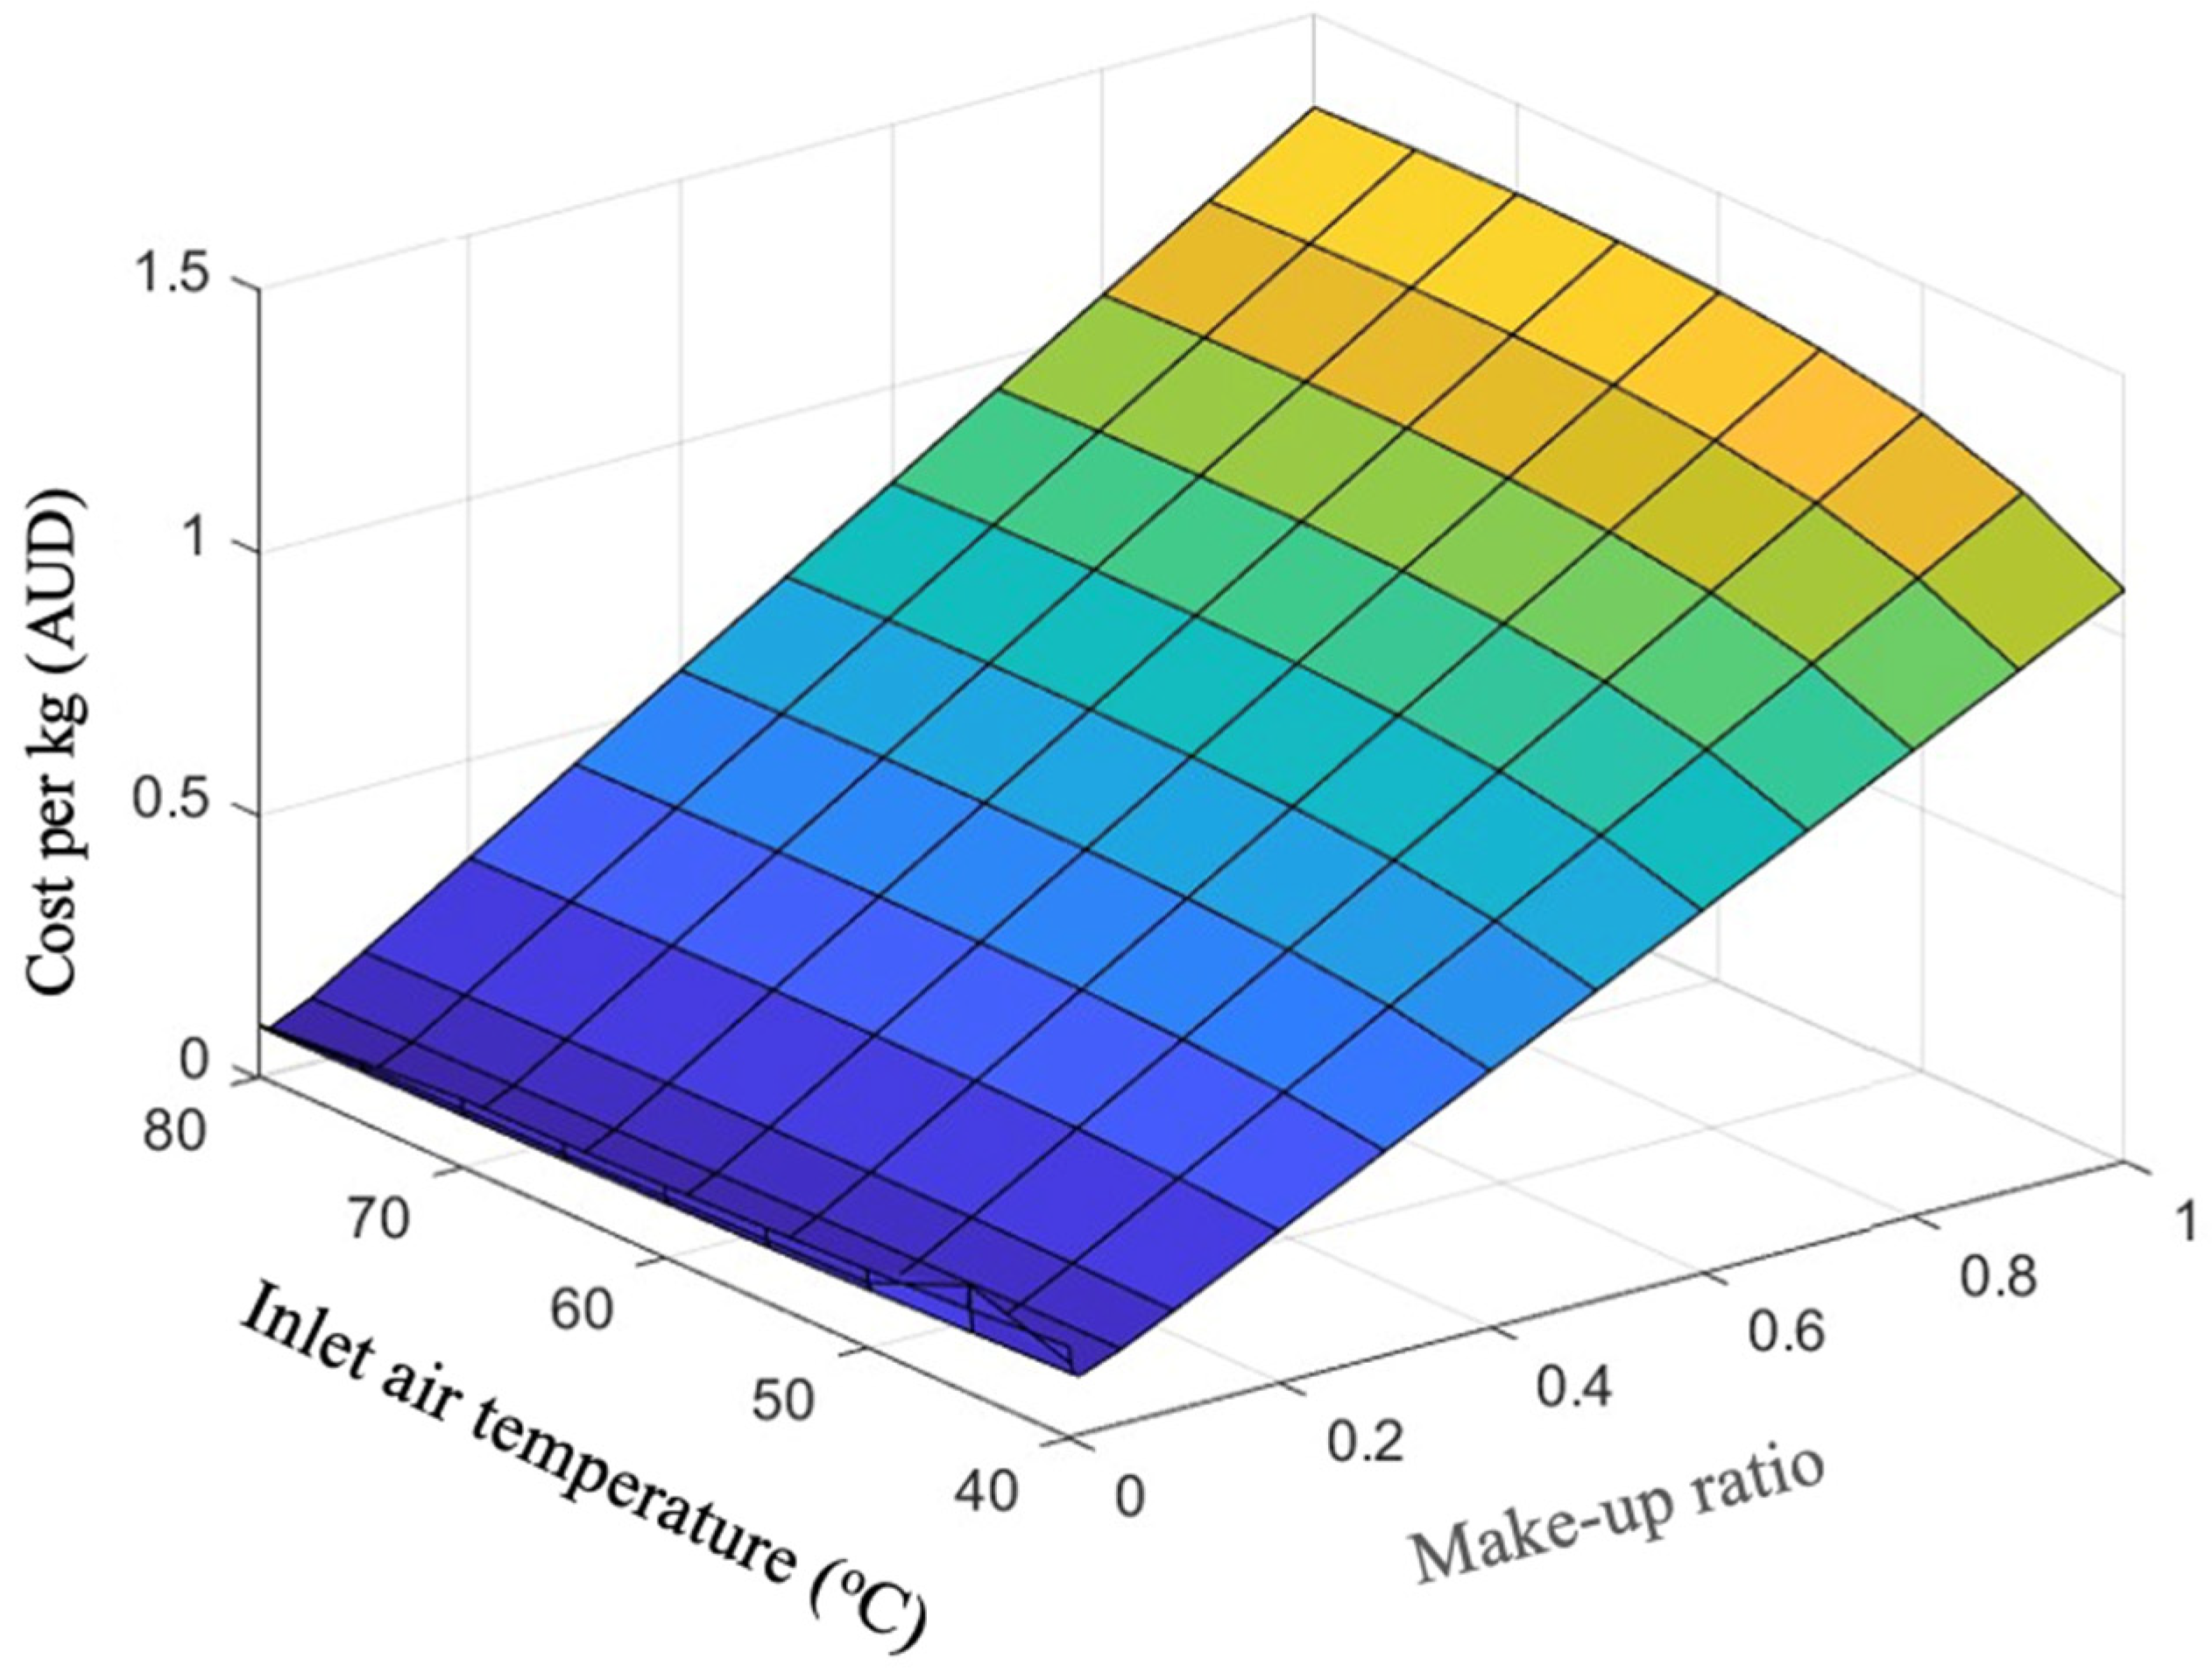
3.2.1. Capital Cost and Operating Cost

As expected, the operating costs of open-loop, straight-through air flow are very high due to the high natural gas costs to heat the fluidizing air, so some recycling of the air appears to be indicated as a possibility for reducing the energy consumption.
From a fundamental overall mass balance, at steady state, the flow rate of purged air is equal to the flow rate of make-up air (b in Figure 1). When considering a mass balance for water, the drying rate (or evaporative load), N, must be equal to the net rate at which water leaves the system, being equal to the difference between the make-up and purged-air water flow rates, b (YoutYamb).
A make-up ratio (r) may be defined as follows:
r = b G
With this make-up and purge system, the purge flow rate (b) cannot be greater than the gas flow rate through the dryer, G, due to the physical need for a finite gas flow rate between the purge and make-up air points, so the ratio r may vary from 0 to 1. A make-up ratio (r) of unity (b = G) corresponds to the open-loop system that has just been analyzed. Also, if there was complete recycling (b = 0, r = 0), there would be no way for water to leave the system, and the air humidity would increase until drying stopped completely. Smaller values of b correspond to more air being recycled.
In terms of the make-up ratio, the make-up and purged-air flow rate is then given as follows:
b = r   G
In terms of mixing between the make-up air and the recycled air, as denoted in Figure 1, the mixed air humidity (also the inlet humidity to the dryer, Yin) is given (in terms of the ambient and dryer outlet air humidities) by the following equation:
Y i n = b   Y a m b + ( G b )   Y o u t G
From any humidity, the wet-bulb temperature (Twb) may be obtained using the procedure outlined in Hecht et al. [22], and this wet-bulb temperature may be used in Equation (2) to predict the drying time and drying rate.
Likewise, the mixed air temperature (also the inlet temperature to the heater, Tmix) is given (in terms of the ambient and dryer outlet air temperatures) by the following equation:
T m i x = b   T a m b + ( G b )   T G o u t G
The procedure for converging the temperatures and humidities in the recycle loop is as follows:
  • Specify the inlet air temperature to the fluidized-bed dryer (TGin) and the make-up ratio (r).
  • Guess the dryer cross-sectional area (A), the outlet gas humidity (Yout), and the outlet air temperature (TGout).
  • Start the iteration.
  • Calculate the gas flow rate (G) from Equation (9).
  • Calculate the purge flow rate (b) from Equation (21).
  • Calculate the inlet air humidity (Yin) from Equation (22).
  • Calculate the mixed air temperature (Tmix) from Equation (23).
  • Calculate the outlet air humidity (Yout) from Equation (12).
  • Calculate the outlet air temperature (TGout) from Equation (13).
  • Calculate the wet-bulb temperature (Twb) using the procedure outlined in Hecht et al. [22].
  • Recalculate the dryer cross-sectional area (A) from Equation (5).
  • Repeat the calculations from step 3.
When this iteration has converged (area values constant within 0.1%), the airflow rates, temperatures, and humidities will all satisfy mass and energy balances. The capital cost (PPC) comes from Equation (7), translated into annual costs through the CRF, Equation (8). The gas cost comes from Equation (17), the electricity cost comes from Equation (18), and the utilities cost per unit mass comes from Equation (19).
Figure 2 shows a very clear and significant decrease in the processing cost per unit mass as the make-up ratio decreases (and the recycle ratio increases) from over AUD 1.32/kg of chickpeas down to AUD 0.0885/kg of chickpeas as the make-up ratio changes from 1.0 to 0.01, and the recycle ratio increases (correspondingly) from 0.0 to 0.99 (0%, open loop, to 99%). Figure 2 also shows that, at low recycle ratios (high make-up ratios), the lowest processing cost per unit mass occurs at the lowest inlet air temperature of 40 °C (AUD 1.09/kg chickpeas, compared with AUD 1.32/kg at 80 °C). However, a close-up of the surface plot in Figure 3 with high recycle ratios (low make-up ratios) shows that the lowest processing cost per unit mass occurs at the highest inlet air temperature of 80 °C and at a make-up ratio close to 0.01 (a recycle ratio of 99%) at this temperature. Use of the fminbnd and fminsearch functions in Matlab leads to a minimum cost at a make-up ratio of 0.0092, which is very close to 0.01. The cost function is very flat in this region, so the difference between make-up ratios of 0.0092 and 0.01 is only a cost difference between AUD 0.0885/kg of chickpeas and AUD 0.0886/kg. Recycling the gas leads to an increase in the inlet air humidity from 0.01 kg kg−1 (ambient and open-loop inlet conditions) to 0.0495 kg kg−1.
It is noteworthy that, with open-loop processing, the lowest overall processing cost per unit mass (AUD 1.09/kg) occurs with the lowest inlet air temperature (40 °C), due mainly to the lower gas heating costs even with the higher gas flow rate, in this case with a relatively small temperature rise. However, with the exhaust air recycling (closed loop) at the optimum recycling rate (99%), the optimum inlet air temperature is 80 °C. The dramatic decrease in the annual processing cost (from AUD 1.09/kg to AUD 0.09/kg) due to the use of recycling and the closed-loop drying operation may also be seen in Table 6.
The key reason for this difference in inlet air temperature at the point of minimum processing cost (but including the annualized capital cost) can be seen from Table 6, which compares the distribution of processing costs between the open-loop and closed-loop cases. The largest difference is the large decrease in air heating costs by using recycling and closed-loop drying, since less air needs to be heated while the existing air is reused. The key reason is, therefore, this decrease in natural gas heating costs.
According to Malik et al. [23], the processing cost of chickpeas in India was reported as INR 266.80 to INR 268.21 per quintal, equivalent to approximately 0.49 AUD/kg to 0.50 AUD/kg. According to the Australian Bureau of Statistics [24], the manufacturing cost index of fruits and vegetables in Australia increased over 49% (from 94.3 in 2009 to 140.8 in 2024). Therefore, translating the processing cost from Malik et al. [23] to now, the cost is 0.73 AUD/kg. In the current study, the total processing cost ranges from 0.09 AUD/kg (using an air recycle system) to 1.32 AUD/kg (in an open-loop system), which is a reasonable cost range.
Two primary factors contribute to the higher cost observed in the open-loop drying system. First, as discussed earlier in this study, the time value of money principle states that a dollar today is worth more than the same amount in the future, impacting cost comparisons across different time periods. Second, the higher labor costs in Australia contribute to the increased expenses compared with previous studies conducted in lower-cost regions. The adoption of an air recycle system in this study has demonstrated its effectiveness in reducing processing costs. Additionally, this study evaluates the carbon dioxide emissions associated with the processing methods, further assessing their environmental impact.

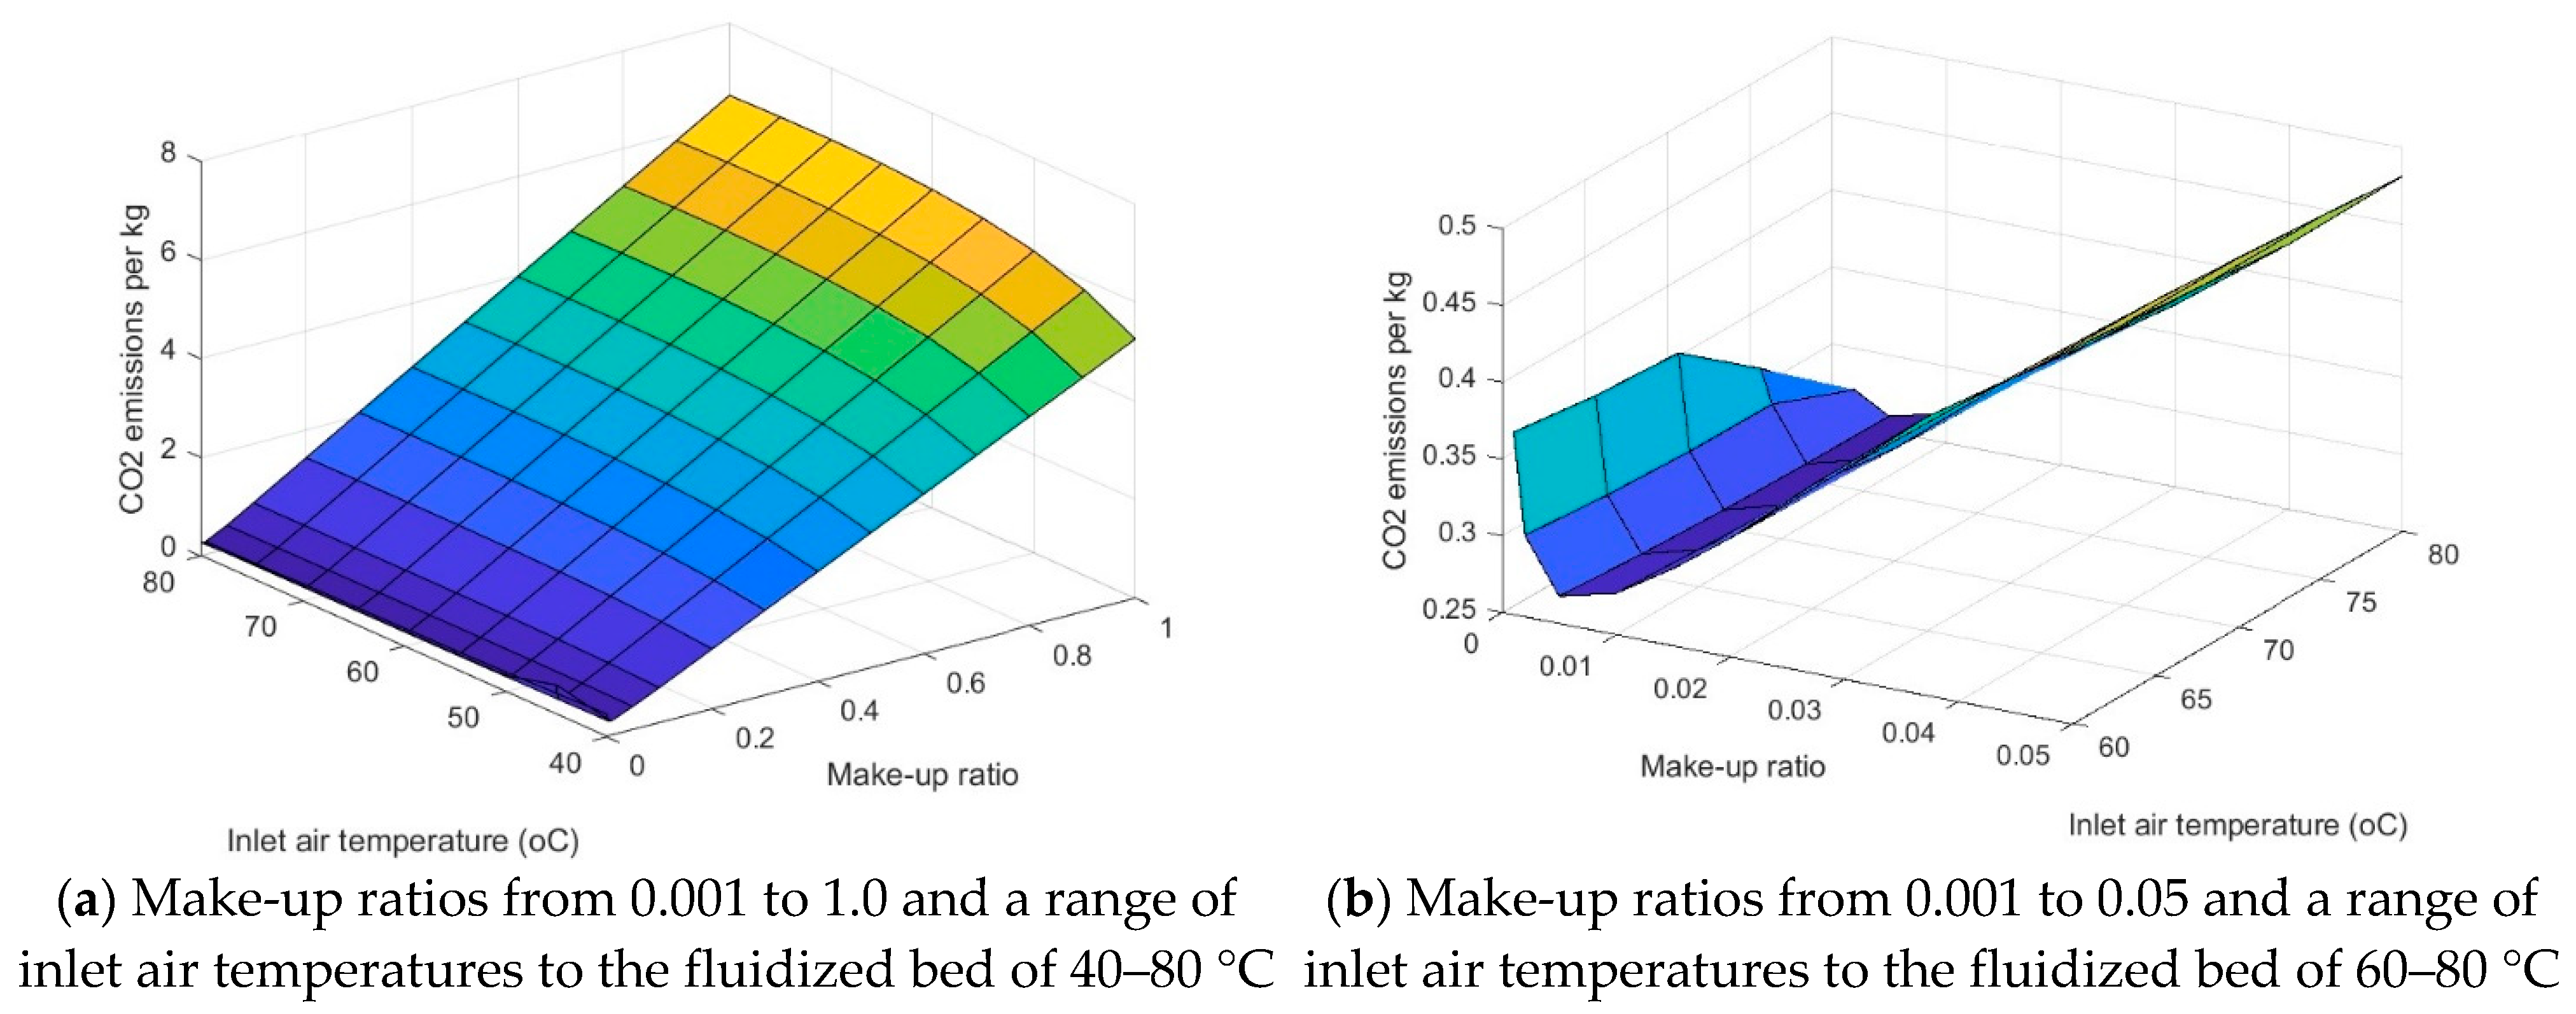
3.2.2. Carbon Emissions

These outcomes may be reviewed in the light of carbon emissions, since both the combustion of natural gas and the generation of electricity contribute to carbon emissions. The carbon emission factors in Australia for electricity and natural gas combustion have been taken from the document Australian National Greenhouse Accounts Factors from the Department of Climate Change, Energy, the Environment, and Water, DCCEEW [25]. For electricity, these are 217 kg CO2-e/GJ, and for natural gas, 65.5 kg CO2-e/GJ. The resulting plots are very similar in shape to those for financial costs.
The minimum operating carbon emissions occur at a slightly different make-up ratio (0.0055) than that for the minimum cost (r = 0.0092), with a flat minimum in the operating carbon emissions of around 0.259 kg of CO2 equivalent from the processing per kg of chickpeas. Again, as with the costs, recycling the air more (and reducing the make-up ratio) decreases the carbon emissions from over 6 to 0.259 kg of CO2 equivalent from the processing per kg of chickpeas.
The carbon dioxide emissions (kg of CO2 equivalent) embodied in the stainless steel used for the fluidized-bed dryer have been recently quoted as 6.15 kg of CO2 equivalent/kg stainless steel [26]. If the mass of the fluidized-bed dryer is assumed to be 500 kg of stainless steel, then the total (capital) embodied CO2 content for the equipment is 3075 kg of CO2 equivalent. Using the approach described in Hasan and Langrish [27], whereby the Capital Recovery Factor (CRF) from financial analysis is used to annualize the embodied energy and embodied carbon in capital structures, such as this fluidized-bed dryer, the same CRF as used in the financial analysis (0.163) may be used to annualize the total (capital) embodied CO2 content for the equipment. This approach gives an equivalent annual carbon dioxide emission for the fluidized-bed dryer of 501 kg of CO2 equivalent per year. Given the processing of 60 kg h−1 and 8000 h year−1, the inclusion of the embodied carbon into this analysis adds 501/(60 × 8000) = 0.001 kg of CO2 equivalent emissions per kg of chickpeas that are processed. This addition (0.001 kg CO2 (kg chickpeas)−1) is small compared with the carbon emissions associated with the operating and processing costs (over 0.259 kg CO2 (kg chickpeas)−1).

3.2.3. Product Quality and Environmental Considerations

Given that the drying schedule for chickpeas developed by Cheng and Langrish [2] uses inlet air temperatures from 40 °C to 80 °C, the techno-economic implications of this range of temperatures are worth considering. Reviewing the techno-economic results in Figure 2, Figure 3 and Figure 4, the cost of processing per unit mass and the equivalent carbon dioxide emissions per unit mass show only a very modest variation with the inlet air (drying) temperature, so using a recycling ratio of 99% for the range of temperatures used in the drying schedule (ibid.) will be both financially advantageous and beneficial in terms of minimizing carbon emissions. Implementing this drying schedule in the recycle scheme shown in Figure 1 should also not require any special changes to the schedule.

4. Conclusions

There is a significant decrease in the processing cost per unit mass as the make-up ratio decreases (and the recycling ratio increases) from over AUD 1.32/kg of chickpeas down to AUD 0.0885/kg of chickpeas as the process configuration changes from open loop (one through, no recycling) to 99% recycling. At low recycling ratios, the lowest processing cost per unit mass occurs at the lowest inlet air temperature of 40 °C (AUD 1.09/kg chickpeas, compared with AUD 1.32/kg at 80 °C). However, high recycling ratios (low make-up ratios) show that the lowest processing cost per unit mass occurs at the highest inlet air temperature of 80 °C. For carbon dioxide emissions, the pattern is the same in terms of having the lowest emissions at high recycling ratios and high inlet air temperatures. Adding the embodied carbon in the construction of the fluidized-bed dryer raises the equivalent carbon emissions by 0.001 kg CO2 (kg chickpeas)−1, which is small compared with the carbon emissions associated with the operating and processing costs (over 0.259 kg CO2 (kg chickpeas)−1). In terms of product quality considerations, no special changes to the previously produced drying schedule should be necessary to achieve minimum financial cost for processing and minimum carbon emissions from this processing. Future studies could extend the techno-economic analysis (TEA) of air-recycled fluidized-bed drying to other pulses, such as lentils, peas, and faba beans, to assess the broader applicability of this approach. Evaluating the impact of different drying conditions on the processing costs and carbon emissions of various pulse crops would provide valuable insights for optimizing sustainable drying techniques in the pulse industry.

Author Contributions

Conceptualization, T.A.G.L. and S.C.; Methodology, T.A.G.L.; Software, T.A.G.L.; Validation, T.A.G.L.; Data curation, T.A.G.L. and S.C.; Writing—original draft, T.A.G.L.; Writing—review & editing, S.C.; Supervision, T.A.G.L. All authors have read and agreed to the published version of the manuscript.

Funding

This research was funded by Global Innovation Linkages Program Round 3, Transitioning Australian pulses into protein-based food industries, no grant number.

Data Availability Statement

Data are contained within the article.

Conflicts of Interest

The authors declare no conflicts of interest.

Nomenclature

TTemperature°C
YHumiditykg kg−1
AAream2
CRFCapital recovery costAUD/USD
iInterest rate%
nThe number of repaymentsyear
GAir mass flow ratekg s−1
ρDensitykg m3
HLatent heat kJ kg−1
CPYSpecific heat capacity of air J kg−1 K−1
ΔpPressure dropsPa
PPowerW
QHeatW
rMake-up ratio
Subscripts
GGas
wbWet bulb
vwVaporization for water

References

  1. AEGIC, Australian Export Grains Innovation Centre (2017). Australian Pulses: Quality, Versatility, Nutrition. Available online: https://www.aegic.org.au (accessed on 16 September 2023).
  2. Cheng, S.; Langrish, T.A.G. Fluidised bed drying of chickpeas: Developing a new drying schedule to reduce protein denaturation and remove trypsin inhibitors. J. Food Eng. 2023, 351, 111515. [Google Scholar] [CrossRef]
  3. Olabode, H.A.; Standing, C.N.; Chapman, P.A. Total energy to produce food servings as a function of processing and marketing modes. J. Food Sci. 1977, 42, 768–774. [Google Scholar] [CrossRef]
  4. Rao, M.A. Energy consumption for refrigerated, canned and frozen snap beans and corn. J. Food Process Eng. 1980, 3, 61–76. [Google Scholar] [CrossRef]
  5. Cheng, W.-C.; Langrish, T.A.G. Technico-economic analysis: A case study for orange juice liquids and spray-dried powders. In Chemeca 2018; Morison, K., Ed.; IChemE: Queenstown, New Zealand, 2018; ISBN 9781911446682. [Google Scholar]
  6. Nwakuba, N.; Okafor, V.; Okorafor, O. Techno-economic analysis of a hybrid solar-electric dryer. Energy Sources Part A Recover. Util. Environ. Eff. 2020, 46, 10289–10313. [Google Scholar] [CrossRef]
  7. Philip, N.; Duraipandi, S.; Sreekumar, A. Techno-economic analysis of greenhouse solar dryer for drying agricultural produce. Renew. Energy 2020, 199, 613–627. [Google Scholar] [CrossRef]
  8. Haque, N.; Somerville, M. Techno-economic and environmental evaluation of biomass dryer. Procedia Eng. 2013, 56, 650–655. [Google Scholar] [CrossRef]
  9. Shofinita, D.; Langrish, T.A.G. Spray drying of orange peel extracts: Yield, total phenolic content, and economic evaluation. J. Food Eng. 2014, 139, 31–42. [Google Scholar] [CrossRef]
  10. Langrish, T.; Cheng, S. Technico-Economic Analysis for the Costs of Drying Chickpeas: An Example Showing the Trade-off between Capital and Operating Costs for Different Inlet Air Temperatures. In Proceedings of the IDS 2024—23rd International Drying Symposium, Wuxi, China, 24 November 2024. [Google Scholar]
  11. Selina Wamucii (2024), Australia Chickpeas Prices. Available online: https://www.selinawamucii.com/insights/prices/australia/chickpeas/ (accessed on 3 January 2024).
  12. Grains Research & Development Corporation, Grownotes, Section 7, 2018, Chickpea, Harvest. Available online: https://grdc.com.au/__data/assets/pdf_file/0031/369418/GrowNote-Chickpea-North-12-Harvest.pdf (accessed on 29 March 2025).
  13. Towler, G.P.; Sinnott, R.K. Chemical Engineering Design: Principles, Practice and Economics of Plant and Process Design, 3rd ed.; Butterworth-Heinemann: Oxford, 2022; Chapter 7; ISBN 978-0-12-821179-3. [Google Scholar]
  14. Brennan, D. Process Industry Economics—Principles, Concepts and Applications, 2nd ed.; Elsevier: San Diego, CA, USA, 2020; ISBN 9780128194669. EISBN 9780128195604. [Google Scholar]
  15. Turton, R.A.; Shaeiwitz, J.; Bhattacharya, D.; Whiting, W.B. Analysis, Synthesis, and Design of Chemical Processes, 5th ed.; Prentice-Hall: Hoboken, NJ, USA, 2018; ISBN 978-0134177403. [Google Scholar]
  16. Keey, R.B.; Danckwerts, P.V. Drying: Principles and Practice; Pergamon: Oxford, UK, 2013; Chapter 1; pp. 1–18. [Google Scholar]
  17. Strumiłło, C.; Jones, P.L.; Żyłła, R. Energy Aspects in Drying. In Handbook of Industrial Drying, 4th ed.; Mujumdar, A.S., Ed.; ebook published; CRC Press: Boca Raton, FL, USA, 2014; Chapter 54; pp. 1077–1100. ISBN 9780429169762. [Google Scholar] [CrossRef]
  18. Pakowski, Z.; Mujumdar, A.S. Basic process calculations in drying. In Handbook of Industrial Drying; CRC Press: Boca Raton, FL, USA, 2020; pp. 10–13, 71–111. [Google Scholar]
  19. Venkateshan, S.P. Heat Transfer; Springer Nature: Berlin/Heidelberg, Germany, 2021; Chapter 2; pp. 17–57. [Google Scholar]
  20. Australian Energy Regulator, Whole Gas and Electricity Prices, Q3, 2023, Industry Charts, Monitoring Performance and Analysing Trends. Available online: https://www.aer.gov.au/industry/wholesale/charts (accessed on 29 December 2024).
  21. Davis, W.V.; Weber, C.; Wechsler, S.; Lucier, G.; Wakefield, H.; Vaiknoras, K. Vegetables and Pulses Outlook, December 2023. In Economic Research Service, Situation and Outlook Report; USDA, United States Department of Agriculture: Washington, DC, USA, 2023. [Google Scholar]
  22. Hecht, J.P.; Beimesch, W.E.; Dyvelkov, K.N.; Kemp, I.C.; Langrish, T.A.G.; Smith, F.L.; Stamper, J.A. Psychrometry. In Perry’s Chemical Engineers’ Handbook, 9th ed.; Green, M.Z., Southard, D.W., Eds.; McGraw-Hill Education: New York, NY, USA, 2019; Chapter 12.1; Available online: https://www.accessengineeringlibrary.com/content/book/9780071834087/toc-chapter/chapter12/section/section2 (accessed on 29 December 2024).
  23. Malik, D.P.; Kundu, K.K.; Singh, D.; Singh, K. Production and processing of chickpea in Haryana state-An economic analysis. Haryana J. Agron. 2009, 25, 48–53. [Google Scholar]
  24. Australian Bureau of Statistics, Products Price Indexes, Australia, Dec, 2024. Available online: https://www.abs.gov.au/statistics/economy/price-indexes-and-inflation/producer-price-indexes-australia/latest-release (accessed on 29 March 2025).
  25. DCCEEW, Department of Climate Change, Energy, the Environment, and Water, Australian National Greenhouse Accounts Factors, Australian Government, February 2023. Available online: https://www.dcceew.gov.au/sites/default/files/documents/national-greenhouse-accounts-factors-2022.pdf (accessed on 12 February 2024).
  26. Maharaj, P.; Freidrich, E. Environmental life cycle, carbon footprint and comparative economic assessment of rainwater harvesting systems in schools—A South African case study. Water SA 2014, 50, 80–91. [Google Scholar] [CrossRef]
  27. Hasan, M.; Langrish, T.A.G. Development of a sustainable methodology for life-cycle performance evaluation of solar dryers. Sol. Energy 2016, 135, 1–13. [Google Scholar] [CrossRef]
Figure 1. Schematic diagram of air recycle system for fluidized-bed drying (of chickpeas and other pulses).
Processes 13 01178 g001
Figure 2. Surface plot for the cost of processing per unit mass of chickpeas processed as a function of the make-up ratio and the inlet air temperature, for a range of make-up ratios from 0.001 to 1.0 and a range of inlet air temperatures to the fluidized bed of 40–80 °C.
Processes 13 01178 g002
Figure 3. Surface plot (close-up of Figure 2) for the cost of processing per unit mass of chickpeas processed as a function of the make-up ratio and the inlet air temperature, for a range of make-up ratios from 0.001 to 0.05 and a range of inlet air temperatures to the fluidized bed of 60–80 °C.
Processes 13 01178 g003
Figure 4. Surface plot for the operating carbon emissions per unit mass of chickpeas processed as a function of the make-up ratio and the inlet air temperature.
Processes 13 01178 g004
Table 1. Drying (evaporation) flux and full-scale fluidized bed sizing calculations for chickpeas, based on the drying data of Cheng and Langrish [2], from an initial moisture content of 55% (dry basis) to a final moisture content of 14% (d.b.).
Inlet Air Drying TemperatureWet-Bulb Temperature for an Inlet Air Humidity of 0.0077 kg kg−1Drying Flux
(Evaporative Flux)
Full-Scale Fluidized Bed Cross-Sectional Area
(°C)(°C)(kg m−2 bed area h−1)(m2)
4021.041.978.06
6026.503.484.56
8031.065.093.12
Table 2. Estimated costs of fluidized beds for chickpea drying, including the conversion from Purchased Equipment Costs (PECs) to Process Plant Costs (PPCs, Lang factor 4), allowing for stainless steel construction (1.3) and the Australian dollar to US dollar conversion (1.5).
Inlet Air Drying TemperatureBasic Capital Cost (Based on Tray Dryer)
(PEC)
Process Plant Cost After Using Lang Factor, Allowing for Stainless Steel
(PPC)
Process Plant Cost in Australian Dollars
(PPC)
Annual Capital Recovery Costs
(°C)(USD)(USD)(AUD)(AUD/year)
4020,800108,160162,24026,445
6017,00088,400132,60021,614
8011,70060,84091,26014,875
Table 3. The effect of different inlet air drying temperatures on the predicted airflow rates for maintaining fluidization, the predicted changes in air humidity and temperature across the fluidized bed during drying, and the outlet air humidities and temperatures.
Inlet Air Drying TemperatureG, Airflow Rate for FluidizationΔY, Change in Air HumidityΔTG, Change in Air TemperatureYout, Outlet Air HumidityTGout, Outlet Air Temperature
(°C)(kg s−1)(×10−3 kg kg−1)(°C)(kg kg−1)(°C)
4086.40.05100.1120.01005139.9
6046.00.09590.2110.01009659.8
8029.70.14900.3270.01014979.7
Table 4. The effect of different inlet air drying temperatures on the predicted thermal energies required to heat the air at the required flow rates (Equation (14)), predicted air pumping power required for fluidization (Equation (15)), and predicted heat losses (Equation (16)).
Inlet Air Drying TemperatureQ, Thermal Energy Required to Heat the AirP, Pumping Power Required to Fluidize the BedQL, Heat Losses
(°C)(kW)(kW)(kW)
4012967.76.0
6016324.38.0
8011923.08.6
Table 5. Gas and electricity costs, utilities costs, and total operating and capital costs for the once-through drying system when processing 60 kg h−1 of chickpeas.
Inlet Air Drying TemperatureAnnual Gas Heating CostsAnnual Electricity (Fan) CostsUtilities Cost per Unit Mass of ChickpeasTotal Operating Costs per Unit Mass of ChickpeasTotal Capital and Operating Costs per Unit Mass
(°C)(AUD/year)(AUD/year)(AUD/kg)(AUD/kg)(AUD/kg)
40407,90044100.861.031.09
60505,70025001.061.271.32
80513,30017101.071.291.32
Table 6. Distribution of costs for optimum open-loop and optimized closed-loop processing conditions.
Open Loop, No RecyclingClosed Loop, Recycling Ratio 99%
Inlet air temperature (°C)4080
Area of fluidized bed (m2)8.064.41
Annualized capital costs (AUD per year−1)26,50019,300
Annual gas heating costs (AUD per year−1)407,90017,000
Gas flow rate (kg s−1)86.442.0
Annual electricity (fan) costs (AUD per year−1)44102240
Total processing cost per unit mass (AUD per kg−1)1.090.09
Disclaimer/Publisher’s Note: The statements, opinions and data contained in all publications are solely those of the individual author(s) and contributor(s) and not of MDPI and/or the editor(s). MDPI and/or the editor(s) disclaim responsibility for any injury to people or property resulting from any ideas, methods, instructions or products referred to in the content.

