Article

Evaluation of Pore-Fracture Structures and Gas Content in Deep Coal Reservoir of Yan’an Gas Field, Ordos Basin

1
Gasfield Company of Shaanxi Yanchang Petroleum Group Co., Ltd., Yan’an 716000, China
2
College of Geoscience and Surveying Engineering, China University of Mining and Technology, Beijing 100083, China
*
Authors to whom correspondence should be addressed.
Processes 2025, 13(4), 1177; https://doi.org/10.3390/pr13041177
Submission received: 13 March 2025 / Revised: 3 April 2025 / Accepted: 11 April 2025 / Published: 13 April 2025

Abstract

:
Research has delved into the main controlling factors for the evolution of the pore-fracture structure in deep coal samples. The gas content is influenced by multiple factors, among which the pore-fracture structure in deep coal samples stands as one of the key determinants. To ascertain the evolution of the pore-fracture structure and the main controlling factors of the gas content in deep coal samples of the Yan’an Gas Field, 16 coal samples were collected from the Yan’an Gas Field in the Ordos Basin in this study. A series of laboratory tests and analyses were then carried out. According to the test results, the major controlling factors for the evolution of the pore-fracture structure of the samples were analyzed in accordance with the proximate analysis components, maceral components, mineral composition of the coal samples, and Ro,max, in conjunction with the pore volume and specific surface area of nanopores. Meanwhile, based on the in situ desorption experiment, the major controlling factors of the gas content in coal were explored. First, based on the SEM and hand specimen identification, the pore-fracture structure of the samples is relatively well developed. Calcite filling the fractures of samples can be seen in the hand specimens of samples. This indicates that the mineral composition has a very important influence on the evolution of the pore-fracture structure of samples. Secondly, this study indicates that pore-fracture structure evolution is influenced by multiple factors, primarily ash content and fixed carbon. As ash content increased, the mesopore surface area and volume rose across all sample types, with Type C showing the highest increase (78.1% in surface area and 12.4% in volume compared to Type A). Conversely, micropore characteristics declined, with Type C exhibiting a 4.8% drop in surface area and a 4.7% reduction in volume. The Ro,max of the samples is generally higher than 2.8%, which has a multifaceted impact on pore-fracture structure evolution. Finally, the gas content is mainly controlled by pore volume and the specific surface area of nanopores, with industrial components and maceral compositions showing minimal direct influence. This suggests that gas content results from the combined effects of material composition and pore-fracture structure evolution. Inorganic minerals like quartz and calcite indirectly affect gas content by influencing pore structure development—occupying spaces while also creating new pores, especially through calcite dissolution. Conversely, clay minerals generally hinder pore development by filling spaces with limited fracture-forming capacity. The main purpose of this study is to evaluate the gas content of coal samples in Yan‘an Gas Field. There are few studies on this area by previous scholars.

1. Introduction

In recent years, with the advancement in the research on deep coalbed methane theories, remarkable breakthroughs have been achieved [1]. Deep coalbed methane has abundant reserves in coal-measure strata, which is of great significance for enhancing energy supply, reducing greenhouse gas emissions, and alleviating the tight situation of conventional oil and gas resources. The deep coalbed methane resources in the Ordos Basin, Junggar Basin, Qinshui Basin, and other regions have attracted attention due to their vast potential. Among them, as a leading region in China’s natural gas production, the Ordos Basin contributes a substantial share to the national natural gas output. The discovery of large gas fields such as Sulige and Yulin has significantly ensured national energy security [2,3]. Meanwhile, remarkable achievements have been made in deep CBM exploration and production (E&P) in the Ordos Basin. In recent years, the newly proven reserves account for a large proportion of the national incremental reserves in the same period. The development of deep coalbed methane in the Daning–Jixian Block has taken initial shape, and the exploration in the central part of the basin has also been fully carried out. The discovery of several large gas fields further highlights the promising prospects of coalbed methane exploration in the basin [4,5,6]. Deep coalbed methane resources hold enormous potential. The gas content is a crucial parameter for resource evaluation and is essential for the exploration and development of deep coalbed methane resources. Given the complex geological conditions of the deep coal reservoir, it is particularly vital to conduct an in-depth analysis of the impacts of coal sample characteristics, coal quality, and pore characteristics on the gas content for deep CBM exploration and production (E&P).
There are numerous factors influencing the gas content of coalbed methane, including reservoir pressure, reservoir temperature, and coal quality characteristics [7,8]. Qin et al. argue that pressure and temperature changes with burial depth modify coal’s methane adsorption behavior and CBM occurrence, ultimately influencing gas content. Simultaneously, coal quality characteristics and pore structure properties influence coal-bed methane content by affecting the gas storage capacity within coal reservoirs [9]. Zhu demonstrates that the deep coalbed methane content results from nonlinear interactions between geological factors including burial depth, coal rank, pressure gradient, and thermal gradient [10].
Xiao et al. believe that the ash content occupies most of the pore space and is negatively correlated with the micropore volume. In addition, the development of mesopores is usually controlled by the degree of thermal evolution and proximate analysis components, which comprehensively affects the gas content [11]. Sun et al. believe that the ash content reduces the reservoir-storage capacity of coal and fills the micropores, thus leading to an increase in the heterogeneity of the coal reservoir and affecting the gas content [12]. Ouyang et al. demonstrate that mineral matter (ash) in coal occupies void spaces otherwise available for organic matter. Given its low gas adsorption capacity, this mineral fraction reduces both the effective surface area for gas adsorption and the available gas storage volume. Consequently, this mechanism results in diminished methane adsorption capacity of the coal matrix, ultimately reducing the total gas content within the reservoir [13]. Liu et al. demonstrate that clay mineral infill within coal’s micropore system reduces available adsorption sites, thereby diminishing both the reservoir’s methane adsorption capacity and permeability characteristics essential for CBM migration [14]. Mastalerz et al. found that an increase in the ash content will lead to a large number of micropores being filled, deteriorating the adsorption and seepage conditions of deep coalbed methane [15].
Based on previous research, 16 coal samples from the Yan’an Gas Field were selected as the research objects to conduct a refined description of the pore structure of deep coal reservoirs and the main controlling factors of gas content. Unlike previous studies, in this study, the coal samples were classified into ultra-low-ash coal (ash content ranging from 0% to 10%), low-ash coal (ash content ranging from 10% to 20%), and medium-ash coal (ash content ranging from 20% to 30%). Then, based on the experimental results, the evolution law of the pore-fracture in coal samples and the main controlling factors of gas content were analyzed. Firstly, according to the classification, the Ro,max, proximate analysis component contents, and maceral composition of the samples under different ash contents were studied. Secondly, based on the test results of the Low-Temperature Nitrogen Adsorption Experiment (LTN2 GA), Low-Pressure Carbon Dioxide Adsorption Experiment (LPCO2 GA), and X-ray Diffraction Experiment (XRD), the main controlling factors of the proximate analysis components, maceral composition of coal samples, and mineral contents on the pore volume (PV) and specific surface area (SSA) of nanopores (less than 2 nm and 2–100 nm) under different ash contents were analyzed. Finally, based on the experimental results, the main controlling factors of the gas content in coal samples and their influencing mechanisms were analyzed.
This study aims to offer a scientific reference for the future exploration and development of coalbed methane wells within the study area. By doing so, it seeks to minimize unnecessary resource wastage during development and exploration phases, enhance the efficiency of coalbed methane extraction, and contribute to environmental protection [16].

2. Geological Background

The Yan’an Gas Field is located in the southeastern part of the Ordos Basin, geographically covering Yan’an City, Shaanxi Province, and its surrounding areas (Figure 1). Tectonically, it is situated in the transitional area between Yishan Slope and the Weibei Uplift [17]. Second only to the Tarim Basin in sedimentary volume in China, the Ordos Basin exhibits a predominant north–south structural trend, covering an area of approximately 3.7 × 10⁵ km2. Affected by the compression of the Qinling Orogenic Belt at the southern margin of the basin, multiple phases of thrust fault systems have developed. However, the southern slope zone where the Yan’an Gas Field is located has a relatively gentle structure, and the general dip angle of the strata is less than 5° [18]. The deep coal-bearing strata in this area mainly occur within the Shanxi Formation of the Upper Paleozoic Permian and the Yan’an Formation of the Mesozoic Jurassic. The burial depth of the Shanxi Formation ranges from 2000 to 3500 m, belonging to a transgressive delta-coastal environment. The reservoir in the second member of the Shanxi Formation is mainly composed of fine- to medium-grained quartz sandstone (quartz more than 80%), with a porosity of less than 10% and a permeability of less than 1 mD, belonging to tight sandstone. The reservoir space is mainly composed of secondary dissolved pores and microfractures, which are controlled by siliceous cementation and dissolution [19,20]. The roof and floor of the coal reservoir are mostly mudstone or siltstone, forming good sealing conditions. The interbedding of the coal reservoir and sandstone forms a “sandwich” structure, providing a channel for the vertical migration of natural gas. The deep coal reservoirs in the Yan’an Gas Field have been superimposed and reconstructed by the Indosinian and Yanshanian tectonic movements, forming broad and gentle folds and local small faults. The formation pressure coefficient ranges from 0.9 to 1.1, belonging to a normal-pressure system, but locally, high-pressure sealed boxes are formed due to differential compaction [19]. The gas reservoir type is mainly of the lithological–structural composite type, and the enrichment of natural gas is jointly controlled by sedimentary microfacies (such as the distribution of channel sand bodies) and structural highs [20]. This study mainly focuses on the No. 5 coal seam of the Shanxi Formation and the No. 8 coal seam of the Benxi Formation in the Yan’an Gas Field, with a burial depth of over 2000 m, which belong to deep coal. In this study, a total of 16 samples were collected from four wells, namely J2, J3, J5, and J6.

3. Experimental Methods

LPCO2 GA and LTN2 GA measure the adsorption amounts of CO2 and N2 under low-temperature conditions through a gas adsorption instrument and a specific surface area analyzer, respectively [22]. These are used to analyze the nanopore structure and SSA of coal samples. For the analysis of industrial components, moisture, ash, and volatile matter were determined according to the standard experimental procedure and the fixed carbon content was calculated. The final results were based on air drying. The determination of vitrinite reflectance assesses the vitrinite reflectance under a microscope to characterize the maturity of organic matter. This method can not only test the vitrinite reflectance of coal rocks but also detect that of other rocks such as shales [23]. Maceral analysis observes the composition of substances in microscopic samples under the microscope with the aid of an optical microscope. X-ray diffraction (XRD) determines the composition of substances by using an X-ray diffractometer. Scanning electron microscopy (SEM) obtains high-resolution microscopic morphology images by scanning with an electron beam [24]. The gas content data of this study came from the field desorption experiment, using the conventional desorption method, and the desorption experiment was carried out quickly after the coal sample was collected. This method is an effective means of obtaining gas content. Although there will be a certain amount of lost gas, the estimated lost gas can ensure that the data are basically accurate. This method is also widely used in shale gas and sandstone gas [25]. These experiments jointly provide a comprehensive means of characterizing the pore-fracture structure of coal samples (Table 1).

4. Results and Discussion

4.1. Classification of Coal Sample Types Based on Proximate Analysis, Coal Rank, and Maceral Composition

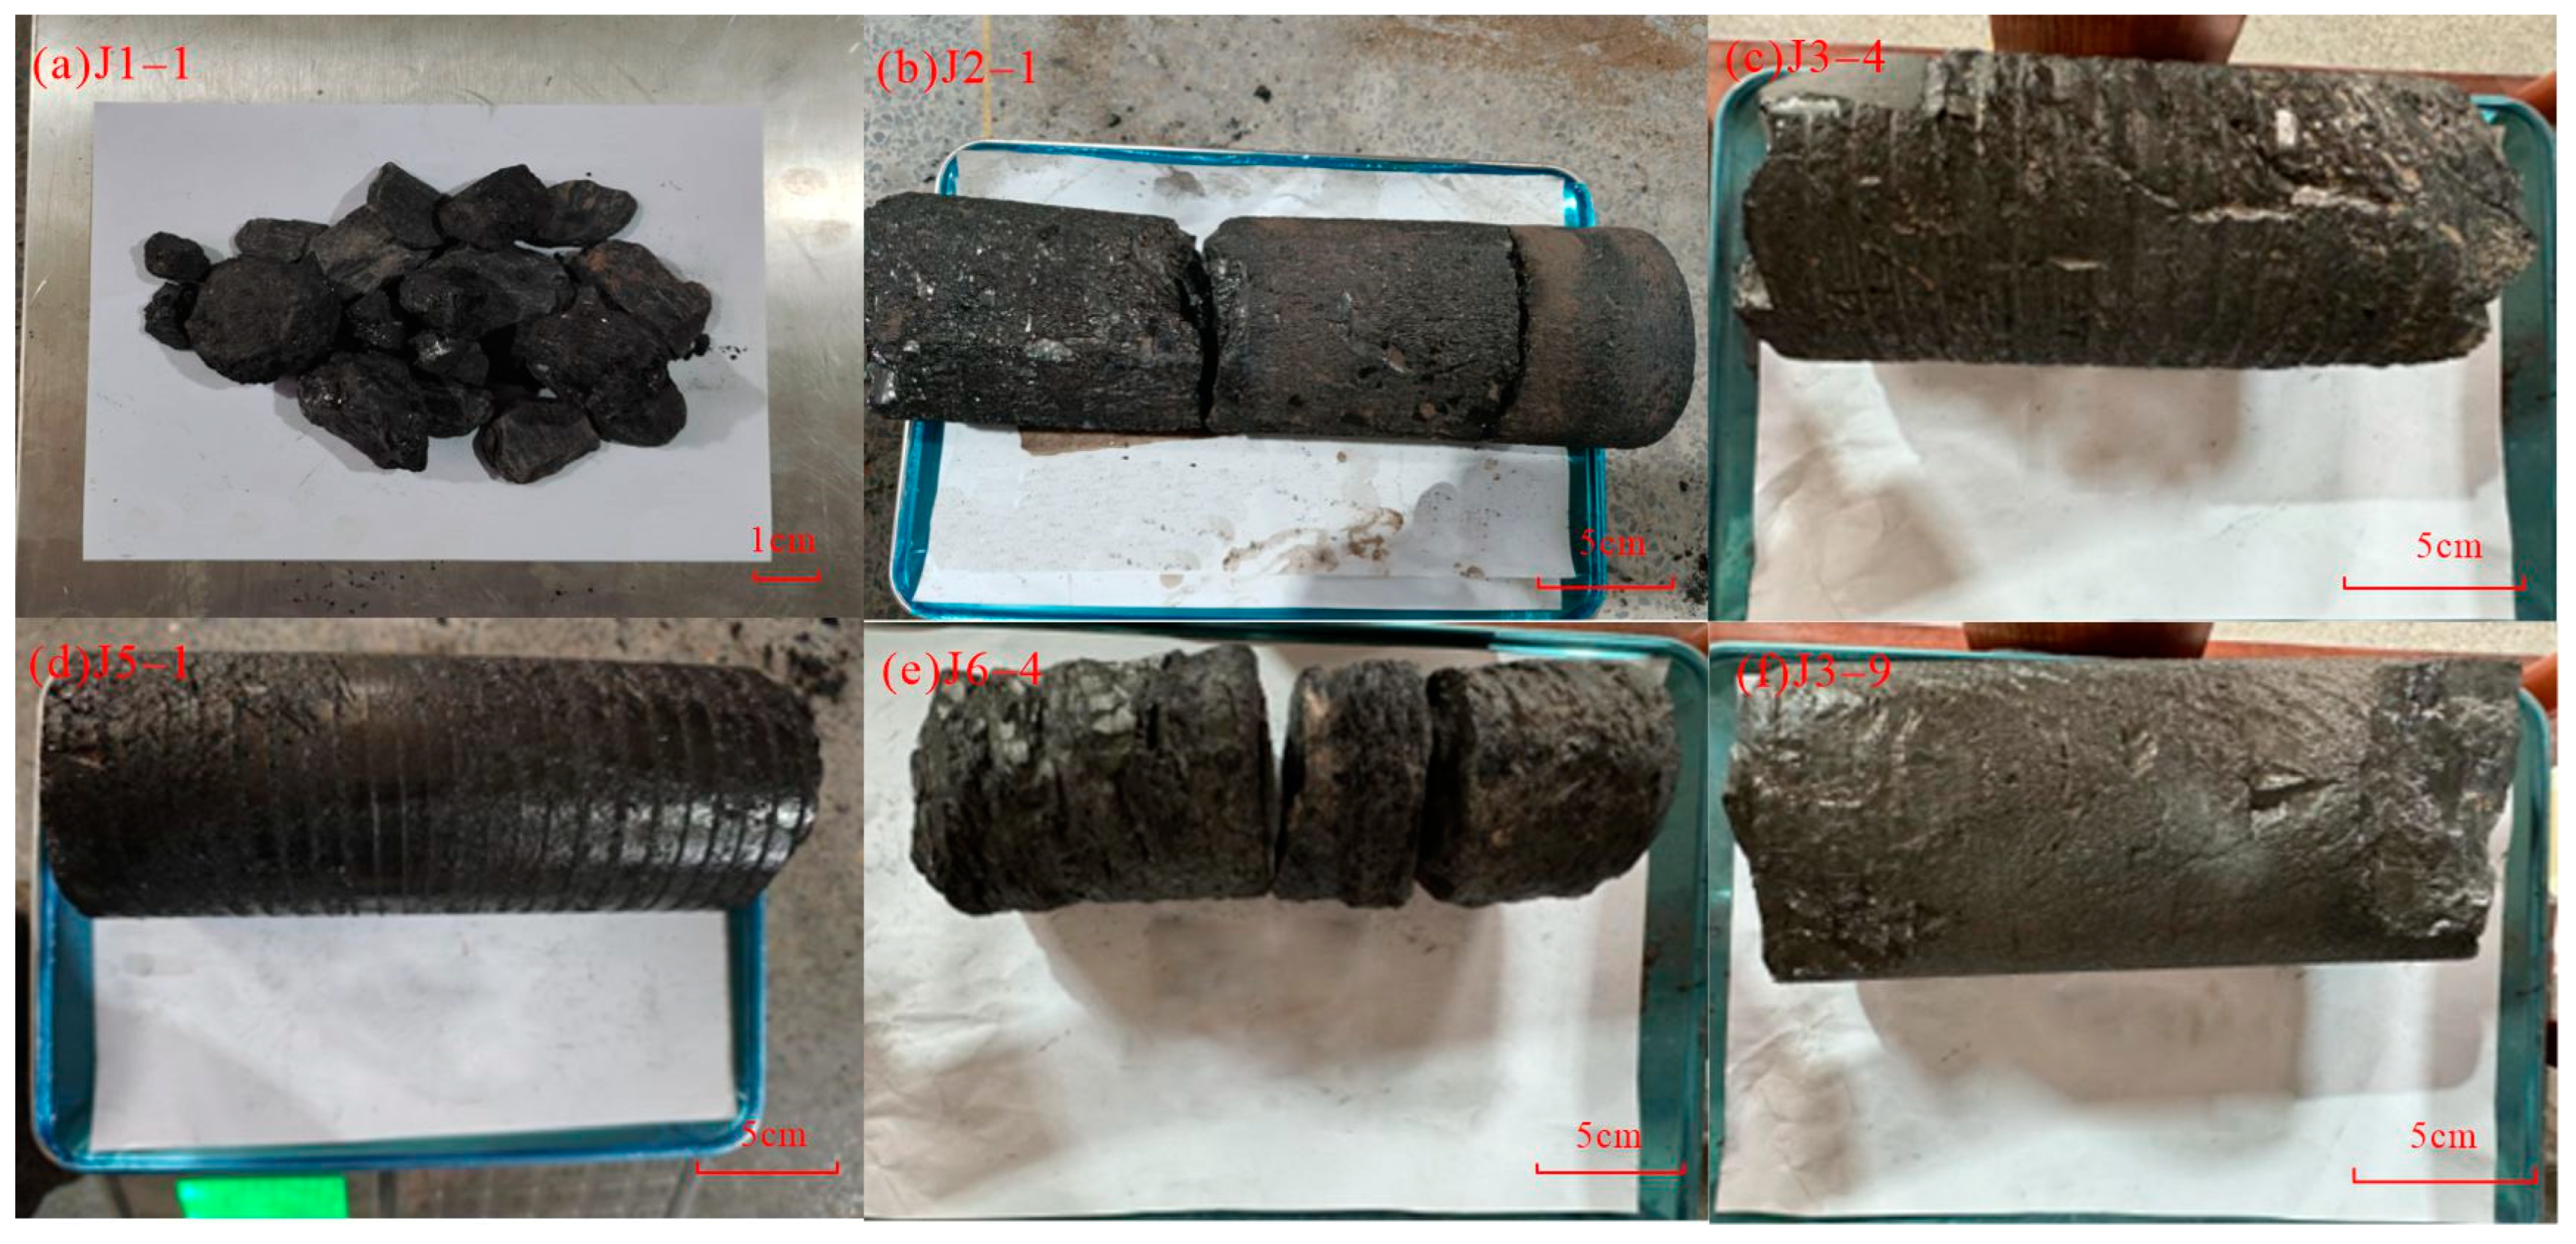
Based on the naked eye observation of hand specimens, the macroscopic maceral components of the samples in the study area are mainly semi-bright coal, with a small portion being dull coal and semi-bright coal. Overall, the samples are relatively intact and exhibit a columnar structure, while some coal samples show a fragmented blocky shape. The samples in the study area are mainly massive and banded, and some also have a layered structure. The observable characteristics of different samples with the naked eye vary as well. For coal sample J1-1 (Figure 2a), this sample generally has a strong luster, appearing grayish-black with a vitreous luster. It has a relatively high hardness and an uneven fracture. However, the endogenous cleats and exogenous fractures are not easily observable. The carbonaceous mudstone and semi-bright coal of this sample are both in a fragmented blocky state and are mixed together. For coal sample J2-1 (Figure 2b), it has a relatively strong overall luster, appearing grayish-black with a vitreous luster. It has a relatively high hardness and an uneven conchoidal fracture. At the same time, this coal sample also develops two groups of cleats approximately perpendicular to the bedding plane, namely face cleats and butt cleats. These two groups of cleats are perpendicular or obliquely intersecting. The endogenous cleats are partially filled with calcite films, the exogenous fractures are completely filled with calcite veins, a 5 cm thick carbonaceous mudstone develops in the middle, and a pyrite band is present. The coal sample also has a banded structure. For coal sample J3-4 (Figure 2c), this sample has an asphaltic luster, a stepped fracture, and a relatively high hardness. At the same time, the butt cleats show a spacing > 10 cm, but the face cleats are developed, with a length of 3 cm for the face cleats. It is worth noting that the endogenous fractures of the coal sample are filled with calcium carbonate. For coal sample J5-1 (Figure 2d), it appears blackish-gray, with an adamantine luster and a stepped fracture, but the fractures of the coal sample are not developed. For coal sample J6-4 (Figure 2e), it has a silky luster, a conchoidal fracture, and a relatively high hardness. At the same time, a 4.5 cm thick gangue interlayer can be observed. It is worth noting that the face cleats of this sample are developed, while the butt cleats show a spacing > 8 cm. There is a 1 cm long face cleat, and the endogenous fractures are filled with calcium carbonate. For coal sample J3-9 (Figure 2f), it has a vitreous luster, a stepped fracture, and a relatively high hardness. It is worth noting that the butt cleats show a spacing > 10 cm, but the face cleats are developed, and the endogenous fractures are filled with calcium carbonate.
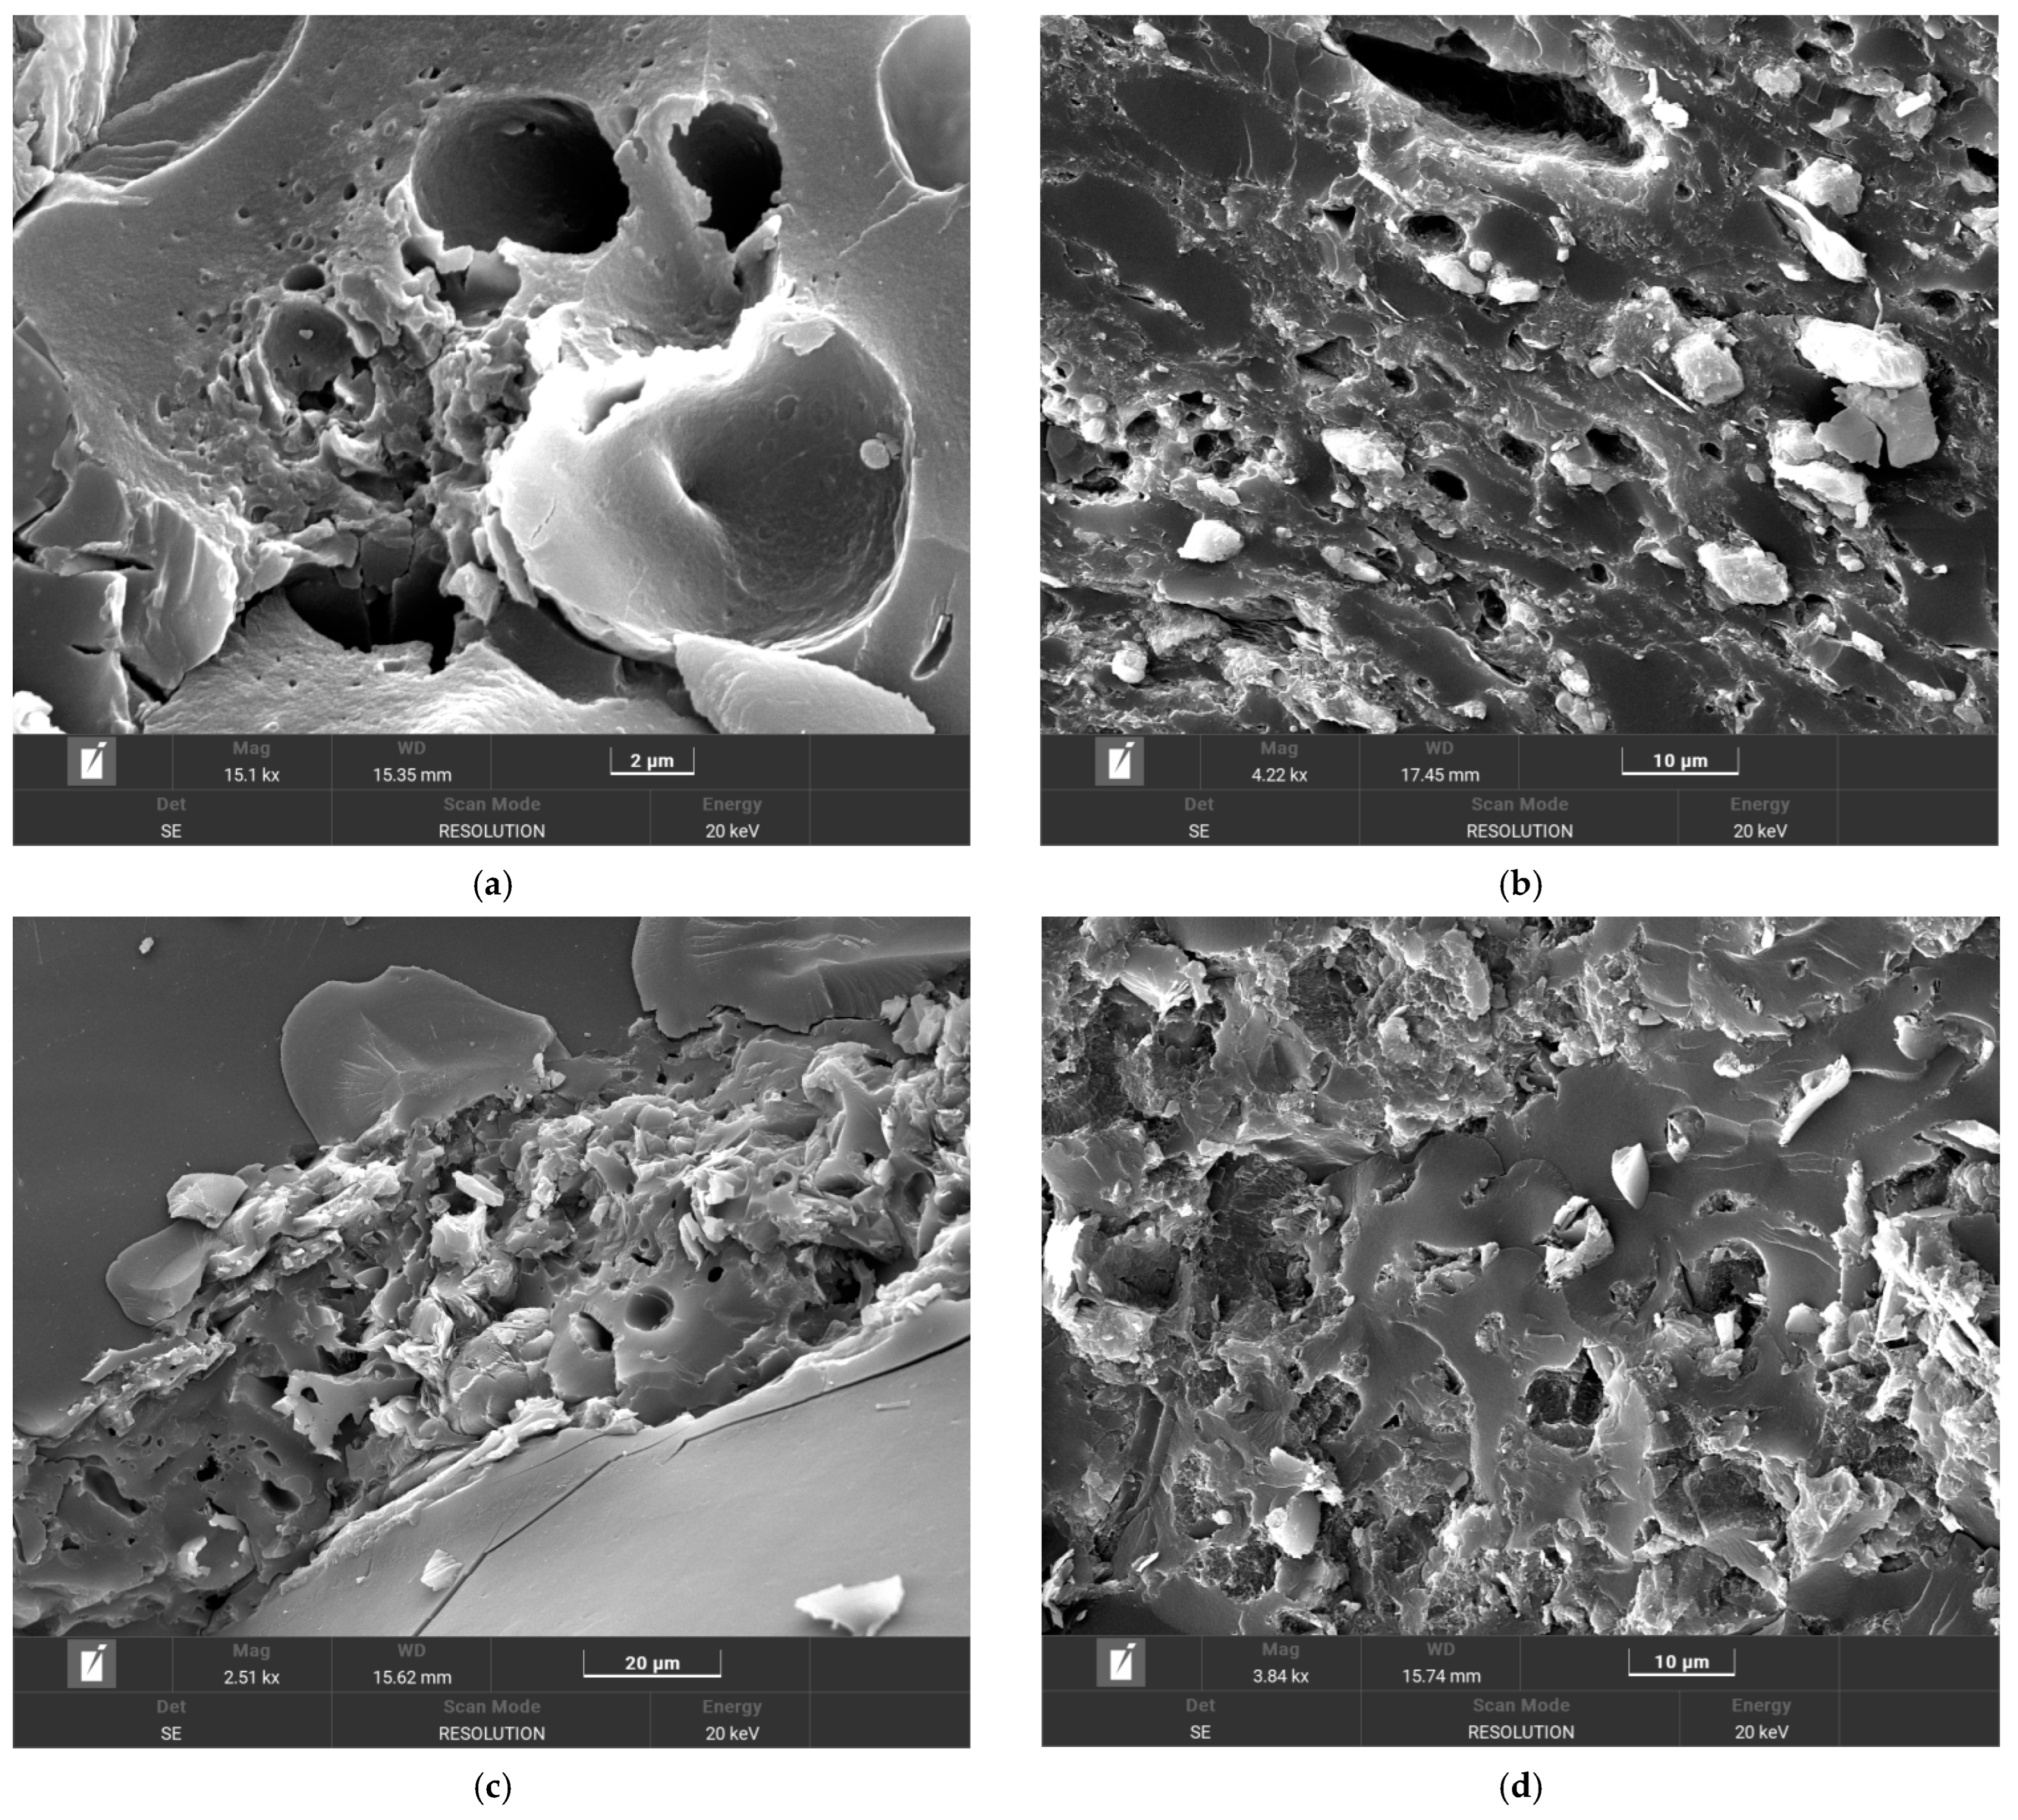
Scanning electron microscopy (SEM) has distinct advantages in observing the material composition of coal samples and the development of pore-fracture structures at the microscopic level. For sample J2-1 (Figure 3a), the main component of the sample is vitrinite, with sporadic occurrences of alginite. Pores can be observed inside some vitrinite, and sclerotia can also be seen. For sample J3-3 (Figure 3b), the main component of the sample is vitrinite, and part of the vitrinite is distributed in a banded pattern. Pores can be observed, and some of the pores are filled with argillaceous particles. Sporadic alginite can be seen on the surface of local grains. For sample J5-2 (Figure 3c), the main component of the sample is vitrinite, and pores can be observed inside the vitrinite, which are locally distributed in groups. Argillaceous particles and the like can be seen filling the pores and microfractures, and alginite development can be seen on the surface of local grains. Pores can be observed inside, which are locally distributed in groups. Argillaceous particles and the like can be seen filling the pores and microfractures. For sample J6-1 (Figure 3d), the main component of the sample is vitrinite, with local occurrences of fusinite. Pores can be observed in the vitrinite. Clay minerals such as illite and illite-smectite mixed layers can be seen between local grains. Authigenic minerals and the like can be seen filling the microfractures locally. Pores can be observed. Clay minerals such as illite and illite-smectite mixed layers can be seen between local grains. Authigenic minerals and the like can be seen filling the microfractures locally.
In order to achieve a refined description of the pore-fracture structure and the main controlling factors of gas content in coal samples under the constraint of ash content, the samples were specifically divided into three types according to their ash content: Type A, Type B, and Type C. Type A has an ash content ranging from 0 to 10%, belonging to ultra-low-ash coal. Type B has an ash content ranging from 10 to 20%, belonging to low-ash coal. Type C has an ash content ranging from 20 to 30%, belonging to medium-ash coal.
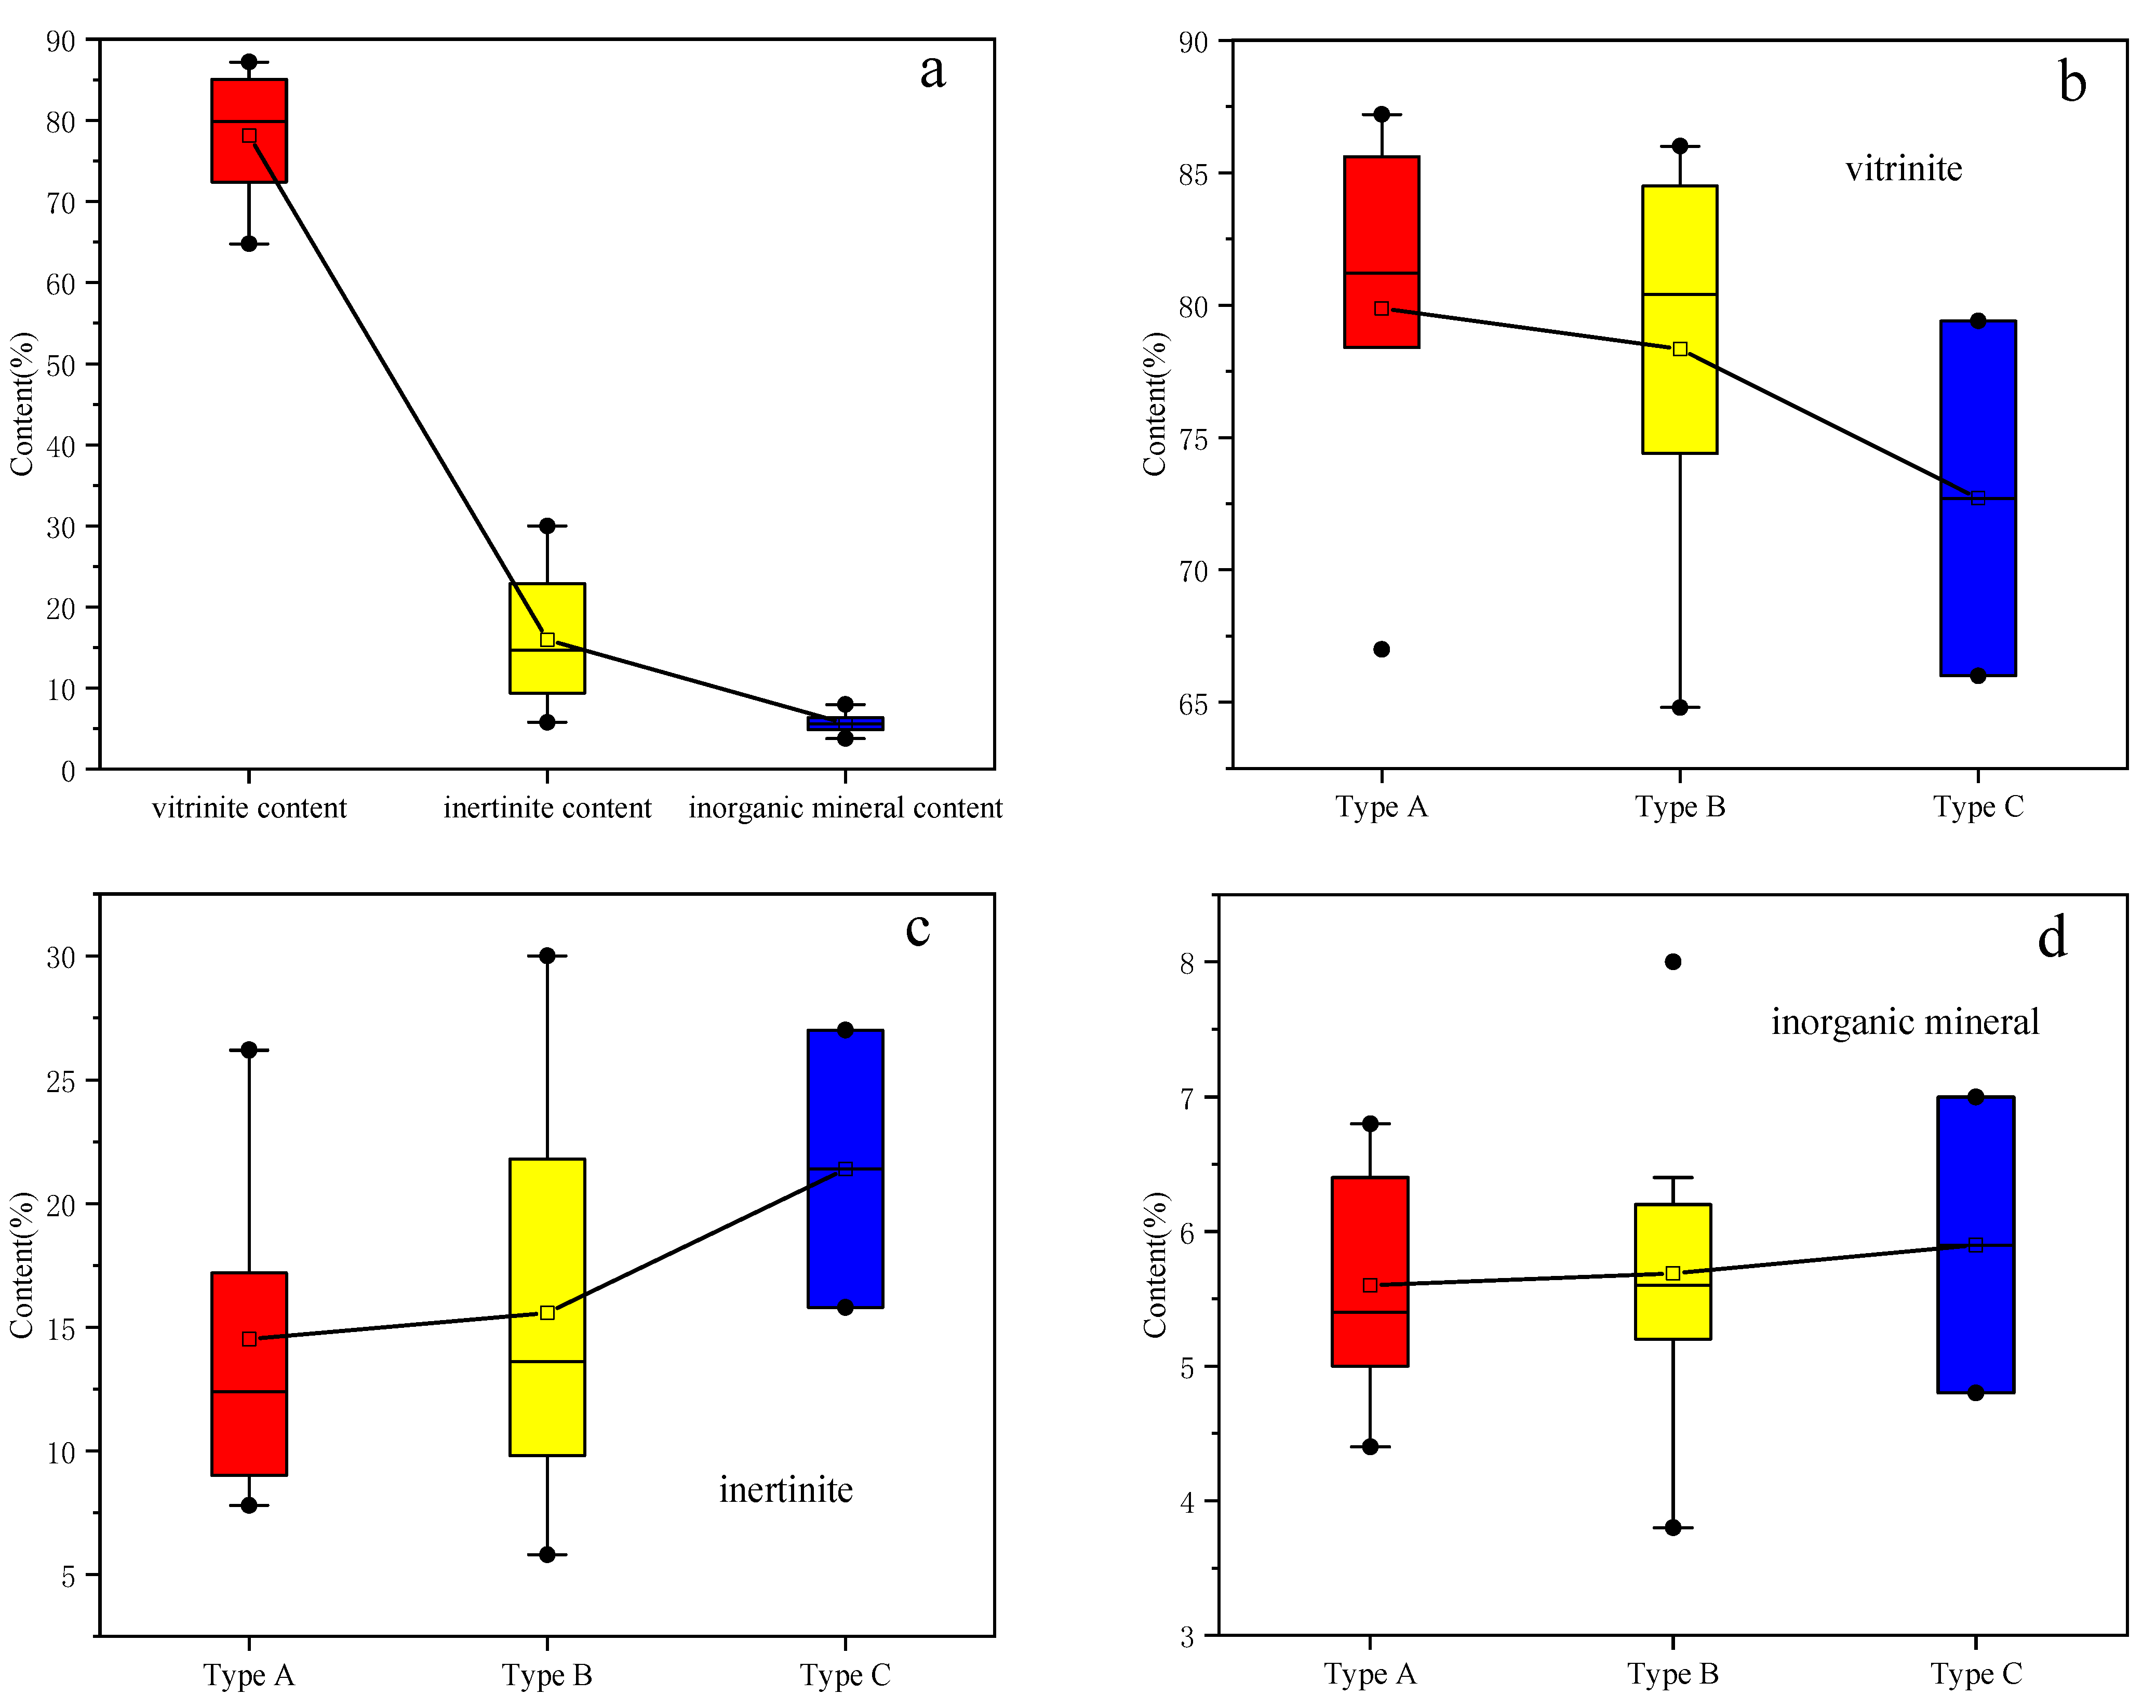
As can be seen from the statistical results (Figure 4), the maceral composition content is mainly the vitrinite group, followed by the inertinite group, and the content of inorganic minerals is the least. The content of the vitrinite group in Type A ranges from 67% to 87.2%, the content of the inertinite group ranges from 7.8% to 26.2%, and the content of inorganic minerals ranges from 4.4% to 6.8%. The content of the vitrinite group in Type B ranges from 64.8% to 85.8%, the content of the inertinite group ranges from 5.8% to 30%, and the content of inorganic minerals ranges from 3.8% to 6.4%. The content of the vitrinite group in Type C ranges from 66% to 79.4%, the content of the inertinite group ranges from 15.8% to 27%, and the content of inorganic minerals ranges from 4.8% to 7%. For the samples with three different ash contents, as the ash content increases, the content of the vitrinite group shows a decreasing trend. At the same time, in contrast to the vitrinite group, the content of the inertinite group shows an increasing trend with the increase in the ash content. It is worth noting that the content of inorganic minerals is less affected by the ash content, and the difference is not obvious.
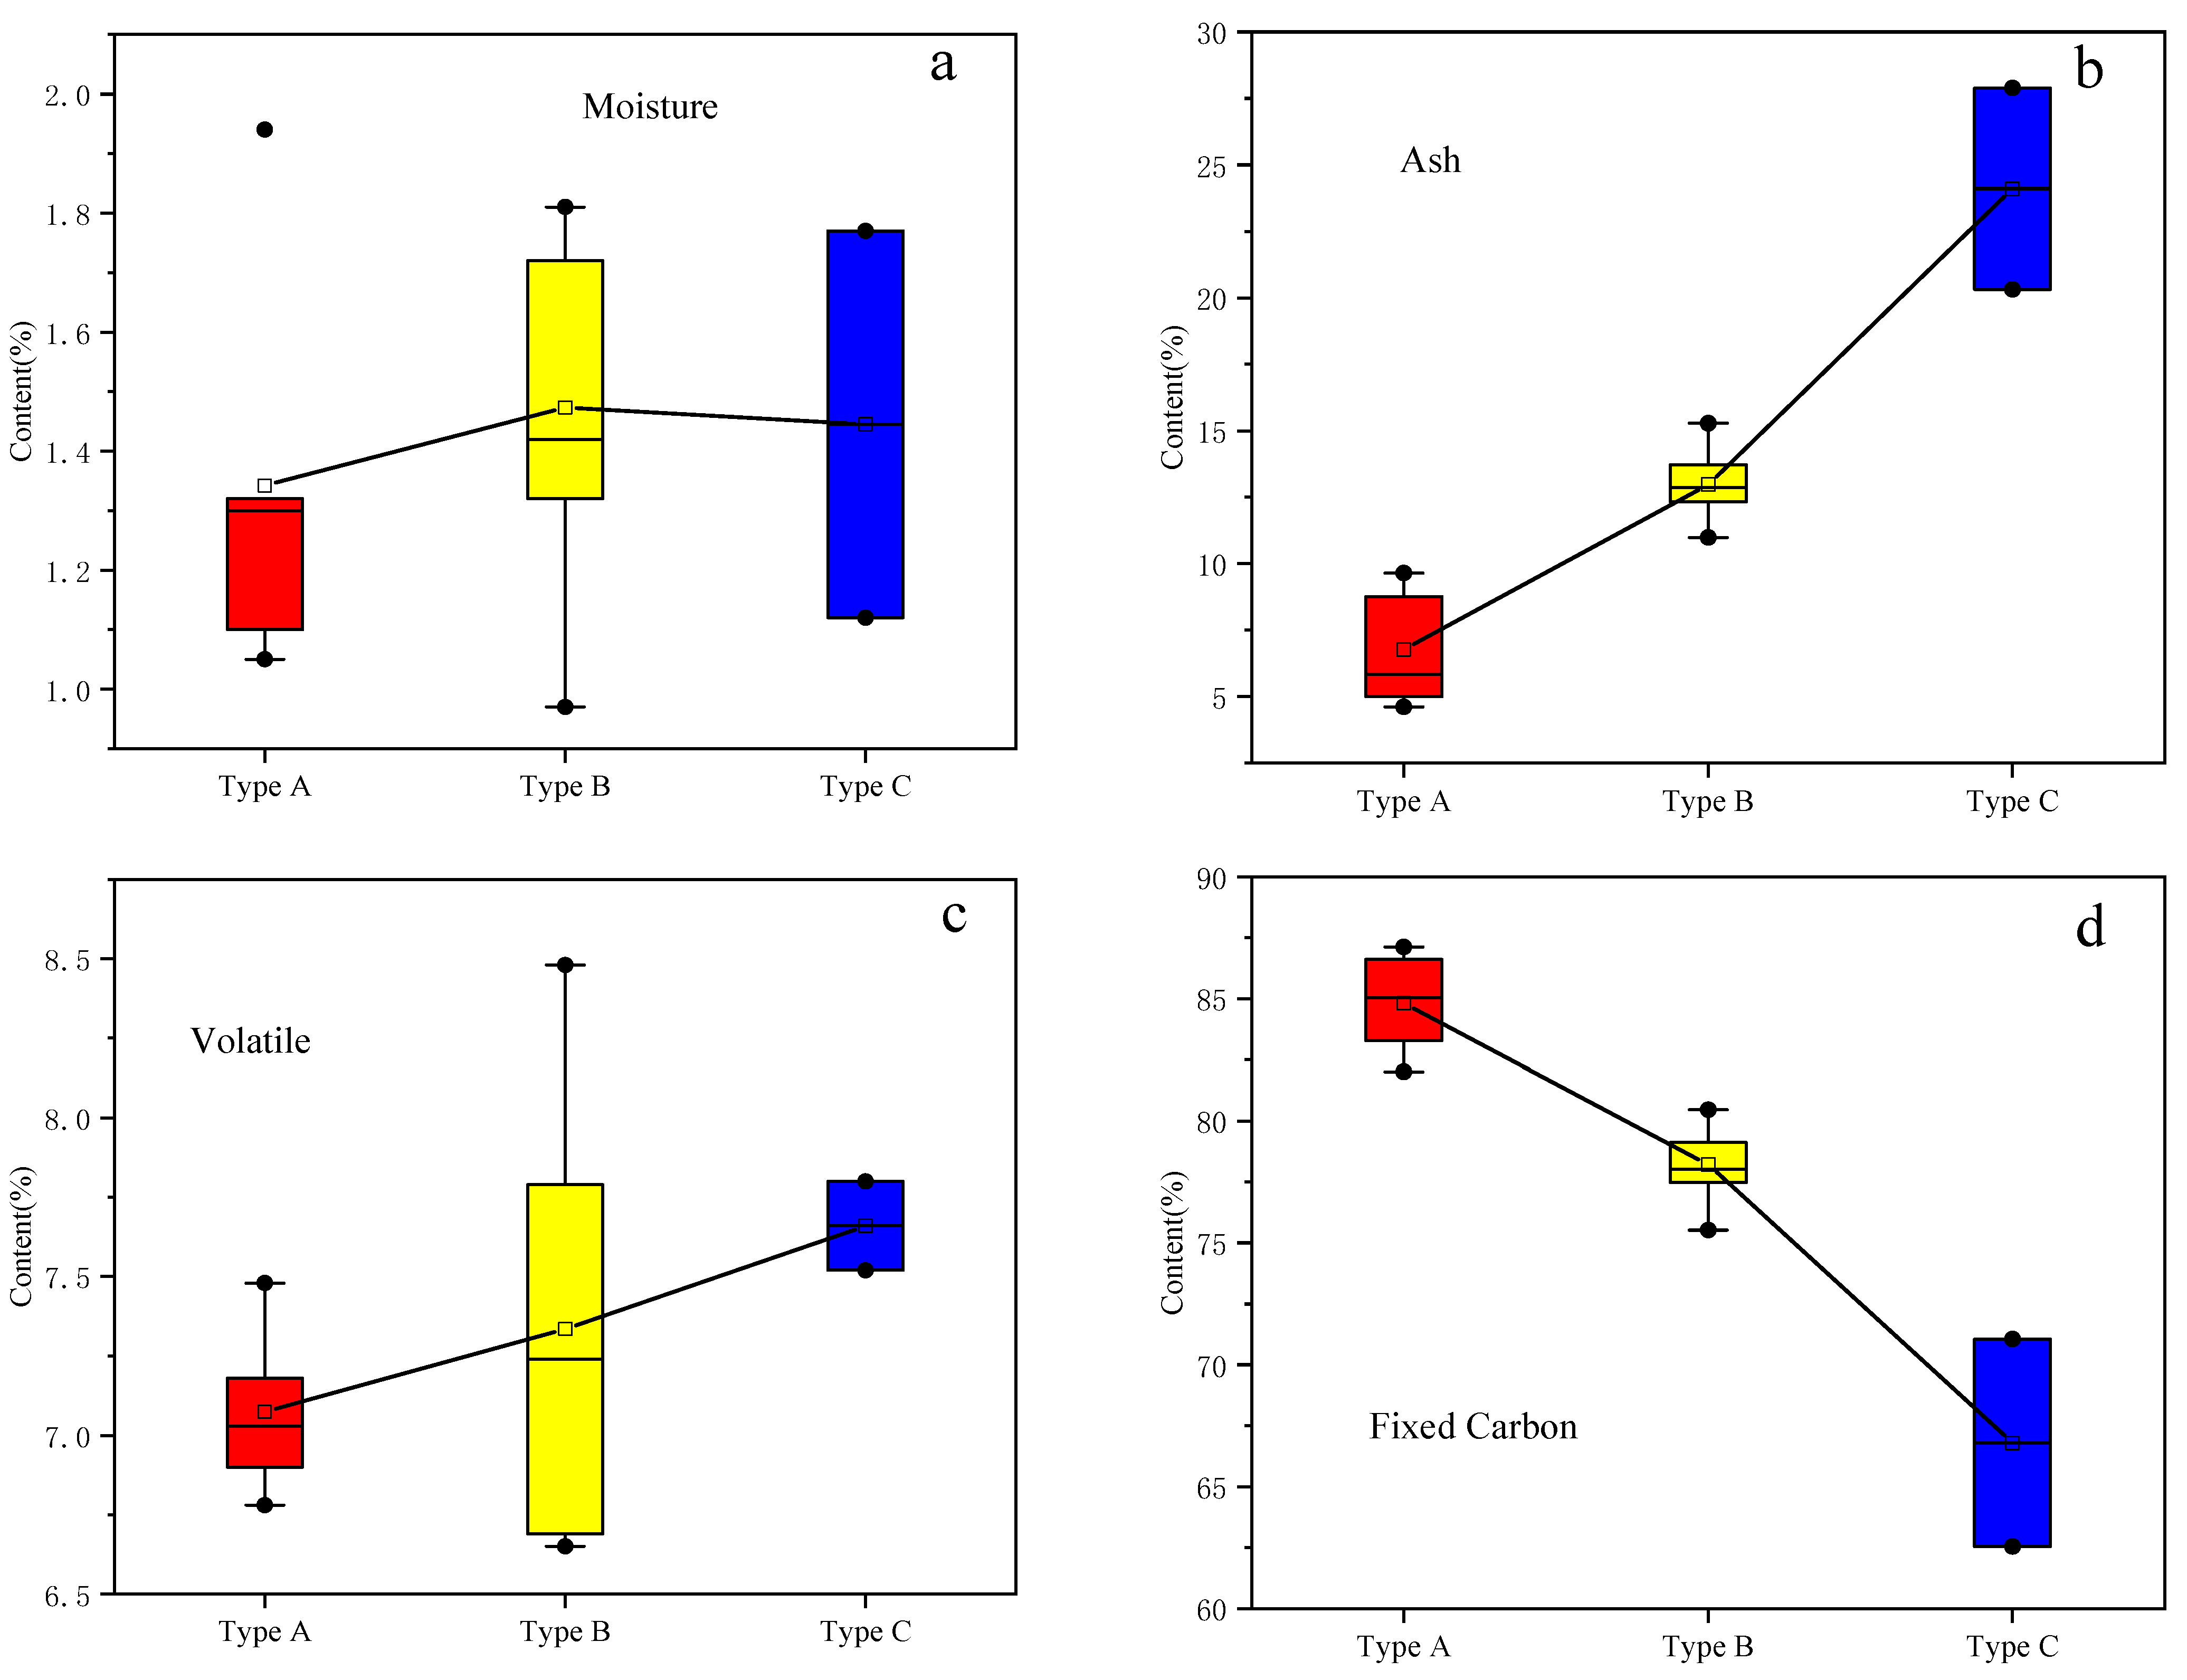
Proximate analysis components are important factors affecting the evolution of pore-fractures in coal samples. For Type A, the moisture content ranges from 1.05% to 1.94%, the volatile matter ranges from 6.78% to 7.48%, and the fixed carbon ranges from 6.78% to 7.48%. For Type B, the moisture ranges from 0.97% to 1.81%, the volatile matter ranges from 6.65% to 8.48%, and the fixed carbon ranges from 75.53% to 80.47%. For Type C, the moisture ranges from 1.12% to 1.77%, the volatile matter ranges from 7.52% to 7.8%, and the fixed carbon ranges from 62.54% to 71.05%.
As shown in Figure 5, the moisture of Type B samples is highest, and that of Type A samples is lowest. At the same time, the volatile matter of Type C samples is highest, followed by that of Type B samples, and then that of Type A samples. Fixed carbon and ash are the main components of proximate analysis components. Type A samples have the lowest ash content and the highest fixed carbon, while Type C samples have the highest ash content and the lowest fixed carbon.
The mineralogical composition of the samples was characterized by X-ray diffraction (XRD) analysis. As presented in Table 2, quartz, calcite, and clay minerals constitute the dominant mineral assemblages in the coal samples and are ubiquitously present. Notably, clay minerals account for a substantial proportion of the total mineral content. Therefore, the effects of these three predominant minerals (quartz, calcite, and clay minerals) on coal pore structure development merit thorough investigation.

4.2. Analysis of the Key Influencing Factors on the Evolution of Pore-Fractures in Micropores and Mesopores Based on Pore Structure Experiments

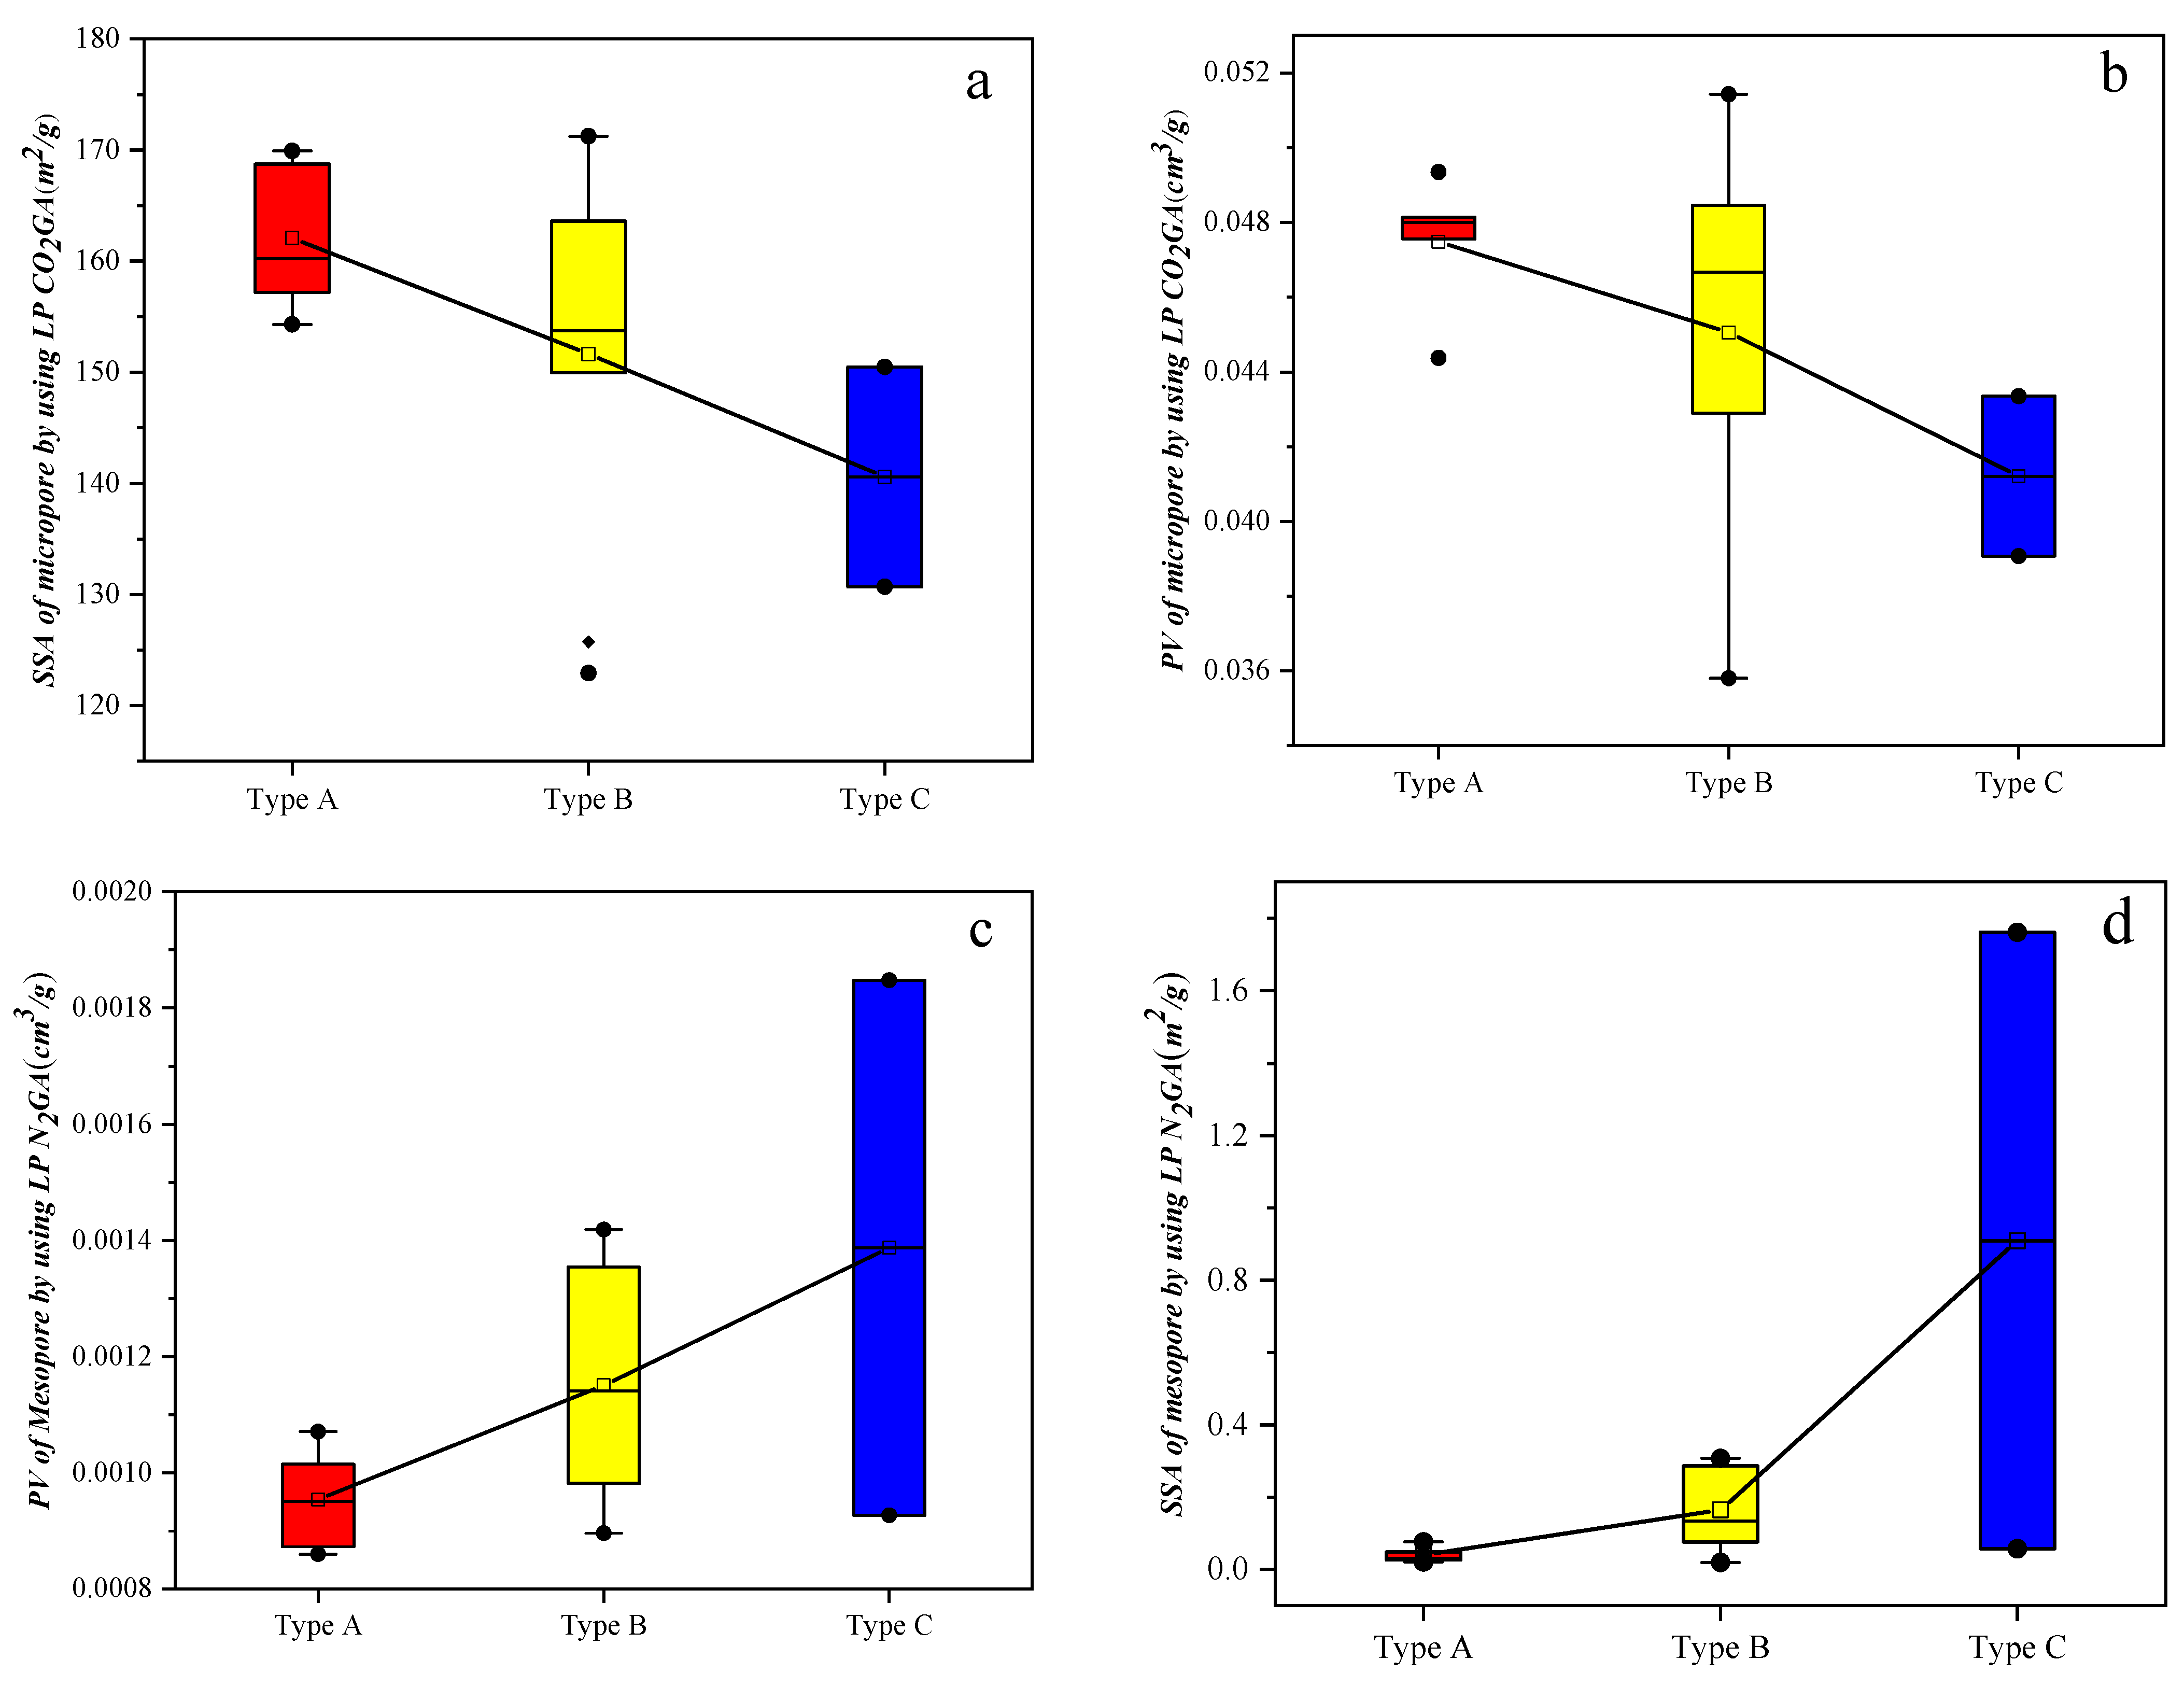
Based on the PV and SSA parameters of nanopores obtained from LPCO2 GA and LTN2 GA (Figure 6 and Table 3), the average values of each sample type were normalized by dividing them by the sum of the averages for all three types to characterize variations in the micro-mesoporous specific surface area and pore volume with increasing ash content.
The analysis revealed a consistent upward trend in both specific surface area and pore volume across all three mesopore types as ash content increased. Notably, Type C samples exhibited the most significant enhancement, demonstrating a 78.1% increase in specific surface area compared to Type A and a 67% increase relative to Type B. Type B samples showed a more moderate improvement, with an 11.1% higher specific surface area than Type A. Similarly, the mesoporous pore volume of Type C samples increased by 12.4% and 6.7% compared to Types A and B, respectively, while Type B samples displayed only a marginal 2.7% increase over Type A.
In contrast, micropore characteristics exhibited an overall declining trend. The micropore specific surface area decreased by 2.3% in Type B samples relative to Type A, with Type C samples showing more pronounced reductions of 4.8% compared to Type A and 2.5% compared to Type B. Similarly, micropore volume demonstrated modest decreases, with Type B samples showing a 1.8% reduction compared to Type A, while Type C samples decreased by 4.7% and 2.9% relative to Types A and B, respectively. Under different ash contents, the PV and SSA of micropores show a decreasing trend as the ash content increases. This is because the ash will fill the micropores, leading to a reduction in their PV and SSA. Unlike micropores, the PV and SSA of mesopores show an increasing trend as the ash content increases. This indicates that while the ash fills the micropores, under certain conditions, the ash may form new mesopores through the interaction between minerals and organic matter [26,27].
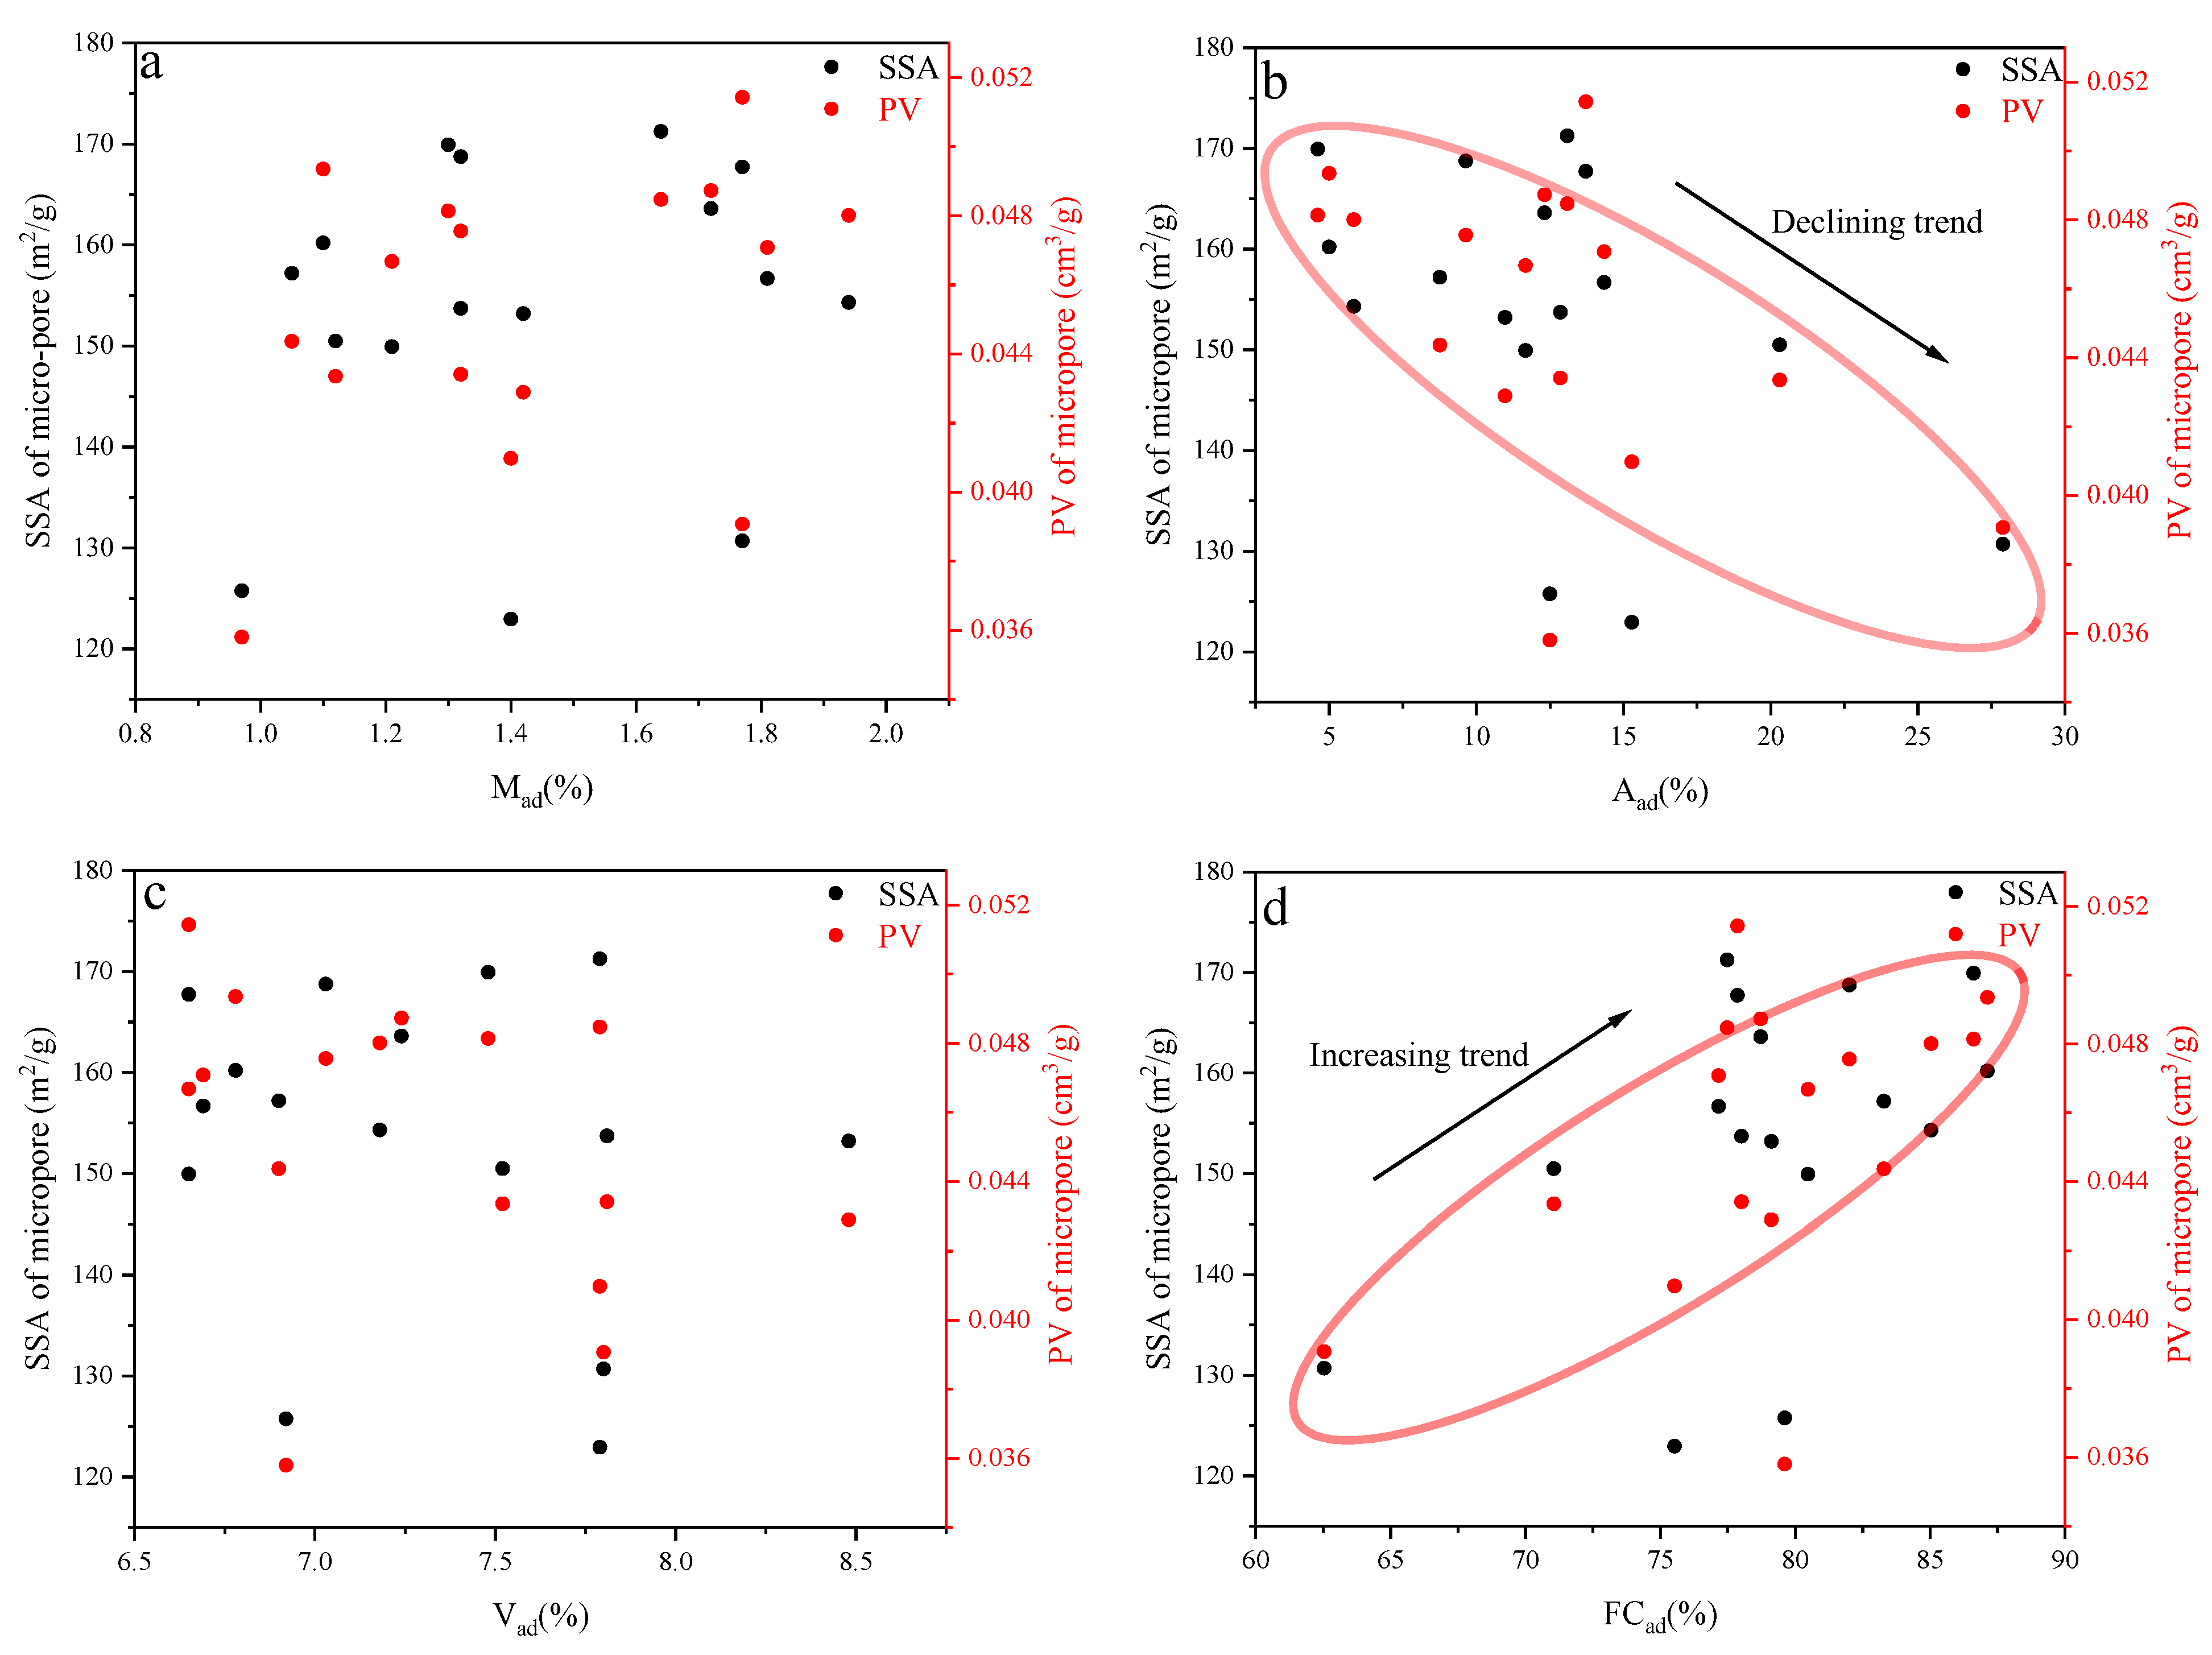
Based on the experimental results of the carbon dioxide adsorption experiment and the proximate analysis experiment (Figure 7), there is a distinct negative correlation between the ash content in the samples and the PV and SSA of the micropores. This indicates that the ash content is the major controlling factor affecting the pore structure of the micropores. The reason for this phenomenon is that the increase in the ash content causes the micropores in samples to be filled, resulting in a decrease in the PV and SSA of the micropores (Figure 8). It is worth noting that there is a certain positive correlation between the fixed carbon and the PV and SSA of the micropores. This is because as the content of fixed carbon increases, the molecular arrangement in the samples becomes more regular, increasing the number of pores in the coal samples [28]. As the degree of coal thermal evolution rises, the content of fixed carbon in the coal gradually increases, while the contents of volatile matter and moisture decrease. In the deep coal reservoir, high coalification promotes the condensation of aromatic structures and the development of micropores. This reflects the promoting effect of the increasing fixed carbon, which rises with the increase in the degree of thermal evolution, on the micropore structure [29]. The research results show that in this study, the correlations between the contents of moisture and volatile matter and the PV and SSA of micropores are not obvious.
As can be seen from the statistical results (Figure 9), the contents of the vitrinite group, inertinite group, and inorganic minerals have no obvious influence on the pore-fracture structure of mesopores. However, there is a certain negative correlation between the content of the inertinite group and the PV and SSA of micropores, indicating that the inertinite group affects the evolution of the micropore structure. There is a positive correlation trend between the mineral composition and the PV and SSA of micropores, indicating that with the increase in the content of inorganic mineral composition in samples, the micropores in samples are more developed. This may be because some minerals in the inorganic minerals are conducive to the development of micropores. At the same time, in the visual identification of samples, it can be observed that calcite obviously fills the endogenous and exogenous fractures of samples, which also shows that the mineral composition has a very important influence on the evolution of the pore-fracture structure of coal samples.
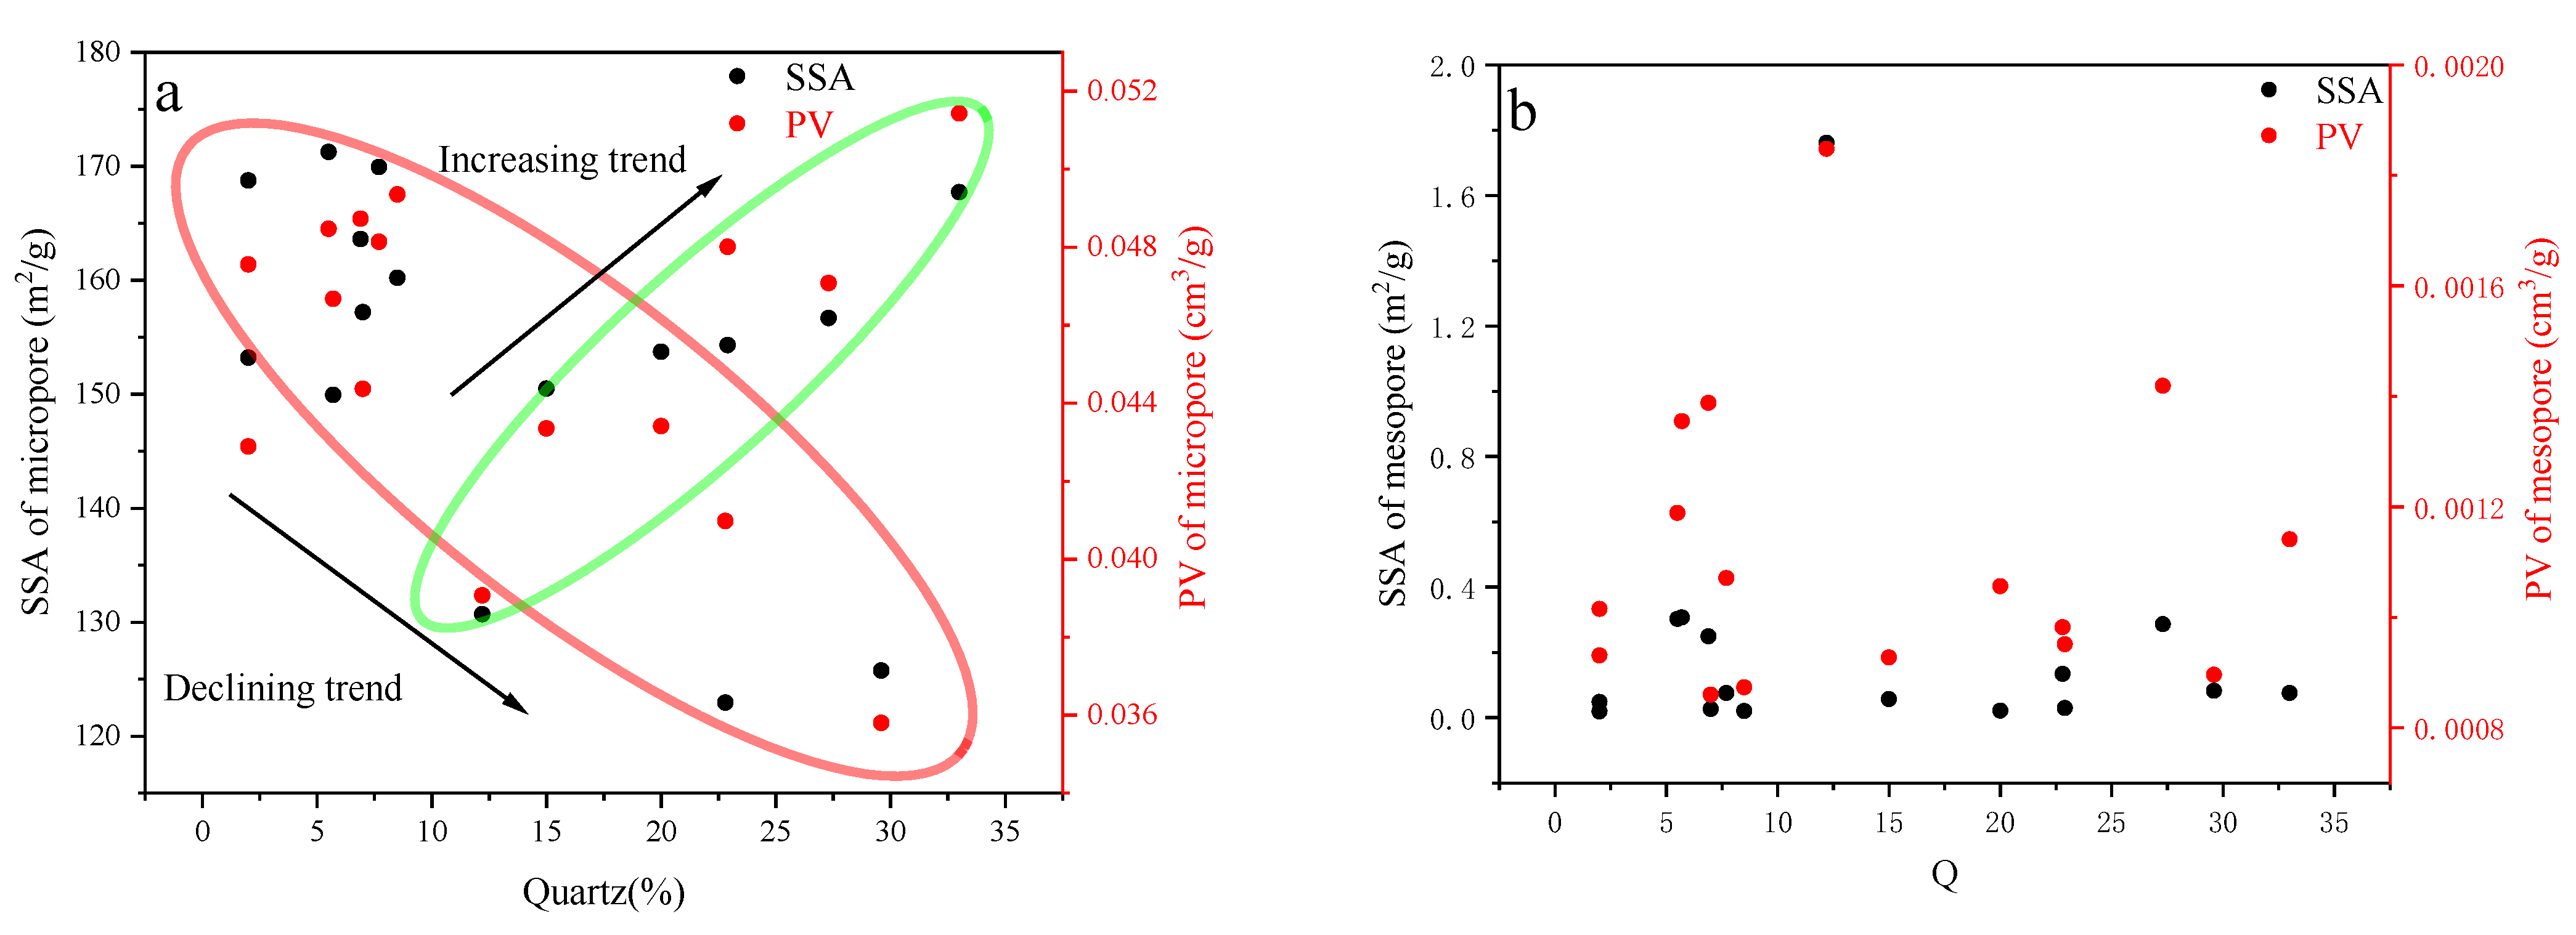
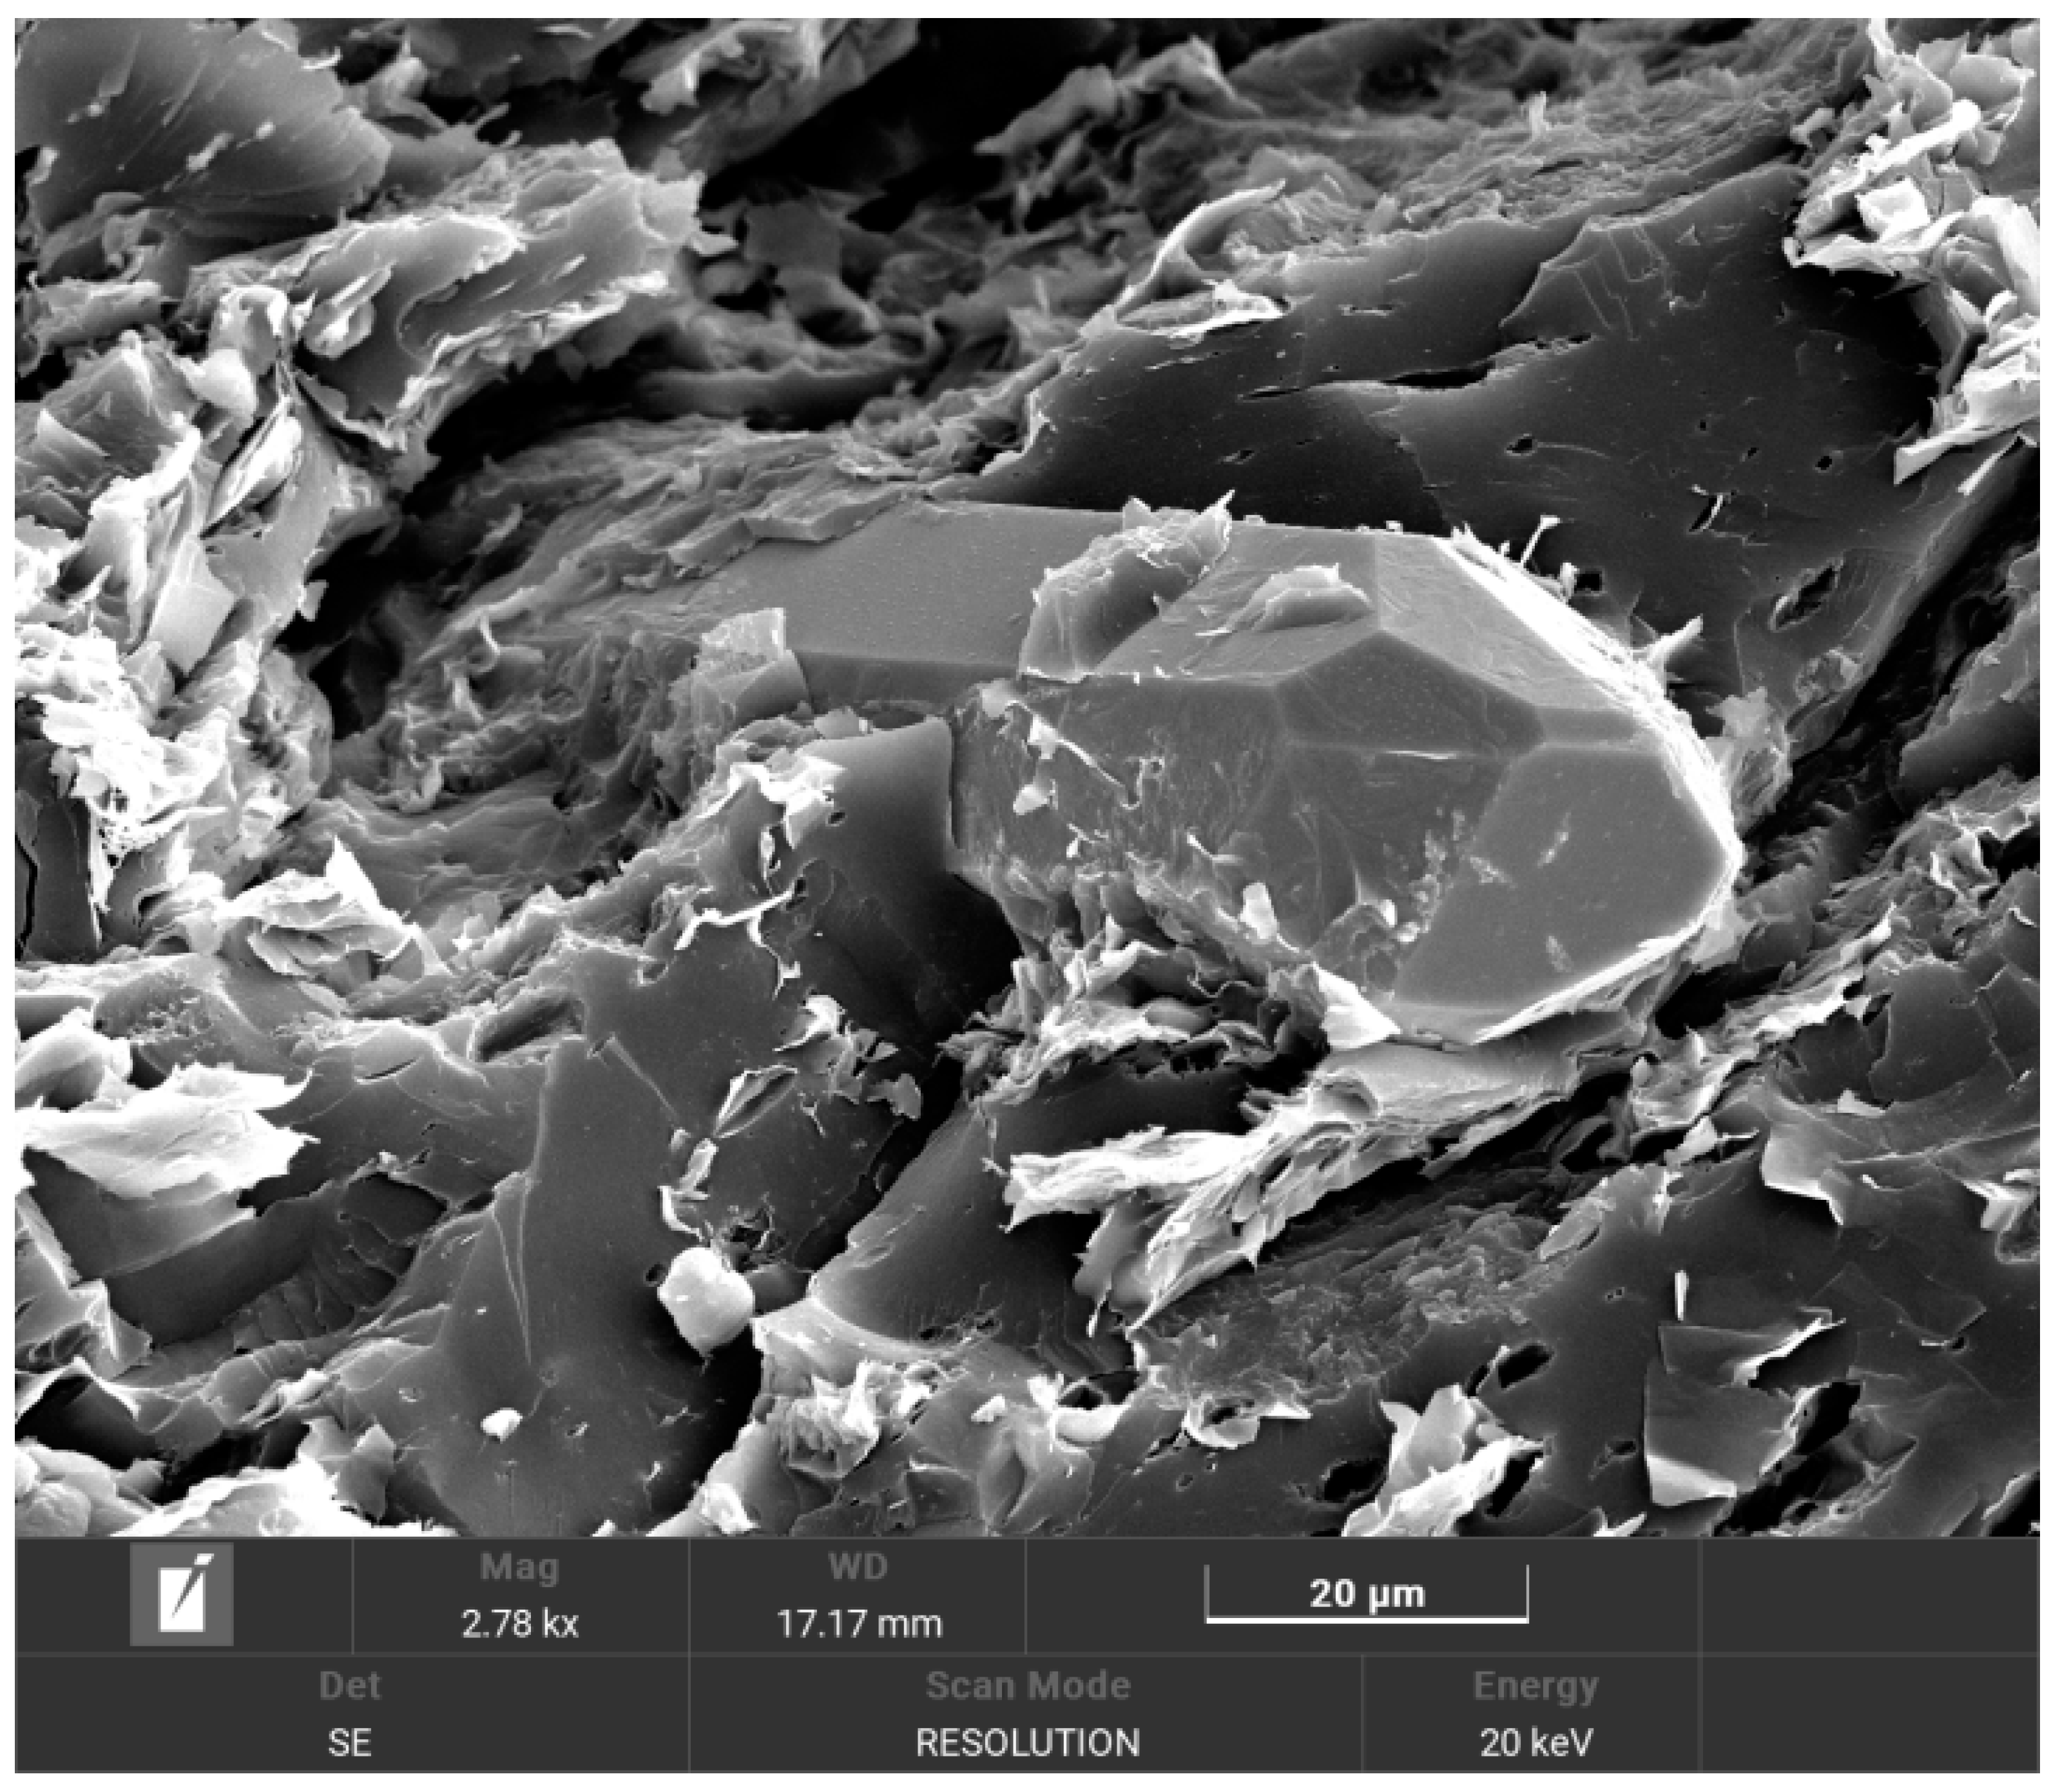
According to Figure 10, quartz in the inorganic mineral composition has a relatively complex influence on the development of micropores. On one hand, the increase in the content of quartz can provide support for the formation of micropores. On the other hand, the presence of quartz will also occupy the space of micropores, thus affecting the development of micropores (Figure 11). The influences of calcite and clay minerals on the development of nanopores are relatively complex. The increase in the content of calcite occupies the space of micropores in coal samples, thus reducing the PV and SSA of micropores. At the same time, if calcite is corroded, new pores will be generated, which will also increase the PV and SSA of micropores in coal samples. However, existing experiments cannot effectively identify the substances that form the micropores. Additionally, clay minerals commonly occlude nanopores, thereby significantly reducing the effective porosity of coal. However, in this study, the influences of calcite and clay minerals on the evolution of the pore-fracture structure are not obvious.
The maximum vitrinite reflectance of coal samples reflects the degree of thermal evolution of coal rock samples. In this study, the degree of thermal evolution of samples is relatively high (Figure 12), all above 2.8%, and they are in the over-mature stage [30]. As the degree of thermal evolution increases, the coal gradually becomes denser, resulting in a decrease in the porosity of the coal. The increase in thermal evolution degree usually improves the gas storage capacity of coal [31]. As can be seen from Figure 12, with the increase in the degree of thermal evolution of samples, the PV and SSA of micropores increase, enhancing the gas storage capacity of coal. This is because as the degree of thermal evolution increases, although the overall porosity is decreasing, more pores in the coal samples are transformed into micropores, leading to an increase in the PV and SSA of micropores [32]. However, in this study, no obvious correlation between mesopores and the degree of thermal evolution has been observed.

4.3. Analysis of the Key Influencing Factors of Methane Adsorption Capacity Based on the Desorption Experiment

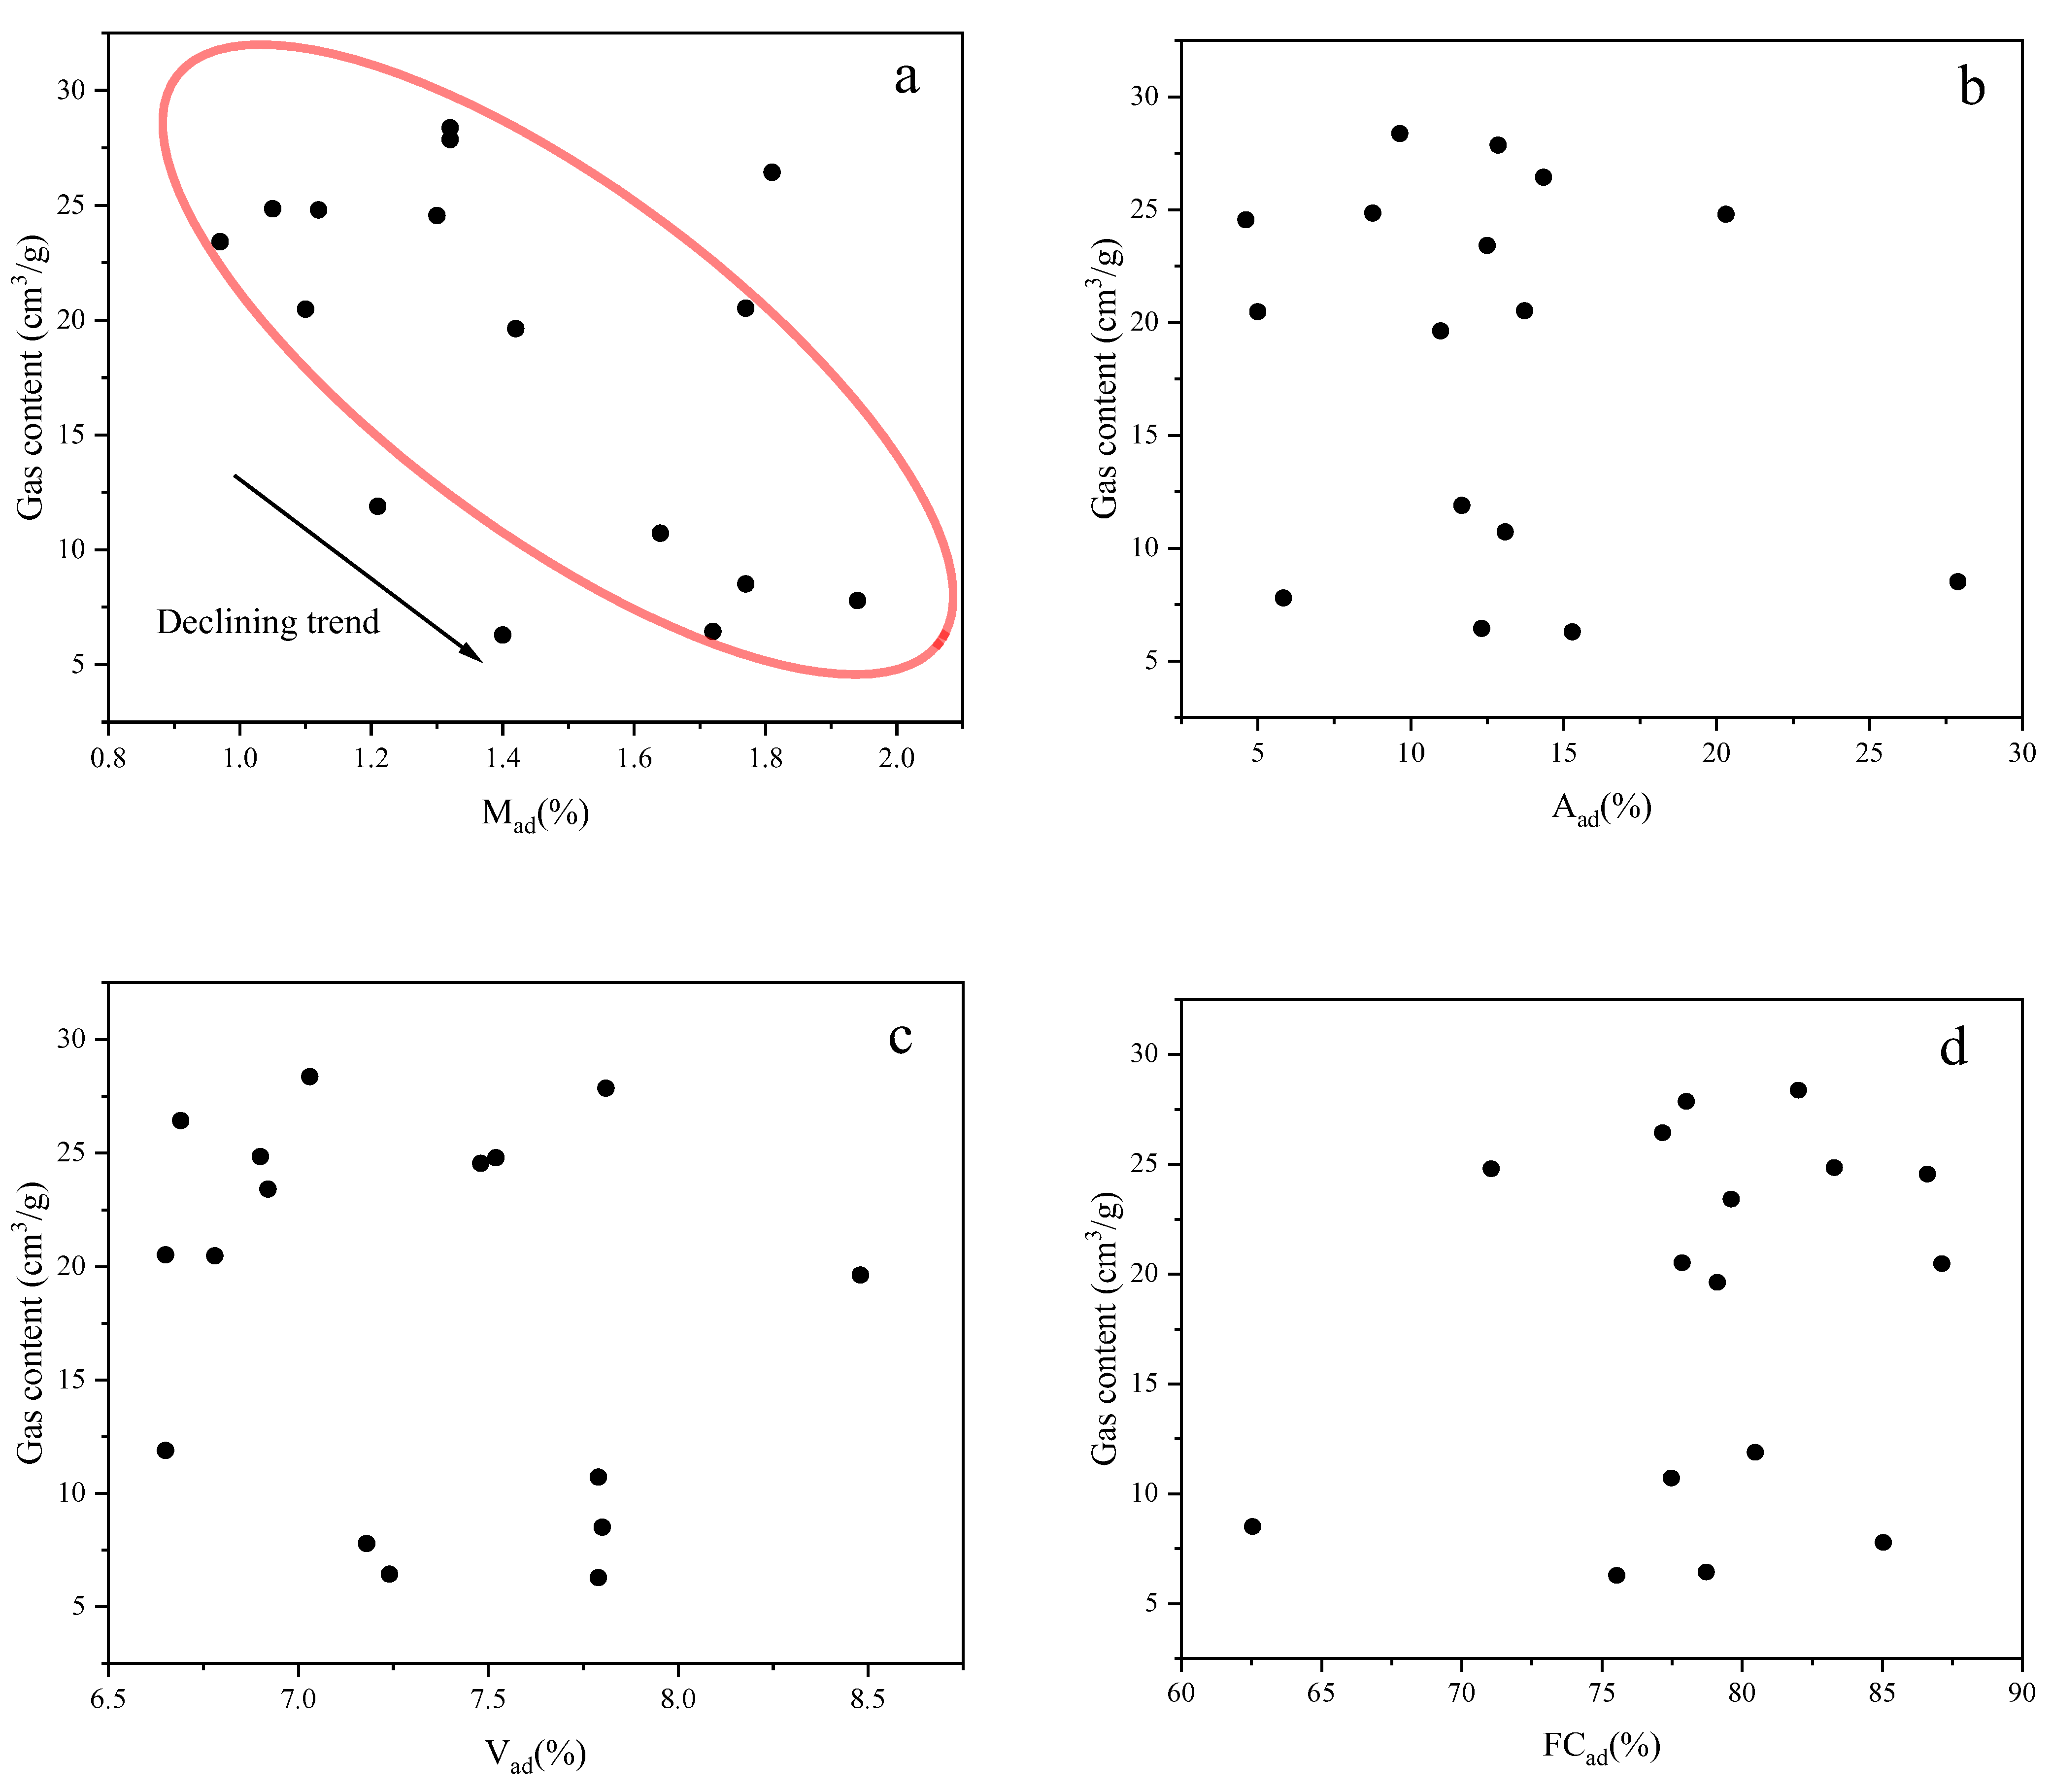
The statistical results show (Figure 13) that the influence of proximate analysis components on the gas content is relatively complex. Among them, a relatively obvious negative correlation can be observed between the moisture content and the gas content. This is because deep coalbed gas is different from shallow coalbed gas. Deep coalbed gas exists in a state where free gas and adsorbed gas coexist, while shallow coalbed gas mainly exists in the form of adsorbed gas [33]. The increase in moisture will occupy the space in the pores, which is not conducive to the occurrence of adsorbed methane, thus decreasing the gas content [34]. There is no obvious correlation between the ash content and the gas content. However, a high ash content will fill the pores in coal samples, reducing the occurrence space of coalbed gas, thus causing the CBM to decrease. There is no obvious correlation between the volatile matter and the gas content. Fixed carbon refers to the content of the remaining organic components in coal after removing the contents of moisture, ash, and volatile matter. The fixed carbon of coal samples is above 60%. The higher the fixed carbon, the better the material basis for gas generation in coal.
As can be seen from Figure 14, under different ash contents, the PV of micropores shows different correlation relationships with the gas content. There is no obvious correlation between the coal samples of Type A and Type B and the gas content. It is worth noting that the coal samples of Type C belong to medium-ash coal, and the gas content increases as the PV of micropores increases. This is because the increase in the PV of micropores provides more space for the occurrence of coalbed gas. The SSA of micropores is the main controlling factor affecting the gas content. The gas contents of Type A and Type C increase with the increase in the SSA of micropores. This is because deep coalbed gas mainly exists in the form of free gas and adsorbed gas, and the increase in the SSA of micropores can provide more occurrence sites for the adsorbed gas.
For mesopores, with the increase in the PV of mesopores, the gas content of samples of Type A increases. However, there is an obvious negative correlation trend between the gas contents of Type B and Type C and the PV of mesopores. This suggests that at a low ash content, its impact on mesopores is minimal, allowing an increase in the PV of mesopores to enhance coalbed methane storage capacity. As the ash content increases, its impact on mesopores becomes more pronounced, resulting in gas content being jointly influenced by multiple factors. There is no obvious relationship between the SSA of mesopores and the gas content. At the same time, the SSA of micropores is much larger than that of mesopores, which is the main occurrence location of adsorbed coalbed gas.
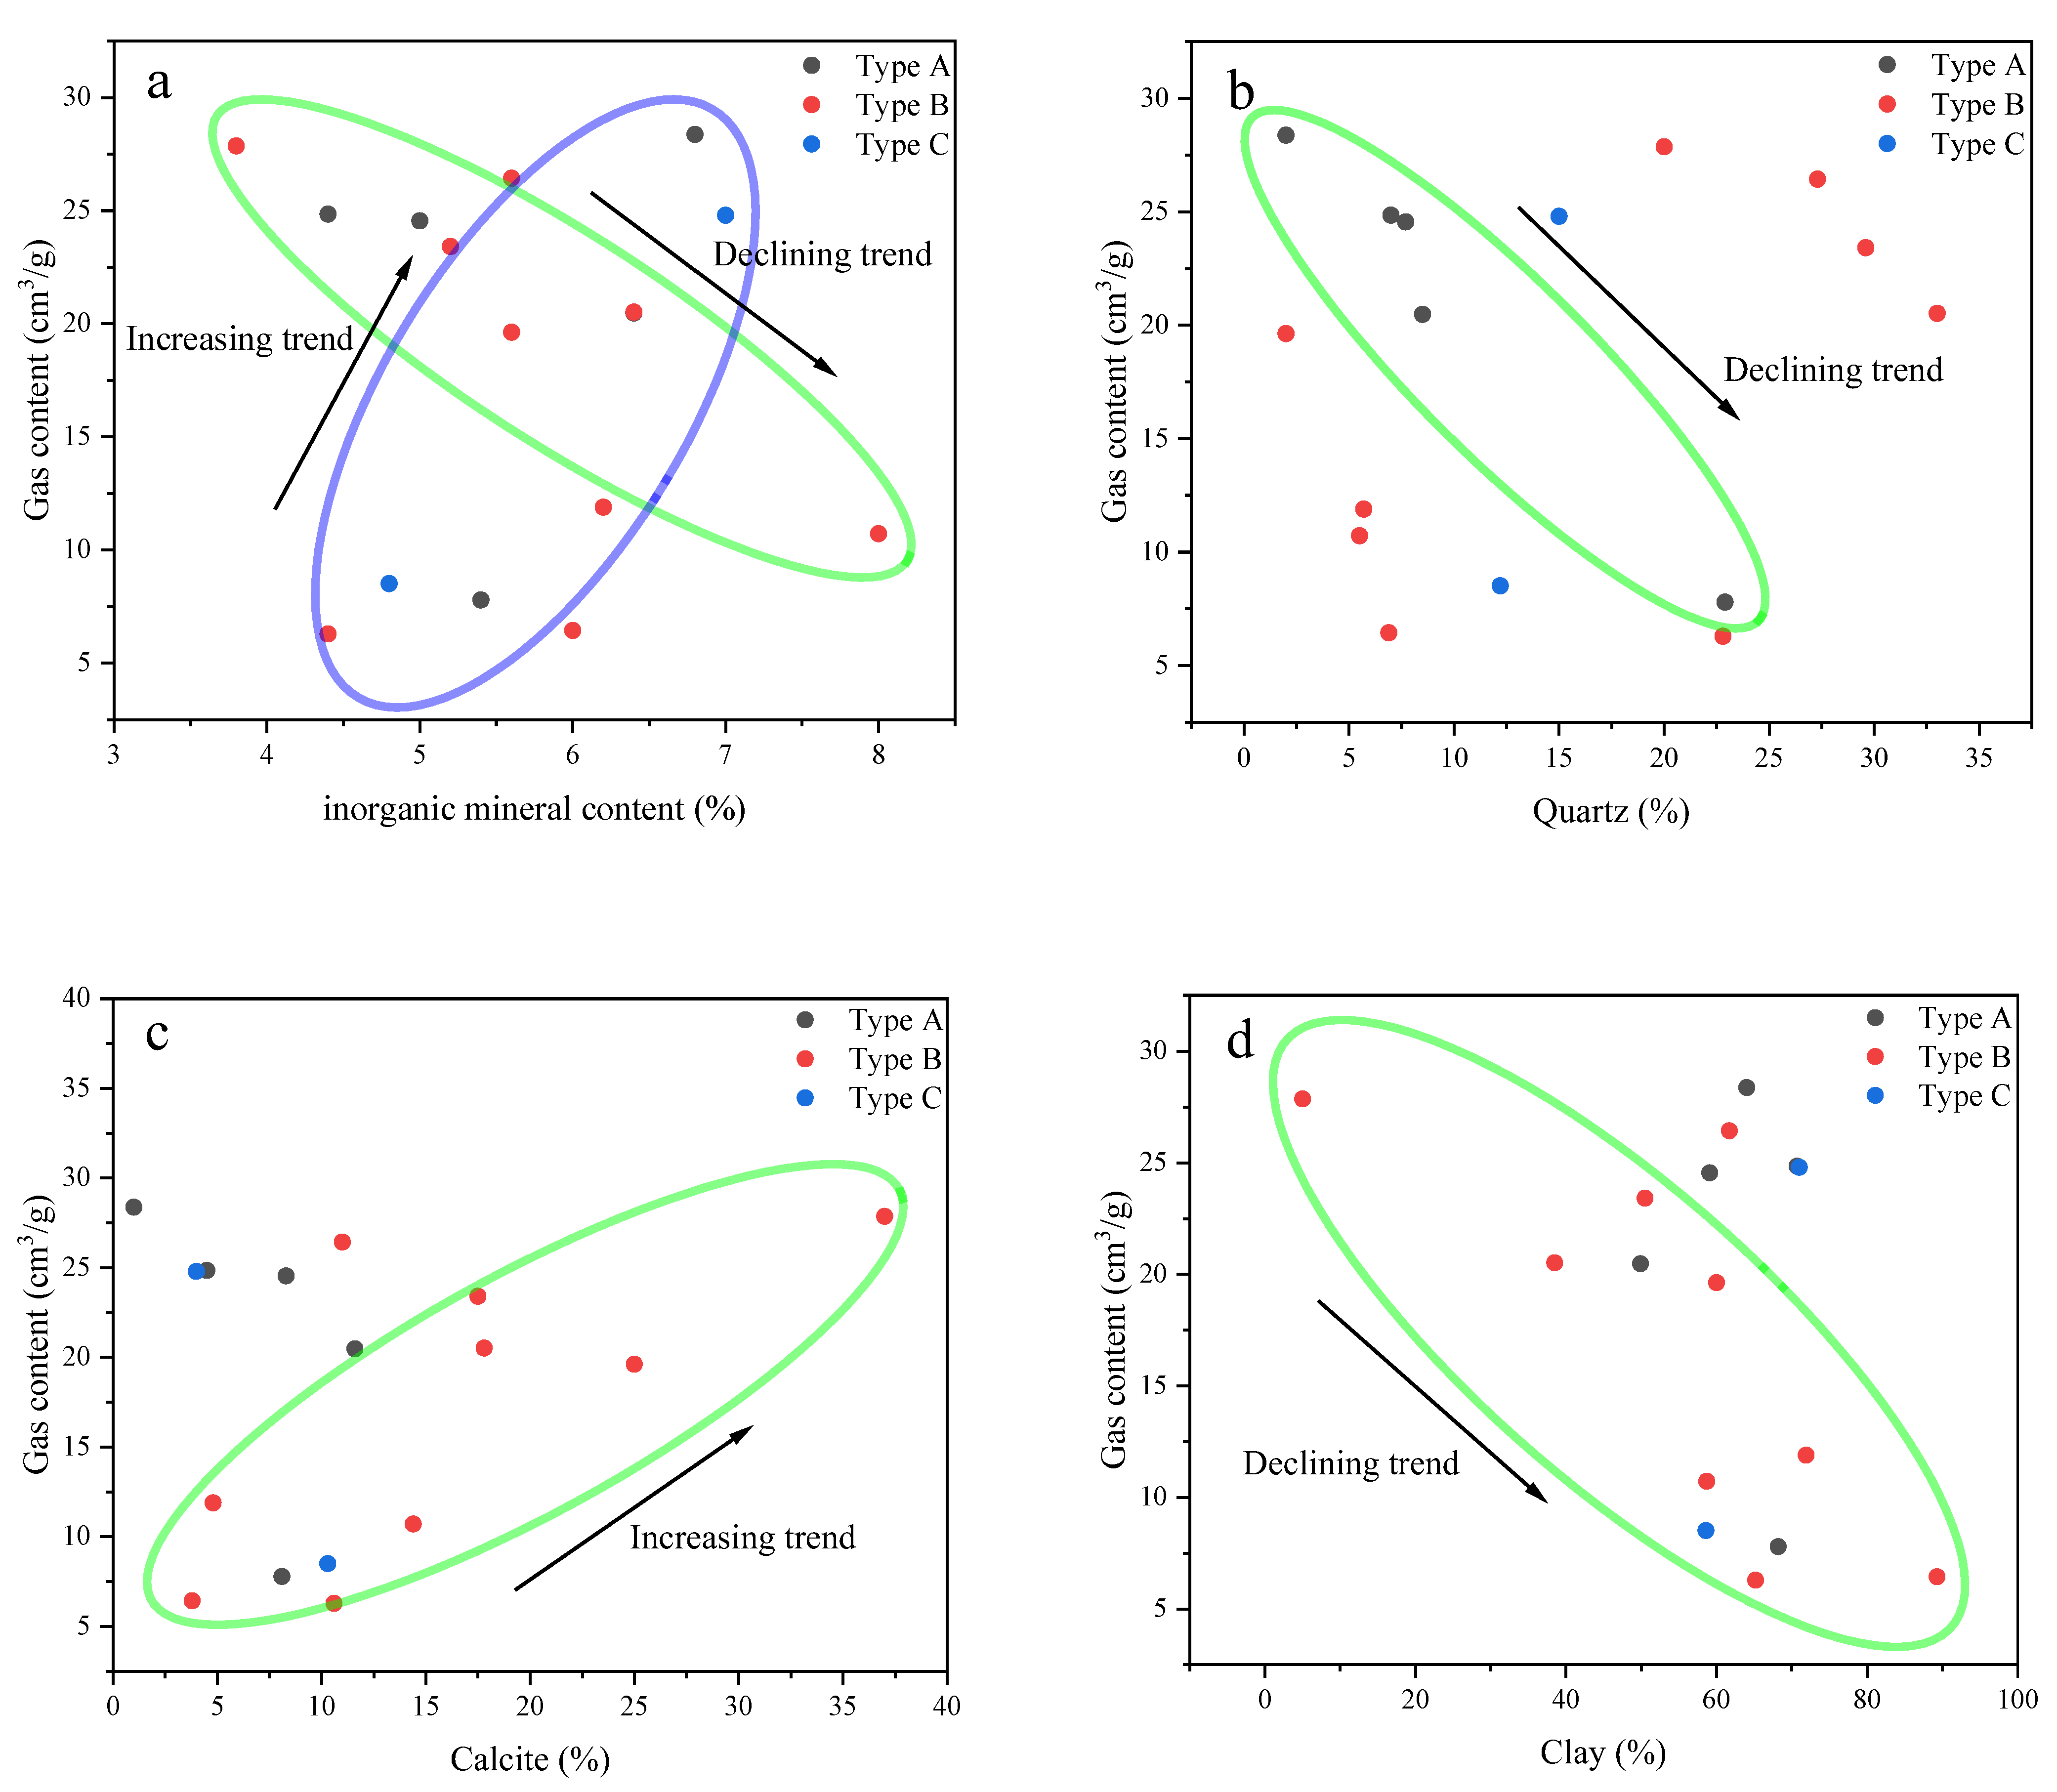
As can be seen from Figure 15, there is a complex relationship between the inorganic mineral composition and the gas content. Overall, there is a dual and complex relationship of both positive and negative correlations between the content of inorganic minerals and the gas content, which requires further in-depth discussion. There is an obvious negative correlation between the quartz content of the samples of Type A and the gas content. Quartz plays a certain positive role in the formation of pores. The increase in its content can provide support for the pores and increase the pore space of the samples, thus providing more occurrence space for coalbed gas. However, an excessively high quartz content will also occupy the pore space, thus reducing the occurrence space of coalbed gas. For the influence of calcite composed of coal minerals on pore-fracture structure, it is necessary to distinguish the fact that calcite in coal is a primary and secondary mineralization process. The influence of primary mineral calcite on the pore-fracture structure is mainly in the form of occupying the space for the development of the pore-fracture structure. The secondary mineralized calcite will produce new pores. There is an obvious negative correlation between the content of clay minerals and the gas content. As the clay mineral content increases, these minerals progressively fill the pore spaces, resulting in reduced sample porosity and correspondingly decreased storage potential for coalbed gas.

5. Conclusions

This study investigates the pore-fracture structure characteristics and gas-content-controlling factors of 16 coal samples from the Yan’an Gas Field in the Ordos Basin through comprehensive laboratory analyses and field desorption experiments. The re-search methodology integrates proximate analysis, maceral and mineral composition characterization, Ro,max, and nanopore structure evaluation (including PV and SSA). The main conclusions are as follows:
  • Based on the SEM and hand specimen identification, the pore-fracture structure of the samples is relatively well developed. Calcite filling the fractures of samples can be seen in the hand specimens of samples. This indicates that the mineral composition has a very important influence on the evolution of the pore-fracture structure of samples.
  • This study indicates that pore-fracture structure evolution is influenced by multiple factors, primarily ash content and fixed carbon. As ash content increases, mesopore surface area and volume rise across all sample types, with Type C showing the highest increase (78.1% in surface area and 12.4% in volume compared to Type A). Conversely, micropore characteristics decline, with Type C exhibiting a 4.8% drop in surface area and a 4.7% reduction in volume. The Ro,max of the samples is generally higher than 2.8%, which has a multifaceted impact on pore-fracture structure evolution.
  • The gas content is mainly controlled by PV and SSA, with proximate analysis com-ponents and maceral compositions showing minimal direct influence. This suggests that the gas content results from the combined effects of material composition and pore-fracture structure evolution. Inorganic minerals like quartz and calcite indirectly affect gas content by influencing pore structure development—occupying spaces while also creating new pores, especially through calcite dissolution. Conversely, clay minerals generally hinder pore development by filling spaces with limited fracture-forming capacity.
This study focuses specifically on examining the development of pore-fracture structures and gas content under the influence of ash content. It should be noted that these characteristics are inherently multifactorial in nature. Additional investigations could be conducted to evaluate other controlling factors, including microscopic components, moisture, volatile matter, and fixed carbon, to provide a more comprehensive understanding of pore-fracture structure evolution and gas storage mechanisms in coal reservoirs of the Yan’an Gas Field.

Author Contributions

Software, J.F. and S.L.; Data Curation, J.F., S.L. and L.Q.; Writing—Original Draft Preparation, Z.W. and H.G.; Writing—Review and Editing, H.G.; Project Administration, Z.W. and Y.W.; Funding Acquisition, Z.W. and Y.W. All authors have read and agreed to the published version of the manuscript.

Funding

The project is supported by the Shaanxi Yanchang Petroleum (Group) Co., Ltd. “The Deep Coalbed Methane Scientific and Technological Research Project” (Number QTKTN0924QTY0122).

Data Availability Statement

The original contributions presented in this study are included in the article. Further inquiries can be directed to the corresponding author.

Conflicts of Interest

Authors Zhenchuan Wang and Yongping Wan were employed by Gasfield Company of Shaanxi Yanchang Petroleum Group Co., Ltd. The remaining authors declare that the research was conducted in the absence of any commercial or financial relationships that could be construed as a potential conflict of interest.

References

  1. Jia, H.M.; Hu, Q.J.; Zhang, C.; He, S.; Sang, L.J.; Li, J.; Liu, C.C. Characteristics and development practice of deep coalbed methane reservoir in the southern part of Ningwu Basin. J. China Univ. Min. Technol. 2025, 54, 149-160+185,1–13. [Google Scholar]
  2. Shen, J.; Li, K.X.; Zhang, H.W.; Shabbiri, K.; Hu, Q.J.; Zhang, C. The geochemical characteristics, origin, migration and accumulation modes of deep coal-measure gas in the west of Linxing block at the eastern margin of Ordos Basin. J. Nat. Gas Sci. Eng. 2021, 91, 103965. [Google Scholar] [CrossRef]
  3. Zhao, Z.; Xu, W.L.; Zhao, Z.Y.; Yi, S.W.; Yang, W.; Zhang, Y.Q.; Zhang, W.B.; Shi, Y.P.; Zhang, C.L.; Gao, J.R. Geological characteristics and exploration breakthrough of coalmeasure gas in the Benxi Formation of the Carboniferous system in the Ordos Basin. Pet. Explor. Dev. 2024, 51, 234–247+259. [Google Scholar] [CrossRef]
  4. Li, Y.; Xu, F.Y.; Tang, S.H.; Wang, Y.B.; Meng, S.Z.; Xu, Q.; Tang, S.H. Progress and development direction of coalbed methane exploration and development in the Ordos Basin. Nat. Gas Ind. 2024, 44, 63–79. [Google Scholar]
  5. Li, M.R.; Shi, Y.H.; Fan, L.Y.; Dai, X.D.; Jing, X.Y.; Zhang, Y. Comparison of main gas reservoir characteristics between coalmeasure gas and tight sandstone gas in the 8# coal seam of the Upper Paleozoic Benxi Formation in the Ordos Basin. Oil Gas Geol. 2024, 45, 1590–1604. [Google Scholar]
  6. Huang, D.J.; Zhou, G.X.; Yang, Z.B.; Gu, J.Y.; Jing, X.Y.; Wang, J.N. Geochemical characteristics and geological response of gaswater production from deep coal-measure gas wells in the Ordos Basin. Oil Gas Geol. 2024, 45, 1617–1627. [Google Scholar]
  7. Gensterblum, Y.; Merkel, A.; Busch, A.; Krooss, B.M.; Littke, R. Gas saturation and CO2 enhancement potential of coalbed methane res-ervoirs as a function of depth. AAPG Bull. 2014, 98, 395–420. [Google Scholar] [CrossRef]
  8. Chatterjee, R.; Paul, S. Classification of coal reservoir for coal bed methane exploitation in central part of Jharia coalfield, India—A statistical approach. Fuel 2013, 111, 20–29. [Google Scholar] [CrossRef]
  9. Qin, Y.; Shen, J. On the fundamental issues of deep coalbed methane geology. Acta Petrol. Sin. 2016, 37, 125–136. [Google Scholar]
  10. Zhu, Q.Y.; Du, X.J.; Zhang, T.; Yu, H.M.; Liu, X.B. Investigation into the variation characteristics and influencing factors of coalbed methane gas content in deep coal reservoir. Sci. Rep. 2024, 14, 18813. [Google Scholar]
  11. Xiao, C.Y.; Han, D.L.; Zhang, J.J.; Chen, S.Z.; Qin, Z.Y.; Vandeginste, V. Effect of Coal Rank and Coal Facies on Nanopore-Fracture Structure Heterogeneity in Middle-Rank Coal Reservoirs. ACS Omega 2024, 9, 33279–33292. [Google Scholar] [CrossRef] [PubMed]
  12. Sun, L.; Zhou, G.X.; Jing, X.Y.; Zhang, J.Y.; Wu, C.J. Fractal characteristics and reservoir formation mechanism of deep coal-measure in the Benxi Formation in the central-eastern Ordos Basin. J. Xi’an Shiyou Univ. (Nat. Sci. Ed.) 2024, 39, 1–11. [Google Scholar]
  13. Ouyang, Z.; Wang, H.; Sun, B.; Liu, Y.; Fu, X.; Dou, W.; Du, L.; Zhang, B.; Luo, B.; Yang, M.; et al. Quantitative prediction of deep coalbed methane content in DaningJixian Block, Ordos Basin, China. Processes 2023, 11, 3093. [Google Scholar] [CrossRef]
  14. Liu, B.; Huang, W.H.; Ao, W.H.; Zhang, S.R.; Wu, J.; Xu, Q.L.; Teng, J. Adsorption characteristics of high-rank coal and its influencing factors: A case study of the Shizhuang Block in the Qinshui Basin. J. Xi’an Shiyou Univ. (Nat. Sci. Ed.) 2014, 29, 31–37+5–6. [Google Scholar]
  15. Mastalerz, M.; Drobniak, A.; Schimmelmann, A. Changes in optical properties, chemistry, and micropore and mesopore characteristics of bituminous coal at the contact with dikes in the Illinois Basin. Int. J. Coal Geol. 2009, 77, 310–319. [Google Scholar] [CrossRef]
  16. Karacan, C.Ö.; Ruiz, F.A.; Cotè, M.; Phipps, S. Coal mine methane: A review of capture and utilization practices with benefits to mining safety and to greenhouse gas reduction. Int. J. Coal Geol. 2011, 86, 121–156. [Google Scholar] [CrossRef]
  17. Yang, Y.Y. Influence of Indosinian Qinling orogeny on the sedimentary characteristics of the Yanc-hang Formation in the Ordos Basin. Coal Geol. Explor. 2004, 5, 7–9. [Google Scholar]
  18. Zeng, L.B.; Li, Z.X.; Shi, C.E.; Wang, Z.G.; Zhao, J.Y.; Wang, Y.K. Characteristics and genesis of fractures in the ultra-low permeability sandstone reservoirs of the Upper Triassic Yanchang Formation in the Ordos Basin. Acta Geol. Sin. 2007, 2, 174–180. [Google Scholar]
  19. Chen, Z.J.; Ren, Z.L.; Zhao, J.Z.; Zhao, X.Y.; Gao, X.P.; Qiang, T.; Lei, Y.Y.; Liu, T. Characteristics and types analysis of tight gas reservoirs in the second member of the Shanxi Formation in the Yan’an Gas Field, Ordos Basin. J. Cent. South Univ. (Sci. Technol.) 2016, 47, 1625–1636. [Google Scholar]
  20. Yu, T.J.; Quan, M.; Luo, W.Q.; Jin, H.; Wan, Y.P.; Tang, M.M.; Chen, G. Semi-quantitative prediction of reservoir thickness using seismic multi-attributes: A case study of the Shan 2 reservoir in the southeastern Ordos Basin. J. Xi’an Shiyou Univ. (Nat. Sci. Ed.) 2024, 39, 50–58+70. [Google Scholar]
  21. Chang, X.C.; Han, R.Y.; Zhang, J.J.; Vandeginste, V.; Zhang, X.Y.; Liu, Y.; Han, S.B. Prediction of coal body structure of deep coal reservoirs using logging curves: Principal component analysis and evaluation of factors influencing coal body structure distribution. Nat. Resour. Res. 2024, 34, 1023–1044. [Google Scholar] [CrossRef]
  22. Mahamud, M.M.; Menéndez, J.M.; Álvarez, A. Fractal Analysis of CO2 and N2 Adsorption Data to Assess Textural Changes during Char Gasification. Fuel Process. Technol. 2019, 189, 15–27. [Google Scholar] [CrossRef]
  23. Han, S.B.; Xie, L.F.; Du, X.; Xiang, C.H.; Huang, J.; Tang, Z.Y.; Wang, C.S.; Horsfield, B.; Mahlstedt, N. Insights into organic metagenesis using Raman spectroscopy and high resolution mass spectrometry: A case study of the Shahezi formation, deep Songliao basin, China. Int. J. Coal Geol. 2023, 265, 104153. [Google Scholar] [CrossRef]
  24. Rai, S.; Rai, A.; Kumar, K.; Naik, A.S.; Singh, N.S.; Srivastava, D.K.; Singh, P.K. Study of micro-structures and their relation with occurrence of mineral matter in Ramagundam Coals, Godavari Basin, India: Implications on coal and hydrocarbon industries. J. Geol. Soc. India 2022, 98, 88–92. [Google Scholar] [CrossRef]
  25. Han, S.B.; Bai, S.T.; Tang, Z.Y.; Rui, Y.R.; Gong, D.J.; Zhang, J.C. Nitrogen-rich gas shale logging evaluation and differential gas-bearing characterization of lower Cambrian formation in northern Guizhou, south China. Mar. Pet. Geol. 2020, 115, 104270. [Google Scholar] [CrossRef]
  26. Wang, B.W.; Li, W. Study on the influence of ash content on coal pore structure based on smallangle X-ray scattering. Saf. Coal Mines 2017, 1, 149–153. [Google Scholar]
  27. Yang, G.; Qin, Y.; Wu, C.F.; Li, S.H. Pore structure characteristics of low-rank coal in the Xishanyao Formation of the Heshuo Tuoluogai Basin, Xinjiang. Coal Sci. Technol. 2017, 45, 123–130. [Google Scholar]
  28. Hao, S.X.; Wang, C.Y.; Jiang, C.F. Influence of fixed carbon on pore structure and methane adsorption capacity of coal. J. China Coal Soc. 2012, 37, 1477–1482. [Google Scholar]
  29. Zhao, X.L.; Tang, D.Z.; Xu, H.; Tao, S.; Chen, Z.L. Influence of coal metamorphism on the development of pore systems in coal reservoirs. J. China Coal Soc. 2010, 35, 1506–1511. [Google Scholar]
  30. Alpern, B.; De Sousa, M.L.; Flores, D. A progress report on the Alpern Coal Classification. Int. J. Coal Geol. 1989, 13, 1–19. [Google Scholar] [CrossRef]
  31. Hazra, B.; Wood, D.A.; Panda, M.; Sethi, C.; Vishal, V.; Chandra, D.; Ostadhassan, M. Pore Structural Complexities and Gas Storage Capacity of Indian Coals with Various Thermal Maturities. Energy Fuels 2025, 39, 5818–5831. [Google Scholar] [CrossRef]
  32. Niu, X.B.; Fan, L.Y.; Yan, X.X.; Zhou, G.X.; Zhang, H.; Jing, X.Y.; Zhang, M.B. Enrichment conditions and resource potential of coal-measure gas in the Ordos Basin. Pet. Explor. Dev. 2024, 51, 972–985. [Google Scholar] [CrossRef]
  33. Xu, H.; Tang, D.Z.; Tao, S.; Li, S.; Tang, S.L.; Chen, S.D.; Zong, P.; Dong, Y. Differences in geological conditions and formation mechanisms of deep and shallow coalbed methane. Coal Geol. Explor. 2024, 52, 33–39. [Google Scholar]
  34. Yao, P.; Zhang, J.J.; Lv, D.W.; Vandeginste, V.; Chang, X.C.; Zhang, X.Y.; Wang, D.D.; Han, S.B.; Liu, Y. Effect of water occurrence in coal reservoirs on the production capacity of coalbed methane by using NMR simulation technology and production capacity simulation. Geoenergy Sci Eng. 2024, 243, 213353. [Google Scholar] [CrossRef]
Figure 1. Study area and sampling locations (a) and histogram of targeted layer (b) [21]. Reprinted with permission from Ref. [21]. 2024, Zhang, J.J.
Processes 13 01177 g001
Figure 2. Macroscopic coal types of coal samples in study area (af).
Processes 13 01177 g002
Figure 3. Maceral composition and types of pore-fracture development under SEM (ad).
Processes 13 01177 g003
Figure 4. Contents of maceral compositions in three types of samples (ad).
Processes 13 01177 g004
Figure 5. Contents of proximate analysis components in three types of samples (ad).
Processes 13 01177 g005
Figure 6. Nanopore structure parameters of three types of samples (ad).
Processes 13 01177 g006
Figure 7. Correlations between the pore structure parameters of micropores and analysis components (ad).
Processes 13 01177 g007
Figure 8. Mechanism of ash-mediated pore transformation.
Processes 13 01177 g008
Figure 9. Correlations between the pore structure parameters of nanopores and maceral compositions (af).
Processes 13 01177 g009aProcesses 13 01177 g009b
Figure 10. Correlations between the pore structure parameters of nanopores and the mineral composition (af).
Processes 13 01177 g010aProcesses 13 01177 g010b
Figure 11. The dual effects of quartz on the development of pore-fracture under SEM.
Processes 13 01177 g011
Figure 12. Correlations between the pore structure parameters of micropores (a) and mesopores (b) and the degree of thermal evolution.
Processes 13 01177 g012
Figure 13. Correlation between proximate analysis components and gas content (ad).
Processes 13 01177 g013
Figure 14. Correlations between the pore structure parameters of nanopores and the gas content under different ash contents (ad).
Processes 13 01177 g014
Figure 15. Correlation between gas content and mineral composition under different ash contents (ad).
Processes 13 01177 g015
Table 1. Basic information of coal samples.
Sample
No.
TypesDepth,
m
Vitrinite (%)Liptinite (%)Inertinite
(%)
Inoriganic Mineral (%)Ro,max,%Mad,%Aad,%Vad,%FCad,%
J5-2A2103.5687.27.8052.871.34.617.4886.61
J5-5A2165.1681.212.406.43.041.156.7887.12
J2-1A3001.4585.6905.43.081.945.847.1885.04
J5-4A2164.878.417.204.43.031.058.766.983.29
J3-9A2746.636726.206.83.051.329.647.0382.01
J3-3B2670.6370.42405.62.911.4210.988.4879.12
J2-4B3076.8784.55.806.23.251.2111.676.6580.47
J6-4B2468.2580.413.6063.251.7212.327.2478.72
J5-1B2102.6664.83005.22.920.9712.56.9279.61
J3-5B2677.574.421.803.82.941.3212.867.8178.01
J2-6B3082.35866083.261.6413.097.7977.48
J6-2B2390.476.417.206.43.21.7713.726.6577.86
J6-3B2467.9582.41205.63.211.8114.346.6977.16
J2-2B3002.8285.89.804.43.051.415.287.7975.53
J3-7C2745.656627072.971.1220.317.5271.05
J6-1C2389.879.415.804.83.091.7727.897.862.54
Note: Mad is water content, %; Aad is ash content, %; Vad is volatile content, %; FCad is fixed carbon content, %,Ro,max is Maximum vitrinite reflectance, %.
Table 2. Mineral composition of coal samples.
Sample
No.
Quartz
(%)
Plagioclase
(%)
Calcite
(%)
Ankerite
(%)
Siderite
(%)
Barite
(%)
Halite
(%)
Total Clay
(%)
J5-27.7/8.3//16.78.259.1
J5-58.5/11.69.7/20.3/49.9
J2-122.9/8.10.6//0.268.2
J5-47/4.5//17.8/70.7
J3-92/13/29/64
J3-32/2555//60
J2-45.7/4.80.2/16.4171.9
J6-46.9/3.8////89.3
J5-129.6/17.5/2.4//50.5
J3-520/372/31/5
J2-65.5/14.40.3/19.91.258.7
J6-2336.917.81.90.9/138.5
J6-327.3/11////61.7
J2-222.8/10.60.2//1.265.2
J3-715/4125/71
J6-112.2410.34.9/10/58.6
Table 3. Nanopore structure parameters of three types.
TypesSample
No.
MesoporousMicropore
Specific Surface Area
(m2/g)
Pore Volume
(cm3/g)
Specific Surface Area (m2/g)Pore Volume
(cm3/g)
Type AJ5-20.07580.0011169.92900.0481
J5-50.01990.0009160.21400.0494
J2-10.02940.0010154.31300.0480
J5-40.02640.0009157.20100.0444
J3-90.04800.0010168.75100.0476
Type BJ3-30.01870.0009153.20700.0429
J2-40.30680.0014149.94200.0467
J6-40.24880.0014163.60400.0487
J5-10.08230.0009125.75000.0358
J3-50.02140.0011153.72700.0434
J2-60.30240.0012171.24600.0485
J6-20.07530.0011167.72700.0514
J6-30.28670.0014156.67100.0471
J2-20.13390.0010122.93600.0410
Type CJ3-70.05700.0009150.48300.0434
J6-11.76090.0018130.69600.0391
Disclaimer/Publisher’s Note: The statements, opinions and data contained in all publications are solely those of the individual author(s) and contributor(s) and not of MDPI and/or the editor(s). MDPI and/or the editor(s) disclaim responsibility for any injury to people or property resulting from any ideas, methods, instructions or products referred to in the content.