Abstract
In cold environments, traditional independent thermal management systems heavily rely on inefficient Positive Temperature Coefficient (PTC) heaters, which exacerbate range anxiety in vehicles. In this study, an energy management-based control strategy for an integrated thermal management system (ITMS) designed for hybrid electric vehicles (HEVs) is proposed. By coupling the four thermal flow circuits of the entire vehicle and integrating driving modes with heating demands, this strategy achieves full vehicle-level integrated control. Through optimizing the distribution and utilization of heat within the vehicle, this enhances the heating performance of the air source heat pump. The simulation results demonstrate that the proposed strategy significantly reduces the power consumption of the heat pump and improves heating efficiency for both the battery and the cabin. By utilizing waste heat from the motor and the engine, the ITMS increases the heating capacity of the heat pump, particularly in low-temperature environments. Compared to traditional thermal management systems, the ITMS control strategy achieves substantial improvements in both heating time and energy efficiency. Specifically, the system reduces battery heating time by 55.94% and enhances the overall heating performance of the vehicle. Furthermore, the strategy reduces fuel consumption by 5.18%, demonstrating its potential to improve the energy efficiency of HEVs in cold climates.
1. Introduction
The transportation sector is one of the largest contributors to anthropogenic greenhouse gas (GHG) emissions. In the United States, transportation accounts for 27% of the total human-induced GHG emissions, with 83% of this originating from vehicles, and this proportion is increasing annually [1]. According to data released by the European Commission, transportation contributes approximately 25.9% of the total GHG emissions, with road transportation accounting for 76.7% of this [2]. To reduce GHG emissions, countries are actively promoting the research and application of energy-saving and carbon-reducing technologies. Many nations have begun phasing out fuel-powered vehicles, encouraging the adoption of new energy vehicles (NEVs) [3]. NEV sales have been rising steadily, reaching 14 million units in 2023, with projections by the International Energy Agency (IEA) indicating that sales could reach 17 million units in 2024 [4]. Compared to pure electric vehicles, hybrid electric vehicles (HEVs) combine the long driving range advantage of traditional fuel vehicles with the energy- and carbon-saving benefits of pure electric vehicles. As a transitional form between conventional fuel vehicles and pure electric vehicles, HEVs will maintain a significant market presence for an extended period.
In terms of energy-saving and carbon reduction, NEVs have significant advantages over traditional fuel vehicles. NEVs require more complex thermal management systems to meet their stringent temperature sensitivity requirements. Lithium-ion batteries, commonly used in NEVs, have a narrow operational temperature range, with the optimal working temperature being around 15–35 °C [5]. This is particularly crucial in winter, where the limited driving range of NEVs becomes a pressing issue. In low-temperature environments, the substantial increase in internal resistance reduces the battery’s power output and effective capacity [6]. To maintain battery efficiency and cabin thermal comfort in cold conditions, the mainstream method adopted is Positive Temperature Coefficient (PTC) heating [7]. Although PTC heating has a faster heating speed, it has low efficiency and high energy consumption, which means that a large amount of electricity is required for heating in low-temperature environments, greatly reducing the vehicle’s driving range [8].
Air source heat pumps are widely regarded as an efficient technology, and heat pump air conditioning is expected to play a key role in the thermal management of new energy vehicles (NEVs) in the future [9]. Currently, the R134a refrigerant is extensively used in automotive heat pumps. As the ambient temperature drops, the efficiency of the air source heat pump also decreases, and its heating capacity significantly declines, often requiring auxiliary PTC heating, which reduces overall heating efficiency [10]. Therefore, developing an integrated thermal management system that reduces energy consumption for heating both the battery and the cabin, while improving battery efficiency and cabin comfort, is crucial for the widespread adoption of NEVs in low-temperature environments.
Unlike pure electric vehicles, HEVs have an internal combustion engine, which offers more advantages in mitigating driving range reduction at low temperatures [11]. Due to the operational characteristics of both the motor and engine, a significant amount of energy is lost to the environment as heat. Recovering and utilizing this waste heat are key to addressing the issue of driving range reduction for HEVs in low-temperature conditions [12]. It is important to note that the waste heat from the motor and engine does not result in additional energy consumption for the vehicle. Therefore, harnessing this waste heat for heating the battery and cabin can effectively reduce the energy consumption of the thermal management system.
In order to improve the efficiency of waste heat utilization in vehicles, many scholars have conducted theoretical and applied research on integrated thermal management systems. Guo et al. designed an integrated thermal management topology based on a four-way valve, effectively reducing the heating time of the battery and cabin through waste heat recovery and decreasing heating energy consumption by 2.56% [13]. Lee et al. studied the effects of waste heat recovery during cold start conditions, resulting in an 18.8% increase in heating speed [14]. Fei et al. employed a heat pump system to recover waste heat to assist PTC heating and evaluated the impact of different control strategies on temperature regulation and energy consumption [15]. Qu et al. directly coupled key subsystems such as waste heat sources, a cabin, and a battery, achieving a 3.6% reduction in energy consumption and an 8% increase in driving range compared to conventional air source heat pumps [16].
In summary, current research on integrated thermal management for new energy vehicles (NEVs) only considers single coupling structures, such as recovering engine waste heat for cabin or battery heating, and has yet to achieve full vehicle-level integrated control. Regarding waste heat recovery, most studies focus on the direct utilization of single waste heat sources. However, in hybrid electric vehicles (HEVs), there are multiple subsystems generating waste heat, and significant temperature differences exist between these subsystems, making waste heat utilization challenging. In practice, the thermal management system includes the engine circuit, motor circuit, battery circuit, and air conditioning circuit. At present, there is limited research on the coordinated control of heat flows across all circuits. This study aims to fill this research gap by coupling the thermal management systems of all circuits to achieve overall thermal management control and improve energy utilization efficiency.
The structure of this paper is organized as follows: Section 2 establishes a dynamic model of a hybrid electric vehicle, upon which the electrothermal coupling model of the battery pack, along with the efficiency and thermal models of the engine, motor, and cabin, is developed. Section 3 introduces the energy management strategy, the topology of the thermal management system, and the control strategy for thermal management. Section 4 validates the effectiveness of the proposed strategy, and Section 5 concludes this study.
The main contributions of this study are as follows.
- An integrated thermal management system structure was designed by coupling the heat pump with the motor and engine circulation circuits through heat exchangers and electromagnetic valves, building upon an independent thermal management system.
- A logic threshold control strategy, tailored to the integrated thermal management system, was developed, enabling flexible multi-mode control and full vehicle heat integration.
- This study analyzed the heat generation of the motor and engine in low-temperature conditions and verified the feasibility and advantages of the integrated thermal management system through simulation experiments, significantly enhancing the system’s heating capacity and reducing the overall energy consumption of the vehicle.
2. HEV Dynamic and Thermal Model
This study selects a P2-configuration hybrid electric vehicle (HEV) [17] as the research subject. The original vehicle thermal management system (TMS) consists of four circuits, as shown in Figure 1. The battery circuit alternates between different loops, utilizing a temperature-feedback-based electromagnetic three-way valve, to maintain the battery’s optimal operating temperature. At low temperatures, the battery dissipates heat through the air-cooling circuit, while the heat exchanger in the air conditioning circuit heats the battery. The cabin temperature is controlled by the air conditioning system. Due to its simple structure, the independent thermal management system offers flexible temperature control for components within subsystems and lower manufacturing and maintenance costs, leading to its widespread adoption. However, the independent thermal management system, by keeping all subsystems entirely separate, restricts energy flow within the thermal management system. This is especially problematic in low-temperature environments, where the waste heat generated by the motor and engine cannot be efficiently utilized, resulting in energy waste.
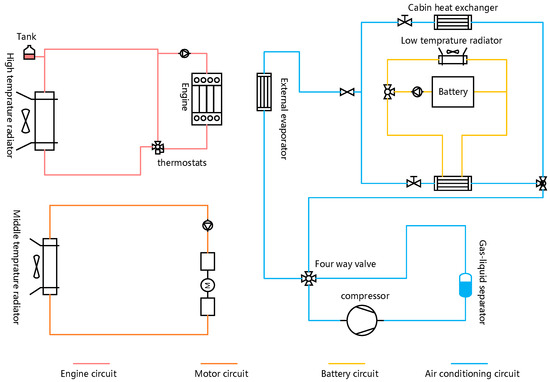
Figure 1.
A structural diagram of the independent thermal management system.
To overcome the shortcomings of the aforementioned TMS topology, an improved integrated thermal management system (ITMS) that recovers waste heat from the motor and engine is proposed, as shown in Figure 2. The design incorporates heat exchangers into both the motor and engine circuits to enhance the performance of the heat pump air conditioning system in low-temperature conditions. The heat exchangers are connected to the heat pump air conditioning system via electromagnetic three-way valves, which, based on the energy management mode, switch to the appropriate heat exchanger to optimize the heat pump’s operating conditions, providing heat to either the battery or the cabin as needed. The improved ITMS structure effectively reduces energy consumption in low-temperature environments while accelerating the heating process.
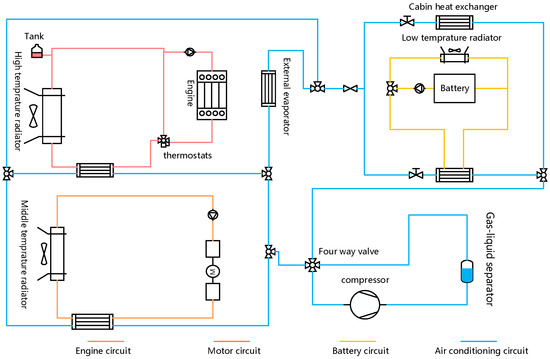
Figure 2.
A structural diagram of the integrated thermal management system.
2.1. Vehicle Dynamic Model
The P2 hybrid electric vehicle operates in three driving modes: pure electric drive, hybrid drive, and charging while driving. The vehicle switches between these modes based on the energy management strategy. While driving, the vehicle needs to overcome aerodynamic drag, rolling resistance, gradient resistance, and acceleration resistance. The driving power supplied by the powertrain can be calculated using Equation (1).
where is the required driving power (W), is the vehicle velocity (m⋅s−1), is the aerodynamic drag coefficient, is the rolling resistance coefficient, is the road slope, and g is the gravitational acceleration (m⋅s−2). The definitions, values and units are listed in Table 1 and the vehicle dynamic parameters are given in Table 2.

Table 1.
Vehicle parameters.
Table 2.
Power component parameters.
The transmission efficiency models for different driving modes are as follows.
- Pure Electric Mode
In pure electric mode, the clutch is disengaged, and all the driving force of the vehicle comes from the driving motor. The vehicle driving power can be expressed as shown in Equation (2):
where is the output power of the motor (W); is the mechanical efficiency of the transmission system.
- 2.
- Hybrid Mode
In hybrid mode, the clutch is engaged, and the vehicle is driven by both the electric motor and the engine. The vehicle driving power can be expressed as shown in Equation (3):
where is the output power of the engine (W); is the mechanical efficiency of the transmission system.
- 3.
- Charging While Driving Mode
In this mode, the clutch is engaged, and the electric motor functions as a generator. The vehicle is driven solely by the engine, which simultaneously drives the generator through the clutch to charge the battery. The vehicle driving power can be expressed as shown in Equation (4):
where is the battery charging power (W); is the generator’s power generation efficiency.
2.2. Motor Model
When the vehicle is set to pure electric mode, the driving power provided by the driving motor is the difference between the total motor power and the motor’s loss power. The specific expression is as follows:
where is the total power of the motor, and is the motor loss power (W).
When the vehicle is set to charging while driving mode, the motor functions as a generator. The charging power is the difference between the generator’s input power and the motor’s loss power. The specific expression is as follows:
where is the battery charging power (W), is the generator input power (W), and is the battery charging efficiency.
is calculated using the motor power loss graph shown in Figure 3. When the heat generated by the driving motor reaches equilibrium with its dissipation, the motor achieves a state of thermal balance.
where is the mass flow rate of the motor cooling water jacket (kg⋅s−1), is the specific heat capacity of the coolant (J⋅kg−1⋅°C−1), and are the inlet and outlet temperatures of the coolant in the motor cooling water jacket, respectively (°C).
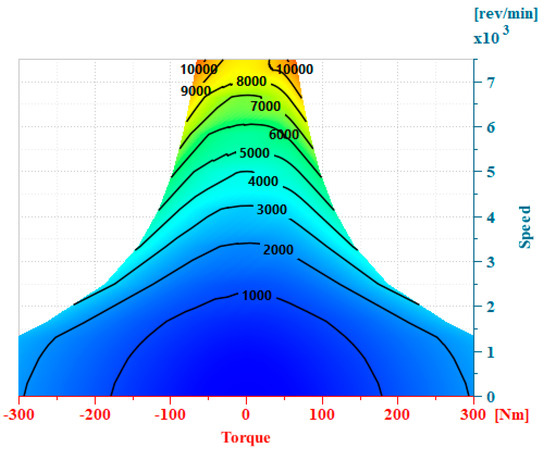
Figure 3.
Power loss map of motor.
2.3. Engine Thermal Model
The engine is modeled based on an efficiency map [18], and the engine heat generation power is calculated using the following equation:
where represents the heat generation power of the engine (W); is the fuel consumption rate (kg⋅s−1); is the lower heating value of the fuel, set at 42,700 kJ⋅kg−1; and is the engine output power (W).
When the engine is in a thermal equilibrium state,
where indicates the mass flow rate of the engine cooling water jacket (kg⋅s−1). The variable c stands for the specific heat capacity of the coolant (J⋅kg−1 °C−1), and and are the inlet and outlet temperatures of the coolant in the engine cooling water jacket (°C). Lastly, is the percentage of heat transferred to the cooling system relative to the total heat generated by the engine [19].
2.4. Battery Thermal Model
Due to the low computational complexity and good stability of the equivalent circuit model, the RC equivalent circuit model is selected as the electrical model of the battery, as shown in Figure 4, and represents the open-circuit voltage and terminal voltage of the battery pack.
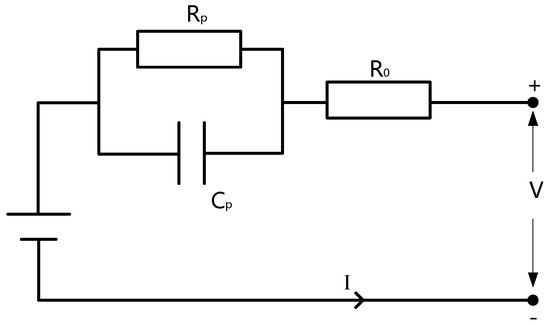
Figure 4.
Equivalent circuit model of lithium battery.
According to the Bernardi model [20], the heat generated by a lithium-ion battery primarily consists of two components: the irreversible heat generated by the internal resistance and the reversible heat produced by entropy change [21]. This is shown in the following equation.
where I represents the charging/discharging current of the battery (A), is the internal resistance (Ω), T is the battery temperature (°C), is the entropy coefficient, and is the open-circuit voltage of the battery (V).
The battery heat generation model was validated by evaluating the heat generation during 1C charging and discharging, where 1C refers to the rate at which the battery is charged or discharged in one hour, corresponding to a current that will fully charge or discharge the battery in one hour, following the method of Liu et al. [22], as presented in Figure 5. The errors between the predicted and measured results were within 10%. The battery parameters are listed in Table 3.
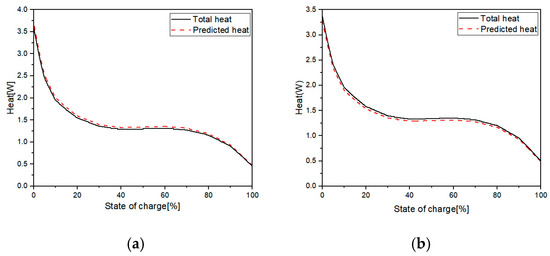
Figure 5.
Validation of battery heat generation model: (a) 1C charging and (b) 1C discharging.
Table 3.
Battery parameters.
2.5. Cabin Thermal Model
The cabin model established in this study focuses solely on the heating condition. The model parameters are shown in Table 4. The model was developed using the built-in module of the simulation software, accounting for the effects of solar radiation, body heat, external convective heat transfer, and air conditioning on the cabin temperature. The heat load of the cabin can be expressed as follows:
where is the solar radiation (W), is the heat exchange between the vehicle and the external environment (W), is the heat generated by the human (W), and is the heat output from the air conditioning system (W).
Table 4.
Cabin parameters.
For the heat exchange between the external environment and the vehicle body,
where is the ambient temperature (°C), is the vehicle body temperature (°C), is the heat transfer coefficient between the vehicle and the external environment (W⋅m−2 °C−1), and is the heat exchange area outside the cabin (m2).
For the heat exchange between the internal environment and the vehicle body,
where is the cabin temperature (°C), is the heat transfer coefficient between the vehicle and the internal air (W⋅m−2 °C−1), and is the heat exchange area inside the cabin (m2).
2.6. Compressor and Other Component Models
The compressor is a major energy-consuming component in the refrigeration system. In this simulation, a simplified model of the compressor is used, where the refrigerant flow and heat exchange within the compressor are neglected. Only the volumetric efficiency, isentropic efficiency, and mechanical efficiency affecting the performance of the compressor are taken as the main descriptive parameters [23], thereby establishing the following model.
where is the mass flow of the compressor. The subscripts , , and represent suction, displacement, and isentropic displacement, respectively. represents the displacement of the compressor, is the torque of the compressor, and stands for the speed of the electric compressor.
Other component models of the thermal management system were built using the simulation software’s built-in modules, each with detailed descriptions. The parameters of the model are shown in Table 5. These components include the pipeline model, pump model, radiator model, and coolant. The water pump model was developed based on the H-Q curve provided by the manufacturer at the rated speed. The radiator model was established through experimental testing, where the heat dissipation was measured under various airflow speeds and coolant flow rates at a specific air–liquid temperature difference. The actual heat exchange was calculated using a heat transfer diagram. Ethylene glycol (50%) was selected as the coolant for all thermal management circuits.
Table 5.
Other component parameters.
3. Control Strategy
3.1. Energy Management Strategy
The vehicle adopts a rule-based energy management strategy, as shown in Figure 6. Under conditions where the state of charge (SOC) is above the set threshold soc_high and the vehicle speed is below 15 m/s, the vehicle operates in pure electric mode. If the vehicle speed exceeds 15 m/s, the vehicle switches to hybrid drive mode. Under conditions where the SOC drops below the set threshold Soc_low, the vehicle enters the charging while driving mode, where the engine drives the vehicle and powers the generator to charge the battery until the SOC rises above the set threshold soc_high. To prevent frequent start–stop cycles of the engine, the vehicle maintains the previous driving mode when the battery SOC is between soc_high and soc_low.
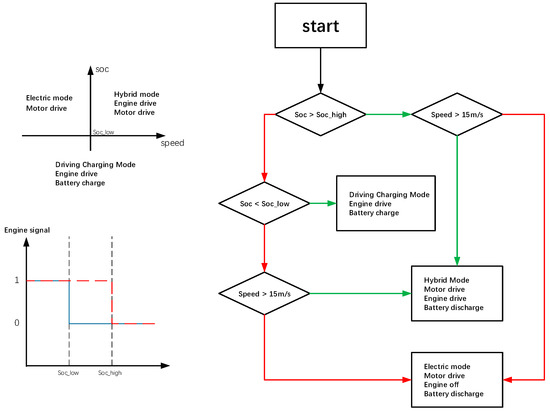
Figure 6.
Rule-based energy management strategy.
3.2. TMS Control Strategy
The mode switching rules for the thermal management system (TMS) are established based on the energy management strategy. The selection of the mode is determined by engine signals, battery temperature signals, and cabin temperature signals. The logic diagram for mode switching is shown in Figure 7.
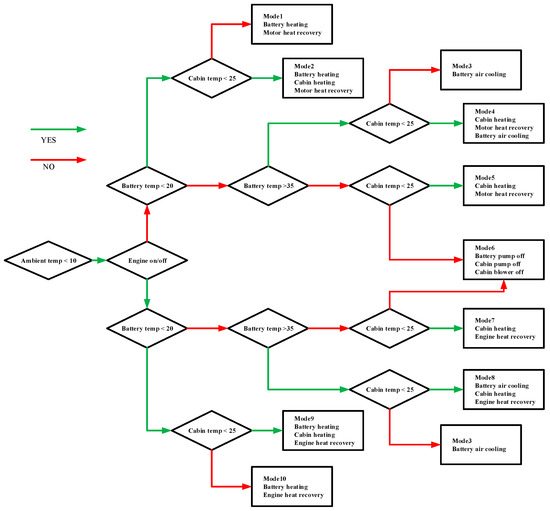
Figure 7.
Mode switching rules for the operation of the integrated thermal management system.
To maintain thermal comfort in the cabin at low temperatures, warm air is needed to raise the temperature of the passenger compartment. To ensure optimal low-temperature performance, improve battery efficiency, and extend battery life, the battery should be heated to its optimal operating temperature. Both the cabin and the battery are heated via a heat pump, while the waste heat from the engine and motor is used to enhance the operating conditions of the heat pump air conditioning system, thereby reducing the energy consumption for heating the battery and cabin. According to the vehicle’s driving mode, battery heating requirements, and cabin heating requirements, the thermal management system can switch between different circulation circuits to manage the temperature of components. The various circulation circuits are shown in Figure 8.
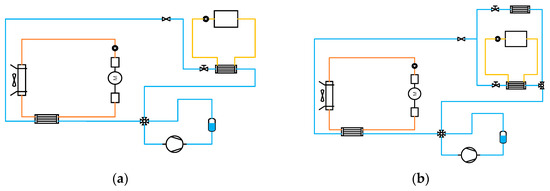
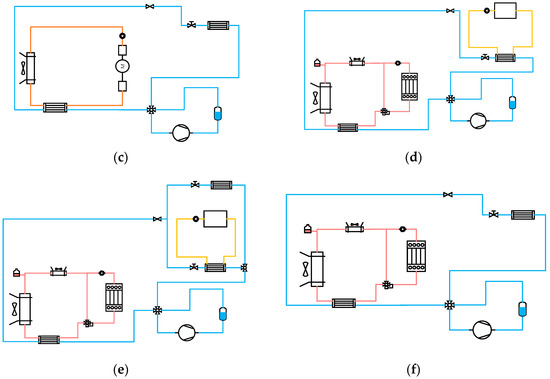
Figure 8.
Heating circuits of integrated thermal management system: (a) Circuit 1 battery heating (engine off), (b) Circuit 2 battery and cabin heating (engine off), (c) Circuit 3 cabin heating (engine off), (d) Circuit 4 battery heating (engine on), (e) Circuit 5 battery and cabin heating (engine on), (f) Circuit 6 cabin heating (engine on).
In pure electric mode, the waste heat from the motor is utilized to enhance the efficiency of the heat pump air conditioning system. Both the battery and the cabin are heated by the heat pump—battery heating is achieved through Circuit 1 or Circuit 2, while cabin heating uses Circuit 2 or Circuit 3. When there is no heating demand from either the battery or the cabin, the water pumps for the cabin and battery circulation are turned off.
In hybrid mode and charging while driving mode, the waste heat from the engine is used to enhance the efficiency of the heat pump air conditioning system. Battery heating operates through Circuit 4 or Circuit 5, and cabin heating is managed via Circuit 5 or Circuit 6. Similar to pure electric mode, when neither the battery nor the cabin requires heating, the water pumps for both circulations are turned off.
4. Results and Discussions
The ambient temperatures are set to −20 °C and −10 °C, with the vehicle’s initial temperature matching the ambient temperature. The target temperatures for the battery and the cabin are set to 25 °C and 20 °C, respectively. The airspeed is correlated with the vehicle speed. Four World Light Vehicle Test Cycles (WLTCs) were selected to evaluate the thermal management control strategy. Each cycle lasts 1800 s and covers a distance of 23.25 km, which closely approximates real driving conditions. The cycle is illustrated in Figure 9.
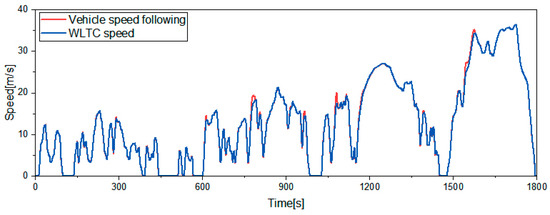
Figure 9.
WLTC and vehicle speed fallowing.
During this cycle, the heat generation of the motor and engine varies over time, as shown in Figure 10. In terms of heat generation duration, the motor continuously produces heat, while the engine, constrained by the energy management strategy, experiences frequent start–stop conditions and cannot generate heat continuously. Regarding the amount of heat generated, the engine produces significantly more heat compared to the motor.
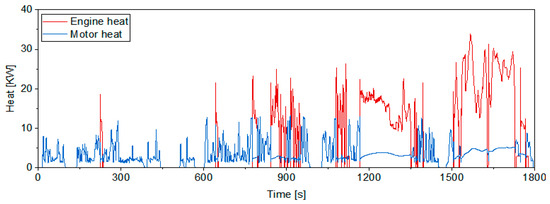
Figure 10.
Heat generation power of motor and engine.
4.1. Impact of Different Heat Sources on Heating Capacity
As shown in Figure 11 and Figure 12, by switching between different circulation circuits, the refrigerant can absorb heat from either the motor circuit or the engine circuit to heat the cabin and battery. By analyzing the impact of different waste heat sources on heating time, the influence of waste heat recovery on the system’s heating capacity is explored.
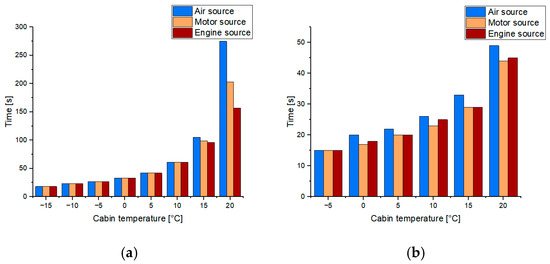
Figure 11.
Time to reach the target cabin temperature at different ambient temperatures: (a) −20 °C, (b) −10 °C.
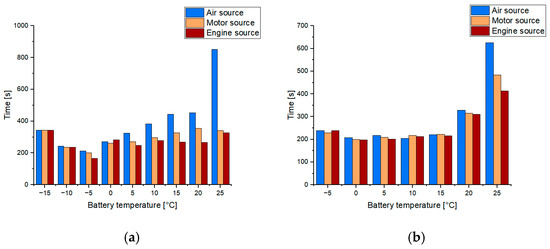
Figure 12.
Time to reach the target battery temperature at different ambient temperatures: (a) −20 °C, (b) −10 °C.
For different ambient temperatures, waste heat recovery has a more positive and significant effect on heating speed at lower temperatures. The greater the temperature difference between the ambient and target heating temperatures, the more pronounced the enhancement in heating capacity from waste heat recovery for the heat pump.
Overall, for both the cabin and the battery, the impact of waste heat recovery on heating speed is not immediately apparent during the initial heating phase. This is because, at the beginning of vehicle startup, the heat generated by the engine and motor is primarily used to heat their own bodies and circulation systems, leaving little excess heat for recovery. During the early heating stage, waste heat from the motor can more effectively shorten the heating time, while the engine requires more heat to warm up its body and the circulation water jacket. In the end, the engine provides a more abundant heat source, leading to the most significant reduction in the overall heating time.
4.2. Performance Analysis of ITMS
To demonstrate the superiority of the ITMS with waste heat recovery functionality, an independent TMS is used as a reference. As shown in Figure 1, the ITMS uses an air source heat pump to heat the battery. The initial SOC of the battery is set to 0.7, and the upper and lower SOC limits are set to 0.6 and 0.3, respectively, to simulate the energy management strategy under normal driving conditions. The engine’s on/off signals are illustrated in Figure 13.
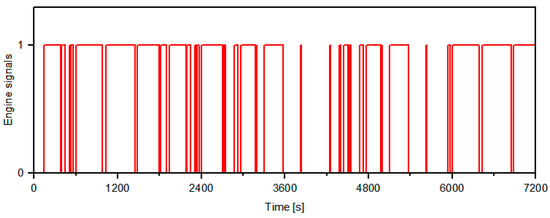
Figure 13.
Engine on/off signals.
The ambient temperature is set to −20 °C. The performance of the integrated thermal management system (ITMS) will be analyzed from two dimensions: heating time and energy consumption.
According to Figure 14 and Figure 15, in terms of heating capacity, the integrated thermal management system (ITMS) with waste heat recovery demonstrates an improvement in heating speed for both the battery and the cabin compared to the independent thermal management system (TMS), with a more significant enhancement for the battery, which requires a longer heating period. When the temperature difference between the target heating temperature and the ambient temperature exceeds 20 °C, the ITMS’s heating speed becomes noticeably superior to that of the independent TMS.
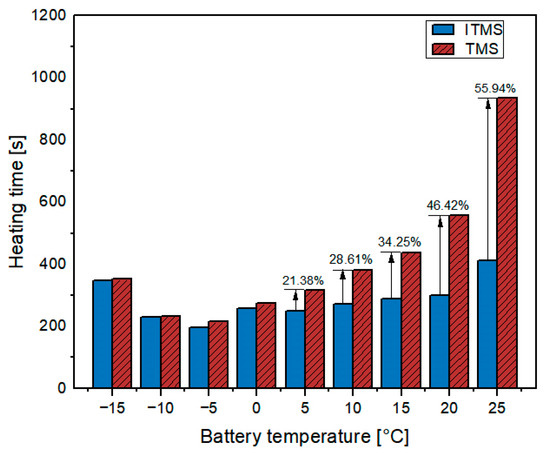
Figure 14.
Time for the battery to reach target temperatures.
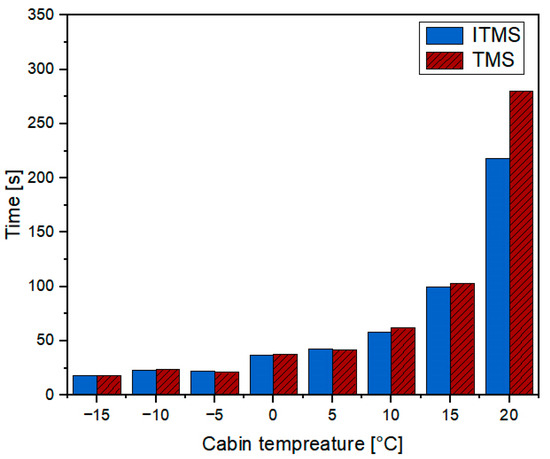
Figure 15.
Time for the cabin to reach target temperatures.
Regarding system energy consumption, Figure 16 shows the energy required to raise the battery temperature by 5 °C increments, and the corresponding Coefficient of Performance (COP) is an efficiency indicator of a heat pump or refrigeration system. Its calculation method is shown in (17).
where is the heat provided by the system, and is the electrical power consumed by the system or the mechanical energy input.
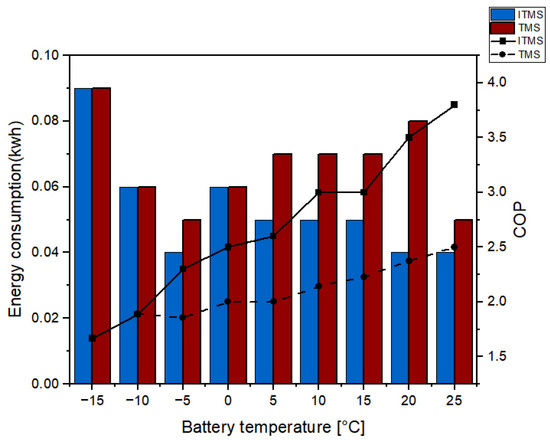
Figure 16.
Energy and Coefficient of Performance (COP) for the battery to reach the target temperature.
As the battery temperature increases, the energy consumption of the integrated TMS is significantly lower than that of the independent TMS, and the COP is higher. Considering the impact of battery temperature and heat pump power on overall vehicle energy consumption, Figure 17 presents the vehicle fuel consumption curve. With the integrated TMS, fuel consumption is 8.978 L, whereas with the independent TMS, it is 9.468 L.
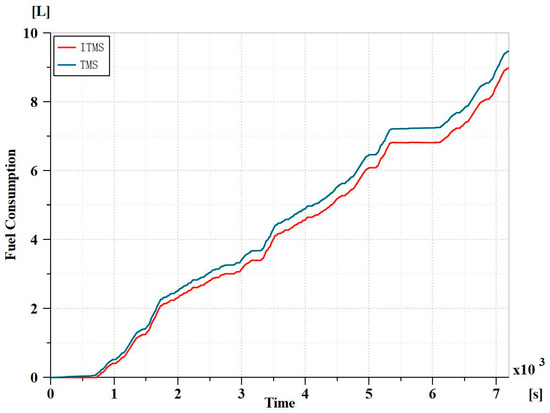
Figure 17.
Fuel consumption curve of vehicle.
In conclusion, the independent TMS, which relies on an air source heat pump, is more affected by temperature, exhibiting poorer heating capability and lower efficiency in low-temperature conditions. In contrast, the ITMS with waste heat recovery effectively reduces the heating time for the battery and cabin and lowers system energy consumption. Due to the different temperature and SOC variation processes between the independent and integrated TMS, the impact on overall vehicle efficiency is reflected in fuel consumption. Vehicles using the ITMS experience a 5.18% reduction in fuel consumption compared to those using the independent TMS.
5. Conclusions
To reduce the heating energy consumption of HEVs in winter and shorten the heating time, this study designed an integrated thermal management system (ITMS) with waste heat recovery, focusing on battery heating and cabin thermal comfort. A rule-based TMS control strategy was developed based on energy management strategy and heating requirements. An ITMS model was established for the P2 HEV, and the strategy was validated through simulations. The results demonstrate the significant effectiveness of this approach.
The main conclusions are summarized as follows.
- Both motor and engine waste heat have a positive impact on the heating speed of the cabin and battery at low temperatures. However, the waste heat from the motor is relatively limited, offering only a slight improvement compared to the air source heat pump, while the engine provides a more substantial heat source, leading to greater enhancement. Nonetheless, due to the HEV’s energy management strategy, the engine’s frequent start–stop operation prevents it from producing a stable and continuous heat supply.
- Since the cabin heats up relatively quickly and the available waste heat for recovery is minimal during vehicle startup, the effects of waste heat recovery on reducing cabin heating time are limited. However, for the battery, which heats up more slowly, waste heat recovery can significantly shorten the heating time. As the ambient temperature increases, the positive impact of waste heat recovery on heating speed gradually diminishes.
- The independent TMS, relying solely on an air source heat pump, is more affected by temperature, exhibiting poor heating capability and low efficiency under low-temperature conditions. In contrast, the ITMS with waste heat recovery significantly enhances the heating capacity of the heat pump in low temperatures, reducing vehicle energy consumption. This effect is especially pronounced when there is a large temperature difference between the target heating temperature and the ambient temperature. Compared to the independent TMS, the ITMS can shorten the battery heating time by up to 55.94%, with an average increase in the Coefficient of Performance (COP) of 27.39%, and reduce overall vehicle energy consumption by 5.18%.
Future work will focus on integrating energy management strategies with thermal management strategies by introducing predictive control strategies. The impact of predictive control on the thermal management system and overall vehicle efficiency will be explored to further improve vehicle economy.
Author Contributions
Resources, J.Z.; Data curation, P.C. and X.M.; Writing—original draft, B.X.; Writing—review and editing, B.X.; Supervision, Y.Z.; Project administration, Y.Z.; Funding acquisition, Y.Z. All authors have read and agreed to the published version of the manuscript.
Funding
This research was supported by the National Natural Science Foundation of China (52375105), the Excellent Young Talents Fund of Shandong Province (ZR2022YQ51), and the Major Science and Technology Innovation Project of Shandong Province (2019JZZY010911).
Data Availability Statement
The original contributions presented in this study are included in the article. Further inquiries can be directed to the corresponding author.
Conflicts of Interest
The authors declare no conflict of interest.
Nomenclature
| Acronyms | |
| ITMS | Integrated thermal management system |
| TMS | Thermal management system |
| HEV | Hybrid electric vehicle |
| NEV | New energy vehicle |
| SOC | State of charge |
| PTC | Positive Temperature Coefficient |
| GHG | Greenhouse gas |
| COP | Coefficient of Performance |
| IEA | International Energy Agency |
| WLTC | Worldwide Light Vehicle Test Cycle |
| EPA | Environmental Protection Agency |
| P2 | P2 configuration |
References
- U.S. Environmental Protection Agency (EPA). The 2023 EPA Automotive Trends Report: Greenhouse Gas Emissions, Fuel Economy, and Technology Since 1975, Executive Summary; U.S. Environmental Protection Agency (EPA): Washington, DC, USA, 2023. [Google Scholar]
- Directorate-General for Mobility and Transport (European Commission). EU Transport in Figures: Statistical Pocketbook 2022; Publications Office of the European Union: Luxembourg, 2022; Available online: https://data.europa.eu/doi/10.2832/216553 (accessed on 12 March 2023).
- Çolak, A.M.; Irmak, E. Electric Vehicle Advancements, Barriers, and Potential: A Comprehensive Review. Electr. Power Compon. Syst. 2023, 51, 2010–2042. [Google Scholar] [CrossRef]
- International Energy Agency. Global EV Outlook 2024; International Energy Agency: Paris, France, 2024. [Google Scholar]
- Tran, M.-K.; Mevawalla, A.; Aziz, A.; Panchal, S.; Xie, Y.; Fowler, M. A Review of Lithium-Ion Battery Thermal Runaway Modeling and Diagnosis Approaches. Processes 2022, 10, 1192. [Google Scholar] [CrossRef]
- Lu, M.; Zhang, X.; Ji, J.; Xu, X.; Zhang, Y. Research progress on power battery cooling technology for electric vehicles. J. Energy Storage 2020, 27, 101155. [Google Scholar] [CrossRef]
- Liang, K.; Wang, M.; Gao, C.; Dong, B.; Feng, C.; Zhou, X.; Liu, J. Advances and challenges of integrated thermal management technologies for pure electric vehicles. Sustain. Energy Technol. Assess. 2021, 46, 101319. [Google Scholar] [CrossRef]
- Lee, H.; Lee, D.; Kim, Y. Heating performance of a coolant-source heat pump using waste heat from stack and electric devices in fuel cell electric vehicles under cold conditions. Energy Convers. Manag. 2022, 252, 115092. [Google Scholar] [CrossRef]
- Yan, H.; Wang, R.; Zhang, C.; Xu, Z.; Hu, B.; Shao, Z. The role of heat pump in heating decarbonization for China carbon neutrality. Carbon Neutrality 2022, 1, 40. [Google Scholar] [CrossRef]
- Teng, H.; Wang, J.; Wang, Y.; Song, Z.; Liu, D.; Liu, Z.; Xue, X.; Chang, W.; Li, M. Performance research on a CO2 heat pump system with novel control strategy in electric vehicle. Appl. Therm. Eng. 2025, 259, 124877. [Google Scholar] [CrossRef]
- Song, Z.; Pan, Y.; Chen, H.; Zhang, T. Effects of temperature on the performance of fuel cell hybrid electric vehicles: A review. Appl. Energy 2021, 302, 117572. [Google Scholar] [CrossRef]
- Liu, H.; Wen, C.; Yuen, A.C.Y.; Han, Y.; Cheung, S.C.-P.; Kook, S.; Yeoh, G.H. A novel thermal management system for battery packs in hybrid electrical vehicles utilising waste heat recovery. Int. J. Heat Mass Transf. 2022, 195, 123199. [Google Scholar] [CrossRef]
- Guo, R.; Li, L.; Sun, Z.; Xue, X. An integrated thermal management strategy for cabin and battery heating in range-extended electric vehicles under low-temperature conditions. Appl. Therm. Eng. 2023, 228, 120502. [Google Scholar] [CrossRef]
- Lee, S.; Chung, Y.; Lee, Y.I.; Jeong, Y.; Kim, M.S. Battery thermal management strategy utilizing a secondary heat pump in electric vehicle under cold-start conditions. Energy 2023, 269, 126827. [Google Scholar] [CrossRef]
- Fei, F.; Wang, D. PTC power control of electric vehicle thermal management system based on neural network feedforward. Appl. Therm. Eng. 2024, 253, 123803. [Google Scholar] [CrossRef]
- Qu, Y.; Li, D.; Wang, R. Study on integrated thermal management system of hydrogen fuel cell vehicles based on heat pump air conditioning. J. Clean. Prod. 2024, 434, 139951. [Google Scholar] [CrossRef]
- Lee, S.; Lee, B.; McDonald, J.; Sanchez, L.J.; Nam, E. Modeling and Validation of Power-Split and P2 Parallel Hybrid Electric Vehicles. In SAE Technical Paper 2013; SAE International: Warrendale, PA, USA, 2013; p. 11. [Google Scholar] [CrossRef]
- Shams-Zahraei, M.; Kouzani, A.Z.; Kutter, S.; Bäker, B. Integrated thermal and energy management of plug-in hybrid electric vehicles. J. Power Sources 2012, 216, 237–248. [Google Scholar] [CrossRef]
- Chu, S.; Majumdar, A. Opportunities and challenges for a sustainable energy future. Nature 2012, 488, 294–303. [Google Scholar] [CrossRef] [PubMed]
- Bernardi, D.; Pawlikowski, E.; Newman, J. A General Energy Balance for Battery Systems. J. Electrochem. Soc. 1985, 132, 5. [Google Scholar] [CrossRef]
- Panchal, S.; Dincer, I.; Agelin-Chaab, M.; Fraser, R.; Fowler, M. Experimental and theoretical investigations of heat generation rates for a water cooled LiFePO4 battery. Int. J. Heat Mass Transf. 2016, 101, 1093–1102. [Google Scholar] [CrossRef]
- Liu, G.; Ouyang, M.; Lu, L.; Li, J.; Han, X. Analysis of the heat generation of lithium-ion battery during charging and discharging considering different influencing factors. J. Therm. Anal. Calorim. 2014, 116, 1001–1010. [Google Scholar] [CrossRef]
- LMS Imagine. Lab AMESim User’s Guide. Available online: http://oss.jishulink.com/caenet/forums/upload/2014/11/28/392/194967191404007.pdf (accessed on 20 January 2025).
Disclaimer/Publisher’s Note: The statements, opinions and data contained in all publications are solely those of the individual author(s) and contributor(s) and not of MDPI and/or the editor(s). MDPI and/or the editor(s) disclaim responsibility for any injury to people or property resulting from any ideas, methods, instructions or products referred to in the content. |
© 2025 by the authors. Licensee MDPI, Basel, Switzerland. This article is an open access article distributed under the terms and conditions of the Creative Commons Attribution (CC BY) license (https://creativecommons.org/licenses/by/4.0/).