Article

Multi-Response Optimization Analysis of the Milling Process of Asphalt Layer Based on the Numerical Evaluation of Cutting Regime Parameters

by
Teodor Dumitru
,
Marius Gabriel Petrescu
*,
Maria Tănase
* and
Costin Nicolae Ilincă
Mechanical Engineering Department, Petroleum–Gas University of Ploiești, 100680 Ploiești, Romania
*
Authors to whom correspondence should be addressed.
Processes 2023, 11(8), 2401; https://doi.org/10.3390/pr11082401
Submission received: 24 July 2023 / Revised: 7 August 2023 / Accepted: 8 August 2023 / Published: 9 August 2023
(This article belongs to the Special Issue Processes in 2023)

Abstract

:
The present study aimed to optimize the process parameters (milling depth and advanced speed) for an asphalt milling operation using a multi-response approach based on Taguchi design of experiments (DOE) and Grey Relational Analysis (GRA). Nine simulations tests were conducted using Discrete Element Method (DEM) in order to determine the forces acting on the cutting tooth support and tip. The considered performance characteristics were cutting forces (smaller is better category) and chip section area (larger is better category). A Grey Relational Grade (GRG) was determined from GRA, allowing to identify the optimal parameter levels for the asphalt milling process with multiple performance characteristics. It was found that that the optimal milling parameters for multi-response analysis are a milling depth of 200 mm and an advanced speed of 30 mm/min. Furthermore, analysis of variance (ANOVA) was used to determine the most significant factor influencing the performance characteristics. The analysis results revealed that the dominant factor affecting the resultant cutting force was milling depth, while the main factor affecting chip section area was the advanced speed. Optimizing milling efficiency is essential in machining operations. A key factor in this direction is comprehending the interplay between chip removal and cutting forces. This understanding is fundamental for achieving increased productivity, cost-effectiveness, and extended tool lifespan during the milling process.

1. Introduction

Machines and equipment used for asphalt pavement milling have gained extensive global usage. As road construction continues to expand, there is a corresponding increase in the demand for this equipment. Simultaneously, to achieve an optimal design and technological parameters for milling machines, it is necessary to make a comprehensive examination of the asphalt concrete milling process, specifically focusing on the cutter’s working elements [1]. The milling process performance and productivity are mainly influenced by the cutting forces and the removed material amount [2].
Milling equipment for asphalt pavement is highly loaded, with the main issues being affected by the very hard-working regime determining the wear of the cutter teeth. These conditions are influenced by factors such as the mechanical properties of the material being processed (asphalt), its non-uniformity, the use of water as a working fluid to clear the work area, and the considerable cutting depth involved [3,4,5,6].
The interaction between the asphalt clothing and the milling cutter teeth during the milling process (Figure 1) is a very complex phenomenon that has been studied using numerical approaches [3,7,8,9,10,11,12,13,14] or experimental investigations [1,15,16,17,18].
Discrete Element Method (DEM) is a widely utilized method for studying dynamic processes, finding numerous applications in the field of asphalt pavement or soil engineering [19,20,21].
Dumitru et al. [3] used a calculation method that integrated both the finite element method (FEM) and the discrete element method (DEM) to achieve precise simulation of the cutting process, enabling them to accurately determine the stresses generated within the active part of the milling tooth.
Another analysis [11] also used DEM and focused on the cutting tool’s forces, with the aim of exploring the optimal conditions to minimize damage to the aggregate in the asphalt mixture and prevent the formation of larger asphalt pieces during the milling process.
To explore the cracking behavior of asphalt concrete, Chen et al. [9] developed a customized micromechanical model using the discrete element method. By representing the irregular shape of individual aggregate particles using clusters of spheres of varying sizes, the three-dimensional discrete element model successfully accounted for aggregate gradation and fraction and it assessed the impact of air void content and aggregate volumetric fraction on the cracking behavior of asphalt concrete.
The precise determination of cutting forces in road milling is an area that has not been extensively explored. Several parameters influence the magnitude of cutting forces, including the geometric shape and position of the cutting element, chip thickness of the material, presence and durability of stone fractions, and the temperature of the asphalt concrete [1]. These factors contribute to a complex relationship that determines the cutting force. Since the productivity of the milling process is mainly influenced by the chip section area and the cutting forces developed on the milling teeth, an optimization of the process parameters is necessary in order to obtain the best combination of process parameters that enables the improvement in milling process. Several studies have focused on this aspect. For example, Atlas et al. [22] optimized the machining parameters for surface milling of a nickel–titanium shape memory alloy using uncoated cutting tools with varying nose radius, in order to minimize the average surface roughness and flank wear values under dry cutting conditions, using Taguchi and ANOVA methods and the Minitab 17 version software. The results indicate that the nose radius of the cutting tool has the most significant influence on surface roughness, while the feed rate is the primary factor affecting flank wear.
Also, statistical analyses were performed in [23] to assess the influence of cutting speed and feed rate on tool life, cutting force, and tool edge chipping.
In study [2], a series of milling experiments were conducted to investigate the influence of number of tool teeth and cutting parameters on the milling performance for the production of a bamboo–plastic composite. The significance of each term in the models was analyzed using ANOVA and it was found that the number of tool teeth had the greatest impact on both resultant force and cutting temperature, followed by the depth of cut and cutting speed.
Mohapatra et al. [24] determined the optimal cutting parameters by applying an optimization technique to minimize both flank surface wear and surface roughness. Through ANOVA analysis, it was observed that the feed parameter contributed the most, with a significant contribution of 40.57%, towards minimizing surface roughness. On the other hand, cutting velocity had the highest impact, with a contribution of 87.67%, in minimizing flank wear. Notably, cutting velocity was found to be an important process parameter influencing both responses.
The objective of study [25] was to optimize the dry turning parameters for two different grades of nitrogen alloyed duplex stainless steel using the Taguchi method. The study focused on analyzing the effects of cutting speed and feed rate on surface roughness, cutting force, and tool wear and it was demonstrated that the feed rate had a greater influence on surface roughness and cutting force, while the cutting speed had a more significant role in tool wear.
Similarly, the scientific work [26] had the purpose to optimize the machining parameters for CNC end milling of brass C26130 alloy using the Taguchi technique. Experimental results indicated that the combination of a spindle speed of 750 rpm, a feed rate of 20 mm/rev, and a depth of cut of 1 mm yielded the optimum level for minimizing surface roughness. Additionally, the combination of a spindle speed of 750 rpm, a feed rate of 60 mm/rev, and a depth of cut of 0.75 mm was identified as the optimum level for minimizing tool wear. Through ANOVA analysis, it was determined that the spindle speed and feed rate were the parameters with the greatest influence on both surface roughness and tool wear.
In [27], the authors optimized the process parameters for the end milling operation of hardened Custom 465 steel using a multi-response approach based on an orthogonal Taguchi matrix and Grey Relational Analysis.
The research paper [28] was dedicated to optimize the input parameters for computer numerical controlled milling of a polypropylene + 60 wt% quarry dust composite. The primary focus was to enhance the efficiency and profitability through the evaluation of the material removal rate. To attain this goal, the Taguchi technique was used to optimize the cutting speed, feed rate, and depth of cut while closely analyzing their impact on the material removal rate. The research findings revealed that the most effective milling parameters for maximizing productivity were a cutting speed of 600 rpm, a feed rate of 200 mm/min, and a depth of cut of 0.8 mm.
The objective of the present study is to investigate the impact of milling process parameters, namely n—milling drum rotation speed (rpm), vf—speed in the advance direction(m/min), and ap—milling depth(mm) on resultant cutting force R (acting on the milling teeth) and also on the chip section area A. To determine the optimal parameters for achieving desirable R (minimum) and A (maximum), DOE, analysis of variance (ANOVA) and Grey Relational Analysis (GRA) methods were applied. The flowchart of the performed analysis can be seen in Figure 2.
The values of cutting forces developed on both body and tooth tip were determined using DEM. Unlike previous studies, this article focuses specifically on the interaction between the active part of the tooth and the asphalt, which serves as the novelty element. Also, another aspect reflecting the novelty of the performed analysis is the technical-economical optimization based on a complex statistical approach. The practical applicability of this study’s findings extends to various aspects of the asphalt milling industry, including improved process efficiency, enhanced productivity, cost savings, and high-quality milling results. This study’s identification of the optimal process parameters makes a significant contribution to sustainable milling practices. The recommended parameters not only result in reduced energy consumption but also lead to improved tool life, resulting in cost savings and environmental benefits.

2. Materials and Methods

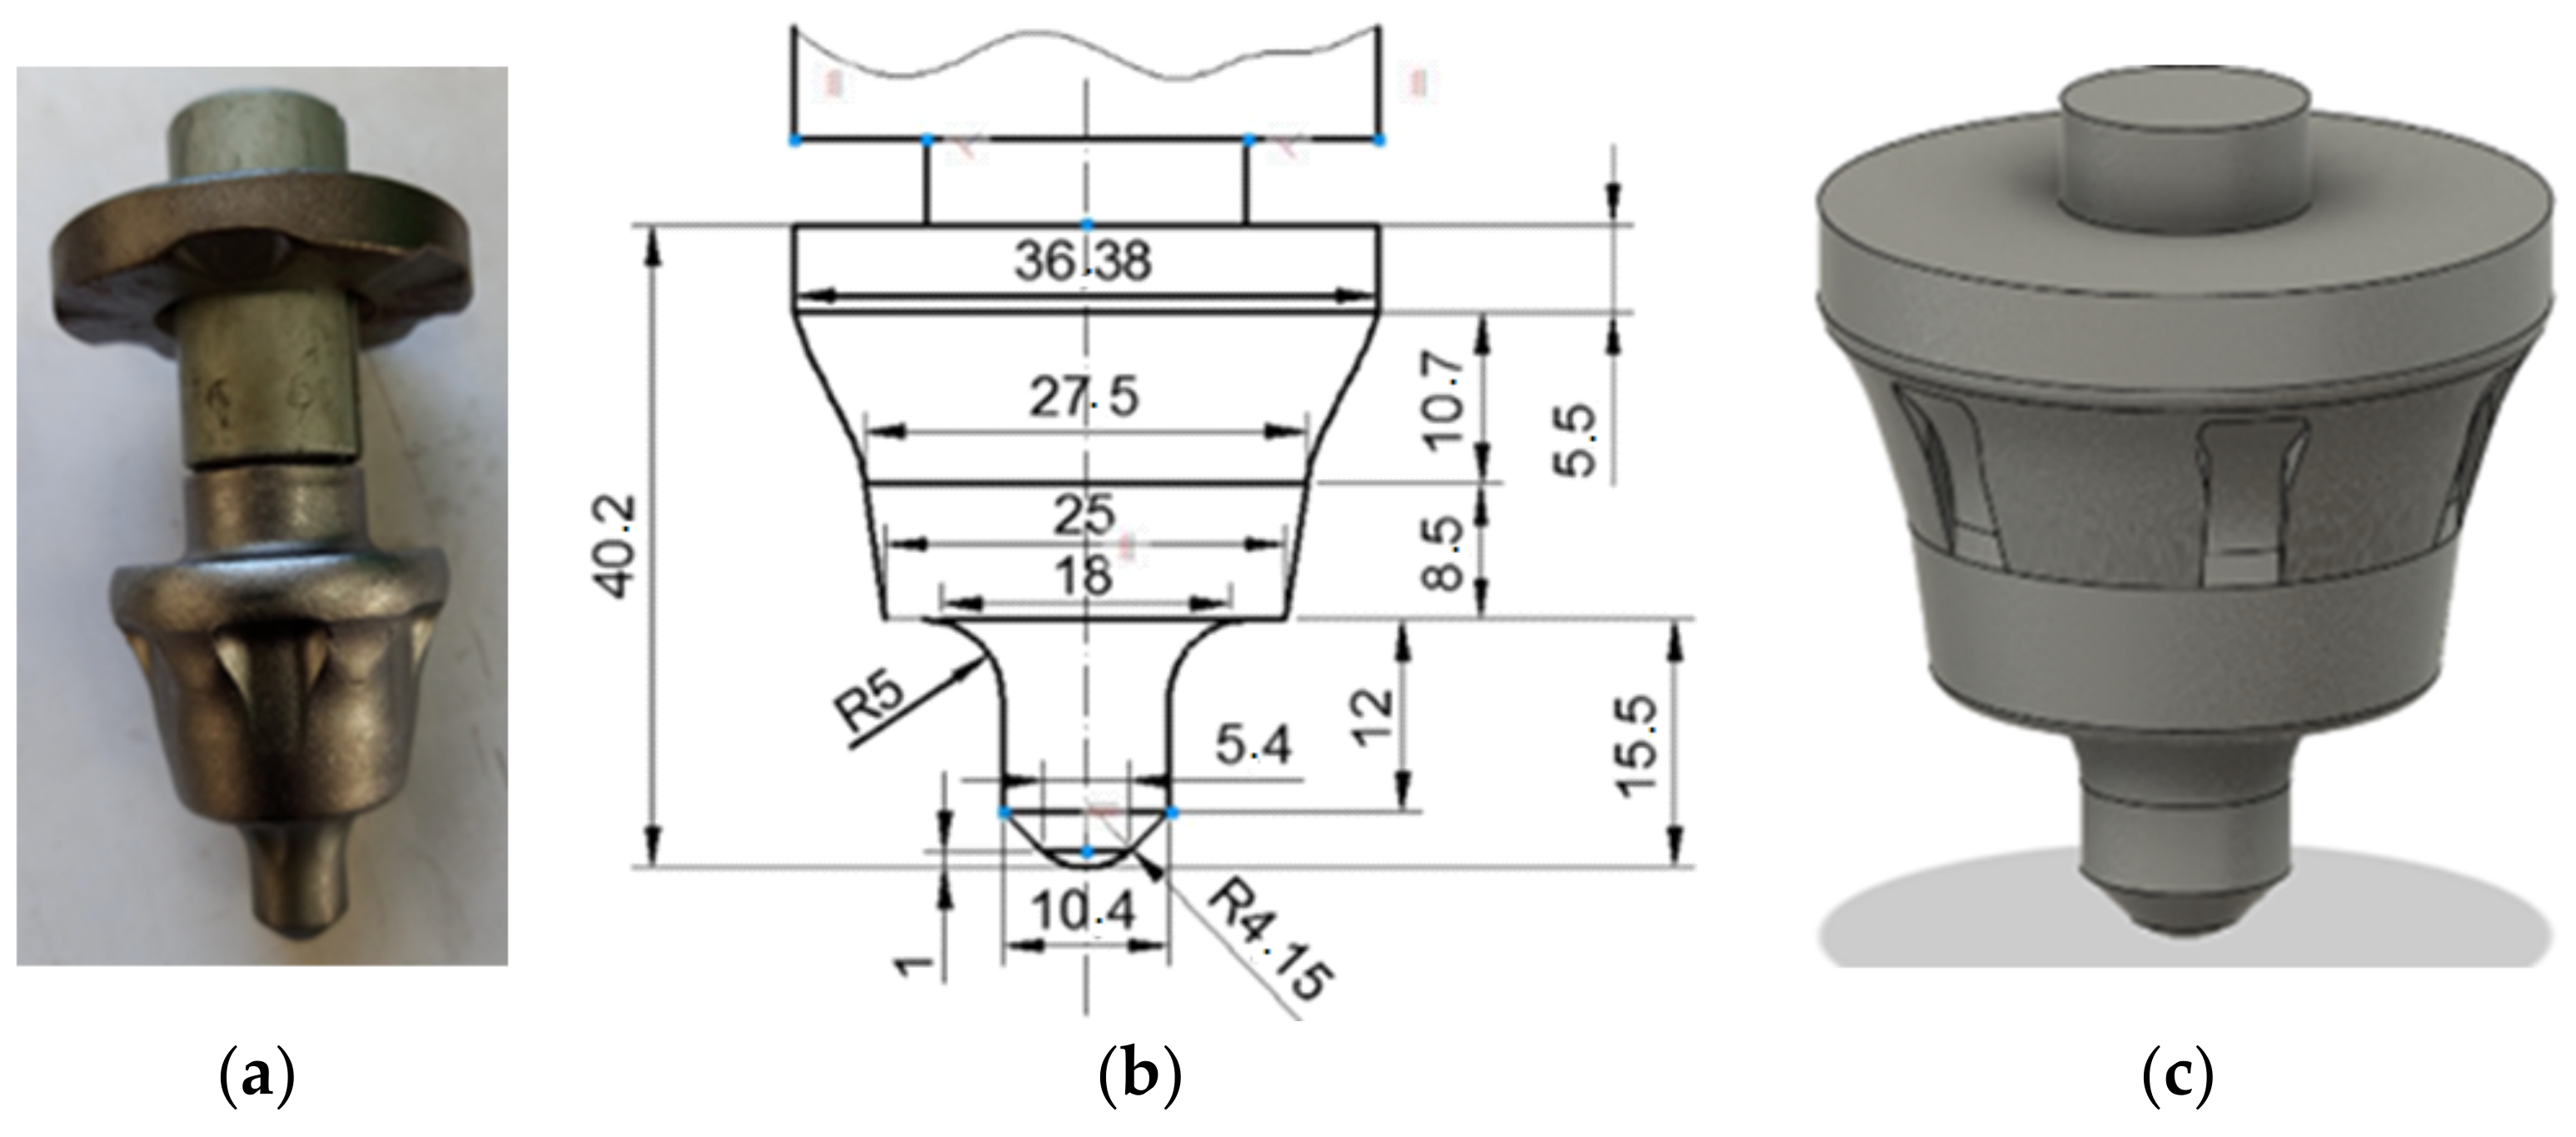
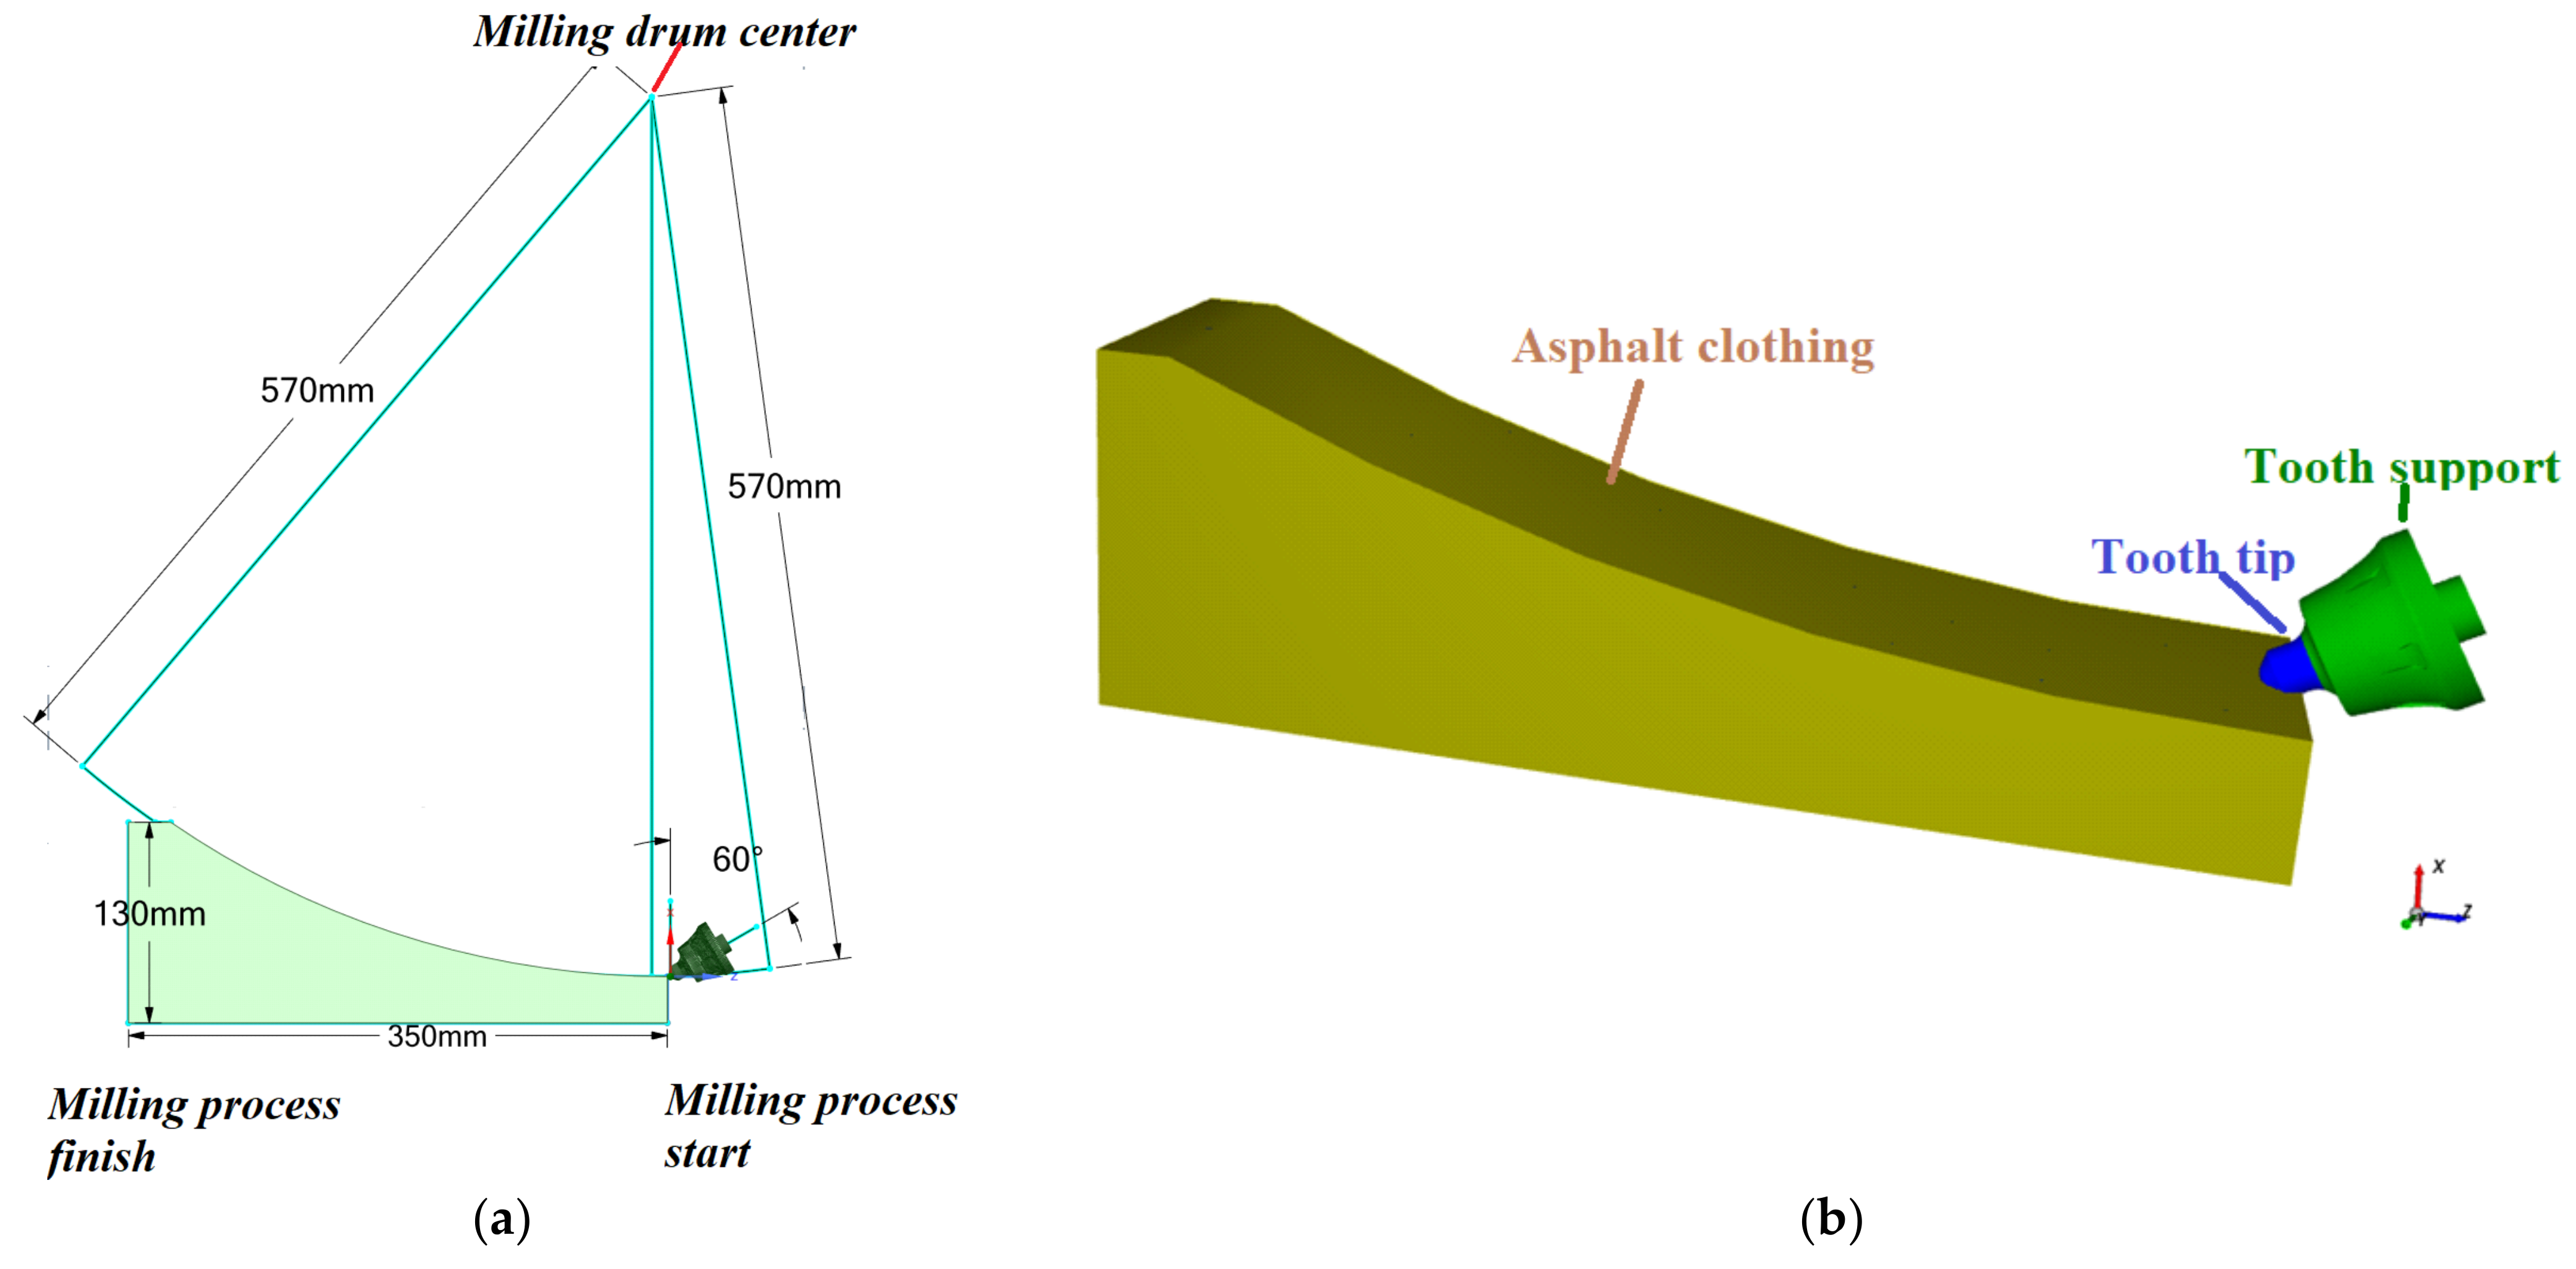
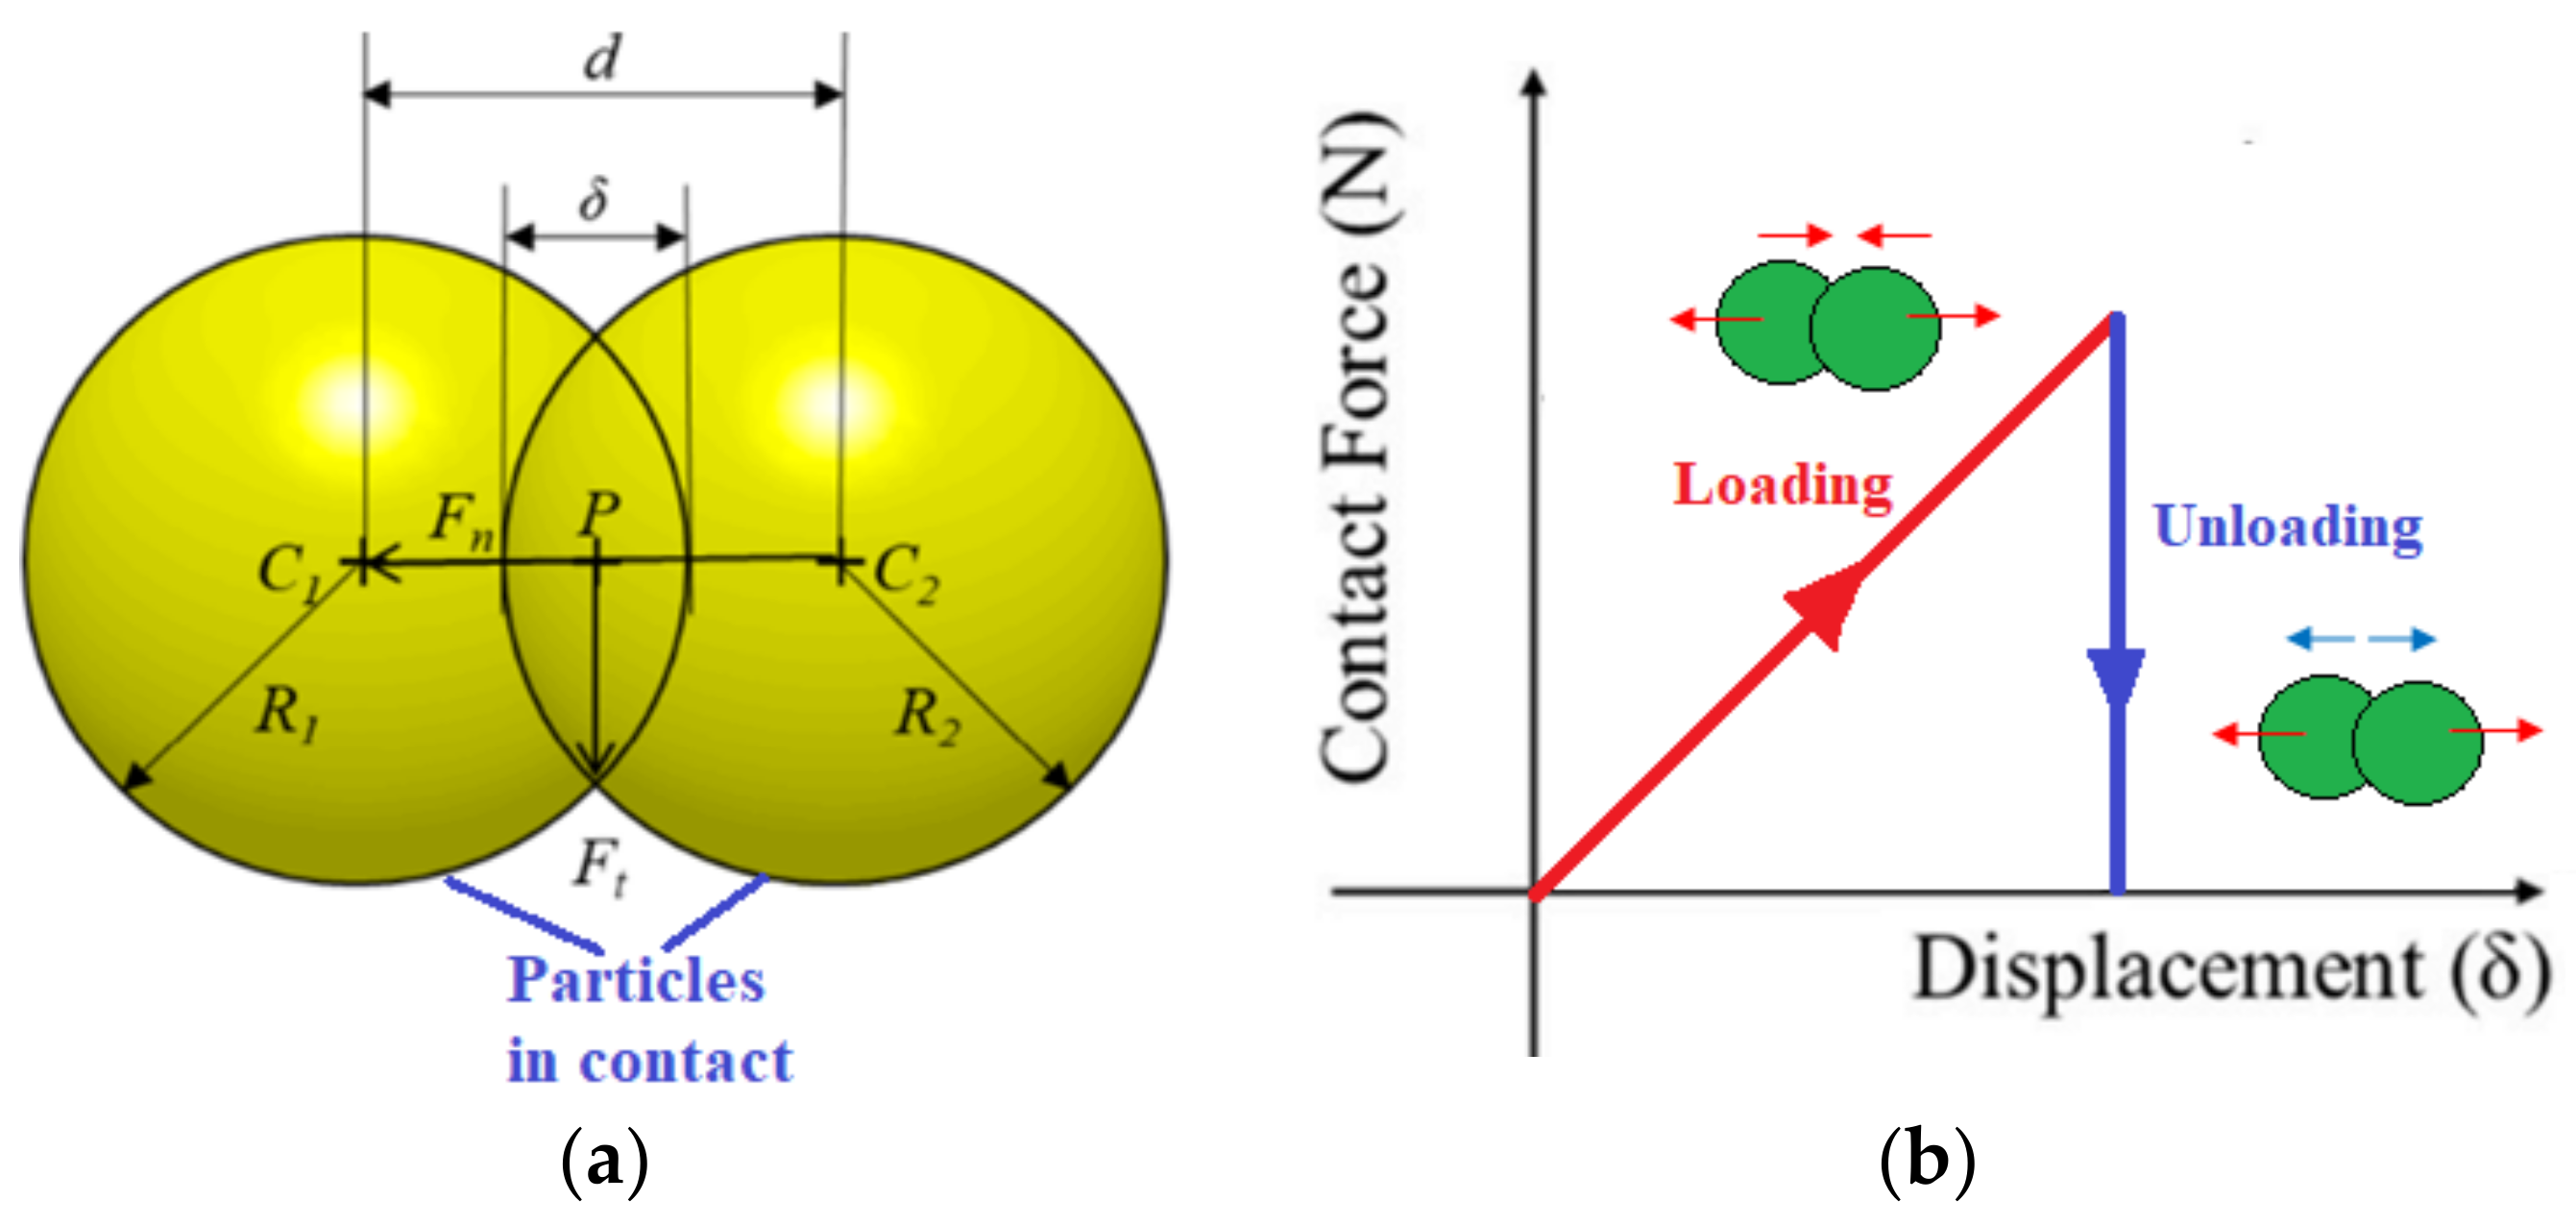
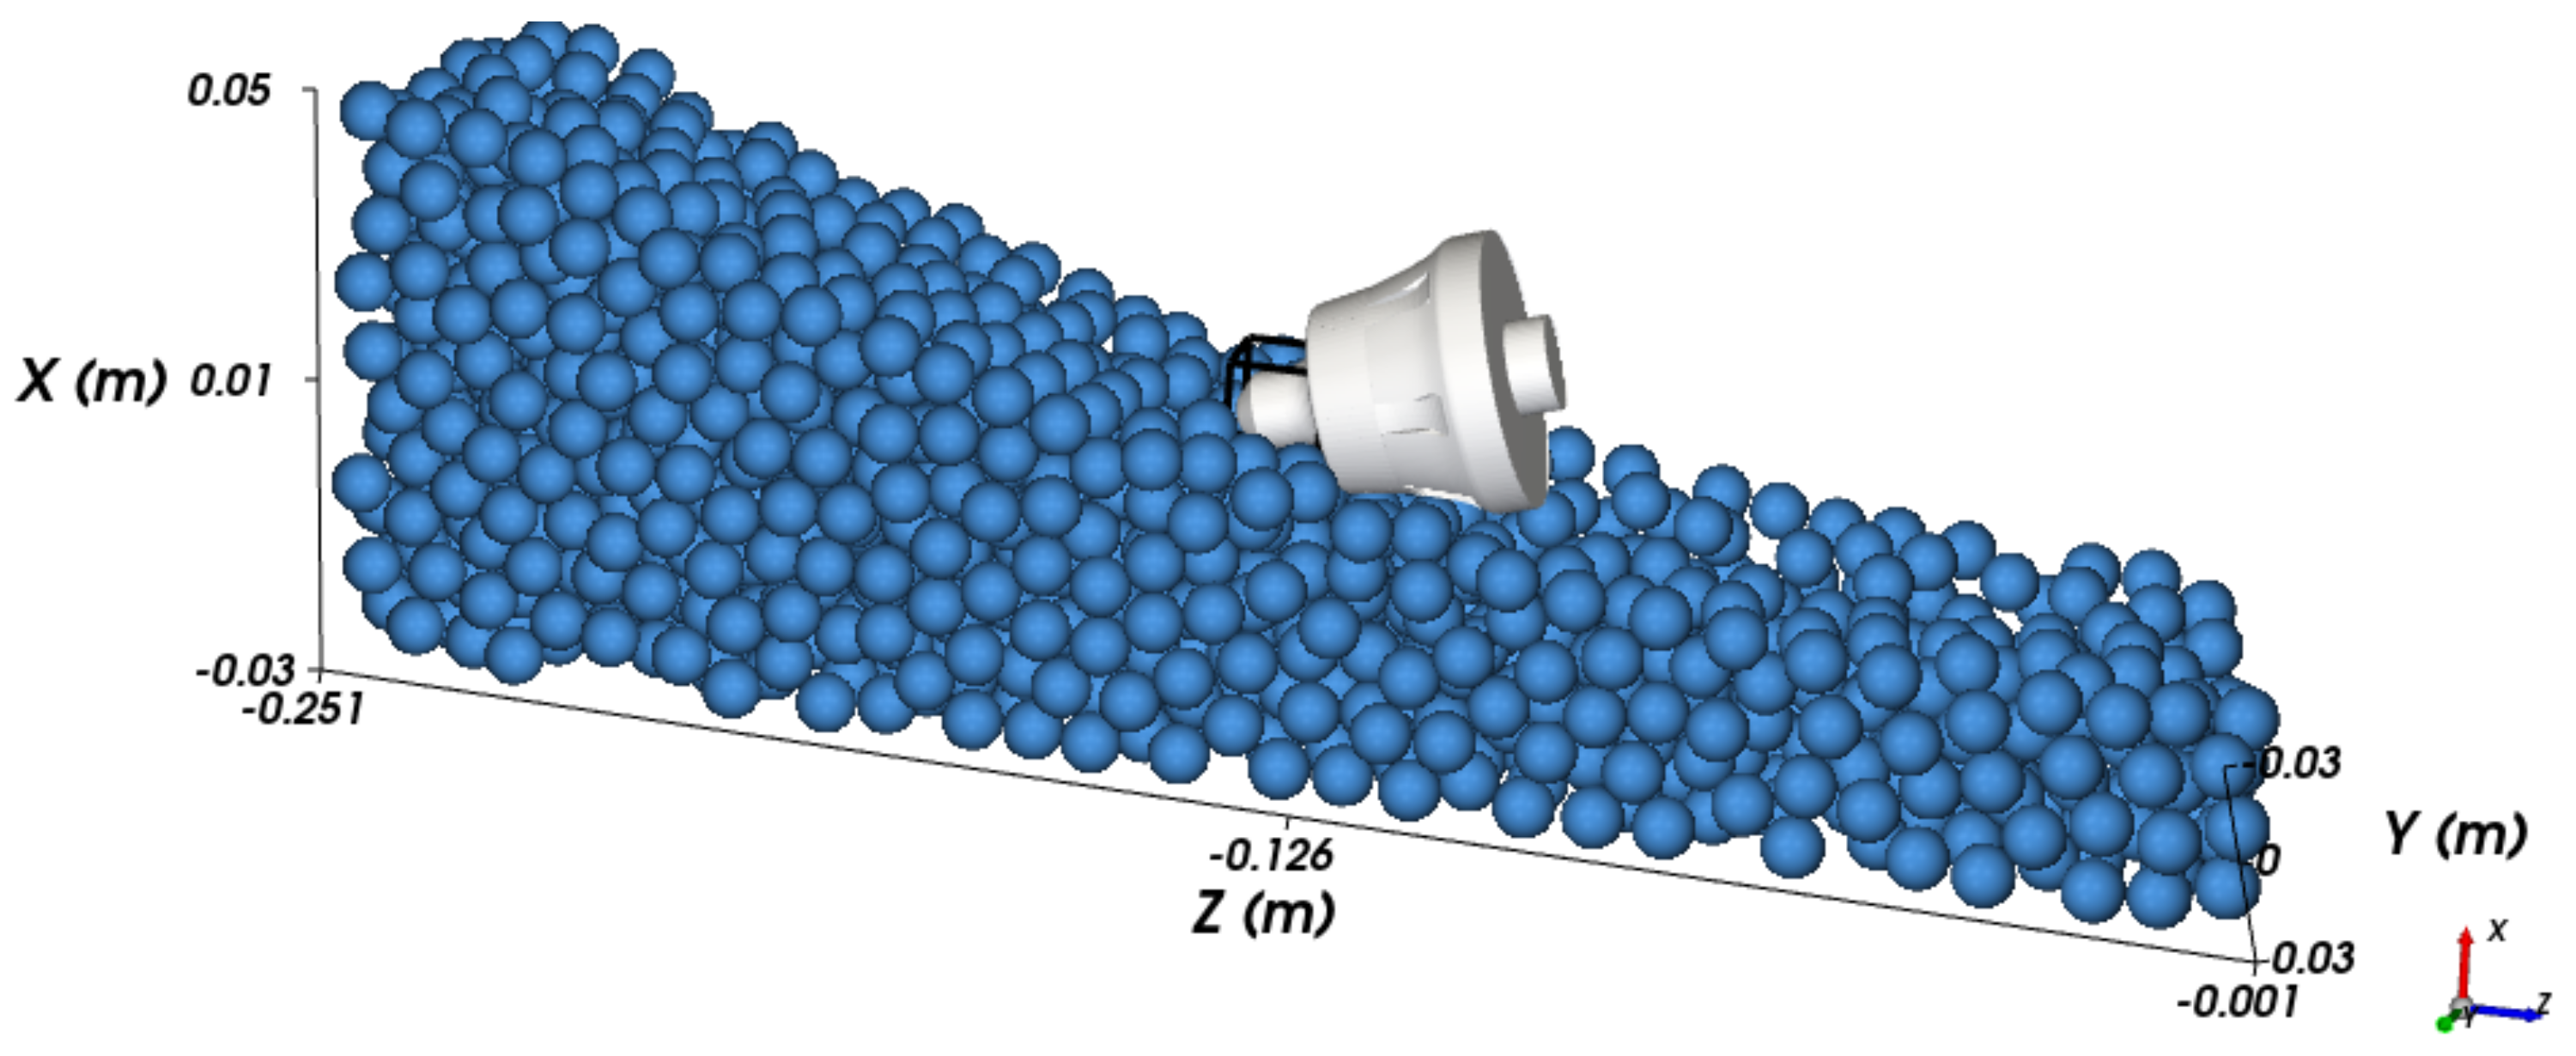
2.1. Discrete Element Simulation of Asphalt Milling Process

The interaction between the cutting tooth and asphalt pavement was simulated via the discrete element method using Rocky 2022 R2 version software. In order to reduce the computational time, spherical particles with 8 mm in diameter were used.
The geometrical models used for DEM simulations, both for tooth (Wirtgen type, see Figure 3) and asphalt clothing (see Figure 4) were obtained using the Space Claim software version 2021 R1.
The technological parameters involved in the numerical analysis are presented in Table 1.
Table 2 presents the elasto-mechanical characteristics of the materials used in DEM analysis [3].
The interaction between the aggregates (particles), filler/bitumen, and the milling drum is quantified using different coefficients (see Table 3), such as static friction coefficient and dynamic friction coefficient (for particle–particle and particle–tooth interactions), rolling coefficient (specific to particles), and restitution coefficient (specific to particles) [3,29,30]. In this study, a value of 0.3 was adopted as the restitution coefficient.
These coefficients are considered based on the experimental investigationand calibration simulations conducted in [31].
In DEM analyses, the contact forces (normal forces and tangential forces with respect to the contact plane) between particles play a crucial role and are initialized during the simulation. The contact plane is typically perpendicular to the line connecting the centers of the particles in contact, assuming the particles have a spherical shape. The normal contact forces primarily act as repulsive forces, facilitating the dissipation of a substantial amount of energy [3].
Hysteretic Linear Spring model was used in the present DEM analysis to represent the normal contact forces, as seen in Figure 5 (the normal contact force is denoted as Fn, while Ft represents the tangential contact force).
The extent of particle overlap during simulation can be determined as follows [3]:
δ = R1 + R2d
where R1 and R2 are the radii of the particles in contact, and d represents the distance between the centers of the particles (see Figure 5).
The normal contact is calculated as follows [3]:
F n = k 1 δ n ,                 δ n > 0 k 2 δ n δ n 0 ,         δ n < 0
where k1 is the line slope corresponding to the loading area and k2 is the line slope corresponding to the unloading area and δ n 0 is the distance over which particles can overlap during simulation in the discharge area when the contact force approaches zero.
Figure 6 presents the models that have been adopted in the DEM analysis for the contact forces.
The adhesion force has an important role in DEM modeling of the phenomena that occur at the dislocation of the asphalt concrete components (the mixture of aggregates and filler/bitumen in solid state) under the action of the milling tooth.
The model that has been implemented considering various factors, including the particles masses (m1 and m2), the gravitational acceleration (g), the distance over which particles can overlap during simulation (δ), and the adhesion distance dadhes which was initially introduced into the model.
The adhesion force F a d h e s i o n has the following expression [3]:
F a d h e s i o n = 0 ,   δ d a d h e s f a d h e s · g · m i n m 1 , m 2 ,   δ n < d a d h e s
where
-
f a d h e s represents a percentage value that indicates the proportion of the adhesion force between particles in relation to their weight (a value of 1 indicates that the adhesion force between particles is equal to the weight of the particles) [3];
-
d a d h e s is the initial distance between the particles (before coming in contact), expressed in mm.
In the performed numerical simulation, it was considered that f a d e z = 0.5…0.7 and d a d e z = 0.1 mm.
The adhesion force effectively quantifies the binder present in the mixture of aggregates and filler/bitumen in a solid state, representing the cohesive forces within the mixture that contribute to its overall integrity.

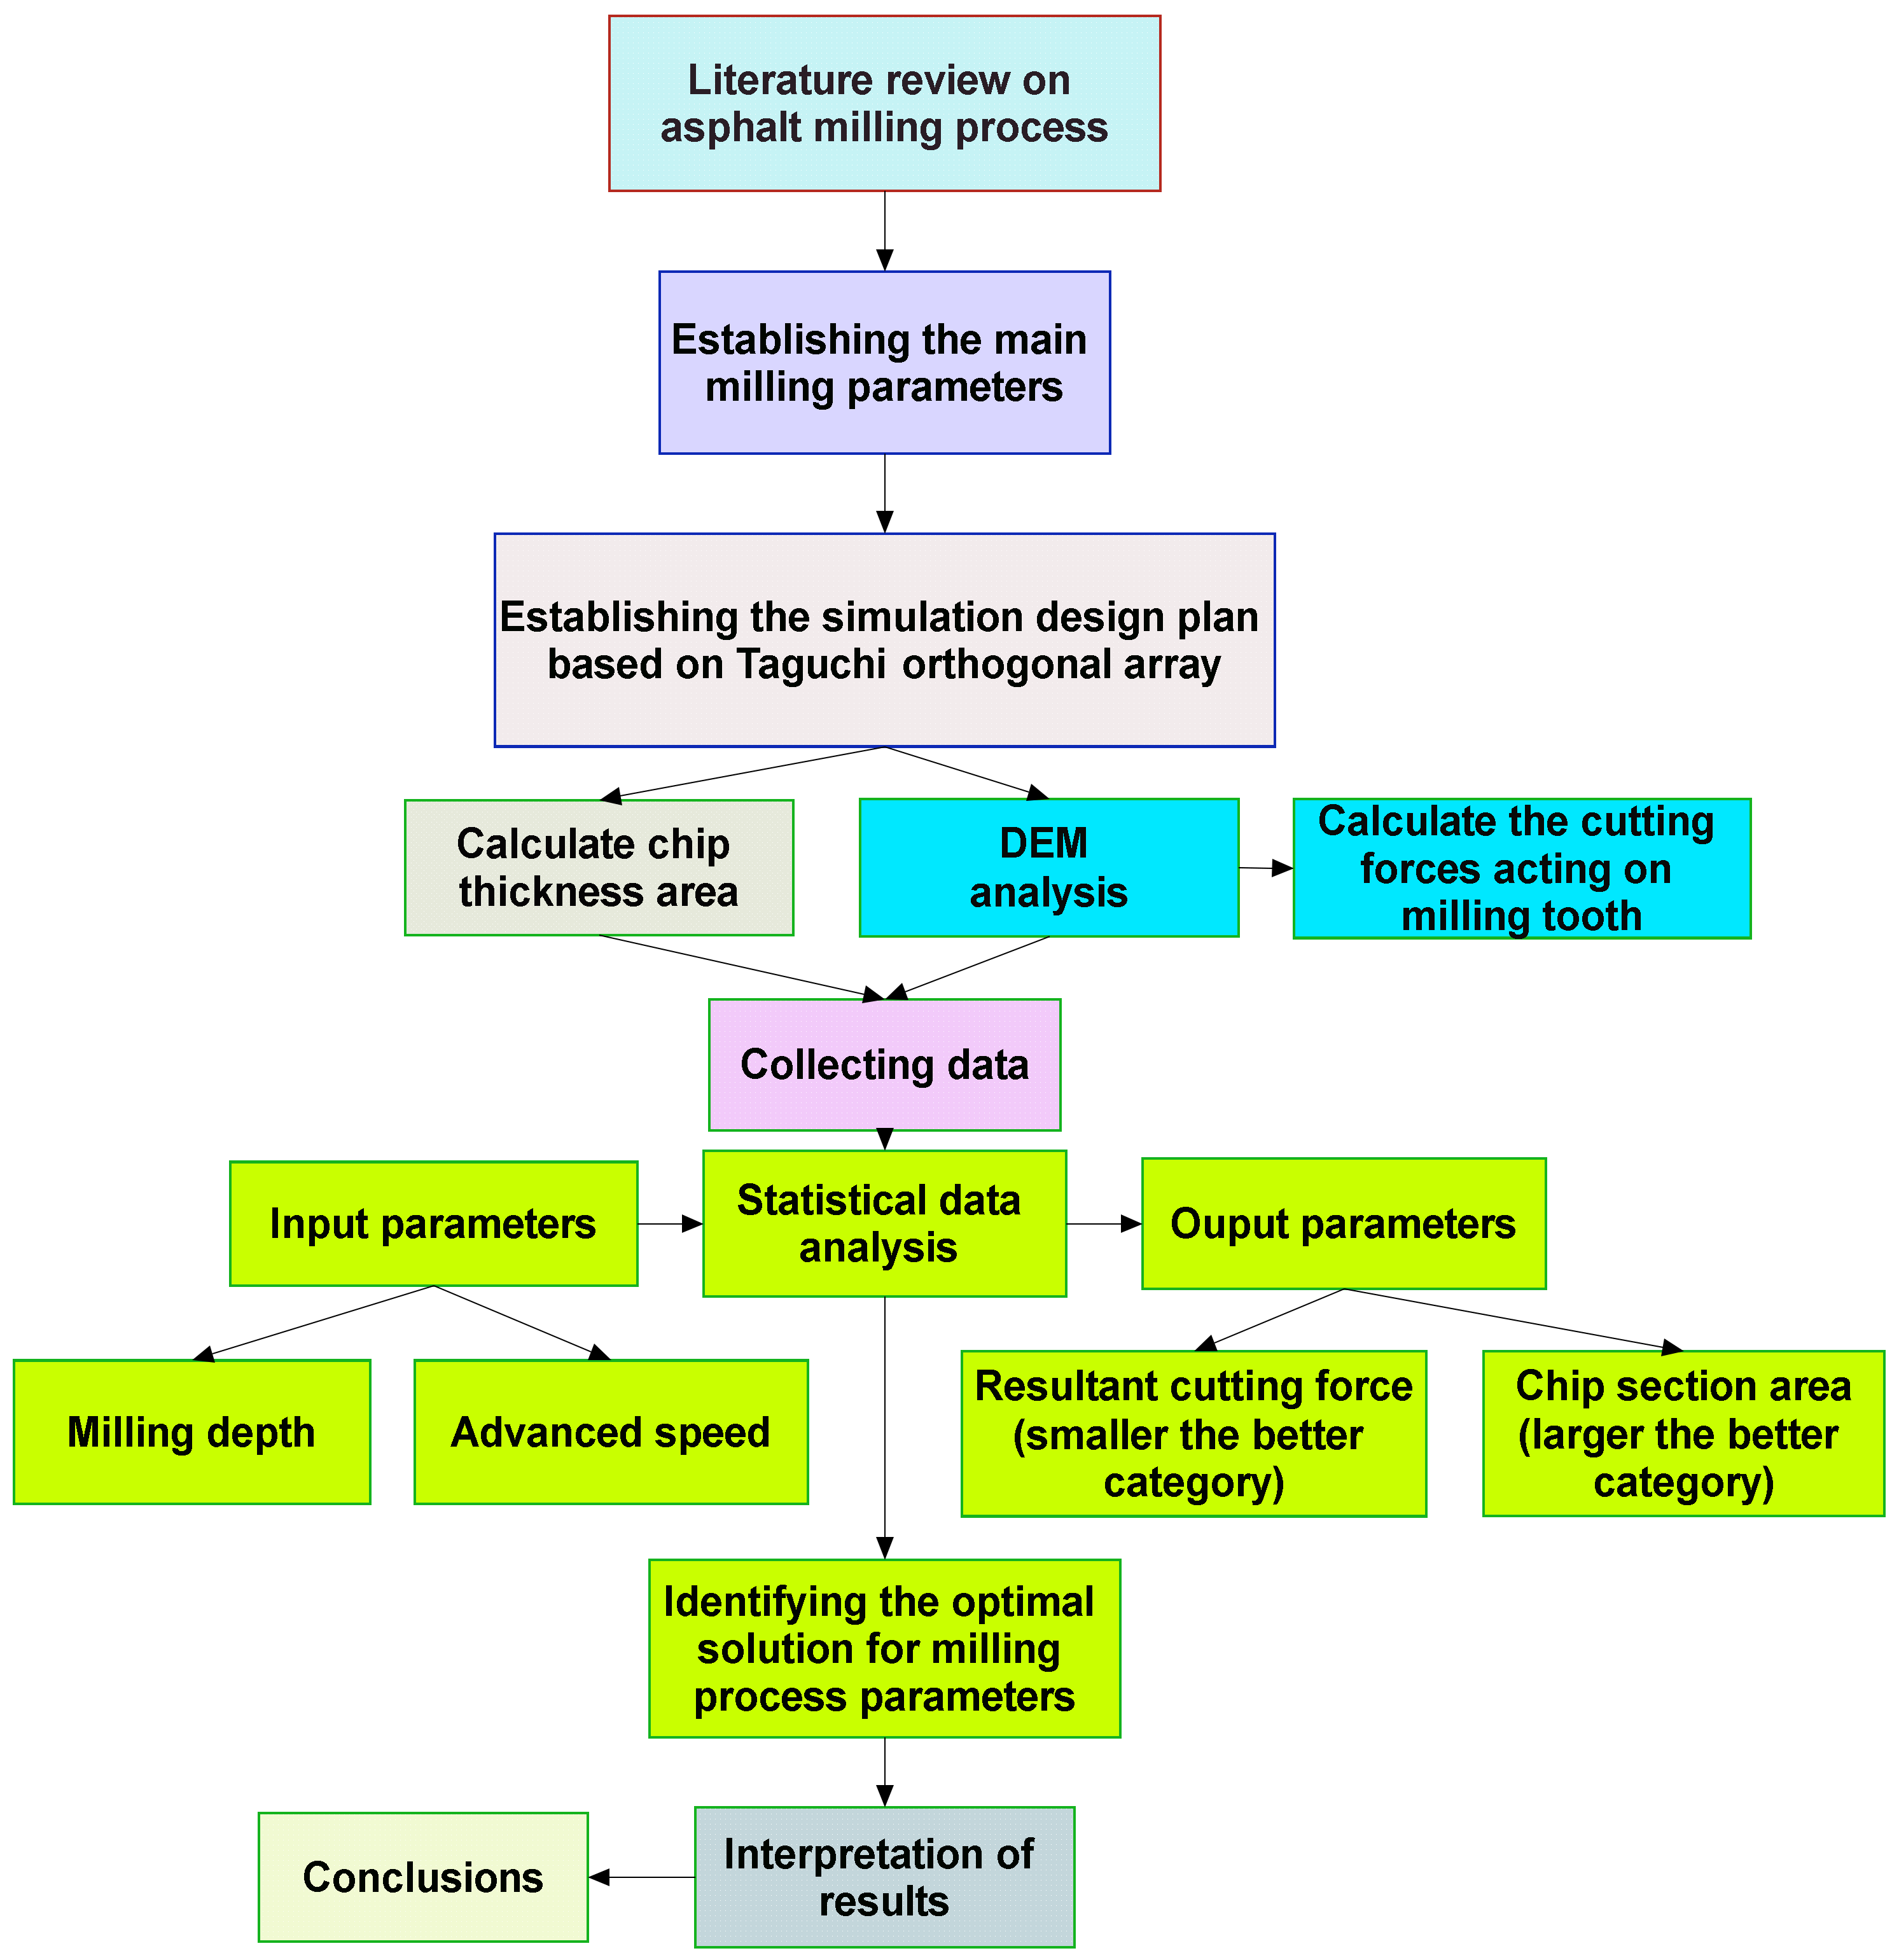
2.2. Optimization Methodology

Full factorial design method using Minitab 17 version software was used to analyze the influence of milling parameters (milling depth and advanced speed) on the cutting forces and chip section areas. Therefore, in the investigation, two input parameters with three levels were introduced, as presented in Table 4.
It therefore resulted in the number of simulations necessary for the DOE analysis as 32 = 9 (taking into account that there are two input factors and three levels).
Grey Relational Analysis was implemented to determine the optimal combination of independent variables that results in the lowest value for cutting forces and greatest value for chip. For smaller-is-better option, the data are normalized using the formula [27,32]:
x i j = max ( y i j ) y i j max ( y i j ) min ( y i j )
where yij are the data points and xij are the resulting normalized data.
For larger-is-better option, the data are normalized using the following formula [32]:
x i j = y i j min ( y i j ) max ( y i j ) min ( y i j )  
The normalized data points are transformed to a deviation sequence Δ 0 i ( k ) by scaling them between 0 and 1, applying the following equation [27,32]:
Δ 0 i ( k ) = x 0 ( k ) Δ x i ( k )
where x 0 ( k ) represents the reference value and x i ( k ) represents the set of normalized data points. In this case, the reference value is fixed at 1.
The Grey Relational Coefficient ε i ( k ) is calculated as follows:
ε i ( k ) = Δ min + ( ψ Δ max ) Δ i j + ( ψ Δ max )
In (7), Δmin and Δmax represent the minimum and the maximum values obtained for the deviation sequence responses, respectively. Each data point in the deviation sequence is denoted as Δij. In this particular study, a distinguishing coefficient ψ of 0.5 was used. The minimum deviation, Δmin, has a value of 0, while the maximum deviation, Δmax, has a value of 1.
For each experiment, the Grey Relational Grade (GRG) γ i is computed as a function of Grey Relational Coefficients ε i ( k ) and number of response variables n, with the following formula:
γ i = i = 1 n ε i ( k ) n
The optimal process parameter levels can be determined by evaluating the signal-to-noise (S/N) ratio in GRA, based on the Taguchi method. The principle of Taguchi’s “larger is better” approach is used to obtain the best possible parameters for multi-response optimization with the objective to maximize the GRG values.
The S/N ratio for “larger is better” criterion is calculated with the following formula [33,33,34]:
S / N = 10 log 1 n i = 1 n 1 y i 2
The S/N ratio for “smaller is better” criterion is calculated with the following formula [33,33,34]:
S / N = 10 log 1 n i = 1 n y i 2
where yi are the measured data and n is the number of measurements.

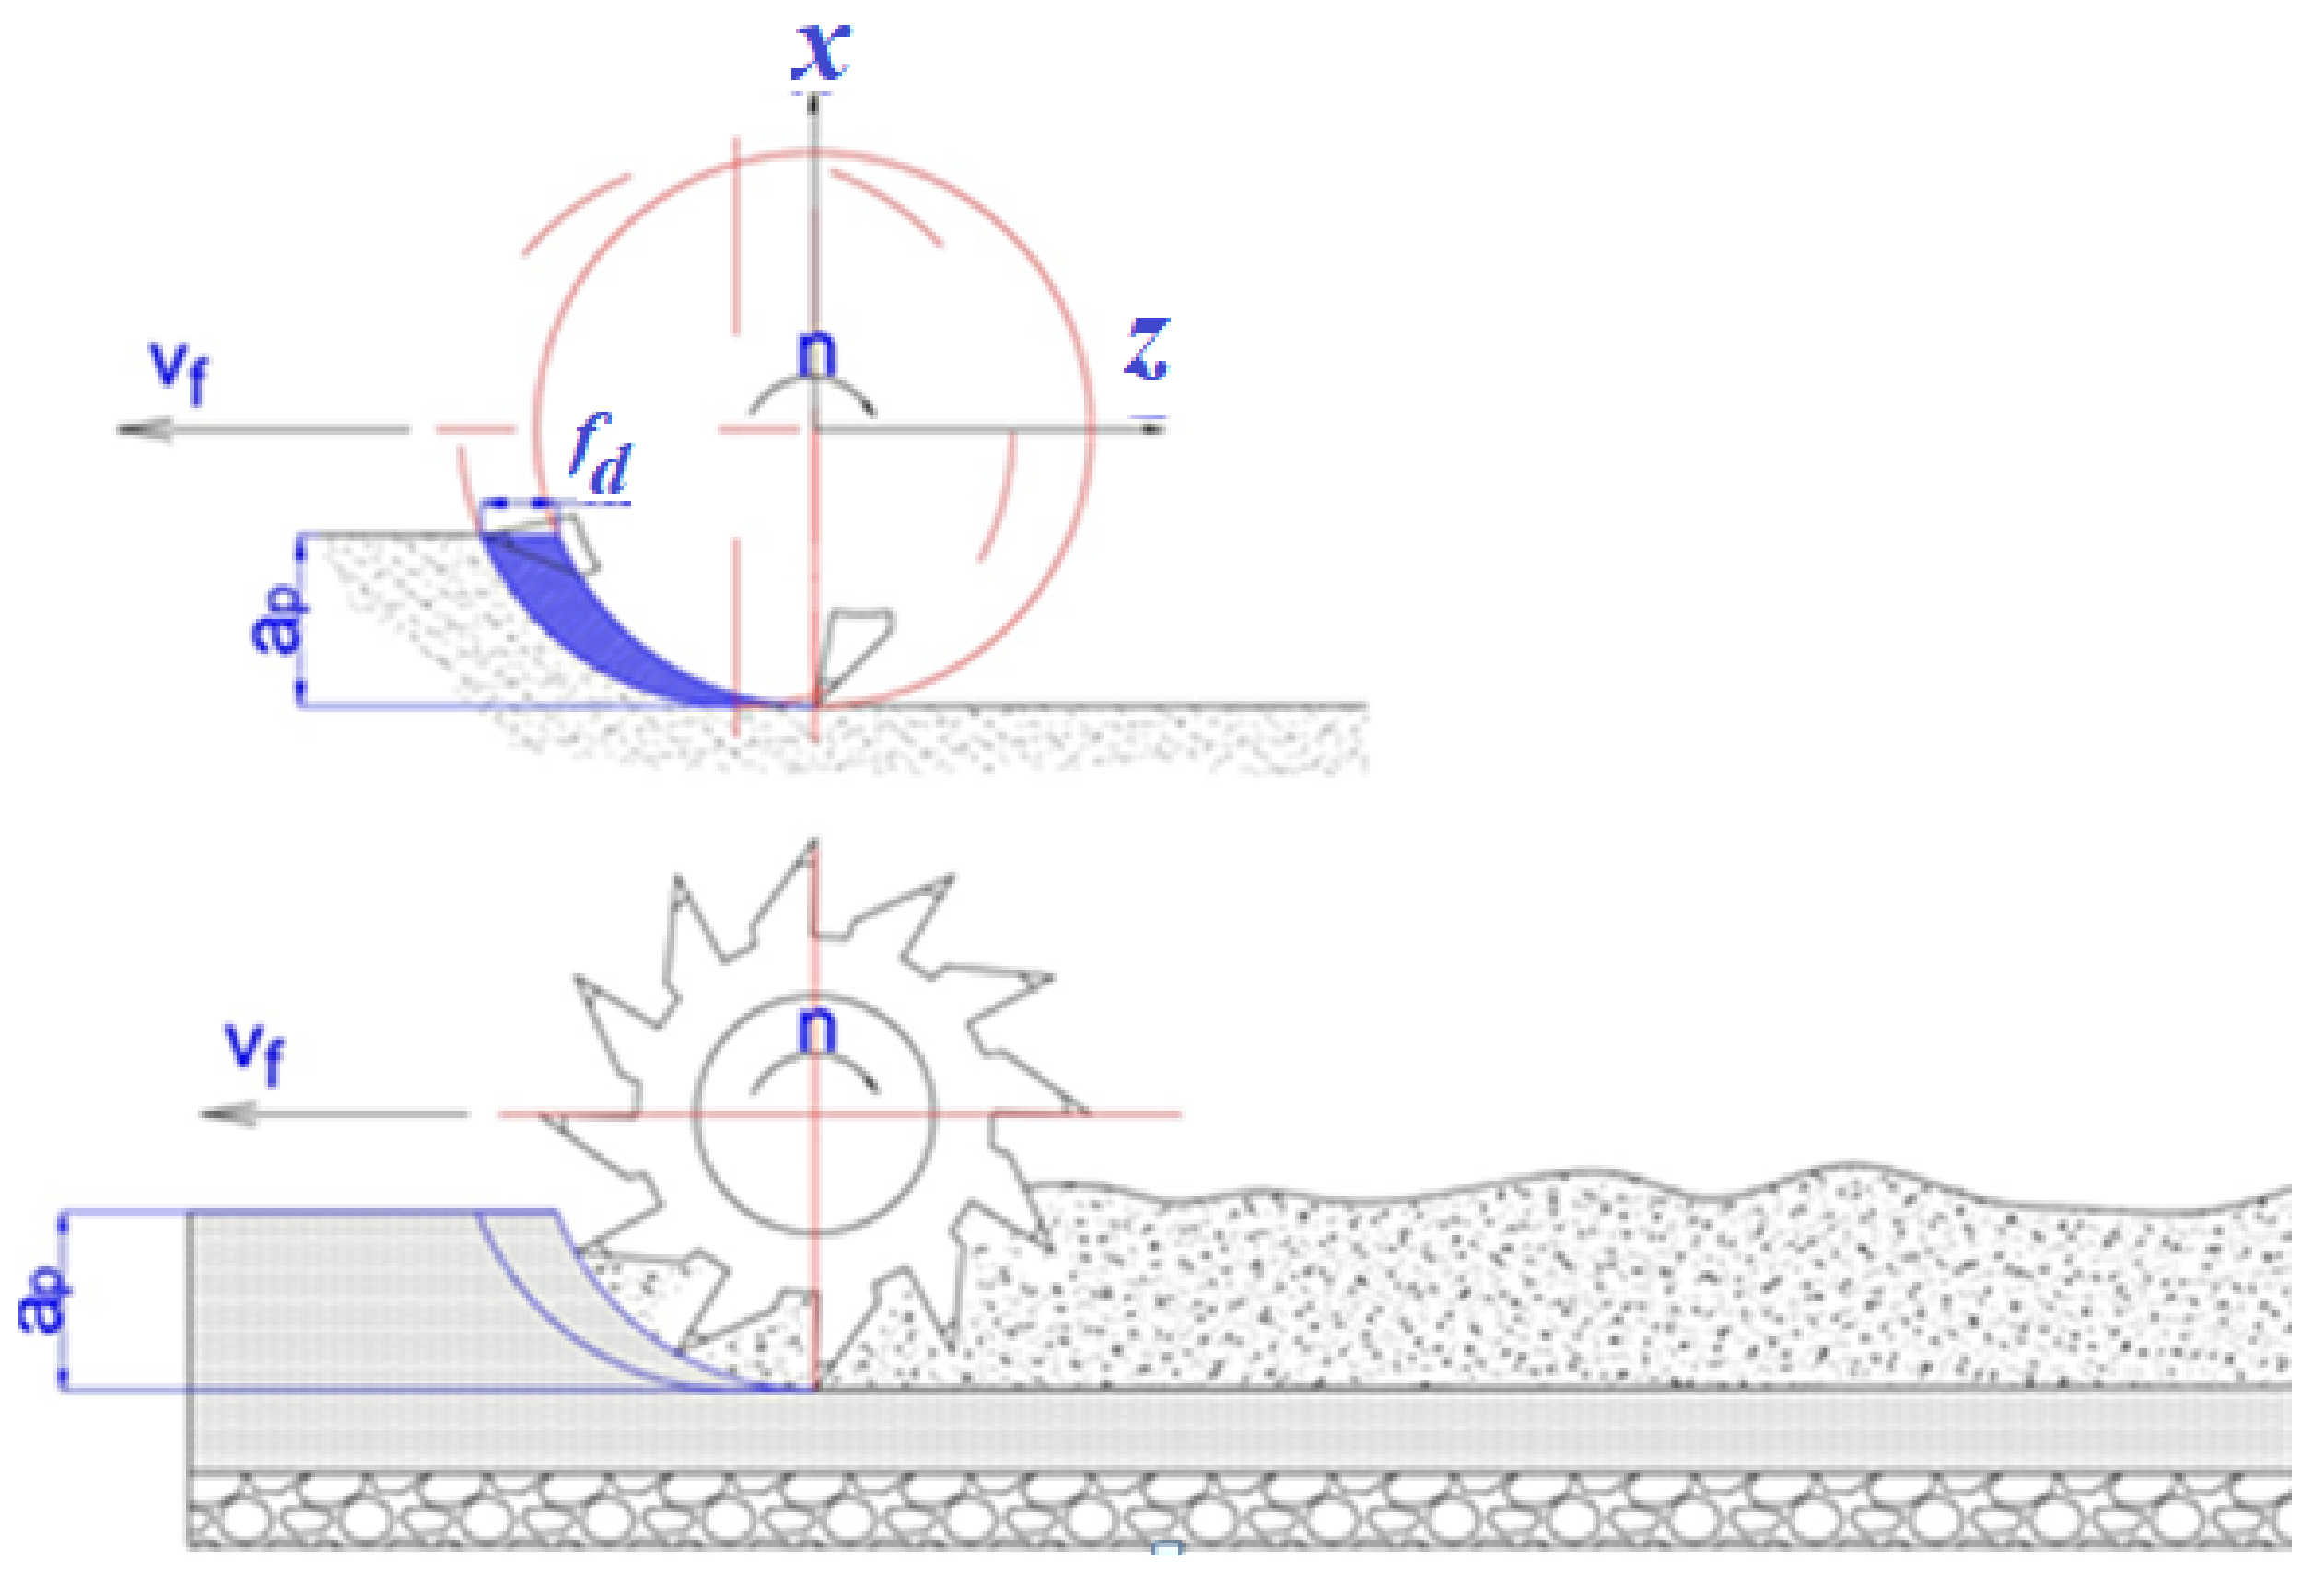
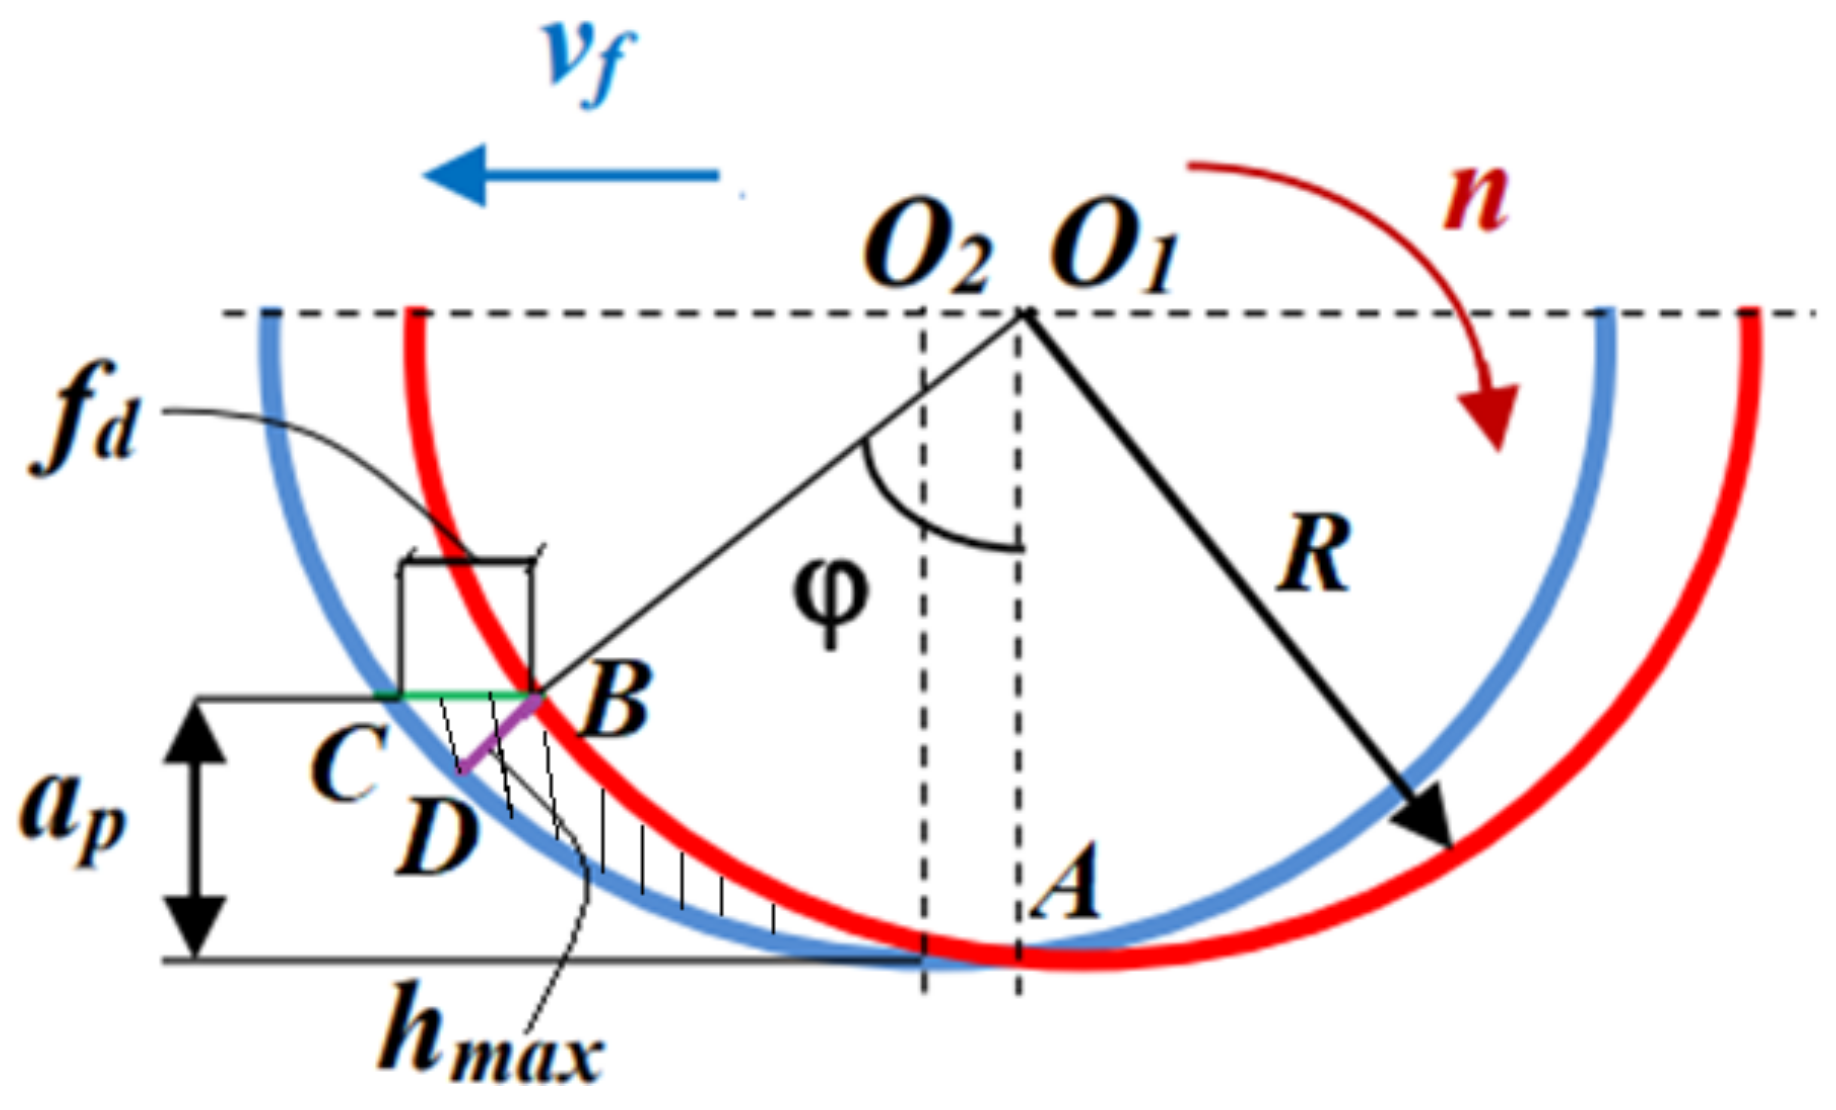
2.3. Cutting Condition in Milling Process

The thickness of the chip displaced by the tooth (the segment BDFigure 7) is variable and depends on the instantaneous position of the tooth, reaching the maximum value for the contact angle φ.
The contact angle φ is formed by the radii that determine the entry and exit of the teeth from the material and is determined with the following expression:
φ = arccos R a p R
where R is drum radius [mm] and ap is milling depth [mm].
The maximum chip thickness (segment length BD) (Figure 7) is as follows [35]:
hmax = BD = fd·sinφ
where fd is the feed rate in mm/tooth and can be calculated as follows:
fd = vf/(n·z)
z is the number of teeth from a dislocation line.
The dislocation line represents the circle determined by a section perpendicular to the cutter axis.
It is obtained with the following formula:
h max = v f z R n 2 R a p a p 2
The contact length (the length of segment AB) is as follows:
l = AB = R·φ
The chip section area A, is determined with the following formula:
A = h max l = h max R φ
It can be considered that the efficiency of the milling process can be appreciated by referring to the chip section detached during processing by each individual tooth.
Also, the milling resistance is proportional to the chip section. For simplification, we considered that the milling resistance is proportional to the chip thickness. In these conditions, the maximum value of the total milling resistance on the tooth is proportional to the maximum chip thickness. Thus, to an acceptable first approximation, we considered the maximum values of the total milling resistance per tooth to be obtained by relating the values of the maximum milling resistance obtained as a result of DEM simulation (for a single tooth) to the number of teeth located on the same dislocation line.

3. Results and Discussion

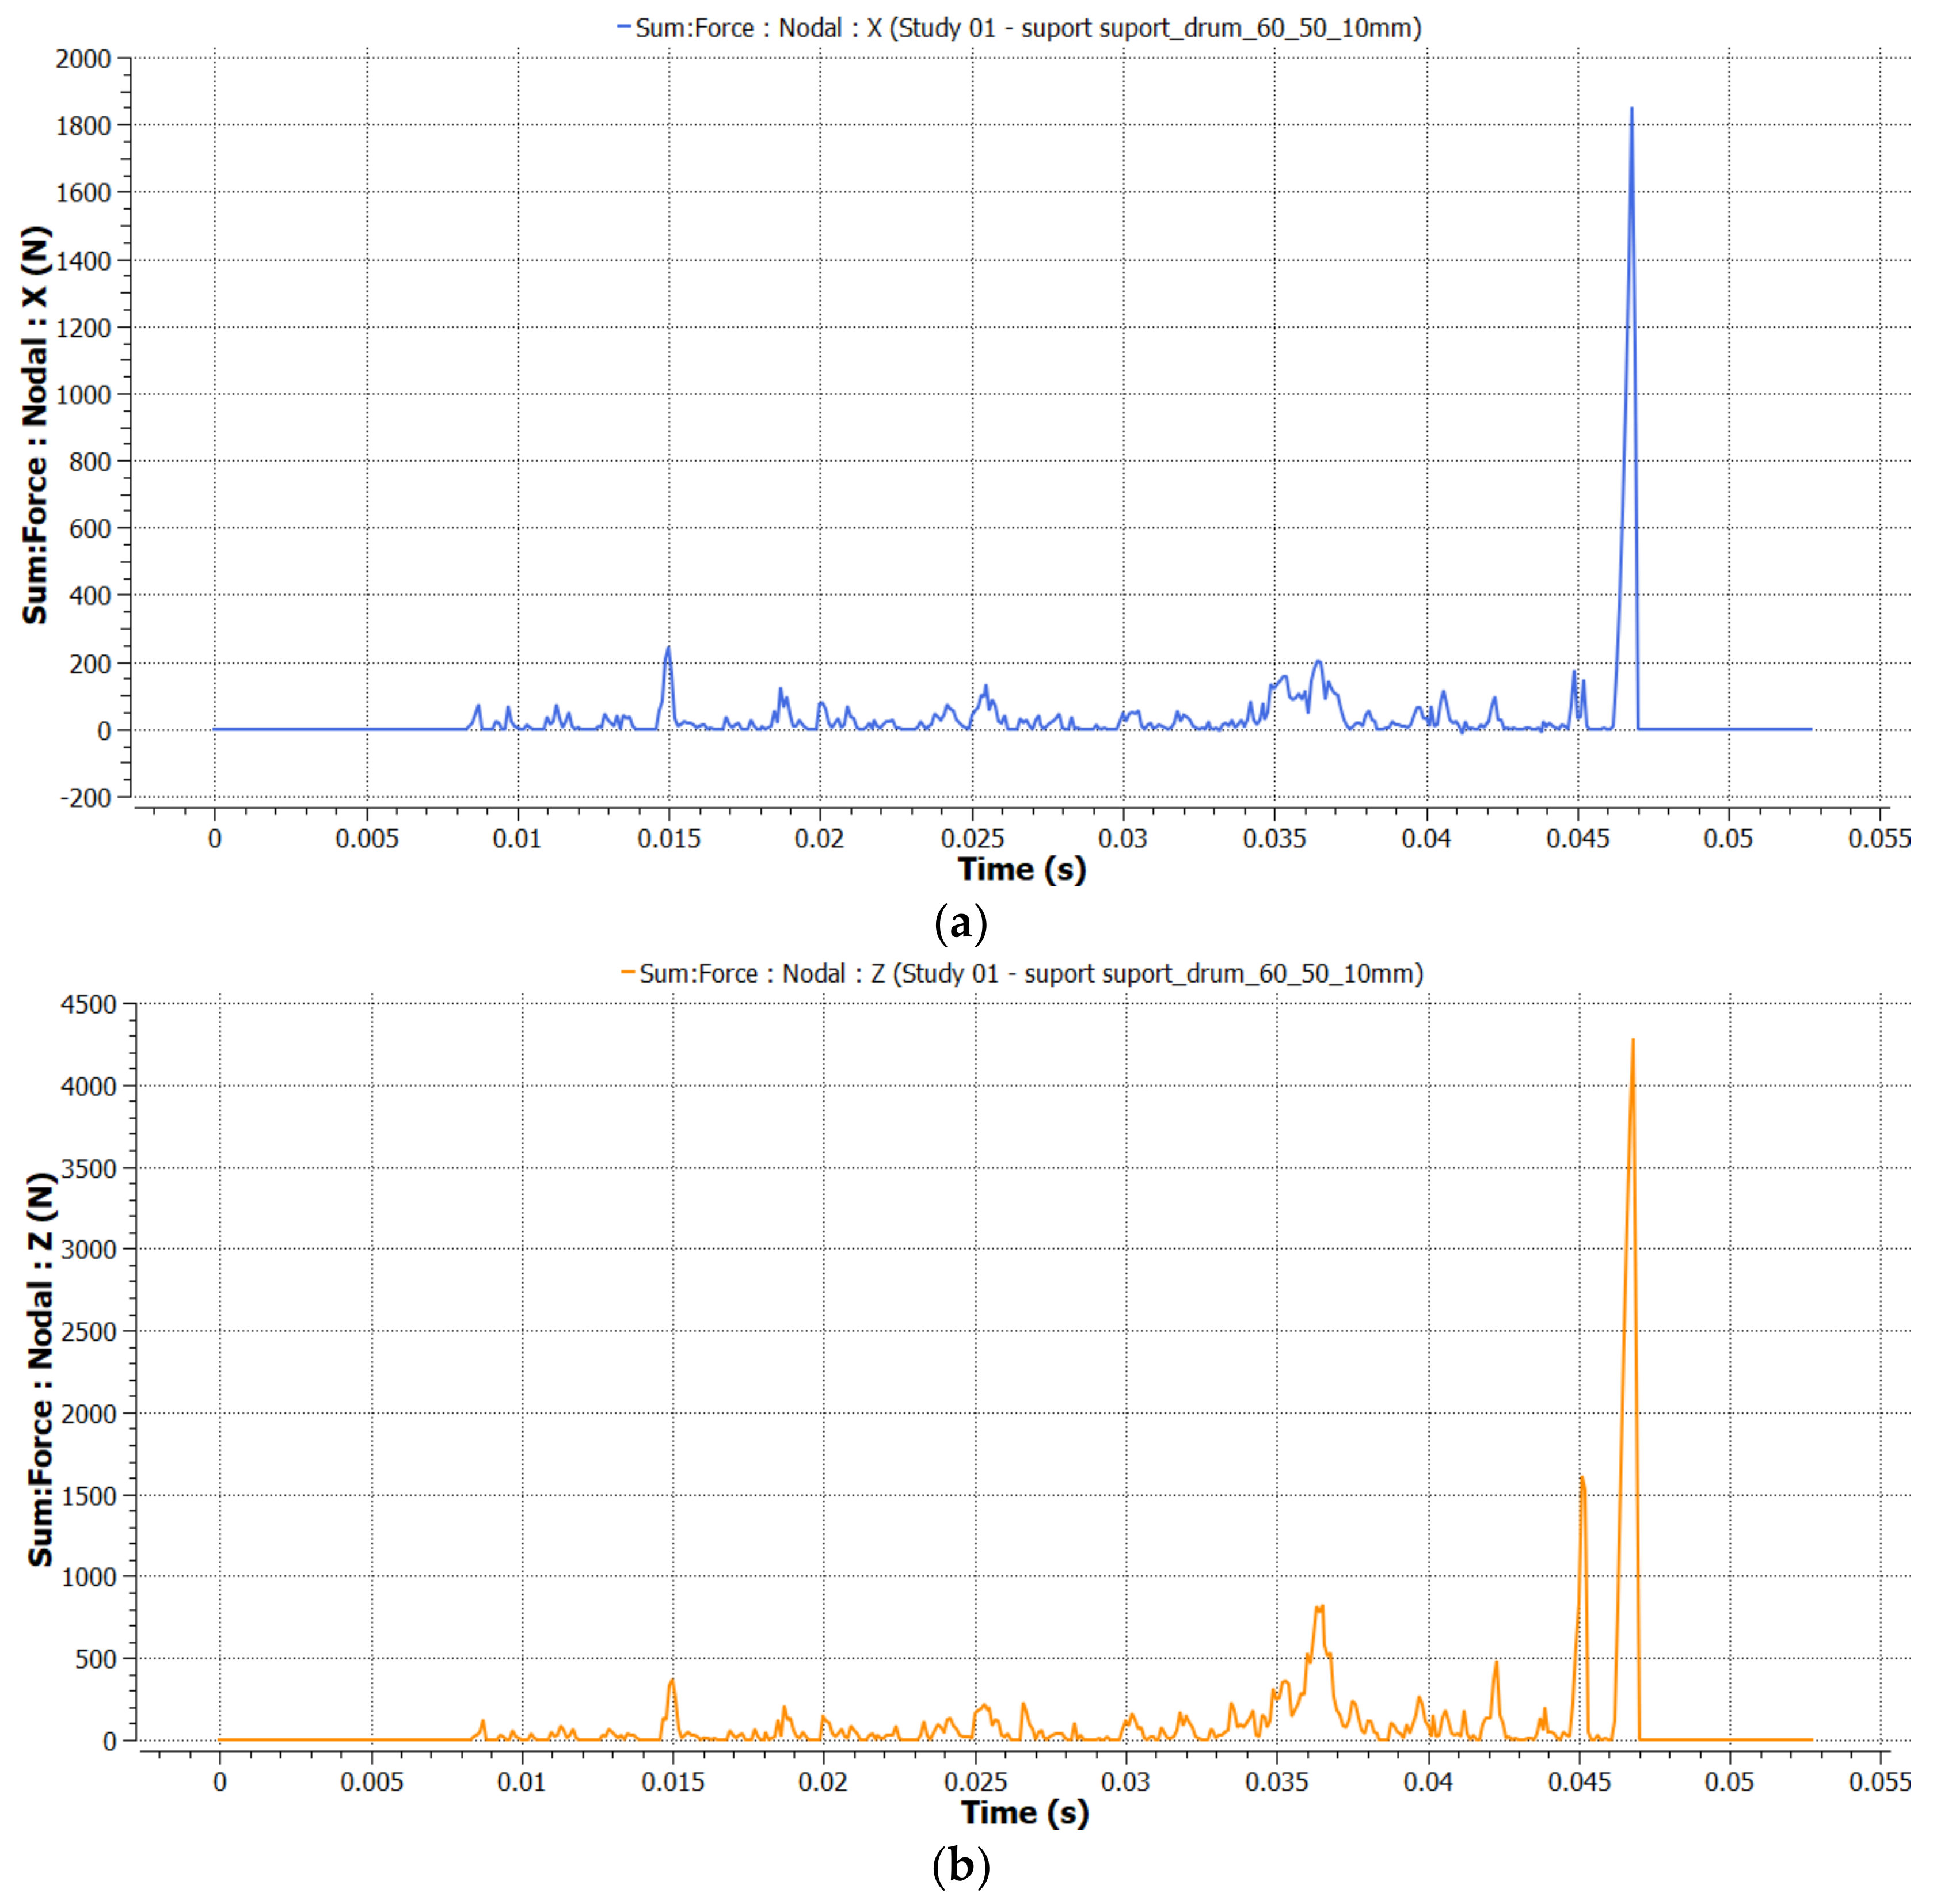
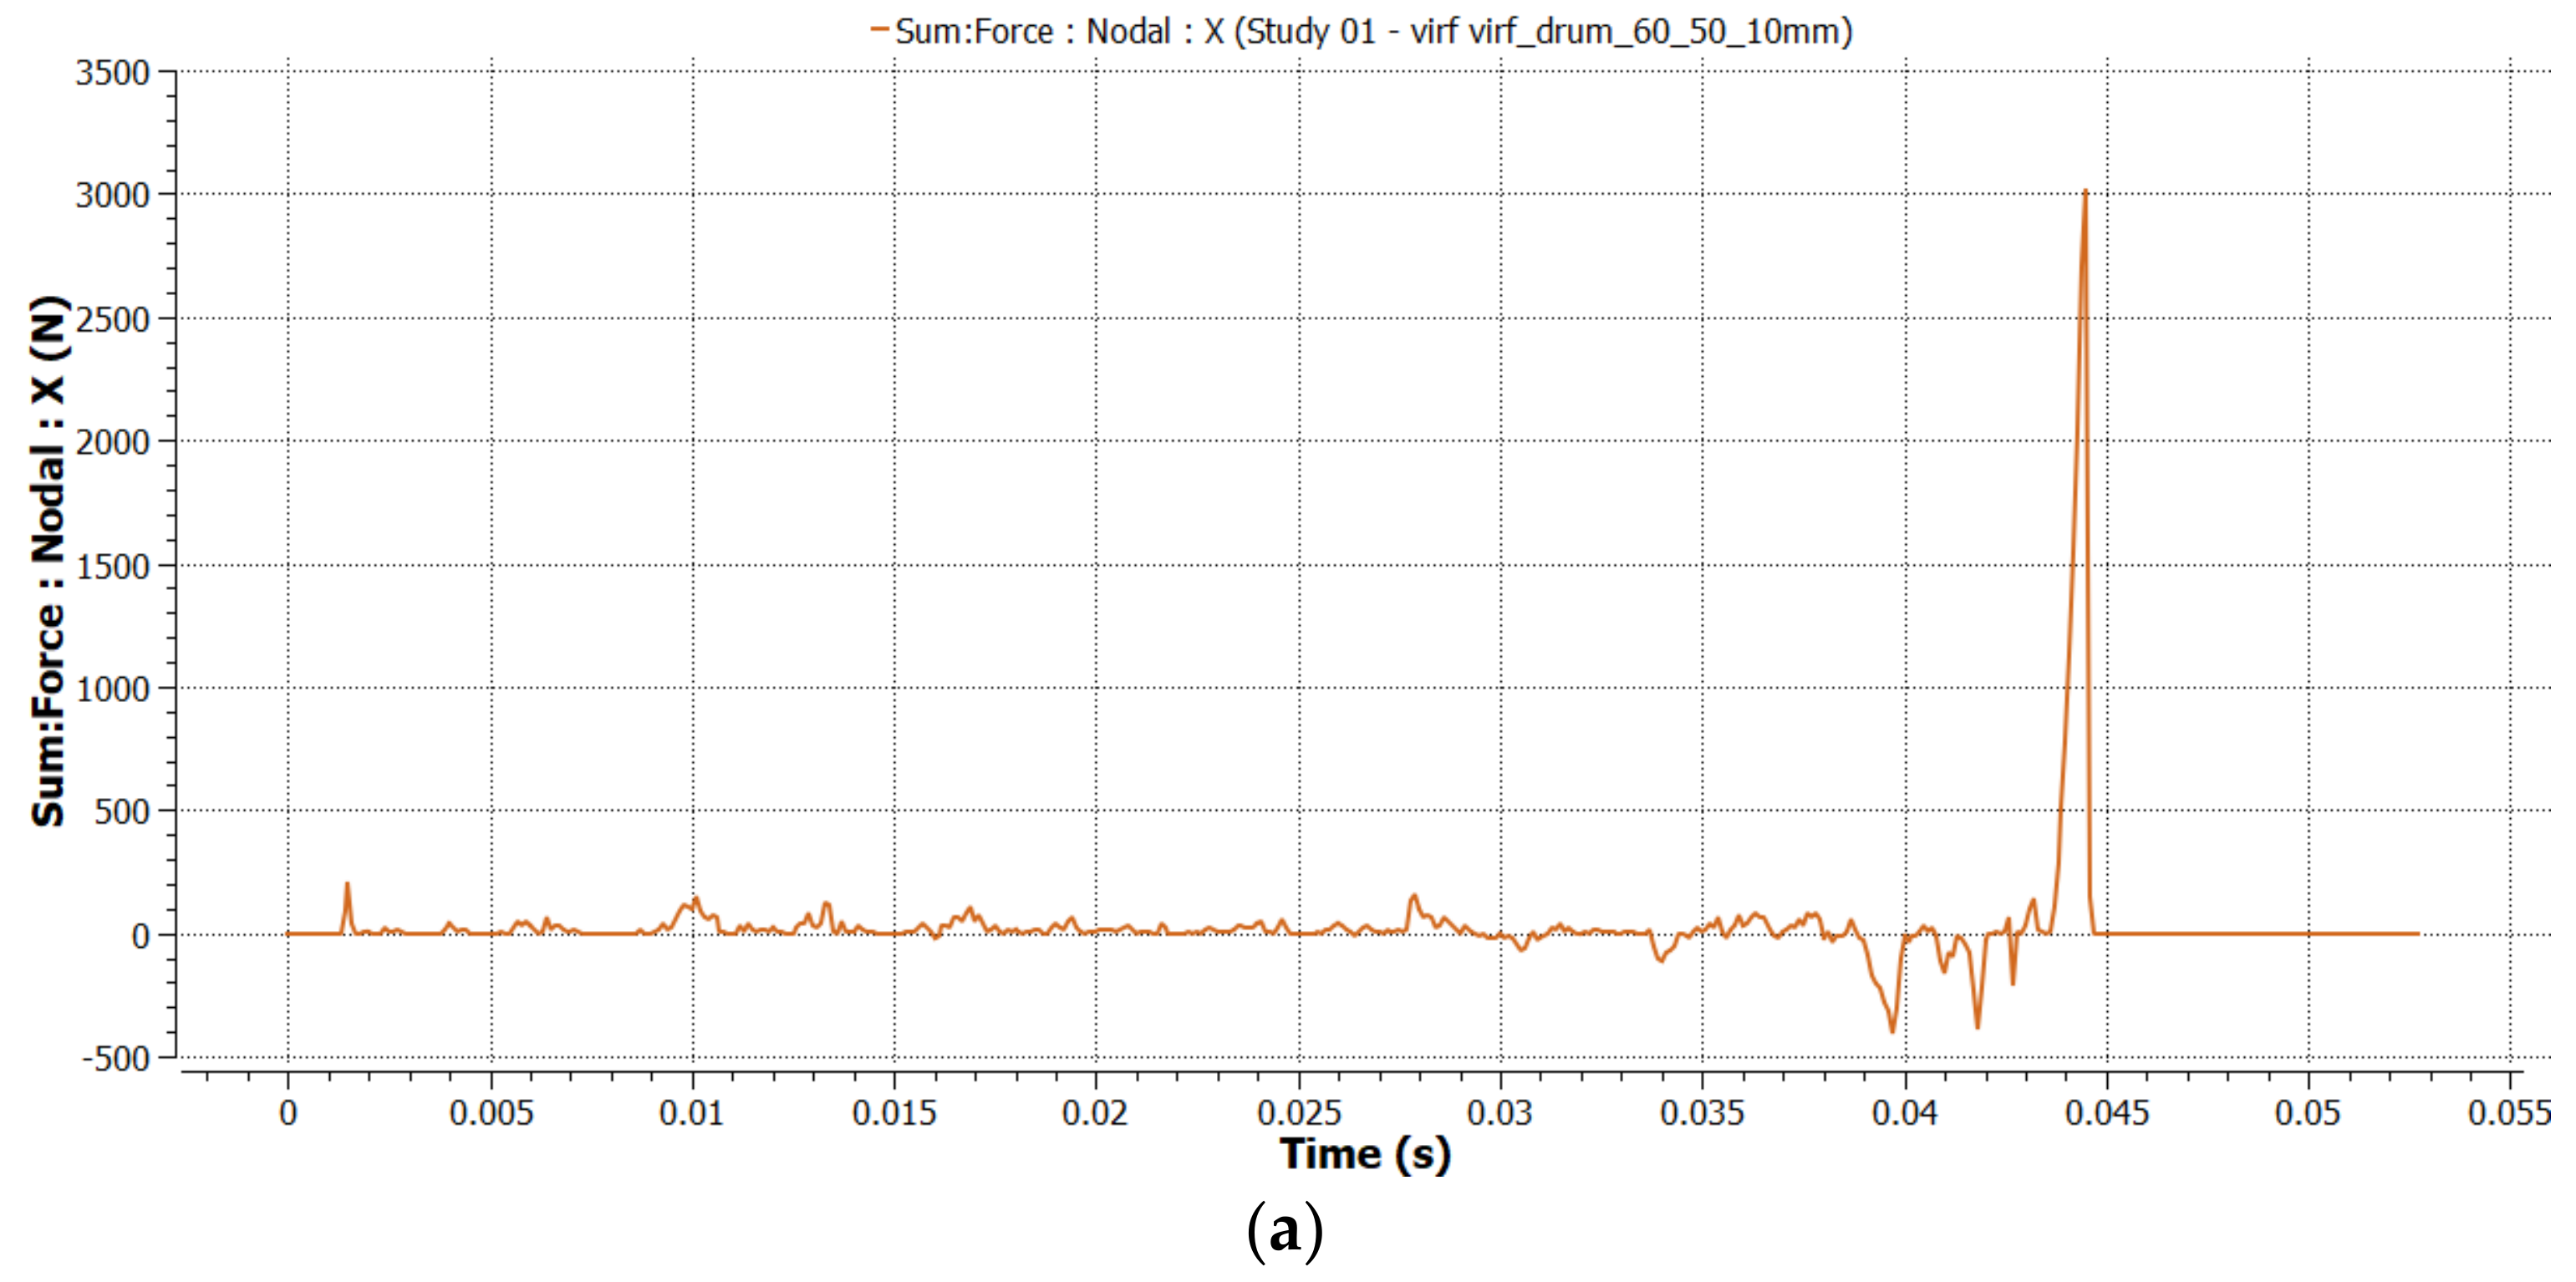
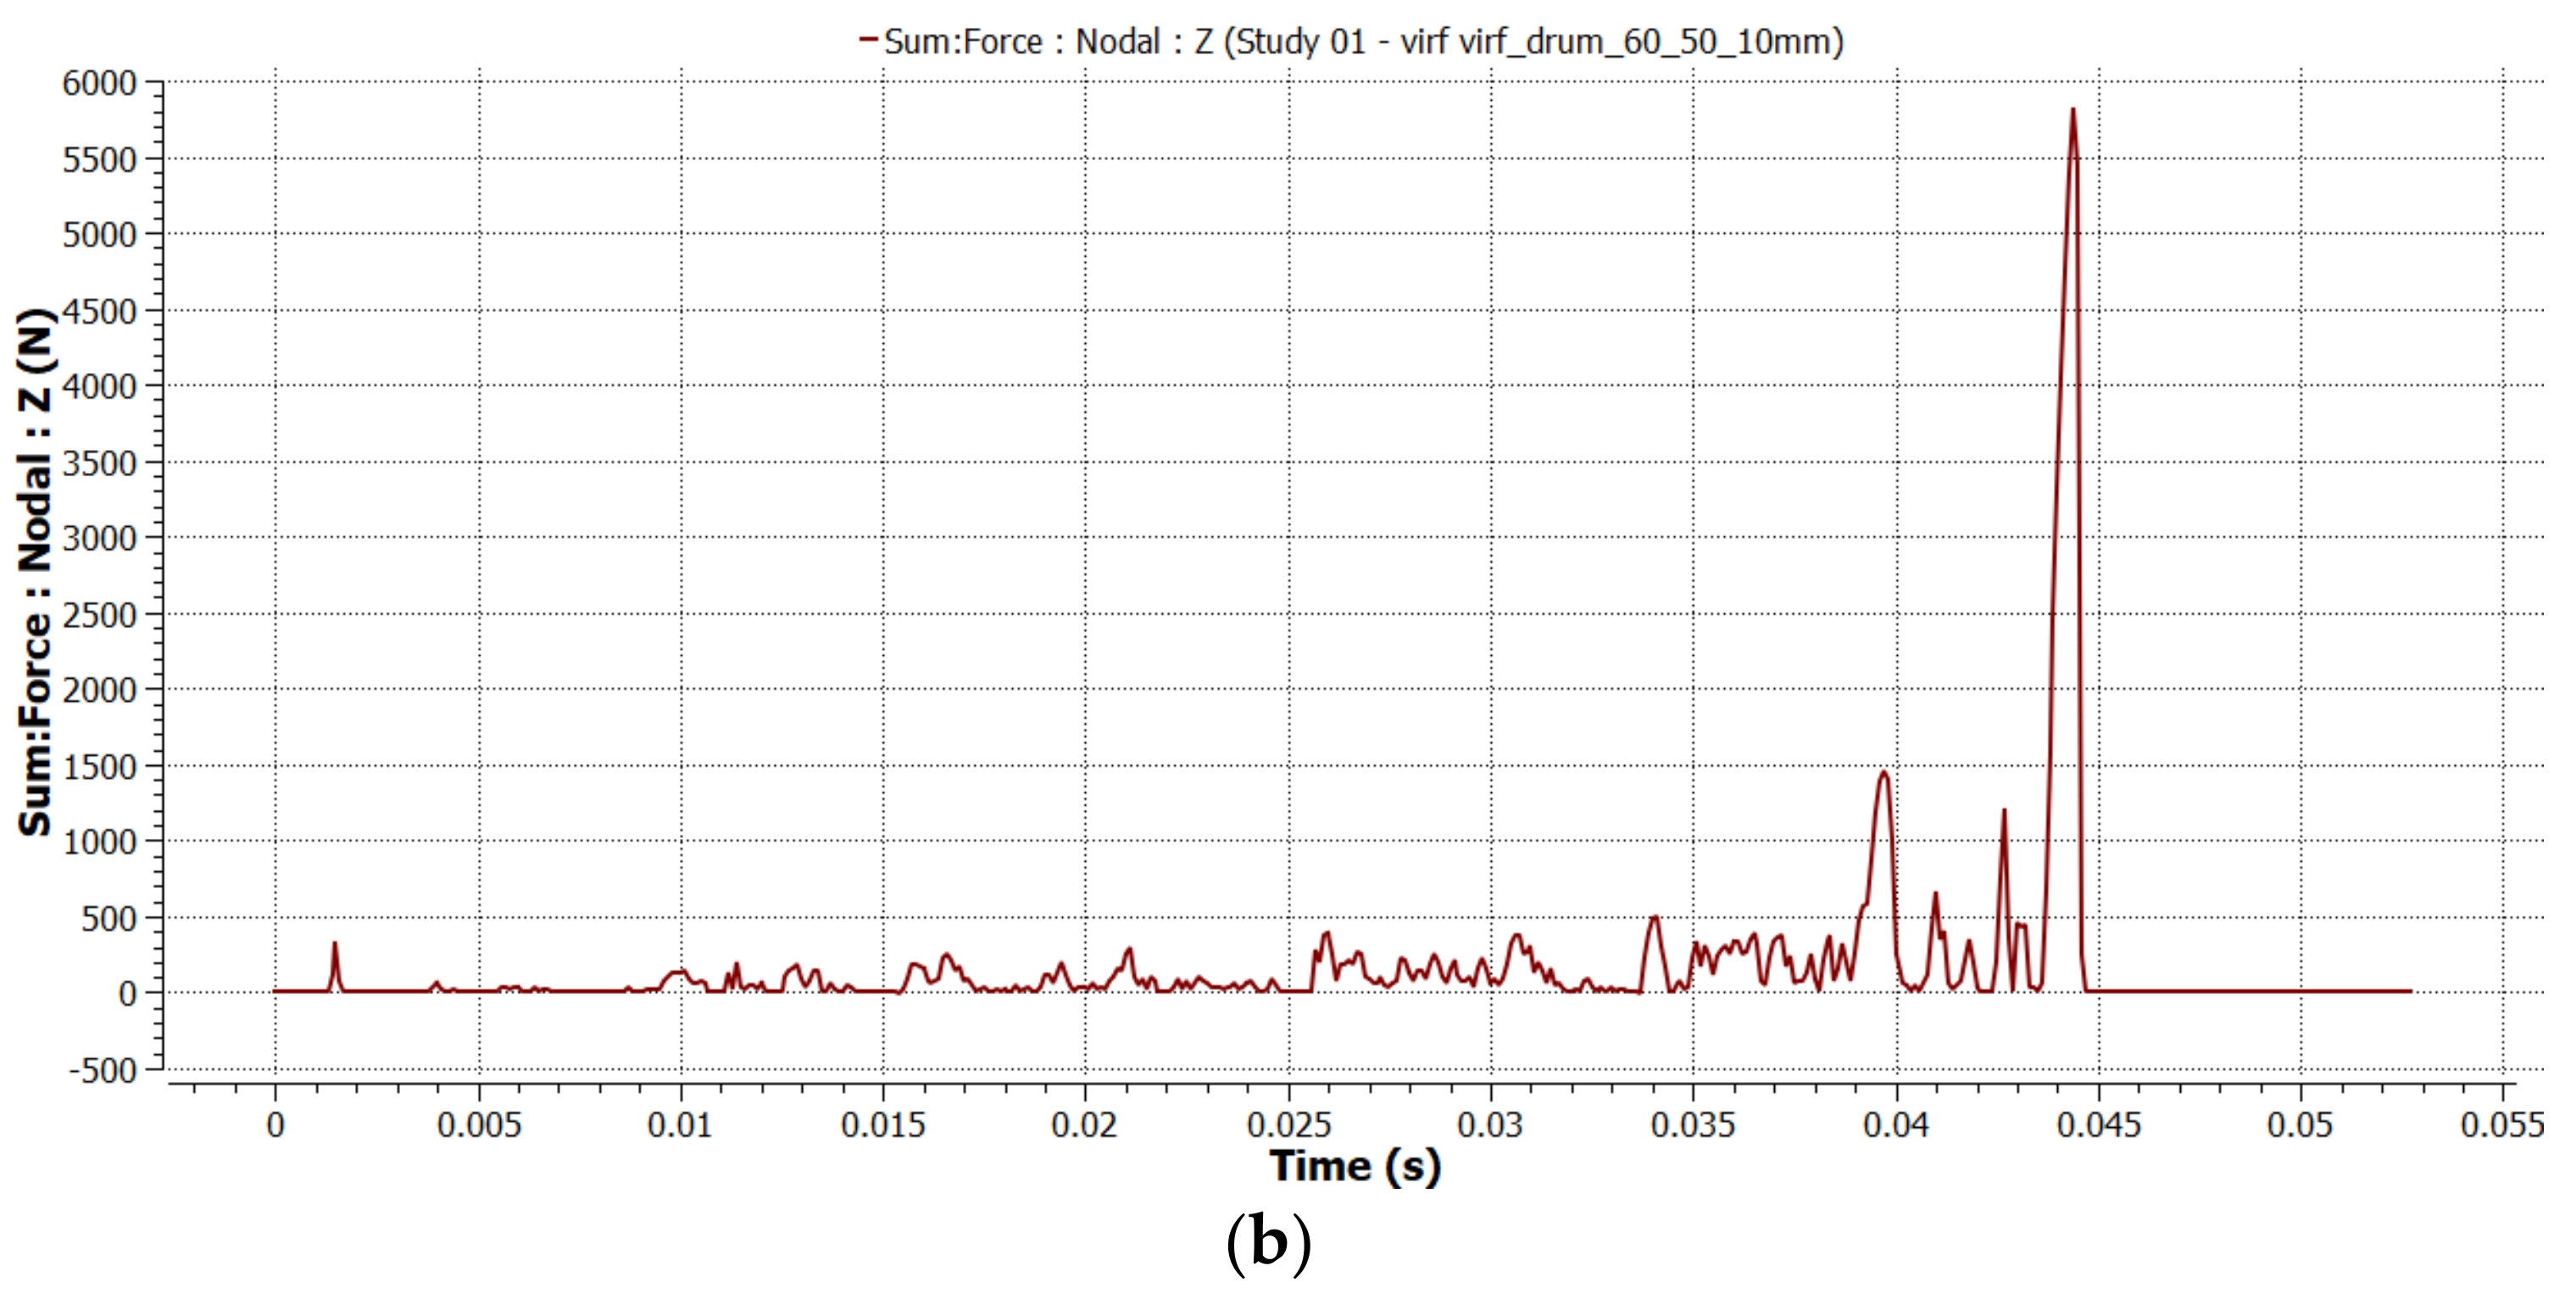
3.1. DEM Analysis Results

The values of cutting forces obtained through DEM simulation (Figure 8) on both Ox (the direction tangent to the circle described by the tip of the cutter teeth) and Oz (the horizontal direction that coincides with the advance direction) directions can be seen in Table 5.
The resultant cutting force was calculated with the formula, taking into account that the force in Oy direction is neglected because it is very small (almost zero):
R = F x 2 + F z 2  
The cutting forces were determined as the maximum values of forces sum during the milling process simulation, as shown in Figure 9 and Figure 10.
The section area of chip, corresponding to different values for number of teeth, was calculated using expression (16), see Table 6.
Figure 11, Figure 12, Figure 13, Figure 14, Figure 15 and Figure 16 show the results regarding the resultant cutting forces and chip section area in the function of milling parameters.
The variations in the values of the components (in the horizontal direction and in the vertical direction) of the cutting forces, both on the active tip of the milling tooth and in its support, have similar tendencies in relation to the values of the advanced speed, vf, in the milling direction, depending essentially on the milling depth size, ap. For small values of the milling depth, ap, the advanced speed does not essentially influence the values of forces Fz and Fx.
It can be also observed that large milling depth values—from 100 mm and higher—causes a significant increase in force values, both on the active side (tip) and in the tooth support.
The simulations results show stability in terms of values tendency variation, especially for advanced speeds above 10 m/min. This can be attributed to the low degree of reproducibility of the model of the chipped material (asphalt) which has a random distribution of mineral aggregate particle components. The trend is much more pronounced when modeling complex polyhedral particles rather than spherical particles. This is, moreover, the main reason why multiple successive runs were performed (three runs for each individual case) for each analyzed combination of milling parameters.
Another aspect is that low advanced speeds cause a longer contact period between the cutter tooth and the milled material, causing the modeled particles to interact more intensively with the cutter tooth, leading to a greater variability in the obtained results.
In practical situations, asphalt cutters are built in such a way that one or two teeth are found on the dislocation lines [36]. For this reason, the statistical analysis presented below was performed considering a single tooth.

3.2. Statistical Analysis

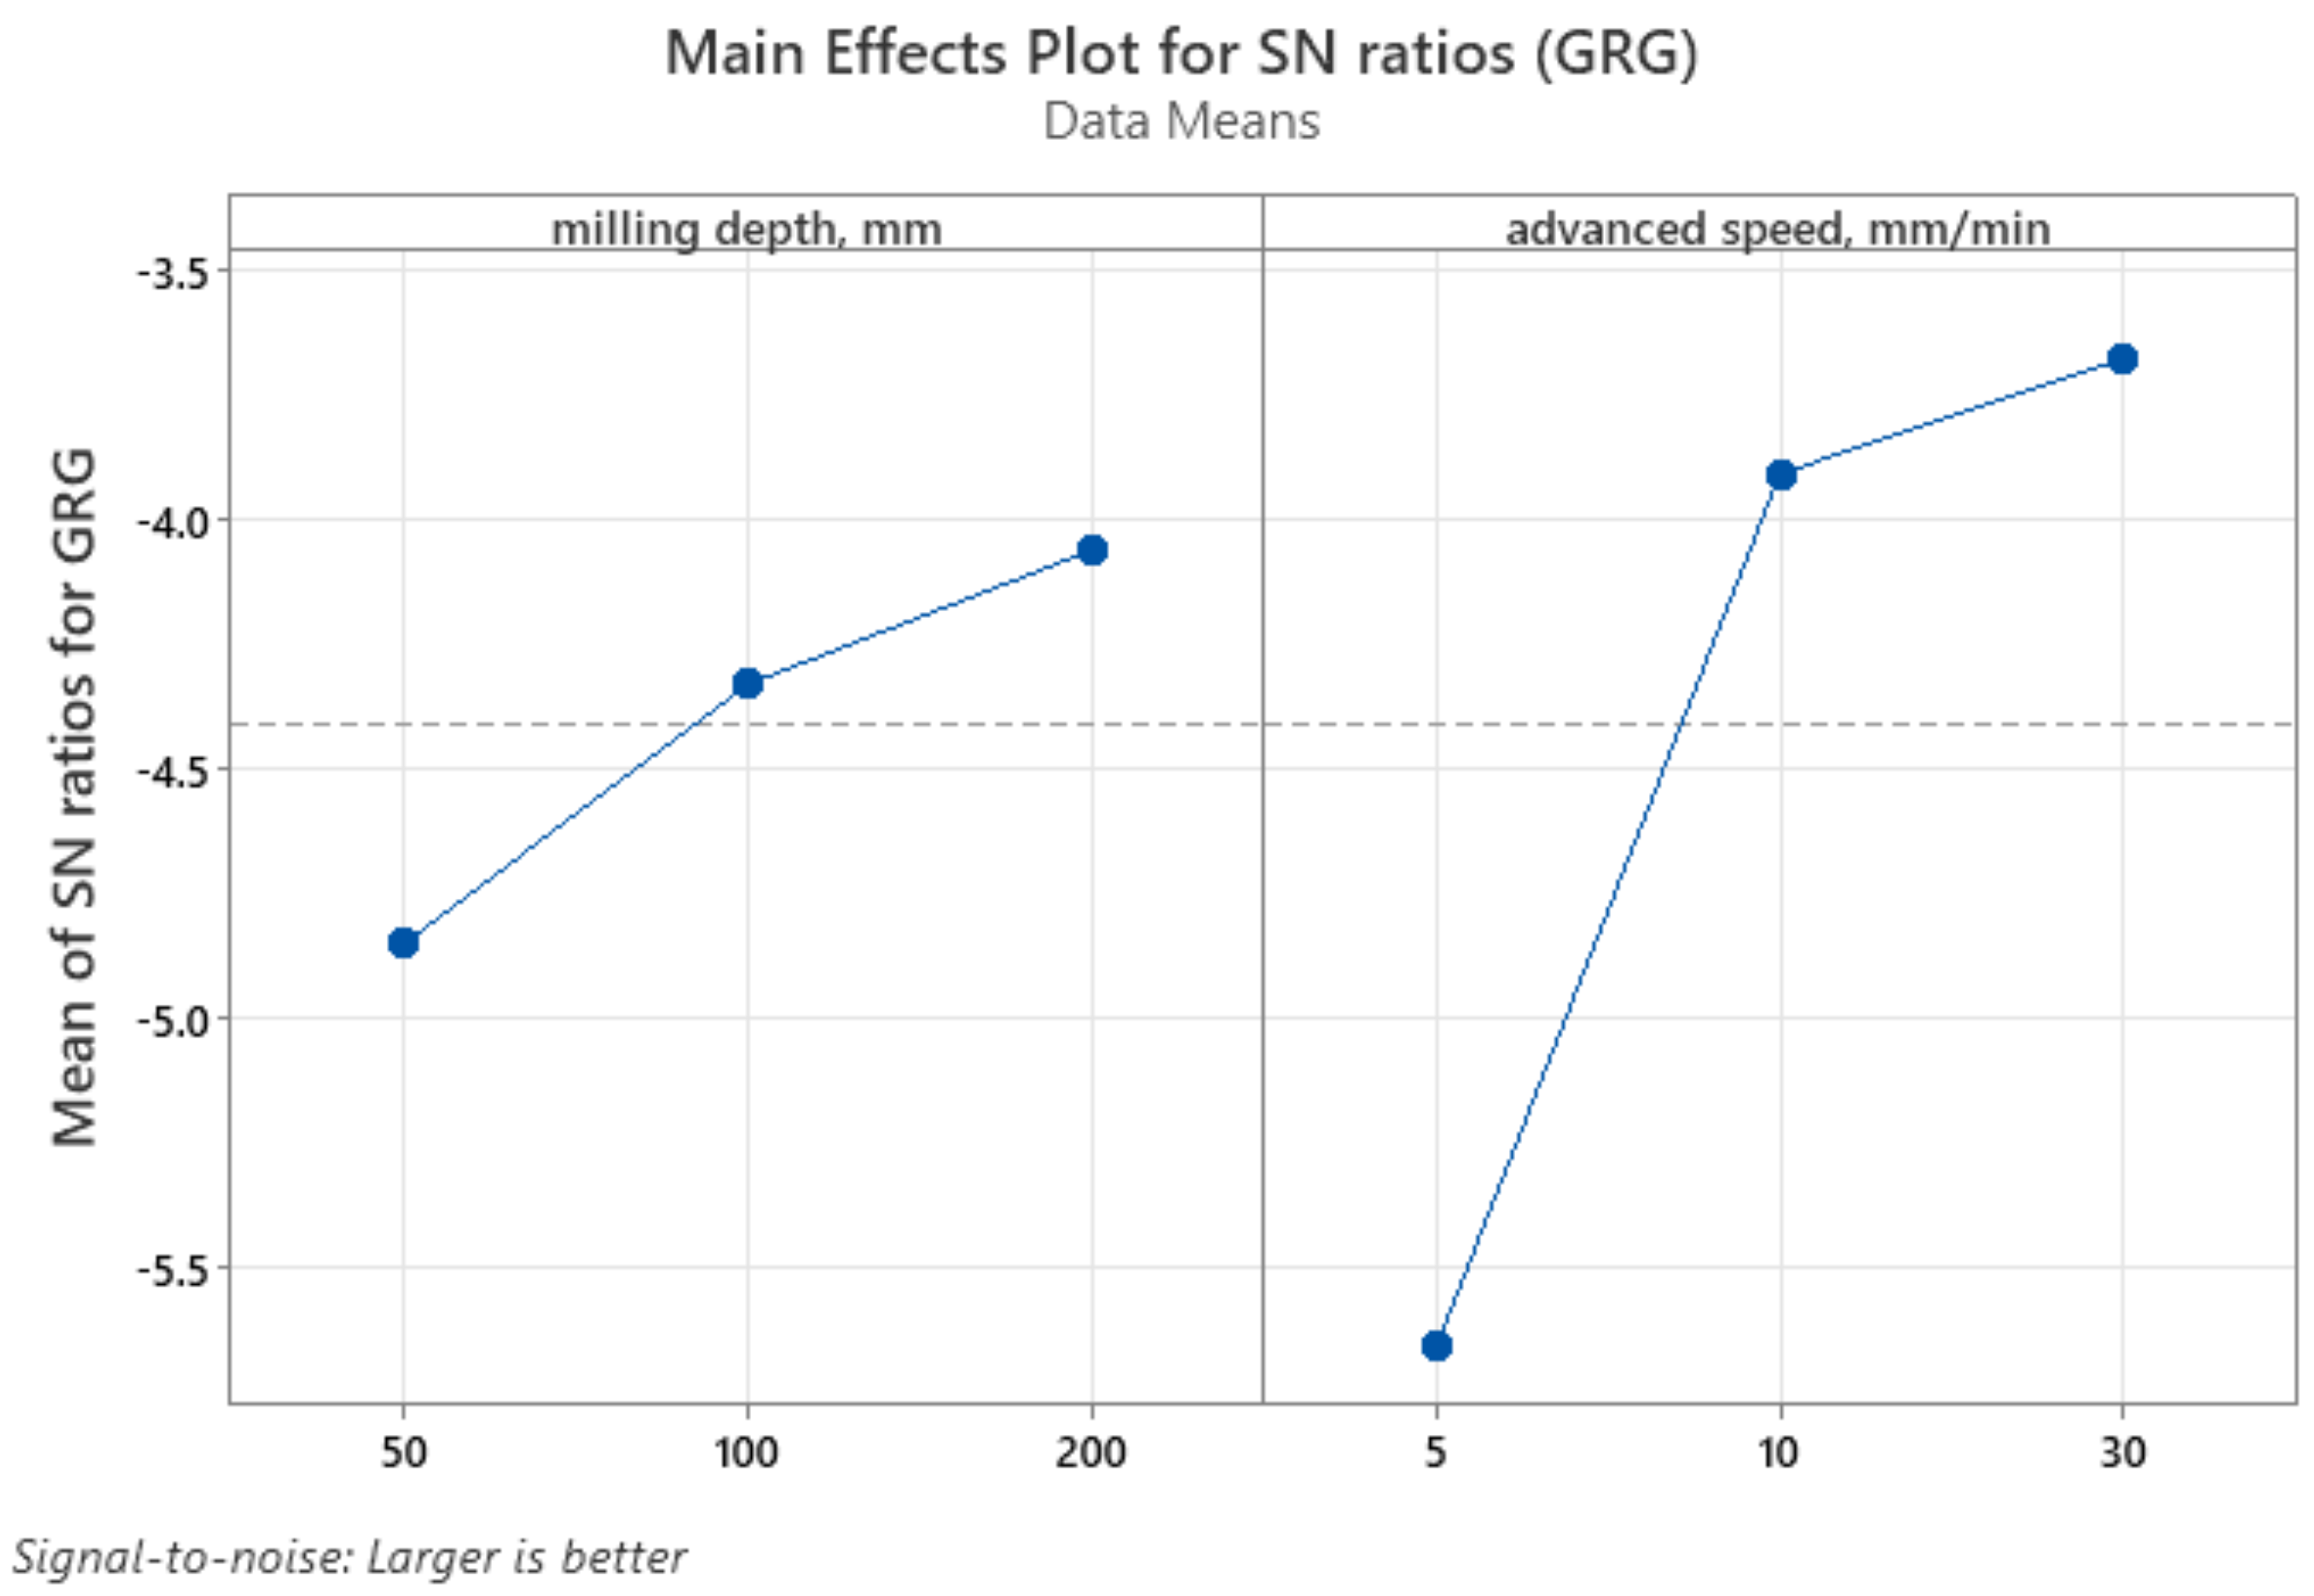
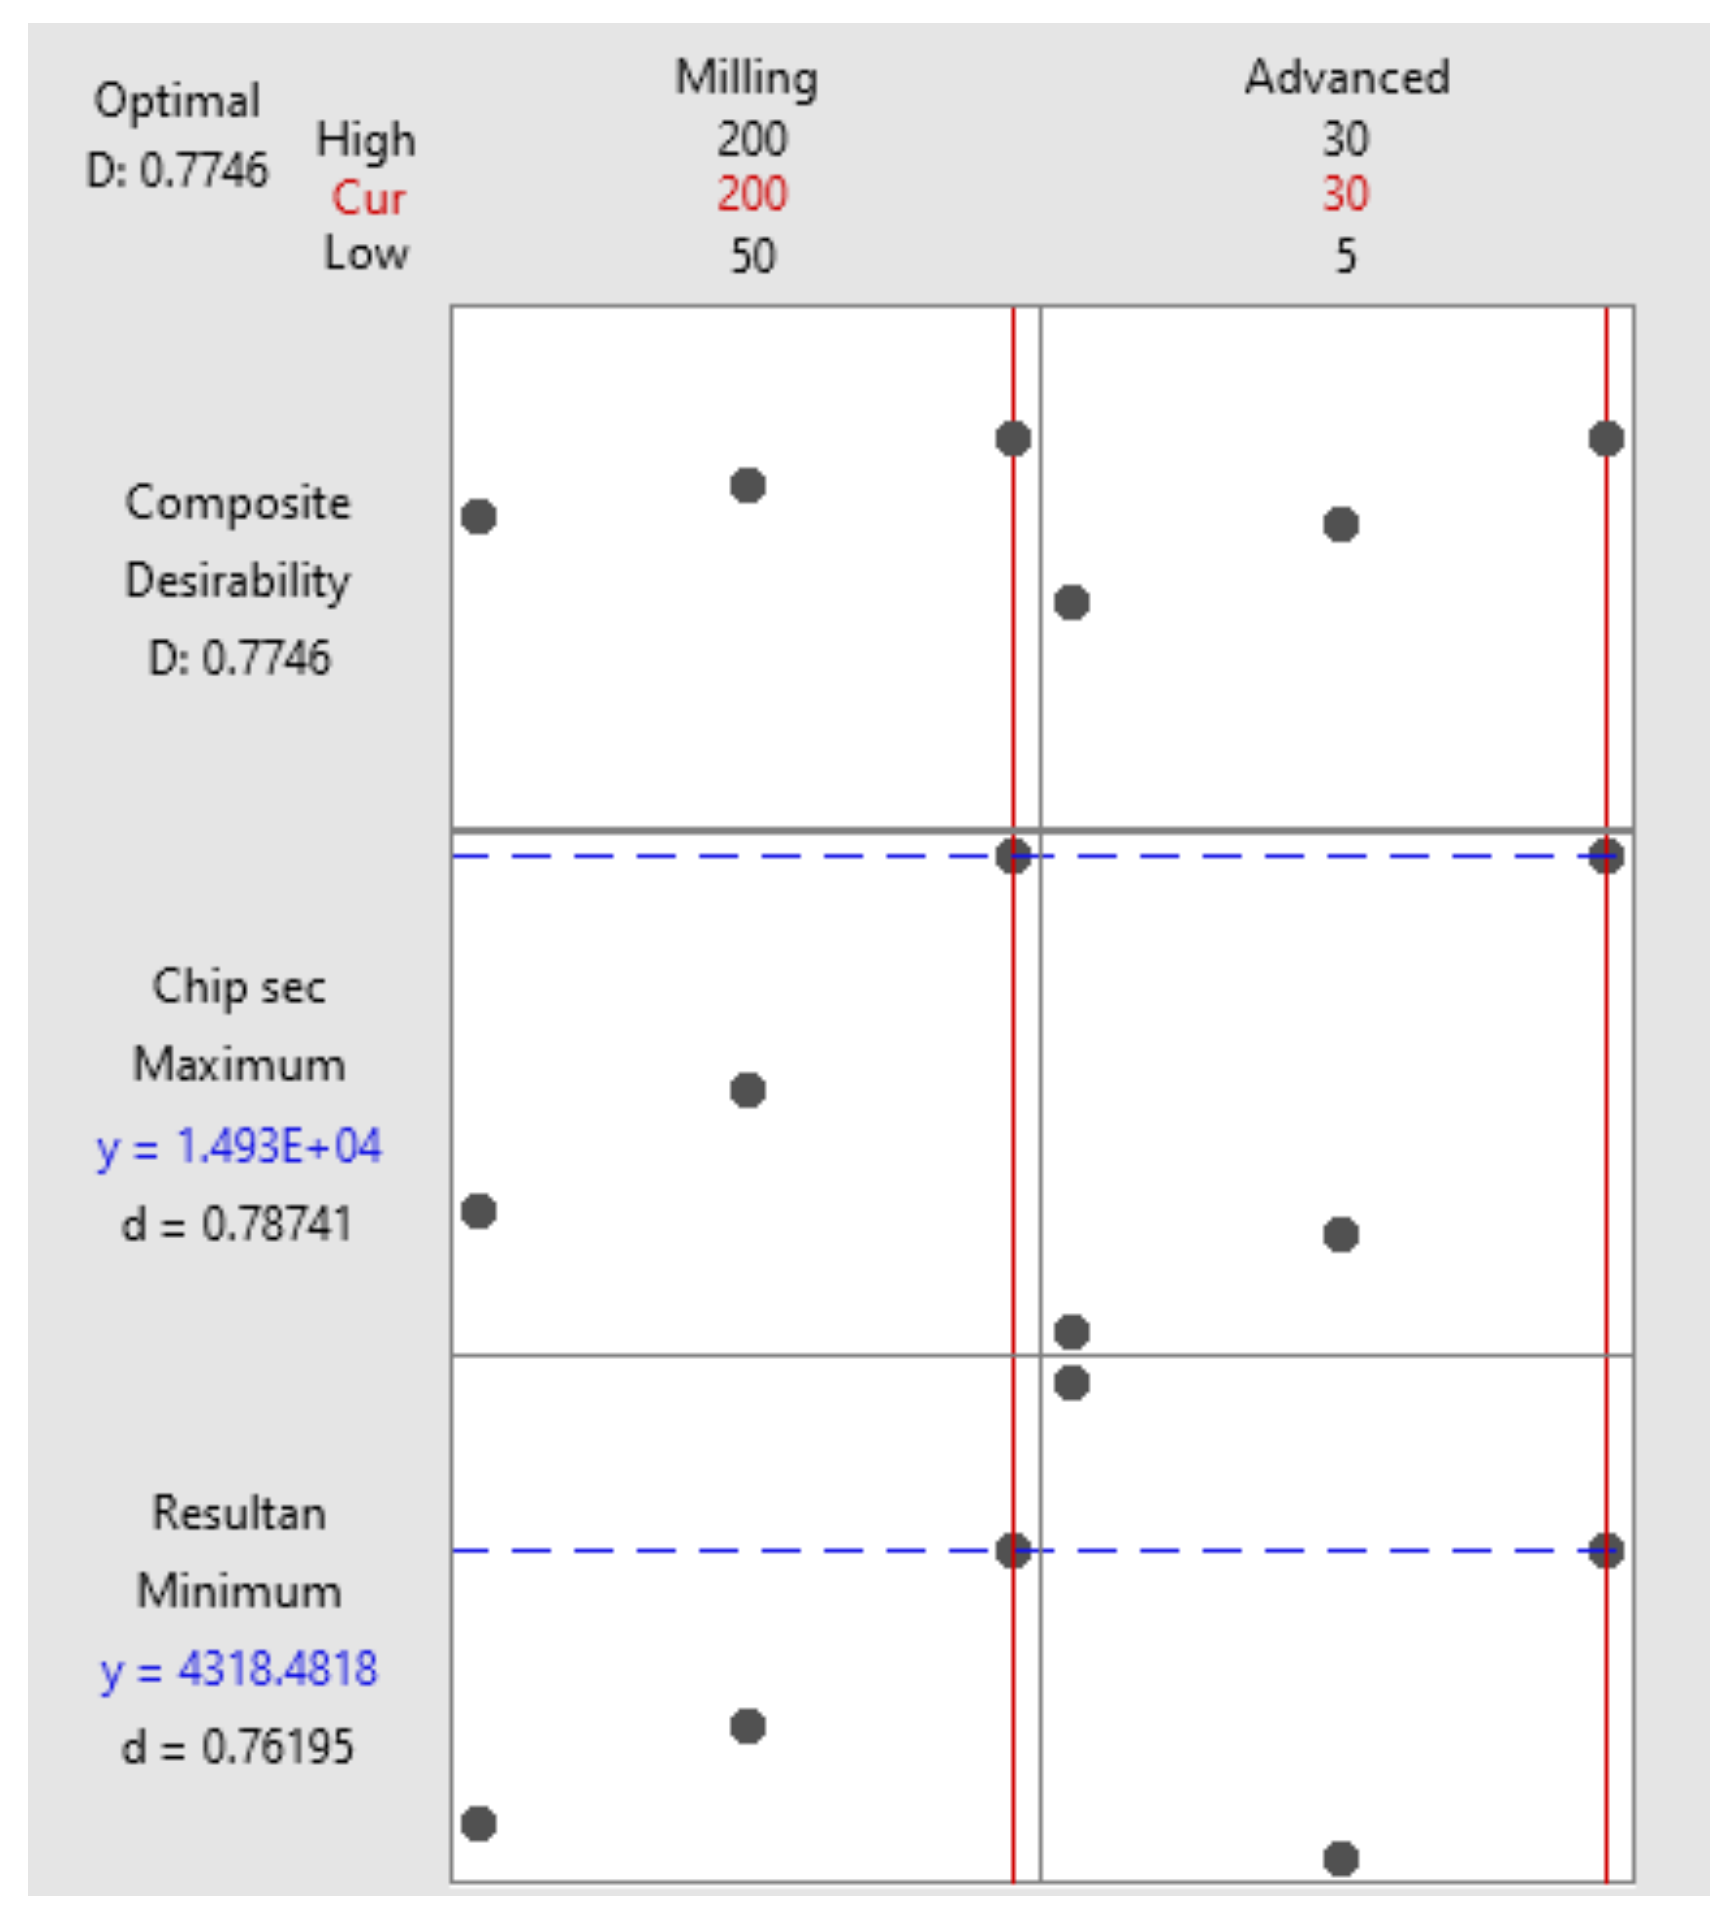
3.2.1. Multi-Response Analysis

This study aimed to minimize the resultant cutting force (R) and maximize the chip section area (A) and therefore the “smaller is better” approach was adopted (for R) and “larger is better” approach (for A) within the Taguchi-based GRA. Firstly, the performance characteristics (R and A) were normalized using Equation (4). Subsequently, the coefficient of grey relational for the normalized data was calculated using Equation (5), enabling the computation of Grey Relational Grades through Equation (7). The final step involved considering the grade and its order to optimize the parameters for the multi-response approach. The summarized result for both performance characteristics can be found in Table 7.
In essence, a larger Grey Relational Grade indicates better performance across multiple characteristics.
The analysis of S/N ratio was used to establish the optimal combination of milling parameters leading to simultaneously achieve both smaller cutting forces and greater chip section area (see Figure 17).
As can be seen in Figure 17, the maximum value of S/N ratio for GRC correspond to 200 mm milling depth and 30 m/min advanced speed. This conclusion is confirmed by the result obtained when a full factorial design analysis was used (see Figure 18).
Furthermore, a variance analysis was performed to assess the impacts of milling parameters on the multi-performance responses. The ANOVA results, as presented in Table 8, indicate that milling depth and advanced speed have influences of 2.5%, and 74.4.4%, respectively, on the GRG values. Consequently, it was determined, with 95% confidence, that the advance speed has the most significant effect on the GRG value; a similar conclusion was found in [24]. The response Table 9 indicates the same factors influence (because advanced speed has Rank 1).

3.2.2. Individual Response Analysis

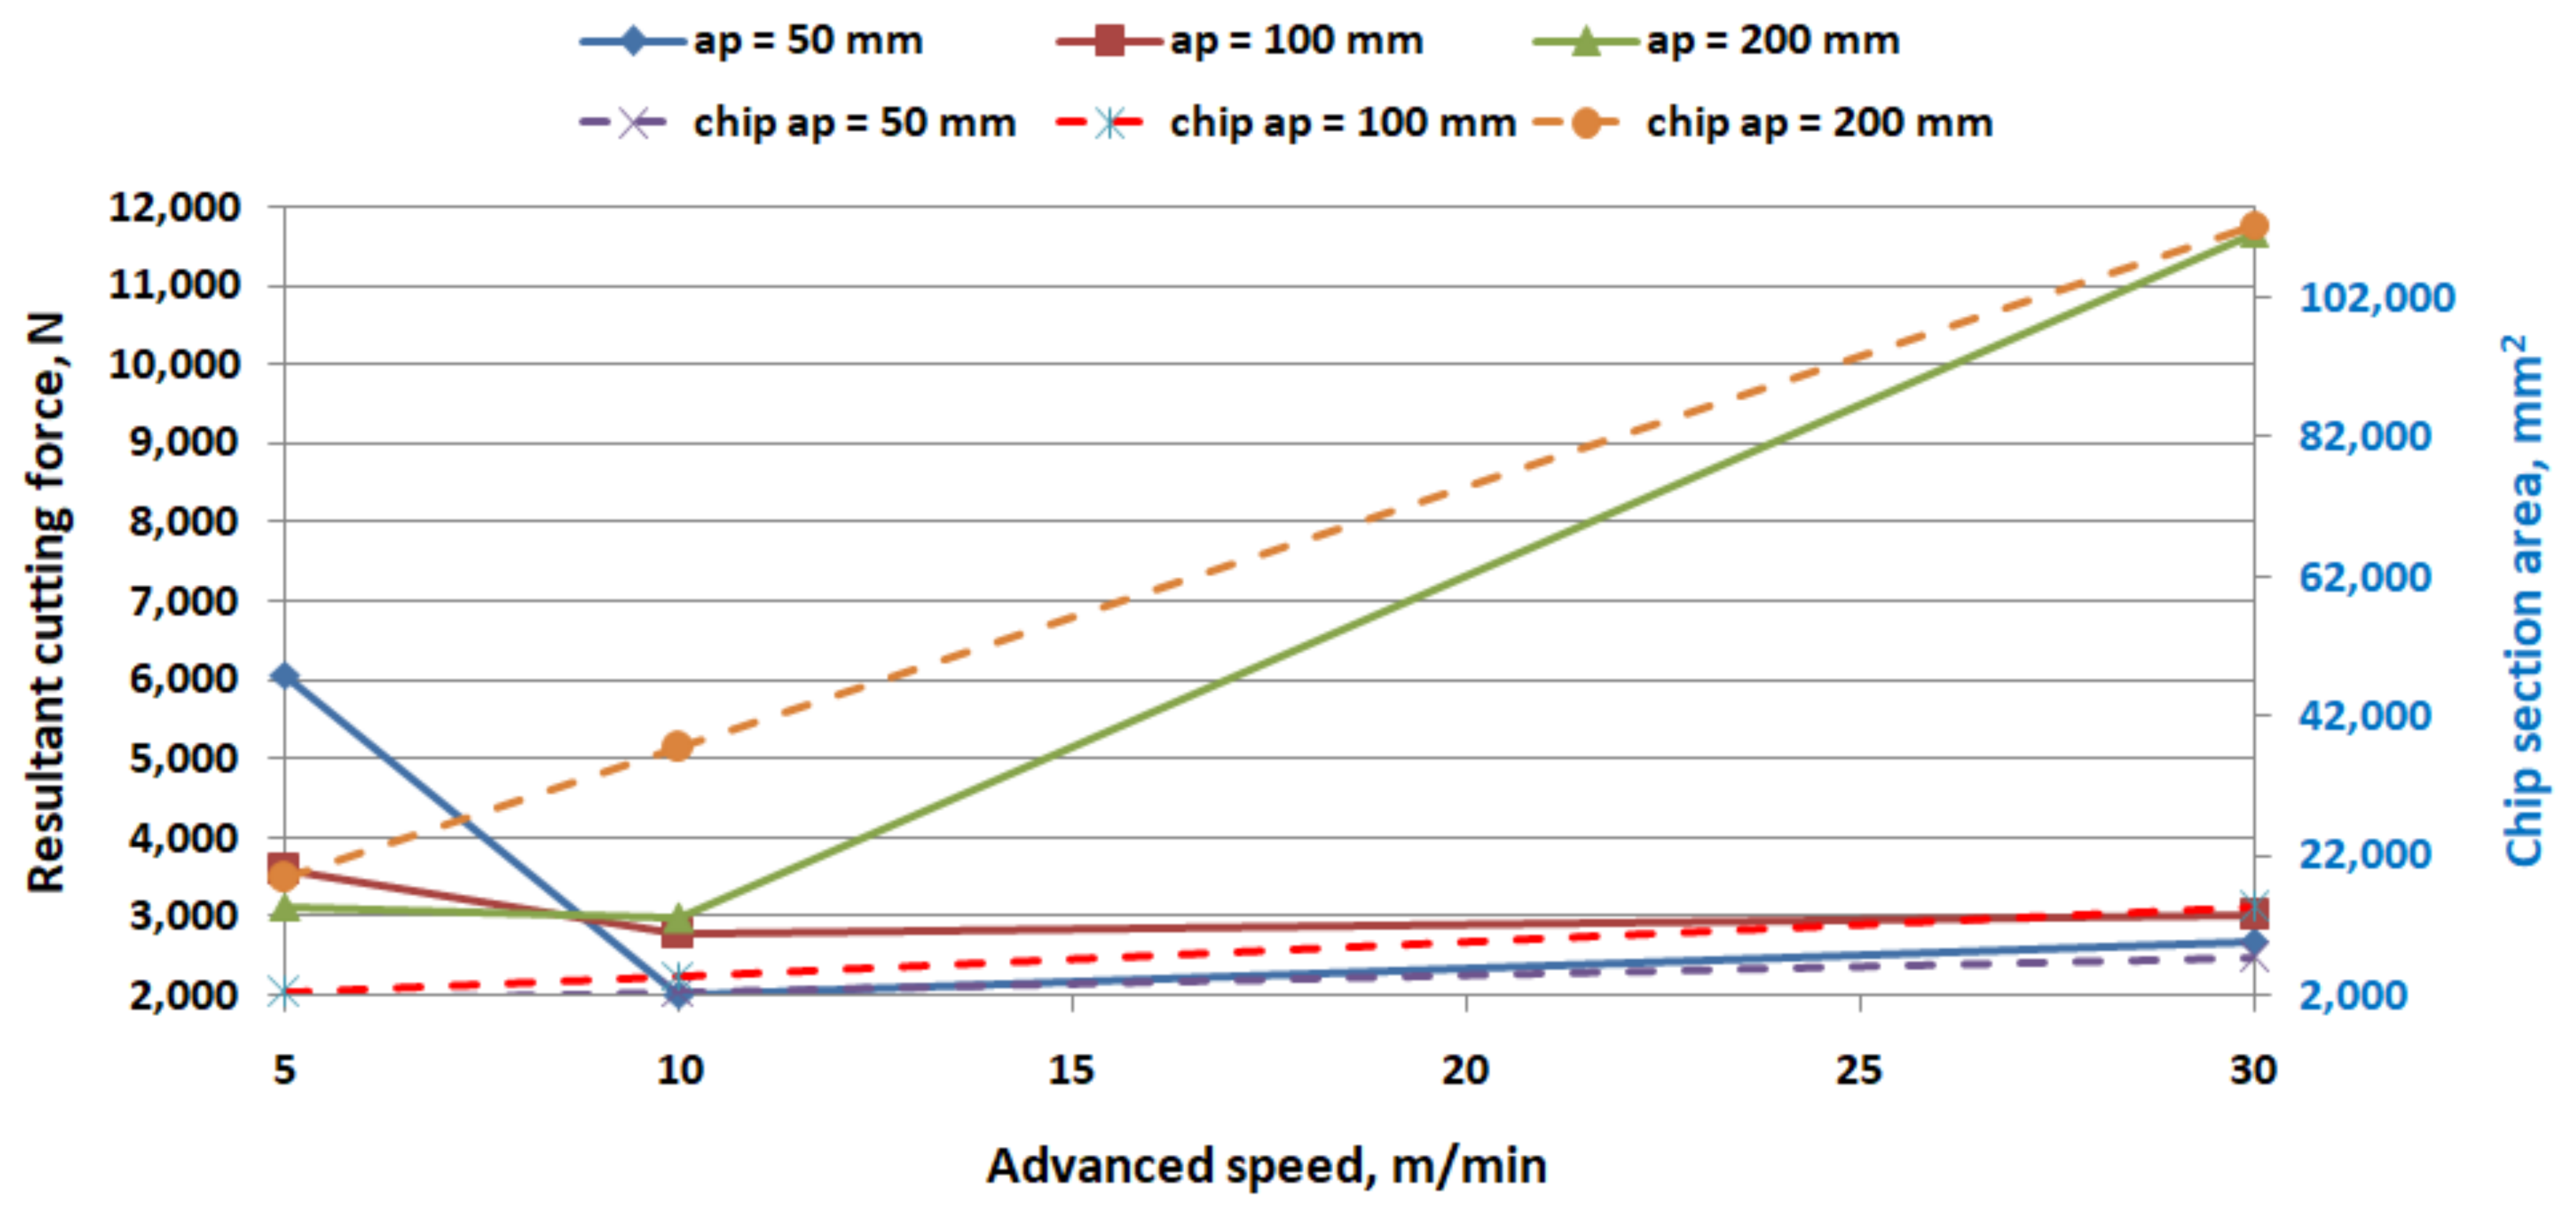
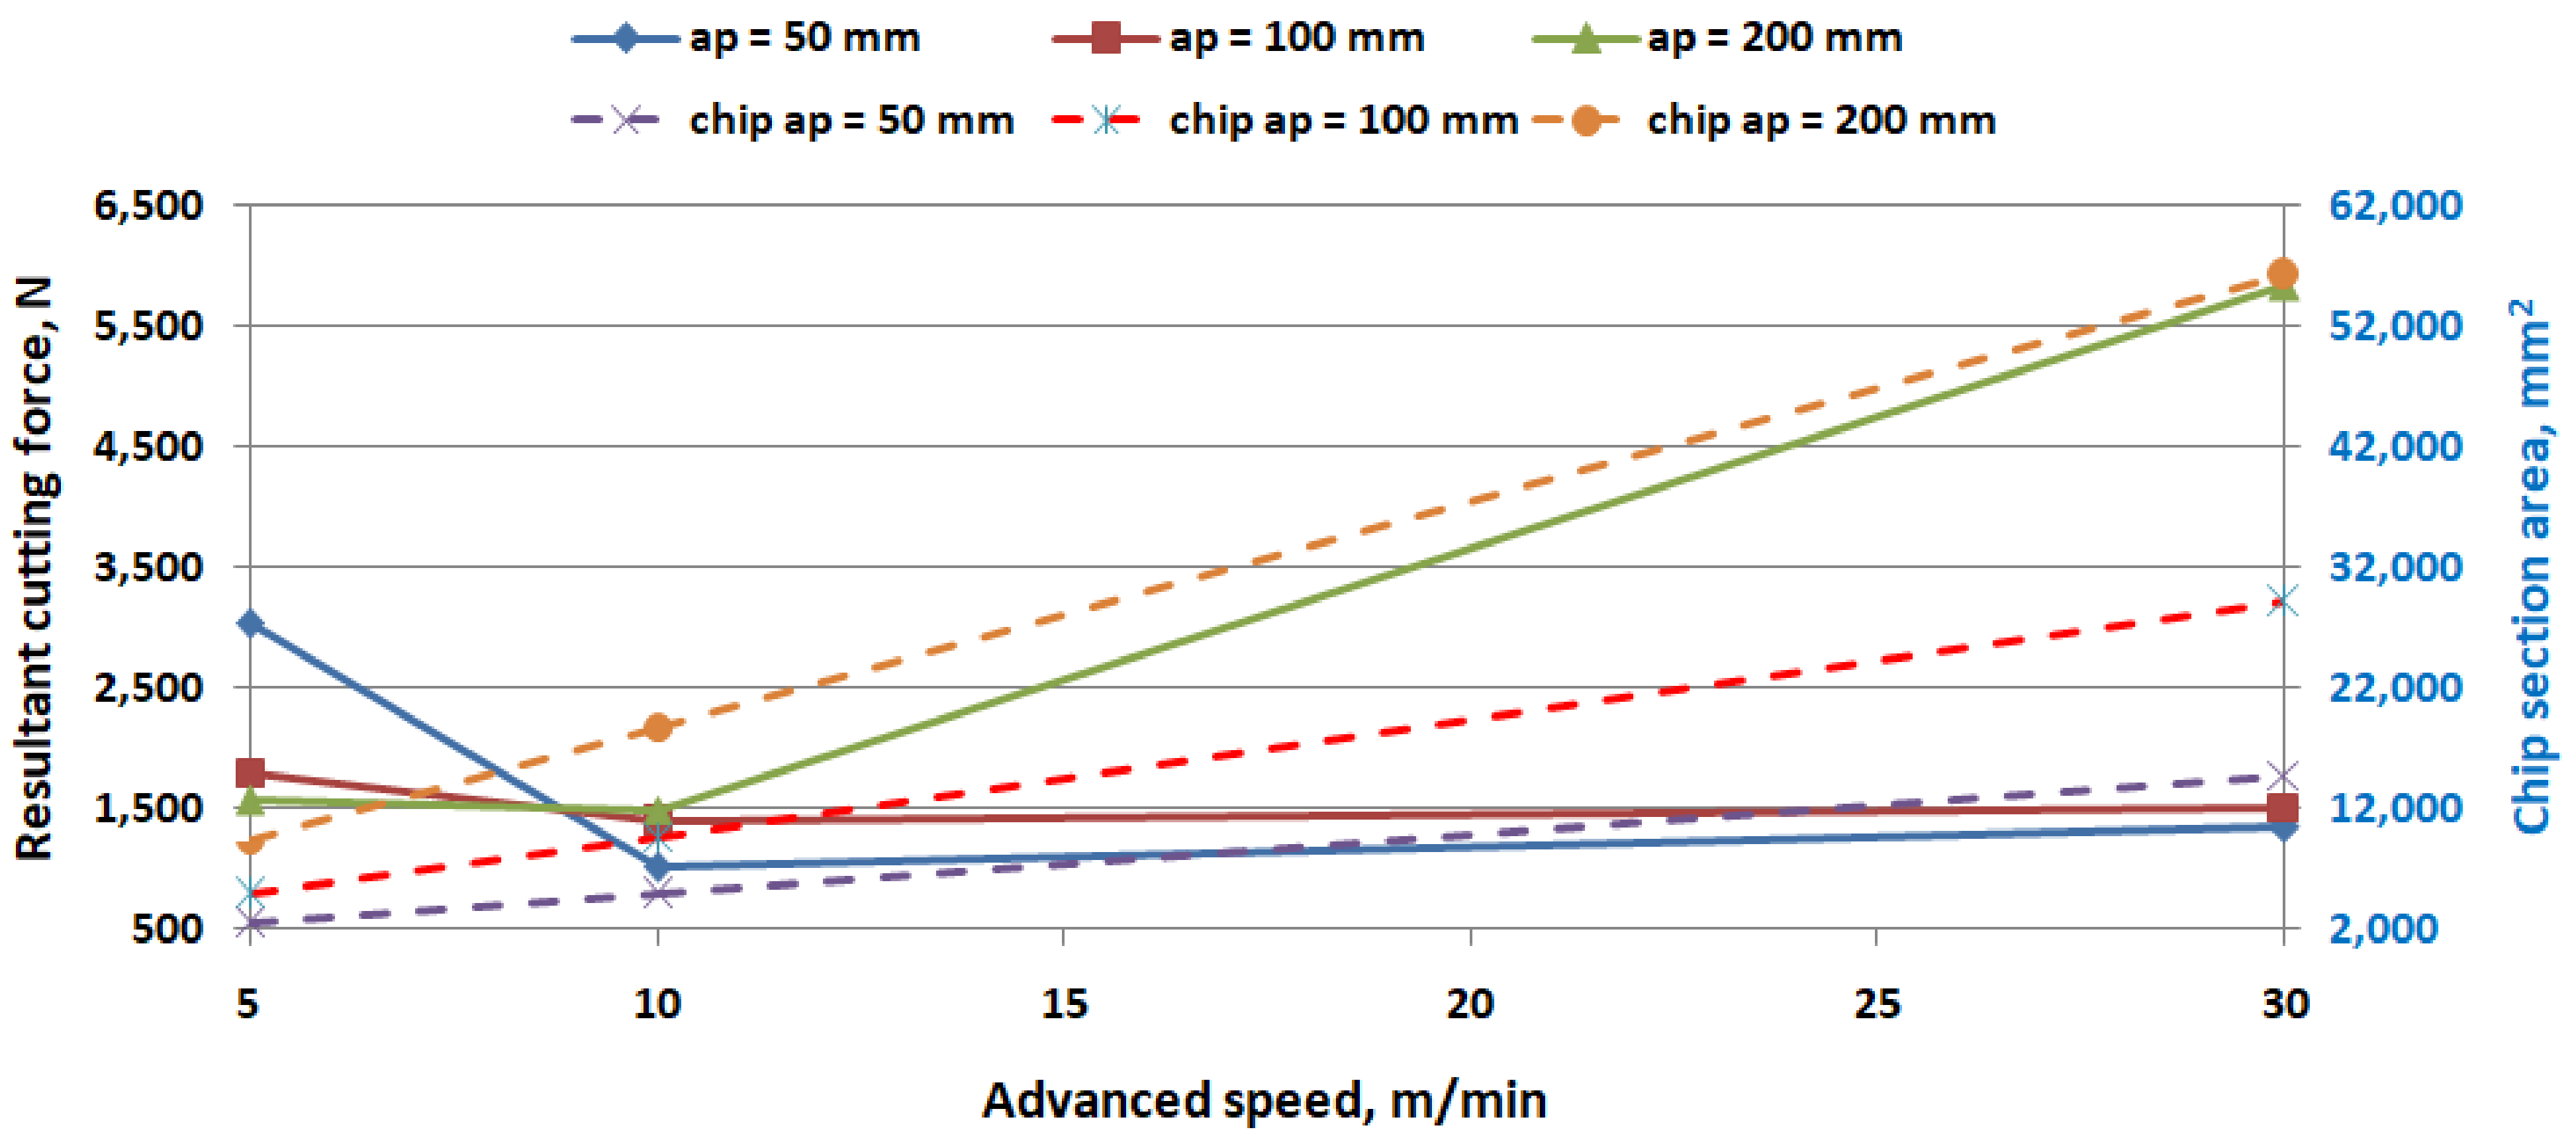
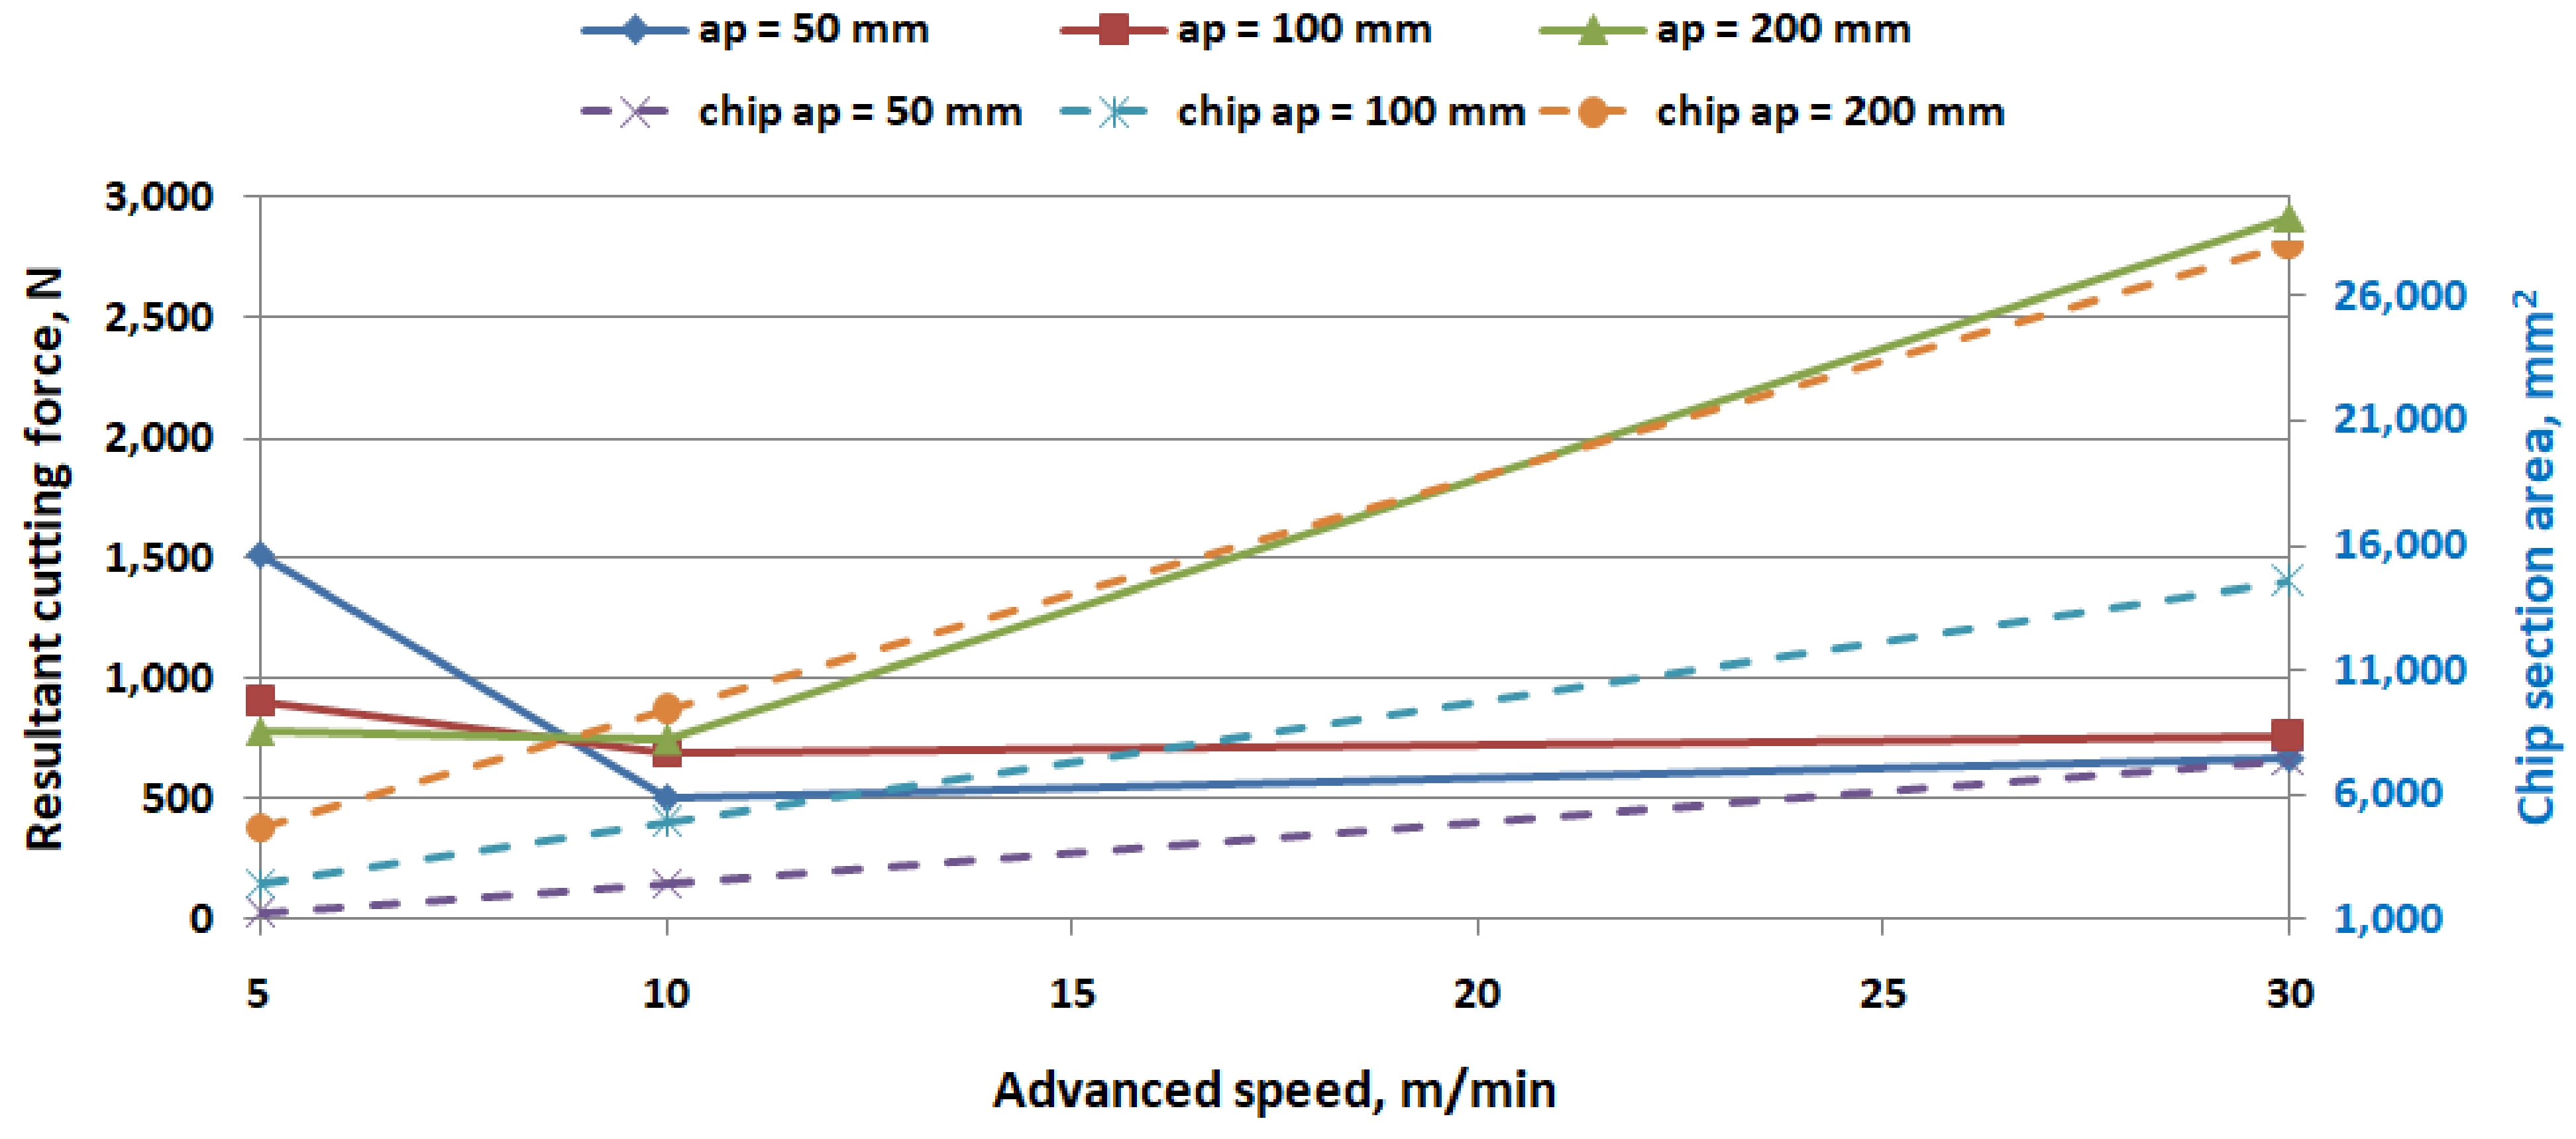
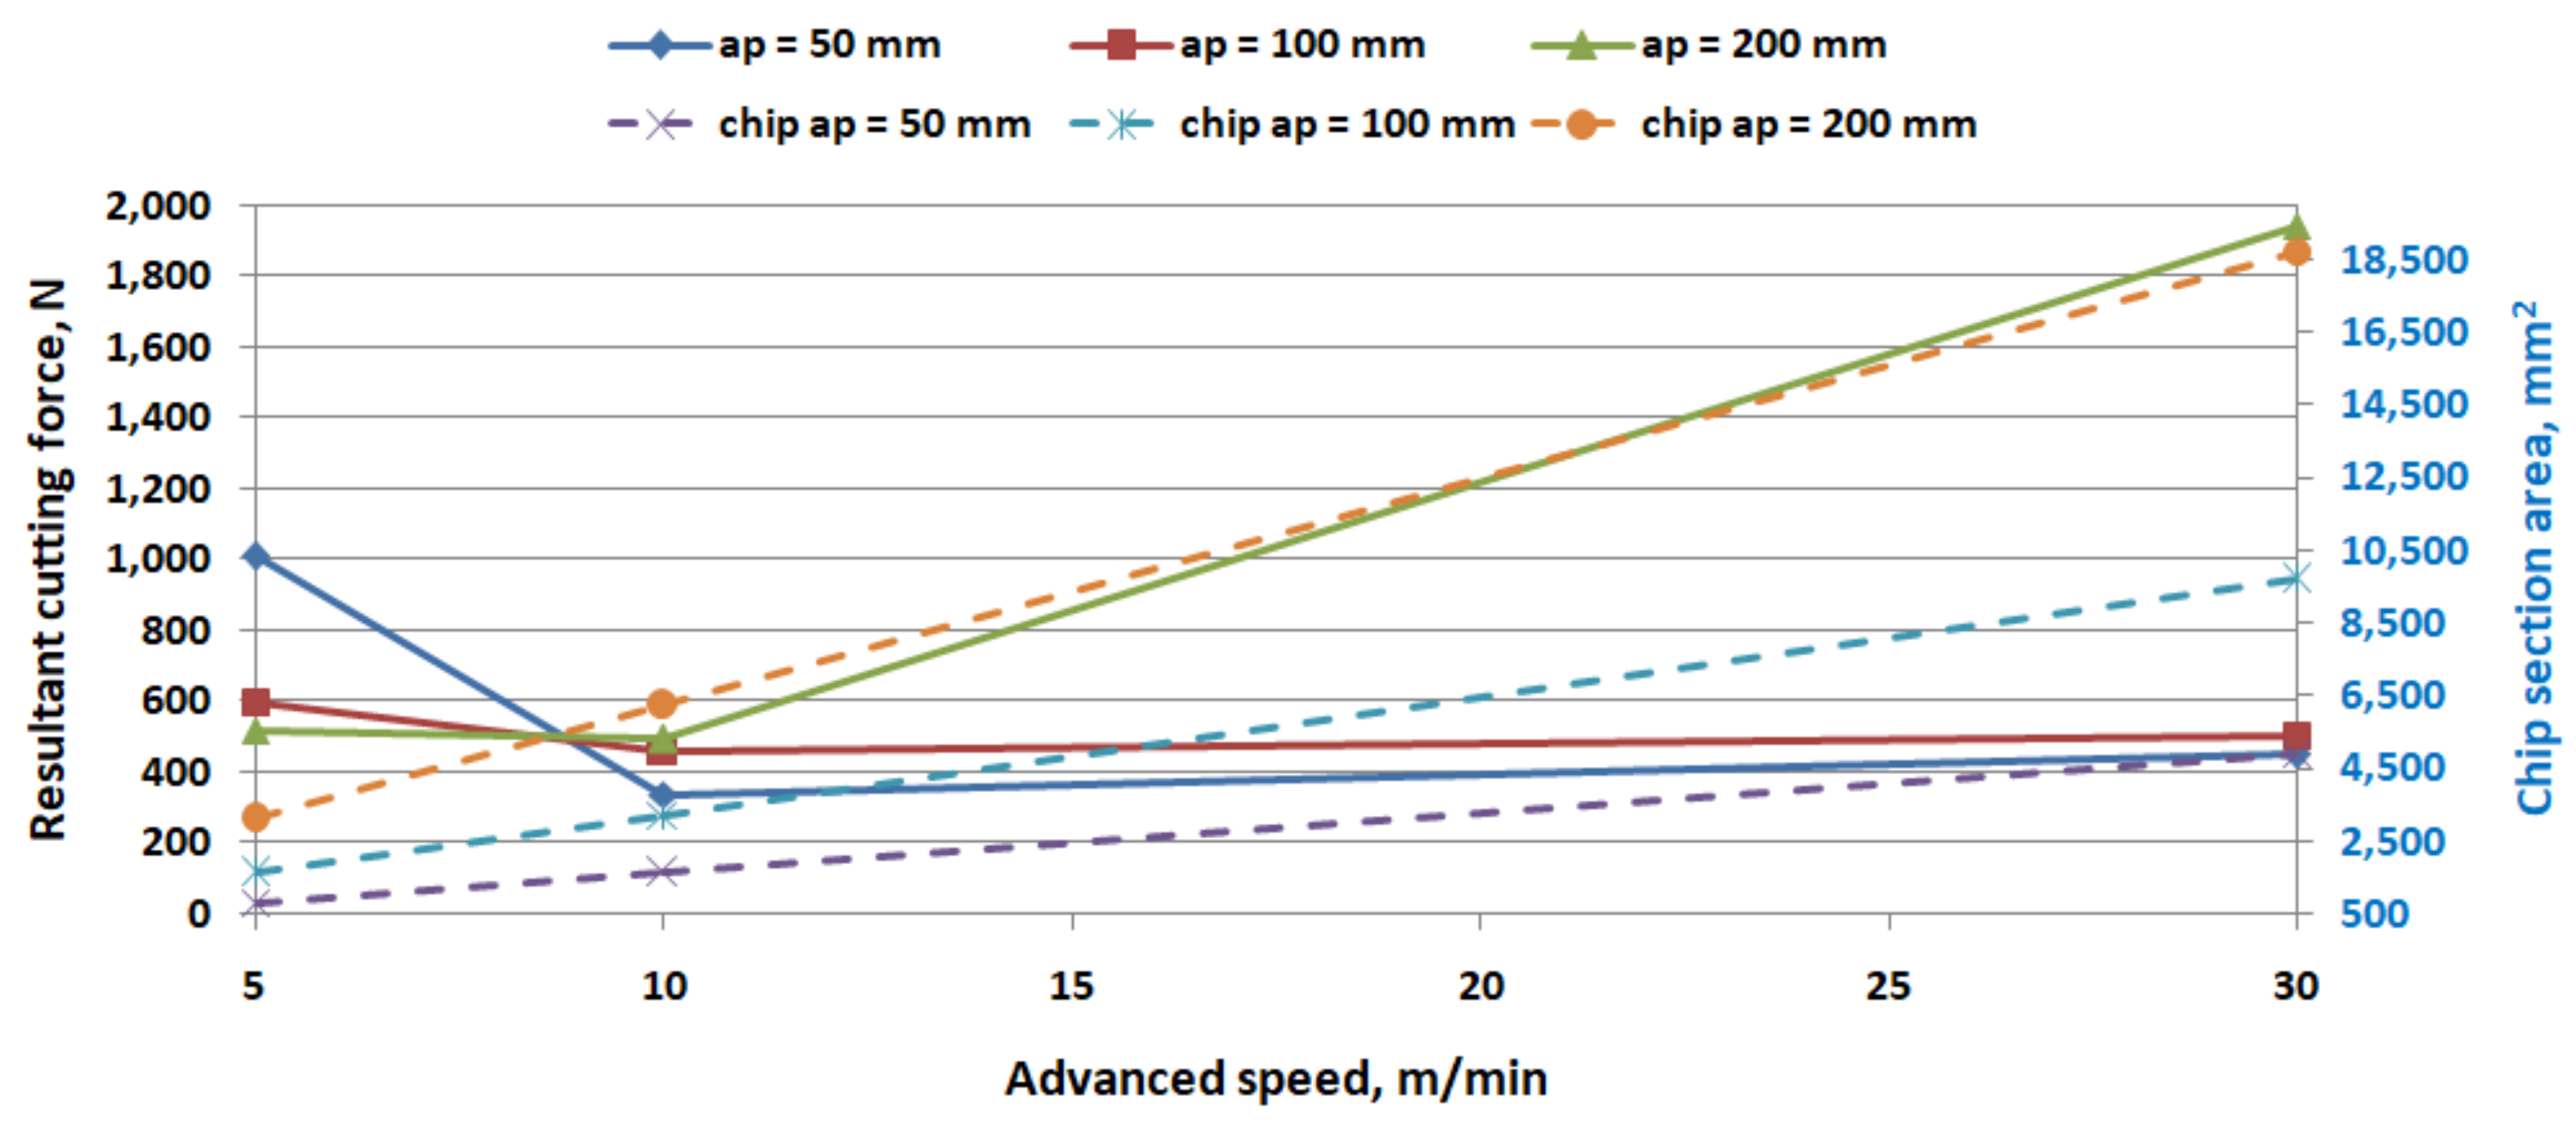
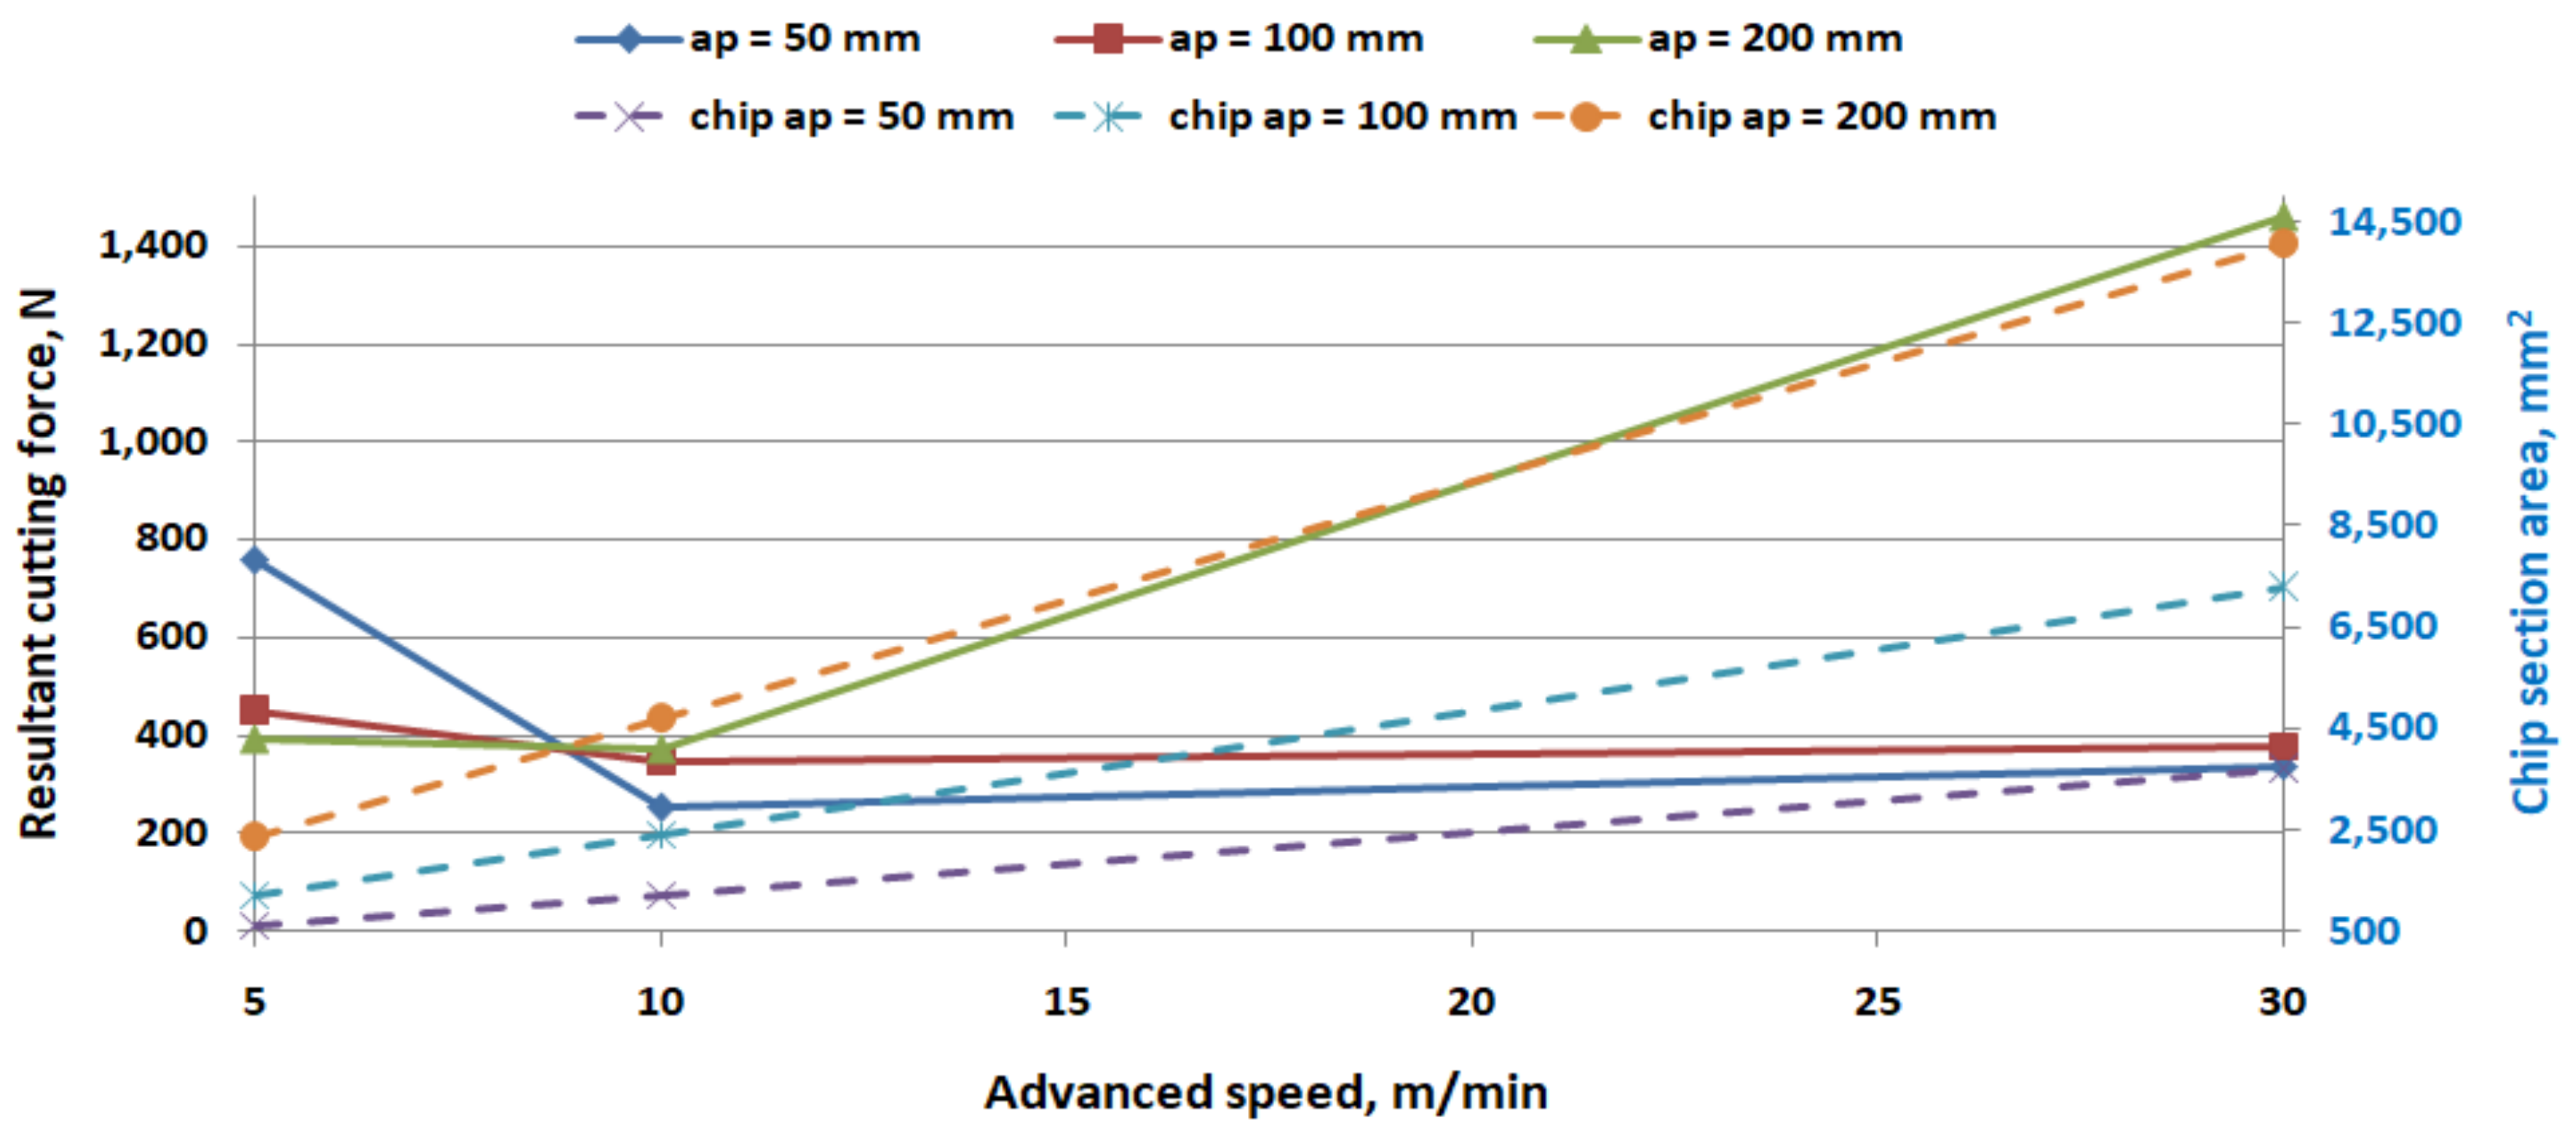
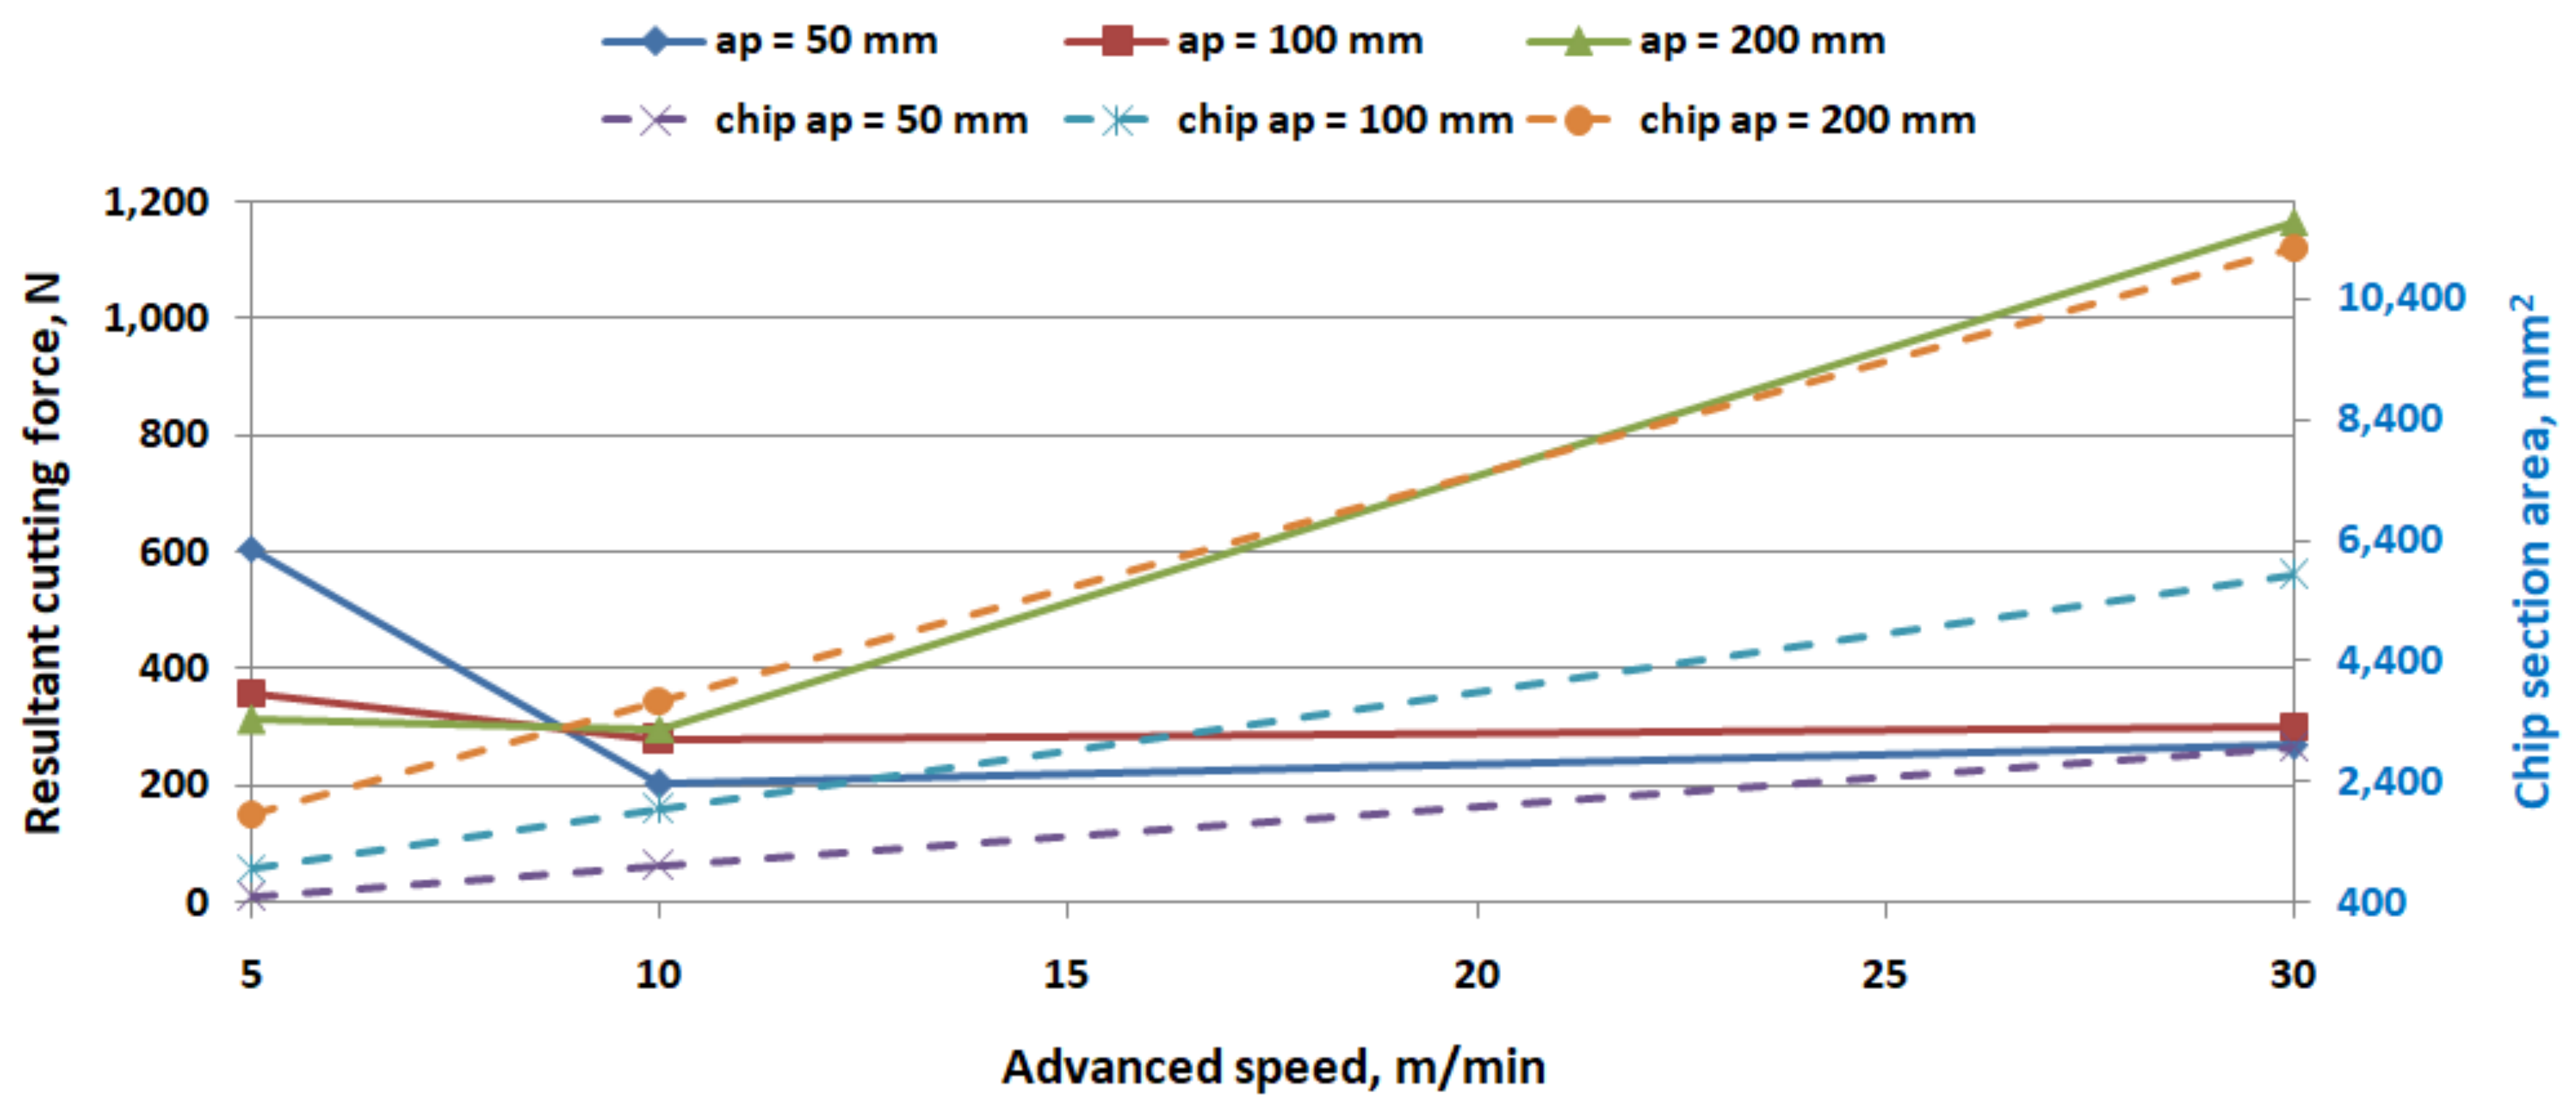
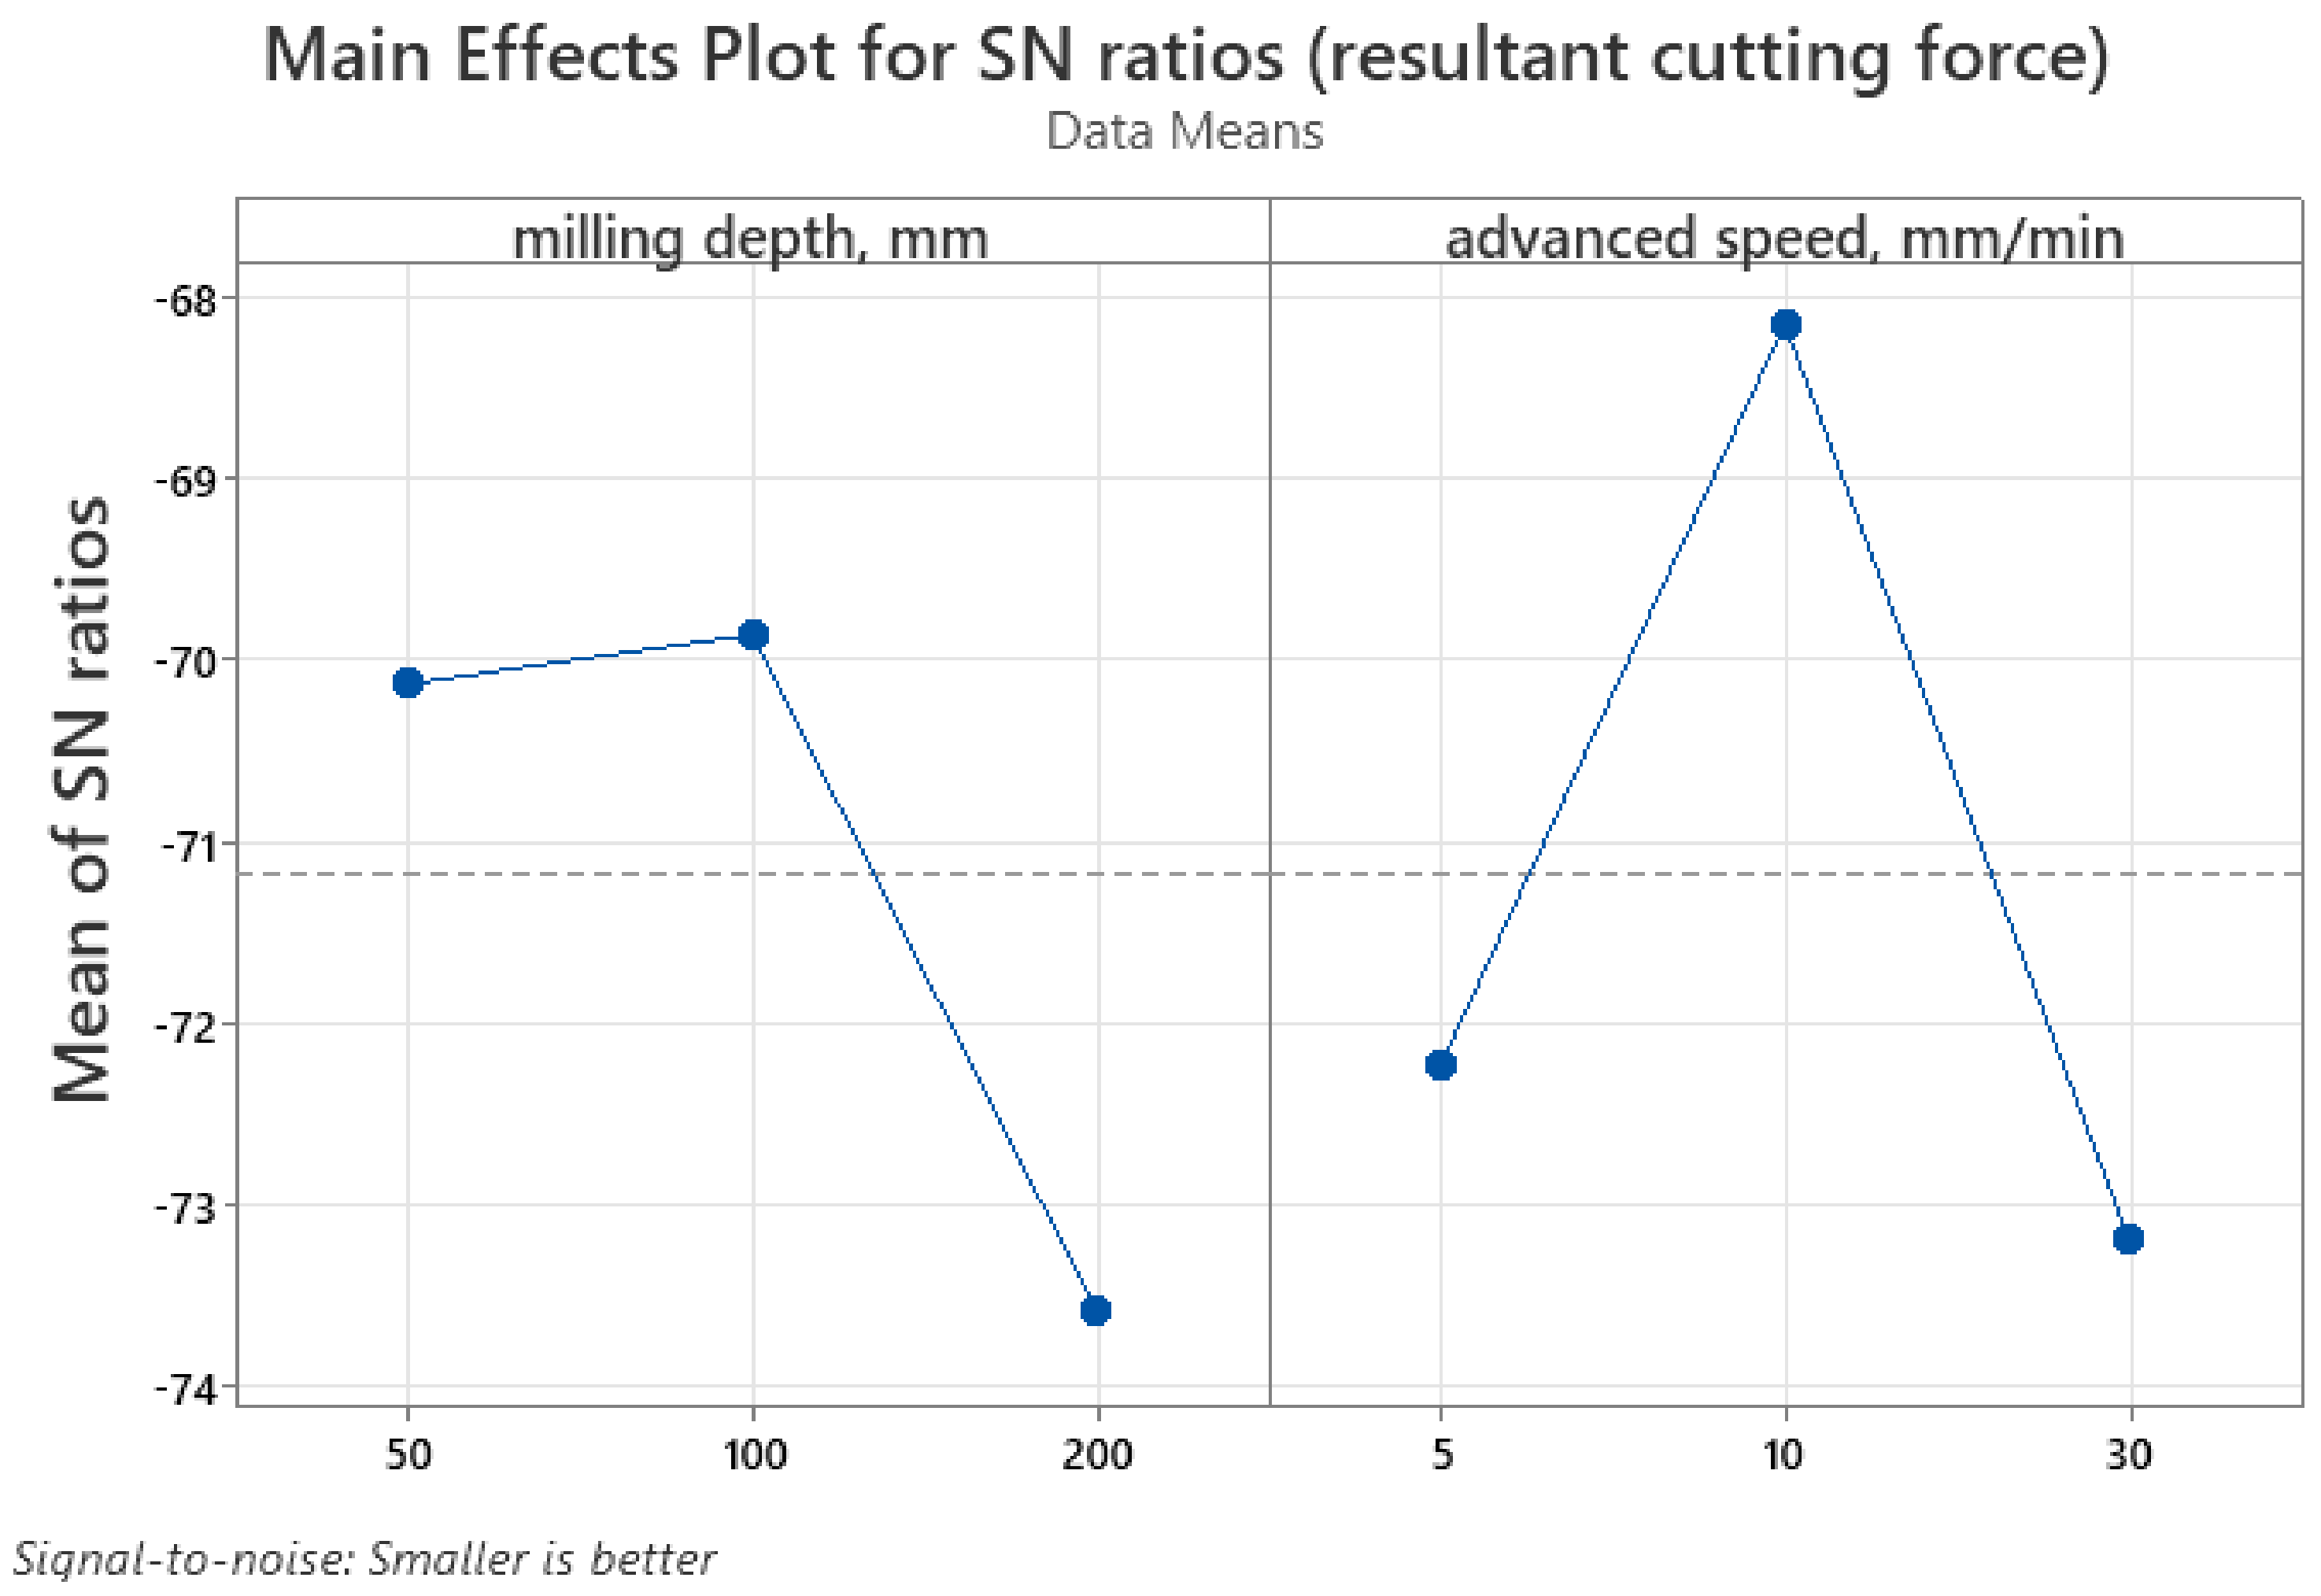
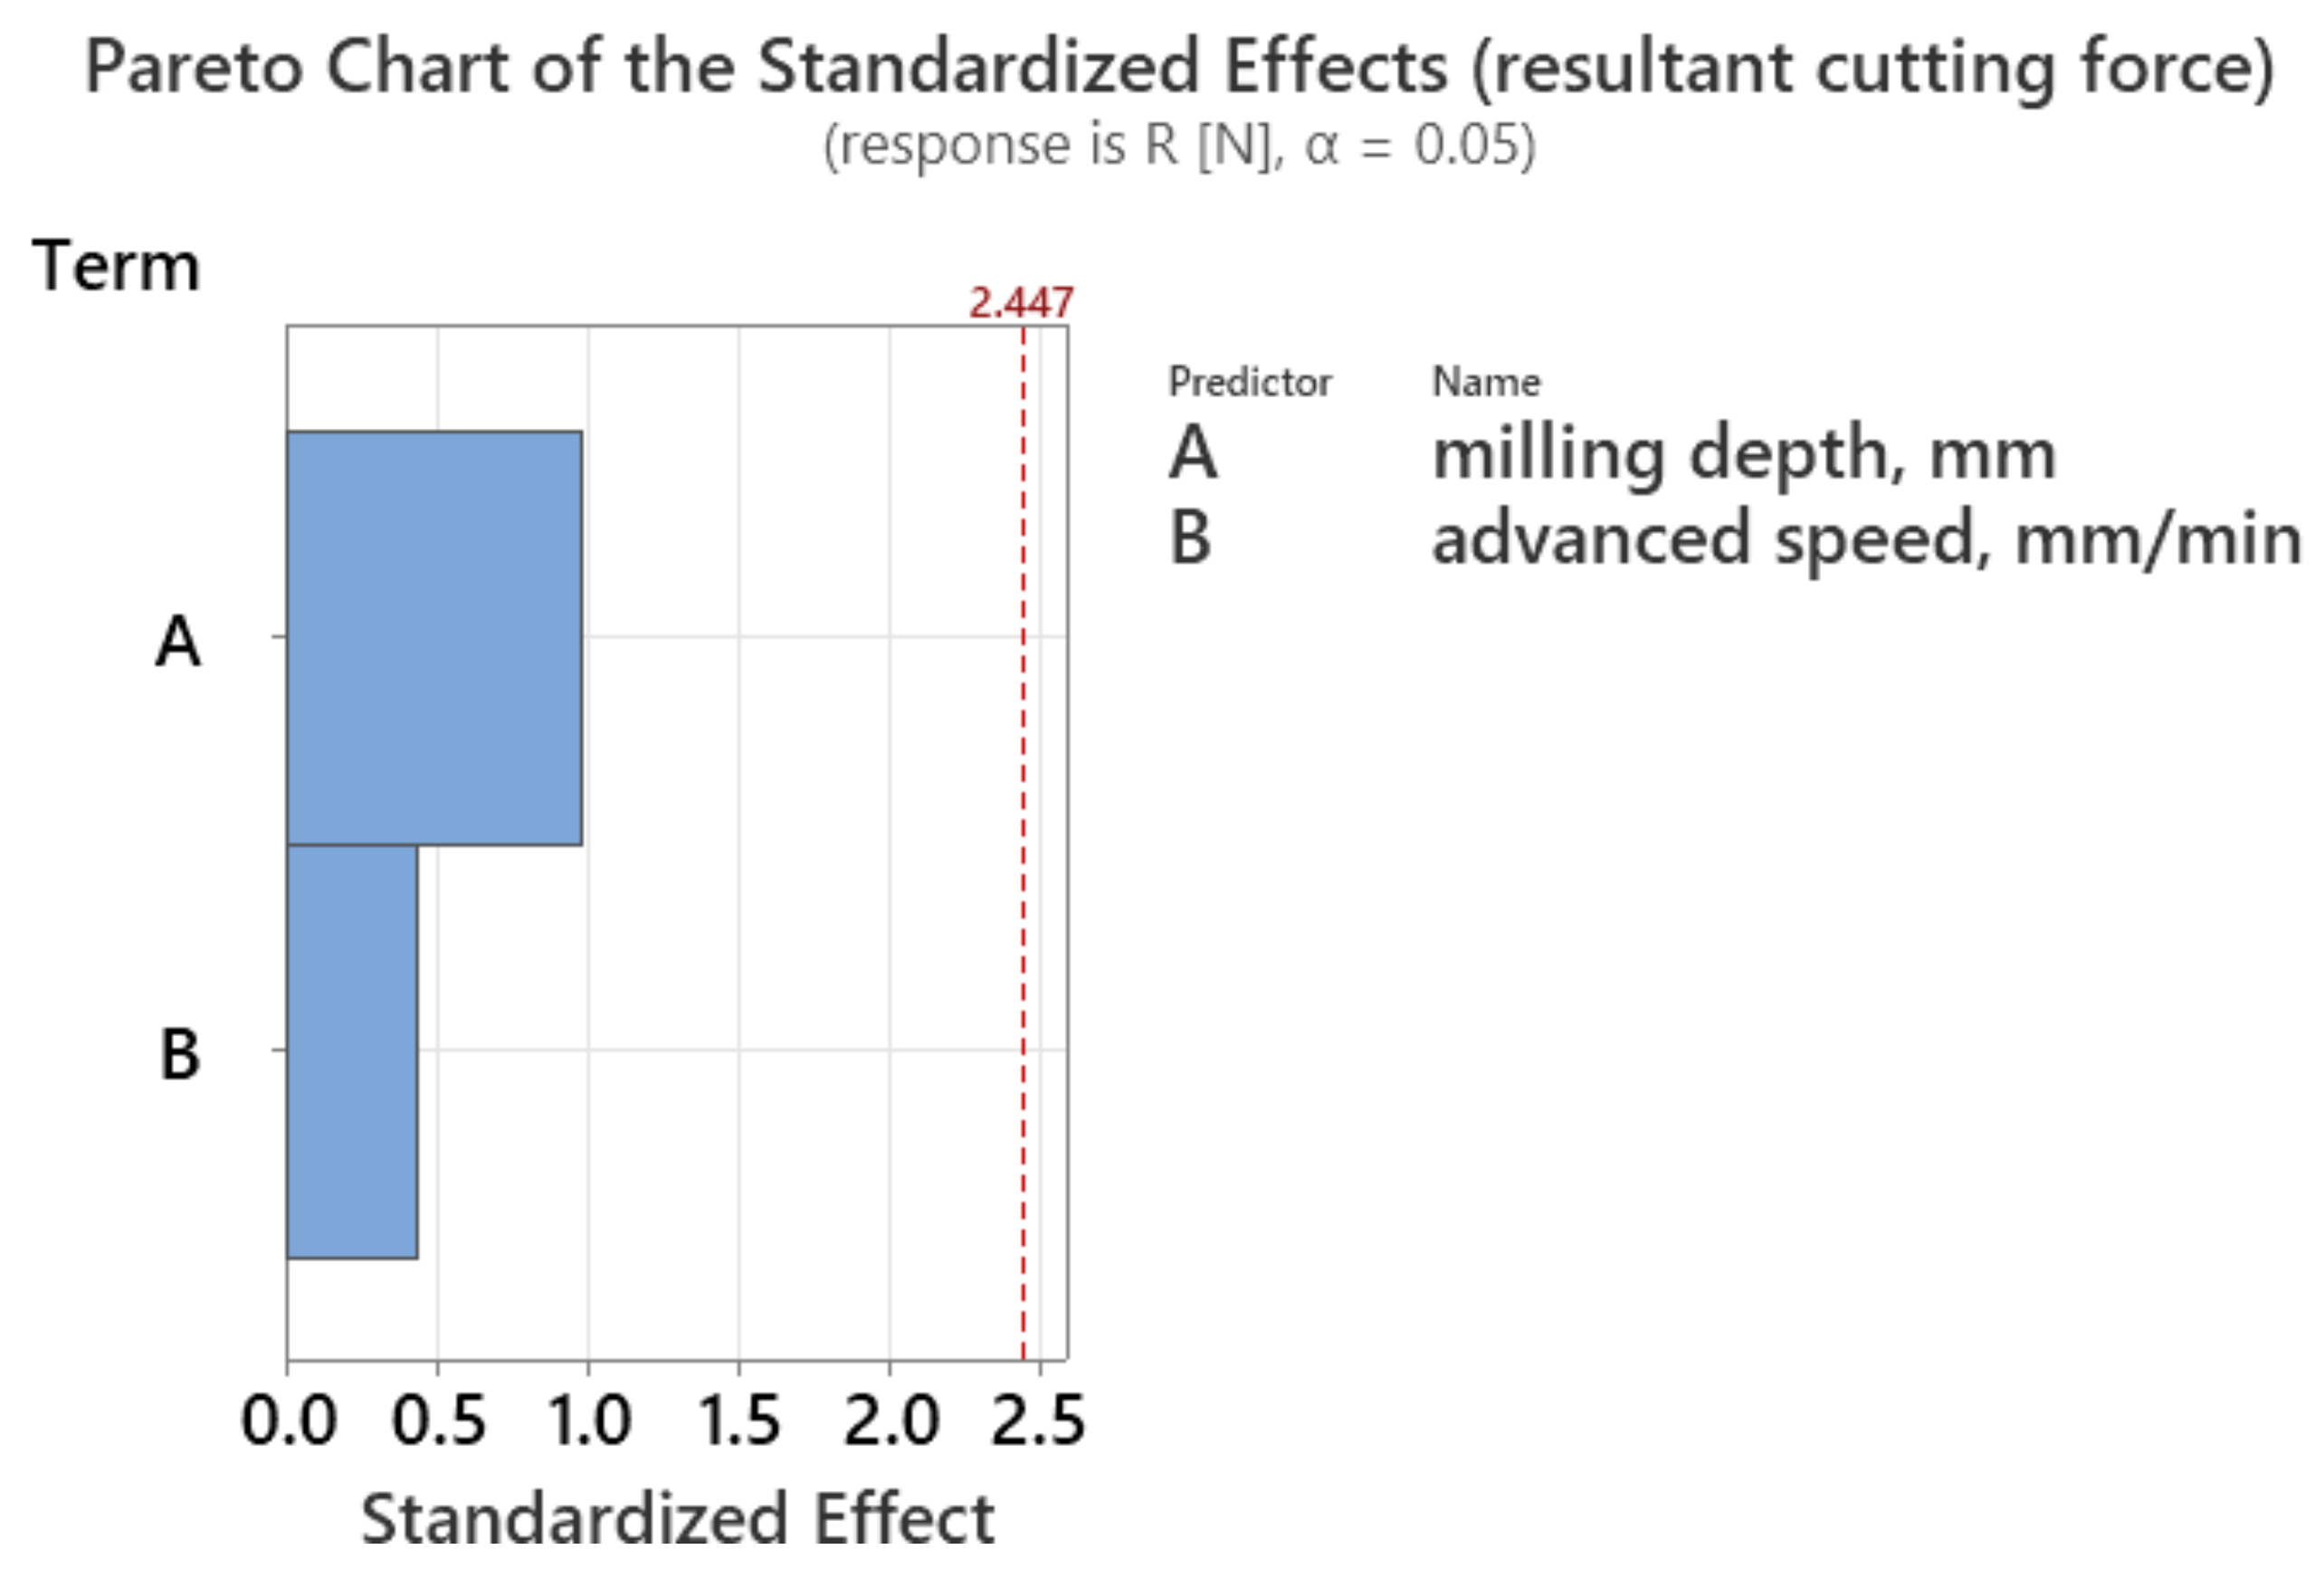
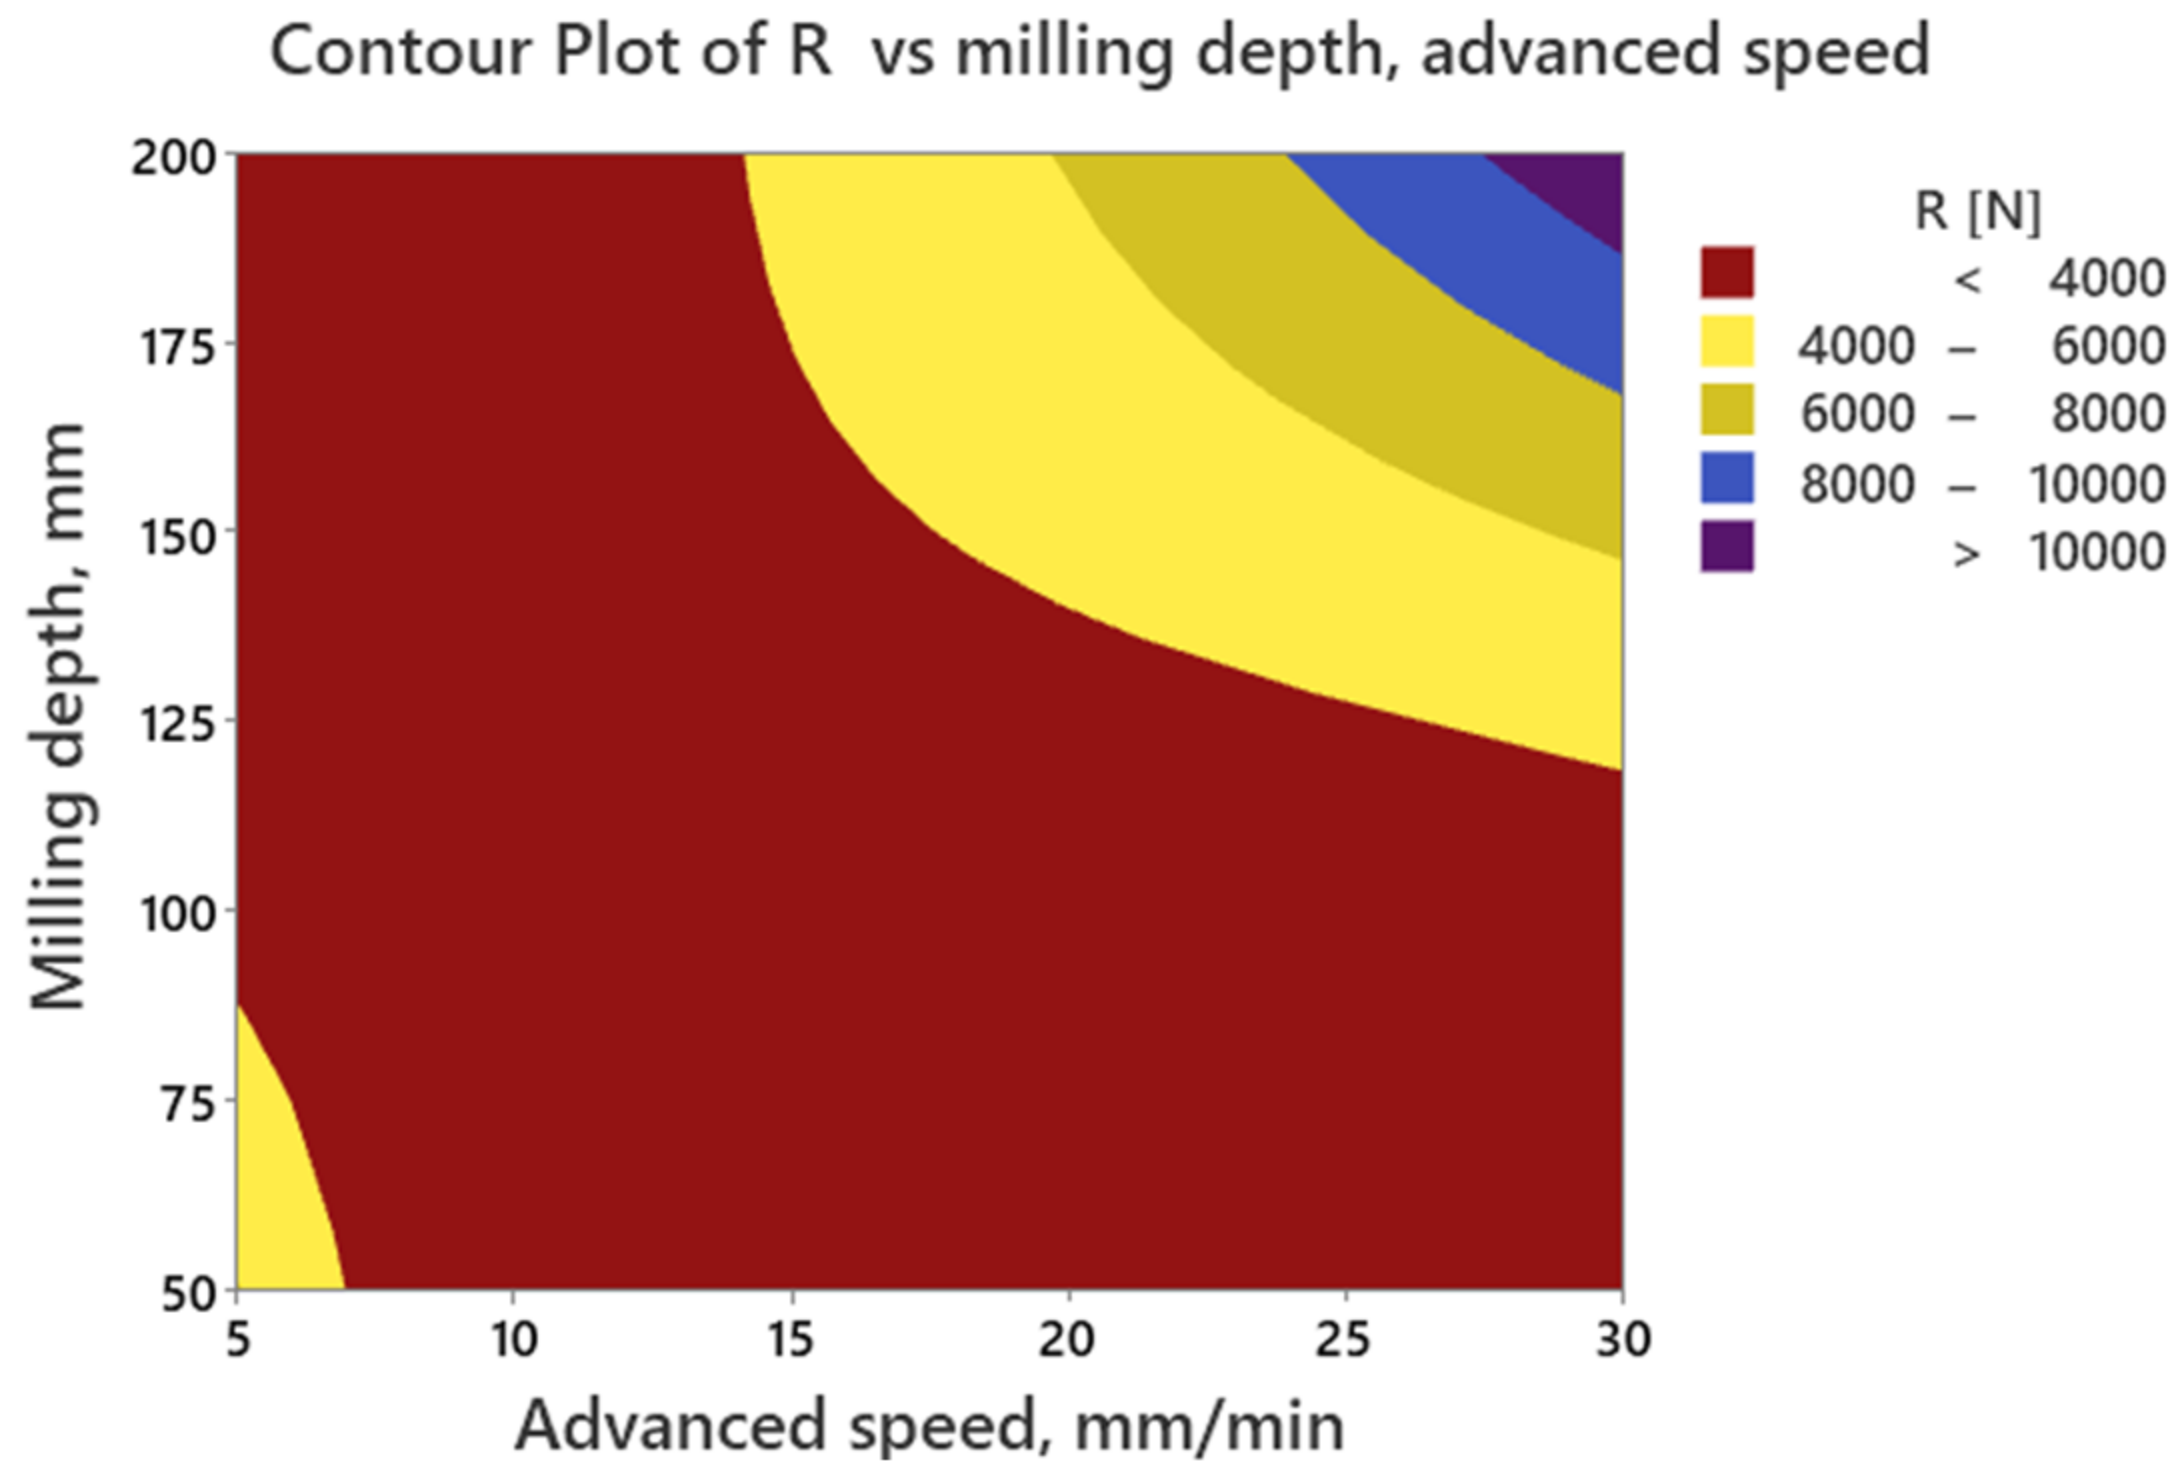
Resultant Cutting Force
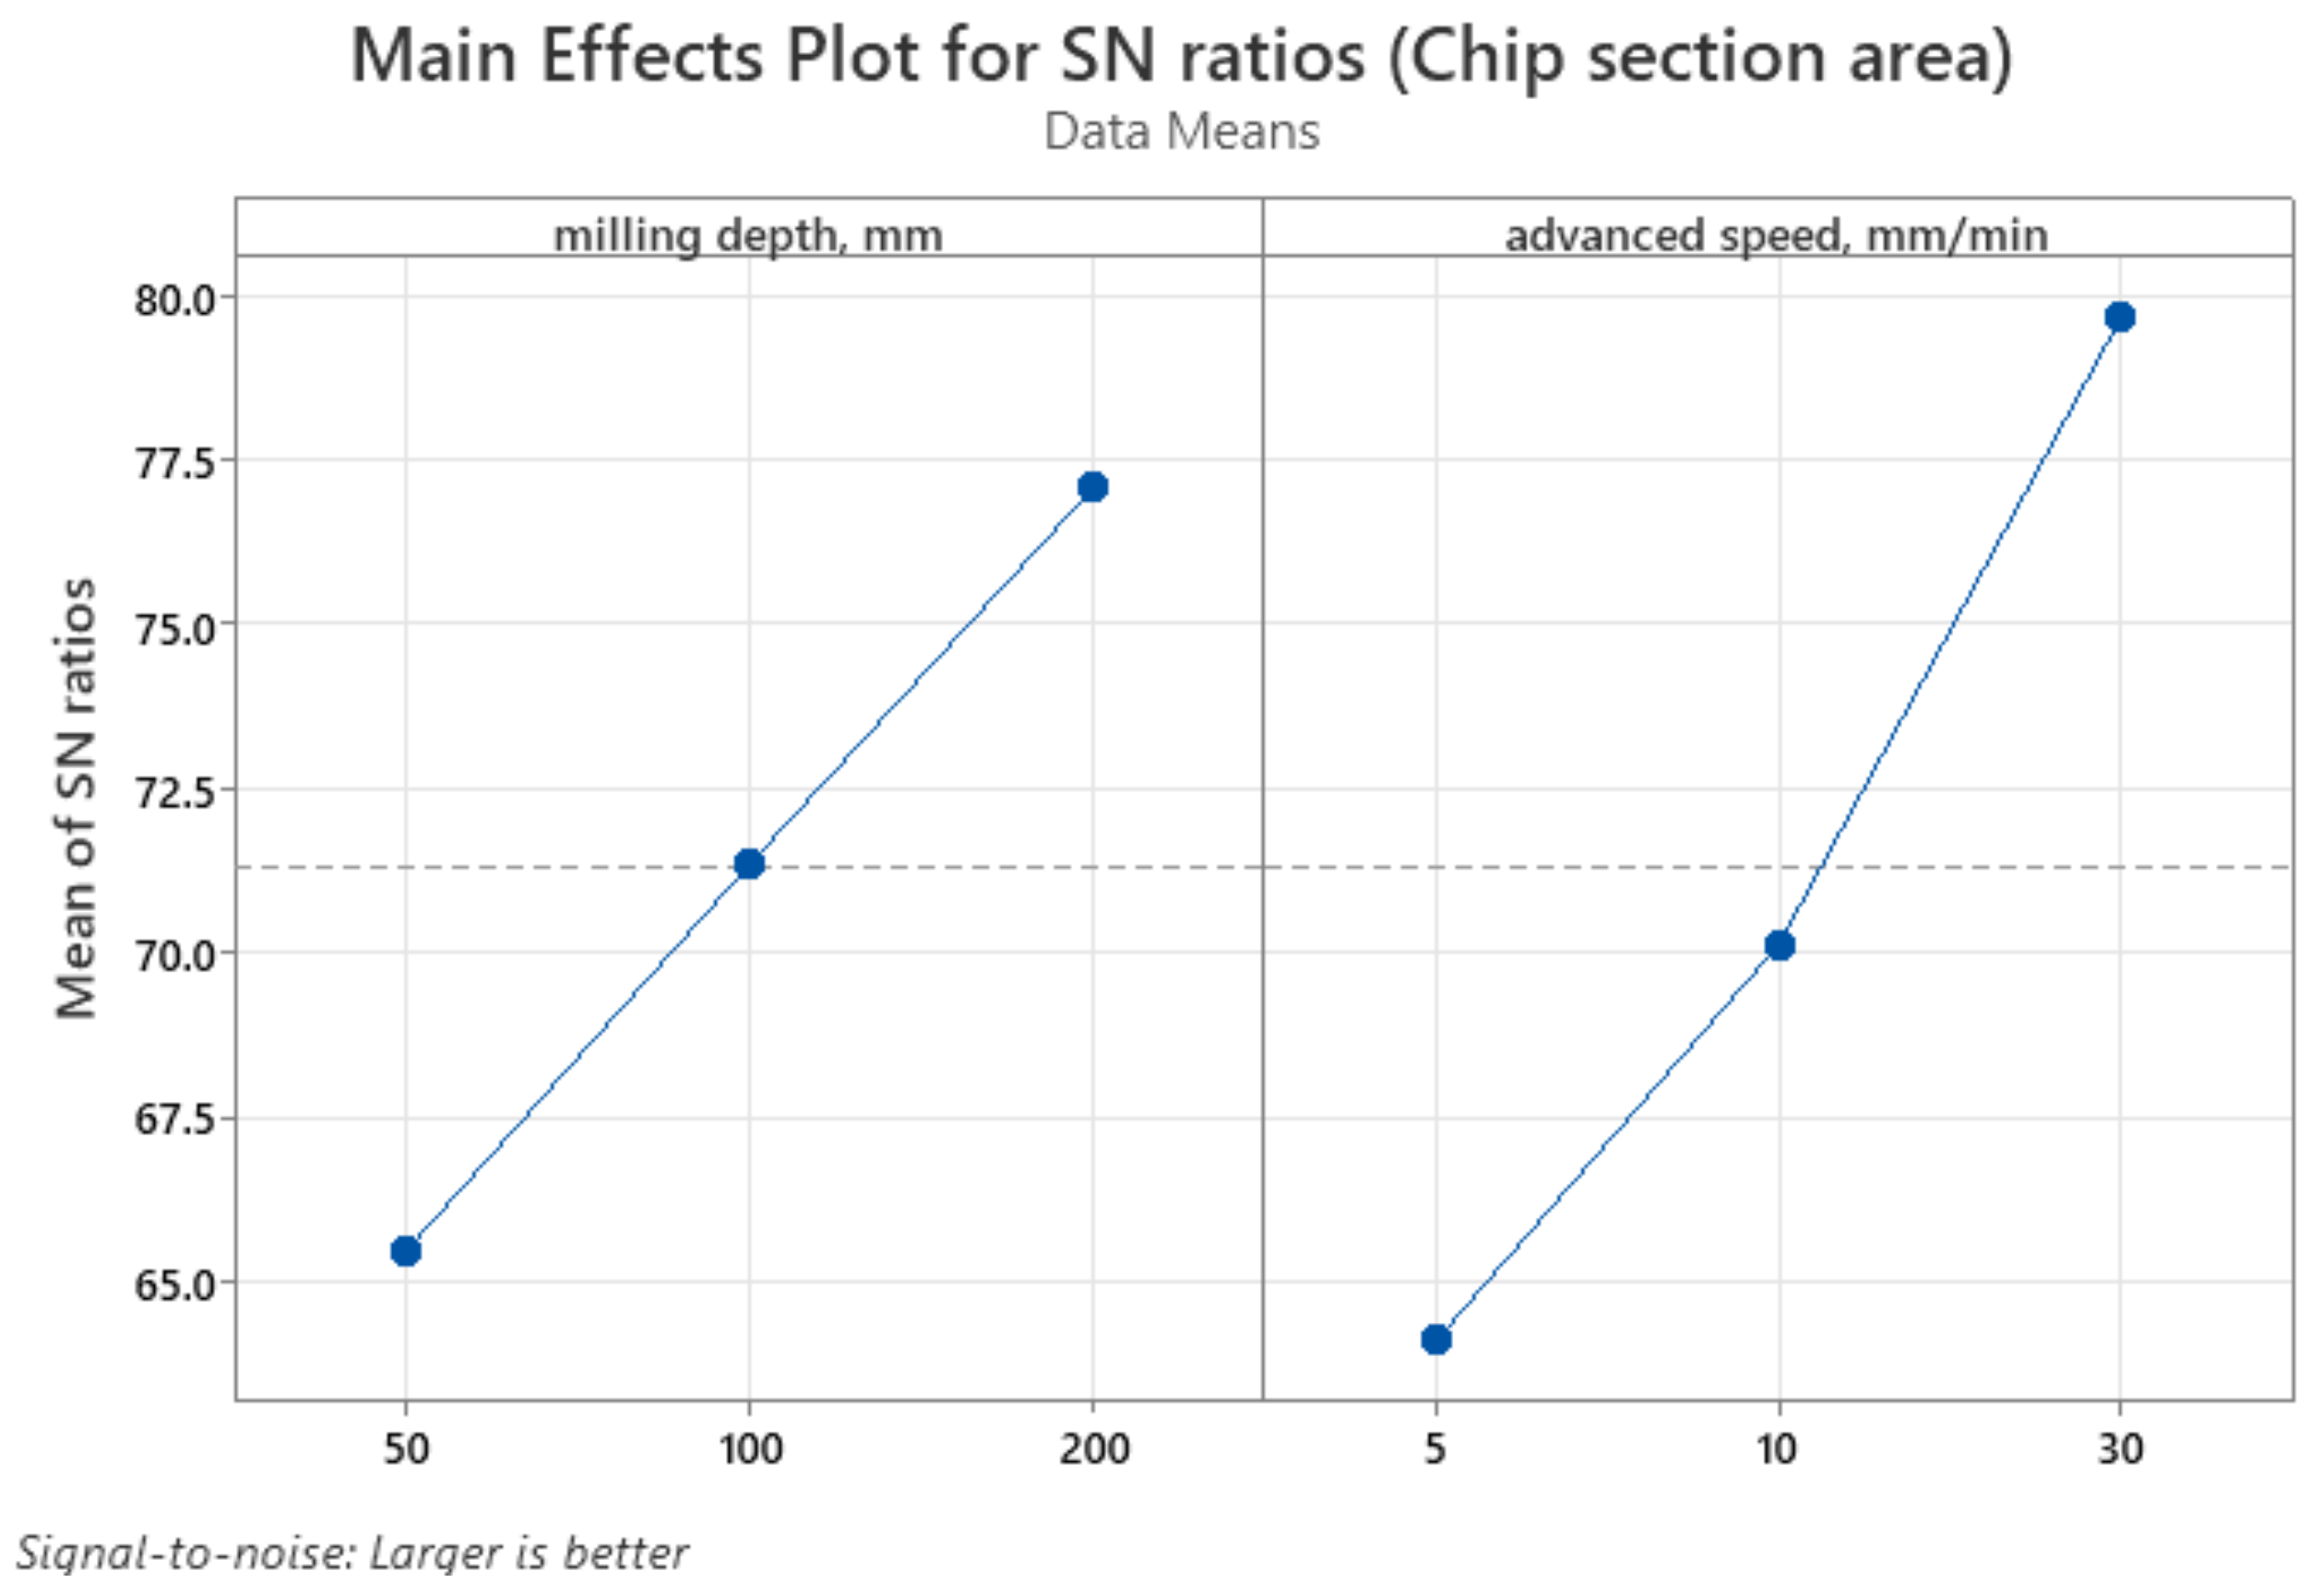
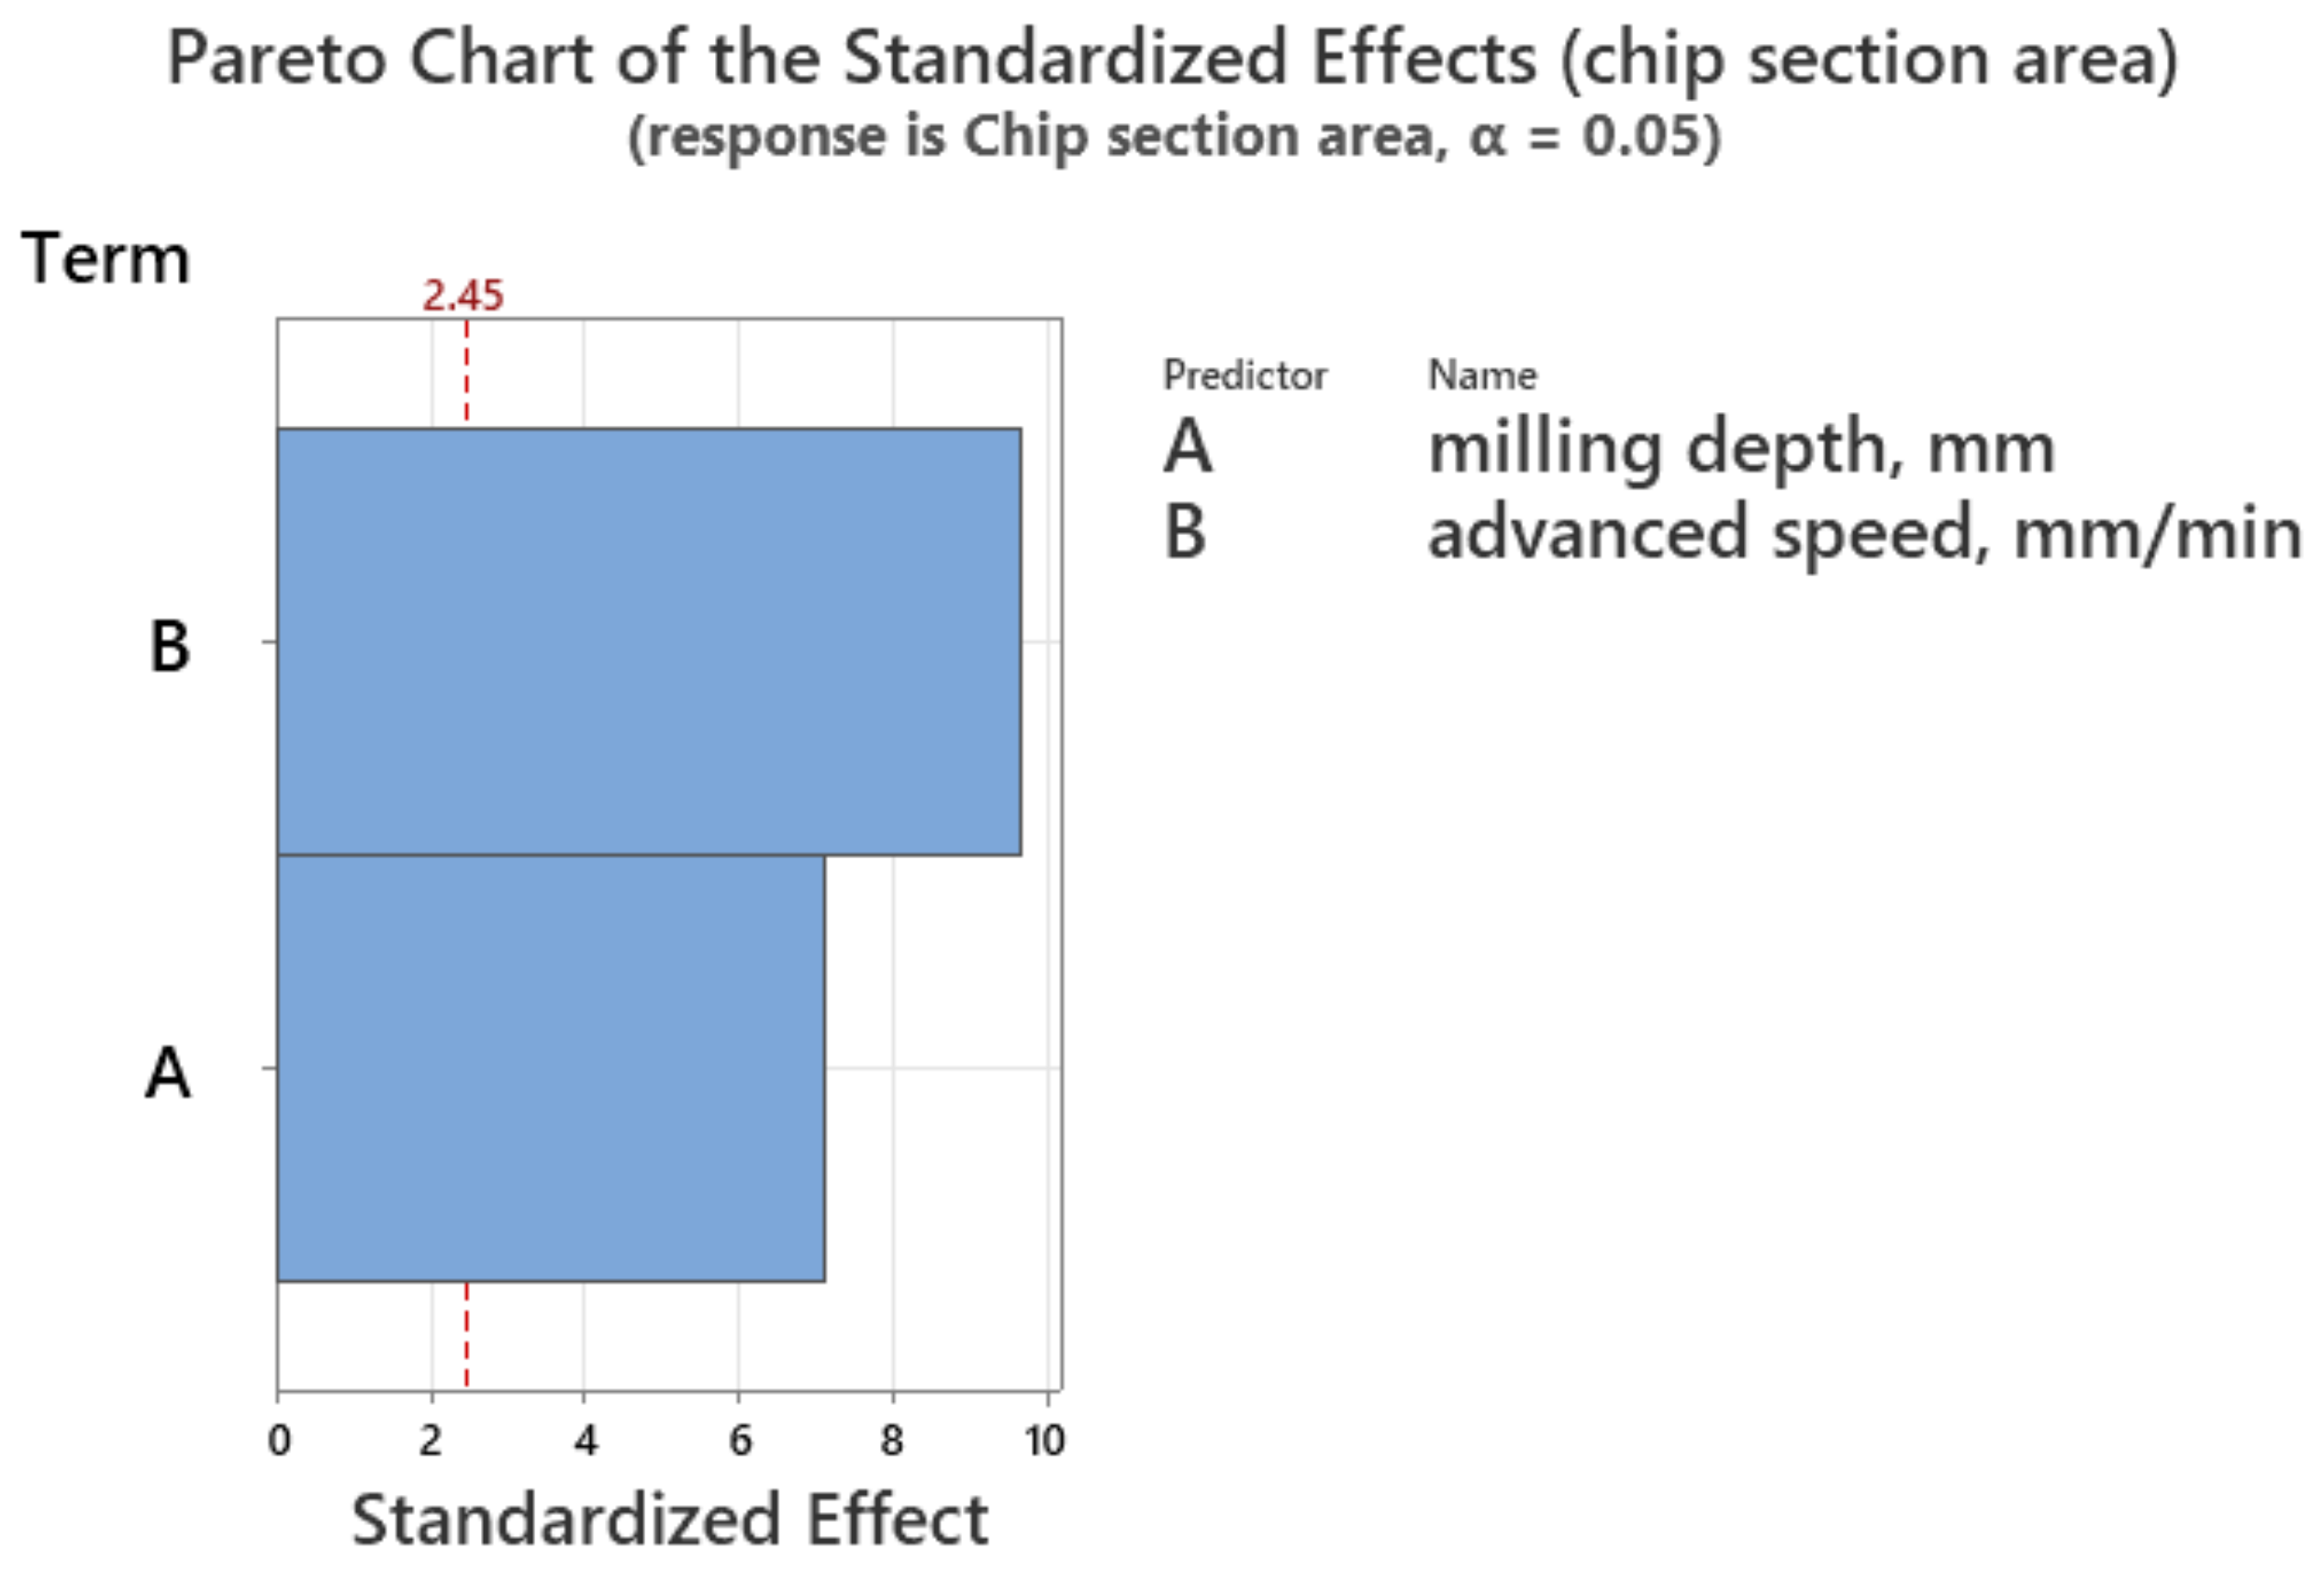
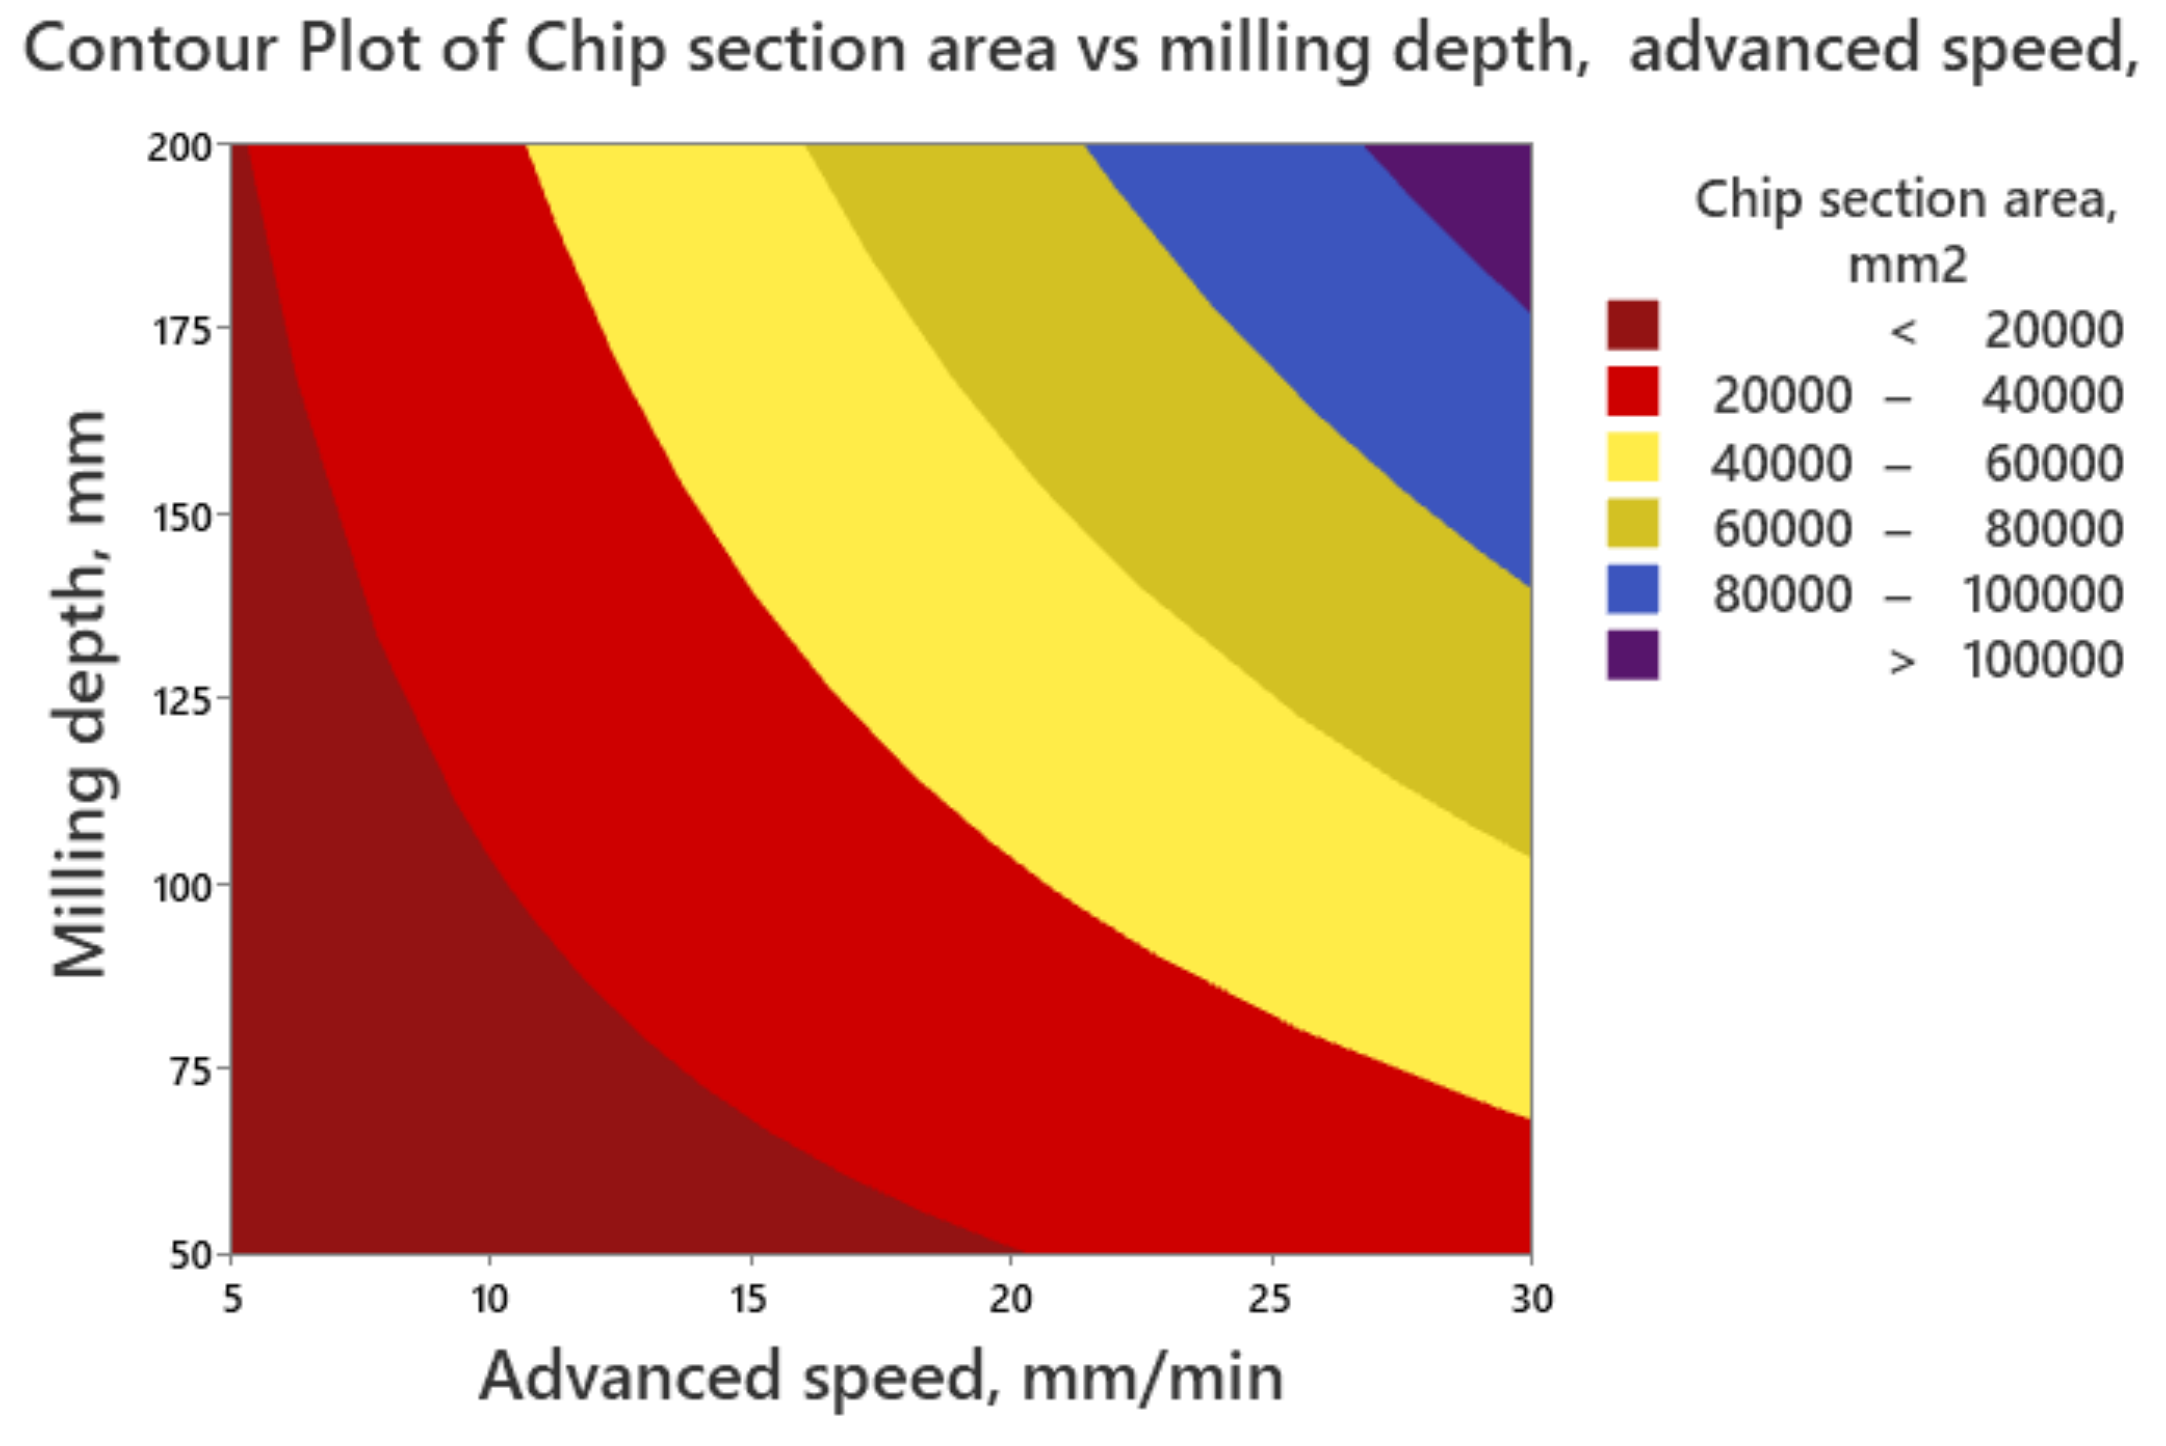
The results from Table 10 and Figure 19 and Figure 20 show that milling depth is the most significant factor for resulting cutting force, having a contribution of 14.41%. Similarly, in [27,33] it was shown that the cutting depth was the most important parameter affecting the resultant force.
Also, the graphs from Figure 19 allow for establishing the optimal combination of milling parameters for minimum resultant cutting force, namely 100 mm milling depth and 10 mm/min advanced speed.
In Figure 21, we present the contour plot for cutting resultant force in order to highlight the interaction and pattern between the considered variables. Analyzing this graph, it can be observed that for avoiding great cutting forces on the milling tooth, an advanced speed greater than 25 m/min and a milling depth greater than 175 mm should not be used.

Chip Section Area

The results from Table 11 and Figure 22 and Figure 23 show that advanced speed is the most significant factor for chip section area, having a contribution of 62.01%.
The graphs from Figure 23 indicate that the optimal combination of milling parameters for maximum chip section area are 200 mm milling depth and 30 mm/min advanced speed.
The contour plot from Figure 24 shows that as the milling depth and advanced speed increase, the chip section area becomes greater, leading to improved milling process efficiency.

4. Conclusions

This study used a comprehensive approach based on Taguchi-GRA to identify the optimal process parameters for minimizing the resultant cutting force and maximizing the chip section area, in case of milling asphalt clothing. The efficiency of the milling process was quantified by the authors based on the amount of chips removed (calculating the chip thickness area), correlating it with the cutting forces. Milling efficiency is a critical consideration in machining processes, and understanding the relationship between the amount of chips removed and the cutting forces is key to optimizing the process for improved productivity, reduced costs, and enhanced tool life.
The milling process was simulated using DEM to establish the values of cutting forces acting on milling tooth. Additionally, an ANOVA analysis was performed to determine the influence levels of various milling parameters on the milling process performance. The outcomes of the numerical and statistical evaluations are as follows:
The multi-response optimization analysis successfully identified the optimal parameters for achieving the objectives of minimizing the resultant cutting force and maximizing the chip section area. The recommended values for these parameters are a milling depth of 200 mm and an advanced speed of 30 mm/min;
The ANOVA analysis provided valuable insights into the influence levels of various milling parameters on the milling process performance. Among the milling parameters, advanced speed was found to have the highest significance in shaping multiple performance characteristics;
Notably, the Pareto chart and ANOVA results revealed that milling depth was the primary parameter influencing the resultant cutting force, while advanced speed was the most critical factor affecting the chip section area;
This study’s results highlight the varying sensitivities of milling parameters concerning cutting force and chip section area. Understanding these sensitivities can aid in making informed decisions during milling process planning and parameter selection. Engineers and operators can adjust the milling depth and advanced speed based on the desired balance between cutting force reduction and chip section area maximization;
By identifying the optimal process parameters, this study contributes to sustainable milling practices. The recommended parameters can lead to reduced energy consumption and improved tool life, contributing to cost savings and environmental benefits;
The successful implementation of the Taguchi-based Grey Relational Analysis showcases its versatility as a robust optimization technique. This method can be applied to other manufacturing processes, enabling researchers and practitioners to optimize multiple performance characteristics simultaneously;
DEM simulations provide valuable insights into the interaction between asphalt pavement and cutting tooth during milling processes, but they have limitations that need to be considered. These limitations include simplified material representation, the choice of contact models, computational cost, and challenges in calibration and validation. The simulation was based on considering the adhesion forces at the level of the aggregates that constitute the asphalt pavement. By incorporating adhesion forces, the DEM simulation aimed to accurately represent the interaction between the tooth and the asphalt particles, providing valuable insights into the cutting process. The consideration of adhesion forces at the aggregate level in the asphalt pavement simulation is essential for accurately representing the behavior of the material during the cutting process. These adhesion forces play a significant role in determining the cutting forces experienced by the tooth, and their proper incorporation in the DEM simulation enhances the reliability and realism of the results.
While this study addresses important aspects of milling efficiency, it can be used as a basis for further research focused on investigating the effects of varying tool geometries, different cutting strategies, and alternative materials to provide a more comprehensive understanding of the milling process and its potential optimizations.

Author Contributions

Conceptualization, M.G.P.; Methodology, M.G.P.; Software, M.T. and C.N.I.; Investigation, T.D., M.G.P., M.T. and C.N.I.; Resources, T.D.; Writing—original draft, M.T. and C.N.I.; Supervision, M.G.P. All authors have read and agreed to the published version of the manuscript.

Funding

This research received no external funding.

Data Availability Statement

Data are contained within the article.

Conflicts of Interest

The authors declare no conflict of interest.

References

  1. Furmanov, D.; Chizhov, V.; Tyuremnov, I.; Troshin, D. Loads on Cutter Teeth for Removing Asphalt Pavement. E3S Web Conf. 2019, 97, 06031. [Google Scholar] [CrossRef] [Green Version]
  2. Song, M.; Buck, D.; Yu, Y.; Du, X.; Guo, X.; Wang, J.; Zhu, Z. Effects of Tool Tooth Number and Cutting Parameters on Milling Performance for Bamboo–Plastic Composite. Forests 2023, 14, 433. [Google Scholar] [CrossRef]
  3. Dumitru, T.; Ilincă, C.; Tănase, M. Influence of Technological Parameters on the Behaviour in Operation of the Asphalt Milling Equipment. IOP Conf. Ser. Mater. Sci. Eng. 2022, 1262, 012018. [Google Scholar] [CrossRef]
  4. Dumitru, T.; Petrescu, M.G.; Tănase, M.; Laudacescu, E. The Application of Tribological Tests to Study the Wear Behavior of Asphalt Cutter Teeth: An Experimental Investigation Using Baroid Tribometer. Coatings 2023, 13, 1251. [Google Scholar] [CrossRef]
  5. Niță, A.; Petrescu, M.G.; Dumitru, T.; Burlacu, A.; Tănase, M.; Laudacescu, E.; Ramadan, I. Experimental Research on the Wear Behavior of Materials Used in the Manufacture of Components for Cement Concrete Mixers. Materials 2023, 16, 2326. [Google Scholar] [CrossRef]
  6. Niță, A.; Laudacescu, E.; Petrescu, M.G.; Dumitru, T.; Burlacu, A.; Bădoiu, D.G.; Tănase, M. Experimental Research Regarding the Effect of Mineral Aggregates on the Wear of Mixing Blades of Concrete Mixers. Materials 2023, 16, 5047. [Google Scholar] [CrossRef]
  7. Guan, Y.; Guan, H. Algorithms for Modelling 3D Flexible Pavements and Simulation of Vibration Cutting by the DEM. Int. J. Pavement Eng. 2019, 20, 1127–1139. [Google Scholar] [CrossRef]
  8. Seibi, A.C.; Sharma, M.G.; Ali, G.A.; Kenis, W.J. Constitutive Relations for Asphalt Concrete Under High Rates of Loading. Transp. Res. Rec. 2001, 1767, 111–119. [Google Scholar] [CrossRef]
  9. Chen, J.; Pan, T.; Huang, X. Discrete Element Modeling of Asphalt Concrete Cracking Using a User-Defined Three-Dimensional Micromechanical Approach. J. Wuhan Univ. Technol. Mat. Sci. Edit. 2011, 26, 1215–1221. [Google Scholar] [CrossRef]
  10. Xie, S.; Yi, J.; Wang, H.; Yang, S.-H.; Xu, M.; Feng, D. Mechanical Response Analysis of Transverse Crack Treatment of Asphalt Pavement Based on DEM. Int. J. Pavement Eng. 2022, 23, 2206–2226. [Google Scholar] [CrossRef]
  11. Wu, J.; Li, D.; Zhu, B.; Wu, C. Milling Process Simulation of Old Asphalt Mixture by Discrete Element. Constr. Build. Mater. 2018, 186, 996–1004. [Google Scholar] [CrossRef]
  12. Abbas, A.; Masad, E.; Papagiannakis, T.; Shenoy, A. Modelling Asphalt Mastic Stiffness Using Discrete Element Analysis and Micromechanics-Based Models. Int. J. Pavement Eng. 2005, 6, 137–146. [Google Scholar] [CrossRef]
  13. Zhou, L.; Liu, Y.; Wang, Z.; Li, Y.; Zhang, K.; Zhang, G. Numerical Analysis of Asphalt Concrete Milling Process Based on Multicomponent Modeling; Mechanical Engineering School of Xiangtan University: Xiangtan, China, 2020; preprint. [Google Scholar]
  14. Three-Dimensional Finite Element Simulation and Experimental Validation of Sliding Wear|Elsevier Enhanced Reader. Available online: https://reader.elsevier.com/reader/sd/pii/S0043164822001612?token=95B30975193AE01EC6C3E028237EE4534B1133BCD4C7515D49FF51C6163F19B365EE2F600B0F203D3488507F3E44124E&originRegion=eu-west-1&originCreation=20230515170834 (accessed on 15 May 2023).
  15. Iovanas, D.M.; Binchiciu, H.; Voiculescu, I.; Binchiciu, E.F. Factors That Influence the Quality Constant of the Manufacturing Process for Asphalt Milling Knifes. MATEC Web Conf. 2017, 121, 03010. [Google Scholar] [CrossRef]
  16. Zaumanis, M.; Loetscher, D.; Mazor, S.; Stöckli, F.; Poulikakos, L. Impact of Milling Machine Parameters on the Properties of Reclaimed Asphalt Pavement. Constr. Build. Mater. 2021, 307, 125114. [Google Scholar] [CrossRef]
  17. Blum, J.; Anderegg, R. Modelling of an Innovative Technology for Pavement Milling. IFAC-PapersOnLine 2016, 49, 591–597. [Google Scholar] [CrossRef]
  18. Iovanas, D.M.; Dumitrascu, A.-E. Reliability Estimation of the Milling Machines Teeth Obtained by Welding Deposition Process. MATEC Web Conf. 2017, 121, 02003. [Google Scholar] [CrossRef]
  19. Makange, N.R.; Ji, C.; Torotwa, I. Prediction of Cutting Forces and Soil Behavior with Discrete Element Simulation. Comput. Electron. Agric. 2020, 179, 105848. [Google Scholar] [CrossRef]
  20. Jiang, Y.-Z.; Liao, G.-W.; Zhu, S.-S.; Hu, Y.-F. Investigation on Cutting Resistance Characteristic of Bucket Wheel Excavator Using DEM and DOE Methods. Simul. Model. Pract. Theory 2021, 111, 102339. [Google Scholar] [CrossRef]
  21. Zhang, X.; Zhang, L.; Hu, X.; Wang, H.; Shi, X.; Ma, X. Simulation of Soil Cutting and Power Consumption Optimization of a Typical Rotary Tillage Soil Blade. Appl. Sci. 2022, 12, 8177. [Google Scholar] [CrossRef]
  22. Altas, E.; Gokkaya, H.; Karatas, M.; Ozkan, D. Analysis of Surface Roughness and Flank Wear Using the Taguchi Method in Milling of NiTi Shape Memory Alloy with Uncoated Tools. Coatings 2020, 10, 1259. [Google Scholar] [CrossRef]
  23. Liu, D.; Liu, Z.; Wang, B. Effect of Cutting Parameters on Tool Chipping Mechanism and Tool Wear Multi-Patterns in Face Milling Inconel 718. Lubricants 2022, 10, 218. [Google Scholar] [CrossRef]
  24. Mohapatra, S.; Sarangi, H.; Kumar Mohanty, U. Optimization of Process Parameters for Centrifugal Cast Single Point Cutting Tools Using Grey-Taguchi Technique. Mater. Today Proc. 2023, 74, 750–755. [Google Scholar] [CrossRef]
  25. Philip Selvaraj, D.; Chandramohan, P.; Mohanraj, M. Optimization of Surface Roughness, Cutting Force and Tool Wear of Nitrogen Alloyed Duplex Stainless Steel in a Dry Turning Process Using Taguchi Method. Measurement 2014, 49, 205–215. [Google Scholar] [CrossRef]
  26. Alagarsamy, S.V.; Ravichandran, M.; Meignanamoorthy, M.; Sakthivelu, S.; Dineshkumar, S. Prediction of Surface Roughness and Tool Wear in Milling Process on Brass (C26130) Alloy by Taguchi Technique. Mater. Today Proc. 2020, 21, 189–193. [Google Scholar] [CrossRef]
  27. Kanchana, J.; Prasath, V.; Krishnaraj, V.; Priyadharshini, B.G. Multi Response Optimization of Process Parameters Using Grey Relational Analysis for Milling of Hardened Custom 465 Steel. Procedia Manuf. 2019, 30, 451–458. [Google Scholar] [CrossRef]
  28. Shagwira, H.; Mbuya, T.O.; Akinlabi, E.T.; Mwema, F.M.; Tanya, B. Optimization of Material Removal Rate in the CNC Milling of Polypropylene + 60 Wt% Quarry Dust Composites Using the Taguchi Technique. Mater. Today Proc. 2021, 44, 1130–1132. [Google Scholar] [CrossRef]
  29. Burlacu, A.; Petrescu, M.G.; Dumitru, T.; Niță, A.; Tănase, M.; Laudacescu, E.; Ramadan, I.; Ilincă, C. Numerical Approach Regarding the Effect of the Flight Shape on the Performance of Rotary Dryers from Asphalt Plants. Processes 2022, 10, 2339. [Google Scholar] [CrossRef]
  30. Burlacu, A.I.; Tănase, M.; Ilincă, C.; Petrescu, M.G. Optimizing the Trajectory of Aggregates in Drying Units from the Asphalt Plants. IOP Conf. Ser. Mater. Sci. Eng. 2022, 1262, 012003. [Google Scholar] [CrossRef]
  31. Niţă, A.; Laudacescu, E.; Ramadan, I.N.; Petrescu, M.G. An Example for Determining the Physical Parameters Used in DEM Modelling for the Interaction Process between Aggregates and Working Equipment. IOP Conf. Ser. Mater. Sci. Eng. 2022, 1262, 012028. [Google Scholar] [CrossRef]
  32. John, J.; Devjani, D.; Ali, S.; Abdallah, S.; Pervaiz, S. Optimization of 3D Printed Polylactic Acid Structures with Different Infill Patterns Using Taguchi-Grey Relational Analysis. Adv. Ind. Eng. Polym. Res. 2023, 6, 62–78. [Google Scholar] [CrossRef]
  33. Kalyon, A.; Günay, M.; Özyürek, D. Application of Grey Relational Analysis Based on Taguchi Method for Optimizing Machining Parameters in Hard Turning of High Chrome Cast Iron. Adv. Manuf. 2018, 6, 419–429. [Google Scholar] [CrossRef]
  34. Shi, K.; Zhang, D.; Ren, J.; Yao, C.; Yuan, Y. Multiobjective Optimization of Surface Integrity in Milling TB6 Alloy Based on Taguchi-Grey Relational Analysis. Adv. Mech. Eng. 2014, 6, 280313. [Google Scholar] [CrossRef]
  35. Available online: https://faculty.ksu.edu.sa/sites/default/files/lecture-05-milling_-_dr_saqib_2018_final.pdf (accessed on 15 May 2023).
  36. Bobrenkov, O.A.; Khasawneh, F.A.; Butcher, E.A.; Mann, B.P. Analysis of Milling Dynamics for Simultaneously Engaged Cutting Teeth. J. Sound Vib. 2010, 329, 585–606. [Google Scholar] [CrossRef]
Figure 1. Milling schematization: n—milling drum rotation speed, rpm; vf—speed in the advanced direction, m/min; ap—milling depth, mm; fd—tooth advance, mm/tooth [4].
Processes 11 02401 g001
Figure 2. The flowchart of the performed analysis.
Processes 11 02401 g002
Figure 3. The geometry of milling cutter tooth: (a) real Wirtgen tooth; (b) dimension (in mm) of tooth; (c) the model used in numerical simulations.
Processes 11 02401 g003
Figure 4. The geometrical model corresponding to milling depth ap = 100 mm: (a) geometrical characteristics; (b) detailed view.
Processes 11 02401 g004
Figure 5. The contact forces representation according to [3] (a) the action of contact forces; (b) loading–unloading process.
Processes 11 02401 g005
Figure 6. The models adopted in the DEM analysis for the contact forces.
Processes 11 02401 g006
Figure 7. The geometry of chip during milling process.
Processes 11 02401 g007
Figure 8. Asphalt milling process simulation through DEM.
Processes 11 02401 g008
Figure 9. Cutting forces variation during milling process simulation for tooth support: (a) Ox direction; (b) Oz direction.
Processes 11 02401 g009
Figure 10. Cutting forces variation during milling process simulation for tooth tip: (a) Ox direction; (b) Oz direction.
Processes 11 02401 g010aProcesses 11 02401 g010b
Figure 11. The resulting cutting forces and chip section area for 1 tooth.
Processes 11 02401 g011
Figure 12. The resulting cutting forces and chip section area for 2 teeth.
Processes 11 02401 g012
Figure 13. The resulting cutting forces and chip section area for 4 teeth.
Processes 11 02401 g013
Figure 14. The resulting cutting forces and chip section area for 6 teeth.
Processes 11 02401 g014
Figure 15. The resulting cutting forces and chip section area for 8 teeth.
Processes 11 02401 g015
Figure 16. The resulting cutting forces and chip section area for 10 teeth.
Processes 11 02401 g016
Figure 17. S/N ratios for GRG.
Processes 11 02401 g017
Figure 18. Response optimizer results.
Processes 11 02401 g018
Figure 19. S/N ratios for resultant cutting force.
Processes 11 02401 g019
Figure 20. Pareto chart for resultant cutting force.
Processes 11 02401 g020
Figure 21. Contour plot for cutting resultant force.
Processes 11 02401 g021
Figure 22. S/N ratios for chip section area.
Processes 11 02401 g022
Figure 23. Pareto chart for chip section area.
Processes 11 02401 g023
Figure 24. Contour plot for chip section area.
Processes 11 02401 g024
Table 1. Milling process parameters.
Milling Depth, ap
[mm]
Milling Drum Rotation Speed, n
[rpm]
Speed in the Advance Direction, vf
[m/min]
Angle of Attack, α
[°]
50/100/2001005/10/3060
Table 2. The elasto-mechanical characteristics of the materials used in the simulation.
CharacteristicsMaterial Type
Asphalt ClothingYG6C Tungsten
Carbide (Tooth Tip)
42CrMo4
(Tooth Support)
Reference temperature
[°C]
212121
Specific weight
[g/cm3]
2.40814.957.800
Poisson coefficient0.350.350.30
Longitudinal modulus of elasticity
[MPa]
5014686,000200,000
Transverse modulus of elasticity
[MPa]
5571762,222333,333
Table 3. The coefficients used to represent the interaction in the simulation.
CoefficientInteraction Elements
Stone-StoneStone–Tooth TipStone–Tooth Support
Static friction0.60.40.4
Dynamic friction0.60.10.1
Restitution0.3
Table 4. Parameters and levels used in DOE analysis.
ParameterLevel
123
Milling depth, mm50100200
Advanced speed, m/min51030
Table 5. The results obtained with DEM.
Simulation
No.
Milling
Parameters
Component Forces Acting
on Tooth Support and Tip
Total Forces
Components
Resultant Force
ap
[mm]
vf
[m/min]
Fx, Supp.
[N]
Fz, Supp.
[N]
Fx, Tip
[N]
Fz, Tip
[N]
Fx, Total
[N]
Fz, Total
[N]
R
[N]
1.5051913.34576.62366.64295428042956063.4
2.5010637.71525.5788.81431.61426.61431.62021.1
3.5030850.320341051.81908.81902.21908.82694.8
4.10051133.82712.11402.42545.12536.32545.13593.1
5.10010873.92090.510811961.919551961.92769.7
6.10030952.72278.91178.42138.62131.12138.63019.2
7.2005986.82360.51220.62215.22207.52215.23127.3
8.20010937.82243.311602105.22097.92105.22972.1
9.200303682.98809.64555.68267.48238.68267.411,671.5
Table 6. Chip section area in function of milling parameters.
Milling
Parameters
Number of Teeth
ap
[mm]
vf
[m/min]
1 Tooth2 Teeth4 Teeth6 Teeth8 Teeth10 Teeth
Chip Section Area, mm2
5054925.62462.81231.4820.9615.7492.6
50109851.24925.62462.81641.91231.4985.1
503029,553.514,776.87388.44925.63694.22955.4
10059696.84848.42424.21616.11212.1969.7
1001019,393.69696.84848.43232.32424.21939.4
1003058,180.829,090.414,545.29696.87272.65818.1
200518,739.09369.54684.83123.22342.41873.9
2001037478.018,739.09369.56246.34684.83747.8
20030112,434.056,217.028,108.518,739.014,054.311,243.4
Table 7. GRA results.
Simulation
No.
Normalized DataGrey Relation Coefficient
GRC
Grade
RARA
10.5810.0000.5440.3330.439
21.0000.0461.0000.3440.672
30.9300.2290.8770.3930.635
40.8370.0440.7540.3430.549
50.9220.1350.8660.3660.616
60.8970.4950.8290.4980.663
70.8850.1280.8130.3650.589
80.9010.3030.8350.4180.627
90.0001.0000.3331.0000.667
Table 8. ANOVA results analysis for GRG.
SourceDFSeq SSContributionAdj SSAdj MSF-Valuep-Value
Milling depth, mm20.0007602.50%0.0007600.0003800.220.814
Advanced speed, mm/min20.02260074.44%0.0226000.0113006.460.056
Error40.00700023.06%0.0070000.001750
Total80.030360100.00%
Table 9. Response table for GRG.
LevelMilling Depth, mmAdvanced Speed,
mm/min
10.58200.5256
20.60930.6381
30.62740.6551
Delta0.04540.1295
Rank21
Table 10. ANOVA results analysis for resultant cutting force.
SourceDFSeq SSContributionAdj SSAdj MSF-Valuep-Value
Regression218,928,51326.01%18,928,5139,464,2561.050.405
Milling depth, mm110,489,82514.41%10,489,82510,489,8251.170.321
Advanced speed, m/min18,438,68811.60%8,438,6888,438,6880.940.370
Error653,845,85673.99%53,845,8568,974,309
Total872,774,369100.00%
Table 11. ANOVA results analysis for chip section area.
SourceDFSeq SSContributionAdj SSAdj MSF-Valuep-Value
Regression27.272095.99%7.27203.6360271.780.000
Milling depth, mm12.574433.98%2.57442.5744050.820.000
Advanced speed, mm/min14.697662.01%4.69764.6976592.740.000
Error60.30394.01%0.30390.05065
Total87.5760100.00%
Disclaimer/Publisher’s Note: The statements, opinions and data contained in all publications are solely those of the individual author(s) and contributor(s) and not of MDPI and/or the editor(s). MDPI and/or the editor(s) disclaim responsibility for any injury to people or property resulting from any ideas, methods, instructions or products referred to in the content.

