Article

Modelling of Drinking Water Recarbonization in Fluidized Bed Reactor

1
Institute of Chemical and Environmental Engineering, Faculty of Chemical and Food Technology, Slovak University of Technology in Bratislava, Radlinského 9, 81237 Bratislava, Slovakia
2
Water Research Institute, Nábrežie arm. gen. L. Svobodu 5, 81249 Bratislava, Slovakia
*
Author to whom correspondence should be addressed.
Processes 2023, 11(11), 3209; https://doi.org/10.3390/pr11113209
Submission received: 14 October 2023 / Revised: 5 November 2023 / Accepted: 8 November 2023 / Published: 10 November 2023

Abstract

:
Calcium and magnesium are important not only for human health but also for reducing problems related to the corrosive and aggressive effects of soft water on drinking water distribution materials. Experimental and mathematical modeling of the recarbonization process aimed at increasing the content of these biogenic elements in water was carried out using the novelty of continuous laboratory- and pilot-scale fluidized bed reactors. A methodology for scaling-up the modeled system was extended with mathematical modeling. Water remineralization was performed using half-calcined dolomite (HCD) and CO2. The influence of operating conditions, i.e., Q(CO2), freshwater inflow, and HCD dose, on quality indicators of treated drinking water (c(Ca2+), c(Mg2+), c(Ca2+ + Mg2+) and Ca/Mg) was studied. Results show that the Mg2+ concentration is more significantly affected by the amount of HCD in the system and the flow of CO2, while the effect of freshwater inflow is less significant. At constant CO2 flow, the Ca2+ content decreases and the Mg2+ content increases as the tap water inflow increases, which results in a decrease in the Ca/Mg molar ratio. However, the Ca/Mg ratio can be effectively controlled by adding an appropriate amount of HCD at certain time intervals. Overproduction of ions is easily controlled by the CO2 flow.

1. Introduction

The content of Mg and Ca in drinking water is very low in many regions of Slovakia, which influences the health of the population. Moreover, low content of these biogenic elements negatively affects the water distribution system due to the aggressive and corrosive effect of water. Increasing the effect of biogenic elements is commonly referred to as recarbonization.
Several recarbonization methods are known and used depending on the drinking water composition and the country of application. Many publications in open literature discuss the content of biogenic elements in drinking water and their effect on public health. Health issues include cardiovascular diseases, oncologic diseases, diabetes mellitus, and diseases of the digestive system and respiratory tract. The strong chronic impact on human health has been investigated especially in connection to magnesium deficiency and it is believed that it is necessary to add magnesium to drinking water if its content is below the endorsed norm [1,2,3,4,5].
Recarbonization is a drinking water treatment to increase water quality parameters such as the calcium and magnesium content in drinking water with low level of mineral content. A large body of scientific evidence has attributed health problems to these biogenic elements. In addition to this, very low concentrations of calcium and magnesium in water have been recognized as the cause of the problems, with corrosive and aggressive impacts. Water with a very low level of minerals is unstable and unbuffered. Various treatment methods can be applied to increase the mineral content of drinking water, each offering several advantages and disadvantages. A fluidized bed reactor offers the potential to increase the interfacial reaction surface and overall reaction rate and appears to be a new approach in water treatment [6,7].
Most authors recommend a content of calcium from 20 to 80 mg/L and that of magnesium in the range of 10–50 mg/L [7,8,9,10,11,12,13]. Biogenic elements such as calcium and magnesium are not only essential from a health point of view but they are also of technological importance because soft water, which contains low concentrations of calcium and magnesium, has a corrosive and aggressive effect on distribution pipes [14].
Despite the demonstrable significance of calcium and magnesium in drinking water, there are no precisely defined limits in the world that would legally define their optimal range of concentration in drinking water. The limit of calcium and magnesium in drinking water is stated only as recommended in Slovak legislation [2,10].
To improve the quality of life in Slovakia, the recarbonization process should be applied to places where drinking water is poorly mineralized. There are many recarbonization methods using both alkaline and acidic reagents in an appropriate ratio [15].
One of the simplest and most effective methods of recarbonization is the direct dosing of biogenic elements solutions to water. For instance, calcium chloride is the most frequently added in combination with sodium bicarbonate. The biggest disadvantage of this process is the cost of chemicals. For this reason, this approach has very limited application [15,16]. A more affordable process is carbonization with carbon dioxide. Soft water flows through a fixed bed composed of limestone and magnesium carbonates or limestone and magnesite in the presence of carbon dioxide [17,18]. Suitable candidates for the recarbonization treatment are dolomite and half-calcined dolomite. Disadvantages of a fixed-bed system include the large diameter of the equipment typically used and high probability of nonuniformity of the liquid flow and, thus, local formation of magnesium carbonate which can block water flow, leading to low effectiveness of the process and low utilization of recarbonization material.
The availability of drinking water is a basic human right and recarbonization processes must be simple and cheap so that they are feasible in rural areas. Therefore, a reactor has been proposed with a highly efficient fluidized bed utilizing half-calcined dolomite with a simple operation that is applicable both in small and in large capacities. It is a new approach in drinking water recarbonization processes, introducing carbon dioxide into the bottom of the reactor together with processed water.
According to our knowledge and literature search, a fluidized bed recarbonization reactor (FBRR) has not been used for drinking water remineralization so far. On the other hand, the dissertation of Van Schagen [19] and conference paper of Kramer et al. [20] focused on modeling the management of drinking water treatment plants using a pellet reactor with a fluidized bed to perform the reverse process, i.e., decarbonization of water with high content of total hardness.
Our fundamental research was carried out in a laboratory FBRR, proving the effectivity of the drinking water mineralization process [21]. This reactor provides the potential to increase the interfacial reaction surface and the overall reaction rate and appears to be a new approach in water treatment. The research was focused on comparing different recarbonization materials, the performance of fixed and fluidized beds, and the investigation of hydrodynamic characteristics of FBRRs. HCD was selected as recarbonization material based on the results of laboratory tests on Ca and Mg extraction from rocks [22].
The experimental work was carried out with different fractions of the recarbonization material. The effect of water and carbon dioxide flow on the performance of the process was studied. Changes in the particle size of the material during the process were monitored. The results indicated half-calcined dolomite as the most suitable material. The results of preliminary experiments showed a positive effect of fluid bed hydrodynamics and an increased rate of the recarbonization process due to the presence of CO2. The concentration of calcium and magnesium ions obtained in a fluidized bed reactor at a liquid flow rate equal to the minimum fluidization velocity of the particles used was almost twice as high as their concentration obtained in a fixed-bed reactor. Continuous feeding of CO2 to the FBRR resulted in an increased recarbonization rate by about one order of magnitude in comparison to the process without CO2 introduction. A first-order kinetic model describes the data from the recarbonization process with good accuracy and the Richardson and Zaki expansion model was found to be a very good description of the hydrodynamic characteristics of the fluidized bed [20,23].
Most of the previous experiments were performed in a fluidized bed reactor with external recirculation of processed water. The main idea was to prepare a concentrate of calcium and magnesium ions [21,24].
It is commonly known that batch systems are not suitable for processing large amounts of drinking water; thus, a flow system was chosen for drinking water, CO2, and HCD located in the reactor, as shown in Figure 1. Processed water was circulated from a reservoir and CO2 was added below the liquid and gas distributor in the reactor. The size of the HCD was a compromise between small particles (i.e., high reaction rate) and larger particles (pressure drop in the system). From this point of view, it was decided to use a fraction of (2–4 mm) of HCD particles [24].
The aim of the work was to extend the FBRR design and scaling methodology [24] by mathematical modeling. For this purpose, modeling of the process of recarbonization of drinking water was carried out in laboratory and pilot scales. An algorithm for the experimental and mathematical modeling of this process was developed and is included as Figure S1. Experiments in the FBRR laboratory were aimed at obtaining basic hydraulic characteristics and kinetic data of water saturation with calcium and magnesium ions. Experimental measurements in continuous reactors operated on both scales were aimed at determining the influence of operating parameters (flow of water and CO2, pH, T, conductivity) on the content of calcium and magnesium in treated drinking water. The results of the experimental modeling were processed statistically using multiple regression analysis. Optimal values of operating parameters were determined for the maximum and minimum values of monitored drinking water quality indicators using the grid search optimization method.

2. Materials and Methods

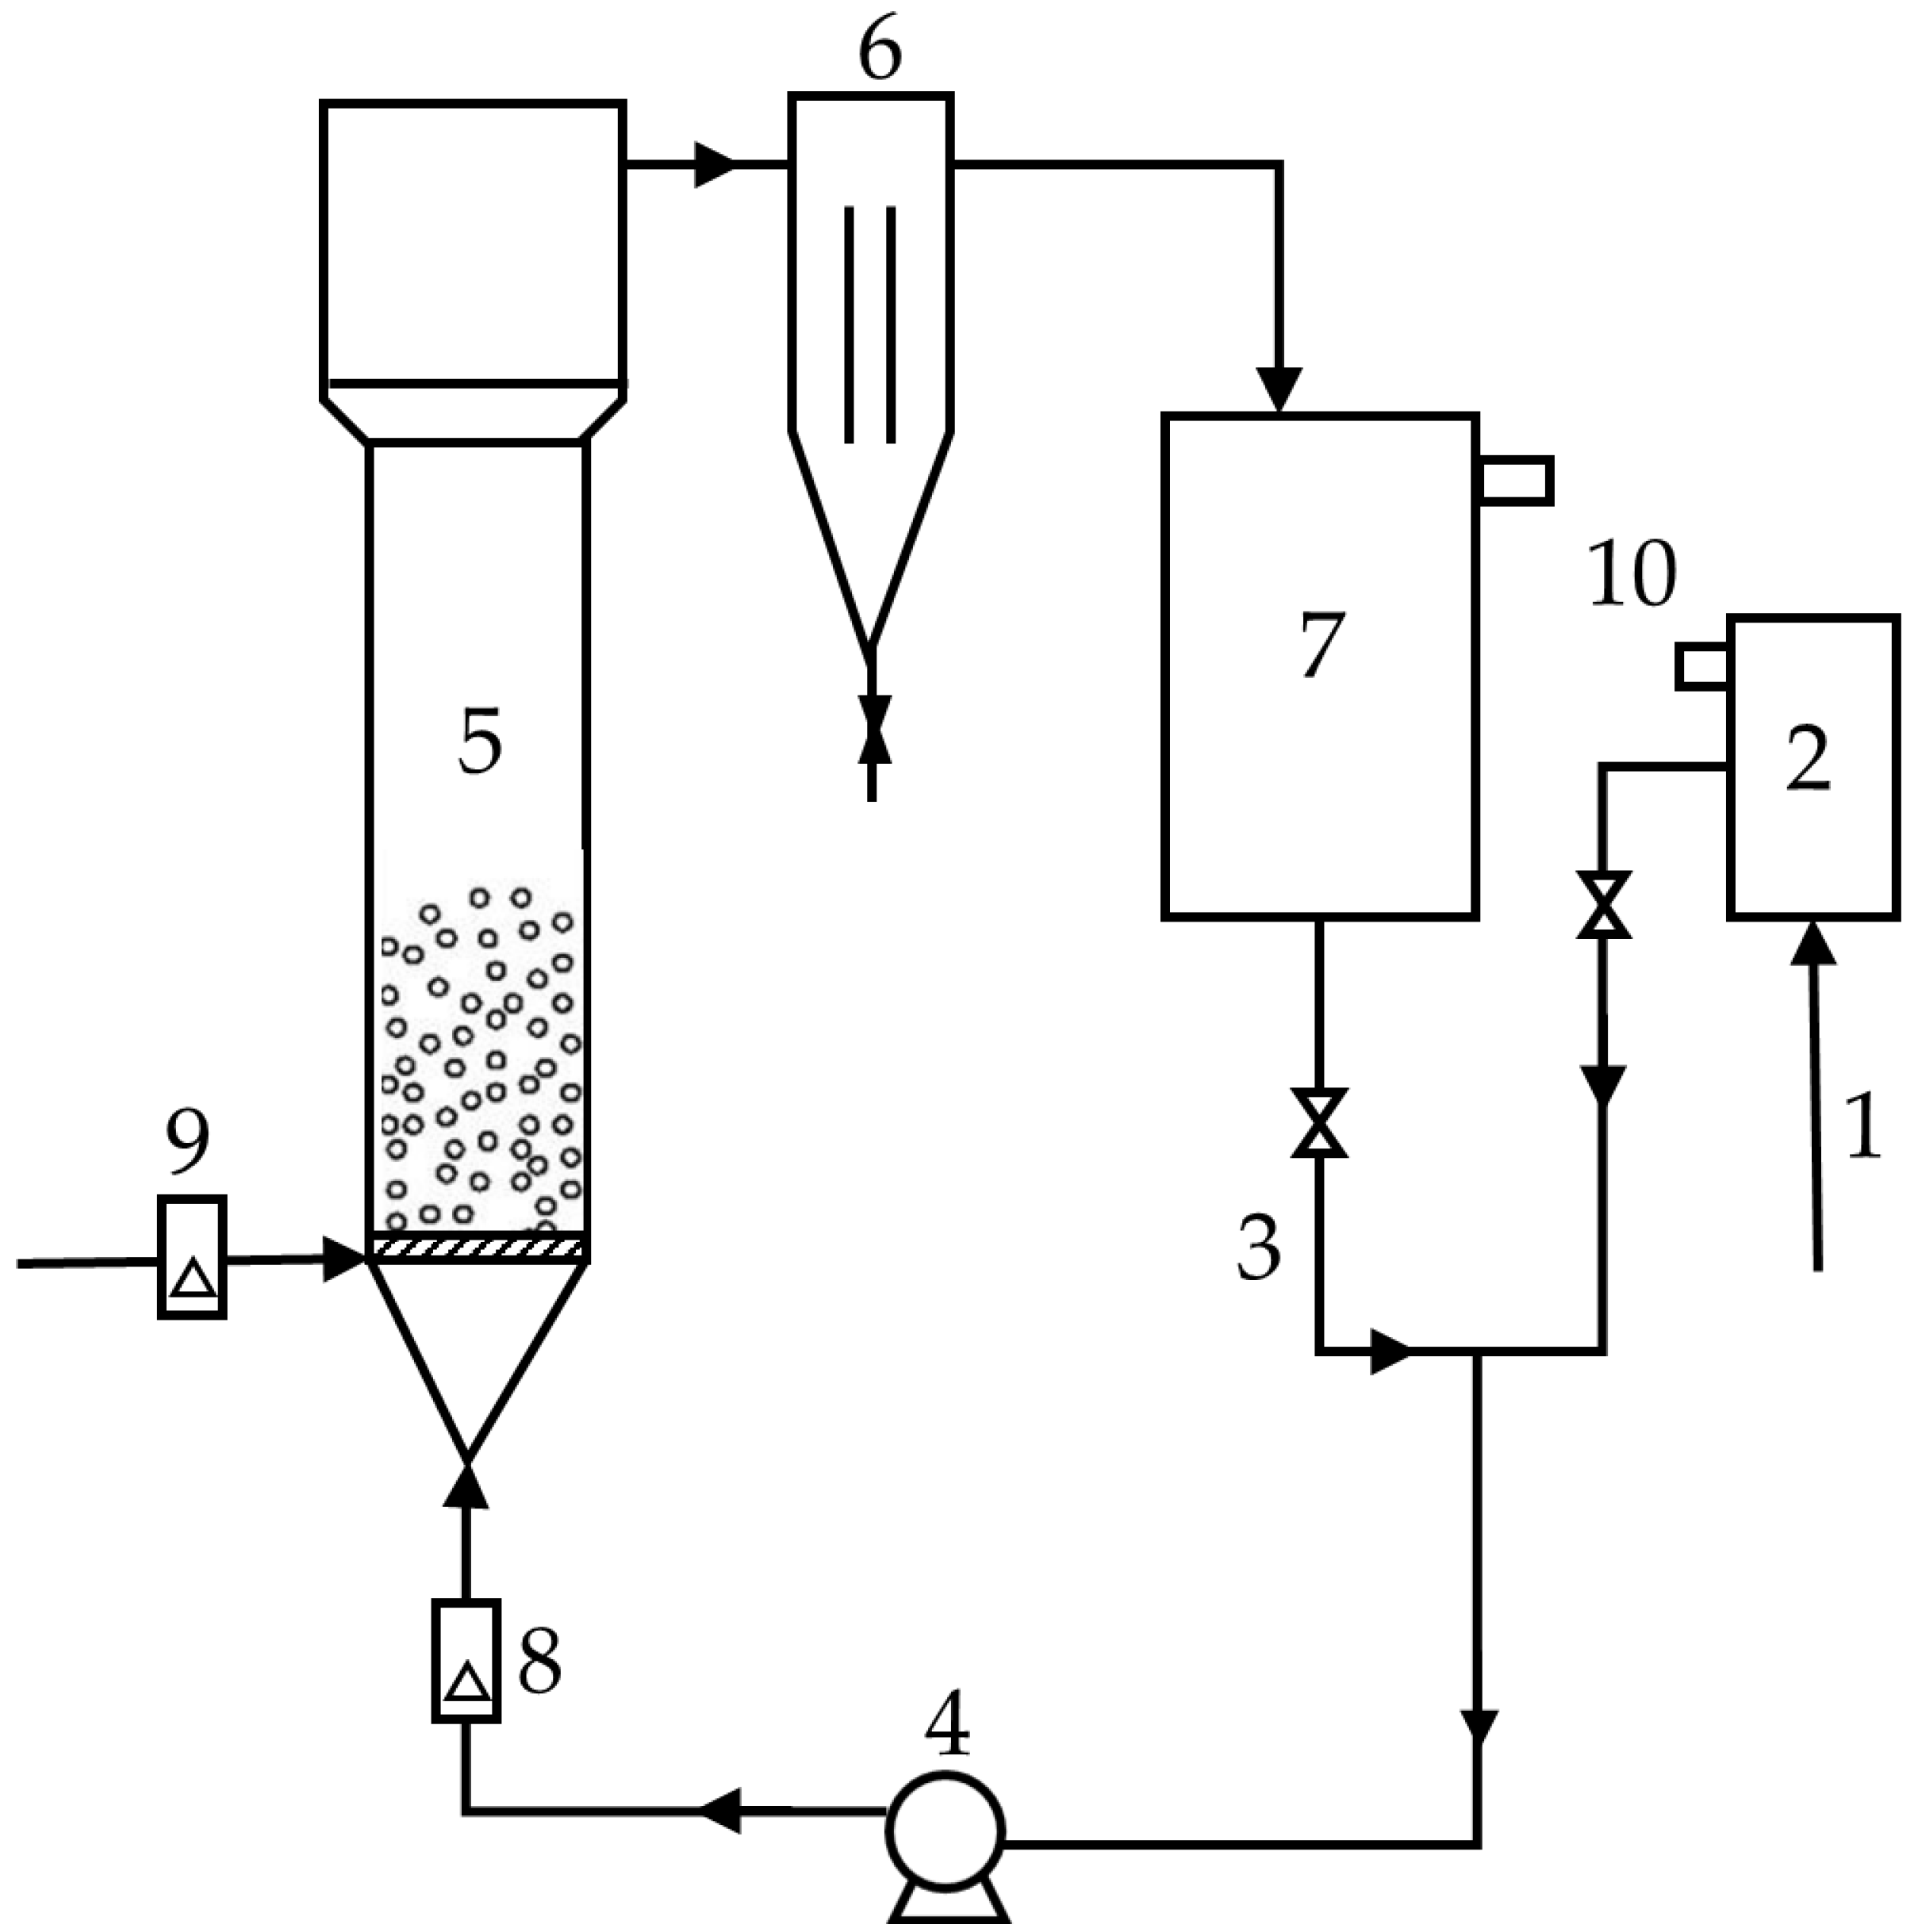
2.1. Fluidized Bed Reactor

A scheme of the testing rig for drinking water recarbonization is shown in Figure 1. Treated water (1) is pumped from the water supply network to buffer tank (2) at a suitable flow rate and through rotameter (8) by pump (4) to a fluidized bed reactor (5) to the storage/water reservoir/water tank (7). Since the one pass system did not satisfy the requirements of water enrichment by biogenic elements, a system with external circulation was used. Carbon dioxide (9) is introduced below the liquid–gas distributor. The concentrate of treated water is accumulated in the water reservoir.
Based on the kinetic and hydrodynamic characteristics of the process, optimal concentration of calcium and magnesium salts for the recarbonization process was determined to provide reasonably high process rate and material consumption.
The recarbonization system is dimensioned so that only about one-tenth of the volume of the storage tank (7) is replaced daily by the supply of tap water (1) and the same amount of concentrate (10), which is discharged into the drinking water distribution system.

Hydraulics of Fluidized Bed Reactor

An important parameter of a fluidized bed is minimum fluidization velocity. This velocity is strongly affected by particles’ geometry, density, and porosity. Physical properties of fluids are also important parameters affecting fluidization characteristics (expansion, etc.). The Richardson and Zaki [20,23] correlation is widely used to describe the expansion of fluidized beds:
ε = U U t n
where ε is fluidized bed voidage, dimensionless, U is superficial velocity, L/T, Ut is particle terminal velocity, L/T, and n is bed expansion parameter, dimensionless.
U t = 4   ρ s ρ l g d p 3 C d ρ l 0.5
where ρs is particle’s density, M/L3, ρl is liquid density, M/L3, g is gravitational acceleration, L2/T, Cd is drag coefficient, dimensionless, and dp is particle’s diameter, L.
The overall bed voidage is given by
ε = 1 h 0 h
where hp is the height of compact bed of particles, L3, A is the bed cross-sectional area, L2, and h is fluidized bed height, L.
Since particles can change physical properties during the recarbonization process (particle’s diameter and porosity) and the hydrodynamic behavior of the fluidized bed’s drag coefficient was developed experimentally [24],
C d =   a   Re t b
n = c Ret−d
Re t =   d p   ρ   U t μ
where Ret is Reynolds number for particle’s terminal velocity, dimensionless, ρs is solid density, M/L3, μ is dynamic viscosity of liquid, Pa s, and a, b, c, d are parameters of empirical correlation equations, dimensionless.
Diameter dp of half-calcined dolomite (HCD) particles was expressed by the geometric mean, L:
d p = d 1 d 2
where d1 and d2 are diameters of two mesh of sieve fraction, L.

2.2. Materials Used

Recarbonization experiments were performed using recarbonization materials, half-calcined dolomite (HCD), Magno Dol (Akdolit, Gerolstein, Germany), and Semidol (Brenntag, Pezinok, Slovakia). HCD is prepared from dolomite containing 50% CaCO3 and 50% MgCO3 at 650–800 °C. This treatment causes the decomposition of MgCO3 into MgO, while CaCO3 does not change during calcination.
During the recarbonization process, the following equations proceed:
MgO + 2 CO2 + H2O → Mg(HCO3)2
CaCO3 + CO2 + H2O → Ca(HCO3)2
Conventionally, HCD is mostly used as a granular material in recarbonization filters where water and CO2 flow downwards. In the HCD layer, the reaction between carbon dioxide and HCD takes place and HCD is gradually consumed, which means that the process has to be stopped, spent material removed, the filter filled with new material, and the process restarted. The recarbonization fixed bed (filter) reactor needs to be washed regularly to prevent sintering of the filter bed [25]. In an FBRR, the material can be added periodically without stopping the process; fine particles formed during the process are entrained from the bed by water flow and trapped in the water reservoir.

2.3. Water Saturation with Calcium and Magnesium

Kinetics of the recarbonization process work by the first order equation:
dC dt =   d c   ( C eq C )
where C is total concentration of dissolved calcium and magnesium ions, mmol/L, for reaction time t, Ceq is equilibrium concentration of calcium and/or magnesium, mmol/L, dc is rate constant of dissolution of Ca2+ and/or Mg2+ ions [1/min], and t is reaction time, min.
Equilibrium concentration of Ca and Mg ions was determined experimentally. The system depicted in Figure 1 was used without water inlet and outlet forming a batch system, i.e., water was recirculated from the water reservoir through the fluidized bed and the concentration of biogenic elements was monitored. Once the concentration was constant, the water was considered as saturated with Ca and Mg ions and the concentration achieved equilibrium concentration Ceq.
Equation (10) can be integrated between the boundary values t = 0 and t = t and C = C0 and for the case that C0 = 0, obtaining
C t = C e q 1 e d c t

2.4. Applied Analytical Methods

Recarbonization was monitored by measuring the solution conductivity and pH and determining the content of calcium and magnesium ions. A WTW Multi 3420 conductometer was used to measure conductivity. A JENWAY 3510 pH meter was used for continuous monitoring. The content of Ca2+ and Mg2+ was determined by a complexometric method using the indicator Eriochrome Black T. Concentration of Ca2+ was measured by a chelatometric method with EDTA using murexide as an indicator. Concentration of Mg2+ was calculated from the total content of Ca2+ + Mg2+ and the determination of the content of Ca2+ [23].

2.5. Multiple Regression Analysis

Experimental values of c(Ca2+ + Mg2+), c(Mg2+), c(Ca2+), and c(Ca2+)/c(Mg2+) in treated water (dependent variable Y) at different flow rates of water and carbon dioxide (independent variables Xi, Xj, …) were processed by multiple regression using a general regression equation in the form:
Y = a 0 + a j X j + a jj X j X j + a ij X i X j
where a0, aj, ajj, and aij are regression coefficients.

2.6. Processing of Experimental Data

Values of used nonlinear hydraulic models (Equations (1), (2), (4), and (5)) were determined by grid search optimization [26]. To determine the values of the parameters of the general regression Equation (12), which corresponds to the minimum value of the objective function, the Nelder–Mead simplex optimization method [27] was used.
The residual sum of squares ( S r 2 ) between the experimental and predicted values of dependent variables (Equation (13)) given by the models, divided by its number of degrees of freedom, ν, was used as the objective function.
S r 2 = ( y i exp y i cal ) 2 n m
where n is the number of measurements and m is the number of parameters.
Correlation coefficient (Equation (14)) was applied for qualitative description of the relationship between two variables:
R YX = 1 ( n m ) S r 2 ( n 1 ) S y 2
where S y 2 is dispersion (Equation (15)):
S y 2 = n y i 2 y i 2 n ( n 1 )
The quality of the description of the recarbonization process using Equation (12) was assessed by the correlation coefficient RYX (Equation (14)). To assess the influence of independent variables on the process, we used the coefficient of determination RYX2.
Optimum values of independent variables Xi, Xj, … for the calculated regression coefficient values corresponding to the minimum objective function for the dependent variable Y were also determined by the grid search optimization method [26].
The algorithm for the modelling of drinking water recarbonization is shown in Figure S1.

3. Results

3.1. Lab-Scale FBRR

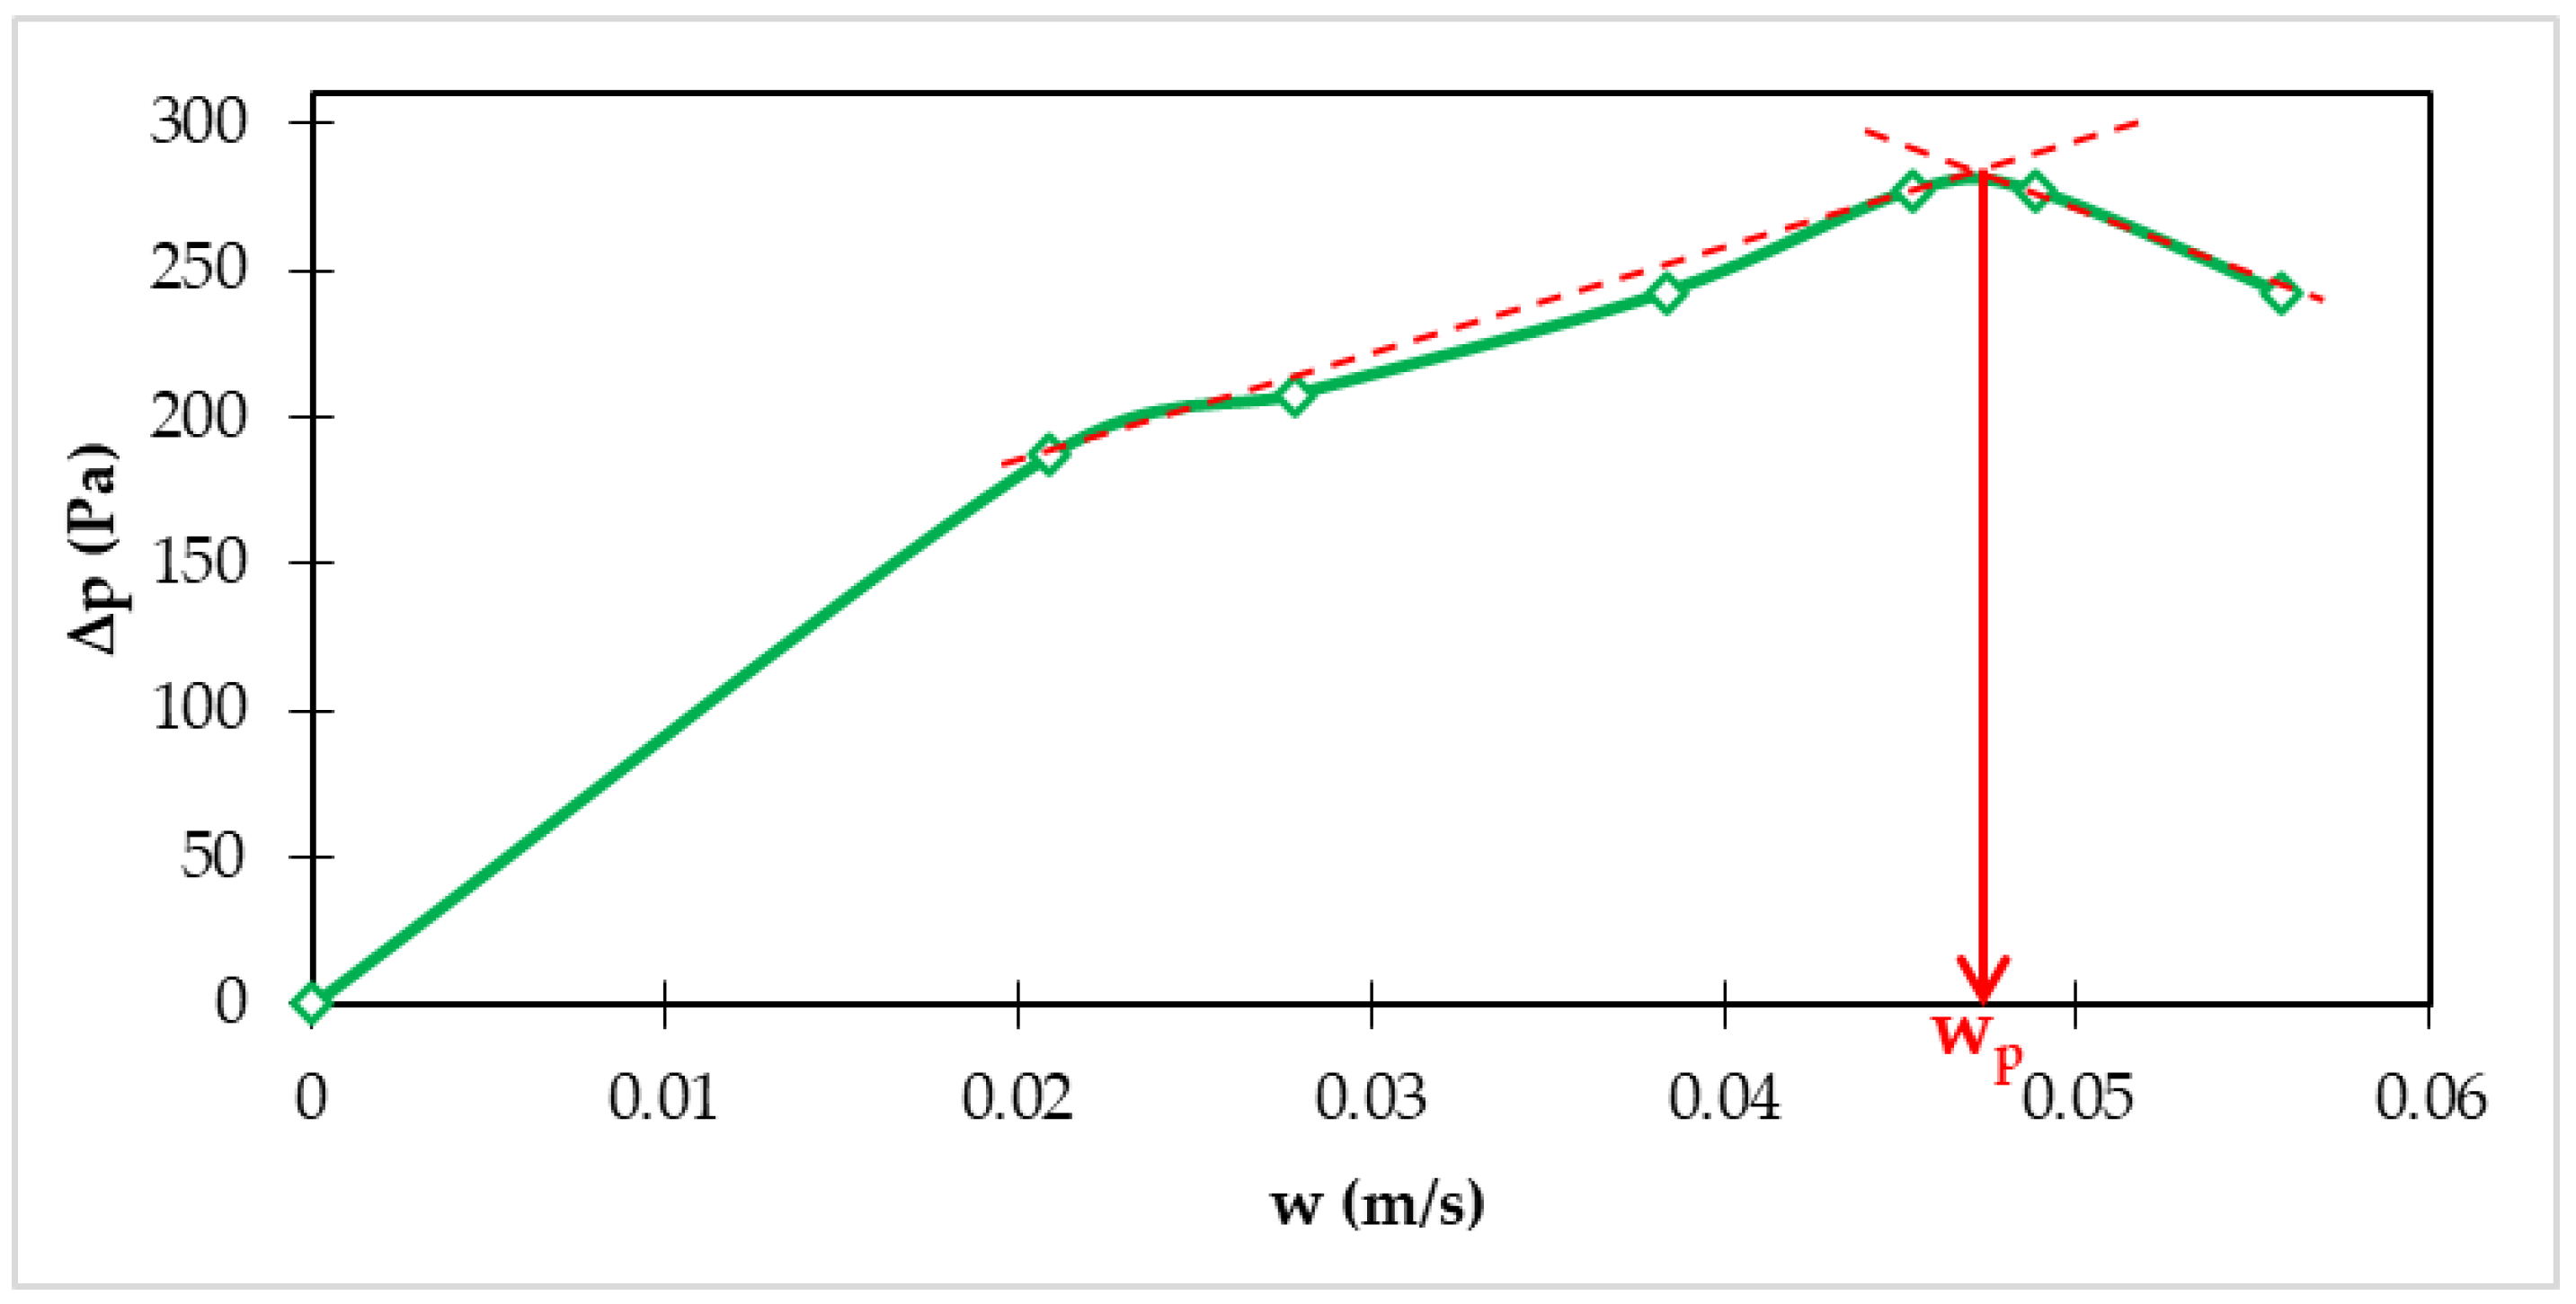
3.1.1. Hydraulic Characteristics

Hydraulic conditions in FBRRs are affected by particle size, porosity, density, and by properties of the water–CO2 gas–liquid mixture. The system is complex and therefore the minimum fluidization velocity must be determined experimentally for the relevant system. Optimum gas–liquid flow must respect the process economy, i.e., the cost of water circulation through the bed and the level of water enrichment by biogenic elements. Experimental data show that it is advantageous to work at minimum fluidization velocity.
Figure 2 shows the dependence of pressure drop (ΔP) in FBRRs on superficial fluid velocity (w) [21].
These experiments were performed using 360 g of HCD. The minimum fluidization velocity wp = 0.0475 m/s was determined graphically.
The measurements were carried out under the following conditions:
  • Particle mass in the bed: mc = 0.36 kg;
  • Voidage of fixed bed: ε = 0.4217;
  • Volume of fixed bed of solids: Vs = 0.266 × 10⁻³ m3;
  • Cross-sectional area of the column: Ap = 1.8 × 10⁻³ m2.
Experimental data of the dependence of the height of the fluidized bed on the water flow were used to calculate parameter values of the expansion Equations (Equations (4)–(6)) using the grid search optimization method. Values of the parameters and the correlation coefficient are shown in Table 1.

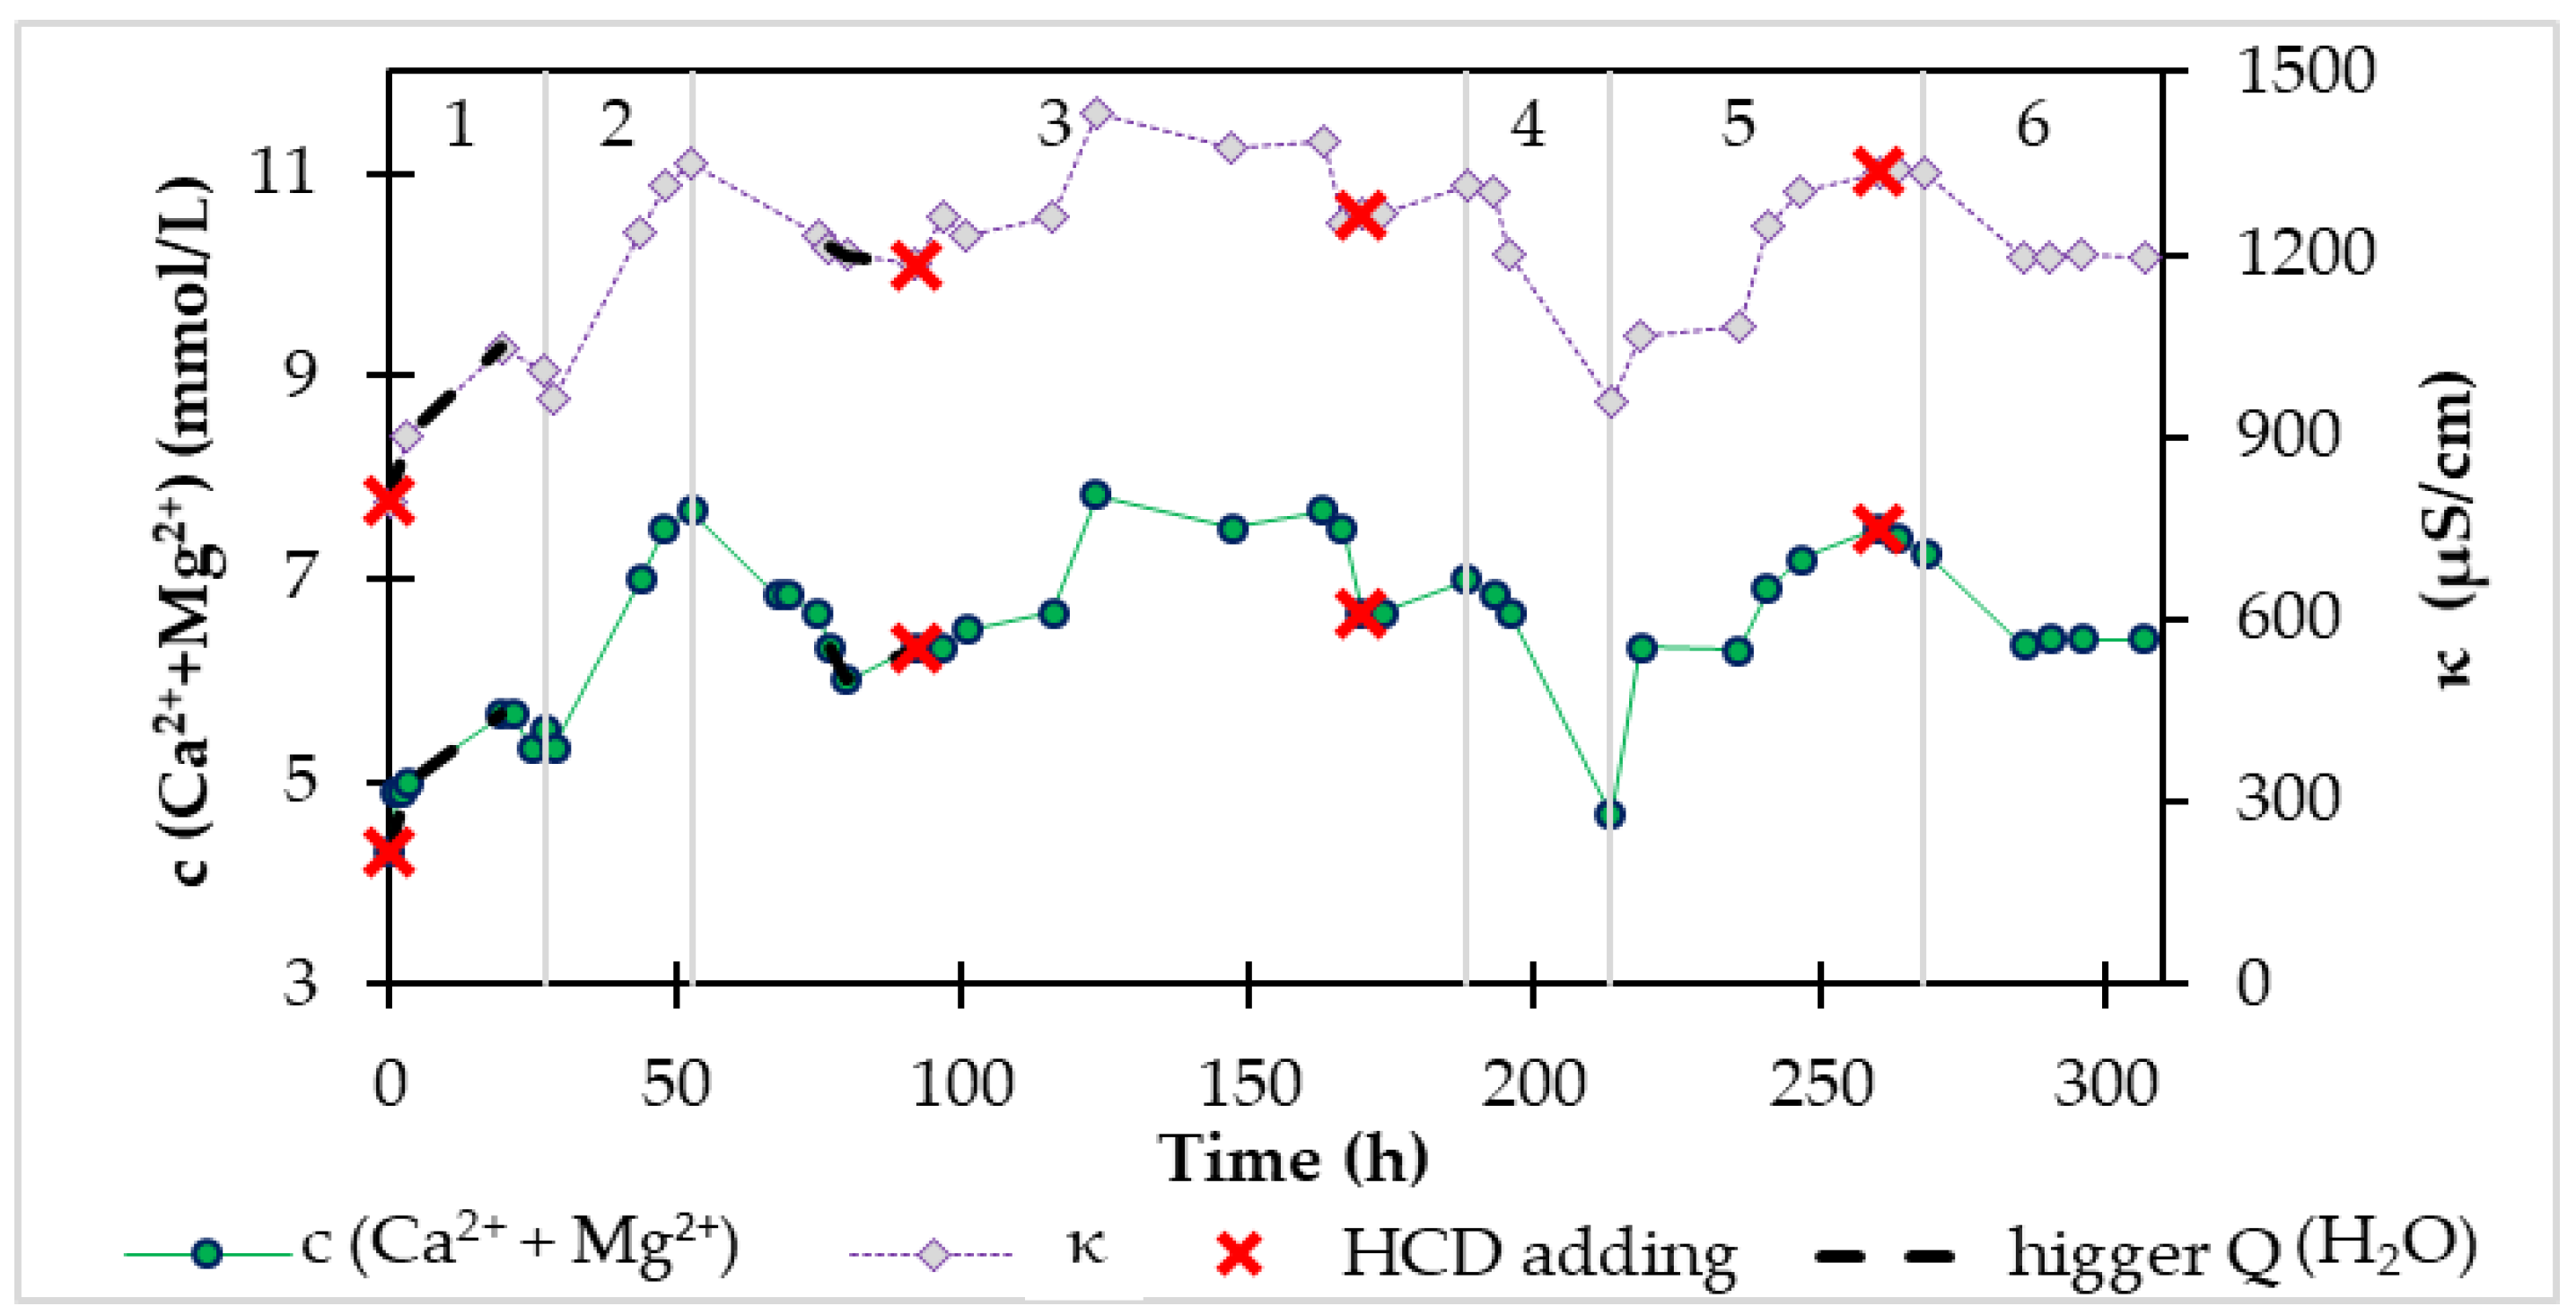
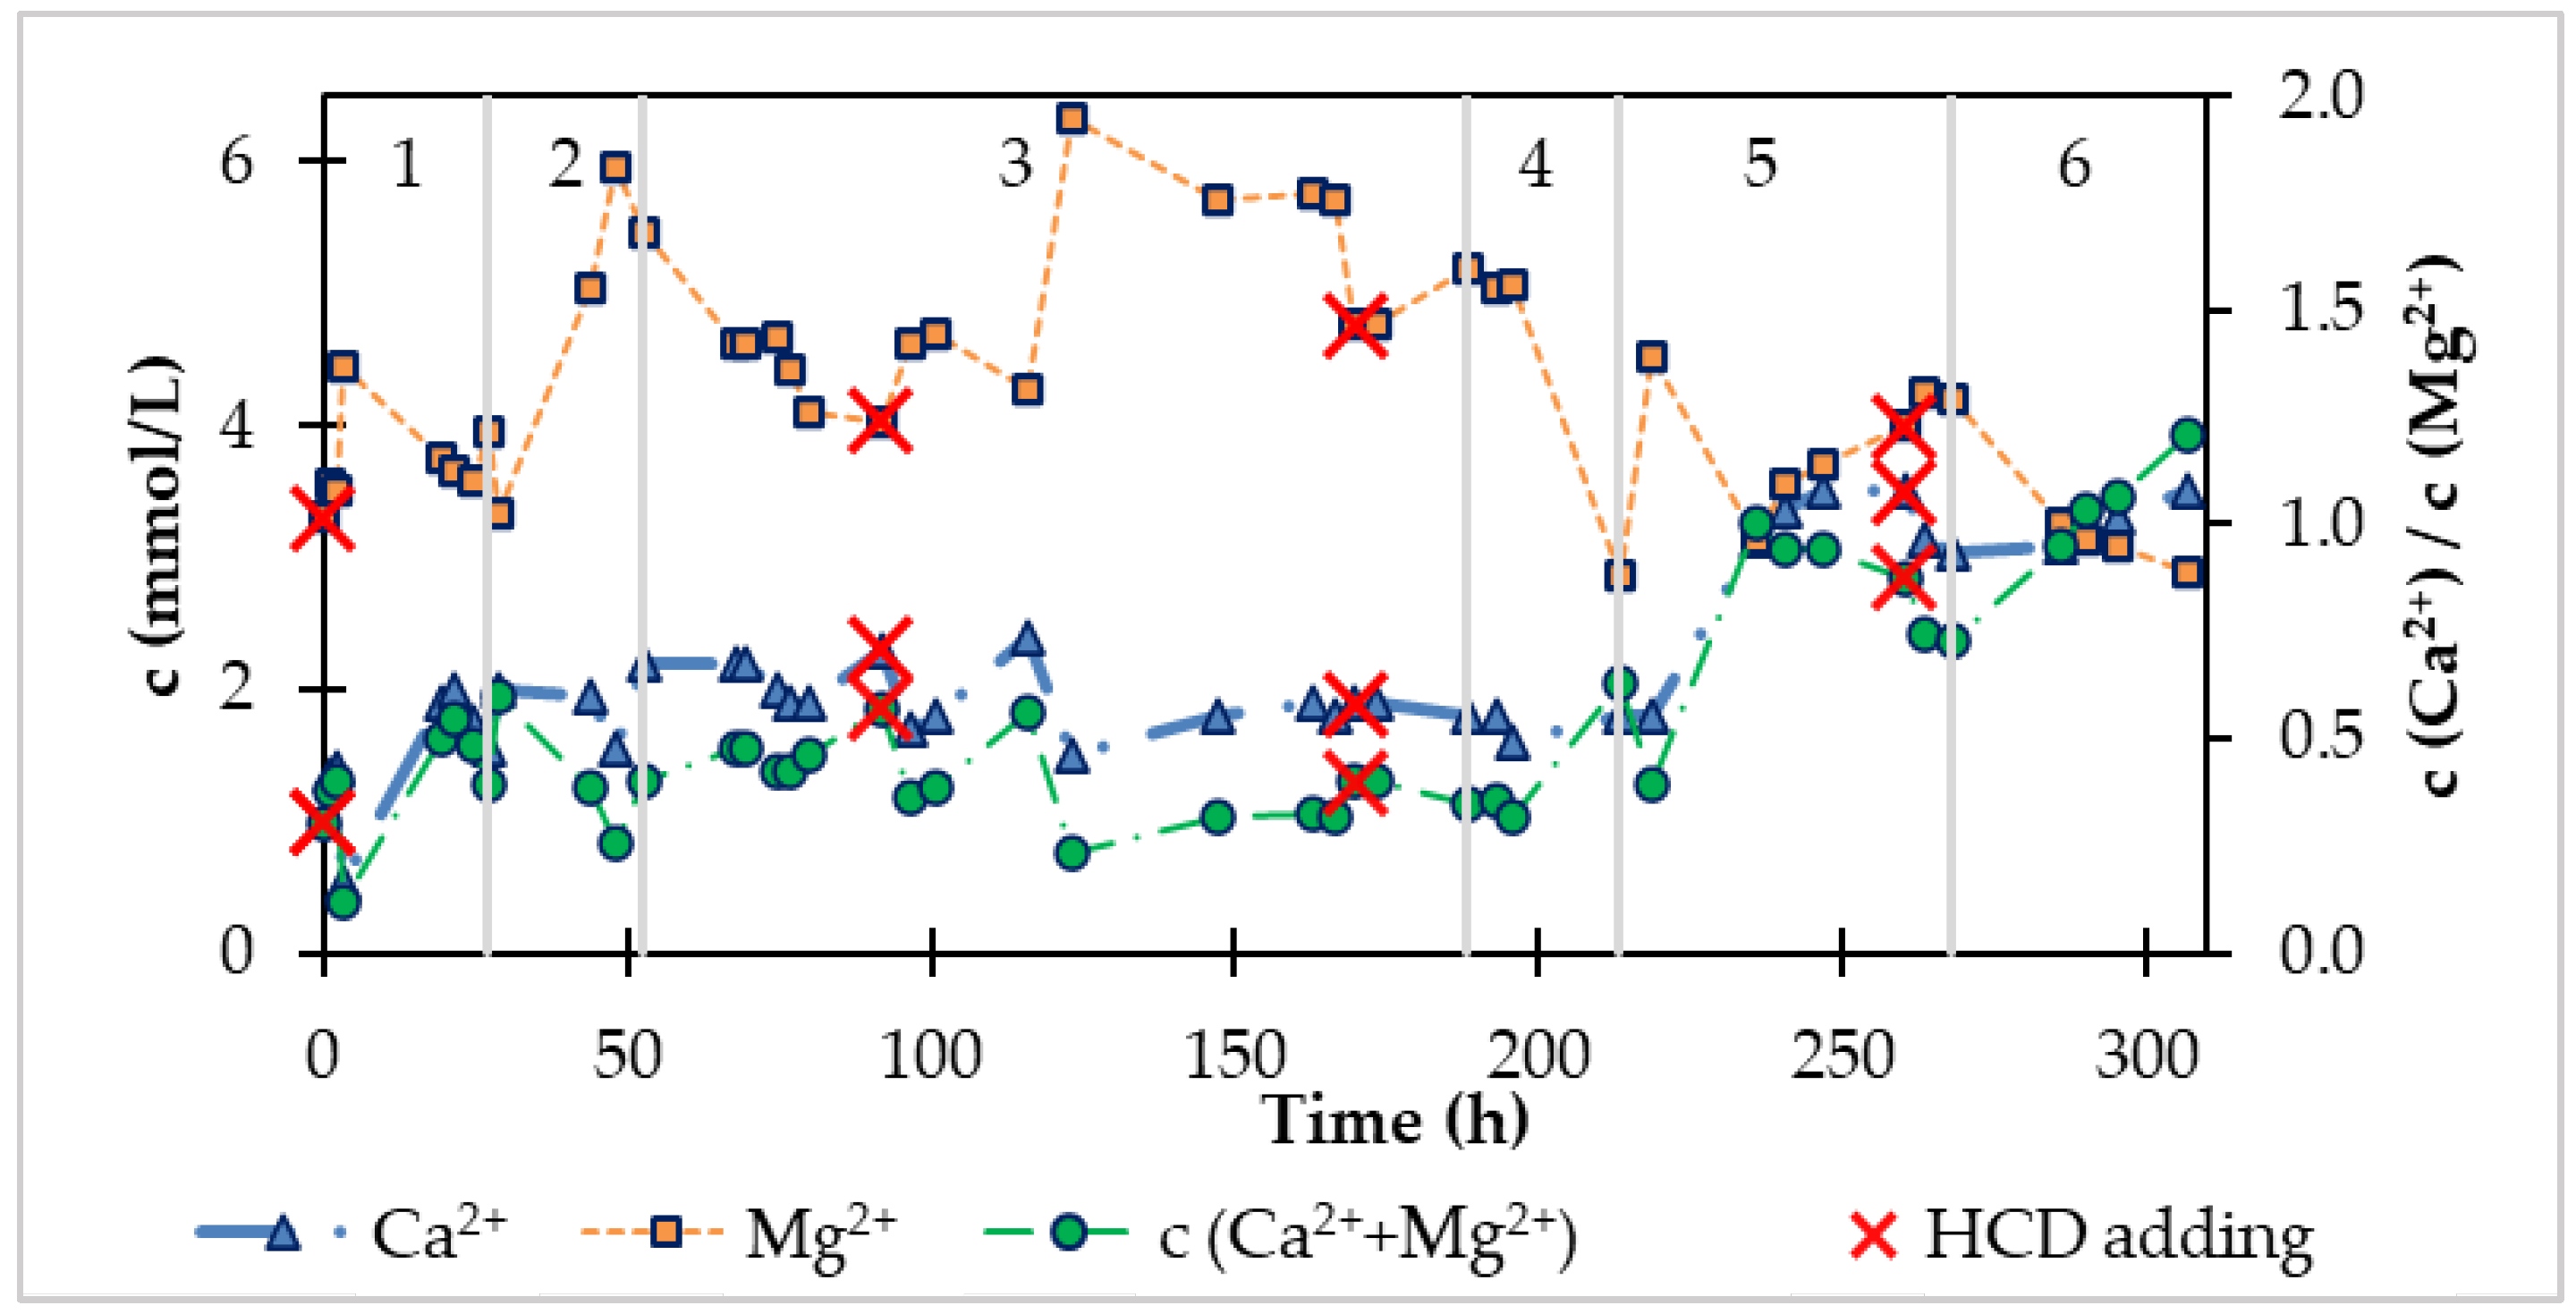
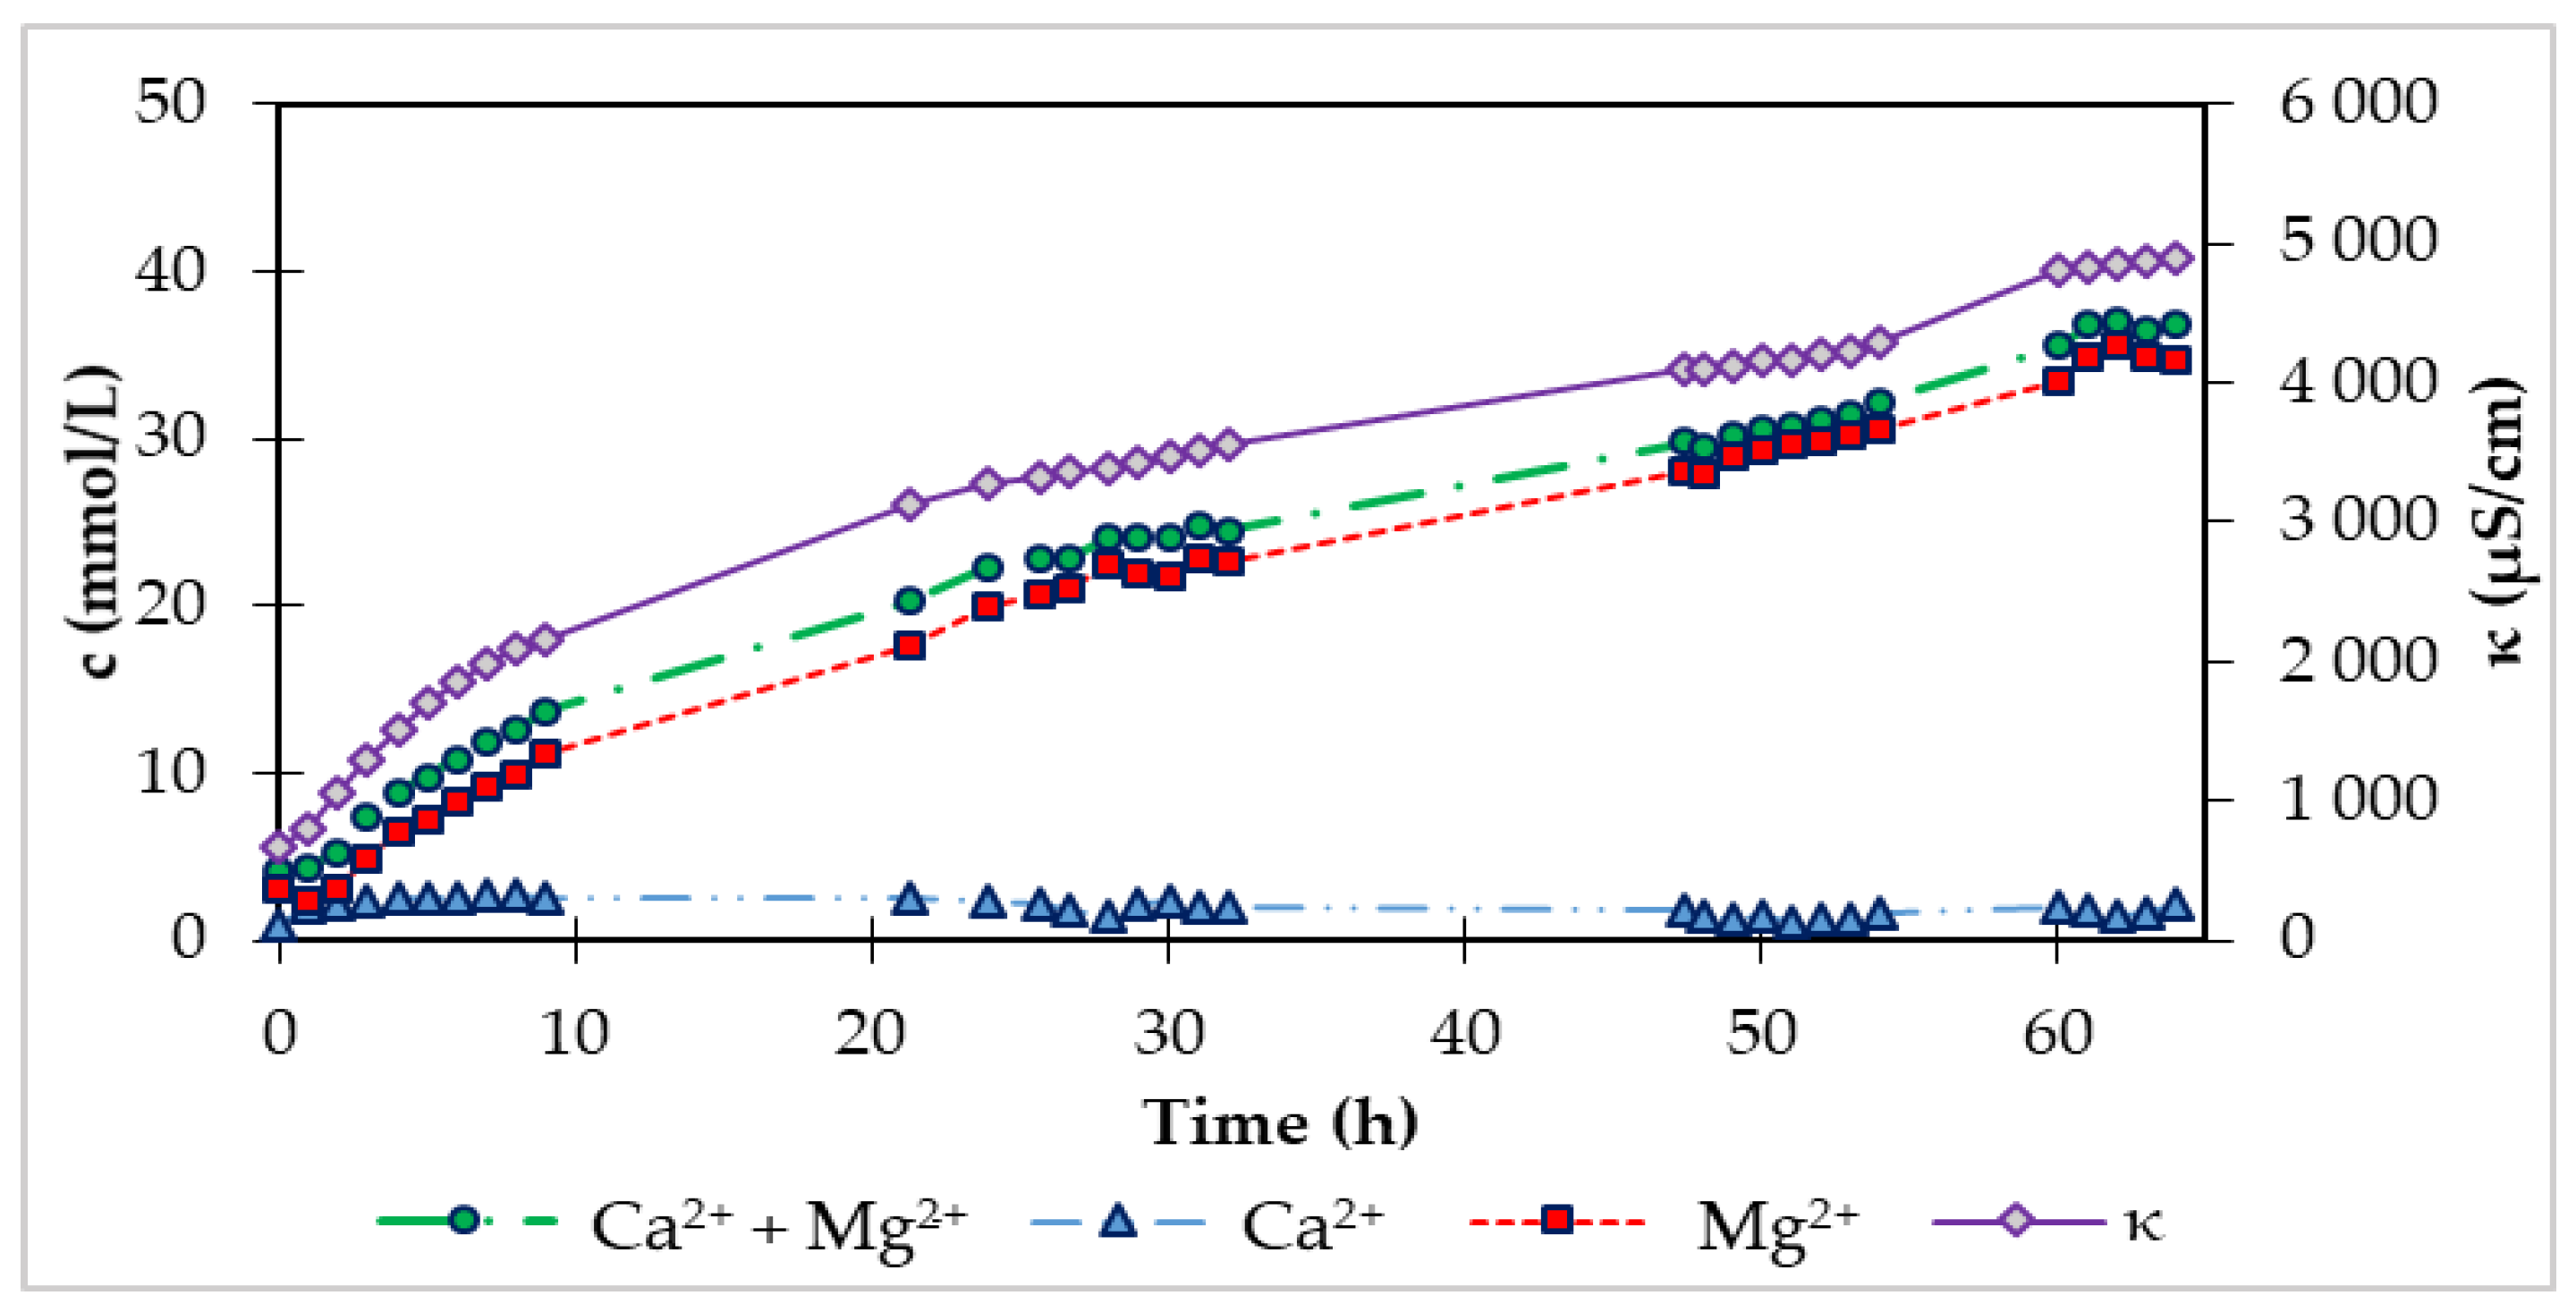
3.1.2. Saturation of Treated Water in the Reactor

At the beginning of the experiment, 360 g of fraction 2–4 mm of HCD Magno Dol (Akdolit, Gerolstein, Germany) was added to the fluidization reactor. The fixed bed of solid particles in the reactor reached a height of 14.0 cm. After starting the CO2 flow at a flow rate of 0.5 L/min and external recirculation of water between the storage tank and the fluidized bed reactor at a flow rate of 6.8 L/min, the height of the fluidized bed of solid particles was 15.1 cm. The saturation phase lasted 64 h, during which parameters such as pH and conductivity were continuously recorded with a digital multimeter and the concentrations of calcium and magnesium in the storage tank were analytically determined. Using conductivity (κ), the increase in the sum of the concentration of Ca2+ and Mg2+ ions can also be expressed as the solution conductivity increases with the ion concentration. Figure 3 shows time dependences of the measured values in the water reservoir.
The production (product of concentration and water flow) of calcium and magnesium ions, Mg2+ and Ca2+, was calculated. After the first 9 h of the saturated phase (Figure 4), Mg2+ production was in the range of 1.3–2.6 g/h. In the following hours, it fell below 1.0 g/h. Ca2+ production was initially 1.3 g/h on average during the first 9 h of saturation and decreased with time to 0.06 g/h, specifically in the 64th hour of saturation. The decrease in produced ions is due to the consumption of HCD components. To sustain the production of required ions during the recarbonization process, HCD needs to be added into the system. The doses of HCD to the fluidization reactor are listed in Table 2.
To compare the monitored variables at the beginning and end of saturation, the measured data are given in Table 3.
According to the measured values of c(Ca2+ + Mg2+) depending on the reaction time, values of the kinetic parameters of recarbonization Equation (11) were calculated to obtain the sum of squared deviations between the experimental and calculated values. The values of the kinetic parameters and statistical characteristics are given in Table 4. The content of Ca2+ + Mg2+ experimentally determined and calculated using the kinetic equation is shown in Figure 5.
After 64 h of the saturation phase, we started the continuous supply of water from the water supply network to the device and the outflow of treated water, followed by the so-called continuous phase. Water from the supply network contained 40.08 mg/L Ca2+, 75.33 mg/L Mg2+, and the sum of calcium and magnesium was equal to 4.10 mmol/L. The goal was to enrich the water from the distribution network with calcium and magnesium ions. The recarbonization process in continuous mode lasted 508.8 h, and together with the initial saturation, the total recarbonization time was 572.8 h.
The continuous phase was operated at different values of water flow from the distribution network drinking water and carbon dioxide inflow in the ranges as follow
Q (CO2) = 0.24–0.54 L/min,
Q (H2O) = 40–76 mL/min.
During the saturation phase, we also monitored the conductivity, pH, and content of calcium and magnesium in the continuous phase. Figure 6 shows the time dependence of the conductivity and molar concentration of Ca2+ + Mg2+ during the continuous recarbonization process.
The mentioned dependence in Figure 6 was divided into seven areas according to the inflow of water from the distribution network and carbon dioxide. In area 1 (Figure 6), which followed immediately after saturation, we set the continuous water flow to 20 mL/min and the carbon dioxide supply was at the level of 0.5 L/min. After the introduction of a continuous inflow of water, the concentration of calcium and magnesium in the storage tank began to decrease from 26.3 mmol/L to 12.8 mmol/L, which represents a decrease of up to half. At the same time, the determined values in the storage tank were the same as the outflow values of the system. In area one (Figure 6), there was also a section during which CO2 was not supplied to the system. In the mentioned section, we observed a faster decrease in the concentration of Ca2+ + Mg2+, while the concentration of Ca2+ + Mg2+ started to rise again after the subsequent supply of CO2. The same section is also seen in area seven, where even after the addition of HCD, but without CO2 access, the concentration of Ca2+ + Mg2+ dropped significantly, and when the CO2 supply was re-introduced, the concentration of Ca2+ + Mg2+ increased. In the mentioned two sections without CO2 access, we were convinced of the seriousness of the presence of carbon dioxide, which needs to be supplied to the system to increase the solubility of HCD in water.
In area two in Figure 6 at Q(CO2) = 0.5 L/min, the inflow of water from the distribution network was increased from 20 mL/min to 53 mL/min and we observed a decrease in concentration by only 2 mmol/L. At the end of this area, we dosed the new HCD Magno Dol (Akdolit) into the system to increase the concentration of ions.
We continued to increase the inflow in area three (Figure 6), where the inflow of treated water was 63–68 mL/min. By 277 h, the CO2 flow was at the level of 0.5 L/min, and after this time, the CO2 flow increased to 0.52–0.54 L/min with constant water supply from the distribution network. The effect of the change in this flow rate can be observed in area three (Figure 6) as an initial increase in the concentration of Ca2+ + Mg2+, which then started to decrease, apparently due to the consumption of HCD. That is why we added recarbonization material to the system and reduced the flow of water from the water network to 58 mL/min. The behavior of the system after the addition of HCD Magno Dol (Akdolit) with reduced water flow and maintained CO2 flow from area three (Figure 6) can be seen in area four (Figure 6), where the concentration of Ca2+ + Mg2+ started to rise again. After increasing the concentration of Ca2+ + Mg2+ to a value of 15.6 mmol/L, we suddenly increased the water flow from the distribution network up to 70–76 mL/min, which we reduced to 60 mL/min after twenty hours because we noticed a sharper decrease in Ca2+ + Mg2+ concentration. After this drop in concentration to 10.8 mmol/L, we dosed another amount of HCD Magno Dol (Akdolit) into the system and gradually reduced the flow of water to 56 mL/min and carbon dioxide to 0.33 L/min, while the concentration of calcium and magnesium in the drinking water was relatively stable.
In area six (Figure 6), we monitored the behavior of the system with small gradual changes in water flow in the range of 60–66 mL/min, with gradual changes in CO2 flow from 0.23 L/min to 0.35 L/min during more frequent replenishment of the HCD mass. The maximum difference of 2 mmol/L for Ca2+ + Mg2+ concentration values occurred when the experimental conditions were changed.
We carried out a gradual reduction in the CO2 flow at water inflows of 50–57 mL/min in area seven (Figure 6), where we exposed the system to the already mentioned zero CO2 flow.

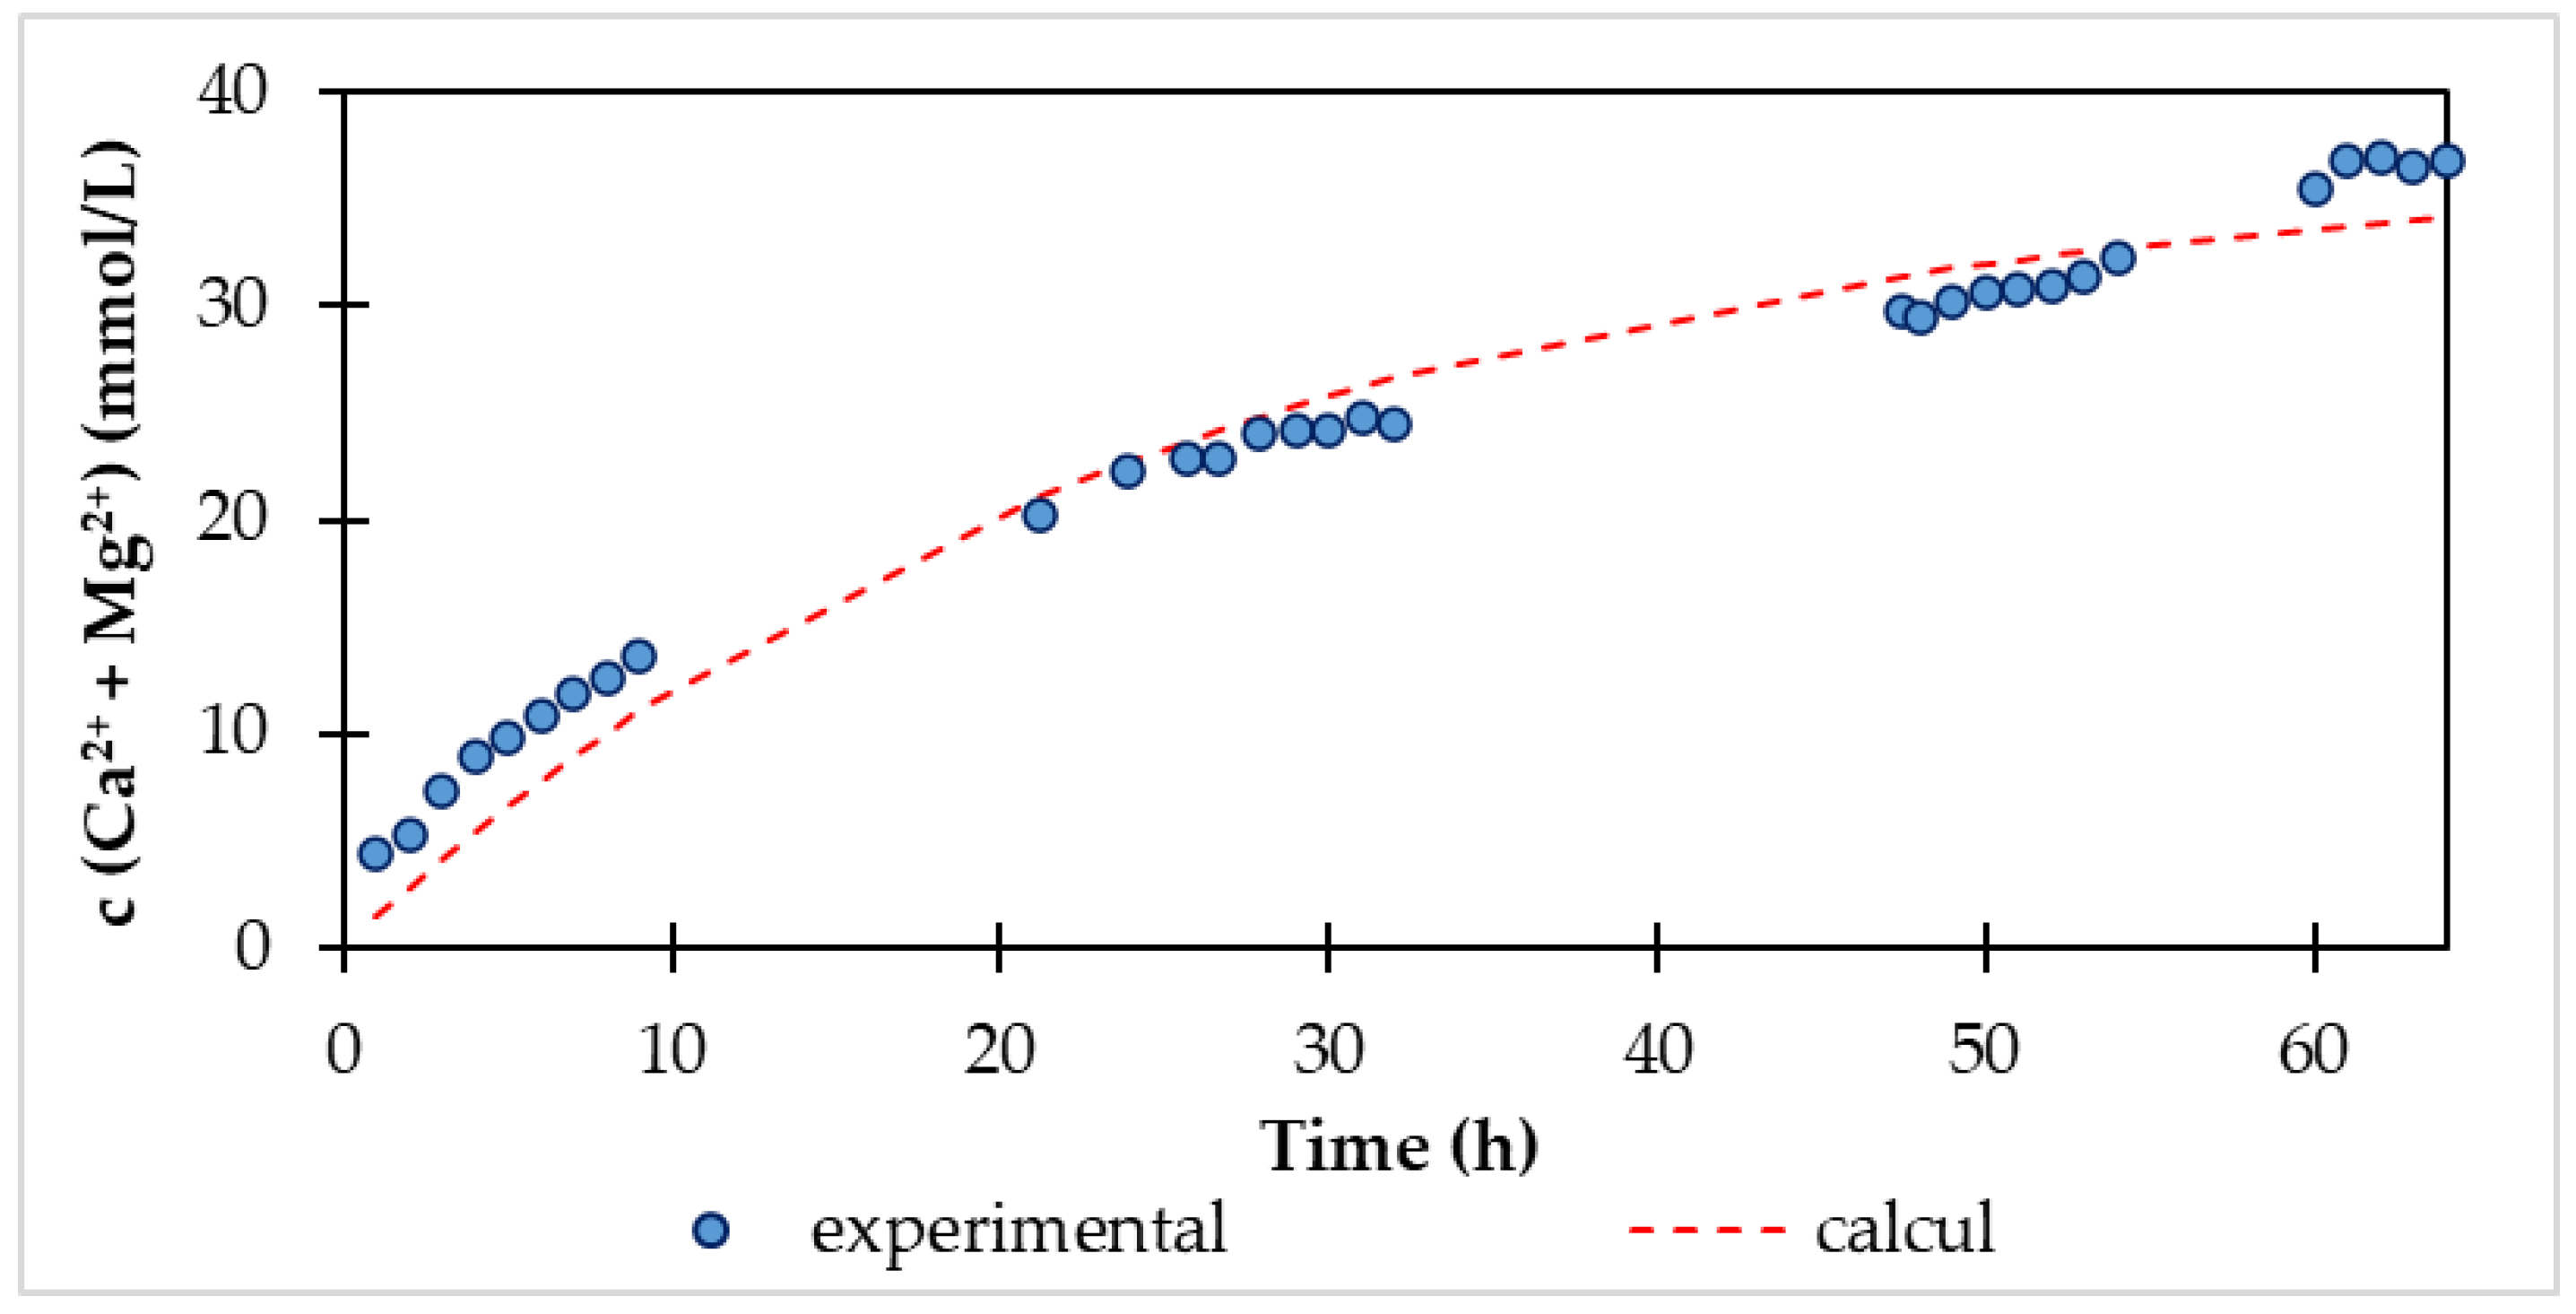
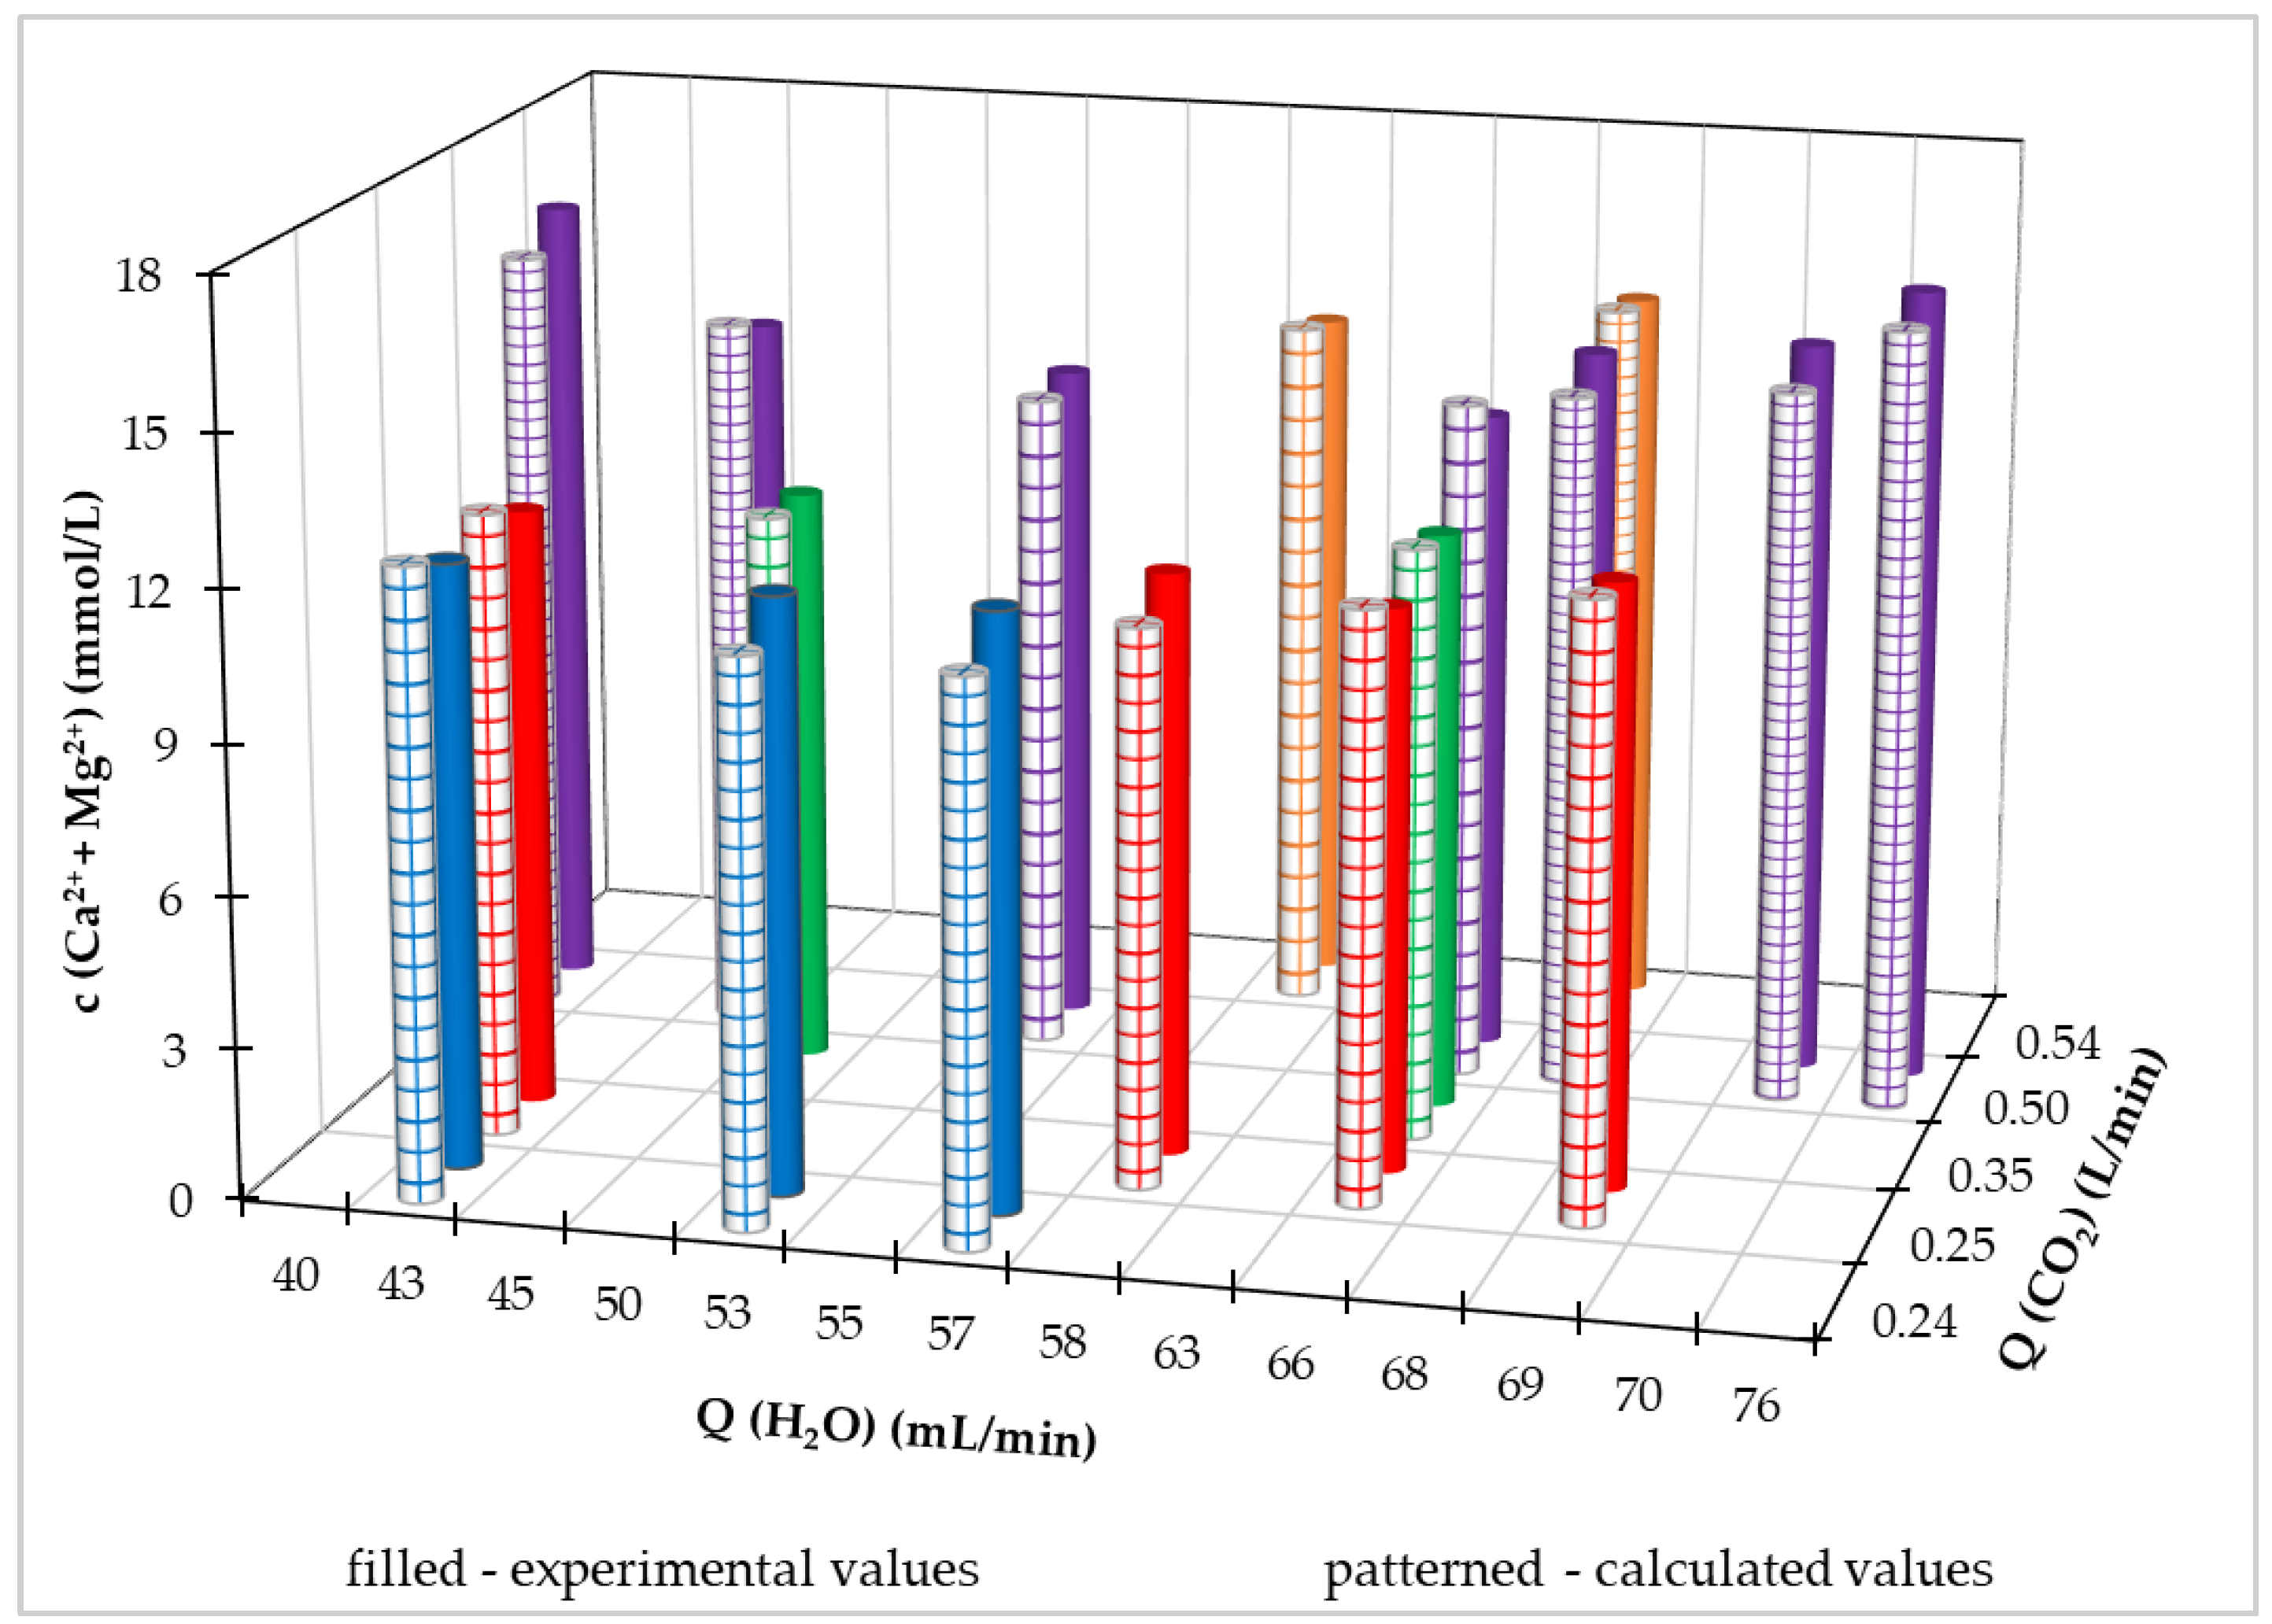
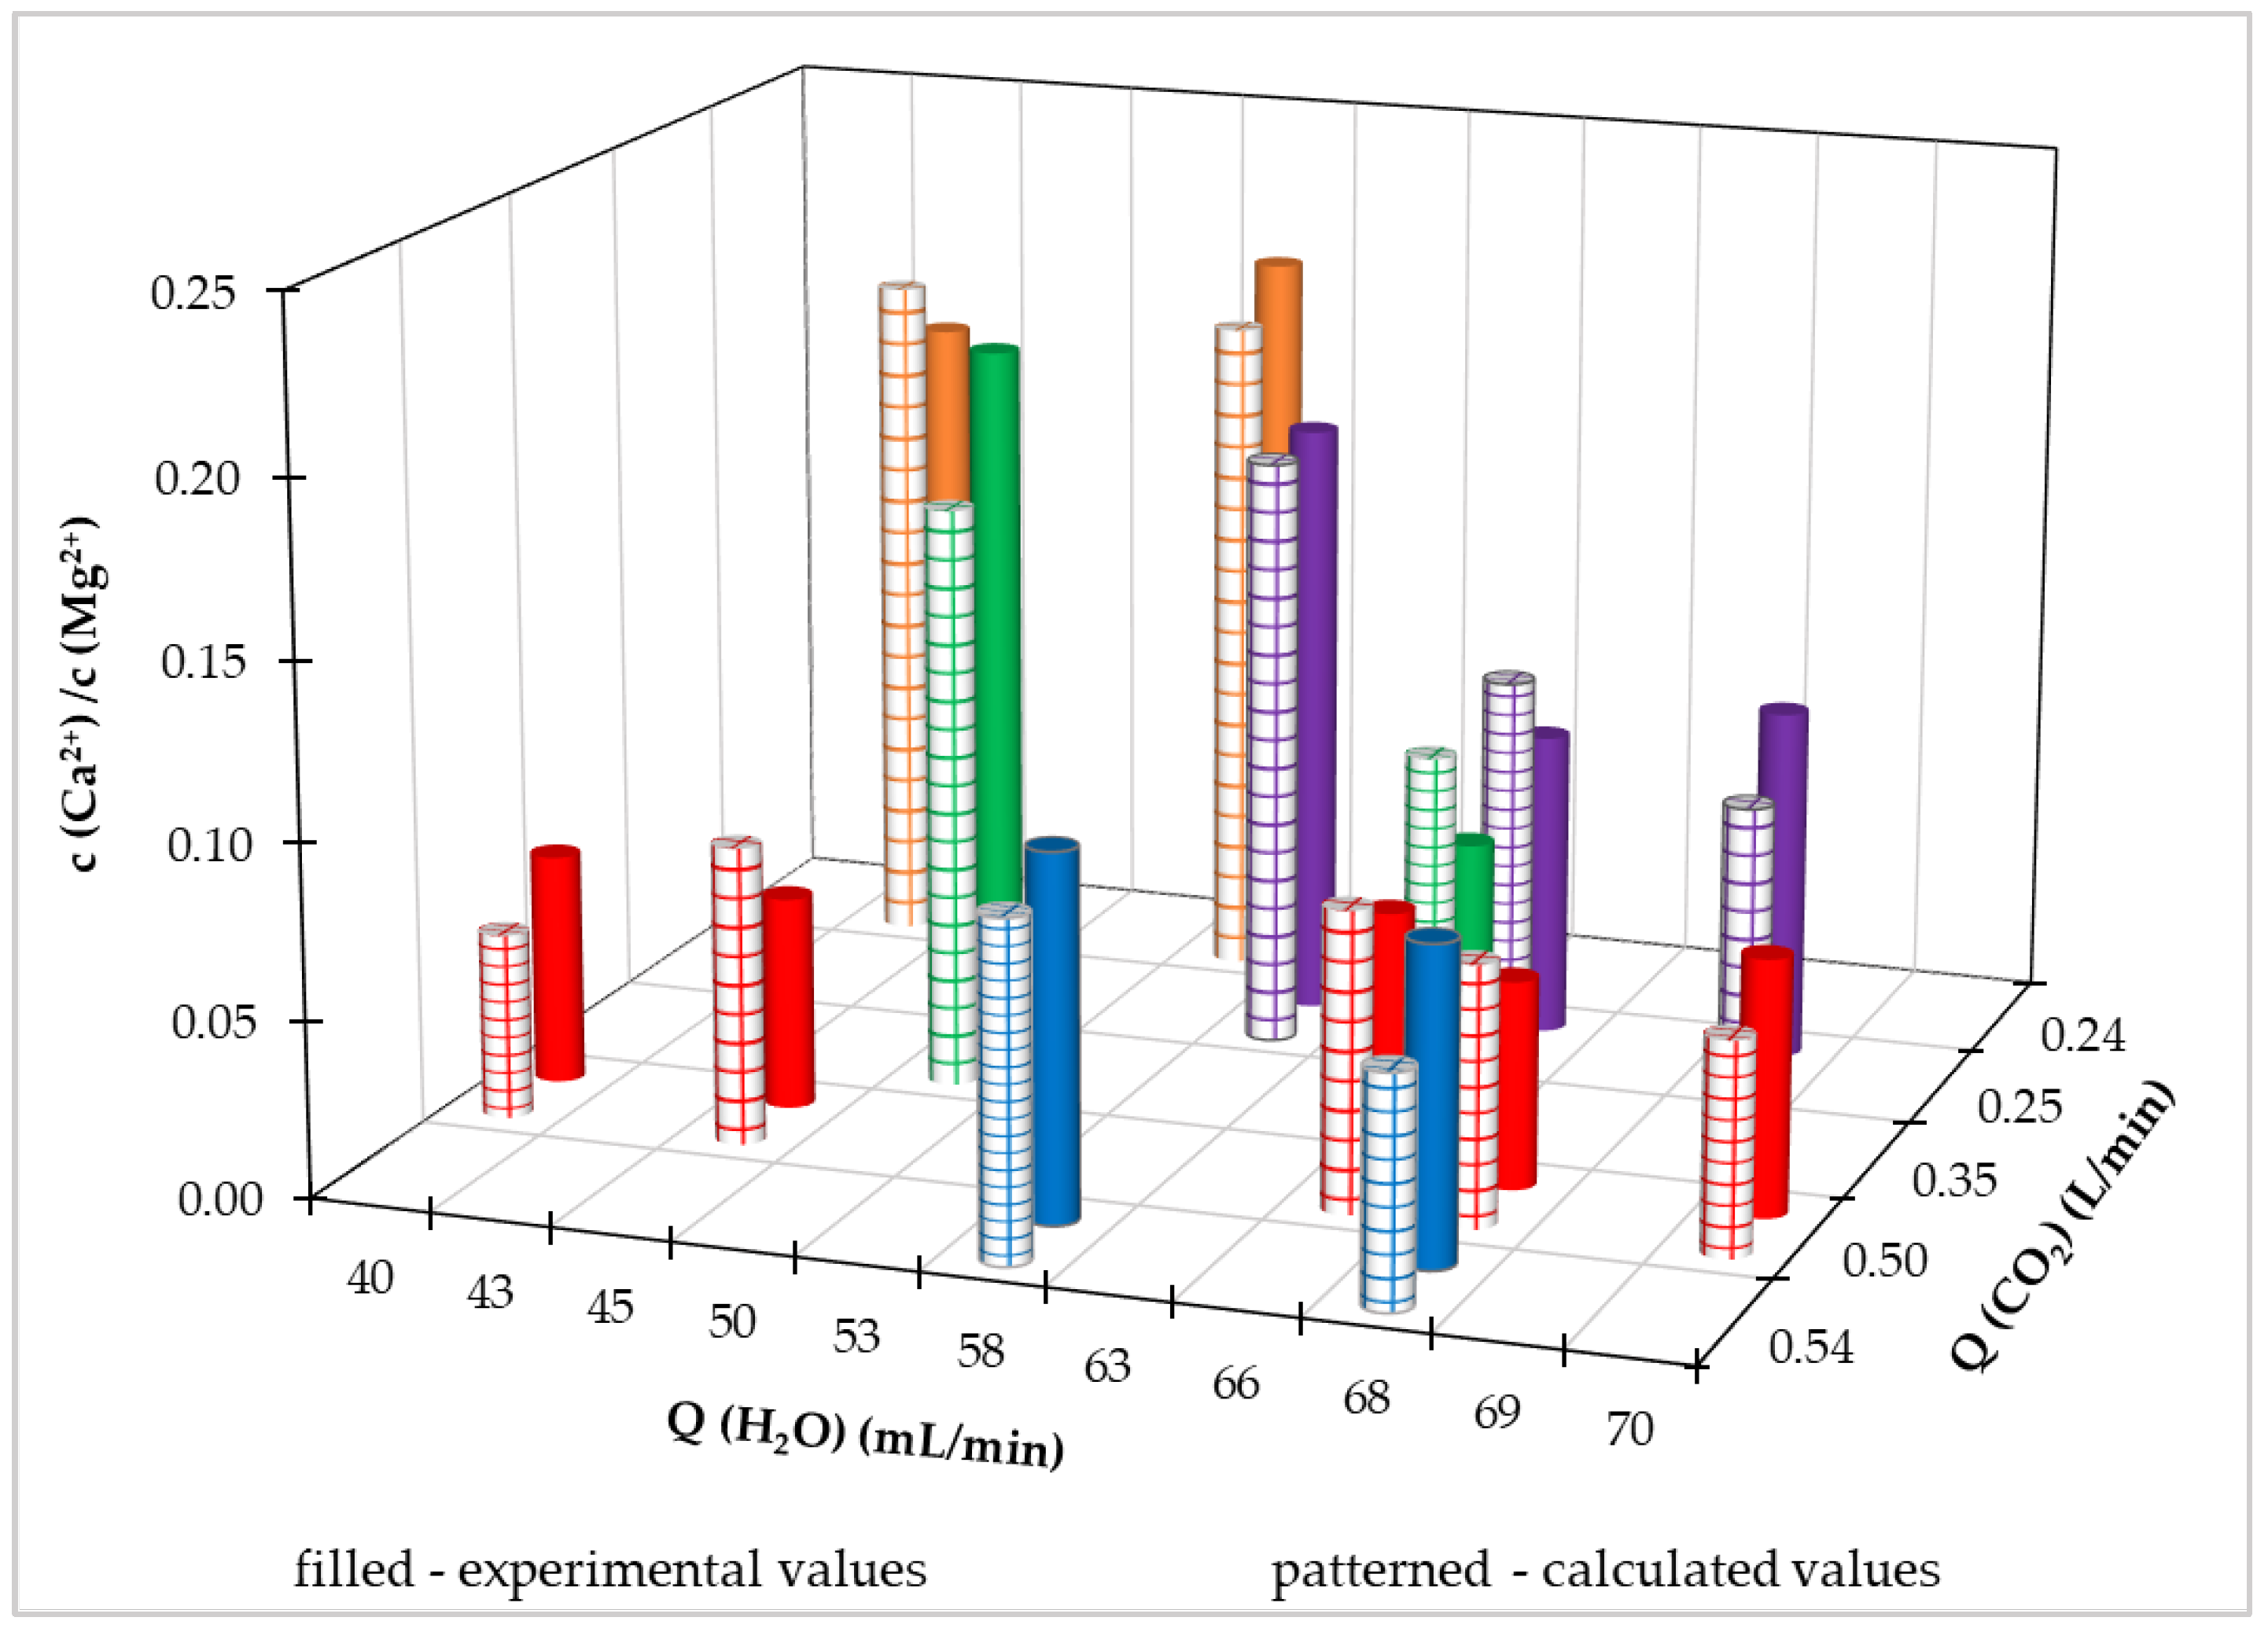
3.1.3. Regression Analysis of Experimental Results

We used the regression Equation (12) and optimized its parameters to describe the behavior of the continuous recarbonization system at different flows of supplied treated drinking water and flows of carbon dioxide.
Using the mentioned regression model with the Nelder–Mead method for parameter optimization, we determined with 95% probability the values of the parameters of the regression equation, which are listed in Table 5. The correlation coefficient of the model with the specified parameter values is 0.9570; that is, the determined quadratic equation with mutual links of independent variables is suitable for describing the process.
According to the determined values of the parameters, the regression equation took the form:
c Ca 2 + + Mg 2 + = 33.994 + 2.790   Q C O 2 0.847   Q H 2 O + 10.0   Q C O 2 2 + + 0.007   Q H 2 O 2 0.021 Q C O 2 Q H 2 O
where c(Ca2+ + Mg2+) is the concentration of calcium and magnesium (mmol/L) and Q(H2O) and Q(CO2) are the flow of water and carbon dioxide. Using this equation, we calculated the concentration of Ca2+ + Mg2+ and in Figure 7 we illustrated in a three-dimensional graph the comparison of calculated values with measured values. It is clear from the above graph that the highest achieved measured and calculated value of the Ca2+ + Mg2+ concentration is at a CO2 flow rate of 0.5 L/min and a value of the supplied treated drinking water flow rate of 76 mL/min. However, we can assume that with the mentioned water flow rate of 76 mL/min, the experimental concentration of Ca2+ + Mg2+ would be even higher with a higher CO2 flow rate, which is also confirmed by the calculation using Equation (16) optimization; we determined with 95% probability the values of the parameters of the regression Equation (16).
For a more illustrative comparison of the measured values with the calculated values using Equation (16), we constructed a two-dimensional graph in Figure S2 (Supplementary Materials) in which the Ca2+ + Mg2+ concentration values from different inflows of treated water from the distribution network are shown. From Figure S2, we can also see that the process (without the first saturation phase) is described by the above-mentioned quadratic equation with mutual interconnections of parameters (Equation (16)) which have a convex shape.
In the statistical treatment of dependence,
c Ca 2 + + Mg 2 + = f Q C O 2 , Q H 2 O
we also calculated the value of the coefficient of determination, which is 0.919. This value of coefficient of determination (R2) indicates that 91.9% variability of the total variability in the sum concentration of calcium and magnesium cations was attributed to investigated experimental independent variables. The remaining 8% is the influence of non-included independent variables. Thus, it can be concluded that the developed model (Equation (16)) adequately describes the relationship between studied variables.
We also applied the regression model of the quadratic equation with mutual links of independent variables for the dependence of the ratio of calcium and magnesium on the flow of carbon dioxide and supplied water from the distribution network. The model of the regression equation took the form of (18) and the determined values of the parameters are listed in Table 6.
c   Ca 2 + c ( Mg 2 + ) = P 0 + P 1 Q C O 2 + P 2 Q H 2 O + P 11 Q C O 2 2 + P 22 Q H 2 O 2 + + P 12 Q C O 2 Q H 2 O
where P1 to P12 are parameters of the regression equation, c(Ca2+)/c(Mg2+) is the molar concentration ratio of calcium and magnesium, and Q(H2O) and Q(CO2) are the flow of water and carbon dioxide. Using this equation, we calculated the concentration of Ca2+ + Mg2+.
We compared the measured values of the ratio of the molar content of calcium and magnesium with the calculated values using the regression Equation (18) in Figure 8. The correlation coefficient between the measured and calculated values is 0.922 and the coefficient of determination is 0.850.

3.1.4. Optimizing the Conditions of the Recarbonization Process in Laboratory FBRR

We used the determined values of the parameters of the regression Equations (16) and (18) to determine the optimal conditions of the process, i.e., independent variables, or CO2 and H2O flows. Using the grid search of the optimization method, we determined the values of these flows for the maximum and minimum value of the dependent variable in question. The optimal process conditions were determined for the range of values of the independent variables at which the experiments were performed.
For the optimal conditions of the dependent variable c(Ca2+ + Mg2+), we also calculated the optimal values of the ratio c(Ca2+)/c(Mg2+). Also, for optimal conditions of maximum and minimum values of the c(Ca2+)/c(Mg2+) ratio, we calculated optimal values of the sum of c(Ca2+ + Mg2+) concentrations. The results are presented in Table 7 and Table 8.
From the results of process optimization in the laboratory FBRR within the investigated range of values of independent variables, i.e., the flow of carbon dioxide 0.24–0.54 L/min and water from the distribution network 40–76 mL/min, it follows that the minimum value of the sum of calcium and magnesium ions was 10.9 mmol/L and the maximum value of the sum of these ions was 16.2 mmol/L. Both values comply with the recommended values according to Annex no. 1 to the decree of the Ministry of Health of the Slovak Republic no. 247/2017 Coll.
From the optimization calculations for the maximum and minimum values of the molar ratio of calcium and magnesium in drinking water, it follows that the values of the ratios do not correspond to the requirements according to the above-mentioned decree of the Ministry of Health of the Slovak republic. The maximum calculated value of the molar ratio of calcium and magnesium for experimental conditions is 0.20, while the minimum recommended value according to the recommended content of individual ions in drinking water is 0.6 [28].

3.2. Pilot Reactor

We operated the pilot FBRR in flow mode with continuous inflow and outflow of treated drinking water without an initial saturation phase. The initial concentration of the sum of calcium and magnesium ions in the treated water was 4.3 mmol/L. At the beginning of the experiment, we dosed 20.6 kg of HCD Magno Dol (Akdolit) into the fluidized bed reactor. Considering that the pilot FBRR is a larger device and the stabilization of the process when the conditions change takes longer than in the laboratory FBRR, we varied the conditions of the recarbonization process (Q(CO2), Q(H2O)) in smaller ranges:
Q (CO2) = 0.4–0.7 L/min,
Q (H2O) = 118.0–132.8 L/h.
The time dependence of conductivity and the concentration of calcium and magnesium ions in drinking water are shown in Figure 9.
The evaluation of monitored quantities in Figure 9 is divided according to the flow of carbon dioxide into seven areas. The CO2 flow rate for individual areas is shown in Table 9.
During the first 27 h (Figure 9, area one) we operated the reactor at Q(CO2) = 0.4 L/min and the flow of treated drinking water from the distribution network was initially 132.8 L/h, while later we stabilized it at a value of 120 L/h. The concentration of Ca2+ + Mg2+ after 27 h of operation was increased by approximately 1 mmol/L.
In area two (Figure 9), after 27 h, to achieve a higher concentration of calcium and magnesium ions with a constant inflow of treated water, we increased the flow of carbon dioxide to the level of 0.7 L/min. With an increased flow of carbon dioxide, the content of calcium and magnesium in the drinking water was significantly increased up to 7.7 mmol/L. At this concentration, which we considered sufficiently high, we reduced the carbon dioxide flow to a value of 0.5 L/min in order to stabilize the outflow concentration and prevent its further increase.
The course of the process at a constant CO2 flow rate of 0.5 L/min is shown in area three in Figure 9. The concentration of calcium and magnesium in the drinking water after 15 h decreased more than expected, by approximately 1.5 mmol/L. This decrease could also have occurred because of a slight increase in the inflow of treated water from 120 L/h to 132.8 L/h and wear of the HCD in the reactor. We dosed HCD Magno Dol (Akdolit), weighing 3.4 kg into the reactor, and adjusted the water inflow from the distribution network to 120 L/h. The concentration of Ca2+ + Mg2+ started to rise again and stabilized at approximately 7.5 mmol/L. At the next observed decrease in concentration, we again dosed another amount of HCD.
We can assume that for a steady effluent concentration of calcium and magnesium in drinking water at a carbon dioxide flow rate of 0.5 L/min and a water inflow from the water network of 120 L/h, it is necessary to dose approximately 3.5 kg of new HCD Magno Dol (Akdolit) every 75 h into the pilot FBRR.
After 188 h of operation, the equipment reduced the CO2 flow to 0.3 L/min for 24 h. The concentration of calcium and magnesium ions in the water dropped significantly from 7.0 mmol/L to 4.7 mmol/L. When the CO2 flow rate was again increased to 0.5 L/min at a constant Q(H2O) = 120 L/h in area five (Figure 9), we observed a further increase in the content of Ca2+ + Mg2+ ions by 1.5 mmol/L. Based on this observation, we can state that if there is a brief loss of carbon dioxide supply to the system during operation in practice, after re-introduction of CO2 the system can be returned to steady state in approximately less than 4 days, according to the flow of reintroduced carbon dioxide.
Before the end of area five (Figure 9), we added the new recarbonization material, HCD Magno Dol (Akdolit), and during the first 8 h after dosing we recorded a steady concentration of calcium and magnesium in the drinking water of approximately c(Ca2+ + Mg2+) = 7.3 mmol/L. After this stabilization, we again reduced the CO2 flow in the system to a level of 0.4 L/min in area six, shown in Figure 9, where we observed a significant effect of a lower CO2 flow, where even with sufficient recarbonization mass, there was a decrease in c(Ca2+ + Mg2+), which was stabilized at a value of 6.4 mmol/L within five hours.
In addition to the total content of calcium and magnesium in water, their ratio, i.e., the content of individual ions, is also important. The calculated value of the ratio of calcium and magnesium according to the recommended content of individual elements in drinking water [28] should be in the range of 0.6 to 1.0. The temporal evolution of the concentrations of individual ions is illustrated in Figure 10. Increasing the carbon dioxide flux (areas two and five in Figure 10) resulted in a much higher release of magnesium ions into the water than calcium ions. When dissolving HCD in water, a high flow of carbon dioxide stimulates the dissolution of the magnesium component of HCD.
After each dosing of a new amount of HCD, the value of the ratio of calcium to magnesium content is lower. This is probably due to the higher solubility of the magnesium component of the HCD, while the surface and porosity of the recarbonization material also changes during dissolution and the ions inside the pores become more accessible. It is known that the used HCD Magno Dol (Akdolit) has a higher content of calcium components; therefore, after exhausting the magnesium component from the mass, we expected a gradual increase in the concentration ratio of calcium and magnesium ions.
After 213 h of operation of the pilot FBRR at a reduced flow of carbon dioxide (Figure 10, area four) the Ca2+/Mg2+ ratio changed periodically in the range of 0.2–0.6. After its increase (Figure 10, area five,) the increase in c(Ca2+)/c(Mg2+) up to a value equal to 1.0 was observed. We can assume that if the experiment were to continue in area six (Figure 10) after further dosing of HCD, we would keep the ratio of calcium and magnesium at a value close to 1.0 at a constant flow of treated drinking water 120 L/h and CO2 flow 0.4 L/min.

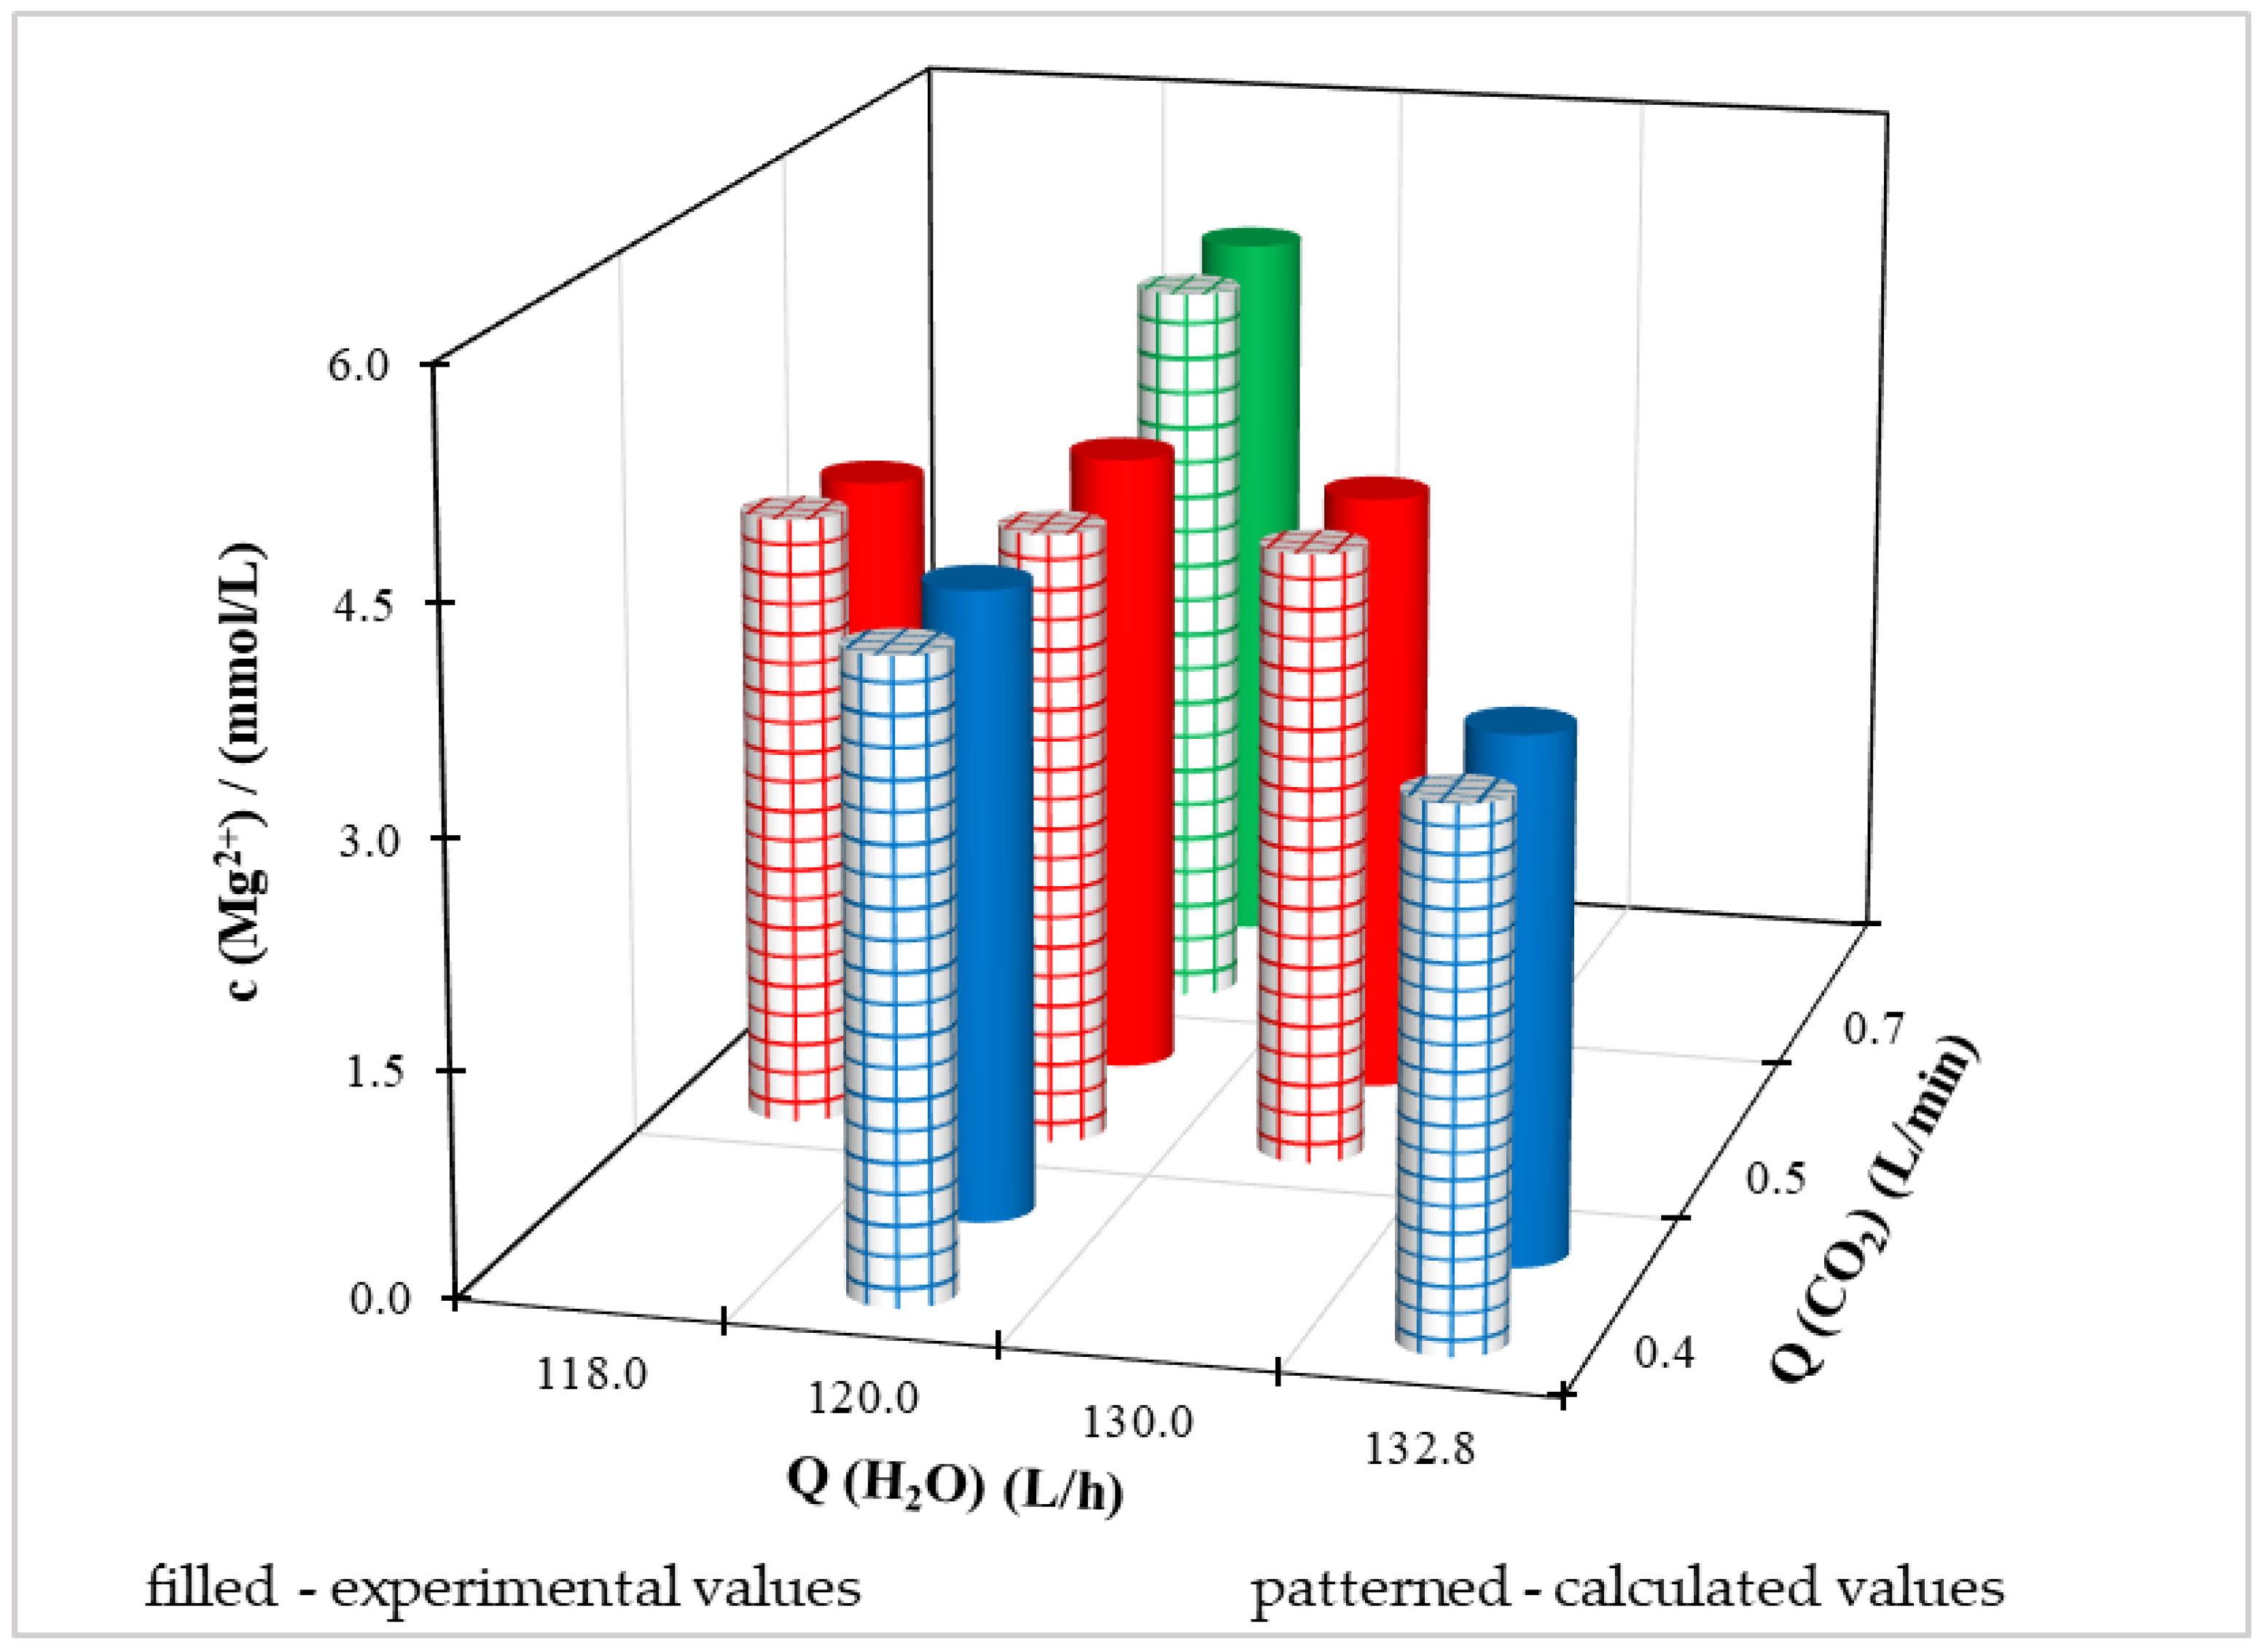
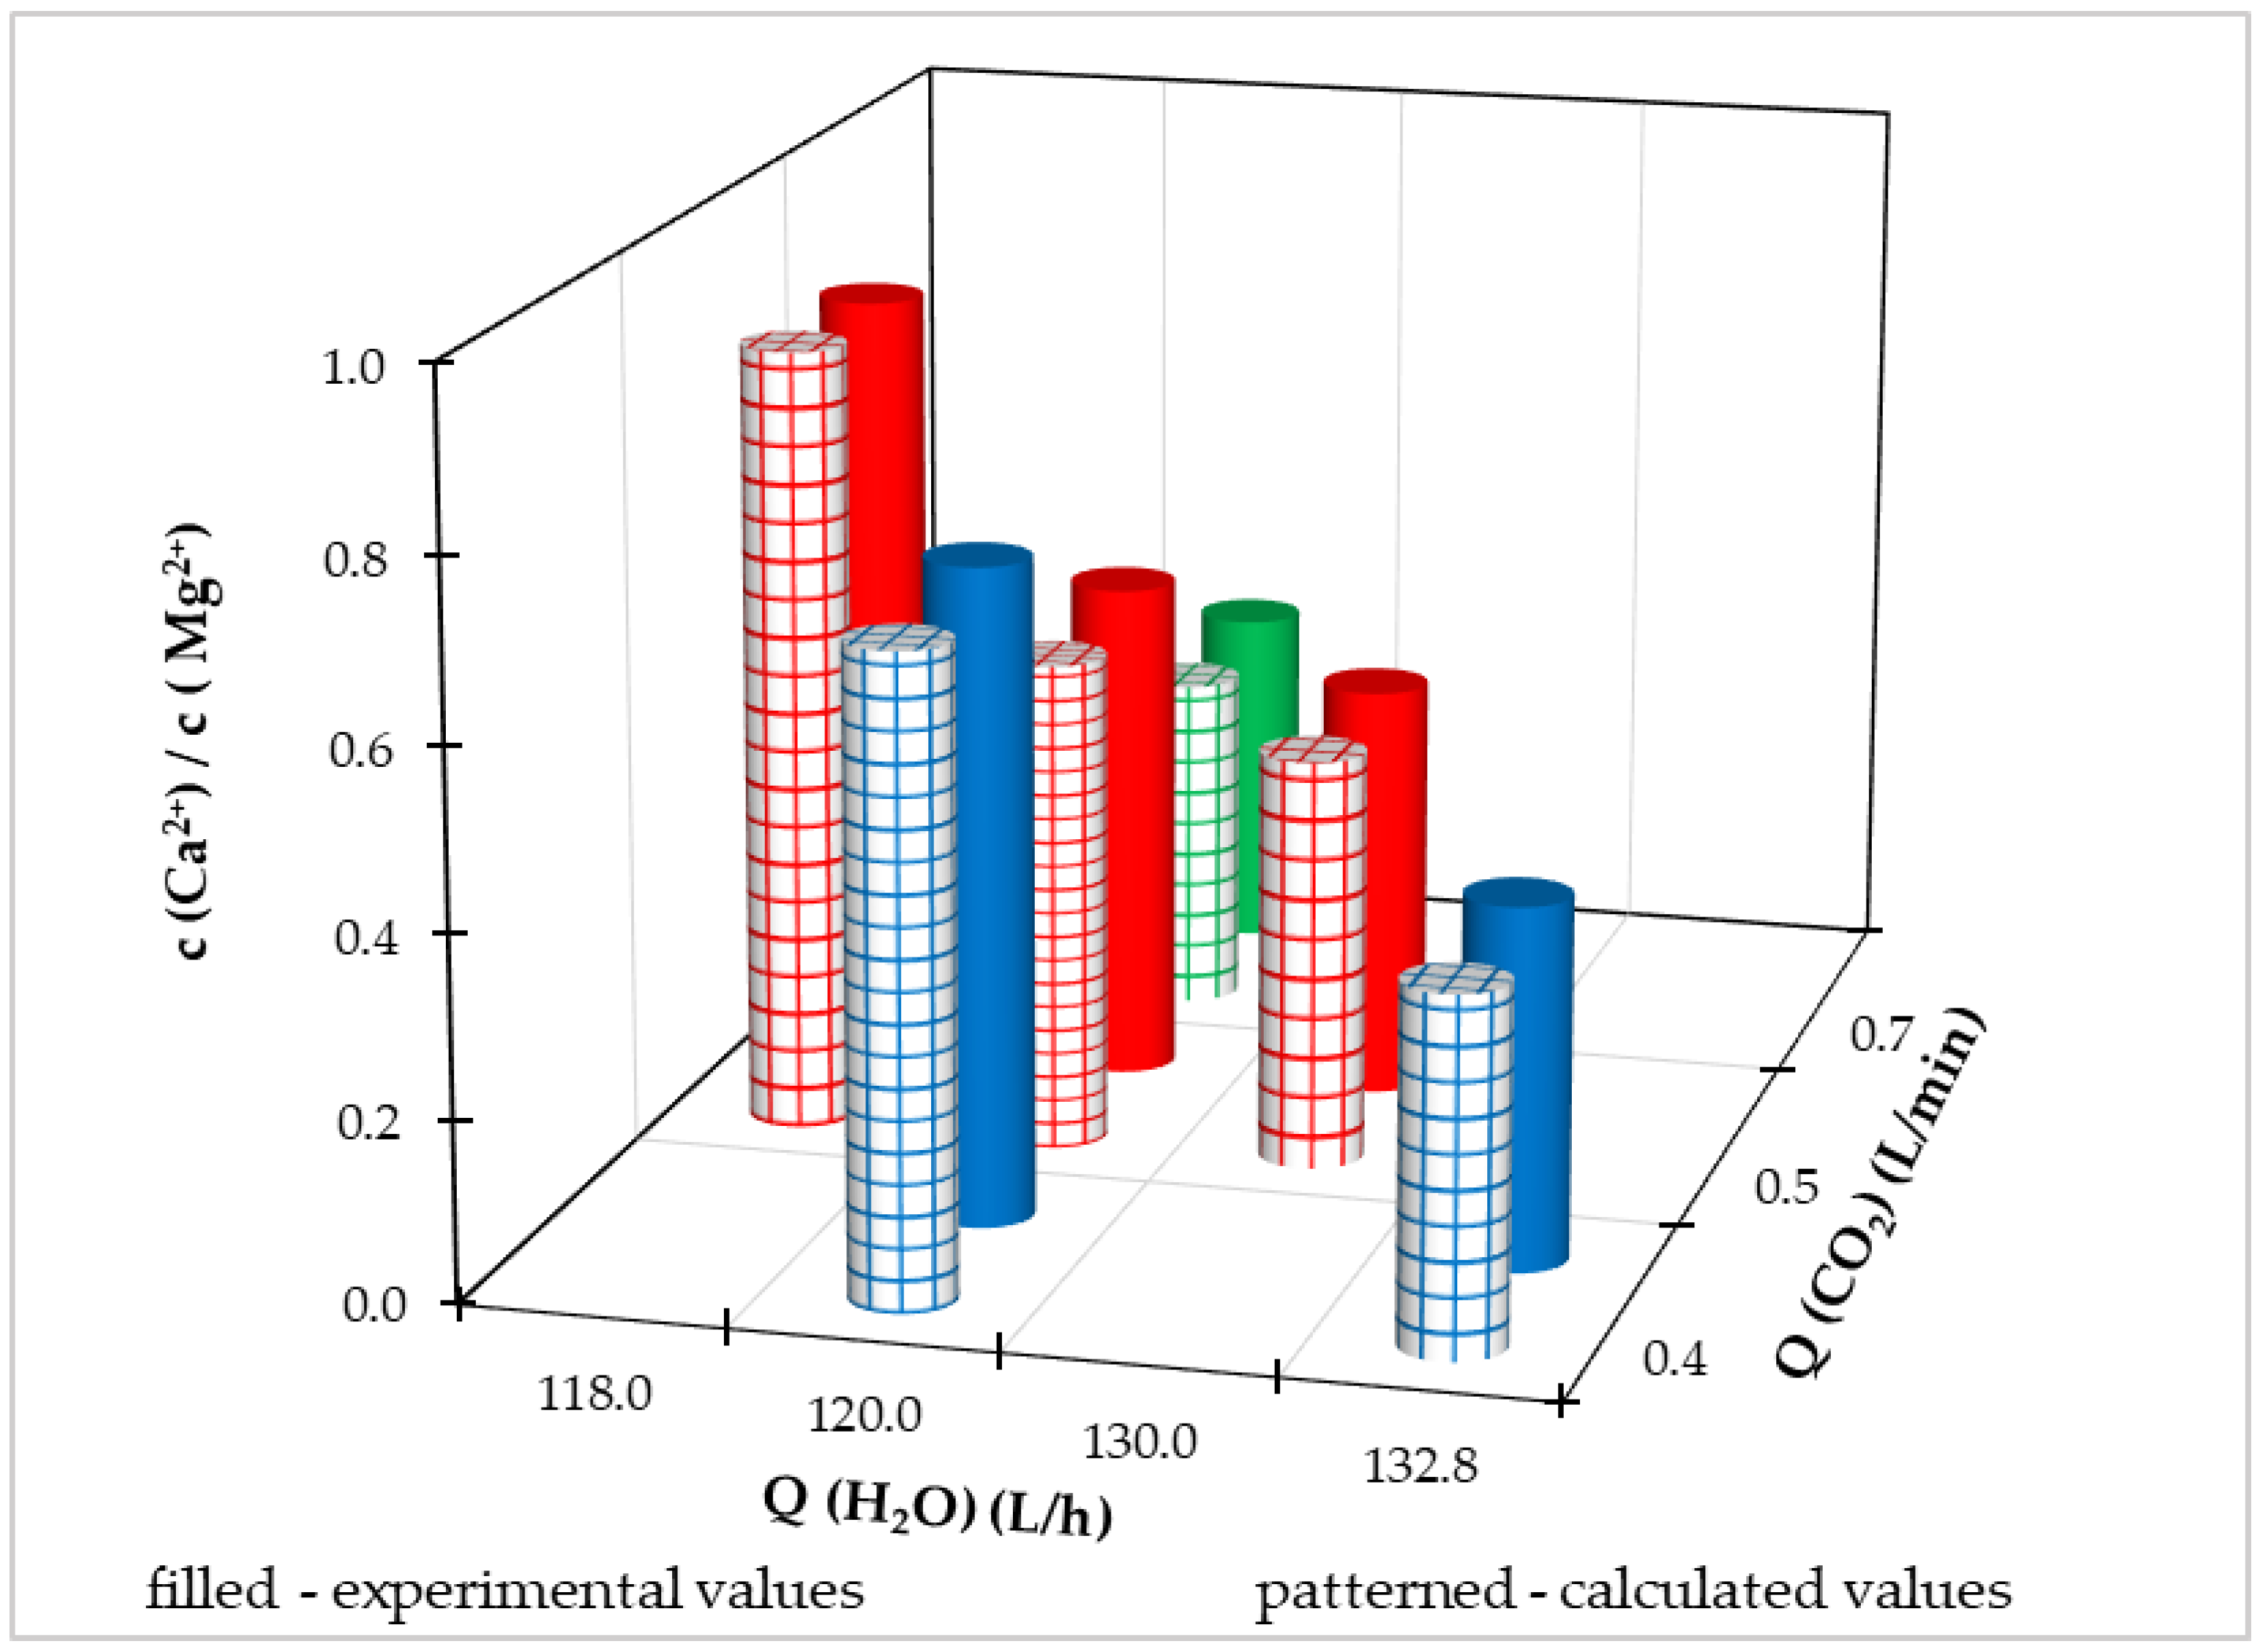
3.2.1. Statistical Processing of Experimental Results

For the mathematical description of the process of enriching drinking water with calcium and magnesium, we used a quadratic equation model with interrelationships between independent variables, i.e., the flow of carbon dioxide Q(CO2) and the flow of treated drinking water from the distribution network Q(H2O).
We applied the regression Equation (12) for four different dependent variables:
  • c(Ca2+ + Mg2+),
  • c(Ca2+)/c(Mg2+),
  • c(Mg2+),
  • c(Ca2+).
Through statistical processing, we obtained four regression models of the quadratic equation with mutual interferences, Q(CO2) and Q(H2O), and determined the values of the regression coefficients of these models with 95% probability (Table 10). We assessed the quality of the description of the recarbonization process using Equation (12) with determined parameter values by the RXY correlation coefficient, which acquires relatively high values for the individual dependencies of the variable depending on Q(CO2) and Q(H2O). Based on the values of the correlation coefficients, we can conclude a good agreement between the measured and calculated values of the dependent variables.
To assess the influence of independent variables on the process, we used the coefficient of determination R X Y 2 . In Table 10, the values of the individual coefficients of determination are listed, which range from 0.8755 to 0.9858. We can say that the recarbonization process in a pilot FBRR is 88% to 99% influenced by the flow of carbon dioxide and water from the water network.
Experimental data and calculated values using a multiple regression equation at different Q(CO2) and Q(H2O) for individual dependent variables are illustrated in Figure 11, Figure 12, Figure 13 and Figure 14. Because the pilot FBRR is a larger reaction system and stabilization of the process when conditions change takes longer than in the laboratory, we approached the change of independent variables during the experiment with caution and changed them gradually.
For a clearer comparison of the values of the dependent variable, in Figures S3–S6 (Supplementary Materials) the achieved measured and calculated values at different flow rates of treated drinking water from the distribution network at a constant flow rate Q(CO2) = 0.5 L/min are shown. Based on the illustrated graphs, we can claim that with a constant flow of carbon dioxide, as the flow of water from the water supply network increases (up to a maximum of 132.8 L/h), it
  • Reduces the sum of the molar concentration of calcium and magnesium ions in drinking water,
  • Reduces the molar concentration of calcium ions in drinking water,
  • Reduces the ratio of the molar content of calcium and magnesium in drinking water.
Regarding the magnesium content, we cannot say such a conclusion unequivocally due to the dependence of the concave shape for experimental values, seen in Figure S4, where the molar concentration of Mg2+ is shown. At the minimum and maximum water flow from the distribution network, the experimental concentration of magnesium ions is lower than at the mean value of Q(H2O). With the calculated values of c(Mg2+), the difference in magnesium ion concentration is in the order of hundredths, based on which we can conclude that the value is quasi-steady.
A comparison of the measured and calculated values of the dependent variable at a constant water flow from the water supply network of 120 L/h and different CO2 flows is shown in Figures S6 and S7.
If we evaluate the process with a constant flow of water from the distribution network and different flows of CO2 supplied to the system, we can conclude that
  • As the CO2 flow increases, the ratio of the molar content of Ca2+ and Mg2+ decreases,
  • With increasing CO2 flow, the molar concentration of Mg2+ in drinking water also increases,
  • At the same time as the CO2 flow increases, the molar concentration of Ca2+ in drinking water decreases.
As the Mg2+ content increases and the Ca2+ content decreases with increasing CO2 flow, the sum of concentrations does not have a clear decreasing/increasing trend with increasing CO2 flow.

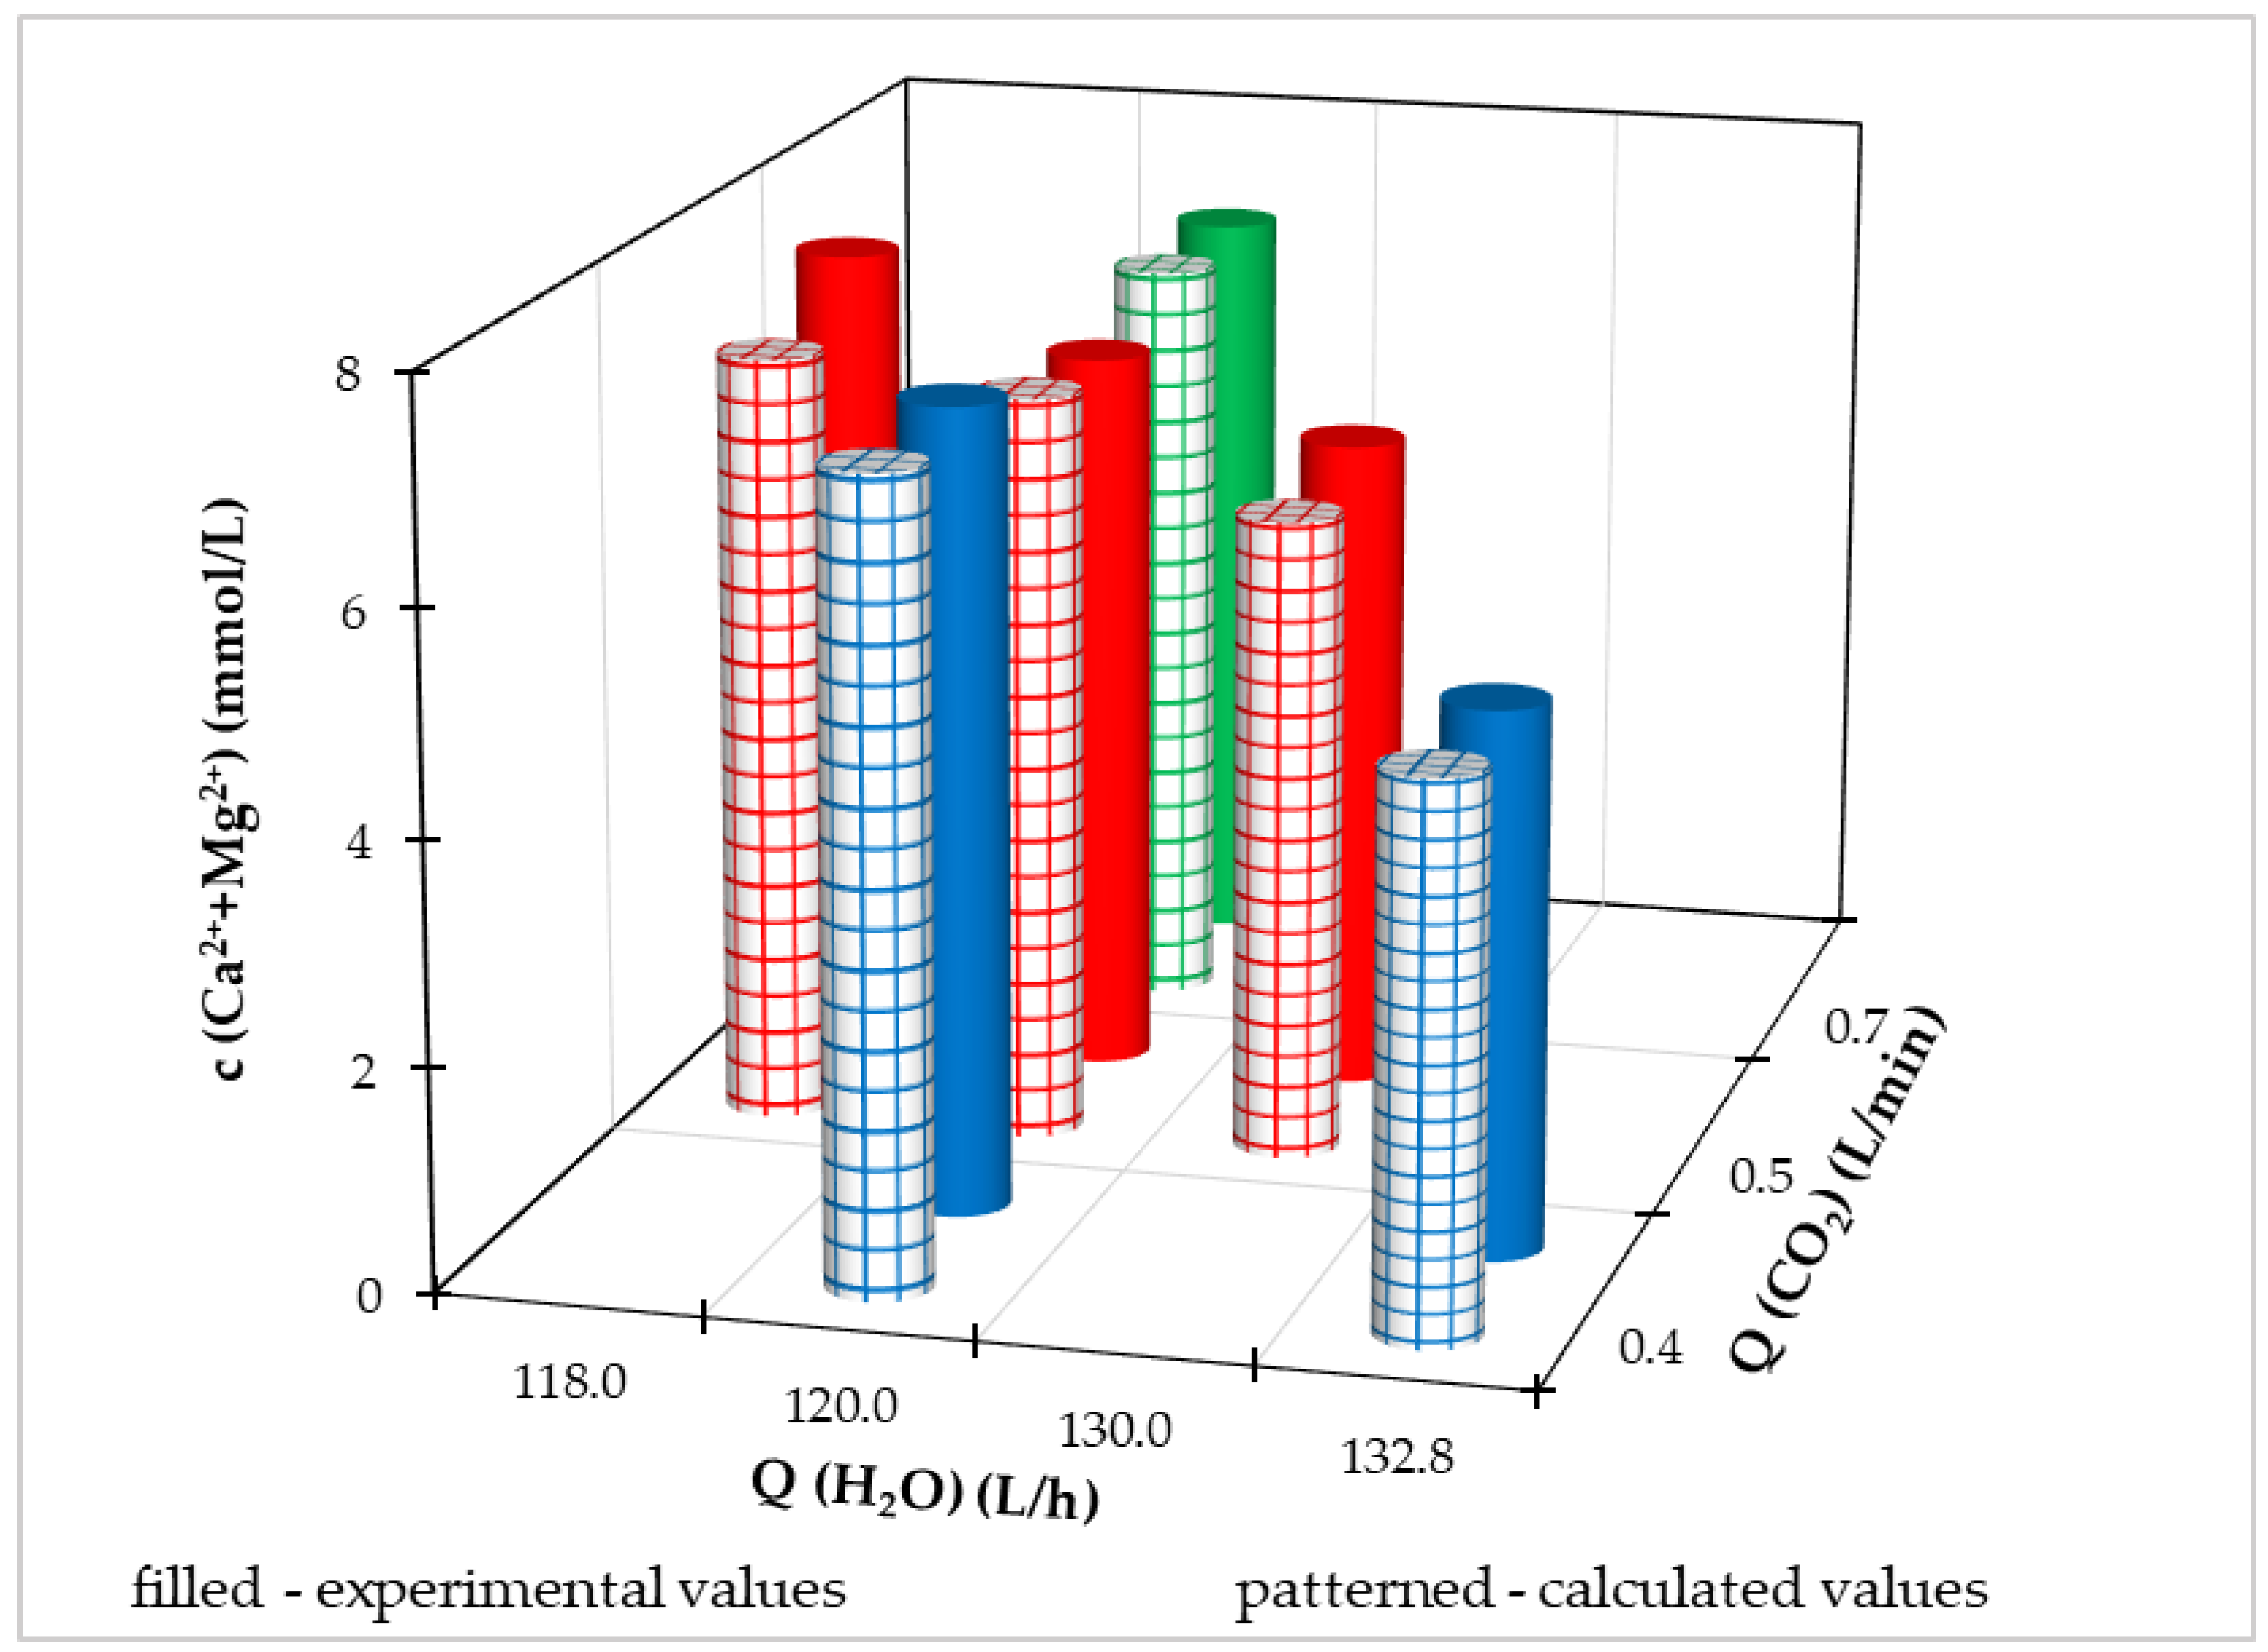
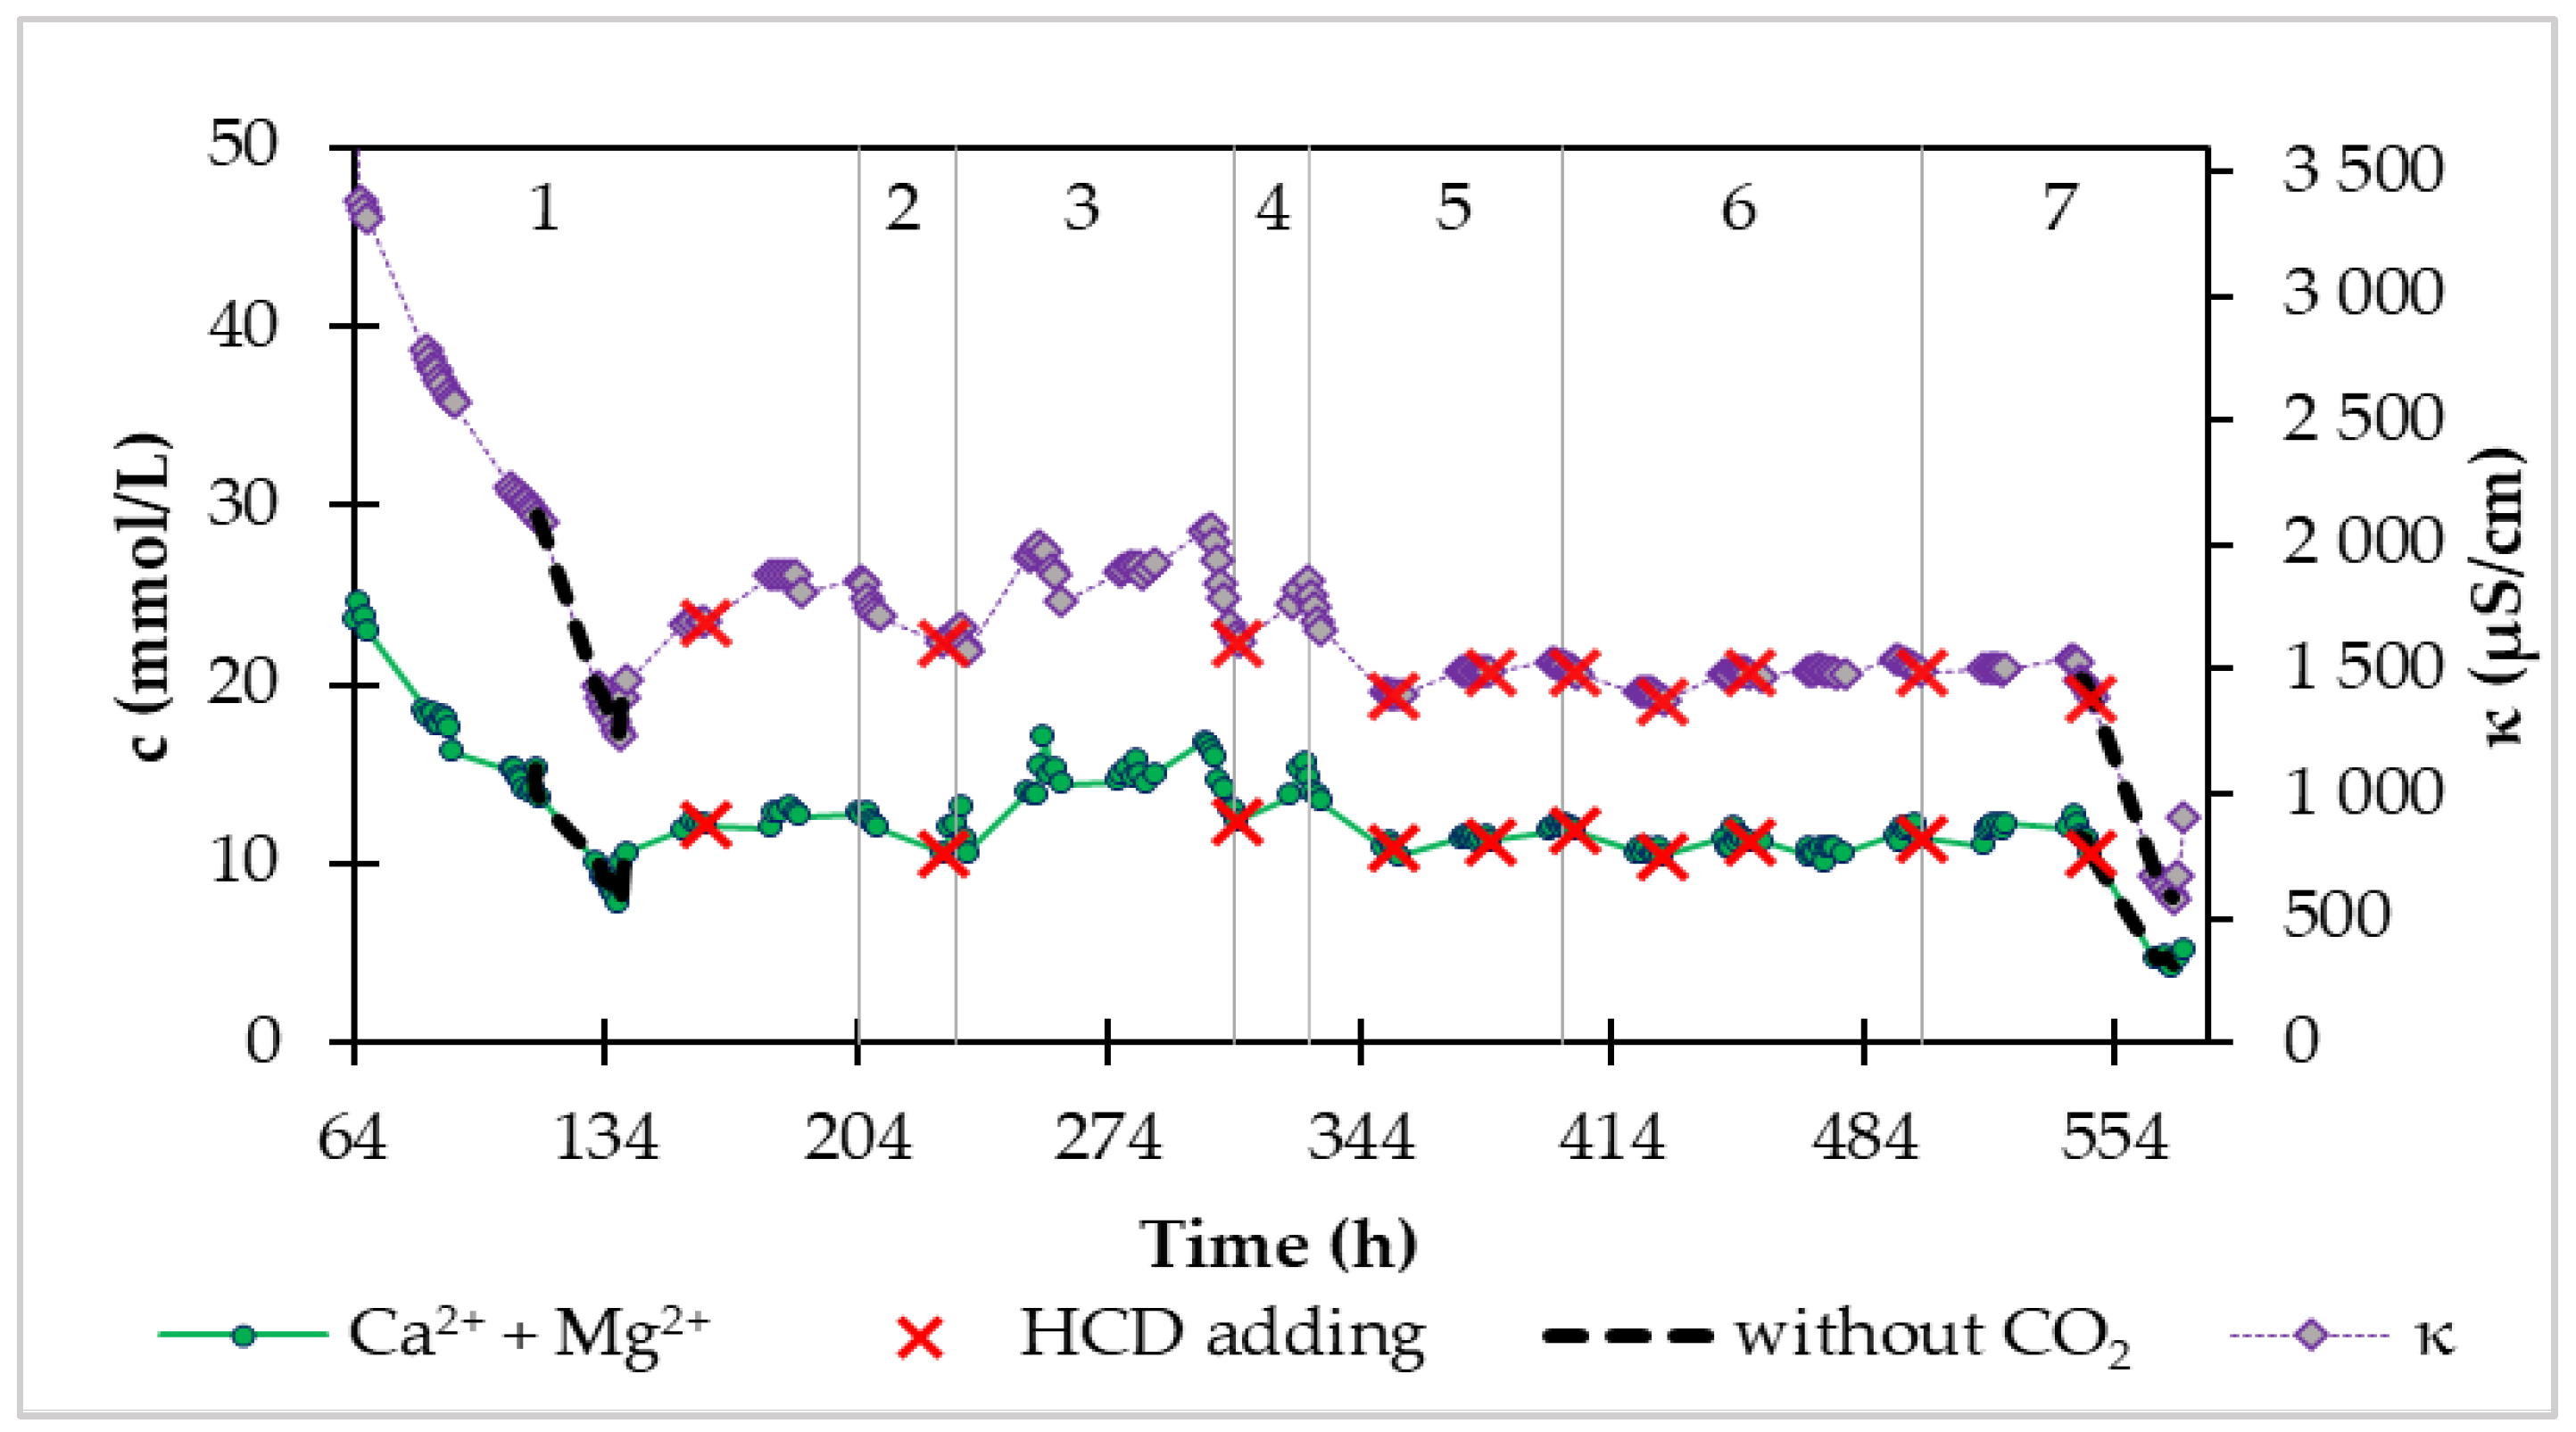
3.2.2. Optimization of the Process in the Pilot FBRR

Using the Solver program in MS Excel using the non-linear algorithm solution method, we calculated the optimal values of the independent variables (Q(CO2), Q(H2O)) in the pilot FBRR for the maximum and minimum value depending on the regression equations with determined parameter values (Table 11). We performed optimization calculations within the range of experimental conditions:
  • Q(CO2) = 0.4–0.7 L/min,
  • Q(H2O) = 118.0–132.8 L/h.
Using the determined values of the parameters of the regression equations for the maximum values of the dependent variables, from Table 11 we can notice the same conditions for all four dependent variables.
The maximum concentration of the sum of calcium and magnesium in drinking water, which can be achieved under the conditions Q(CO2) = 0.4 L/min and Q(H2O) = 118.0 L/h, is 7.59 mmol/L. At the same time, under these process conditions, a content of calcium ions of 3.53 mmol/L is reached, i.e., 141.5 mg/L and magnesium ions 4.3 mmol/L, which represents 104.5 mg/L. The value of the molar ratio of calcium and magnesium in drinking water can reach a maximum of 1.14 under the above-mentioned process conditions.
Under the stated conditions of the process in Table 11, drinking water is prepared, which is very hard [29], and is satisfactory from a health point of view.
In Table 12, the determined process conditions for the minimum values of the dependent variable are listed. We can see that during the recarbonization process in the pilot FBRR, it is possible to achieve minimum concentrations of Ca2+ and (Ca2+ + Mg2+) ions that correspond to the recommended range according to Annex no. 1 to the Decree of the Ministry of Health of the Slovak Republic no. 247/2017 Coll [28]; even the specified minimum magnesium content in drinking water is higher than the recommended range. At the same time, under process conditions that correspond to the minimum value of the dependent variable, it is not possible to achieve the required molar ratio of 0.6−1.0 of calcium and magnesium contents in drinking water.

3.2.3. Comparison of the Used Two Recarbonization Materials

We also operated the pilot FBRR with the 2.5–4.5 mm HCD Semidol recarbonizing material. During operation with this material, we maintained a constant flow of carbon dioxide, Q(CO2) = 0.4 L/min, and inflow of treated drinking water from the distribution network, Q(H2O) ≈ 120 L/h.
Both HCDs Semidol and Magno Dol (Akdolit) have approximately the same chemical composition, volume density, and carbon dioxide consumption per unit weight of the material prescribed by the supplier. HCD Semidol is a more fragile material compared to HCD Magno Dol (Akdolit) and when dosing HCD Semidol into the device, we noticed a lot of HCD dust particles.
When operating a pilot FBRR using HCD Semidol, we can achieve higher average concentrations and outflow values of magnesium ions (Table 13). However, the conditions of the recarbonization process with Magno Dol (Akdolit) were not constant during the entire operation as in the operation with HCD Semidol; therefore, a comparison of the average effluent concentrations during the process is not relevant.
When operating a pilot FBRR using HCD Semidol, we can achieve higher average concentrations and outflow values of magnesium ions (Table 12). However, the conditions of the recarbonization process with Magno Dol (Akdolit) were not constant during the entire operation as in the operation with HCD Semidol; therefore, a comparison of the average effluent concentrations during the process is not relevant.
For a more accurate comparison of the used recarbonization materials we used the balance values, which we related to the HCD weight unit. These values are shown in Table 14.
In the process with HCD Magno Dol (Akdolit), a smaller amount of the added HCD reacted (51.0%) than in the operation with HCD Semidol (79.9%). Even though a smaller amount of HCD Magno Dol (Akdolit) reacted during the process, the production of magnesium and calcium ions per kilogram of the reacted amount of HCD was higher than with HCD Semidol. The same applied to the kilogram of added mass.
Since it is necessary to supply carbon dioxide to the system, when comparing the balance values of carbon dioxide, its consumption of 1.14 kg per 1 kg of added HCD Magno Dol (Akdolit) is close to the value stated by the manufacturer (1.2–1.3 kg). For HCD Semidol, the consumption is approximately 30% lower, i.e., 0.79 kg CO2/kg HCD. The stated consumption of carbon dioxide per kilogram of added Semidol material is also lower than stated by the manufacturer (1.2–1.3 kg). The reason for the lower consumption may be the fragility of the material and the occurrence of particles smaller than 2.5–4.5 mm.
To compare the used recarbonization materials in practice, we performed balance calculations for the conditions of a real water treatment plant, where the introduction of a tested pilot FBRR into operation is being considered. The goal is to treat water with an annual water flow of 11,000 m3 with a required increase in magnesium ion content of 10 mg/L. It means that the annual increase in magnesium ions is 110 kg.
The annual consumption of carbon dioxide and compared materials under the same process conditions is shown in Table 15.
Based on the above-mentioned balance calculations for a potential water treatment plant using HCD Magno Dol (Akdolit), the annual consumption of HCD is 874.7 kg, which corresponds to the consumption of 989.6 kg of CO2 per year. When using HCD Semidol, the annual material consumption is only 43.3 kg higher, but the carbon dioxide consumption is more than 200 kg lower.
In addition to enriching the water with magnesium ions, calcium ions are also released from the recarbonization materials. The amounts of Ca2+ released during the production of 110 kg of Mg2+ per year are shown in Table 16.
The production of calcium during long-term operation of the FBRR can be considered significant in view of the current requirements placed on the quality of drinking water [28]. Annually, 38% more calcium ions are released from the Magno Dol material (Akdolit) compared to the Semidol material. When drinking water is enriched with magnesium of 10 mg/L using HCD Magno Dol (Akdolit), this represents an increase in calcium content by 8.2 mg/L. While, when using HCD Semidol, the content of calcium ions increases by 5.1 mg/L. The operator’s decision on the choice of material can also be influenced by the current selling price of materials.
The aim of this chapter was to compare the operation using these different recarbonization materials in the treatment of drinking water with an annual volume flow of 11,000 m3 with an increase in magnesium ions by 10 mg/L. When using HCD Semidol, the annual consumption of material is higher by approx. 5% and, at the same time, the annual consumption of carbon dioxide is lower by approx. 27% compared to the operation of the equipment with HCD Magno Dol (Akdolit). In addition to magnesium, calcium is also released from the mass. The increase in the concentration of calcium ions is higher by 38% when using the recarbonization material Magno Dol (Akdolit) compared to HCD Semidol.
The resulting choice of recarbonization material is up to the operator, who can decide based on the price ratios of the materials used or from the point of view of the added value of the production of calcium ions in drinking water.

4. Discussion

Recarbonization of drinking water is aimed at increasing the quality of water with a very low content of magnesium and calcium minerals. These biogenic elements are important not only for human health but also for reducing the problems related to the corrosive and aggressive effects of soft water on the materials of the drinking water distribution system. Water with very low total hardness is unstable and unbuffered.
Considering the demonstrable positive relationship between the content of Ca2+, Mg2+, and human health, the application of the recarbonization process appears to be a beneficial perspective for improving the quality of life in areas where the source of drinking water is poor in these biogenic elements. The use of a fluidized bed recarbonization reactor (FBRR) offers the possibility of treating large volumes of drinking water in a relatively short time and in smaller facilities.
The process of enhancing drinking water with biogenic and water-stabilizing calcium and magnesium ions has been investigated. The chemistry of the process is based on half-calcined dolomite in combination with carbon dioxide. The high interface reaction surface, homogenization of reaction conditions, and intensifying the potential of the fluidized bed reactor represent novel approaches to investigating recarbonization processes and reactor techniques in the drinking water industry.
This process is characterized using renewable sources of raw materials with a minimal amount of produced waste, which is environmentally acceptable. The proposed drinking water recarbonization technology using a fluidized bed recarbonization reactor for the preparation of concentrate in a side stream arrangement with respect to the drinking water distribution in main streams minimizes the energy requirements, which are only related to water recirculation near the threshold velocity. In addition, the supply of carbon dioxide under the liquid distributor in the reactor also contributes to the reduction in the required supplied energy.
It is known from published experimental results that it is advantageous to use half-calcined dolomite (HCD) in combination with CO2 when enriching drinking water with calcium and magnesium. Half-calcinated dolomite is commercially available from several companies, and for this reason we also focused on testing two HCDs, Magno Dol (Akdolit) and Semidol, with similar fractions. The results showed that even though they are chemically the same materials, they are of different quality. In general, with the same amount of magnesium ions released, a different amount of calcium ions is released and the consumption of recarbonization materials is different. From a practical point of view, it is advisable to conduct experiments that would deal with the influence of operating parameters on the recarbonization process when using Semidol and compare the results with the operation of MagnoDol (Akdolit).
Experimental and mathematical modelling of the recarbonization process aimed at increasing the content of these biogenic elements in water was carried out in the continuous laboratory- and pilot-scale fluidized bed reactors. Water remineralization using half-calcined dolomite (HCD) and carbon dioxide in a fluidized bed reactor is a novelty in water treatment. Although the chemistry of the process is known and used, the specific conditions in this type of reactor can significantly affect the efficiency of the process. In the presented work, we deal with the possibility of the recarbonization process in a fluidized bed reactor.
The influence of operating conditions (Q(CO2), freshwater inflow, and dose of HCD on some quality indicators of treated drinking water (c(Ca2+), c(Mg2+), amount of Ca2+ + Mg2+, Ca/Mg) was investigated. Subsequently, the operating conditions were optimized for the minimum and maximum value of the mentioned qualitative indicators. The results show that the Mg2+ concentration is more significantly affected by the amount of HCD in the system and the CO2. flow. The influence of the freshwater inflow on the Mg2+ content is to a lesser extent. At a constant CO2 flow, as the inflow of tap water increases the Ca2+ content decreases and the Mg2+ content increases, resulting in a decrease in the Ca/Mg molar ratio.
However, the Ca/Mg ratio can be effectively controlled by adding an appropriate amount of HCD at certain time intervals. The overproduction of ions can be easily controlled by the flow of CO2. When using HCD Semidol, the annual consumption of recarbonization material is higher by approx. 5% and, at the same time, the annual consumption of carbon dioxide is lower by approx. 27% compared to the operation of the device with HCD Magno Dol (Akdolit). With an increase in Mg2+ by 10 mg/L, the increase in the concentration of calcium ions is higher by 38% when using the recarbonization mass Magno Dol (Akdolit) compared to HCD Semidol.
The results of the experimental measurements were processed by regression analysis and optimization methods. Statistical models were developed to describe the dependence between the above water quality indicators and operating parameters. Using the grid search optimization method, the optimal values of operating parameters were determined for the maximum and minimum values of the monitored drinking water’s quality indicators. Each source of drinking water has a different quality so it is important to investigate the effect of basic operating conditions on the recarbonization process. Knowing the influence of operating conditions facilitates the design of such a device in practice, and the recarbonization process can be optimized so that the treated drinking water meets the required quality.
The laboratory and pilot FBRRs were designed, built, and verified for soft water treatment. The results of the measured hydraulic characteristics of the fluidized bed and the values of the optimal conditions of the recarbonization process make it possible to make the operation of the recarbonization system more efficient and facilitate its further expansion to full operation.

5. Conclusions

The use of the recarbonization process in a fluidized bed reactor using carbon dioxide and recarbonization materials based on half-calcined dolomite is a novel technology for enriching drinking water with calcium and magnesium. Among the main advantages of using a fluidized bed is a relatively large contact area between the solid particles and the liquid, which minimizes the residence time of the liquid phase in the reactor. With this advantage, it is possible to adjust large volumes of drinking water in a short time. The aim of this work was experimental and mathematical modelling of the operation of a laboratory and pilot FBRR using CO2 and selected recarbonization materials.
From the results of the work in the investigated range of recarbonization operating parameters, it follows that the Ca/Mg ratio can be effectively regulated by adding a suitable amount of PVD at certain intervals. An overproduction of Mg2+ ions can be easily controlled by CO2 flow. In the tested laboratory and semi-operational equipment, it is possible to increase the concentration of Mg2+ by 10 mg/L, which was the requirement for the recarbonization process in the case study in question. At the same time, the concentrations of Mg2+ and Ca2+ are maintained in both modeled systems, which are in accordance with the recommended values of Slovak standards for drinking water. When applying HCD Magno-Dol to maintain a stable Ca/Mg ratio at a freshwater inflow of 120 L/h and a CO2 flow of 0.5 L/min, it is advisable to dose approximately 3.5 kg of new PVD Magno-Dol into the system every 75 h.
The key values of our results include the development and verification of a sustainable remineralization system for enriching drinking water with the specific biogenic elements calcium and magnesium. Based on our results, a methodology for scaling-up the modeled system was extended with mathematical modelling and an industrial recarbonization system was designed. This system is put into operation in a locality with a deficient content of these elements in the drinking water and related health problems of the inhabitants.

Supplementary Materials

The following supporting information can be downloaded at: https://www.mdpi.com/article/10.3390/pr11113209/s1. Figure S1. Algorithm of Modelling of Drinking Water Recarbonization. Figure S2. Calculated and measured concentrations of Ca2+ + Mg2+ at different flows of treated water and CO2 flow at the level of 0.5 L/min during operation of the laboratory FBRR. Figure S3. The total concentration of the sum of Ca2+ and Mg2+ ions in drinking water at Q(CO2) = 0.5 L/min. Figure S4. Molar concentration of Mg2+ in drinking water at Q(CO2) = 0.5 L/min. Figure S5. Molar concentration of Ca2+ in drinking water at Q(CO2) = 0.5 L/min. Figure S6. Molar concentration ration of Ca2+ and Mg2+ in drinking water at Q(CO2) = 0.5 L/min. Figure S7. Molar concentration of the sum of Ca2+ and Mg2+ in drinking water at Q(H2O) = 120 L/h. Figure S8. Molar concentration of the sum of Mg2+ in drinking water at Q(H2O) = 120 L/h. Figure S9. Molar concentration of the sum of Ca2+ in drinking water at Q(H2O) = 120 L/h. Figure S10. Molar ratio of Ca2+ and Mg2+ concentration in drinking water at Q(H2O) = 120 L/h.

Author Contributions

Conceptualization, J.D. (Ján Derco) and J.D. (Jozef Dudáš); methodology, J.D. (Ján Derco); software, T.K.; validation, N.Š. and J.D. (Ján Derco); formal analysis, N.Š.; investigation, T.K., N.Š. and A.V.; resources, all authors.; data curation, J.D. (Ján Derco); writing—original draft preparation, J.D. (Ján Derco); writing—review and editing, J.D. (Ján Derco); visualization, N.Š.; supervision, A.V.; project administration, N.Š. and A.V. All authors have read and agreed to the published version of the manuscript.

Funding

This research was funded by “Improvement of health status of population of the Slovak Republic through drinking water re-carbonization” LIFE-Water and Health LIFE17 ENV/SK/000036.

Data Availability Statement

Data are contained within the article and Supplementary Materials.

Conflicts of Interest

The authors declare no conflict of interest.

References

  1. Rylander, R.; Bonevik, H.; Rubenowitz, E. Magnesium and Calcium in Drinking Water and Cardiovascular Mortality. Scand. J. Work. Environ. Health 1991, 17, 91–94. [Google Scholar] [CrossRef] [PubMed]
  2. Yang, C.-Y. Calcium and Magnesium in Drinking Water and Risk of Death from Cerebrovascular Disease. Stroke 1998, 29, 411–414. [Google Scholar] [CrossRef] [PubMed]
  3. Rosanoff, A. The High Heart Health Value of Drinking-Water Magnesium. Med. Hypotheses 2013, 81, 1063–1065. [Google Scholar] [CrossRef] [PubMed]
  4. Kaluza, J.; Orsini, N.; Levitan, E.B.; Brzozowska, A.; Roszkowski, W.; Wolk, A. Dietary Calcium and Magnesium Intake and Mortality: A Prospective Study of Men. Am. J. Epidemiol. 2010, 171, 801–807. [Google Scholar] [CrossRef] [PubMed]
  5. Cotruvo, J. Drinking Water Quality and Contaminants Guidebook; Chapman and Hall/CRC: Milton, MA, USA, 2018; ISBN 9781351110464. [Google Scholar]
  6. Rubenowitz, E.; Axelsson, G.; Rylander, R. Magnesium in Drinking Water and Death from Acute Myocardial Infarction. Am. J. Epidemiol. 1996, 143, 456–462. [Google Scholar] [CrossRef] [PubMed]
  7. Rosborg, I. Drinking Water Minerals and Mineral Balance; Springer: Berlin/Heidelberg, Germany, 2014. [Google Scholar]
  8. WHO. Guidelines for Drinking-Water Quality, 4th ed.; World Health Organization: Geneva, Switzerland, 2011; p. 531. [Google Scholar]
  9. Jiang, L.; He, P.; Chen, J.; Liu, Y.; Liu, D.; Qin, G.; Tan, N. Magnesium Levels in Drinking Water and Coronary Heart Disease Mortality Risk: A Meta-Analysis. Nutrients 2016, 8, 5. [Google Scholar] [CrossRef] [PubMed]
  10. Barloková, D.; Ilavský, J.; Kapusta, O.; Šimko, V. Importance of Calcium and Magnesium in Water—Water Hardening. IOP Conf. Ser. Earth Environ. Sci. 2017, 92, 012002. [Google Scholar] [CrossRef]
  11. Rapant, S.; Letkovičová, A.; Jurkovičová, D.; Kosmovský, V.; Kožíšek, F.; Jurkovič, Ľ. Differences in Health Status of Slovak Municipalities Supplied with Drinking Water of Different Hardness Values. Environ. Geochem. Health 2021, 43, 2665–2677. [Google Scholar] [CrossRef]
  12. Whelton, A.J.; Dietrich, A.M.; Burlingame, G.A.; Schechs, M.; Duncan, S.E. Minerals in Drinking Water: Impacts on Taste and Importance to Consumer Health. Water Sci. Technol. 2007, 55, 283–291. [Google Scholar] [CrossRef] [PubMed]
  13. Nelson, N.; De Luca, A. Remineralization and Stabilization of Desalinated Water. In Pathways and Challenges for Efficient Desalination; IntechOpen: London, UK, 2022. [Google Scholar]
  14. Birnhack, L.; Shlesinger, N.; Lahav, O. A Cost-Effective Method for Improving the Quality of Inland Desalinated Brackish Water Destined for Agricultural Irrigation. Desalination 2010, 262, 152–160. [Google Scholar] [CrossRef]
  15. Bang, D.P. Upflow Limestone Contactor for Soft and Desalinated Water. Master’s Thesis, Delft University of Technology, Delft, The Netherlands, 2012. [Google Scholar]
  16. Lehmann, O.; Birnhack, L.; Lahav, O. Design Aspects of Calcite-Dissolution Reactors Applied for Post Treatment of Desalinated Water. Desalination 2013, 314, 1–9. [Google Scholar] [CrossRef]
  17. Van Schagen, K.M. Model-Based Control of Drinking-Water Treatment Plants. Ph.D. Thesis, Technical University of Delft, Delft, The Netherlands, 2009. [Google Scholar]
  18. Kramer, O.; Jobse, M.A.; Baars, E.T.; van der Helm, A.W.C.; Colin, M.G.; Kors, L.J.; van Vugt, W.H. Model-Based Prediction of Fluid Bed State in Full-Scale Drinking Water Pellet Softening Reactors. In Proceedings of the 2nd IWA New Developments in IT & Water Conference, Amsterdam, The Netherlands, 8–10 February 2015; pp. 8–10. [Google Scholar]
  19. Derco, J.; Dudáš, J.; Luptáková, A.; Vrabeľ, M. Method of Increasing the Content of Mineral Substances in Water and Equipment for Performing This Method. (Industrial Property Office of the Slovak Republic—WebRegisters PP 50035-2018). Available online: https://wbr.indprop.gov.sk/WebRegistre/Patent/Detail/50035-2018 (accessed on 6 November 2023).
  20. Ca and Mg Extraction from Rocks: Laboratory Tests. Available online: https://fns.uniba.sk/fileadmin/prif/envi/kge/LifeWater/PDF/Sum_of_Laboratory_tests_of_water_recarbonation_Ca_Mg.pdf (accessed on 3 November 2023).
  21. Richardson, J.F.; Zaki, W.N. Sedimentation and Fluidisation: Part I. Trans. Instn. Chem. Eng. 1954, 32, 35–53. [Google Scholar] [CrossRef]
  22. Dudáš, J.; Derco, J.; Kurák, T.; Šoltýsová, N.; Jelemenský, Ľ.; Vrabeľ, M. Design, Scale-Up, and Construction of Drinking Water Recarbonization Fluidized Bed Reactor System. Processes 2022, 10, 2068. [Google Scholar] [CrossRef]
  23. Rice, E.W.; Baird, R.B.; Eaton, A.D.; Clesceri, L.S.; American Public Health Association; American Water Works Association. Water Environment Federation Standard Methods for Examination of Water and Wastewater 2012; American Public Health Association: Washington, DC, USA, 2012. [Google Scholar]
  24. Mulcahy, L.T.; Shieh, W.K.; Lamotta, E.J. Simplified Mathematical Models for a Fludized Bed Biofilm Reactors. Am. Inst. Chem. Eng. 1981, 209, 273–285. [Google Scholar]
  25. Olejko, Š. Study of Drinking Water Treatability and Environmental Aspects of Water Flows. In Sub-Task 02: Treatment of Drinking Water Mineralization; Final Report of the Task 1999; VÚVH: Bratislava, Slovakia, 1999. [Google Scholar]
  26. Dang, J.S.; Harvey, D.M.; Jobbagy, A.; Grady, C.P.L. Evaluation of Biodegradation Kinetics with Respirometric Data. Res. J. Water Pollut. Control Fed. 1989, 61, 1711–1721. [Google Scholar]
  27. Nelder, J.A.; Mead, R. A Simplex Method for Function Minimization. Comput. J. 1965, 7, 308–313. [Google Scholar] [CrossRef]
  28. Ministry of Health of the Slovak Republic. Decree No. 247/2017 Coll. Slovak Standard Values for Drinking Water. 2017. Available online: https://www.slov-lex.sk/pravne-predpisy/SK/ZZ/2017/247/20171015 (accessed on 6 November 2023).
  29. Pitter, P. Hydrochemistry, 5th ed.; University of Chemistry and Technology: Prague, Czech Republic, 2015; p. 792. [Google Scholar]
Figure 1. Scheme of the laboratory water recarbonization system, 1—drinking water feed, 2—buffer tank, 3—recirculation valve, 4—pump, 5—fluidization reactor, 6—sedimentation tank, 7—storage/water tank, 8—rotameter, 9—CO2 feed, 10—storage tank outlet; reactor height: 90 cm and diameter: 4.8 cm.
Processes 11 03209 g001
Figure 2. Experimental dependence of pressure drops (ΔP) on superficial water velocity (w) for fraction 2.0–4.0 mm of HCD dolomite Magno Dol (Akdolit) in the presence of CO2.
Processes 11 03209 g002
Figure 3. Time dependence of conductivity and Ca2+ and Mg2+ concentrations during saturation phase in laboratory FBRR.
Processes 11 03209 g003
Figure 4. Time dependence of Mg2+ and Ca2+ production and the ratio of molar concentrations of ions during the recarbonization phase in laboratory FBRR.
Processes 11 03209 g004
Figure 5. Time dependence of Ca2+ + Mg2+ content during the saturation phase of laboratory FBRR.
Processes 11 03209 g005
Figure 6. Time dependence of conductivity and molar concentration of Ca2+ + Mg2+ during the continuous operation of a laboratory FBRR.
Processes 11 03209 g006
Figure 7. Calculated and measured values of Ca2+ + Mg2+ concentration during continuous operation of laboratory FBRR.
Processes 11 03209 g007
Figure 8. Experimental and calculated c(Ca2+)/c(Mg2+) during continuous operation of the laboratory FBRR.
Processes 11 03209 g008
Figure 9. Time dependencies of conductivity and molar concentration of Ca2+ + Mg2+ during operation of pilot FBRR.
Processes 11 03209 g009
Figure 10. Time dependencies of the molar concentrations of Ca2+ and Mg2+ and the ratio of the molar concentrations of Ca2+ and Mg2+ during the operation of pilot FBRR.
Processes 11 03209 g010
Figure 11. Experimental and calculated values of molar concentration of Ca2+ + Mg2+.
Processes 11 03209 g011
Figure 12. Experimental and calculated values of molar concentration of Mg2+.
Processes 11 03209 g012
Figure 13. Experimental and calculated values of molar concentration of Ca2+.
Processes 11 03209 g013
Figure 14. Experimental and calculated values of molar concentration of Ca2+ a Mg2+.
Processes 11 03209 g014
Table 1. Values of parameters of hydraulic equations.
ab3cDcdnRXY
34.20.714.976.390.233.180.70
Table 2. Doses of HCD Magno Dol (Akdolit) to laboratory FBRR during saturation phase.
HCD Refill Time
[h]
HCD Dose
[g]
Hight of Fluidized Bed
[cm]
0360.0-
929.115.9
5336.814.9
Table 3. Measured data at the beginning and end of saturation phase in laboratory FBRR.
Time
(h)
pH
(-)
Κ
(µS/cm)
c(Ca2+ + Mg2+)
(mmol/L)
cm (Ca2+)
(mg/L)
cm (Mg2+)
(mg/L)
07.006724.1040.0875.33
647.51490036.7584.17842.00
Table 4. Values of kinetic parameters of recarbonization Equation (11) and statistical characteristics.
cmax
(mmol/L)
dC
(1/min)
S y 2 S r 2 RXY
37.103.95∙10−2118.604.770.9611
Table 5. Parameter values of the regression model (Ca2+ + Mg2+) = f (Q(CO2), Q(H2O)) for laboratory FBRR.
ParameterValue
P033.994
P12.790
P2−0.847
P1110.000
P220.007
P12−0.021
Table 6. Values of regression coefficients of the model c(Ca2+)/c(Mg2+) = f (Q(CO2), Q(H2O)) for the laboratory FBRR.
ParameterValue
P0−0.1249
P1−0.8076
P20.0194
P11−0.4775
P22−0.0002
P120.0160
Table 7. Results of the optimization of recarbonization process conditions for the dependent variable c(Ca2++ Mg2+).
Valuec(Ca2+ + Mg2+)
(mmol/L)
Q(CO2)
(L/min)
Q(H2O)
(mL/min)
c(Ca2+)/c(Mg2+)
Maximum16.200.5476.000.01
Minimum10.900.2457.200.18
Table 8. Results of the optimization of recarbonization process conditions for the dependent variable c(Ca2+)/c(Mg2+).
Valuec(Ca2+)/c(Mg2+)Q(CO2)
(L/min)
Q(H2O)
mL/min)
c(Ca2+ + Mg2+)
Maximum0.200.2447.1011.60
Minimum0.050.5470.0014.80
Table 9. Flows of carbon dioxide for individual areas shown in Figure 9 and Figure 10.
AreaQ(CO2) (L/min)
10.4
20.7
30.5
40.3
50.5
60.4
Table 10. Parameter values of Equation (12) and statistical characteristics for individual dependent variables Y.
Dependent Variables Y
Parameterc(Ca2+ + Mg2+)c(Ca2+)/c(Mg2+)c(Mg2+)c(Ca2+)
P090.785238.76029.965288.433
P1−118.575−67.015−75.558−86.230
P2−0.788−3.546−0.123−4.160
P1116.2792.52416.645−3.577
P221.09 × 10−31.31 × 10⁻²−5.17 × 10−41.49 × 10−2
P120.8340.5260.5000.724
RXY0.96350.99290.97960.9357
RXY20.95970.87550.98580.9283
Table 11. Optimization of the conditions of the process in the pilot FBRR for the maximum values of the dependent variables.
Dependent VariablesValueQ(CO2)
(L/min)
Q(H2O)
(L/h)
c(Ca2+ + Mg2+)7.59 mmol/L0.40118.00
c(Mg2+)4.30 mmol/L0.40118.00
c(Ca2+)3.53 mmol/L0.40118.00
c(Ca2+)/c(Mg2+)1.140.40118.00
Table 12. Optimization of the conditions of the process in the pilot FBRR for the minimum values of the dependent variables.
Dependent VariablesValueQ(CO2)
(L/min)
Q(H2O)
(L/h)
c(Ca2+ + Mg2+)4.93 mmol/L0.40132.80
c(Mg2+)3.52 mmol/L0.40132.80
c(Ca2+)1.30 mmol/L0.40130.24
c(Ca2+)/c(Mg2+)6.93 × 10−40.40127.35
Table 13. Average values achieved when using different HCDs.
Magno Dol (Akdolit)Semidol
Average inflow of freshwater (L/h)121.8119.7
Average c(Mg2+) (mg/L)105.3146.2
Average c(Ca2+) (mg/L)86.570.5
Average outflow Mg2+ (g/h)12.816.6
Average outflow Ca2+ (g/h)10.58.5
Table 14. Values of reaction time and balance values when using two different recarbonization materials.
Magno Dol (Akdolit)Semidol
Reaction time (h)306.6167.0
Total added HCD (kg)31.223.1
Reacted amount of HCD (kg)15.918.4
Reacted HCD to added HCD (%)51.079.9
Total consumption of CO2 (kg)35.318.2
Total production of Mg2+ (kg)3.92.8
Total production of Ca2+ (kg)3.21.4
Average production of Mg2+ per added HCD (g/kg)125.8119.8
Average production of Ca2+ per added HCD (g/kg)103.261.2
Average production of Mg2+ per reacted HCD (g/kg)246.8149.9
Average production of Ca2+ per reacted HCD (g/kg)202.576.5
CO2 consumption per added HCD (kg/kg)1.10.8
CO2 consumption per reacted HCD (kg/kg)2.21.0
Table 15. Consumption of CO2 and recarbonization materials in a pilot FBRR with an annual increase of 110 kg Mg2+.
Magno Dol (Akdolit)Semidol
HCD consumption (kg/year)874.7917.9
CO2 consumption (kg/year)989.6721.2
Table 16. Amounts of Ca2+ released and increased concentrations of Ca2+ using different recarbonization materials in a pilot FBRR, corresponding to an annual increase of 110 kg Mg2+ in treated water.
Magno Dol (Akdolit)Semidol
Released Ca2+ (kg/year))90.356.2
Increases c(Ca2+) (mg/L)8.25.1
Disclaimer/Publisher’s Note: The statements, opinions and data contained in all publications are solely those of the individual author(s) and contributor(s) and not of MDPI and/or the editor(s). MDPI and/or the editor(s) disclaim responsibility for any injury to people or property resulting from any ideas, methods, instructions or products referred to in the content.

