Author Contributions
Conceptualization, E.V.L. and A.V.P.; methodology, E.V.L. and A.V.P.; validation, E.V.L. and A.V.P.; formal analysis, E.V.L. and A.V.P.; investigation, E.V.L., A.V.P. and A.V.K.; writing—original draft preparation, A.V.P.; writing—review and editing, E.V.L., A.V.P., N.N.K., Y.A.Z. and A.A.V.; visualization, A.V.P.; supervision, A.V.P., E.V.L. and A.A.V.; project administration, A.V.P., E.V.L. and N.N.K.; funding acquisition, A.A.V., N.N.K. and Y.A.Z. All authors have read and agreed to the published version of the manuscript.
Figure 1.
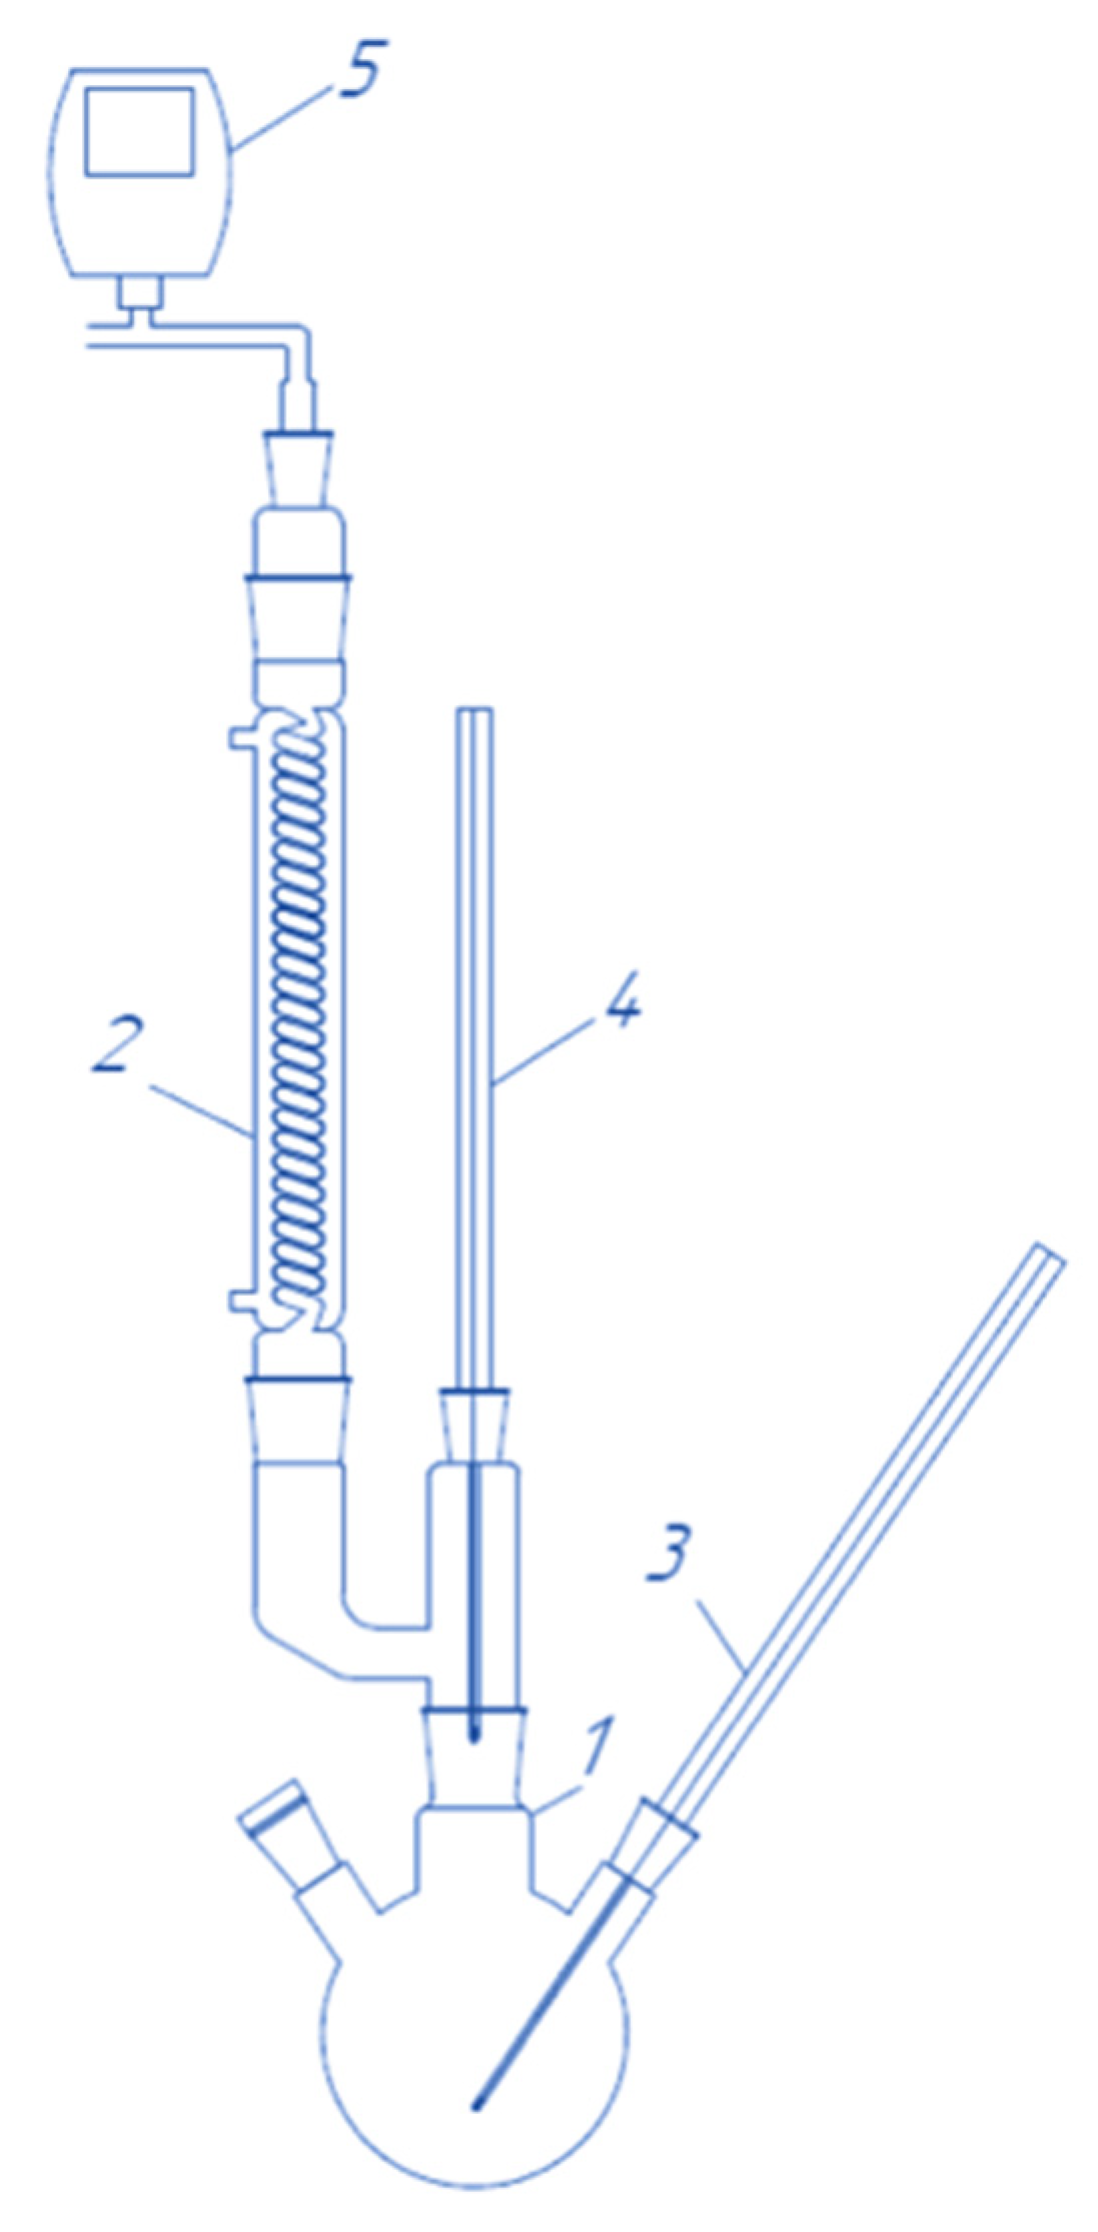
Apparatus for determining saturated vapor pressure: 1—still; 2—backflow condenser; 3 and 4—thermometers; 5—manometer. Reproduced from ref. [
130]. Copyright 2023 American Chemical Society.
Figure 1.
Apparatus for determining saturated vapor pressure: 1—still; 2—backflow condenser; 3 and 4—thermometers; 5—manometer. Reproduced from ref. [
130]. Copyright 2023 American Chemical Society.
Figure 2.
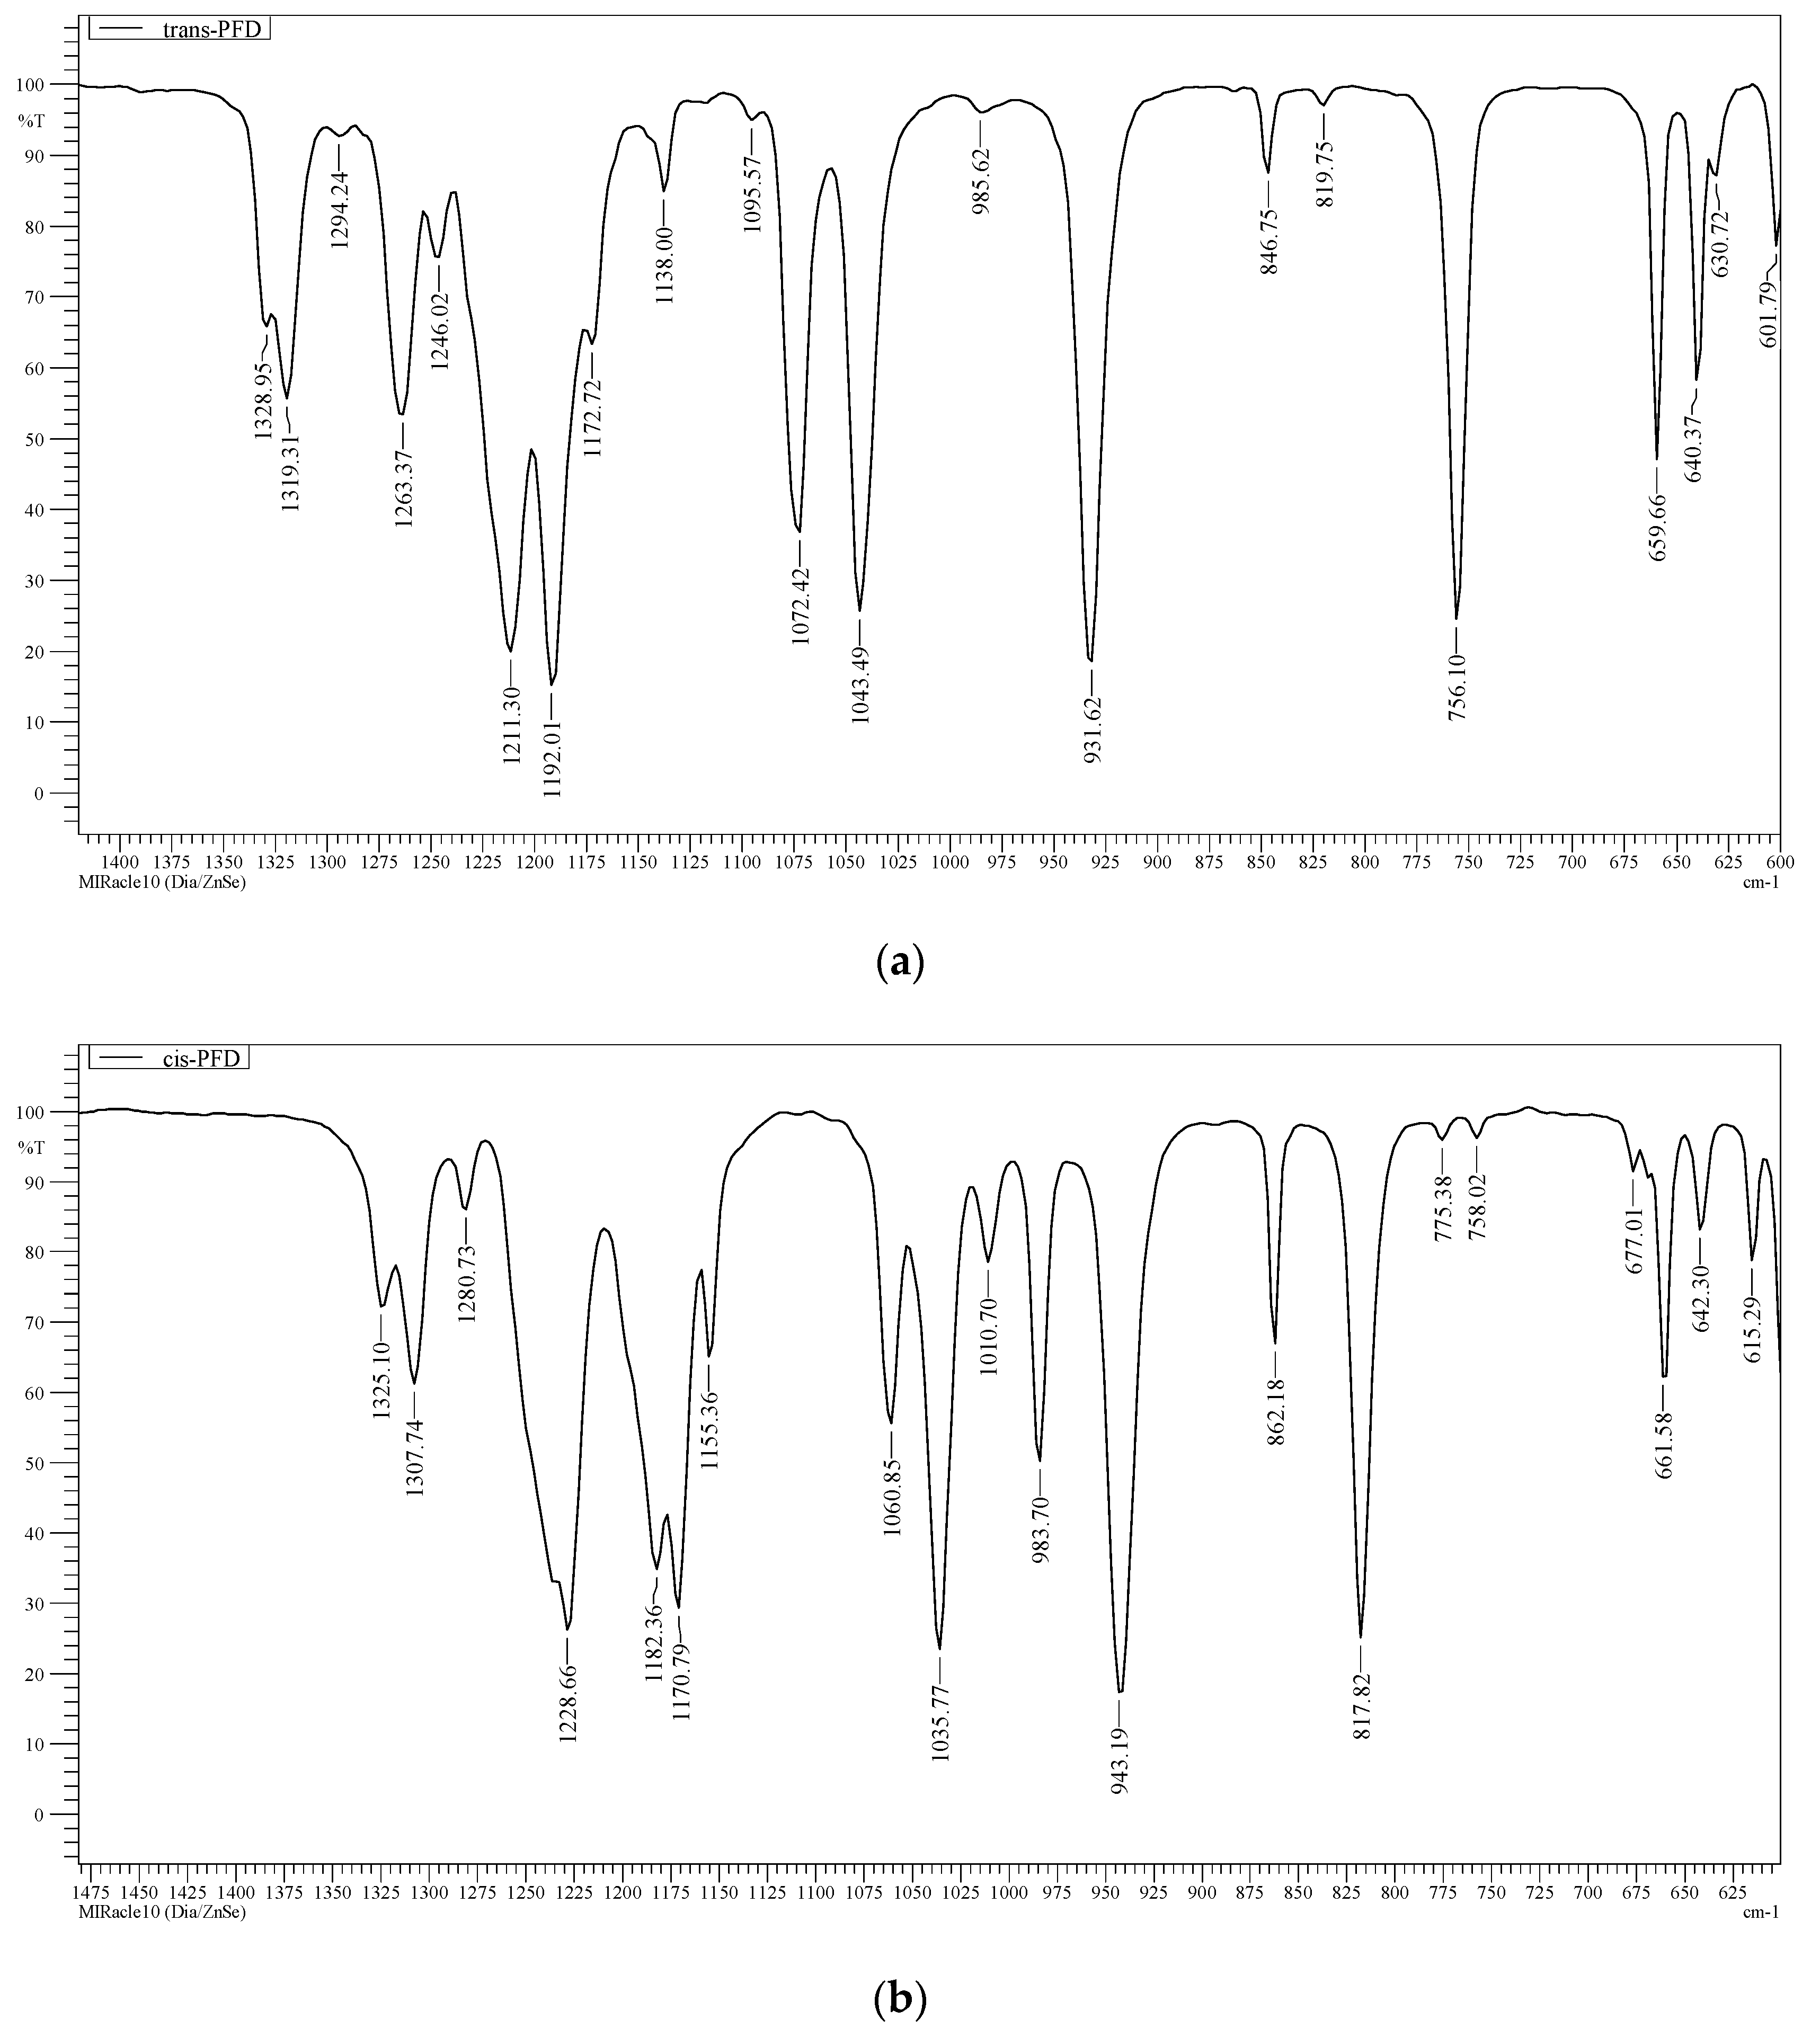
GC–MS data: (a) trans-perfluorodecalin; (b) cis-perfluorodecalin.
Figure 2.
GC–MS data: (a) trans-perfluorodecalin; (b) cis-perfluorodecalin.
Figure 3.
NMR spectrum of trans-perfluorodecalin (red color) and cis-perfluorodecalin (blue color). (a) 13C; (b) 19F.
Figure 3.
NMR spectrum of trans-perfluorodecalin (red color) and cis-perfluorodecalin (blue color). (a) 13C; (b) 19F.
Figure 4.
FTIR spectra. Fingerprint region of (a) trans-perfluorodecalin, (b) cis-perfluorodecalin, (c) spectra comparison (black—cis-PFD; red—trans-PFD).
Figure 4.
FTIR spectra. Fingerprint region of (a) trans-perfluorodecalin, (b) cis-perfluorodecalin, (c) spectra comparison (black—cis-PFD; red—trans-PFD).
Figure 5.
DSC scans. (A) cis-perfluorodecalin; (B) trans-perfluorodecalin.
Figure 5.
DSC scans. (A) cis-perfluorodecalin; (B) trans-perfluorodecalin.
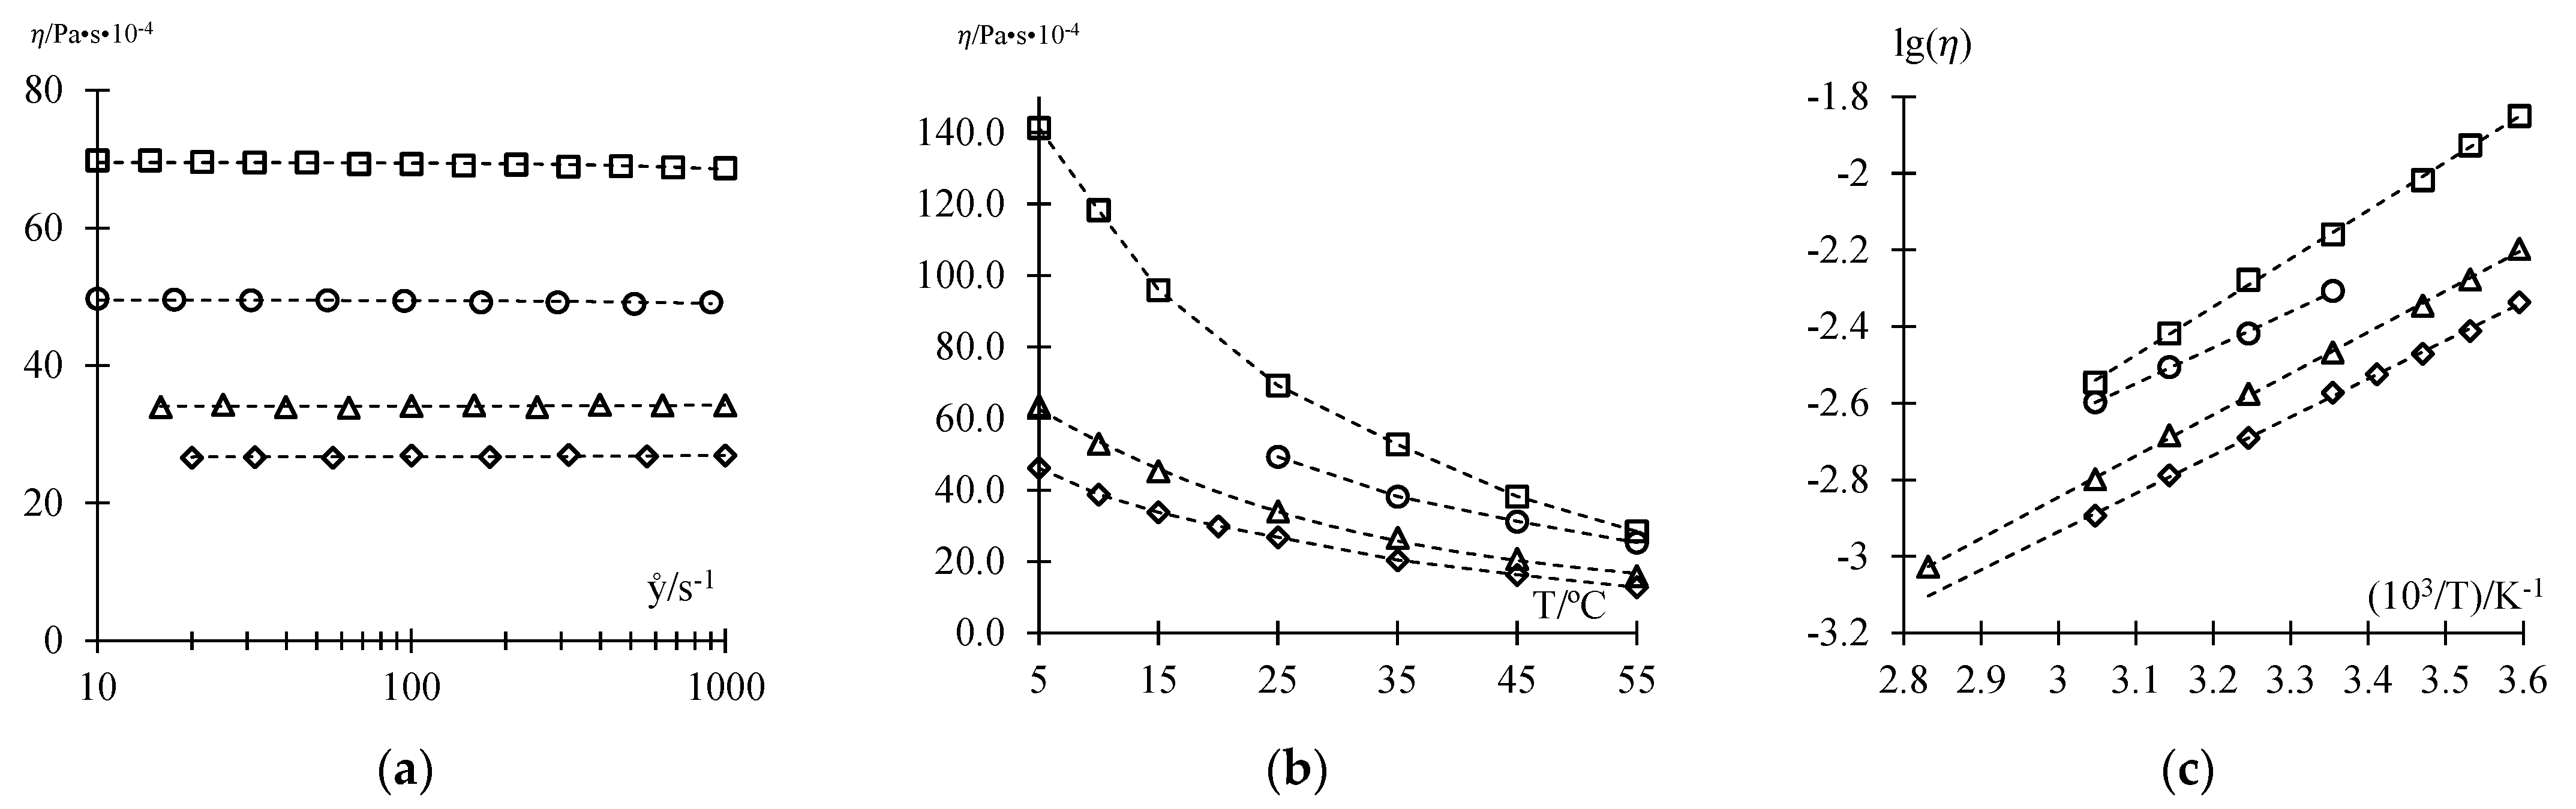
Figure 6.
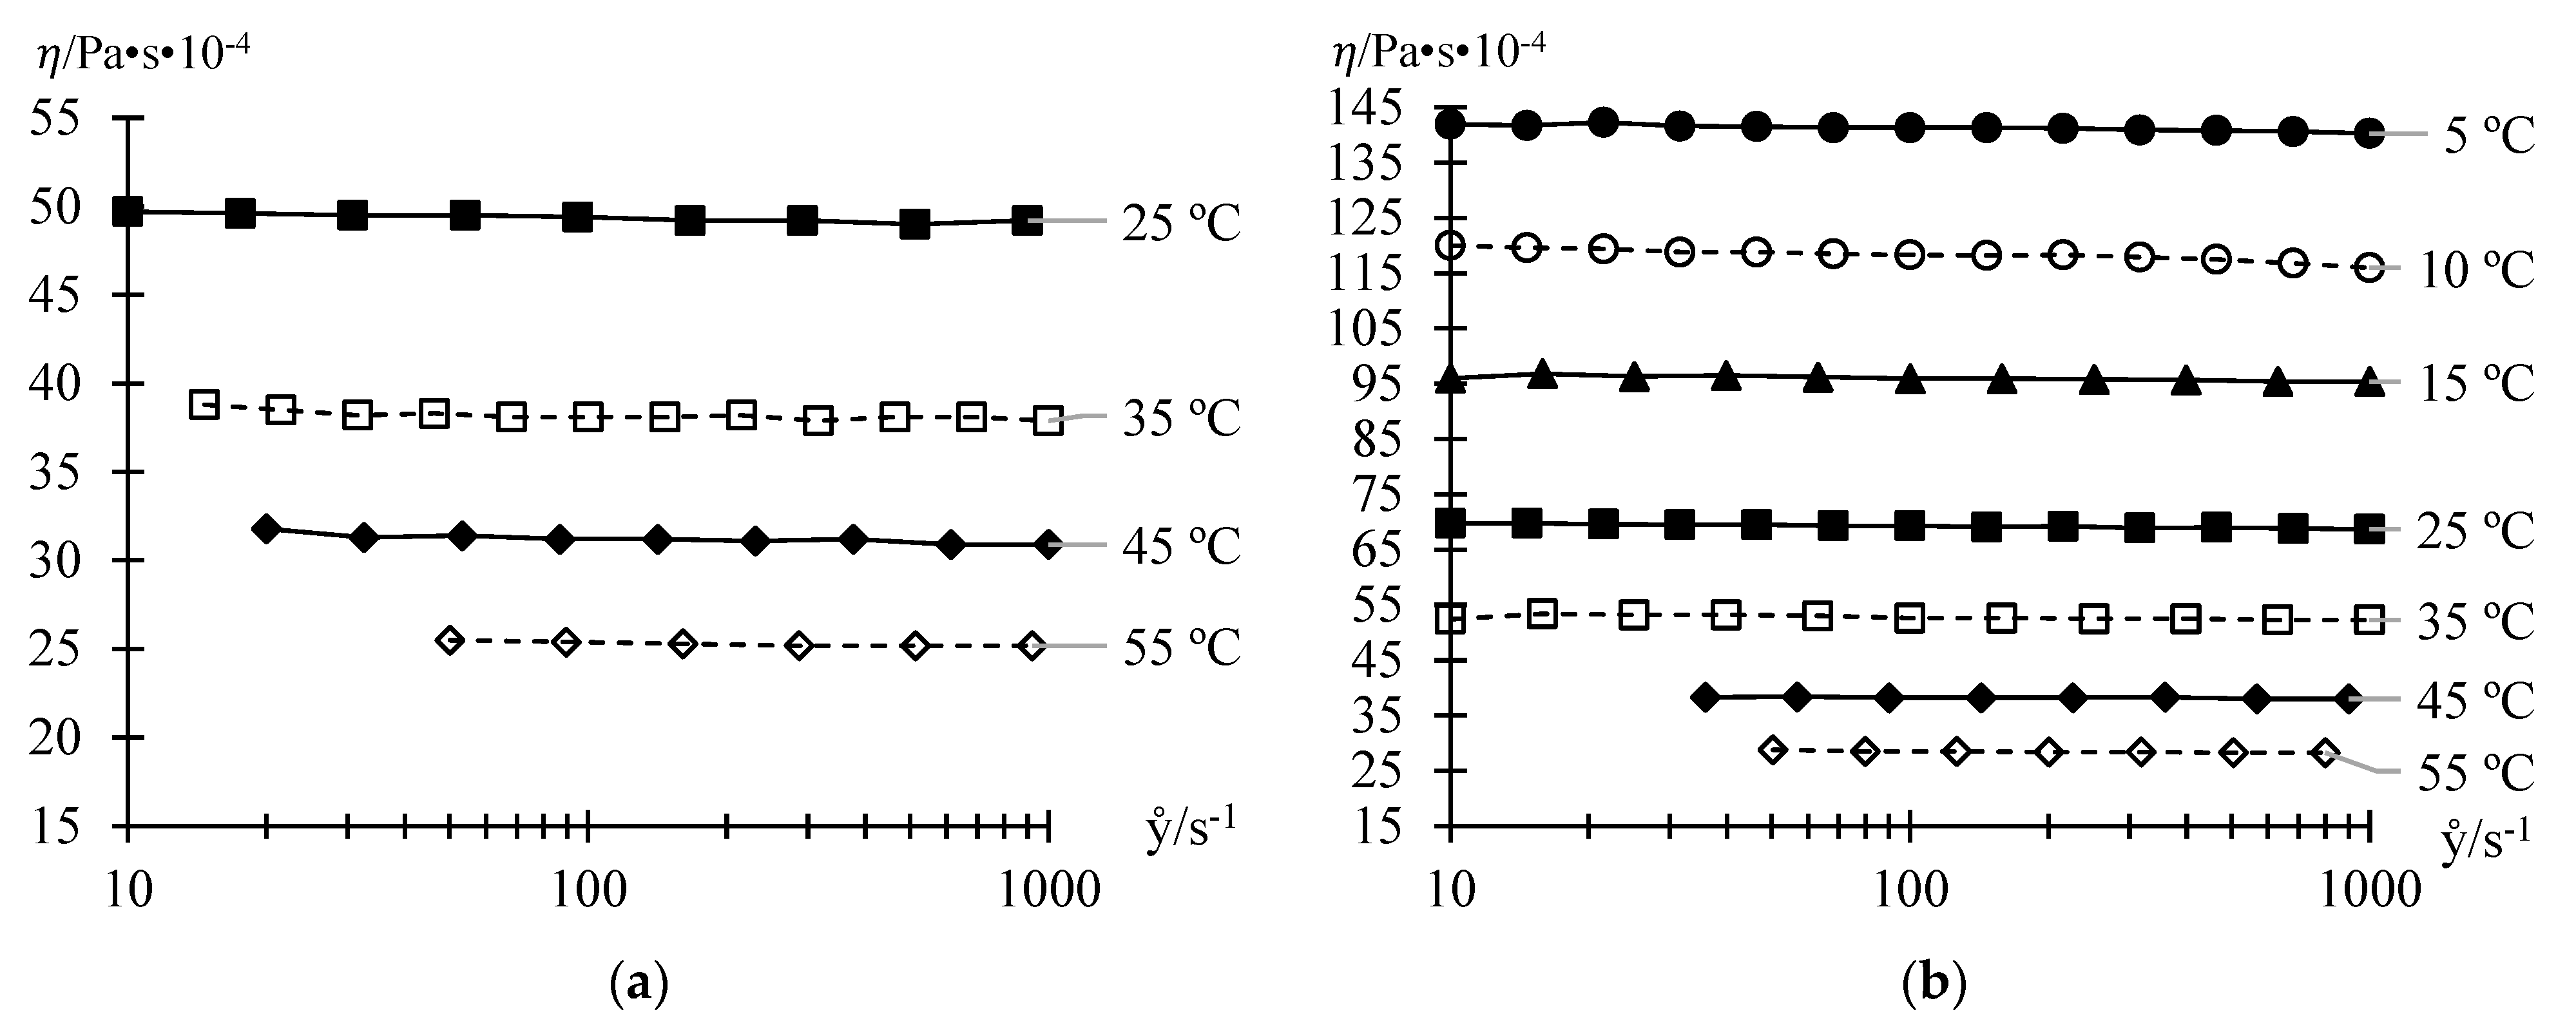
Dependences of shear viscosity η on shear rate ẙ at different temperatures T. (a) Trans-perfluorodecalin; (b) cis-perfluorodecalin. Uncertainties: u(T) = 0.2 °C; ur(η) = 0.02.
Figure 6.
Dependences of shear viscosity η on shear rate ẙ at different temperatures T. (a) Trans-perfluorodecalin; (b) cis-perfluorodecalin. Uncertainties: u(T) = 0.2 °C; ur(η) = 0.02.
Figure 7.
Dependences of «zero» shear viscosity
η on temperature
T according to
Table 3. (
a)
η =
f(
T); (
b) lg(
η) =
f(10
3/
T). Square—cis-perfluorodecalin; circle—trans-perfluorodecalin.
Figure 7.
Dependences of «zero» shear viscosity
η on temperature
T according to
Table 3. (
a)
η =
f(
T); (
b) lg(
η) =
f(10
3/
T). Square—cis-perfluorodecalin; circle—trans-perfluorodecalin.
Figure 8.
The dependence of shear viscosity of trans-PFD on temperature.
Figure 8.
The dependence of shear viscosity of trans-PFD on temperature.
Figure 9.
Viscosity data for constituents of the industrial system of the close-boiling isomeric reaction products for the electrochemical fluorination of decalin or naphthalene. (
a)
η = f(ẙ) at 25 °C; (
b)
η =
f(
T); (
c) lg(
η) =
f(1/
T). Experimental data (
Figure 6 and
Table 3): circle—trans-perfluorodecalin; square—cis-perfluorodecalin. Literature data [
130]: triangular—perfluoro(7-methylbicyclo[4.3.0]nonane); diamond—perfluoro(butylcyclohexane).
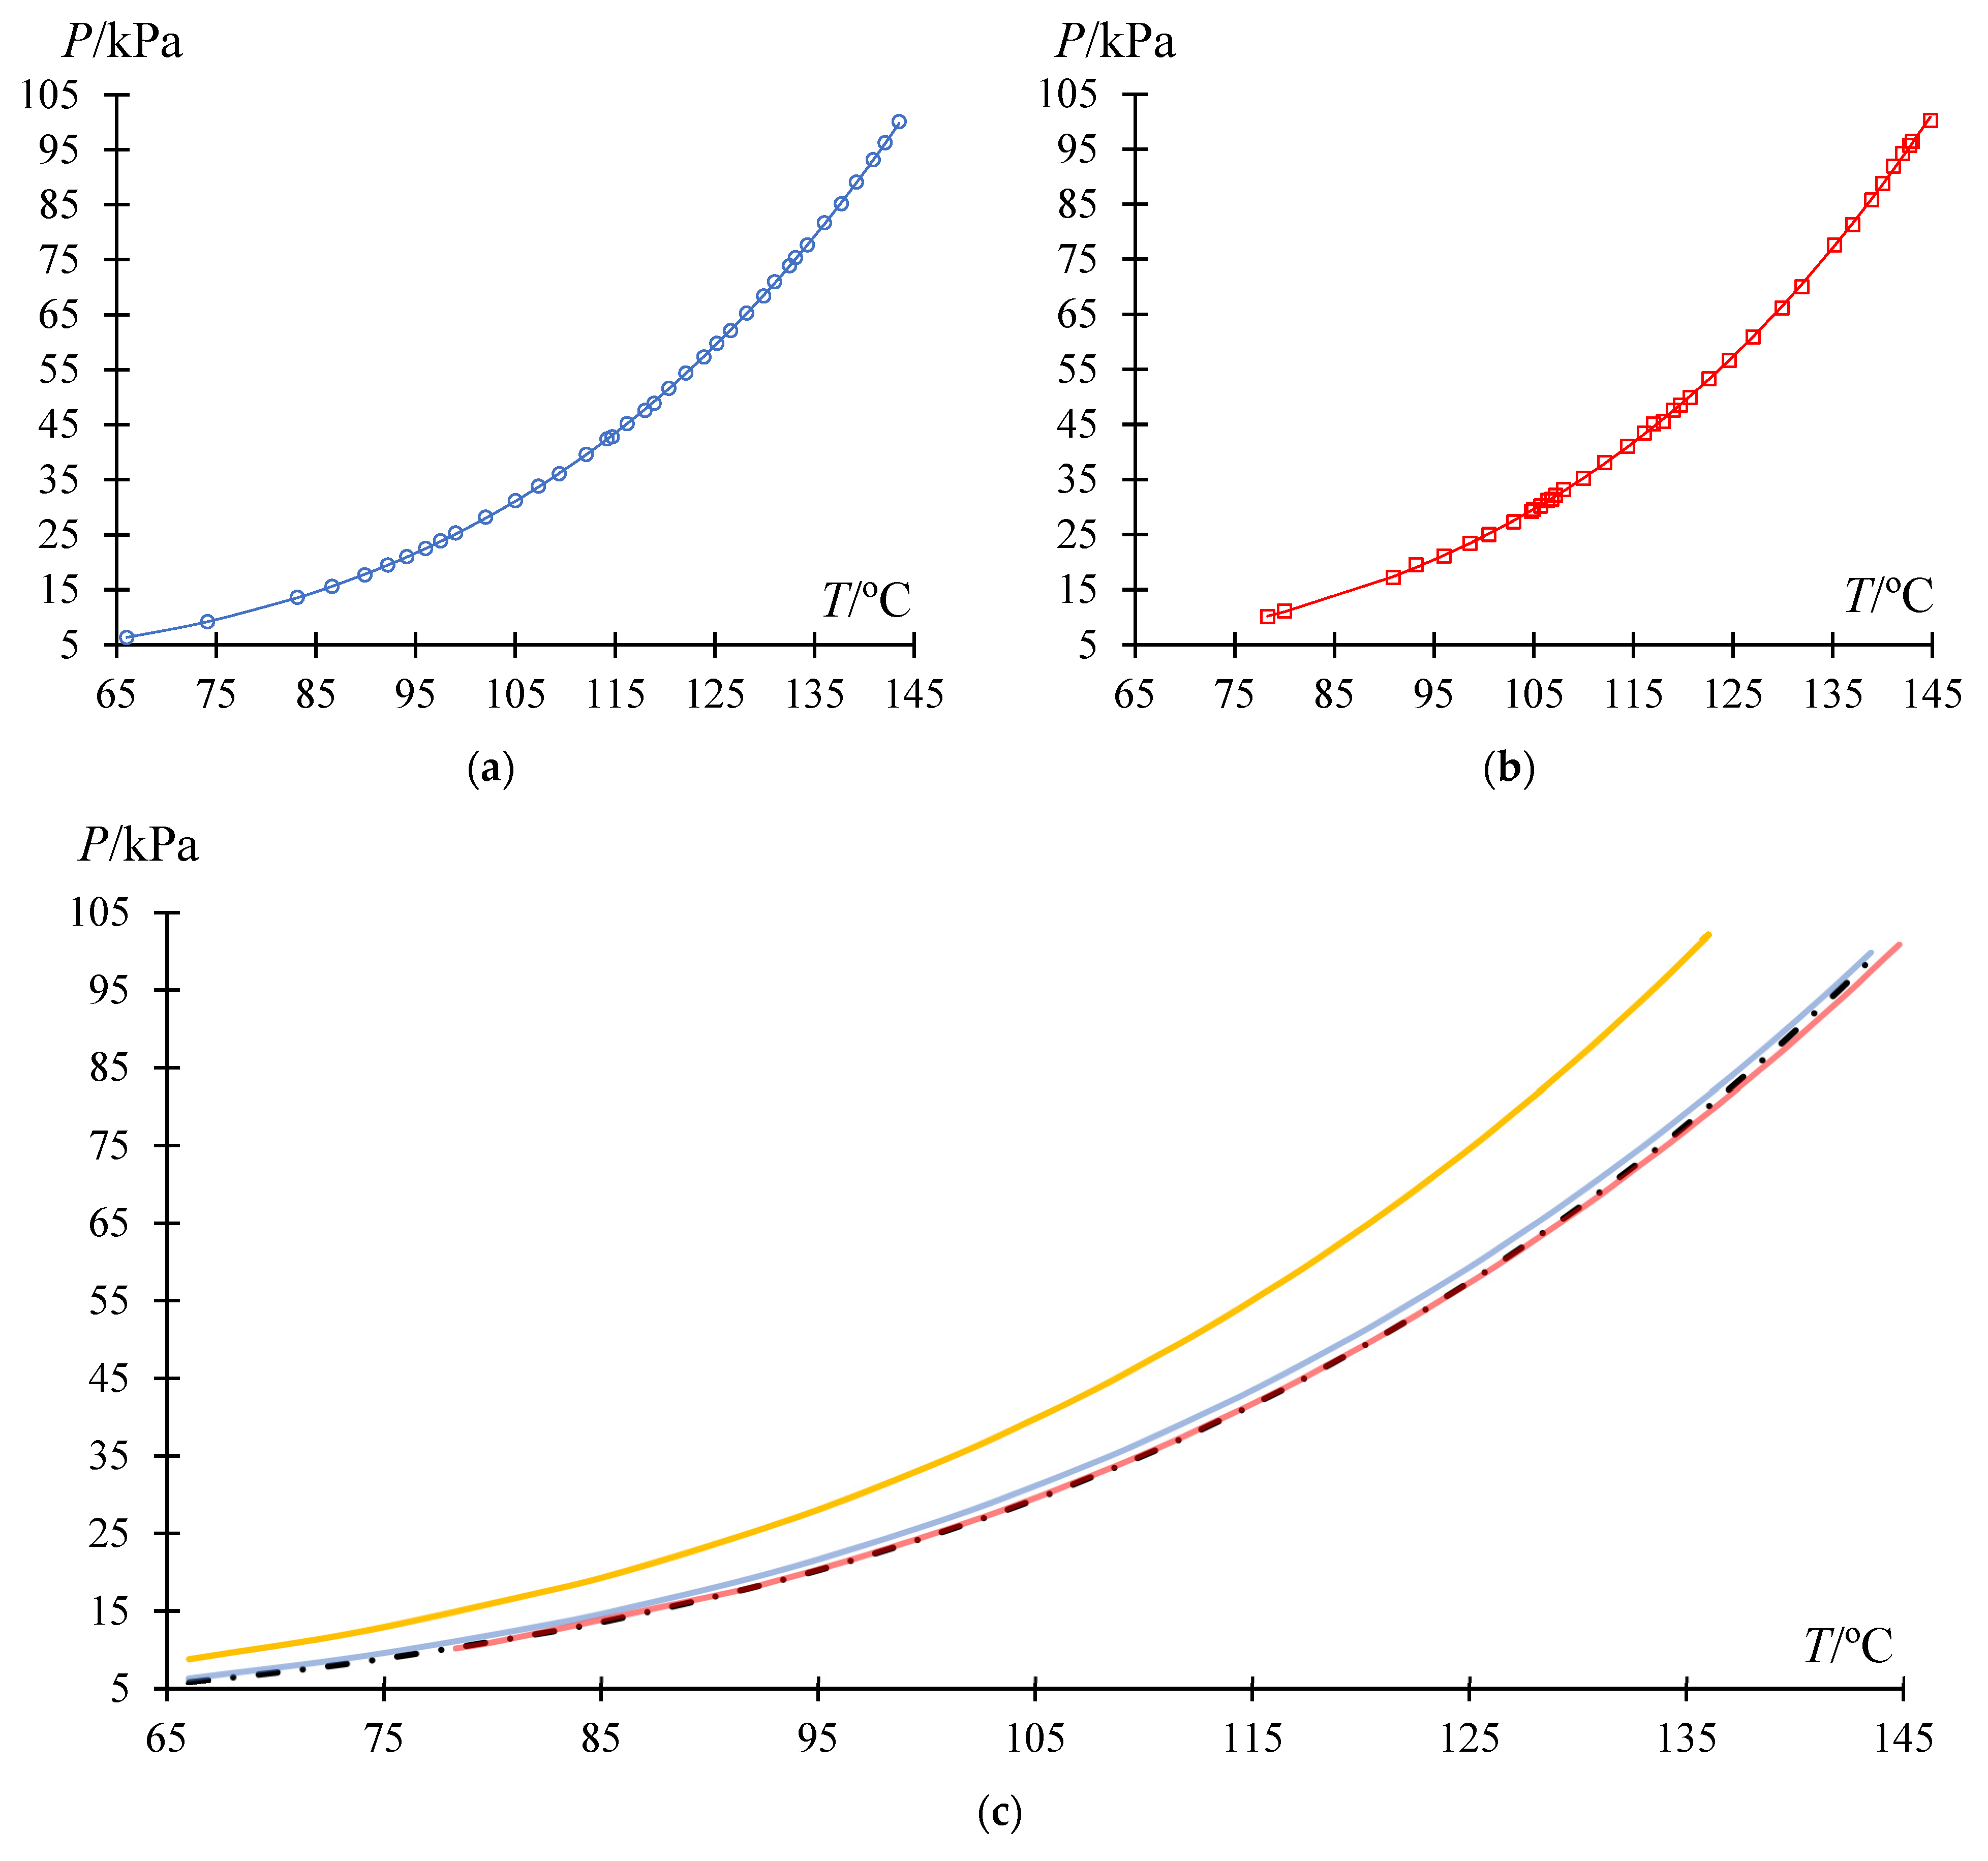
Figure 10.
Dependences of the saturated vapor pressure
P on temperature
T. (
a,
b) Experimental versus calculated data; (
c) isomeric reaction products comparison. Dots represent experimental data (
Table 5 and
Table 6); Lines represent data calculated by the Antoine equation (trans- and cis-PFD:
Table 7 data; BCH and MBCN: literature data [
130]). Blue: trans-PFD; red: cis-PFD; black: BCH; yellow: MBCN.
Figure 11.
Refractive index
versus temperature
T. (
a) trans-perfluorodecalin; (
b) cis-perfluorodecalin. Dots: experimental data (
Table 8 and
Table 9); line: calculated by Equation (3) (
Table 10).
Figure 11.
Refractive index
versus temperature
T. (
a) trans-perfluorodecalin; (
b) cis-perfluorodecalin. Dots: experimental data (
Table 8 and
Table 9); line: calculated by Equation (3) (
Table 10).
Figure 12.
Dependences of the refractive index
on binary system composition
xi according to the
Table 11 data. (
a) 15 °C; (
b) 25 °C. Square trans-PFD (1)–cis-PFD (2); circle BCH (1)–cis-PFD (2); triangular BCH (1)–trans-PFD (2).
Figure 12.
Dependences of the refractive index
on binary system composition
xi according to the
Table 11 data. (
a) 15 °C; (
b) 25 °C. Square trans-PFD (1)–cis-PFD (2); circle BCH (1)–cis-PFD (2); triangular BCH (1)–trans-PFD (2).
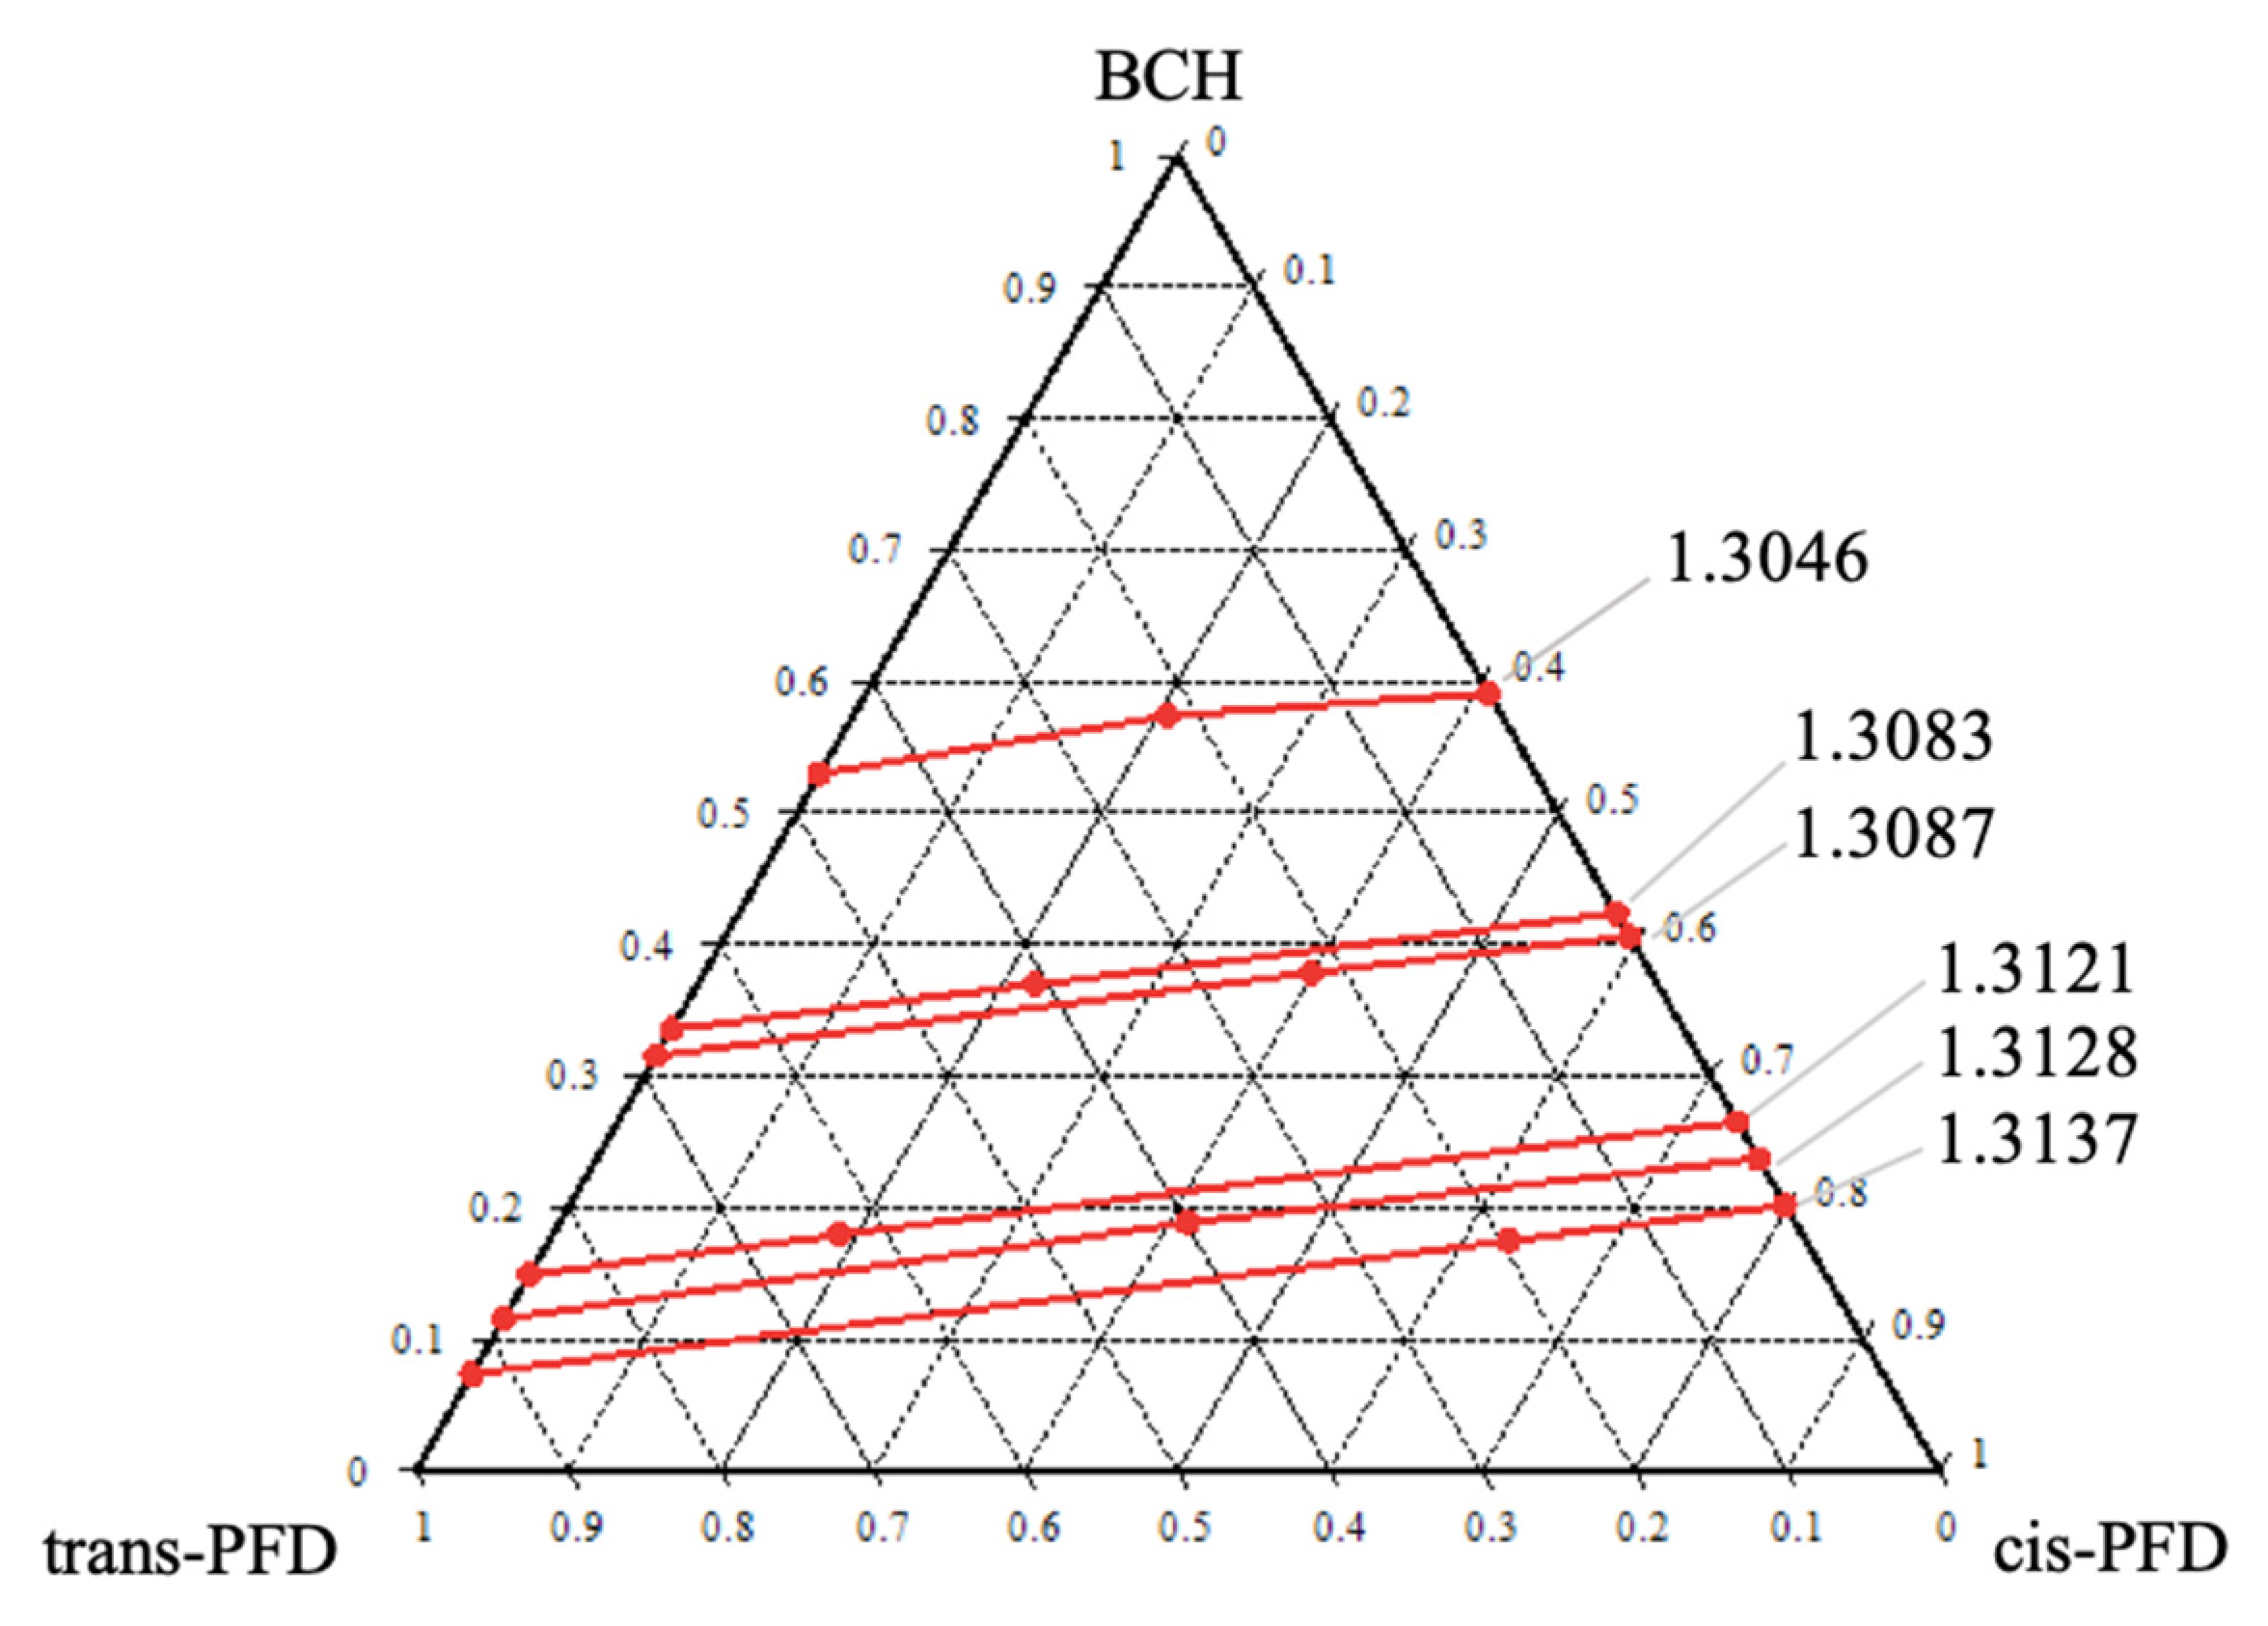
Figure 13.
Dependence of the isoline of refractive index on ternary system composition according to the data from
Table 12 and
Table 13 at 15 °C.
Figure 13.
Dependence of the isoline of refractive index on ternary system composition according to the data from
Table 12 and
Table 13 at 15 °C.
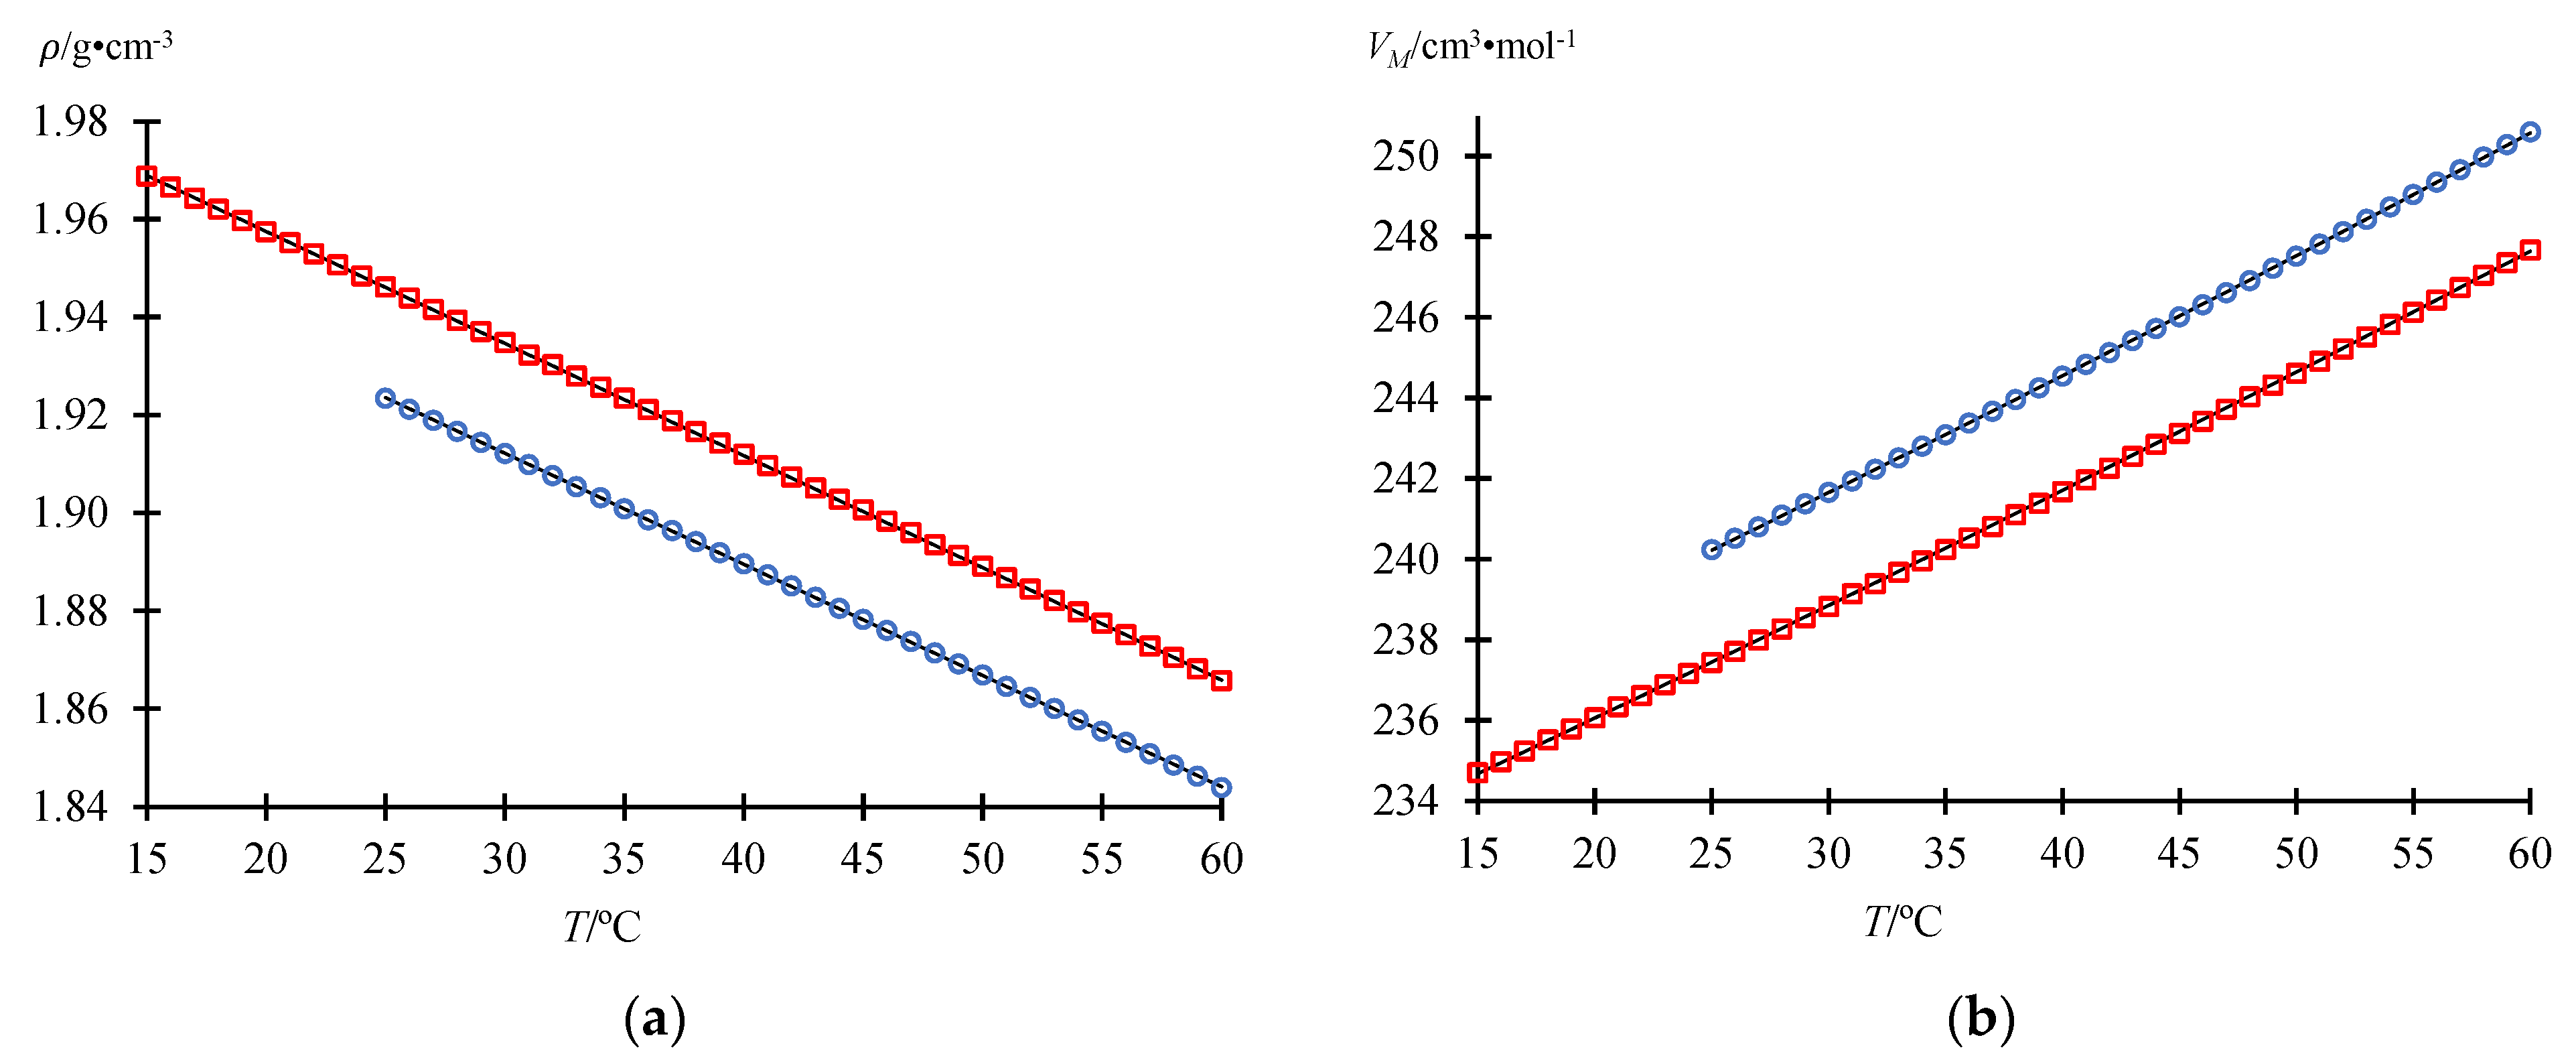
Figure 14.
Experimental values of density
ρ (
a) and liquid molar volume
VM (
b) versus temperature
T. blue dots: trans-perfluorodecalin (
Table 14), red dots: cis-perfluorodecalin (
Table 15), lines: data calculated by Equations (5) and (6) (
Table 16).
Figure 14.
Experimental values of density
ρ (
a) and liquid molar volume
VM (
b) versus temperature
T. blue dots: trans-perfluorodecalin (
Table 14), red dots: cis-perfluorodecalin (
Table 15), lines: data calculated by Equations (5) and (6) (
Table 16).
Figure 15.
Dependences of the excess molar volume
VE versus concentration
xi in the perfluoro(butylcyclohexane) (1)–cis-perfluorodecalin (2) system at temperature
T. Dots: experimental data according to
Table 23; lines: calculated data according to the Redlich-Kister equation; red: Equation (9a)—
Table 26; blue: Equation (10a,b)—
Table 29.
Figure 16.
Dependences of the excess molar volume
VE versus concentration
xi in the perfluoro(butylcyclohexane) (1)–trans-perfluorodecalin (2) system at temperature
T. Dots: experimental data according to
Table 24; lines: calculated data according to the Redlich-Kister equation; red: Equation (9a)—
Table 27; blue: Equation (10a,b)—
Table 30.
Figure 17.
Dependences of the excess molar volume
VE versus concentration
xi in the trans-perfluorodecalin (1)–cis-perfluorodecalin (2) system at temperature
T. Dots: experimental data according to
Table 25; lines: calculated data according to the Redlich-Kister equation; red: Equation (9a)—
Table 28; blue: Equation (10a,b)—
Table 31.
Figure 18.
Dependence of the isoline of excess molar volume
on perfluoro(butylcyclohexane) (BCH)–trans-perfluorodecalin (trans-PFD)–cis-perfluorodecalin (cis-PFD) system composition at 25 °C according to the
Table 26,
Table 27 and
Table 28 and 34 data.
Figure 18.
Dependence of the isoline of excess molar volume
on perfluoro(butylcyclohexane) (BCH)–trans-perfluorodecalin (trans-PFD)–cis-perfluorodecalin (cis-PFD) system composition at 25 °C according to the
Table 26,
Table 27 and
Table 28 and 34 data.
Table 1.
Specifications of the compounds used.
Table 1.
Specifications of the compounds used.
| Chemical Name | CAS-No | Molar Mass M/g·mol−1 | Supplier | Initial Mass Fraction Purity | Purification Method | Mass Fraction after Purification (GC a) |
|---|
| Perfluoro(butylcyclohexane) | 374-60-7 | 500.07 | P&M Invest | 0.80–0.90 | Heteroazeotropic distillation and crystallization | ≥0.997 |
| Trans-perfluorodecalin | 60433-12-7 | 462.08 | P&M Invest | 0.80–0.90 | Heteroazeotropic distillation, crystallization | ≥0.998 |
| Cis-perfluorodecalin | 60433-11-6 | 462.08 | P&M Invest | 0.70–0.80 | Heteroazeotropic distillation, crystallization | ≥0.995 |
Table 2.
Differential scanning calorimetry data for cis-perfluorodecalin (cis-PFD) and trans-perfluorodecalin (trans-PFD) at sample mass
m, temperature
T, enthalpy
H, heat capacity change ∆
Cp, and pressure
P = 98.3 kPa according to
Figure 5 a.
Table 2.
Differential scanning calorimetry data for cis-perfluorodecalin (cis-PFD) and trans-perfluorodecalin (trans-PFD) at sample mass
m, temperature
T, enthalpy
H, heat capacity change ∆
Cp, and pressure
P = 98.3 kPa according to
Figure 5 a.
| Component | Cis-PFD | Trans-PFD |
|---|
| m/g·10−3 | 11.8600 | 6.4600 |
| type | cooling | heating | cooling | heating |
| Integral/mJ | −244.13 | - | 7.08 | 253.24 | −233.17 | 0.65 | - | 248.15 |
| normalized H/J·g−1 | −20.58 | - | 0.60 | 21.35 | −36.09 | 0.10 | - | 38.41 |
| ∆Cp/J·g−1·K−1 | - | 36.930 × 10⁻³ | - | - | - | - | 49.199 × 10⁻³ | - |
| onset T/°C | −17.20 | −95.69 | - | −6.99 | 3.48 | −0.74 | −96.57 | 21.22 |
| peak/average point T/°C | −16.24 | −90.94 | −39.11 | −5.44 | 4.67 | −0.90 | −90.93 | 23.55 |
| endset T/°C | −17.65 | −87.60 | - | −2.88 | 3.13 | −1.26 | −85.87 | 24.95 |
| Effect | crystallization | glass
transition | solid-solid
transition | melting | crystallization | relaxation | glass
transition | melting |
Table 3.
Dependences of «zero» shear viscosity η on temperature T for trans-perfluorodecalin (trans-PFD) and cis-perfluorodecalin (cis-PFD) at pressure P = 99.3 kPa a.
Table 3.
Dependences of «zero» shear viscosity η on temperature T for trans-perfluorodecalin (trans-PFD) and cis-perfluorodecalin (cis-PFD) at pressure P = 99.3 kPa a.
| T/°C | 5.0 | 10.0 | 15.0 | 25.0 | 35.0 | 45.0 | 55.0 |
|---|
| Component | η/Pa·s·10−4 |
|---|
| trans-PFD | - | - | - | 49.4 | 38.2 | 31.2 | 25.3 |
| cis-PFD | 141.3 | 118.3 | 96.0 | 69.3 | 52.7 | 38.2 | 28.5 |
Table 4.
Arrhenius Equation (1) coefficients.
Table 4.
Arrhenius Equation (1) coefficients.
| Component | η0/Pa·s· 10−6 | Ea/J·mol−1 |
|---|
| trans-perfluorodecalin | 3.489 | −17,944.3 |
| cis-perfluorodecalin | 0.426 | −24,036.6 |
Table 5.
Experimental saturated vapor pressure P data for trans-perfluorodecalin at temperature T a.
Table 5.
Experimental saturated vapor pressure P data for trans-perfluorodecalin at temperature T a.
| T/°C | P/kPa | T/°C | P/kPa | T/°C | P/kPa | T/°C | P/kPa |
|---|
| 66.0 | 6.3 | 102.0 | 28.2 | 120.4 | 51.6 | 134.3 | 77.7 |
| 74.1 | 9.2 | 105.0 | 31.2 | 122.1 | 54.4 | 136.0 | 81.7 |
| 83.1 | 13.6 | 107.3 | 33.8 | 123.9 | 57.3 | 137.7 | 85.2 |
| 86.6 | 15.6 | 109.4 | 36.1 | 125.2 | 59.8 | 139.2 | 89.1 |
| 89.9 | 17.7 | 112.1 | 39.6 | 126.6 | 62.1 | 140.9 | 93.2 |
| 92.2 | 19.5 | 114.2 | 42.4 | 128.2 | 65.3 | 142.1 | 96.3 |
| 94.1 | 21.0 | 114.7 | 42.8 | 129.9 | 68.4 | 143.5 | 100.1 |
| 96.0 | 22.5 | 116.2 | 45.2 | 131.0 | 71.0 | - | - |
| 97.5 | 23.9 | 118.0 | 47.6 | 132.5 | 73.9 | - | - |
| 99.0 | 25.3 | 118.9 | 48.9 | 133.1 | 75.4 | - | - |
Table 6.
Experimental saturated vapor pressure P data for cis-perfluorodecalin at temperature T a.
Table 6.
Experimental saturated vapor pressure P data for cis-perfluorodecalin at temperature T a.
| T/°C | P/kPa | T/°C | P/kPa | T/°C | P/kPa | T/°C | P/kPa |
|---|
| 78.3 | 10.1 | 105.7 | 30.2 | 118.0 | 45.5 | 137.0 | 81.3 |
| 80.0 | 11.1 | 106.4 | 31.2 | 119.0 | 47.6 | 138.9 | 85.8 |
| 90.9 | 17.2 | 106.8 | 31.4 | 119.7 | 48.5 | 140.0 | 88.8 |
| 93.2 | 19.5 | 107.2 | 32.1 | 120.7 | 49.9 | 141.1 | 91.9 |
| 96.0 | 21.1 | 108.0 | 33.2 | 122.6 | 53.3 | 142.0 | 94.2 |
| 98.6 | 23.4 | 110.0 | 35.2 | 124.6 | 56.6 | 142.7 | 95.7 |
| 100.5 | 25.0 | 112.1 | 38.1 | 127.0 | 60.9 | 143.0 | 96.4 |
| 103.0 | 27.3 | 114.4 | 41.0 | 129.9 | 66.1 | 144.8 | 100.2 |
| 104.8 | 29.2 | 116.1 | 43.4 | 131.9 | 70.0 | - | - |
| 105.0 | 29.6 | 117.0 | 45.1 | 135.2 | 77.6 | - | - |
Table 7.
Antoine Equation (2) coefficients for the temperature range [Tmin, Tmax].
Table 7.
Antoine Equation (2) coefficients for the temperature range [Tmin, Tmax].
| Component | | | | [Tmin, Tmax]/°C |
|---|
| trans-PFD | 12.4765 | −2350.0059 | 155 | [66, 145] |
| cis-PFD | 12.3477 | −2248.9361 | 146 | [78, 144] |
| BCH [130] | 13.5630 | −2900.7119 | 180 | [80, 145] |
| MBCN [130] | 13.5734 | −2916.7343 | 190 | [75, 145] |
Table 8.
Refractive index versus temperature T for trans-perfluorodecalin at pressure P = 99.0 kPa a.
Table 8.
Refractive index versus temperature T for trans-perfluorodecalin at pressure P = 99.0 kPa a.
| T/°C | nD | T/°C | nD | T/°C | nD |
|---|
| 25.00 | 1.3117 | 37.00 | 1.3073 | 49.00 | 1.3027 |
| 26.00 | 1.3114 | 38.00 | 1.3068 | 50.00 | 1.3023 |
| 27.00 | 1.3110 | 39.00 | 1.3065 | 51.00 | 1.3019 |
| 28.00 | 1.3106 | 40.00 | 1.3061 | 52.00 | 1.3015 |
| 29.00 | 1.3102 | 41.00 | 1.3057 | 53.00 | 1.3011 |
| 30.00 | 1.3099 | 42.00 | 1.3053 | 54.00 | 1.3008 |
| 31.00 | 1.3095 | 43.00 | 1.3050 | 55.00 | 1.3004 |
| 32.00 | 1.3091 | 44.00 | 1.3046 | 56.00 | 1.3000 |
| 33.00 | 1.3088 | 45.00 | 1.3042 | 57.00 | 1.2996 |
| 34.00 | 1.3084 | 46.00 | 1.3038 | 58.00 | 1.2992 |
| 35.00 | 1.3080 | 47.00 | 1.3034 | 59.00 | 1.2988 |
| 36.00 | 1.3076 | 48.00 | 1.3031 | 60.00 | 1.2984 |
Table 9.
Refractive index versus temperature T for cis-perfluorodecalin at pressure P = 99.2 kPa a.
Table 9.
Refractive index versus temperature T for cis-perfluorodecalin at pressure P = 99.2 kPa a.
| T/°C | nD | T/°C | nD | T/°C | nD |
|---|
| 15.00 | 1.3191 | 31.00 | 1.3131 | 47.00 | 1.3069 |
| 16.00 | 1.3188 | 32.00 | 1.3127 | 48.00 | 1.3065 |
| 17.00 | 1.3184 | 33.00 | 1.3123 | 49.00 | 1.3061 |
| 18.00 | 1.3180 | 34.00 | 1.3119 | 50.00 | 1.3057 |
| 19.00 | 1.3176 | 35.00 | 1.3115 | 51.00 | 1.3053 |
| 20.00 | 1.3173 | 36.00 | 1.3111 | 52.00 | 1.3050 |
| 21.00 | 1.3169 | 37.00 | 1.3108 | 53.00 | 1.3046 |
| 22.00 | 1.3165 | 38.00 | 1.3104 | 54.00 | 1.3042 |
| 23.00 | 1.3161 | 39.00 | 1.3100 | 55.00 | 1.3038 |
| 24.00 | 1.3157 | 40.00 | 1.3096 | 56.00 | 1.3034 |
| 25.00 | 1.3154 | 41.00 | 1.3092 | 57.00 | 1.3030 |
| 26.00 | 1.3150 | 42.00 | 1.3088 | 58.00 | 1.3026 |
| 27.00 | 1.3146 | 43.00 | 1.3085 | 59.00 | 1.3022 |
| 28.00 | 1.3142 | 44.00 | 1.3081 | 60.00 | 1.3018 |
| 29.00 | 1.3138 | 45.00 | 1.3077 | - | - |
| 30.00 | 1.3134 | 46.00 | 1.3073 | - | - |
Table 10.
Dimensionless coefficients of Equation (3)—the refractive index dependence on temperature T for trans-perfluorodecalin and cis-perfluorodecalin for the temperature range [Tmin, Tmax].
Table 10.
Dimensionless coefficients of Equation (3)—the refractive index dependence on temperature T for trans-perfluorodecalin and cis-perfluorodecalin for the temperature range [Tmin, Tmax].
| Component | | | [Tmin, Tmax]/°C |
|---|
| trans-perfluorodecalin | 1.3213 | −3.80 × 10⁻⁴ | [25, 60] |
| cis-perfluorodecalin | 1.3250 | −3.85 × 10⁻⁴ | [15, 60] |
Table 11.
Dependences of the refractive index at temperature T on binary system composition xi at atmospheric pressure P a.
Table 11.
Dependences of the refractive index at temperature T on binary system composition xi at atmospheric pressure P a.
| trans-PFD–cis-PFD at P = 98.2 kPa | BCH–trans-PFD at P = 100.3 kPa | BCH–cis-PFD at P = 99.4 kPa |
|---|
| xtrans-PFD | | | xBCH | | xBCH | | |
|---|
| 0 | 1.3191 | 1.3154 | 0 | - | 0 | 1.3191 | 1.3154 |
| 0.10198 | 1.3187 | 1.3150 | 0.10688 | 1.3130 | 0.10343 | 1.3163 | 1.3125 |
| 0.19411 | 1.3184 | 1.3146 | 0.19419 | 1.3112 | 0.17164 | 1.3144 | 1.3107 |
| 0.30439 | 1.3180 | 1.3142 | 0.29614 | 1.3091 | 0.28538 | 1.3116 | 1.3079 |
| 0.37857 | 1.3178 | 1.3139 | 0.40515 | 1.3070 | 0.40622 | 1.3089 | 1.3052 |
| 0.49848 | 1.3173 | 1.3135 | 0.49698 | 1.3053 | 0.50224 | 1.3066 | 1.3029 |
| 0.60085 | 1.3169 | 1.3131 | 0.59993 | 1.3034 | 0.60547 | 1.3044 | 1.3007 |
| 0.70172 | 1.3167 | 1.3129 | 0.69763 | 1.3017 | 0.66844 | 1.3027 | 1.2996 |
| 0.80201 | 1.3162 | 1.3125 | 0.80471 | 1.2999 | 0.80202 | 1.3005 | 1.2968 |
| 0.90273 | 1.3159 | 1.3121 | 0.89712 | 1.2979 | 0.88860 | 1.2988 | 1.2952 |
| 1 | - | 1.3117 | 1 | 1.297 | 1 | 1.2970 | - |
Table 12.
Dimensionless coefficients of Equation (4)—the refractive index dependence on binary systems composition xi at temperature T.
Table 12.
Dimensionless coefficients of Equation (4)—the refractive index dependence on binary systems composition xi at temperature T.
| System | trans-PFD (1)–cis-PFD (2) | BCH (1)–trans-PFD (2) | BCH (1)–cis-PFD (2) |
|---|
| T/°C | 15 | 25 | 15 | 15 | 25 |
| 1.3191 | 1.3153 | 1.3153 | 1.3191 | 1.3153 |
| −0.0035 | −0.0036 | −0.0220 | −0.0279 | −0.0272 |
| 0 | 0 | 0.0034 | 0.0057 | 0.0052 |
Table 13.
Dependences of the refractive index at temperature T on BCH (1)–trans-PFD (2)–cis-PFD (3) ternary system composition xi at pressure P = 99.1 kPa a.
Table 13.
Dependences of the refractive index at temperature T on BCH (1)–trans-PFD (2)–cis-PFD (3) ternary system composition xi at pressure P = 99.1 kPa a.
| x1 | x2 | x3 | | |
|---|
| 0.57402 | 0.21988 | 0.20610 | 1.3046 | 1.3003 |
| 0.17937 | 0.63244 | 0.18819 | 1.3121 | 1.3085 |
| 0.17479 | 0.19519 | 0.63002 | 1.3137 | 1.3099 |
| 0.18870 | 0.39863 | 0.41267 | 1.3128 | 1.3091 |
| 0.37885 | 0.22255 | 0.39860 | 1.3087 | 1.3050 |
| 0.36974 | 0.40875 | 0.22151 | 1.3083 | 1.3046 |
Table 14.
Density ρ and liquid molar volume VM versus temperature T for trans-perfluorodecalin at pressure P = 99.0 kPa a.
Table 14.
Density ρ and liquid molar volume VM versus temperature T for trans-perfluorodecalin at pressure P = 99.0 kPa a.
| T/°C | ρ/g·cm−3 | VM/cm3·mol−1 | T/°C | ρ/g·cm−3 | VM/cm3·mol−1 | T/°C | ρ/g·cm−3 | VM/cm3·mol−1 |
|---|
| 25.00 | 1.92344 | 240.236 | 37.00 | 1.89637 | 243.666 | 49.00 | 1.86915 | 247.214 |
| 26.00 | 1.92116 | 240.521 | 38.00 | 1.89411 | 243.956 | 50.00 | 1.86687 | 247.516 |
| 27.00 | 1.91890 | 240.805 | 39.00 | 1.89186 | 244.246 | 51.00 | 1.86458 | 247.820 |
| 28.00 | 1.91663 | 241.090 | 40.00 | 1.88960 | 244.539 | 52.00 | 1.86230 | 248.123 |
| 29.00 | 1.91438 | 241.373 | 41.00 | 1.88734 | 244.831 | 53.00 | 1.86002 | 248.427 |
| 30.00 | 1.91213 | 241.657 | 42.00 | 1.88507 | 245.126 | 54.00 | 1.85771 | 248.736 |
| 31.00 | 1.90987 | 241.943 | 43.00 | 1.88280 | 245.422 | 55.00 | 1.85542 | 249.043 |
| 32.00 | 1.90763 | 242.227 | 44.00 | 1.88053 | 245.718 | 56.00 | 1.85312 | 249.352 |
| 33.00 | 1.90537 | 242.515 | 45.00 | 1.87826 | 246.015 | 57.00 | 1.85083 | 249.661 |
| 34.00 | 1.90312 | 242.801 | 46.00 | 1.87599 | 246.313 | 58.00 | 1.84850 | 249.976 |
| 35.00 | 1.90087 | 243.089 | 47.00 | 1.87371 | 246.612 | 59.00 | 1.84620 | 250.287 |
| 36.00 | 1.89862 | 243.377 | 48.00 | 1.87143 | 246.913 | 60.00 | 1.84389 | 250.601 |
Table 15.
Density ρ and liquid molar volume VM versus temperature T for cis-perfluorodecalin at pressure P = 99.2 kPa a.
Table 15.
Density ρ and liquid molar volume VM versus temperature T for cis-perfluorodecalin at pressure P = 99.2 kPa a.
| T/°C | ρ/g·cm−3 | VM/cm3·mol−1 | T/°C | ρ/g·cm−3 | VM/cm3·mol−1 | T/°C | ρ/g·cm−3 | VM/cm3·mol−1 |
|---|
| 15.00 | 1.96878 | 234.704 | 31.00 | 1.93225 | 239.141 | 47.00 | 1.89598 | 243.716 |
| 16.00 | 1.96653 | 234.972 | 32.00 | 1.93025 | 239.389 | 48.00 | 1.89354 | 244.030 |
| 17.00 | 1.96427 | 235.243 | 33.00 | 1.92797 | 239.672 | 49.00 | 1.89133 | 244.315 |
| 18.00 | 1.96201 | 235.514 | 34.00 | 1.92569 | 239.956 | 50.00 | 1.88908 | 244.606 |
| 19.00 | 1.95973 | 235.788 | 35.00 | 1.92341 | 240.240 | 51.00 | 1.88674 | 244.909 |
| 20.00 | 1.95746 | 236.061 | 36.00 | 1.92113 | 240.525 | 52.00 | 1.88442 | 245.211 |
| 21.00 | 1.95520 | 236.334 | 37.00 | 1.91885 | 240.811 | 53.00 | 1.88209 | 245.514 |
| 22.00 | 1.95293 | 236.609 | 38.00 | 1.91656 | 241.099 | 54.00 | 1.87975 | 245.820 |
| 23.00 | 1.95066 | 236.884 | 39.00 | 1.91427 | 241.387 | 55.00 | 1.87743 | 246.124 |
| 24.00 | 1.94840 | 237.159 | 40.00 | 1.91198 | 241.676 | 56.00 | 1.87510 | 246.430 |
| 25.00 | 1.94613 | 237.435 | 41.00 | 1.90968 | 241.967 | 57.00 | 1.87276 | 246.737 |
| 26.00 | 1.94387 | 237.711 | 42.00 | 1.90738 | 242.259 | 58.00 | 1.87043 | 247.045 |
| 27.00 | 1.94160 | 237.989 | 43.00 | 1.90509 | 242.550 | 59.00 | 1.86810 | 247.353 |
| 28.00 | 1.93933 | 238.268 | 44.00 | 1.90278 | 242.845 | 60.00 | 1.86576 | 247.663 |
| 29.00 | 1.93707 | 238.546 | 45.00 | 1.90064 | 243.118 | - | - | - |
| 30.00 | 1.93480 | 238.826 | 46.00 | 1.89829 | 243.419 | - | - | - |
Table 16.
Coefficients of Equation (6)—the density (ρ) dependence on temperature (T) for trans-perfluorodecalin and cis-perfluorodecalin.
Table 16.
Coefficients of Equation (6)—the density (ρ) dependence on temperature (T) for trans-perfluorodecalin and cis-perfluorodecalin.
| Component | | | [Tmin, Tmax]/°C |
|---|
| Trans-perfluorodecalin | 1.98029 | −0.00227 | [25, 60] |
| Cis-perfluorodecalin | 2.00330 | −0.00229 | [15, 60] |
Table 17.
Dependences of density ρ on perfluoro(butylcyclohexane) (1)–cis-perfluorodecalin (2) system composition xi at temperature T and pressure P a.
Table 17.
Dependences of density ρ on perfluoro(butylcyclohexane) (1)–cis-perfluorodecalin (2) system composition xi at temperature T and pressure P a.
| x1 | P/kPa | T/°C |
|---|
| 15 | 20 | 25 | 30 | 35 | 40 | 45 | 50 | 55 | 60 |
|---|
| ρ/g·cm−3 |
|---|
| 0 | 99.2 | 1.96878 | 1.95746 | 1.94613 | 1.93480 | 1.92341 | 1.91198 | 1.90048 | 1.88908 | 1.87743 | 1.86576 |
| 0.10343 | 98.8 | 1.95773 | 1.94661 | 1.93538 | 1.92409 | 1.91274 | 1.90134 | 1.88990 | 1.87837 | 1.86681 | 1.85514 |
| 0.17164 | 1.95040 | 1.93938 | 1.92823 | 1.91699 | 1.90568 | 1.89431 | 1.88287 | 1.87133 | 1.85977 | 1.84813 |
| 0.28538 | 1.93986 | 1.92883 | 1.91769 | 1.90648 | 1.89518 | 1.88382 | 1.87239 | 1.86088 | 1.84931 | 1.83769 |
| 0.31744 | 100.5 | 1.93729 | 1.92620 | 1.91502 | 1.90376 | 1.89245 | 1.88103 | 1.86963 | 1.85817 | 1.84662 | 1.83500 |
| 0.35826 | 1.93361 | 1.92262 | 1.91148 | 1.90026 | 1.88896 | 1.87761 | 1.86616 | 1.85466 | 1.84311 | 1.83149 |
| 0.37933 | 98.8 | 1.93190 | 1.92084 | 1.90966 | 1.89842 | 1.88711 | 1.87577 | 1.86434 | 1.85285 | 1.84132 | 1.82971 |
| 0.39919 | 1.92998 | 1.91897 | 1.90783 | 1.89661 | 1.88532 | 1.87394 | 1.86252 | 1.85100 | 1.83945 | 1.82783 |
| 0.44022 | 100.5 | 1.92669 | 1.91568 | 1.90455 | 1.89334 | 1.88204 | 1.87067 | 1.85925 | 1.84772 | 1.83616 | 1.82452 |
| 0.50224 | 98.9 | 1.92200 | 1.91097 | 1.89981 | 1.88859 | 1.87728 | 1.86590 | 1.85445 | 1.84290 | 1.83134 | 1.81967 |
| 0.60547 | 1.91379 | 1.90281 | 1.89167 | 1.88044 | 1.86912 | 1.85772 | 1.84626 | 1.83471 | 1.82309 | 1.81141 |
| 0.69350 | 100.3 | 1.90737 | 1.89625 | 1.88502 | 1.87373 | 1.86236 | 1.85095 | 1.83944 | 1.82786 | 1.81625 | 1.80453 |
| 0.80202 | 1.89986 | 1.88879 | 1.87760 | 1.86631 | 1.85493 | 1.84345 | 1.83192 | 1.82027 | 1.80859 | 1.79682 |
| 0.88860 | 1.89420 | 1.88309 | 1.87186 | 1.86052 | 1.84911 | 1.83760 | 1.82603 | 1.81436 | 1.80264 | 1.79081 |
| 1 | 99.3 | 1.88829 | 1.87697 | 1.86563 | 1.85429 | 1.84283 | 1.83130 | 1.81969 | 1.80795 | 1.79625 | 1.78436 |
Table 18.
Dependences of the density ρ on perfluoro(butylcyclohexane) (1)–trans-perfluorodecalin (2) system composition xi at temperature T and pressure P a.
Table 18.
Dependences of the density ρ on perfluoro(butylcyclohexane) (1)–trans-perfluorodecalin (2) system composition xi at temperature T and pressure P a.
| x1 | P/kPa | T/°C |
|---|
| 25 | 30 | 35 | 40 | 45 | 50 | 55 | 60 |
|---|
| ρ/g·cm−3 |
|---|
| 0 | 98.1 | 1.92344 | 1.91213 | 1.90087 | 1.88960 | 1.87826 | 1.86687 | 1.85542 | 1.84389 |
| 0.10688 | 100.7 | 1.91545 | 1.90436 | 1.89319 | 1.88195 | 1.87063 | 1.85923 | 1.84778 | 1.83623 |
| 0.19419 | 1.90908 | 1.89804 | 1.88689 | 1.87565 | 1.86434 | 1.85294 | 1.84149 | 1.82996 |
| 0.29614 | 1.90250 | 1.89142 | 1.88025 | 1.86900 | 1.85767 | 1.84624 | 1.83478 | 1.82322 |
| 0.40516 | 99.3 | 1.89601 | 1.88487 | 1.87363 | 1.86233 | 1.85096 | 1.83953 | 1.82801 | 1.81643 |
| 0.49698 | 1.89052 | 1.87939 | 1.86815 | 1.85684 | 1.84545 | 1.83396 | 1.82240 | 1.81078 |
| 0.59993 | 1.88470 | 1.87354 | 1.86227 | 1.85091 | 1.83947 | 1.82794 | 1.81635 | 1.80468 |
| 0.69763 | 99.7 | 1.87961 | 1.86836 | 1.85703 | 1.84562 | 1.83415 | 1.82258 | 1.81093 | 1.79920 |
| 0.80471 | 1.87398 | 1.86272 | 1.85135 | 1.83990 | 1.82837 | 1.81675 | 1.80507 | 1.79330 |
| 0.89712 | 1.86994 | 1.85859 | 1.84715 | 1.83560 | 1.82404 | 1.81237 | 1.80064 | 1.78882 |
| 1 | 99.3 | 1.86563 | 1.85429 | 1.84283 | 1.83130 | 1.81969 | 1.80795 | 1.79625 | 1.78436 |
Table 19.
Dependences of the density ρ on trans-perfluorodecalin (1)–cis-perfluorodecalin (2) system composition xi at temperature T and pressure P a.
Table 19.
Dependences of the density ρ on trans-perfluorodecalin (1)–cis-perfluorodecalin (2) system composition xi at temperature T and pressure P a.
| x1 | P/kPa | T/°C |
|---|
| 25 | 30 | 35 | 40 | 45 | 50 | 55 | 60 |
|---|
| ρ/g·cm−3 |
|---|
| 0 | 99.2 | 1.94613 | 1.93480 | 1.92341 | 1.91198 | 1.90079 | 1.88908 | 1.87743 | 1.86576 |
| 0.10198 | 100.9 | 1.94389 | 1.93263 | 1.92128 | 1.90985 | 1.89839 | 1.88684 | 1.87527 | 1.86360 |
| 0.19411 | 1.94178 | 1.93058 | 1.91926 | 1.90787 | 1.89640 | 1.88487 | 1.87330 | 1.86165 |
| 0.30439 | 1.93933 | 1.92811 | 1.91681 | 1.90544 | 1.89397 | 1.88244 | 1.87085 | 1.85919 |
| 0.41417 | 100.0 | 1.93671 | 1.92547 | 1.91416 | 1.90279 | 1.89136 | 1.87988 | 1.86832 | 1.85670 |
| 0.49848 | 100.8 | 1.93455 | 1.92338 | 1.91210 | 1.90076 | 1.88933 | 1.87785 | 1.86631 | 1.85470 |
| 0.60085 | 1.93220 | 1.92104 | 1.90978 | 1.89845 | 1.88704 | 1.87557 | 1.86404 | 1.85246 |
| 0.70172 | 99.7 | 1.92985 | 1.91870 | 1.90745 | 1.89617 | 1.88479 | 1.87335 | 1.86184 | 1.85029 |
| 0.80539 | 100.1 | 1.92740 | 1.91631 | 1.90510 | 1.89382 | 1.88247 | 1.87106 | 1.85956 | 1.84799 |
| 0.90273 | 99.7 | 1.92528 | 1.91420 | 1.90300 | 1.89173 | 1.88039 | 1.86895 | 1.85746 | 1.84592 |
| 1 | 98.1 | 1.92344 | 1.91213 | 1.90087 | 1.88960 | 1.87826 | 1.86687 | 1.85542 | 1.84389 |
Table 20.
Dependences of the liquid molar volume on perfluoro(butylcyclohexane) (1)–cis-perfluorodecalin (2) system composition xi at temperature T a.
Table 20.
Dependences of the liquid molar volume on perfluoro(butylcyclohexane) (1)–cis-perfluorodecalin (2) system composition xi at temperature T a.
| x1 | T/°C |
|---|
| 15 | 20 | 25 | 30 | 35 | 40 | 45 | 50 | 55 | 60 |
|---|
| /cm−3·mol−1 |
|---|
| 0 | 234.704 | 236.061 | 237.435 | 238.826 | 240.240 | 241.676 | 243.139 | 244.606 | 246.124 | 247.663 |
| 0.10343 | 238.036 | 239.395 | 240.784 | 242.197 | 243.634 | 245.095 | 246.579 | 248.092 | 249.629 | 251.199 |
| 0.17164 | 240.259 | 241.624 | 243.021 | 244.446 | 245.897 | 247.373 | 248.876 | 250.410 | 251.967 | 253.554 |
| 0.28538 | 243.792 | 245.186 | 246.610 | 248.060 | 249.539 | 251.044 | 252.576 | 254.139 | 255.729 | 257.346 |
| 0.31744 | 244.744 | 246.153 | 247.590 | 249.054 | 250.543 | 252.064 | 253.601 | 255.165 | 256.761 | 258.387 |
| 0.35826 | 246.012 | 247.418 | 248.860 | 250.329 | 251.827 | 253.349 | 254.903 | 256.484 | 258.091 | 259.729 |
| 0.37933 | 246.644 | 248.064 | 249.516 | 250.993 | 252.498 | 254.024 | 255.581 | 257.166 | 258.777 | 260.419 |
| 0.39919 | 247.280 | 248.699 | 250.151 | 251.631 | 253.138 | 254.675 | 256.236 | 257.831 | 259.450 | 261.099 |
| 0.44022 | 248.511 | 249.939 | 251.400 | 252.889 | 254.407 | 255.953 | 257.525 | 259.132 | 260.764 | 262.427 |
| 0.50224 | 250.343 | 251.788 | 253.267 | 254.772 | 256.307 | 257.870 | 259.462 | 261.089 | 262.737 | 264.422 |
| 0.60547 | 253.467 | 254.929 | 256.430 | 257.962 | 259.524 | 261.117 | 262.738 | 264.392 | 266.077 | 267.792 |
| 0.69350 | 256.073 | 257.575 | 259.109 | 260.670 | 262.262 | 263.879 | 265.530 | 267.212 | 268.920 | 270.667 |
| 0.80202 | 259.255 | 260.775 | 262.329 | 263.916 | 265.535 | 267.189 | 268.870 | 270.591 | 272.339 | 274.122 |
| 0.88860 | 261.766 | 263.311 | 264.890 | 266.505 | 268.149 | 269.829 | 271.539 | 273.285 | 275.062 | 276.879 |
| 1 | 264.827 | 266.424 | 268.044 | 269.683 | 271.360 | 273.068 | 274.811 | 276.595 | 278.397 | 280.252 |
Table 21.
Dependences of the liquid molar volume on perfluoro(butylcyclohexane) (1)–trans-perfluorodecalin (2) system composition xi at temperature T a.
Table 21.
Dependences of the liquid molar volume on perfluoro(butylcyclohexane) (1)–trans-perfluorodecalin (2) system composition xi at temperature T a.
| x1 | T/°C |
|---|
| 25 | 30 | 35 | 40 | 45 | 50 | 55 | 60 |
|---|
| /cm−3·mol−1 |
|---|
| 0 | 240.236 | 241.657 | 243.089 | 244.539 | 246.015 | 247.516 | 249.043 | 250.601 |
| 0.10688 | 243.358 | 244.775 | 246.220 | 247.690 | 249.189 | 250.717 | 252.270 | 253.857 |
| 0.19419 | 245.908 | 247.338 | 248.799 | 250.290 | 251.809 | 253.358 | 254.933 | 256.540 |
| 0.29614 | 248.794 | 250.251 | 251.738 | 253.253 | 254.798 | 256.375 | 257.977 | 259.612 |
| 0.40516 | 251.830 | 253.318 | 254.838 | 256.384 | 257.959 | 259.562 | 261.198 | 262.863 |
| 0.49698 | 254.406 | 255.913 | 257.453 | 259.021 | 260.620 | 262.252 | 263.916 | 265.609 |
| 0.59993 | 257.267 | 258.800 | 260.366 | 261.964 | 263.593 | 265.256 | 266.948 | 268.674 |
| 0.69763 | 259.938 | 261.504 | 263.099 | 264.726 | 266.381 | 268.072 | 269.797 | 271.556 |
| 0.80471 | 262.890 | 264.479 | 266.104 | 267.760 | 269.448 | 271.172 | 272.926 | 274.718 |
| 0.89712 | 265.336 | 266.956 | 268.609 | 270.299 | 272.012 | 273.764 | 275.547 | 277.368 |
| 1 | 268.044 | 269.683 | 271.360 | 273.068 | 274.811 | 276.595 | 278.397 | 280.252 |
Table 22.
Dependences of the liquid molar volume on trans-perfluorodecalin (1)–cis-perfluorodecalin (2) system composition xi at temperature T a.
Table 22.
Dependences of the liquid molar volume on trans-perfluorodecalin (1)–cis-perfluorodecalin (2) system composition xi at temperature T a.
| x1 | T/°C |
|---|
| 25 | 30 | 35 | 40 | 45 | 50 | 55 | 60 |
|---|
| /cm−3·mol−1 |
|---|
| 0 | 237.435 | 238.826 | 240.240 | 241.676 | 243.099 | 244.606 | 246.124 | 247.663 |
| 0.10198 | 237.709 | 239.094 | 240.506 | 241.946 | 243.406 | 244.896 | 246.407 | 247.950 |
| 0.19411 | 237.967 | 239.348 | 240.759 | 242.197 | 243.662 | 245.152 | 246.666 | 248.210 |
| 0.30439 | 238.268 | 239.654 | 241.067 | 242.506 | 243.974 | 245.469 | 246.989 | 248.538 |
| 0.41417 | 238.590 | 239.983 | 241.401 | 242.843 | 244.311 | 245.803 | 247.324 | 248.872 |
| 0.49848 | 238.857 | 240.244 | 241.661 | 243.103 | 244.573 | 246.069 | 247.590 | 249.140 |
| 0.60085 | 239.147 | 240.536 | 241.955 | 243.399 | 244.870 | 246.368 | 247.892 | 249.441 |
| 0.70172 | 239.438 | 240.830 | 242.250 | 243.691 | 245.163 | 246.660 | 248.185 | 249.734 |
| 0.80539 | 239.743 | 241.130 | 242.549 | 243.994 | 245.465 | 246.962 | 248.489 | 250.045 |
| 0.90273 | 240.007 | 241.396 | 242.817 | 244.263 | 245.736 | 247.240 | 248.770 | 250.325 |
| 1 | 240.236 | 241.657 | 243.089 | 244.539 | 246.015 | 247.516 | 249.043 | 250.601 |
Table 23.
Dependences of the excess molar volume on perfluoro(butylcyclohexane) (1)–cis-perfluorodecalin (2) system composition xi at temperature T a.
Table 23.
Dependences of the excess molar volume on perfluoro(butylcyclohexane) (1)–cis-perfluorodecalin (2) system composition xi at temperature T a.
| x1 | T/°C |
|---|
| 15 | 20 | 25 | 30 | 35 | 40 | 45 | 50 | 55 | 60 |
|---|
| /cm−3·mol−1 |
|---|
| 0 | 0 | 0 | 0 | 0 | 0 | 0 | 0 | 0 | 0 | 0 |
| 0.10343 | 0.216 | 0.194 | 0.183 | 0.179 | 0.175 | 0.172 | 0.164 | 0.177 | 0.167 | 0.165 |
| 0.17164 | 0.385 | 0.351 | 0.332 | 0.324 | 0.316 | 0.309 | 0.301 | 0.313 | 0.304 | 0.297 |
| 0.28538 | 0.491 | 0.460 | 0.440 | 0.428 | 0.418 | 0.409 | 0.398 | 0.404 | 0.395 | 0.383 |
| 0.31744 | 0.478 | 0.454 | 0.438 | 0.433 | 0.424 | 0.423 | 0.408 | 0.404 | 0.392 | 0.379 |
| 0.35826 | 0.516 | 0.479 | 0.459 | 0.448 | 0.438 | 0.427 | 0.417 | 0.418 | 0.405 | 0.391 |
| 0.37933 | 0.513 | 0.485 | 0.470 | 0.462 | 0.453 | 0.440 | 0.428 | 0.426 | 0.411 | 0.394 |
| 0.39919 | 0.551 | 0.517 | 0.497 | 0.487 | 0.475 | 0.468 | 0.454 | 0.455 | 0.443 | 0.427 |
| 0.44022 | 0.546 | 0.512 | 0.490 | 0.479 | 0.467 | 0.458 | 0.443 | 0.444 | 0.433 | 0.418 |
| 0.50224 | 0.510 | 0.477 | 0.459 | 0.448 | 0.437 | 0.428 | 0.416 | 0.417 | 0.404 | 0.392 |
| 0.60547 | 0.524 | 0.484 | 0.462 | 0.453 | 0.442 | 0.434 | 0.423 | 0.418 | 0.413 | 0.397 |
| 0.69350 | 0.479 | 0.457 | 0.447 | 0.445 | 0.440 | 0.433 | 0.426 | 0.422 | 0.415 | 0.404 |
| 0.80202 | 0.392 | 0.362 | 0.345 | 0.342 | 0.336 | 0.336 | 0.329 | 0.329 | 0.331 | 0.322 |
| 0.88860 | 0.295 | 0.269 | 0.256 | 0.259 | 0.256 | 0.258 | 0.256 | 0.254 | 0.260 | 0.257 |
| 1 | 0 | 0 | 0 | 0 | 0 | 0 | 0 | 0 | 0 | 0 |
Table 24.
Dependences of the excess molar volume on trans-perfluorodecalin (1)–cis-perfluorodecalin (2) system composition xi at temperature T a.
Table 24.
Dependences of the excess molar volume on trans-perfluorodecalin (1)–cis-perfluorodecalin (2) system composition xi at temperature T a.
| x1 | T/°C |
|---|
| 25 | 30 | 35 | 40 | 45 | 50 | 55 | 60 |
|---|
| /cm−3·mol−1 |
|---|
| 0 | 0 | 0 | 0 | 0 | 0 | 0 | 0 | 0 |
| 0.10688 | 0.150 | 0.123 | 0.109 | 0.102 | 0.096 | 0.093 | 0.090 | 0.087 |
| 0.19419 | 0.272 | 0.239 | 0.220 | 0.211 | 0.202 | 0.195 | 0.190 | 0.181 |
| 0.29614 | 0.323 | 0.294 | 0.277 | 0.265 | 0.255 | 0.248 | 0.241 | 0.230 |
| 0.40516 | 0.327 | 0.306 | 0.295 | 0.286 | 0.277 | 0.264 | 0.262 | 0.249 |
| 0.49698 | 0.350 | 0.328 | 0.314 | 0.304 | 0.294 | 0.284 | 0.285 | 0.272 |
| 0.59993 | 0.348 | 0.329 | 0.316 | 0.310 | 0.302 | 0.295 | 0.295 | 0.284 |
| 0.69763 | 0.302 | 0.295 | 0.287 | 0.284 | 0.277 | 0.270 | 0.276 | 0.270 |
| 0.80471 | 0.277 | 0.269 | 0.265 | 0.263 | 0.261 | 0.256 | 0.262 | 0.257 |
| 0.89712 | 0.153 | 0.156 | 0.158 | 0.166 | 0.164 | 0.161 | 0.170 | 0.166 |
| 1 | 0 | 0 | 0 | 0 | 0 | 0 | 0 | 0 |
Table 25.
Dependences of the excess molar volume on trans-perfluorodecalin (1)–cis-perfluorodecalin (2) system composition xi at temperature T a.
Table 25.
Dependences of the excess molar volume on trans-perfluorodecalin (1)–cis-perfluorodecalin (2) system composition xi at temperature T a.
| x1 | T/°C |
|---|
| 25 | 30 | 35 | 40 | 45 | 50 | 55 | 60 |
|---|
| /cm−3·mol−1 |
|---|
| 0 | 0 | 0 | 0 | 0 | 0 | 0 | 0 | 0 |
| 0.10198 | −0.012 | −0.021 | −0.025 | −0.022 | 0.010 | −0.007 | −0.015 | −0.013 |
| 0.19411 | −0.012 | −0.028 | −0.034 | −0.035 | −0.003 | −0.019 | −0.025 | −0.023 |
| 0.30439 | −0.020 | −0.034 | −0.040 | −0.041 | −0.013 | −0.023 | −0.024 | −0.019 |
| 0.41417 | −0.005 | −0.016 | −0.019 | −0.019 | 0.004 | −0.008 | −0.009 | −0.008 |
| 0.49848 | 0.026 | 0.007 | 0.001 | 0 | 0.020 | 0.012 | 0.011 | 0.012 |
| 0.60085 | 0.029 | 0.009 | 0.003 | 0.003 | 0.019 | 0.014 | 0.014 | 0.013 |
| 0.70172 | 0.037 | 0.017 | 0.011 | 0.006 | 0.018 | 0.012 | 0.013 | 0.009 |
| 0.80539 | 0.052 | 0.024 | 0.014 | 0.012 | 0.017 | 0.012 | 0.014 | 0.016 |
| 0.90273 | 0.043 | 0.014 | 0.005 | 0.002 | 0.005 | 0.007 | 0.011 | 0.010 |
| 1 | 0 | 0 | 0 | 0 | 0 | 0 | 0 | 0 |
Table 26.
Redlich-Kister regression results (according to the Equation (9a,b)) for the excess molar volumes
at temperature
T of perfluoro(butylcyclohexane) (1)–cis-perfluorodecalin (2) system calculated from
Table 23 data.
Table 26.
Redlich-Kister regression results (according to the Equation (9a,b)) for the excess molar volumes
at temperature
T of perfluoro(butylcyclohexane) (1)–cis-perfluorodecalin (2) system calculated from
Table 23 data.
| T/°C | a3 | a2 | a1 | a0 | /cm3·mol−1 |
|---|
| 15 | 1.104964 | 0.978578 | −0.344386 | 2.129725 | 0.021 |
| 20 | 1.062583 | 0.771174 | −0.326034 | 2.008629 | 0.019 |
| 25 | 1.006494 | 0.675298 | −0.295903 | 1.938418 | 0.018 |
| 30 | 1.054220 | 0.720329 | −0.277812 | 1.898207 | 0.018 |
| 35 | 1.042090 | 0.725251 | −0.260297 | 1.856007 | 0.018 |
| 40 | 1.097235 | 0.774554 | −0.255016 | 1.817599 | 0.018 |
| 45 | 1.136660 | 0.774213 | −0.243640 | 1.767653 | 0.018 |
| 50 | 0.985911 | 0.886383 | −0.249339 | 1.755389 | 0.018 |
| 55 | 1.124080 | 0.934376 | −0.232019 | 1.709023 | 0.019 |
| 60 | 1.098612 | 0.985980 | −0.221599 | 1.644507 | 0.018 |
Table 27.
Redlich-Kister regression results (according to Equation (9a,b)) for the excess molar volumes
at temperature
T of perfluoro(butylcyclohexane) (1)–trans-perfluorodecalin (2) system calculated from
Table 24 data.
Table 27.
Redlich-Kister regression results (according to Equation (9a,b)) for the excess molar volumes
at temperature
T of perfluoro(butylcyclohexane) (1)–trans-perfluorodecalin (2) system calculated from
Table 24 data.
| T/°C | a4 | a3 | a2 | a1 | a0 | /cm3·mol−1 |
|---|
| 25 | −1.954153 | 0.190090 | 1.674633 | −0.058943 | 1.343112 | 0.018 |
| 30 | −1.845871 | 0.425479 | 1.529335 | −0.003537 | 1.264095 | 0.014 |
| 35 | −1.727888 | 0.544906 | 1.430764 | 0.021673 | 1.215389 | 0.013 |
| 40 | −1.492634 | 0.699904 | 1.345204 | 0.020418 | 1.183338 | 0.012 |
| 45 | −1.502029 | 0.689572 | 1.344187 | 0.056314 | 1.146885 | 0.012 |
| 50 | −1.512829 | 0.657437 | 1.354771 | 0.072389 | 1.106092 | 0.012 |
| 55 | −1.334099 | 0.710743 | 1.304439 | 0.124689 | 1.104640 | 0.012 |
| 60 | −1.295411 | 0.631341 | 1.298648 | 0.165574 | 1.060024 | 0.010 |
Table 28.
Redlich-Kister regression results (according to Equation (9a,b)) for the excess molar volumes
at temperature
T of trans-perfluorodecalin (1)–cis-perfluorodecalin (2) system calculated from
Table 25 data.
Table 28.
Redlich-Kister regression results (according to Equation (9a,b)) for the excess molar volumes
at temperature
T of trans-perfluorodecalin (1)–cis-perfluorodecalin (2) system calculated from
Table 25 data.
| T/°C | a1 | a0 | /cm3·mol−1 |
|---|
| 25 | 0.363697 | 0.099868 | 0.011 |
| 30 | 0.259612 | −0.019726 | 0.006 |
| 35 | 0.232529 | −0.060487 | 0.008 |
| 40 | 0.205715 | −0.066386 | 0.009 |
| 45 | 0.093063 | 0.034057 | 0.010 |
| 50 | 0.135899 | −0.002282 | 0.008 |
| 55 | 0.194350 | −0.010696 | 0.007 |
| 60 | 0.175727 | −0.005742 | 0.006 |
Table 29.
Redlich-Kister regression results (according to Equation (10a,b)) for the excess molar volumes
of perfluoro(butylcyclohexane) (1)–cis-perfluorodecalin (2) system calculated from
Table 26 data
a.
Table 29.
Redlich-Kister regression results (according to Equation (10a,b)) for the excess molar volumes
of perfluoro(butylcyclohexane) (1)–cis-perfluorodecalin (2) system calculated from
Table 26 data
a.
| ai | bj |
|---|
| b2 | b1 | b0 |
|---|
| a3 | 0.000072 | −0.004674 | 1.131143 |
| a2 | 0.000478 | −0.032840 | 1.283535 |
| a1 | −0.000052 | 0.006427 | −0.428262 |
| a0 | 0.000105 | −0.017362 | 2.333832 |
Table 30.
Redlich-Kister regression results (according to Equation (10a,b)) for the excess molar volumes
of perfluoro(butylcyclohexane) (1)–trans-perfluorodecalin (2) system calculated from
Table 27 data
a.
Table 30.
Redlich-Kister regression results (according to Equation (10a,b)) for the excess molar volumes
of perfluoro(butylcyclohexane) (1)–trans-perfluorodecalin (2) system calculated from
Table 27 data
a.
| ai | bj |
|---|
| b2 | b1 | b0 |
|---|
| a4 | −0.000293 | 0.043508 | −2.864105 |
| a3 | −0.000873 | 0.085766 | −1.384216 |
| a2 | 0.000439 | −0.046791 | 2.548607 |
| a1 | 0.000048 | 0.001634 | −0.112666 |
| a0 | 0.000137 | −0.019123 | 1.725379 |
Table 31.
Redlich-Kister regression results (according to Equation (10a,b)) for the excess molar volumes
of trans-perfluorodecalin (1)–cis-perfluorodecalin (2) system calculated from
Table 28 data
a.
Table 31.
Redlich-Kister regression results (according to Equation (10a,b)) for the excess molar volumes
of trans-perfluorodecalin (1)–cis-perfluorodecalin (2) system calculated from
Table 28 data
a.
| ai | bj |
|---|
| b2 | b1 | b0 |
|---|
| a1 | 0.000388 | −0.037870 | 1.064833 |
| a0 | 0.000233 | −0.020799 | 0.428681 |
Table 32.
Dependences of density ρ on perfluoro(butylcyclohexane) (1)–trans-perfluorodecalin (2)–cis-perfluorodecalin (3) system composition xi at temperature T and pressure P = 99.1 kPa a.
Table 32.
Dependences of density ρ on perfluoro(butylcyclohexane) (1)–trans-perfluorodecalin (2)–cis-perfluorodecalin (3) system composition xi at temperature T and pressure P = 99.1 kPa a.
| x1 | x2 | x3 | T/°C |
|---|
| 25 | 30 | 35 | 40 | 45 | 50 | 55 | 60 |
|---|
| ρ/g·cm−3 |
|---|
| 0.57402 | 0.21988 | 0.20610 | 1.89013 | 1.87891 | 1.86761 | 1.85623 | 1.84481 | 1.83331 | 1.82175 | 1.81008 |
| 0.17479 | 0.19519 | 0.63002 | 1.92382 | 1.91265 | 1.90139 | 1.89007 | 1.87867 | 1.86720 | 1.85569 | 1.84408 |
| 0.17937 | 0.63244 | 0.18819 | 1.91397 | 1.90288 | 1.89168 | 1.88044 | 1.86911 | 1.85769 | 1.84621 | 1.83466 |
| 0.18870 | 0.39863 | 0.41267 | 1.91787 | 1.90673 | 1.89552 | 1.88424 | 1.87287 | 1.86144 | 1.84997 | 1.83842 |
| 0.36974 | 0.40875 | 0.22151 | 1.90212 | 1.89101 | 1.87981 | 1.86853 | 1.85715 | 1.84571 | 1.83419 | 1.82261 |
| 0.37885 | 0.22255 | 0.39860 | 1.90497 | 1.89385 | 1.88261 | 1.87129 | 1.85991 | 1.84846 | 1.83691 | 1.82532 |
Table 33.
Dependences of the liquid molar volume on perfluoro(butylcyclohexane) (1)–trans-perfluorodecalin (2)–cis-perfluorodecalin (3) system composition xi at temperature T a.
Table 33.
Dependences of the liquid molar volume on perfluoro(butylcyclohexane) (1)–trans-perfluorodecalin (2)–cis-perfluorodecalin (3) system composition xi at temperature T a.
| x1 | x2 | x3 | T/°C |
|---|
| 25 | 30 | 35 | 40 | 45 | 50 | 55 | 60 |
|---|
| /cm−3·mol−1 |
|---|
| 0.57402 | 0.21988 | 0.20610 | 256.007 | 257.536 | 259.094 | 260.683 | 262.296 | 263.942 | 265.617 | 267.329 |
| 0.17479 | 0.19519 | 0.63002 | 243.640 | 245.063 | 246.515 | 247.991 | 249.496 | 251.028 | 252.585 | 254.176 |
| 0.17937 | 0.63244 | 0.18819 | 244.988 | 246.416 | 247.875 | 249.356 | 250.868 | 252.410 | 253.979 | 255.578 |
| 0.18870 | 0.39863 | 0.41267 | 244.669 | 246.099 | 247.554 | 249.036 | 250.548 | 252.087 | 253.650 | 255.243 |
| 0.36974 | 0.40875 | 0.22151 | 250.314 | 251.784 | 253.284 | 254.813 | 256.375 | 257.964 | 259.584 | 261.233 |
| 0.37885 | 0.22255 | 0.39860 | 250.121 | 251.589 | 253.091 | 254.622 | 256.180 | 257.767 | 259.388 | 261.035 |
Table 34.
Dependences of the excess molar volume on perfluoro(butylcyclohexane) (1)–trans-perfluorodecalin (2)–cis-perfluorodecalin (3) system composition xi at temperature T a.
Table 34.
Dependences of the excess molar volume on perfluoro(butylcyclohexane) (1)–trans-perfluorodecalin (2)–cis-perfluorodecalin (3) system composition xi at temperature T a.
| x1 | x2 | x3 | T/°C |
|---|
| 25 | 30 | 35 | 40 | 45 | 50 | 55 | 60 |
|---|
| /cm−3·mol−1 |
|---|
| 0.57402 | 0.21988 | 0.20610 | 0.386 | 0.375 | 0.364 | 0.358 | 0.353 | 0.334 | 0.326 | 0.313 |
| 0.17479 | 0.19519 | 0.63002 | 0.308 | 0.291 | 0.279 | 0.269 | 0.285 | 0.263 | 0.250 | 0.243 |
| 0.17937 | 0.63244 | 0.18819 | 0.289 | 0.262 | 0.248 | 0.236 | 0.234 | 0.223 | 0.217 | 0.209 |
| 0.18870 | 0.39863 | 0.41267 | 0.344 | 0.324 | 0.308 | 0.297 | 0.305 | 0.287 | 0.275 | 0.262 |
| 0.36974 | 0.40875 | 0.22151 | 0.417 | 0.392 | 0.373 | 0.360 | 0.359 | 0.341 | 0.334 | 0.320 |
| 0.37885 | 0.22255 | 0.39860 | 0.466 | 0.443 | 0.427 | 0.416 | 0.418 | 0.394 | 0.388 | 0.372 |
Table 35.
Calculated by Kohler Equation (11) the excess molar volume data for the perfluoro(butylcyclohexane) (1)–trans-perfluorodecalin (2)–cis-perfluorodecalin (3) system at temperature T and composition x a.
Table 35.
Calculated by Kohler Equation (11) the excess molar volume data for the perfluoro(butylcyclohexane) (1)–trans-perfluorodecalin (2)–cis-perfluorodecalin (3) system at temperature T and composition x a.
| x1 | x2 | x3 | T/°C |
|---|
| 25 | 30 | 35 | 40 | 45 | 50 | 55 | 60 |
|---|
| /cm−3·mol−1 |
|---|
| 0.57402 | 0.21988 | 0.20610 | 0.452 | 0.437 | 0.425 | 0.415 | 0.409 | 0.405 | 0.403 | 0.405 |
| 0.17479 | 0.19519 | 0.63002 | 0.270 | 0.260 | 0.251 | 0.245 | 0.241 | 0.238 | 0.238 | 0.239 |
| 0.17937 | 0.63244 | 0.18819 | 0.283 | 0.257 | 0.235 | 0.219 | 0.208 | 0.201 | 0.199 | 0.203 |
| 0.18870 | 0.39863 | 0.41267 | 0.288 | 0.270 | 0.255 | 0.243 | 0.235 | 0.231 | 0.229 | 0.231 |
| 0.36974 | 0.40875 | 0.22151 | 0.377 | 0.358 | 0.341 | 0.328 | 0.318 | 0.311 | 0.308 | 0.307 |
| 0.37885 | 0.22255 | 0.39860 | 0.414 | 0.399 | 0.386 | 0.375 | 0.366 | 0.360 | 0.355 | 0.352 |


 ,
, 


