
Preparation of PVA/SA-FMB Microspheres and Their Adsorption of Cr(VI) in Aqueous Solution


Abstract
1. Introduction
2. Materials and Methods
2.1. Experimental Reagents
2.2. Preparation of PVA/SA-FMB Microsphere
2.2.1. Preparation of the FMB
2.2.2. Preparation of PVA/SA Solution
2.2.3. Preparation of PVA/SA-FMB Microspheres
2.3. Optimization of Parameters for the Preparation of PVA/SA-FMB Microspheres
2.4. Characterization and Principle of Materials
- Element composition analysis: An element analyzer was utilized to quantitatively assess the elemental composition of biochar, focusing primarily on carbon (C) and oxygen (O).
- X-ray diffraction (XRD) analysis: The phase structure of the materials was studied using a EVASTAR Y2 X-ray diffractometer from Suzhou Ivan Zhitong (Suzhou, China), covering a test range of 2θ = 10–90°.
- Surface area and pore size analysis (BET): The pore structures of different biochars have their own characteristics. The specific surface area, total pore volume, and average pore diameter of the test samples were analyzed using the ChemStation-001 type nitrogen adsorption–desorption instrument from mainland China (Zhejiang, China) to examine the types of adsorption–desorption curves.
- Scanning electron microscope (SEM): In this experiment, the morphology of the samples was observed using a Supra55 scanning electron microscope from the German company Zeiss (Jena, Germany), with an EHT of 15 KV. Before testing, the samples were thoroughly dried and sputter-coated with gold.
- X-ray photoelectron spectroscopy (XPS): In this experiment, the elemental composition and valence state information of the samples were characterized using the ESCALAB 250 X-ray photoelectron spectrometer(Thermo Fisher Scientific Company, Waltham, MA, USA). The Al Kα radiation was 1486.6 eV, with a vacuum level better than 5 × 10⁻¹⁰ mbar.
- Fourier transform infrared spectroscopy (FTIR): The structure of the samples was characterized using the VERTEX 80 Infrared-Raman spectrometer from the German company Bruker (Berlin, Germany), with a spectral range of 4000–400 cm−1 and a resolution of 0.07 cm−1.
2.5. Evaluation of Adsorption Properties
3. Results and Discussion
3.1. Optimization of Preparation Parameters for PVA/SA-FMB Microspheres
3.1.1. Analysis of Single Factor Test Results
- The effect of SA concentration on the preparation of PVA/SA-FMB microspheres
- 2.
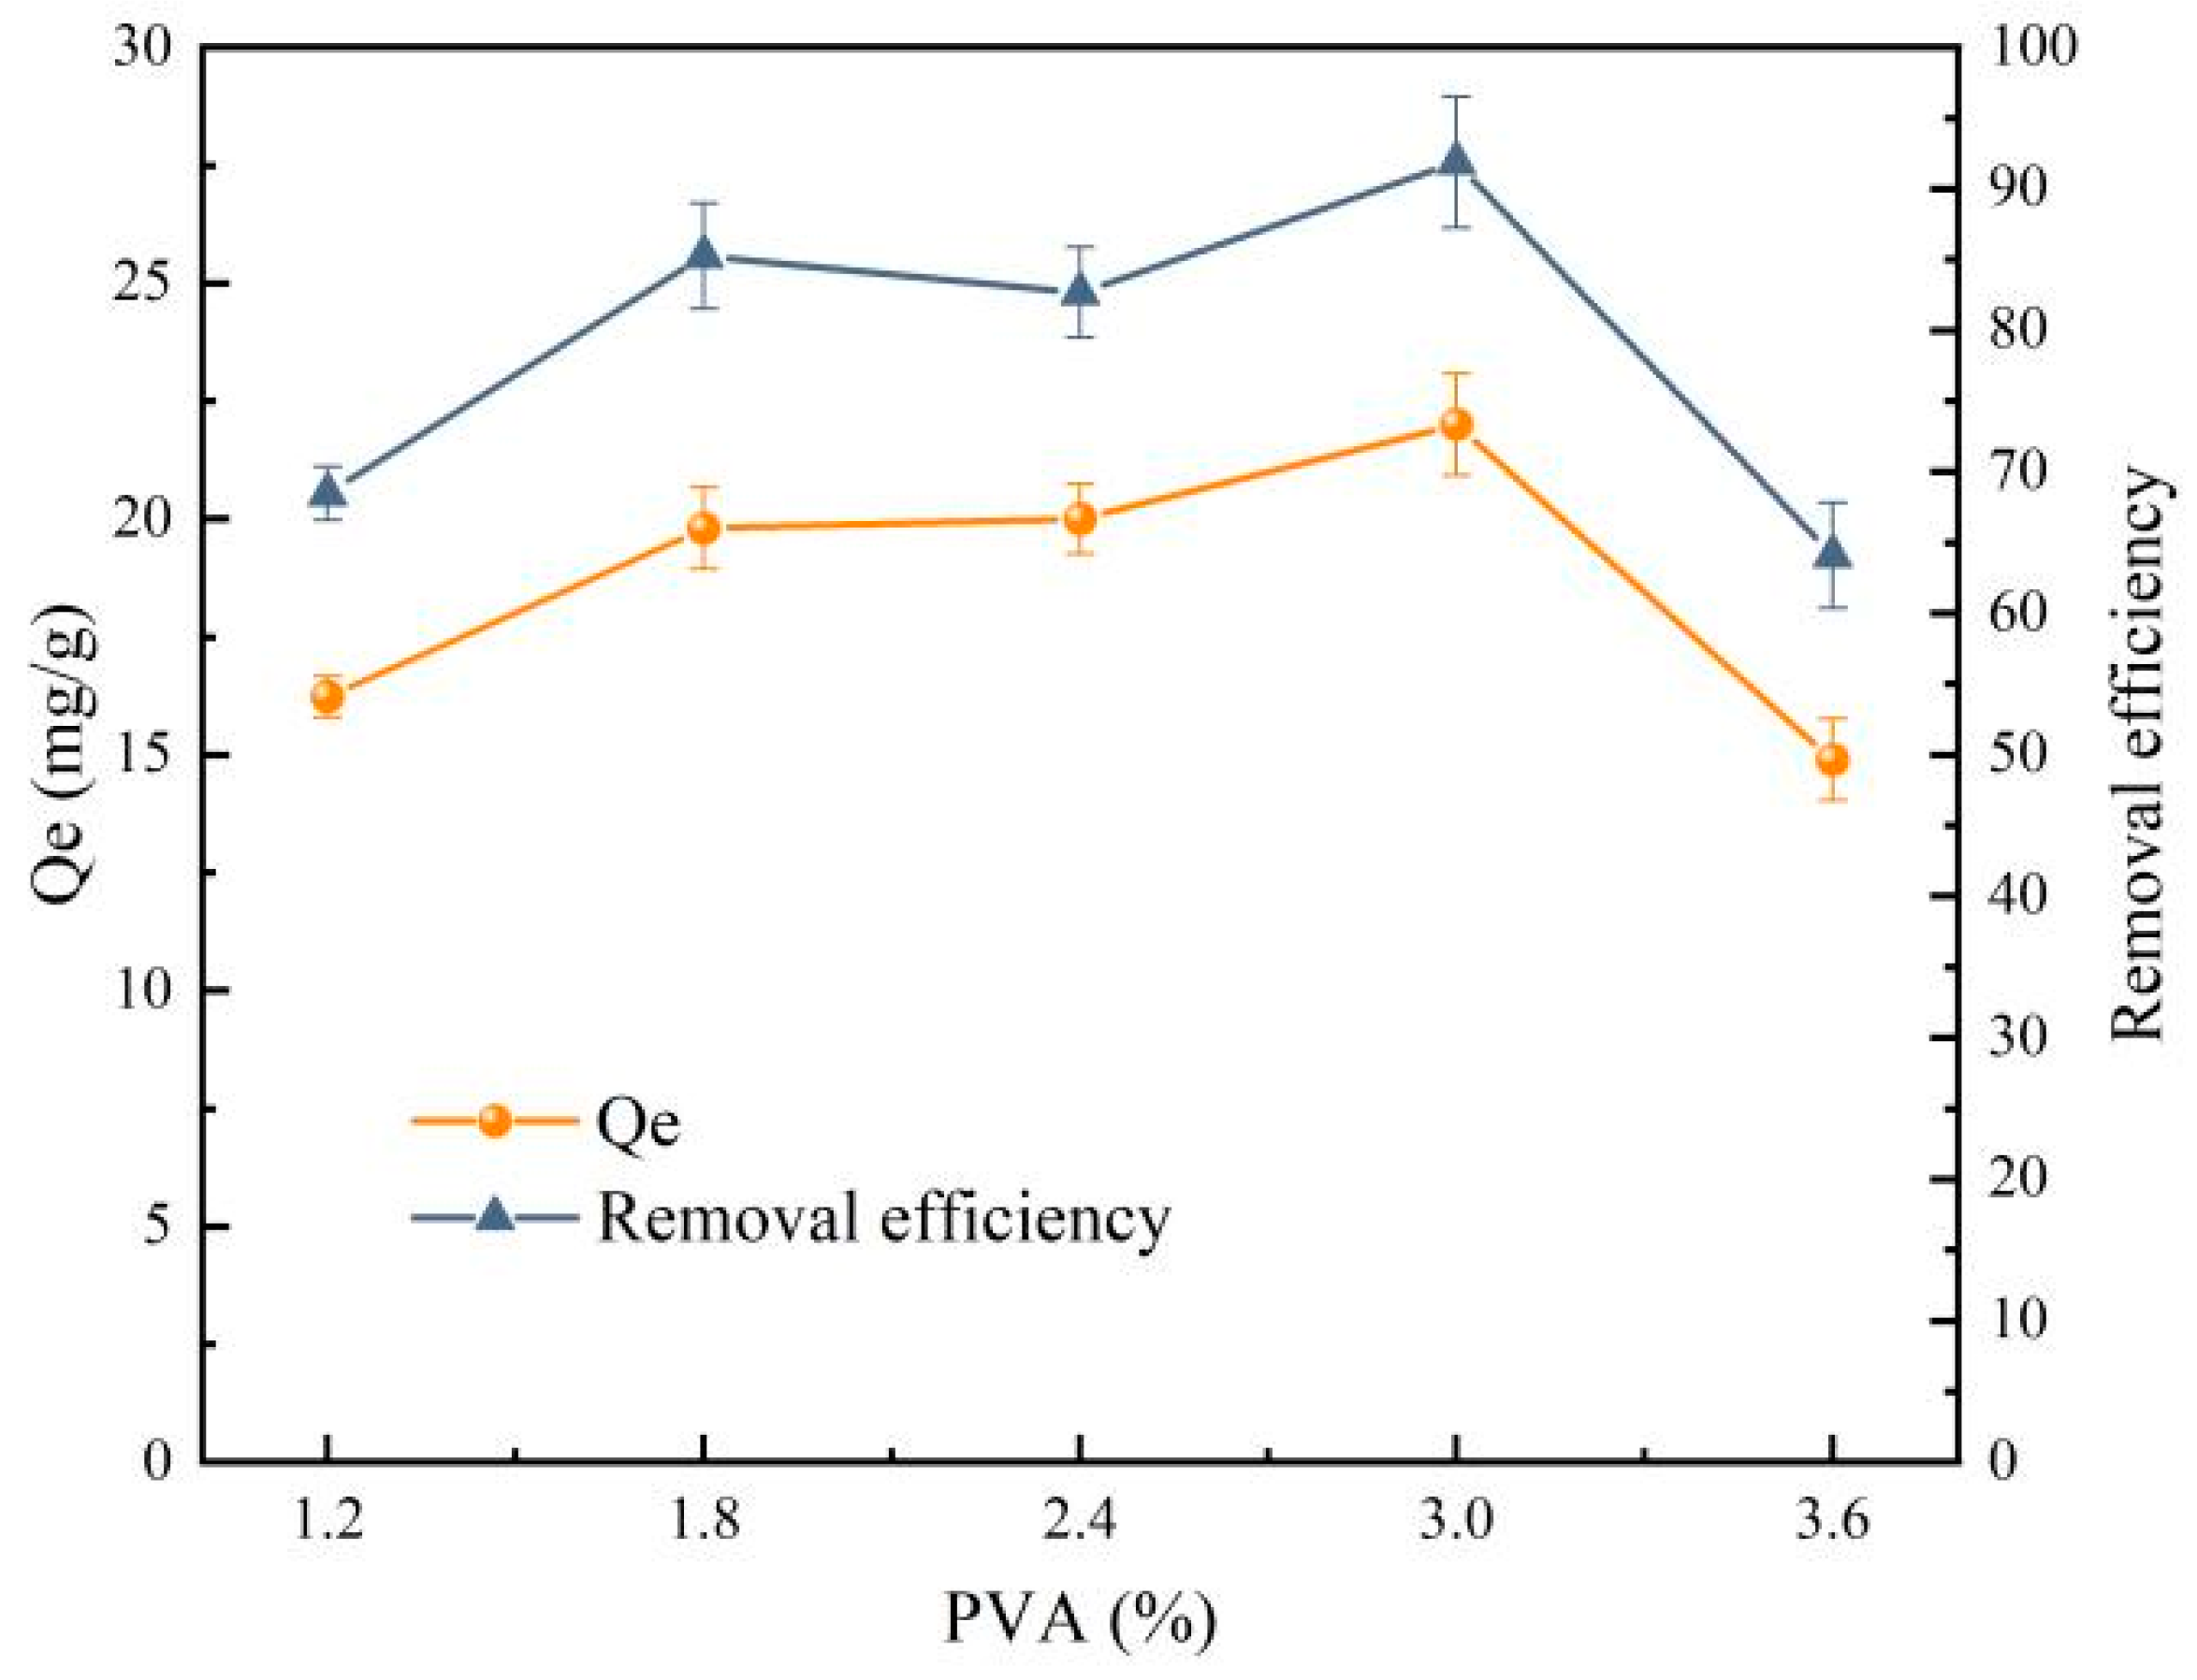
- Effect of PVA concentration on the preparation of PVA/SA-FMB microspheres
- 3.
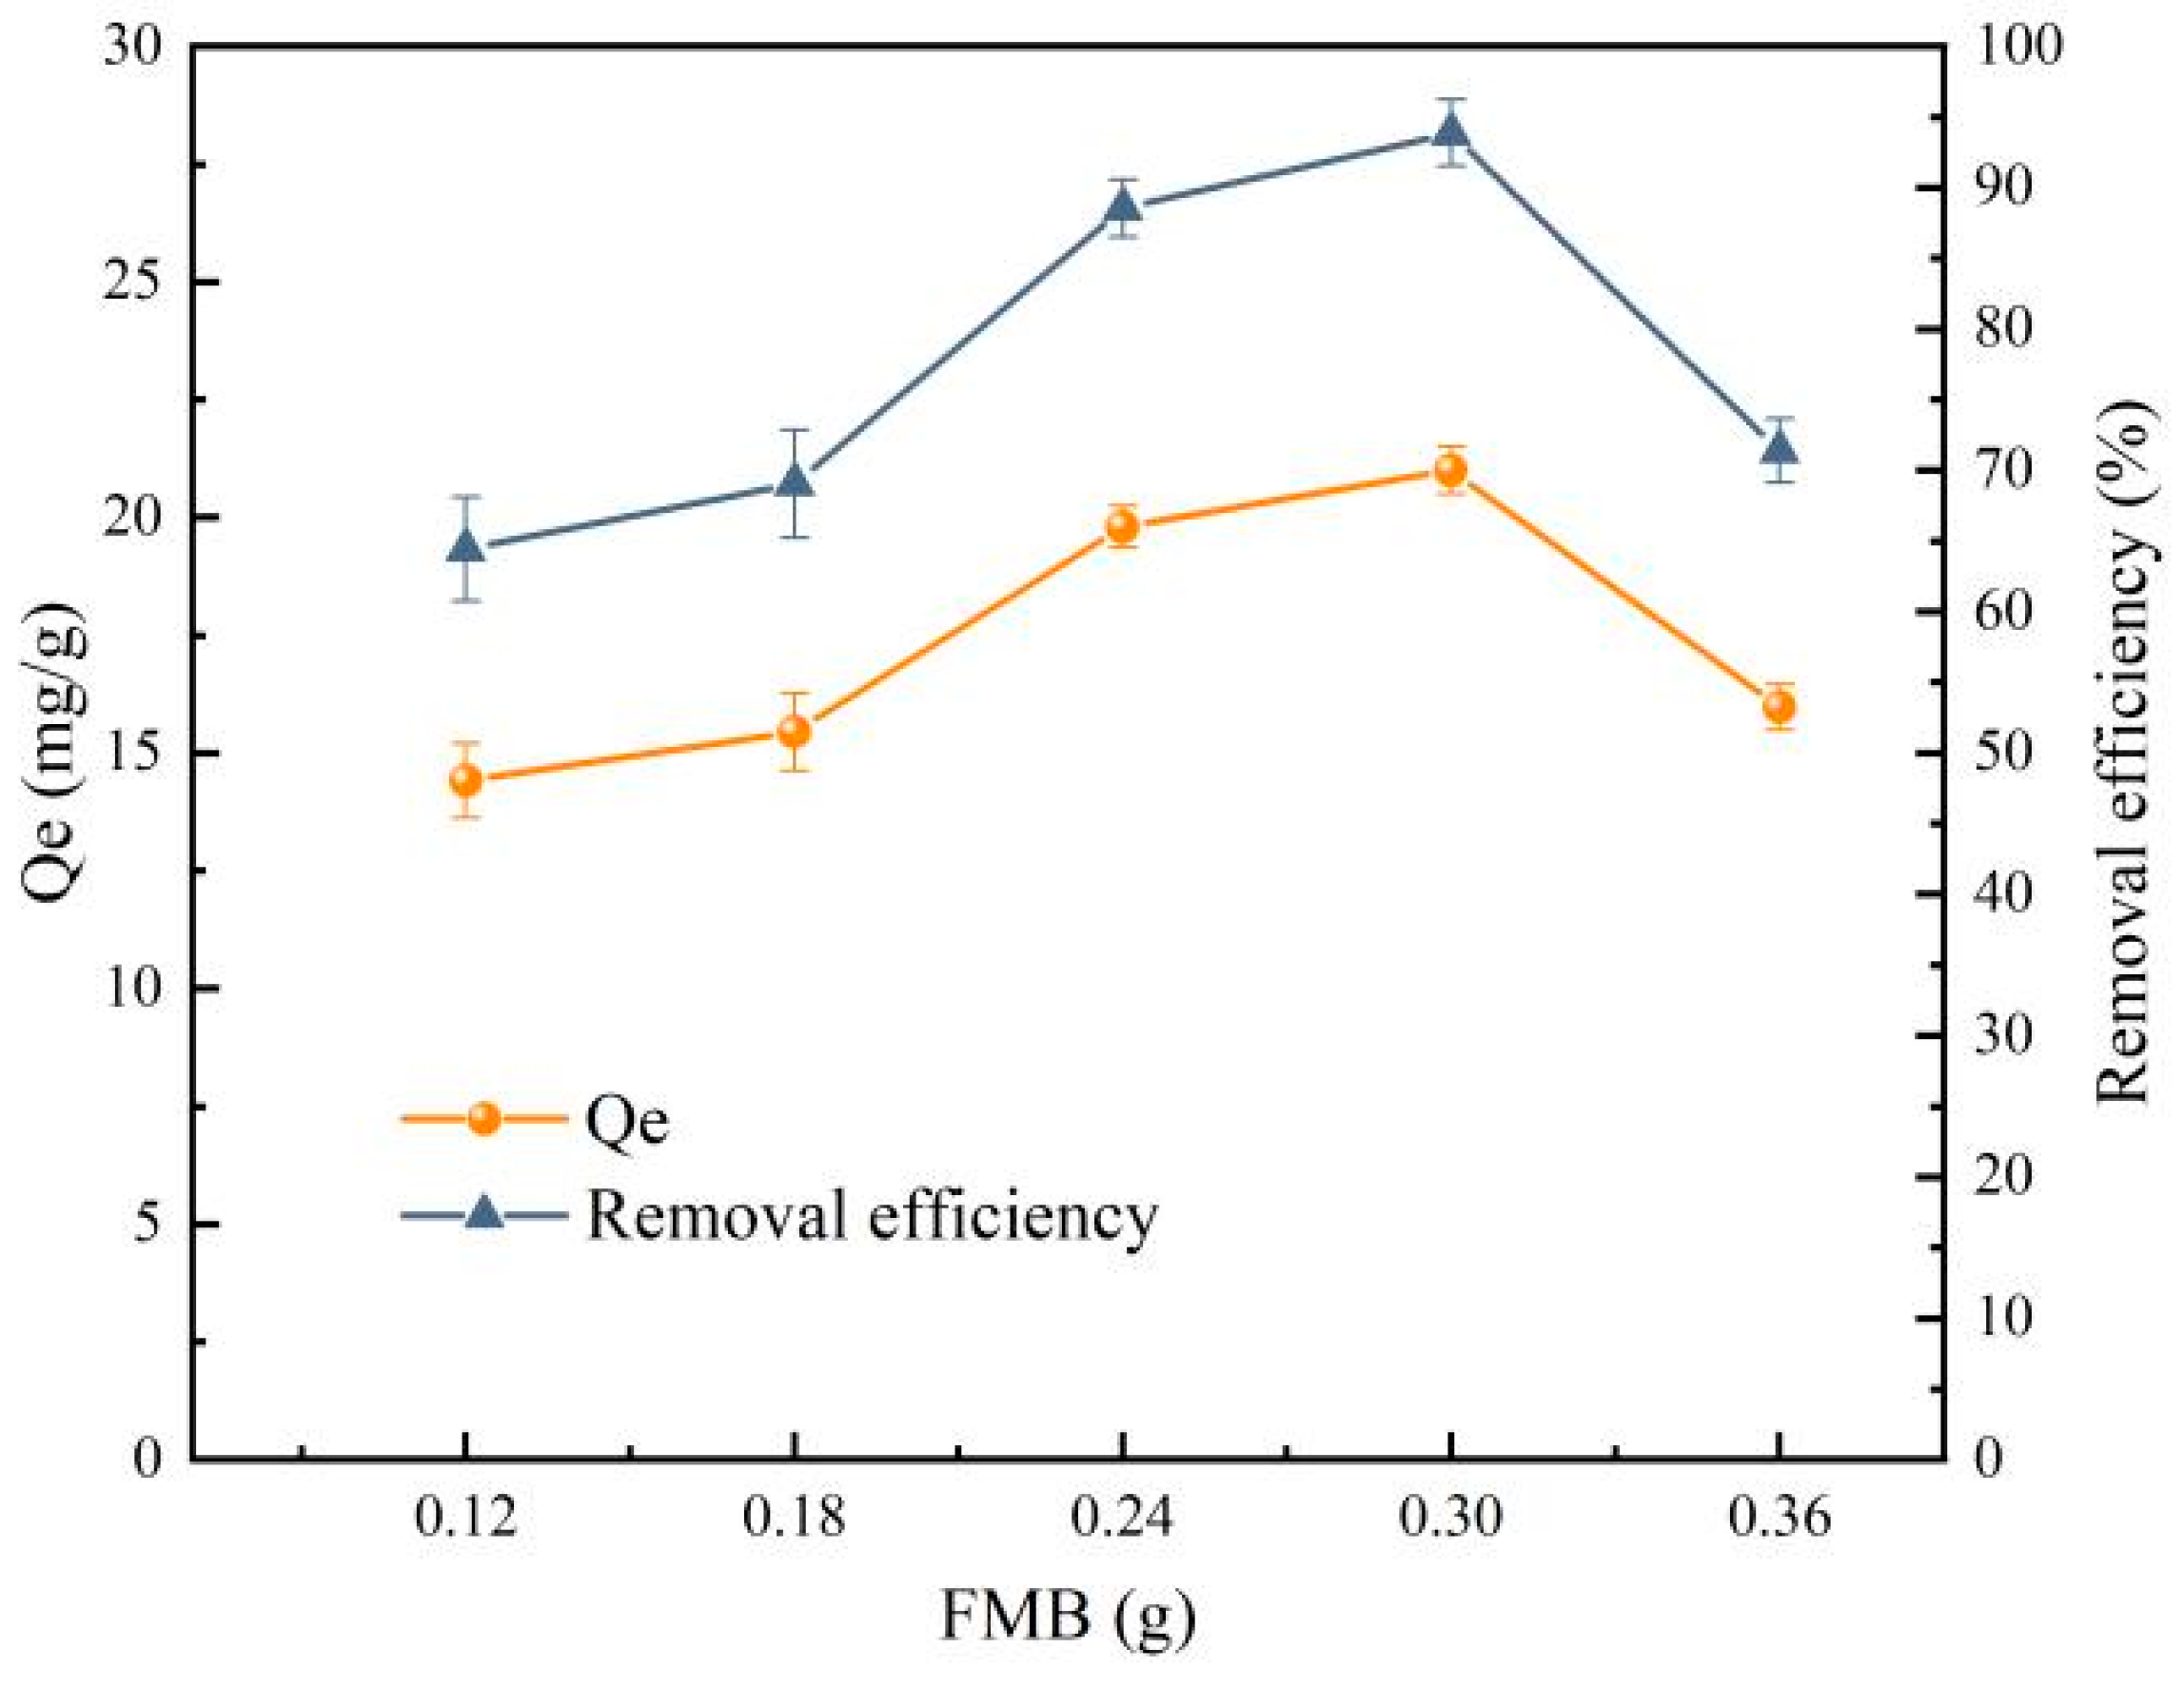
- Influence of FMB mass on the preparation of PVA/SA-FMB microspheres
- 4.
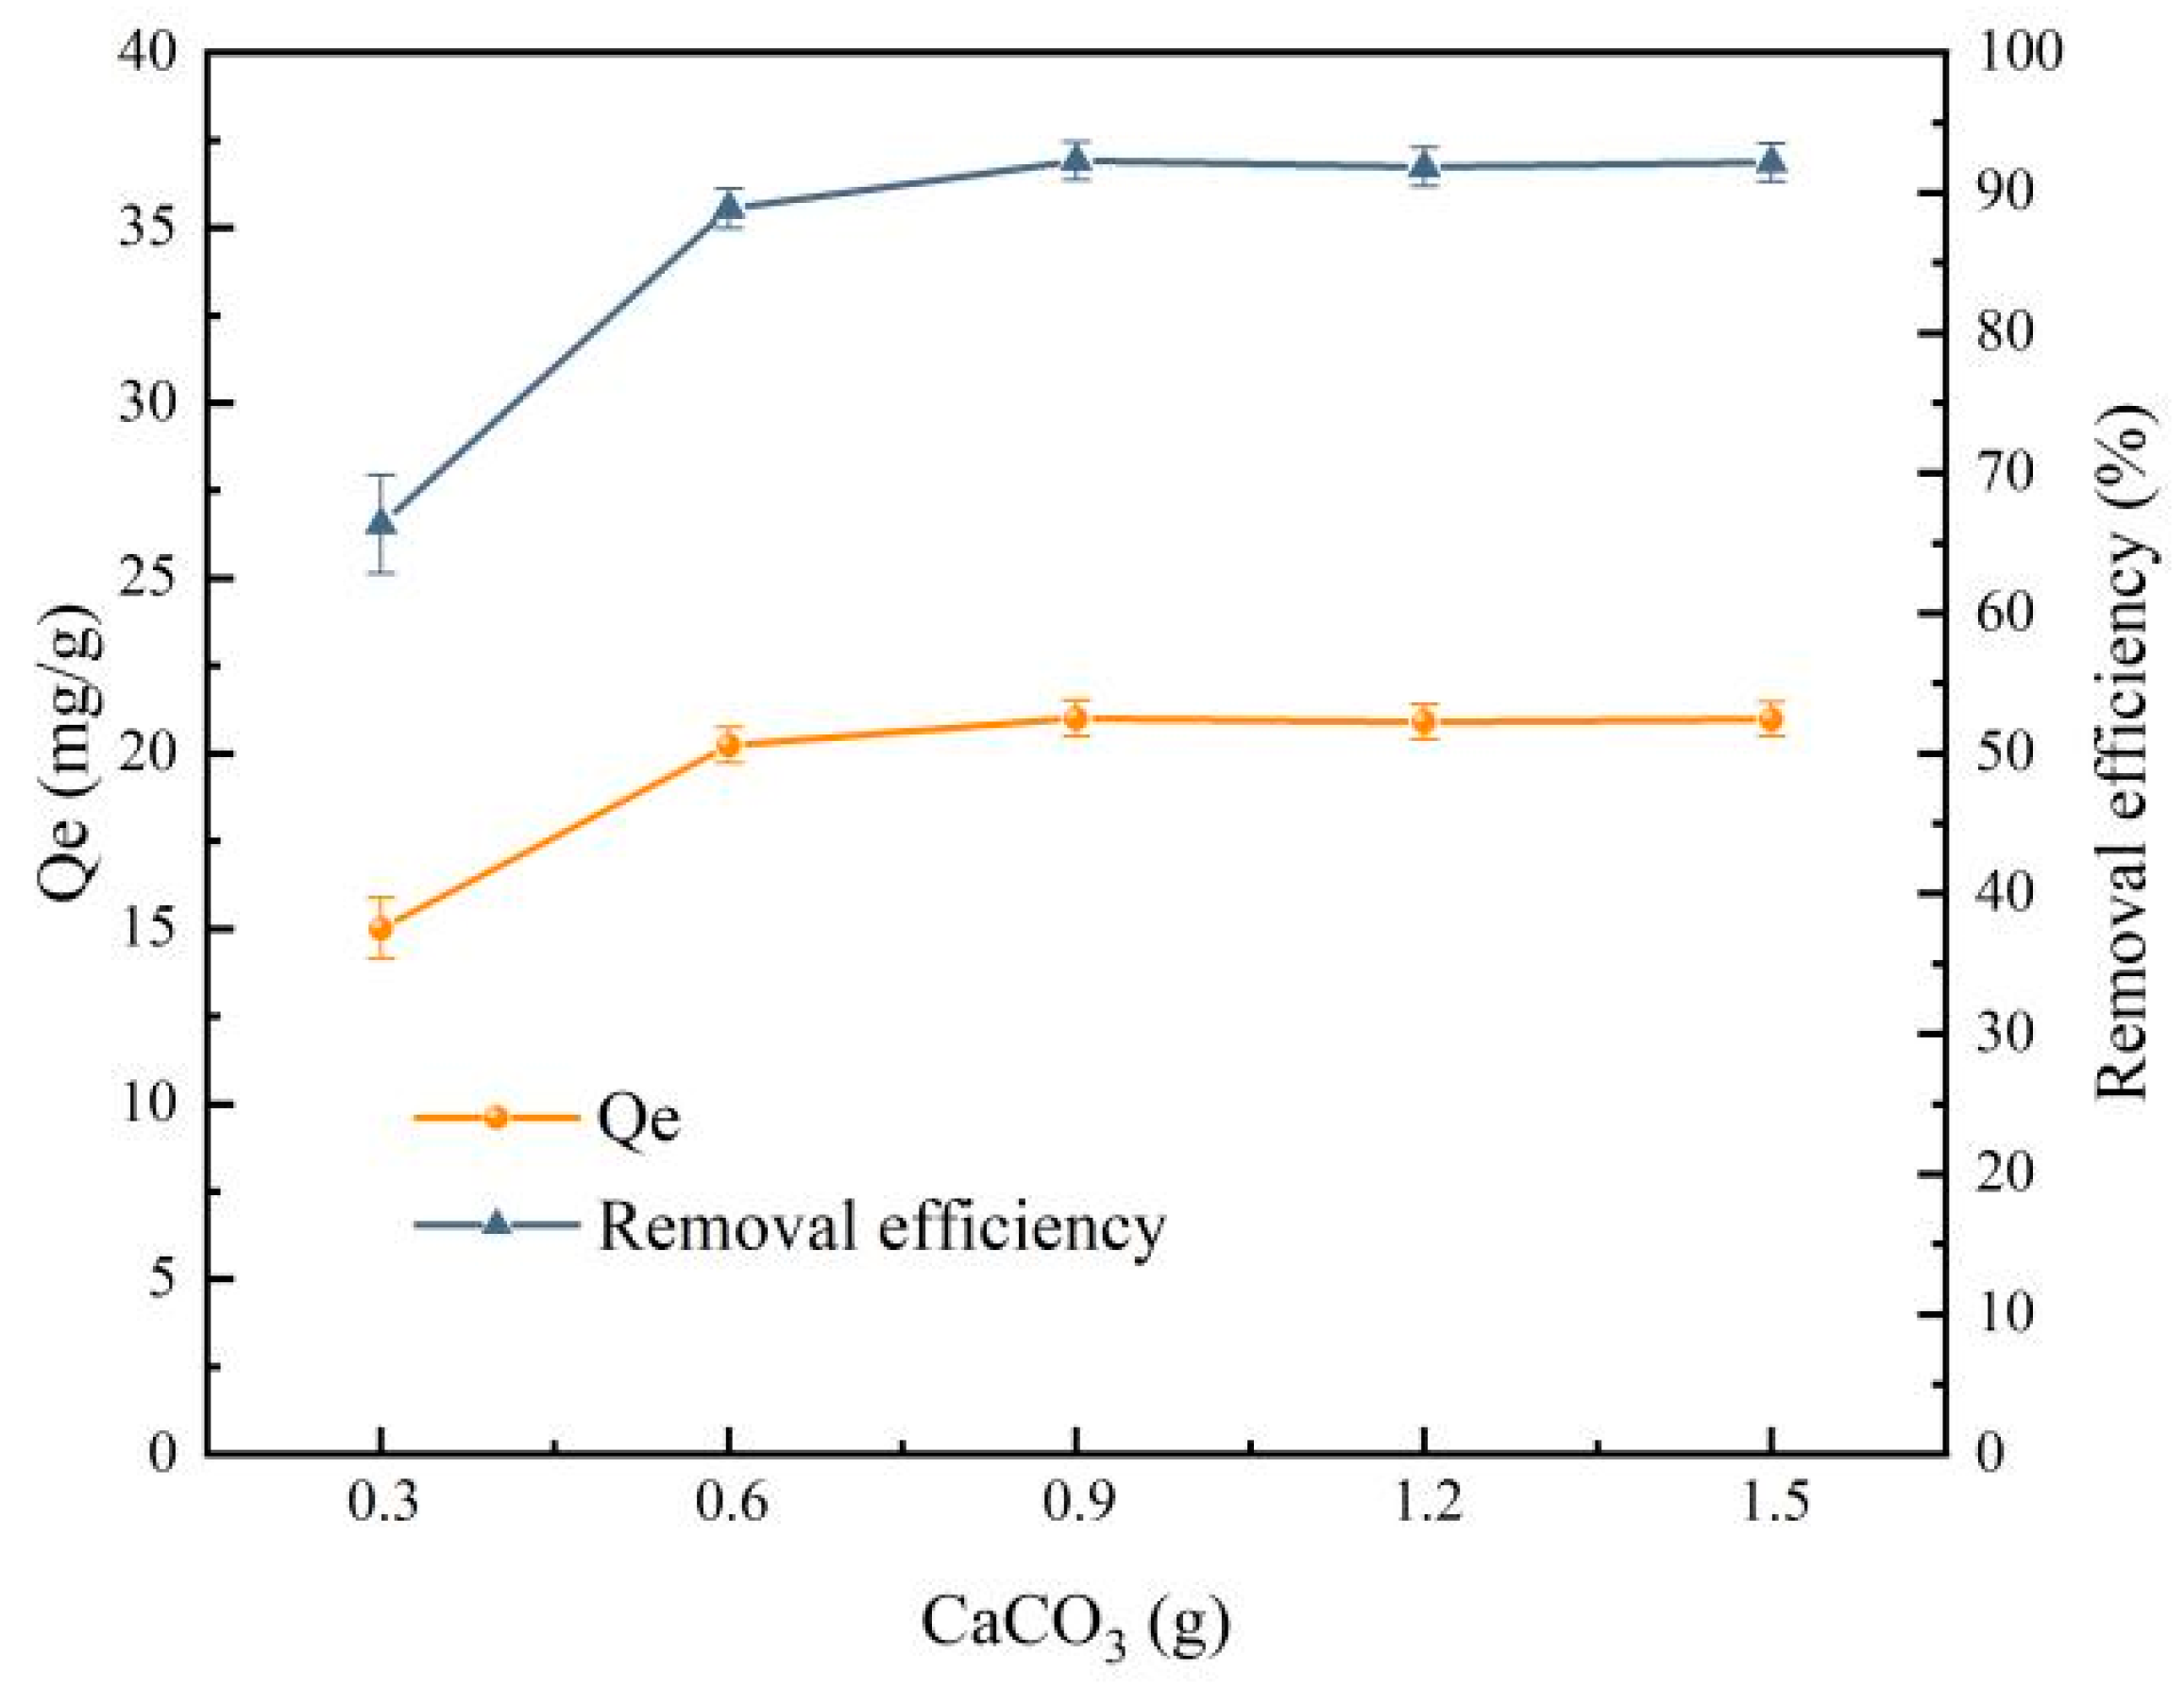
- Influence of CaCO3 mass on the preparation of PVA/SA-FMB microspheres
3.1.2. Establishment and Analysis of the RSM Model
- Design of RSM test
- 2.
- Establishment and analysis of the regression model
- 3.
- Response regression analysis
- 4.
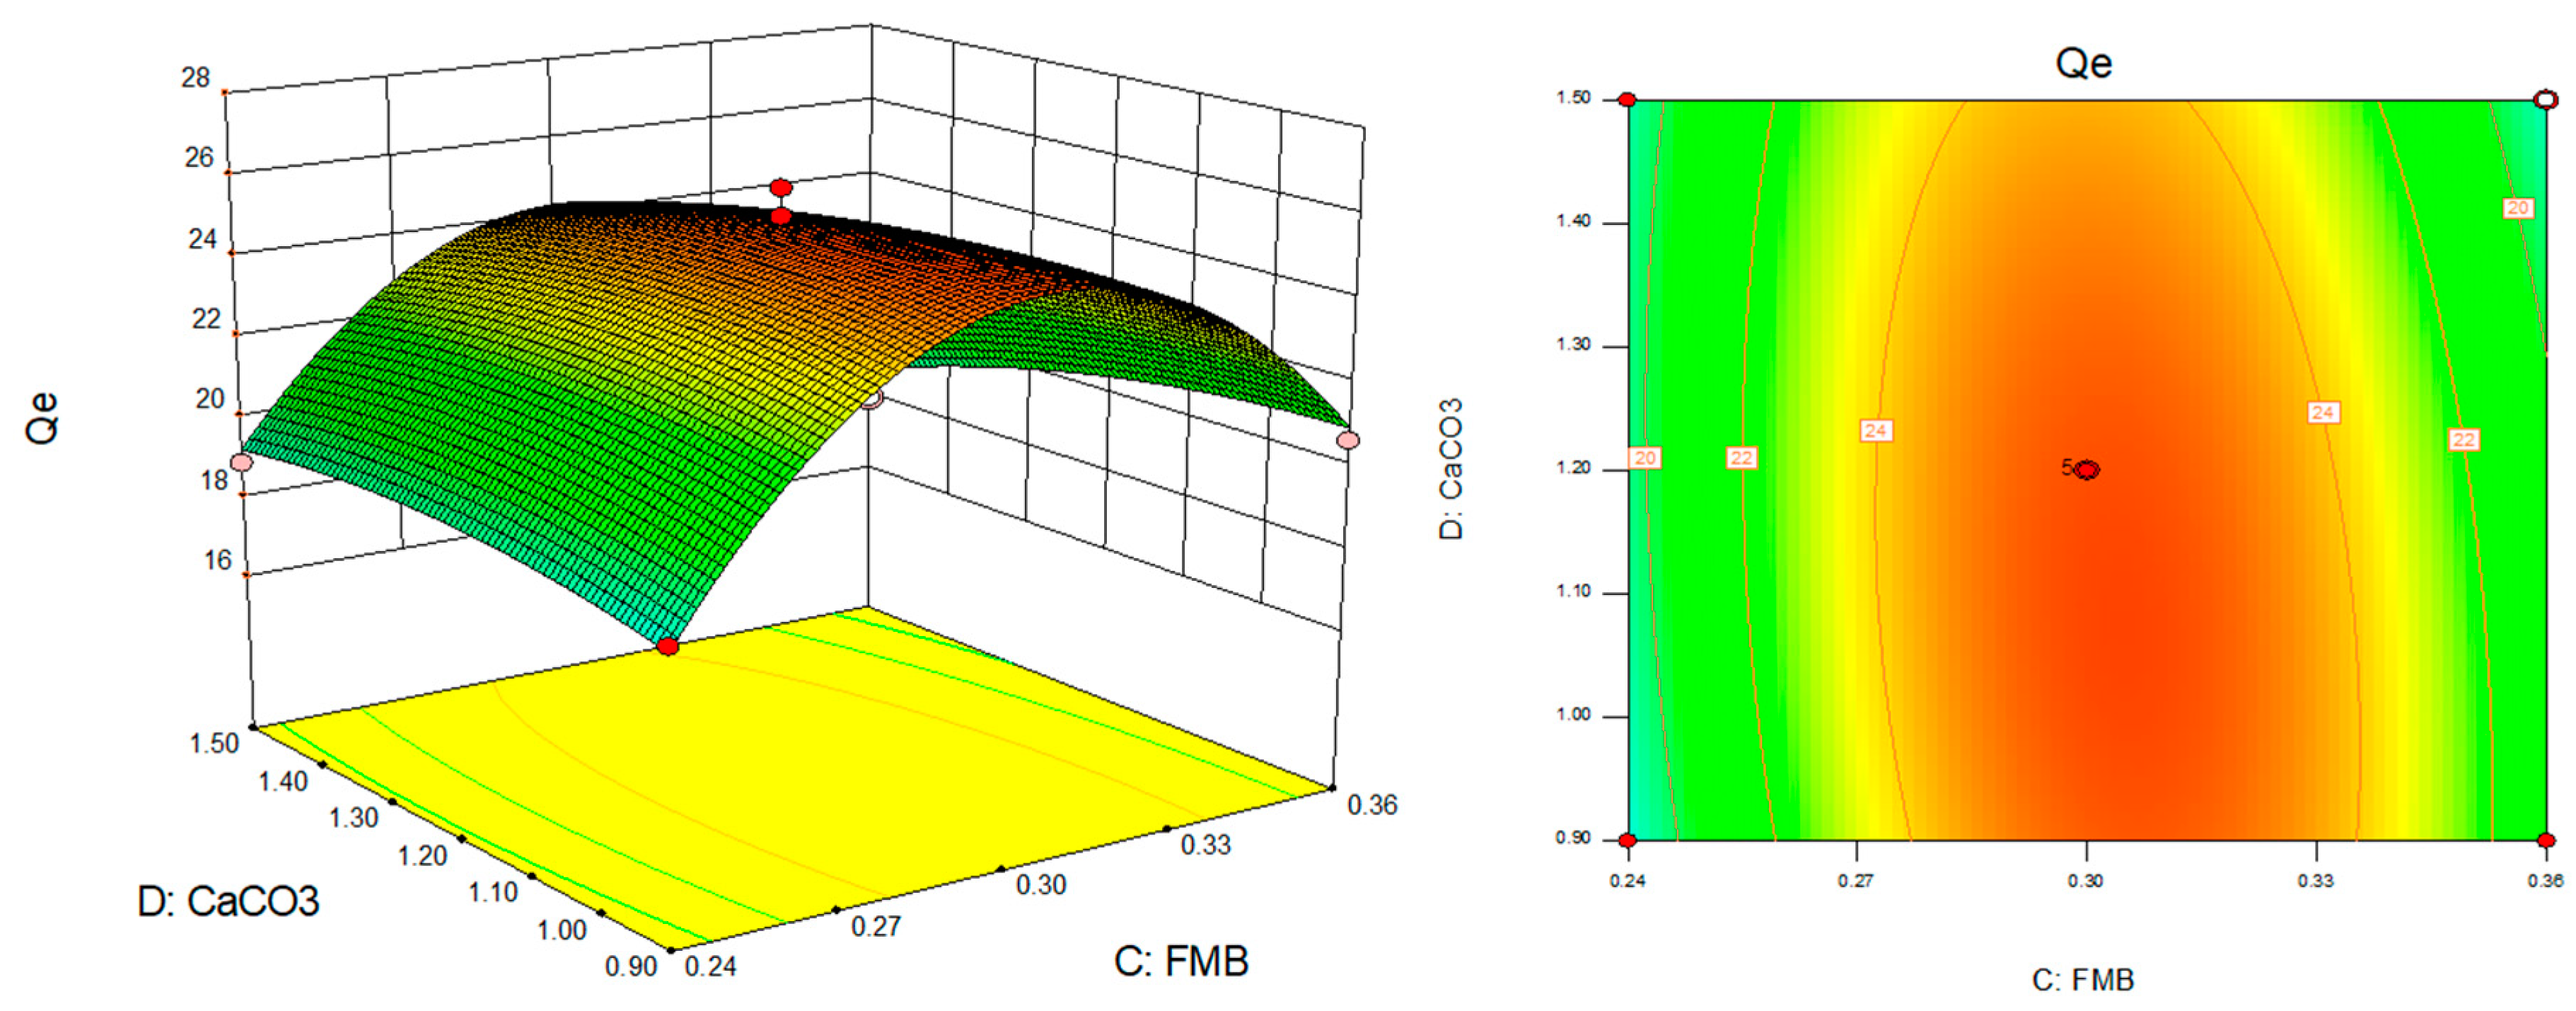
- Optimized model response surface analysis
3.2. Characterization and Principle of the Materials
3.2.1. Analysis of Element Composition
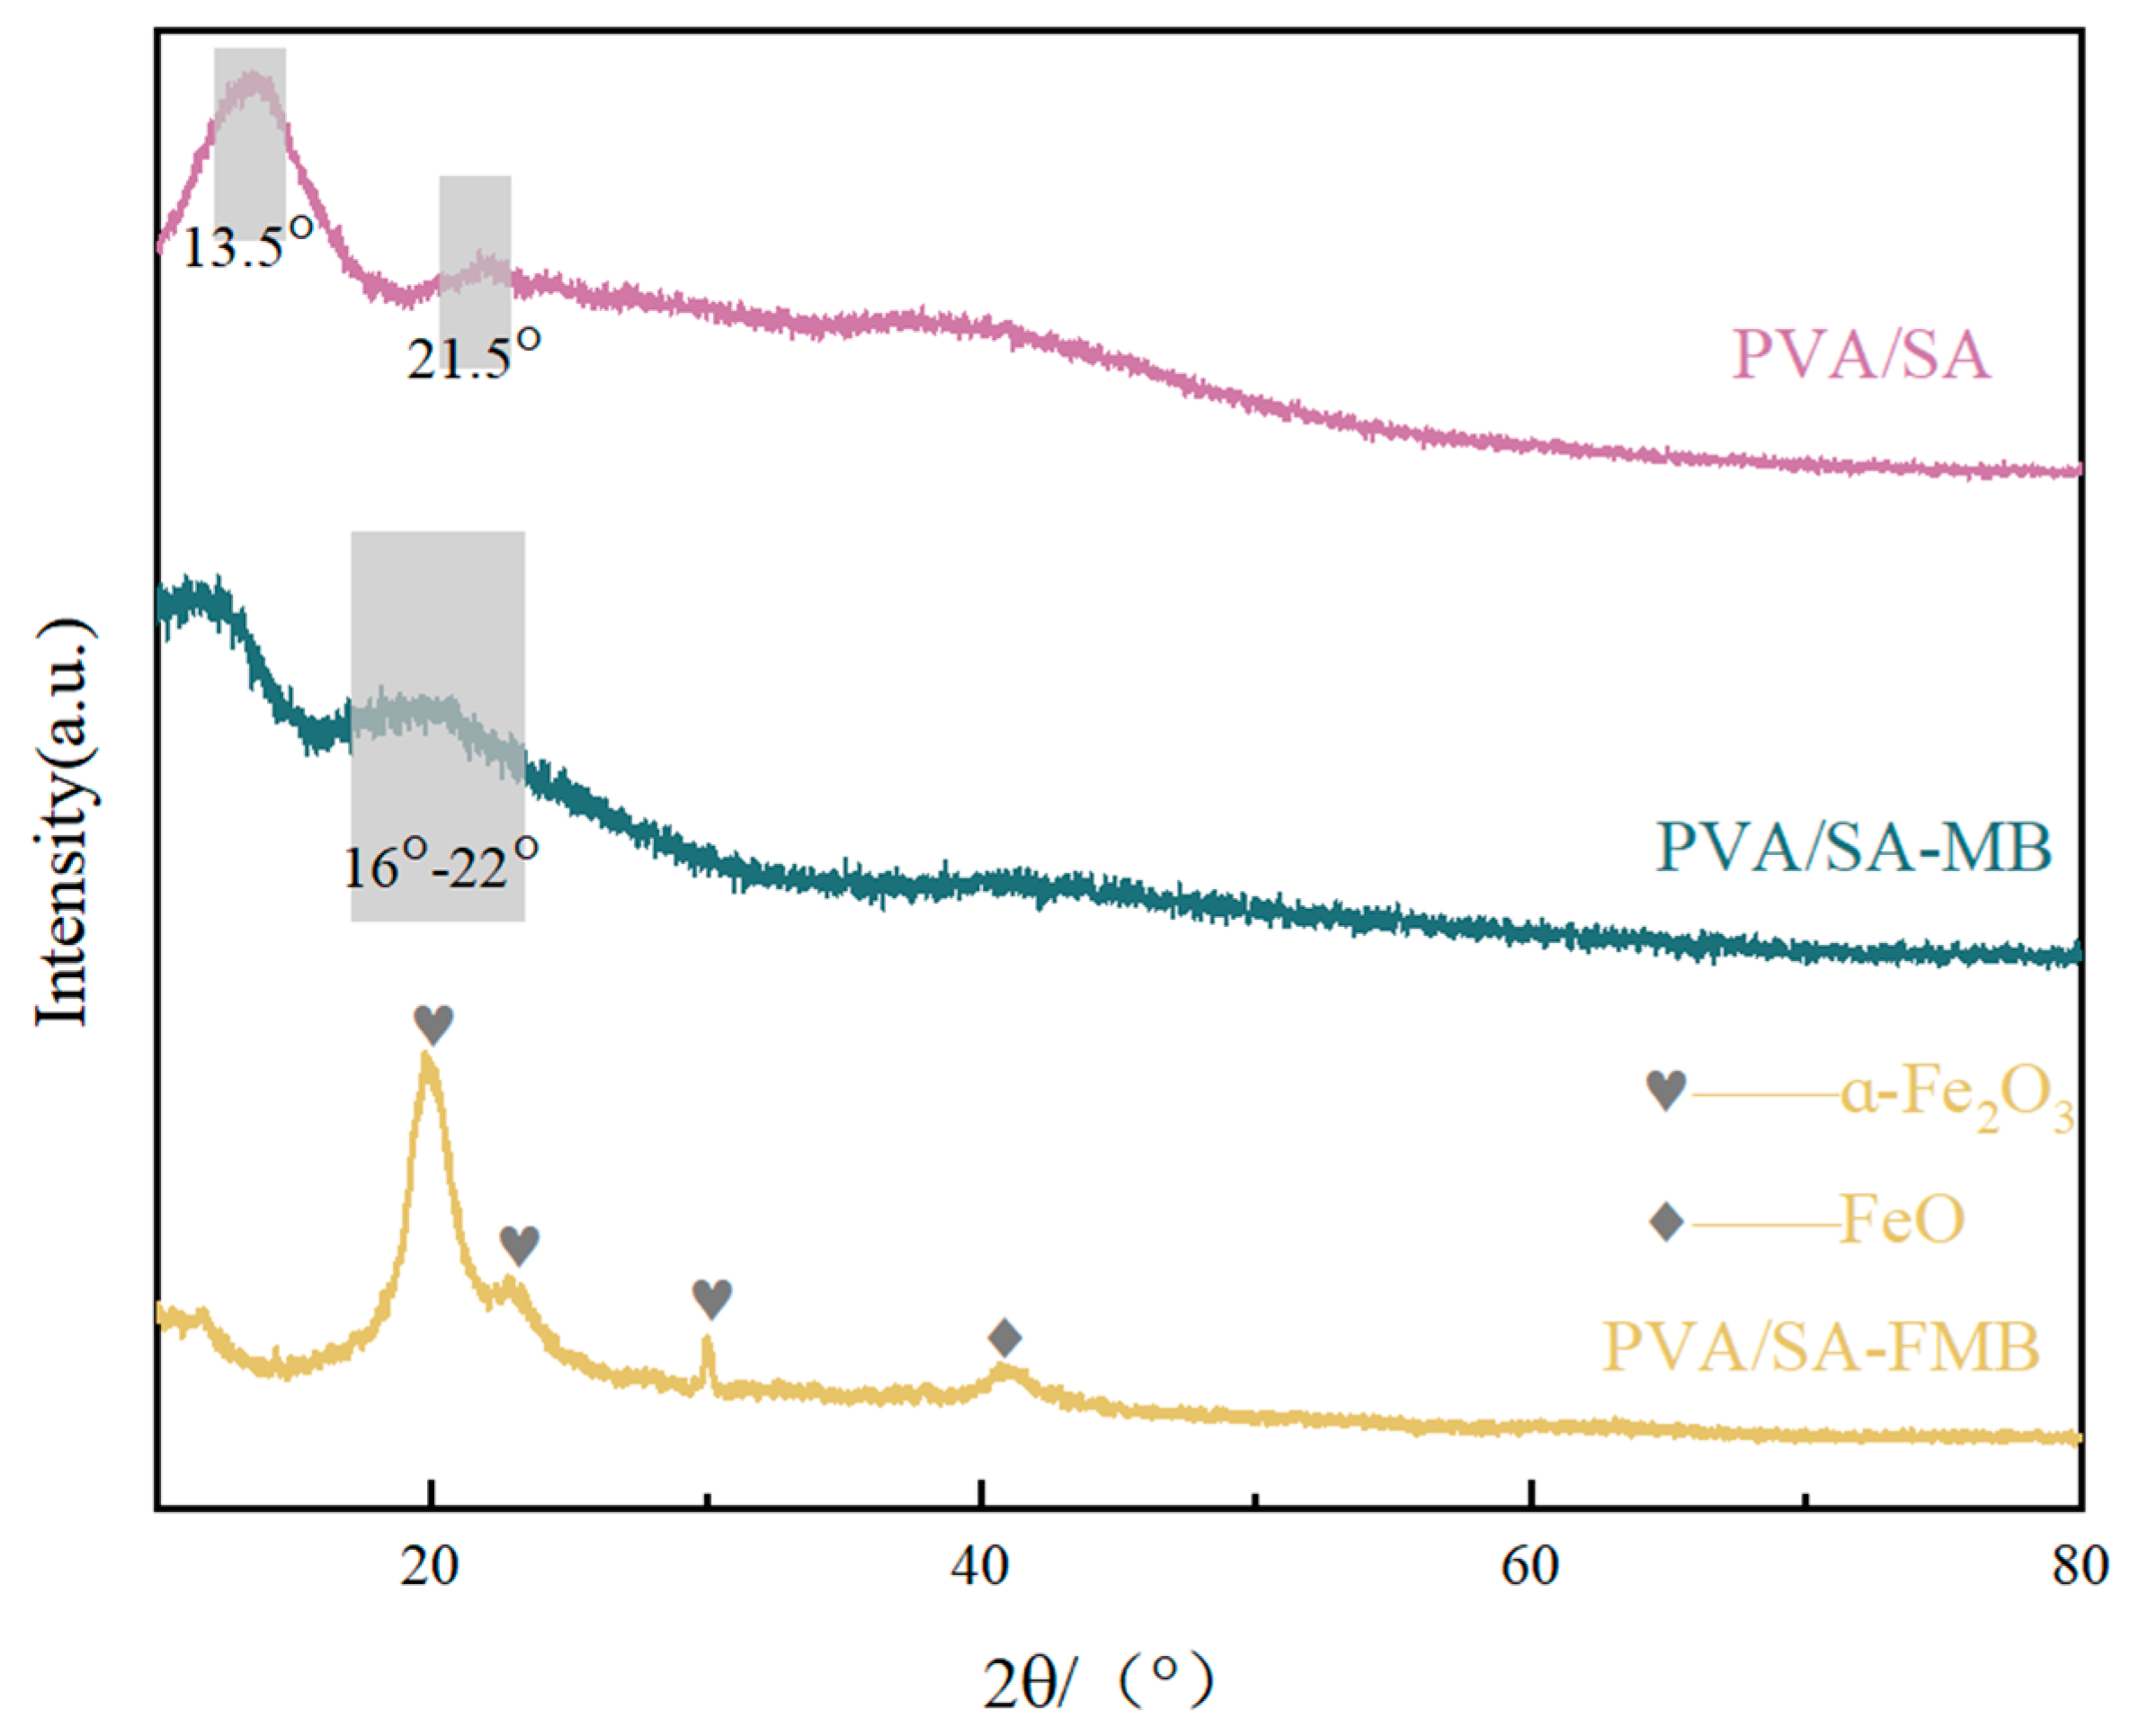
3.2.2. X-ray Diffraction (XRD) Determination
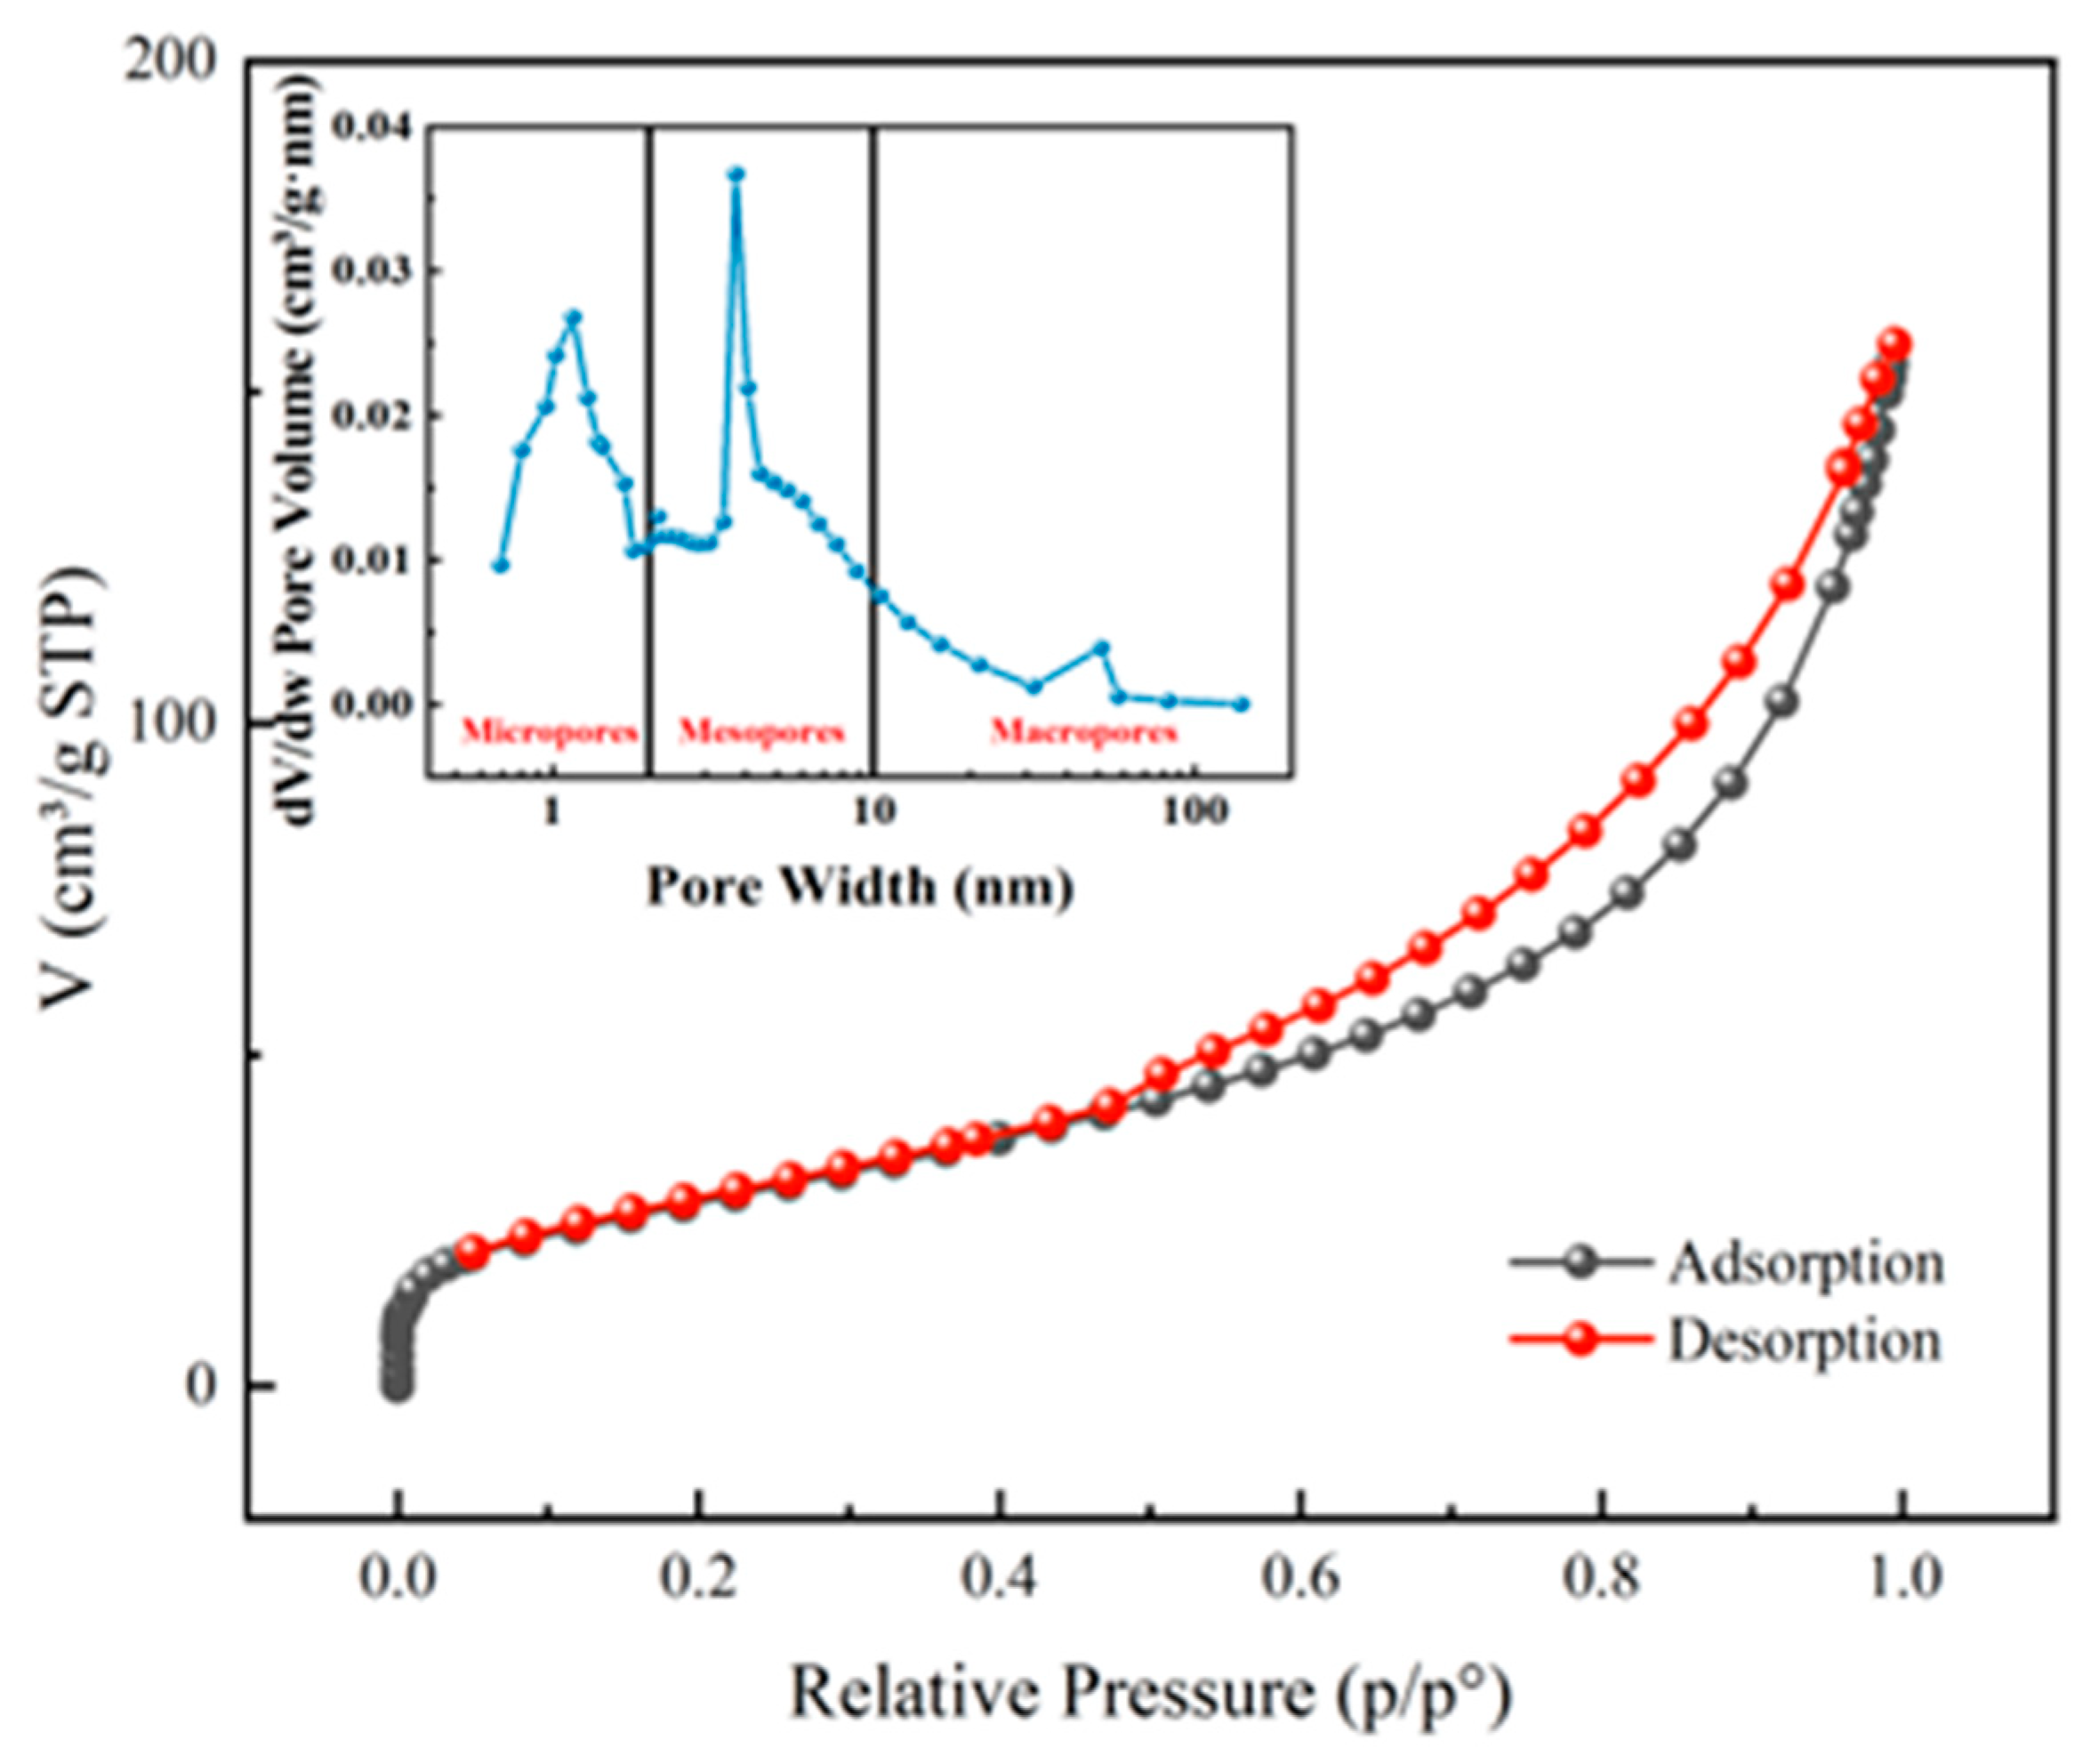
3.2.3. Specific Surface Area (BET) and Pore Size Analysis
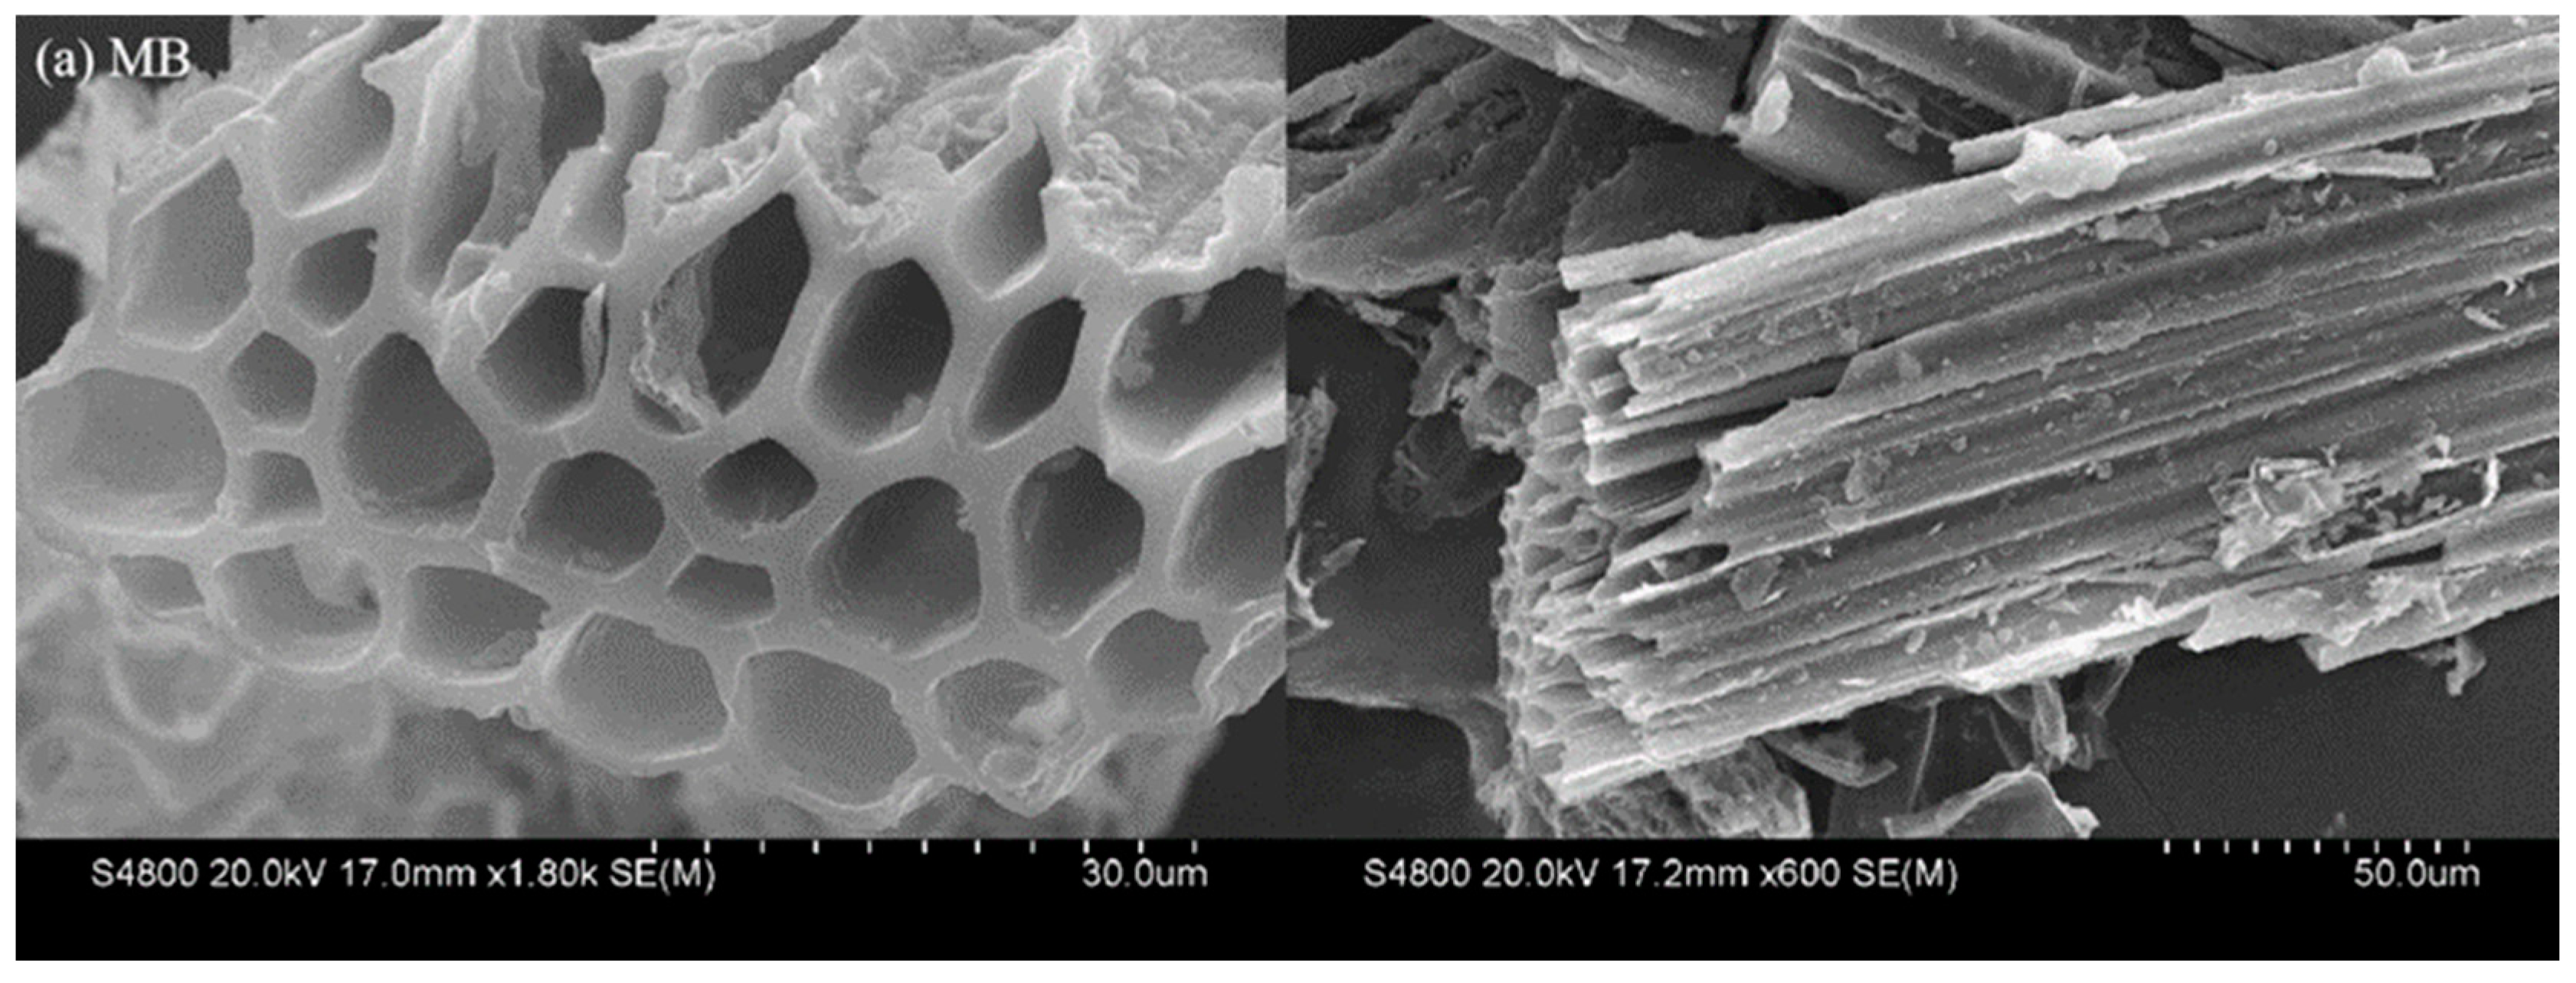
3.2.4. Scanning Electron Microscope (SEM) Determination
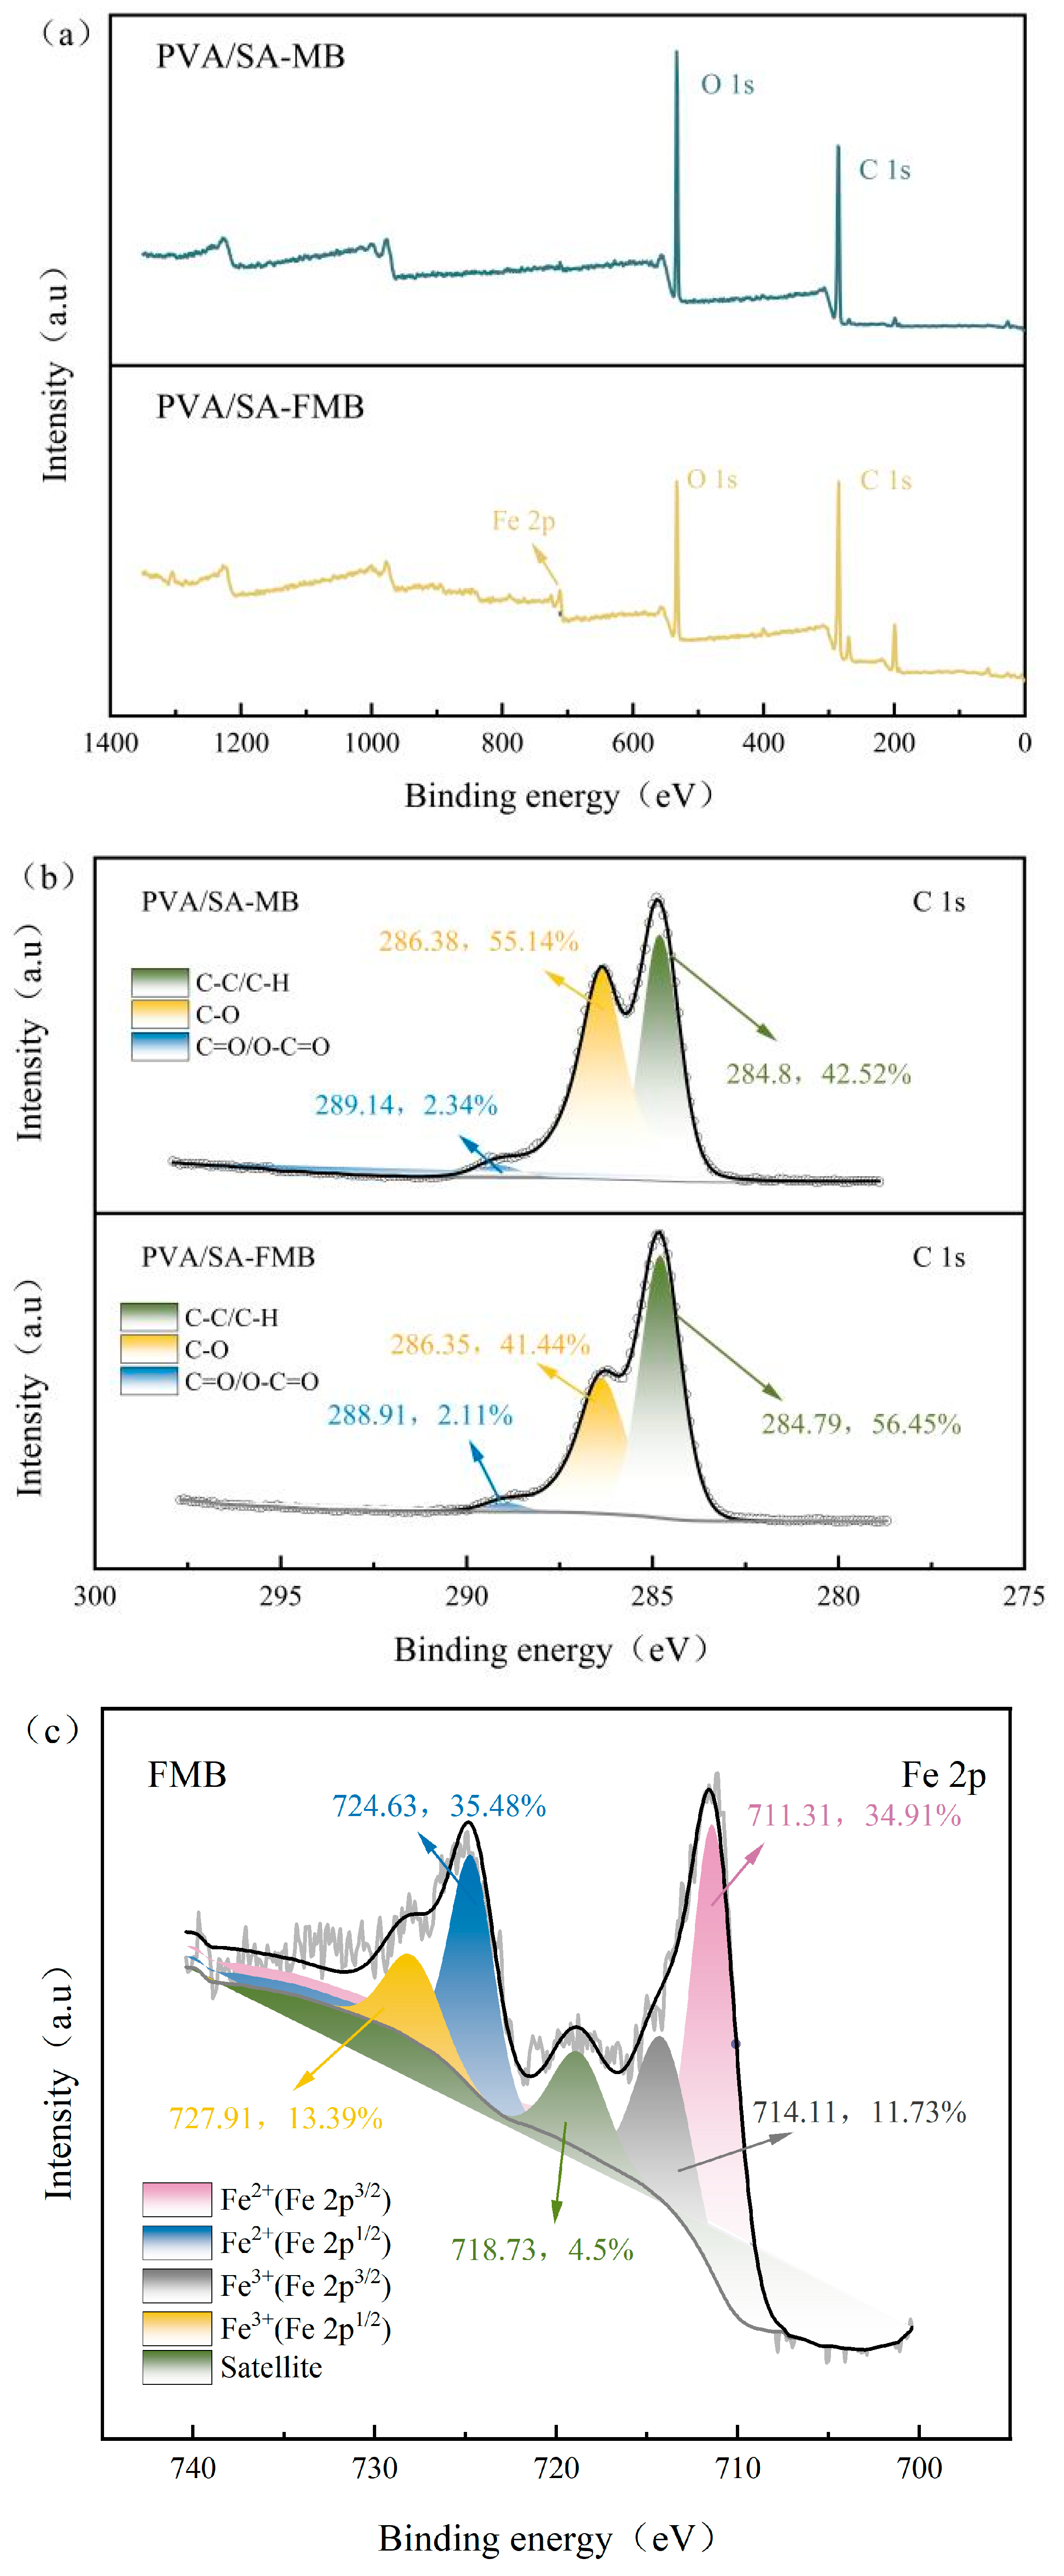
3.2.5. X-ray Photoelectron Spectroscopy (XPS) Determination
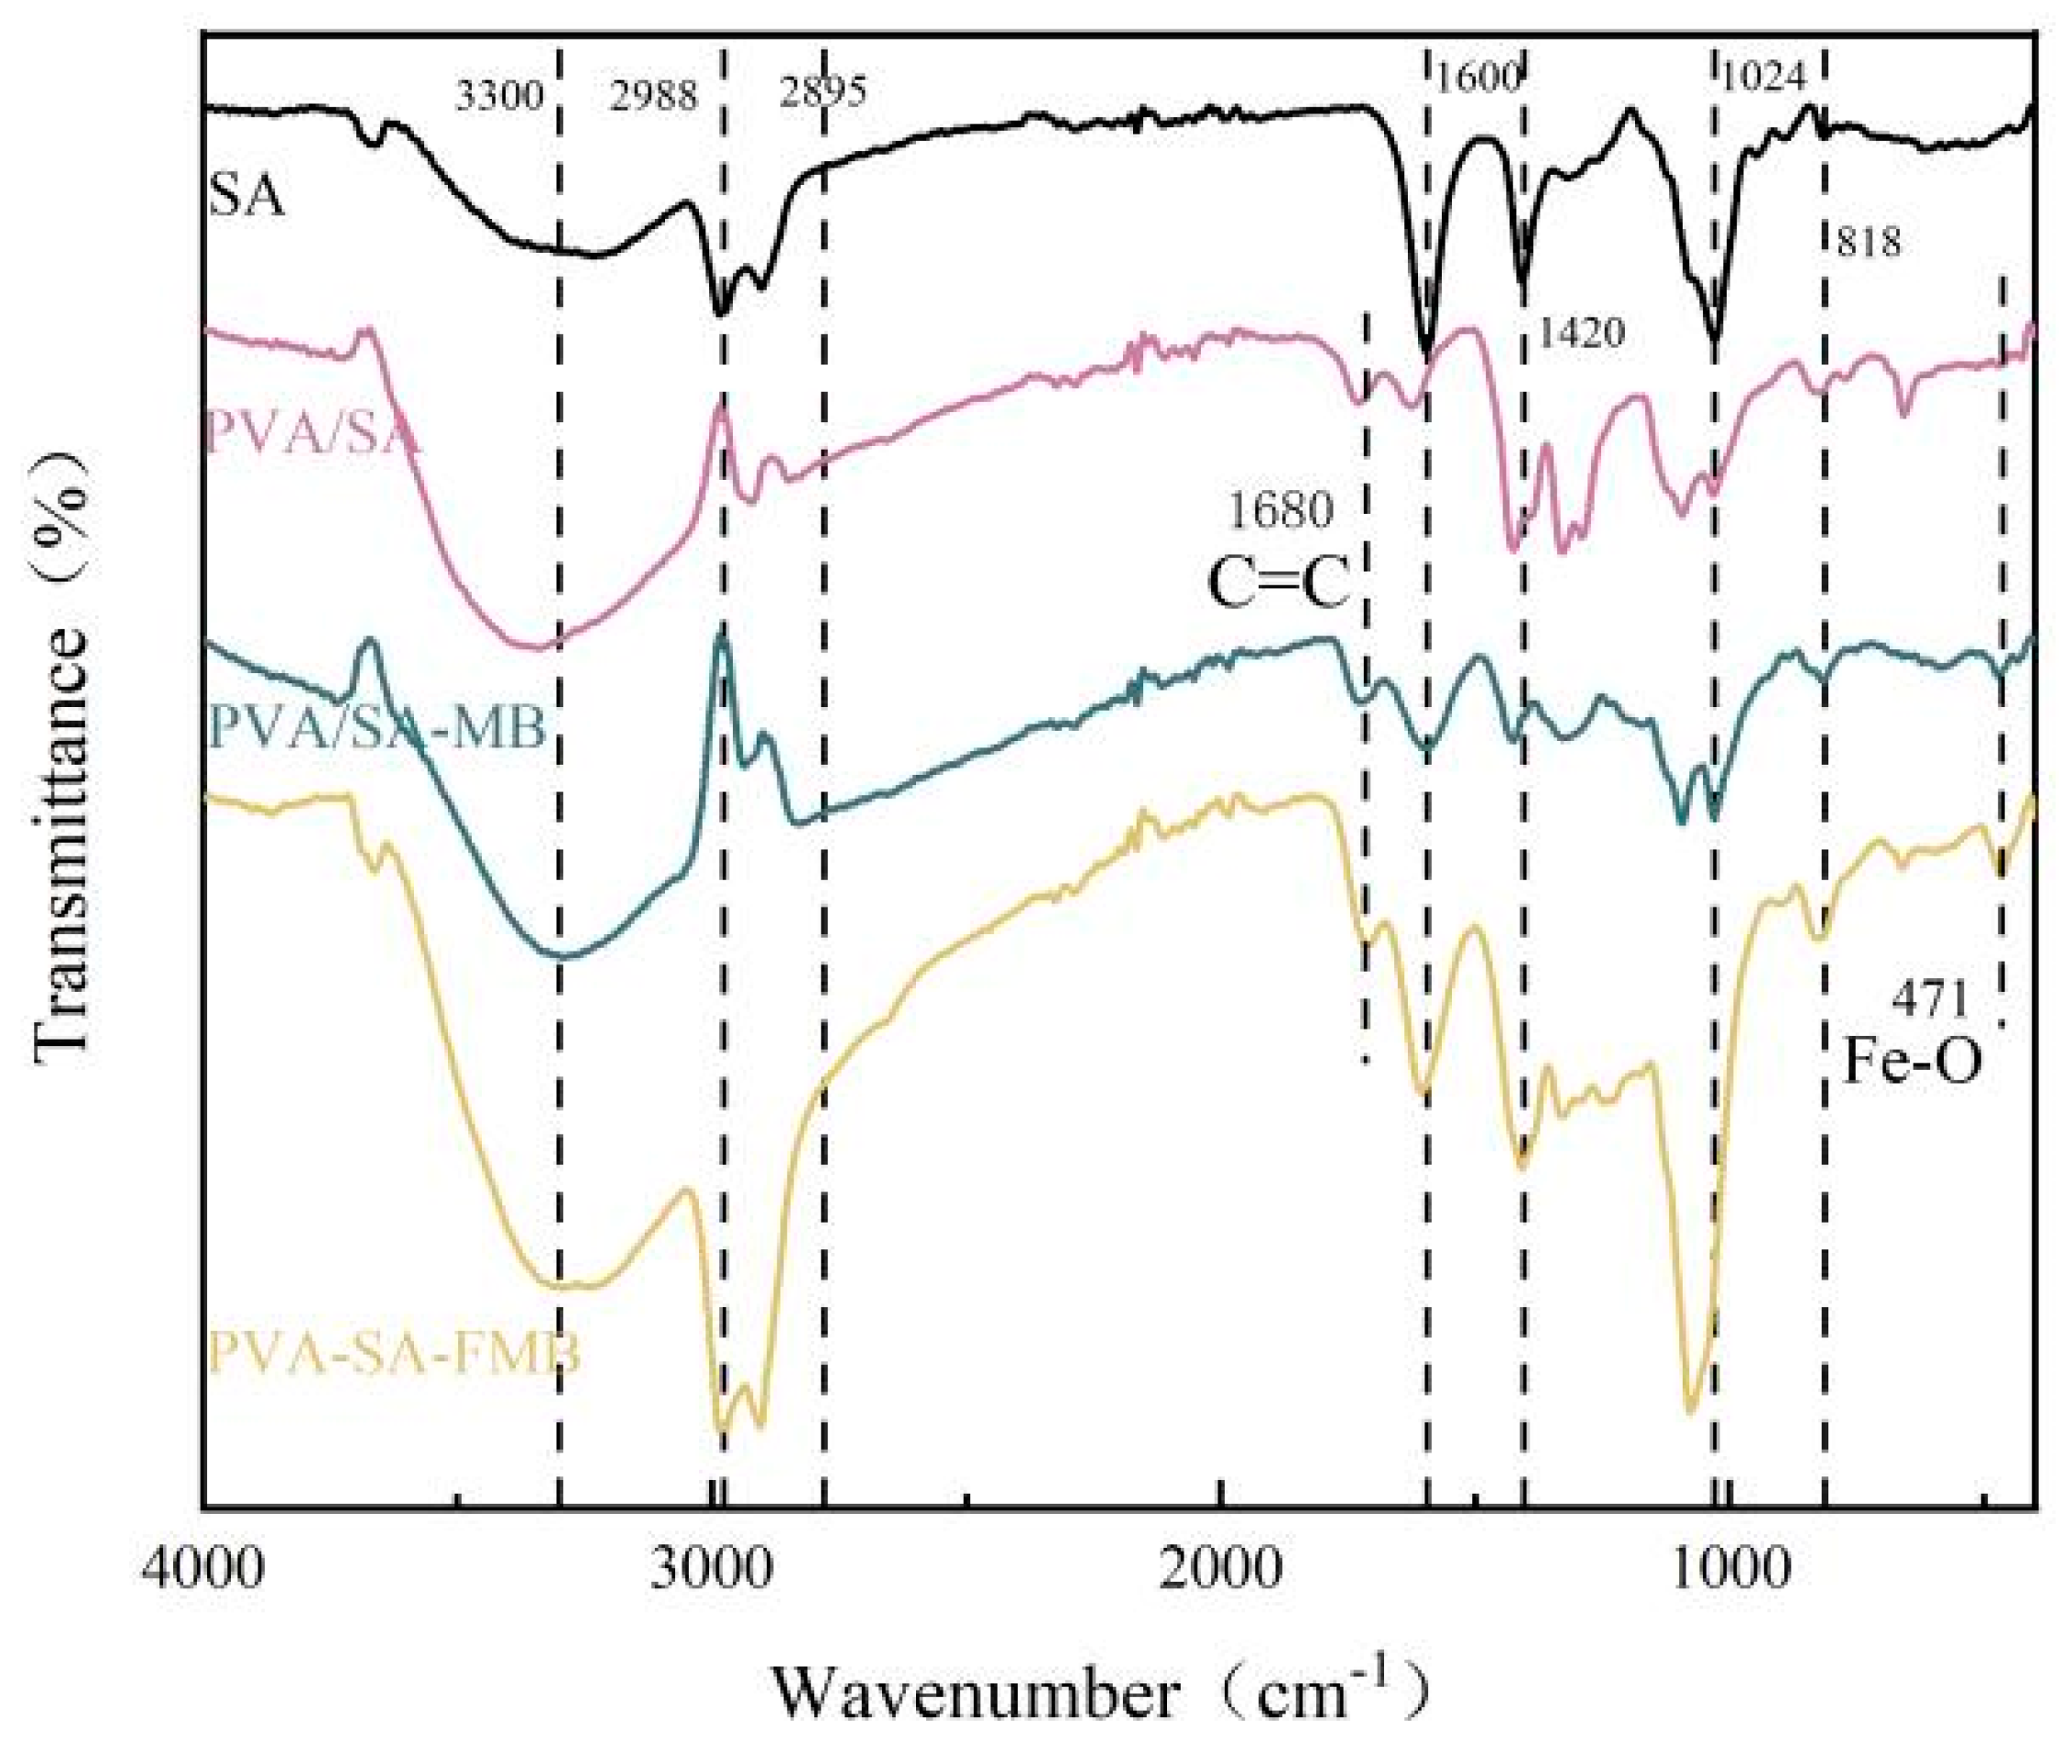
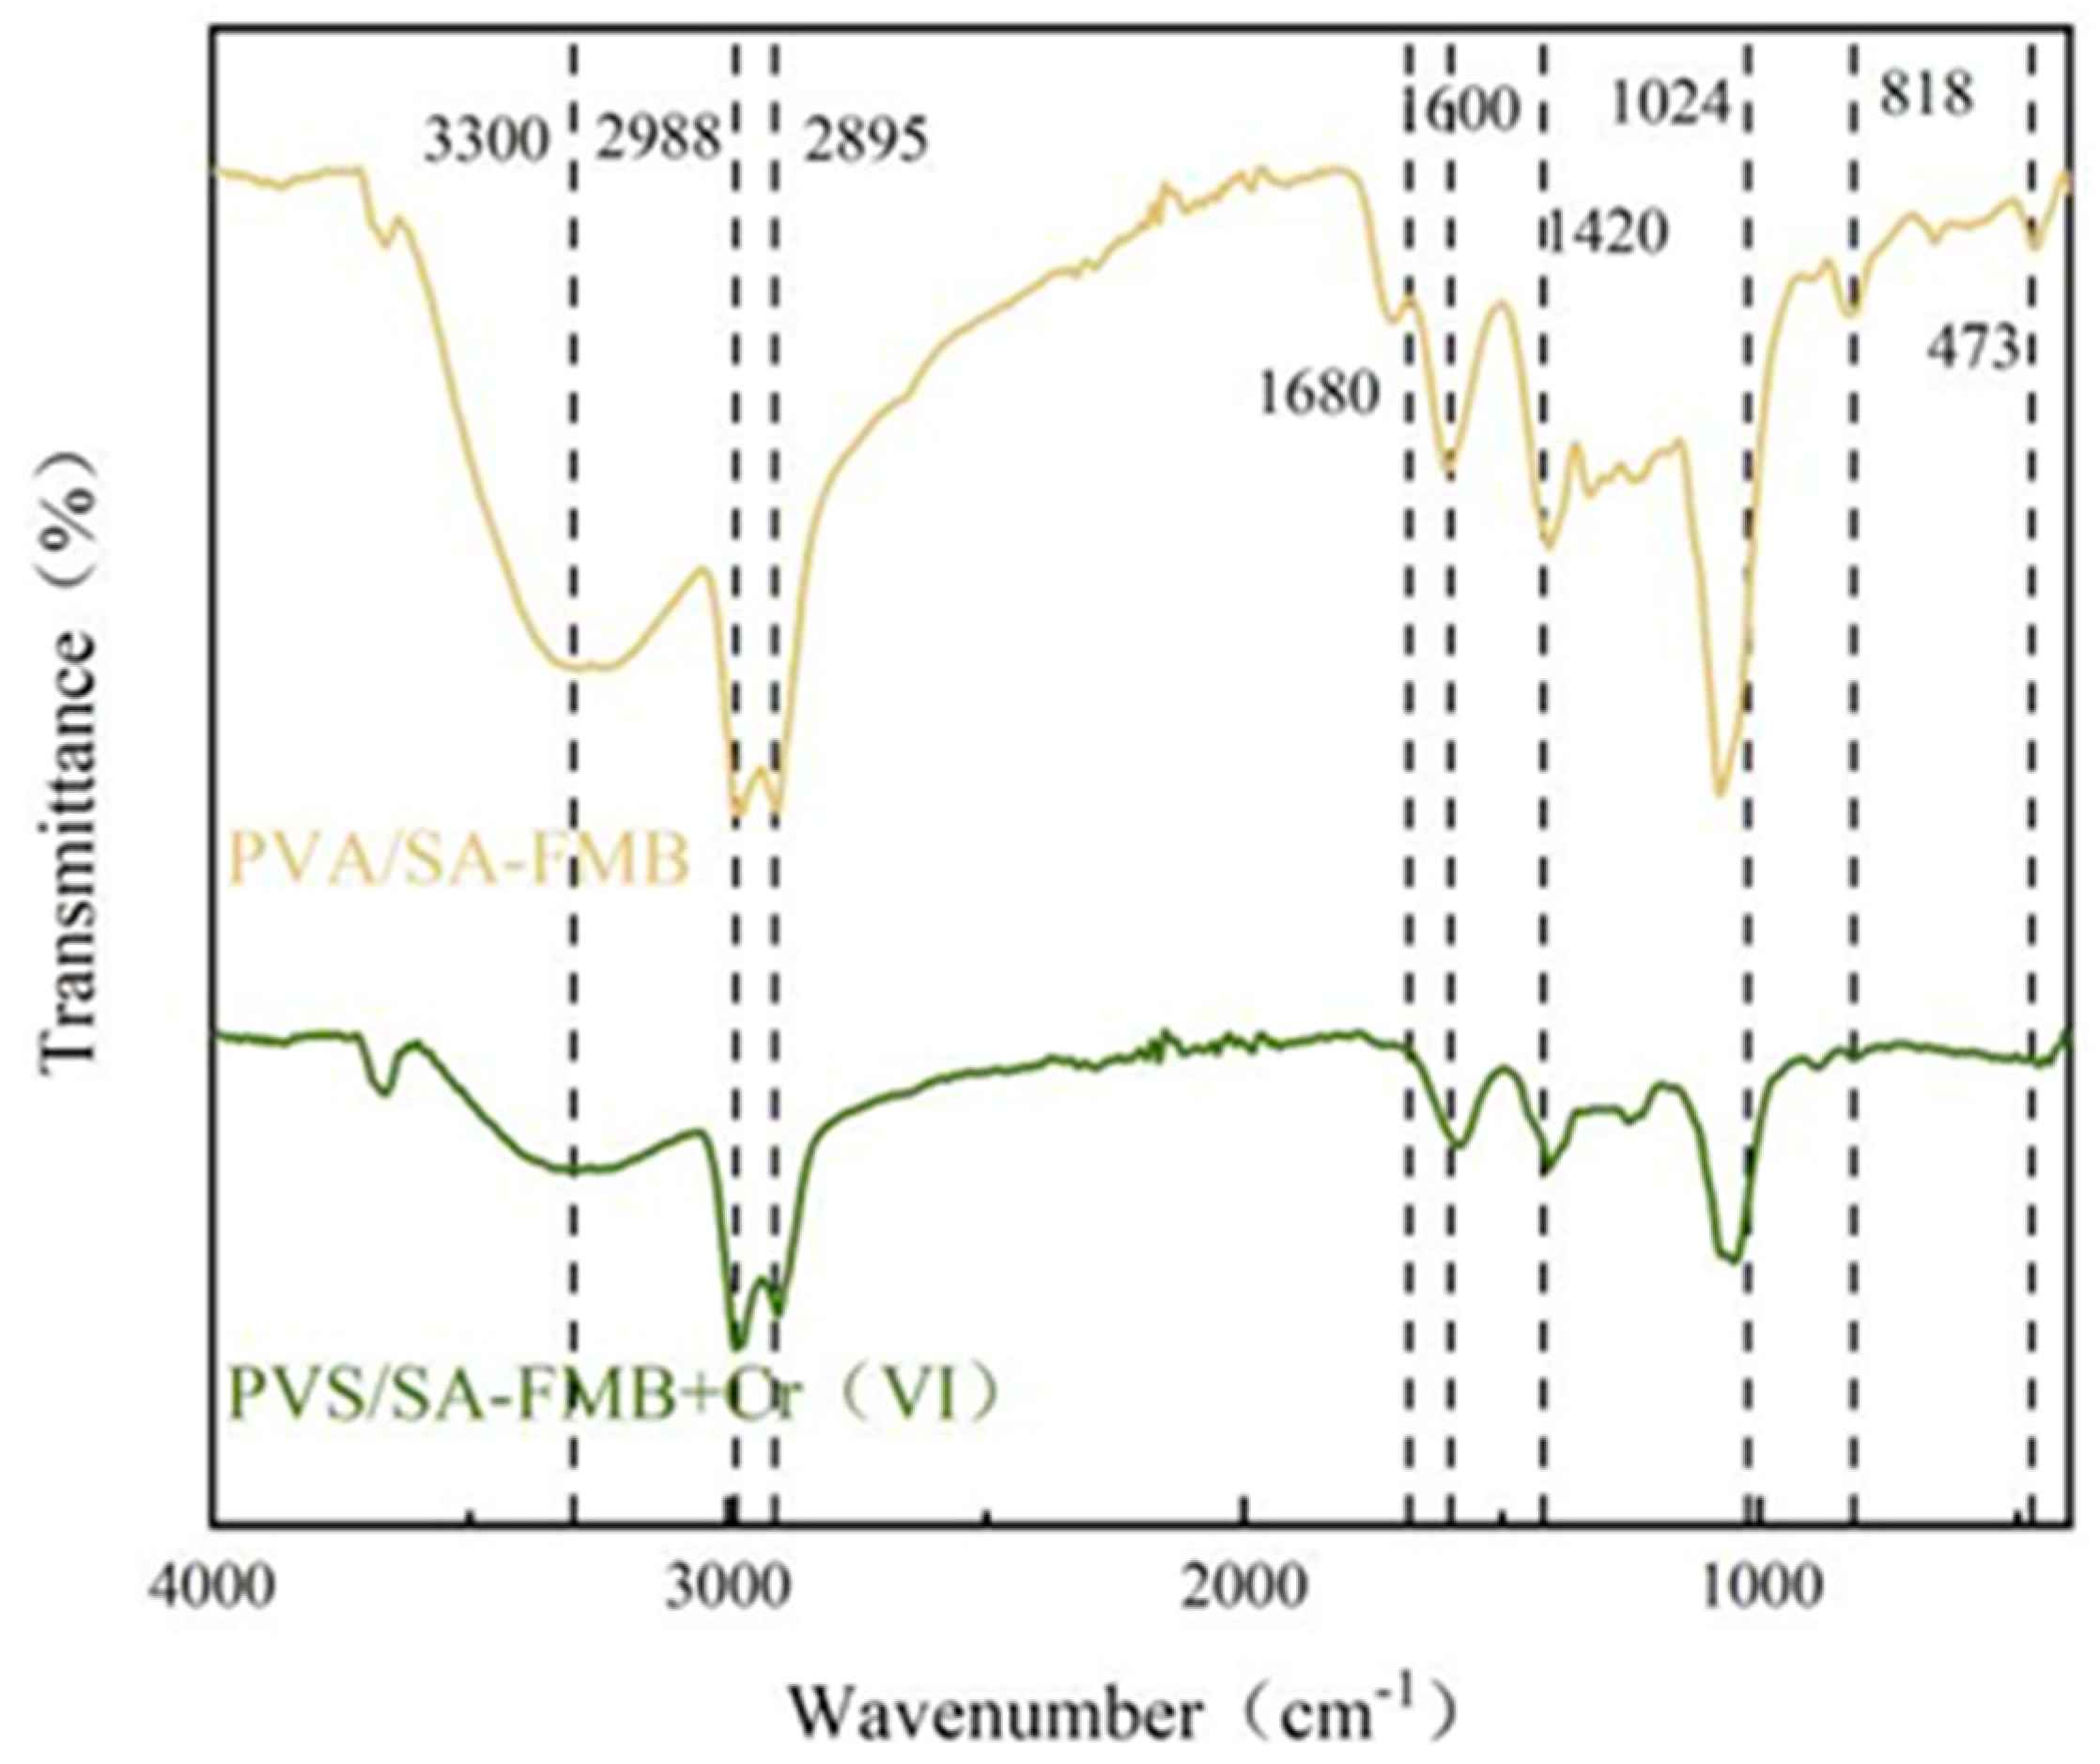
3.2.6. Fourier Transform Infrared Spectroscopy (FTIR) Determination
3.3. Evaluation of Adsorption Properties
3.3.1. Adsorption Single Factor Experiment
- Initial concentration
- 2.
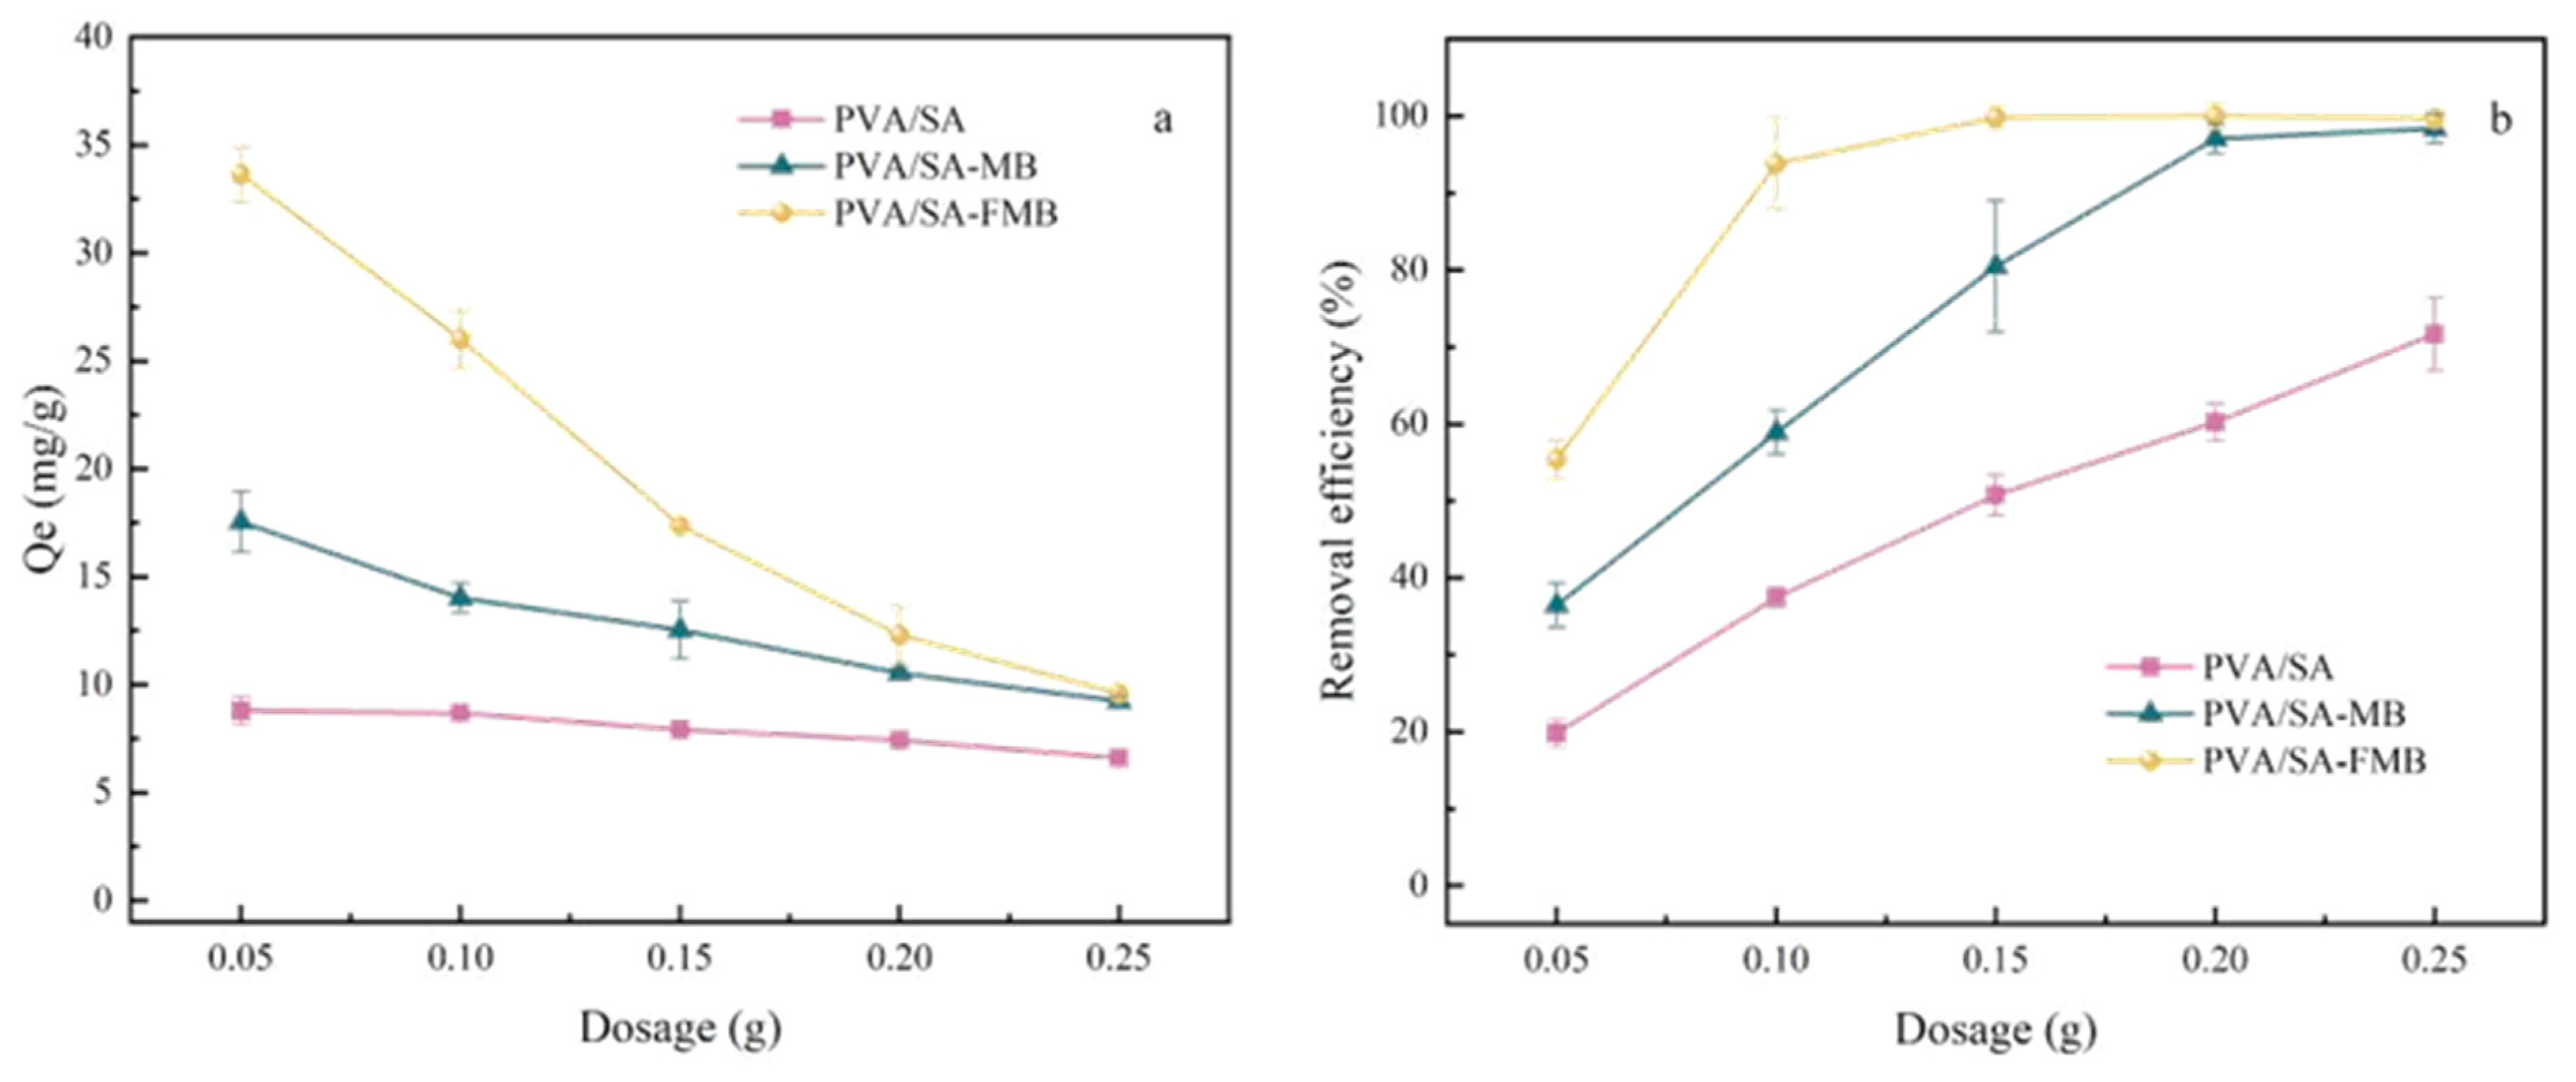
- Dosage
- 3.
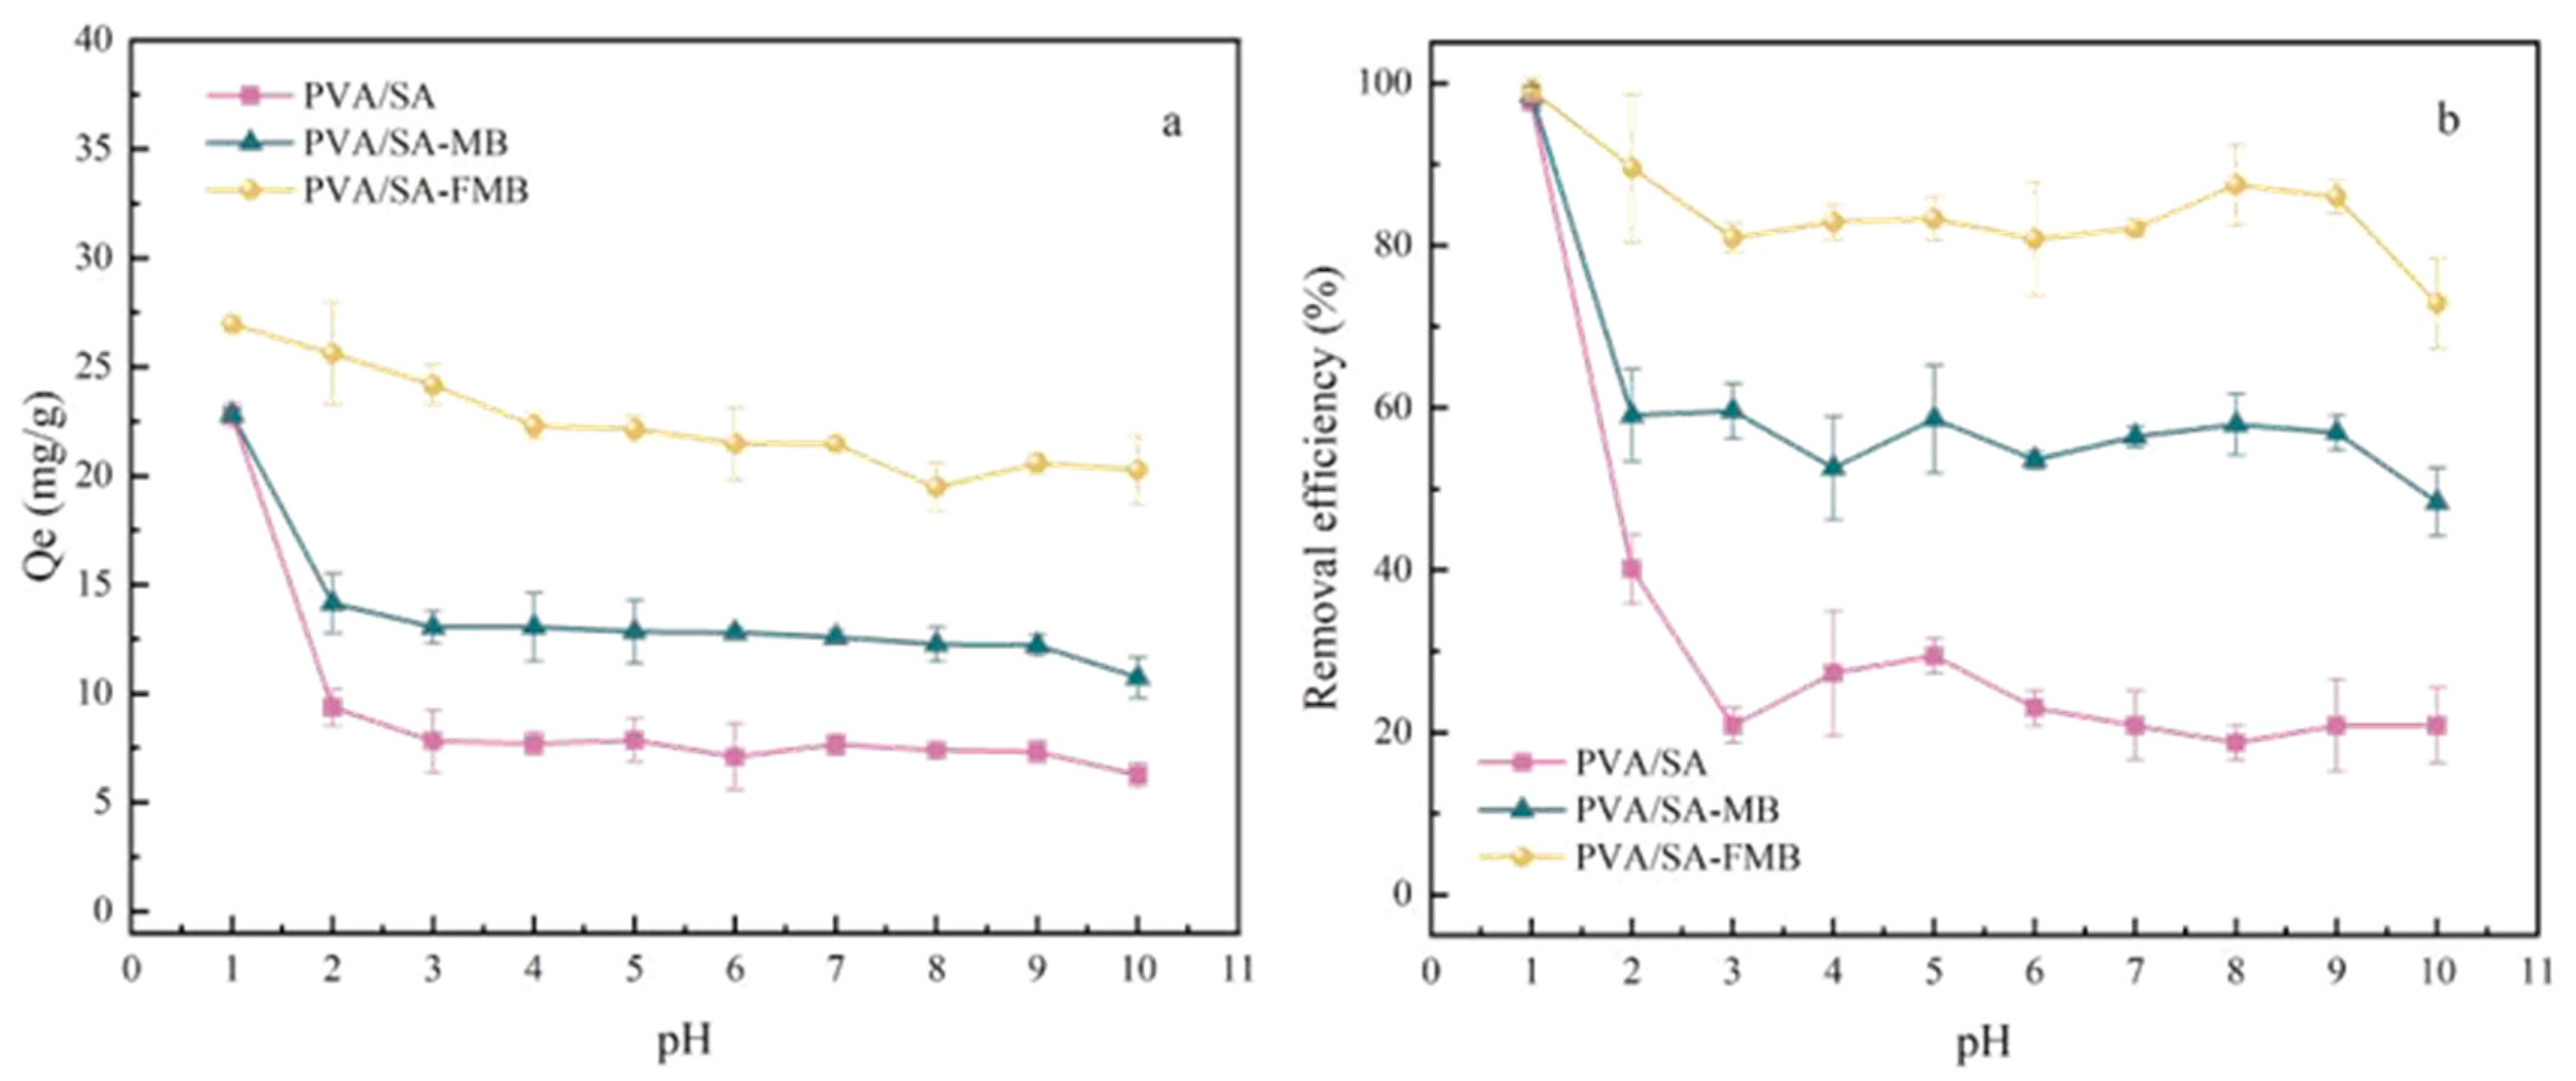
- pH
3.3.2. Adsorption Kinetics Experiment
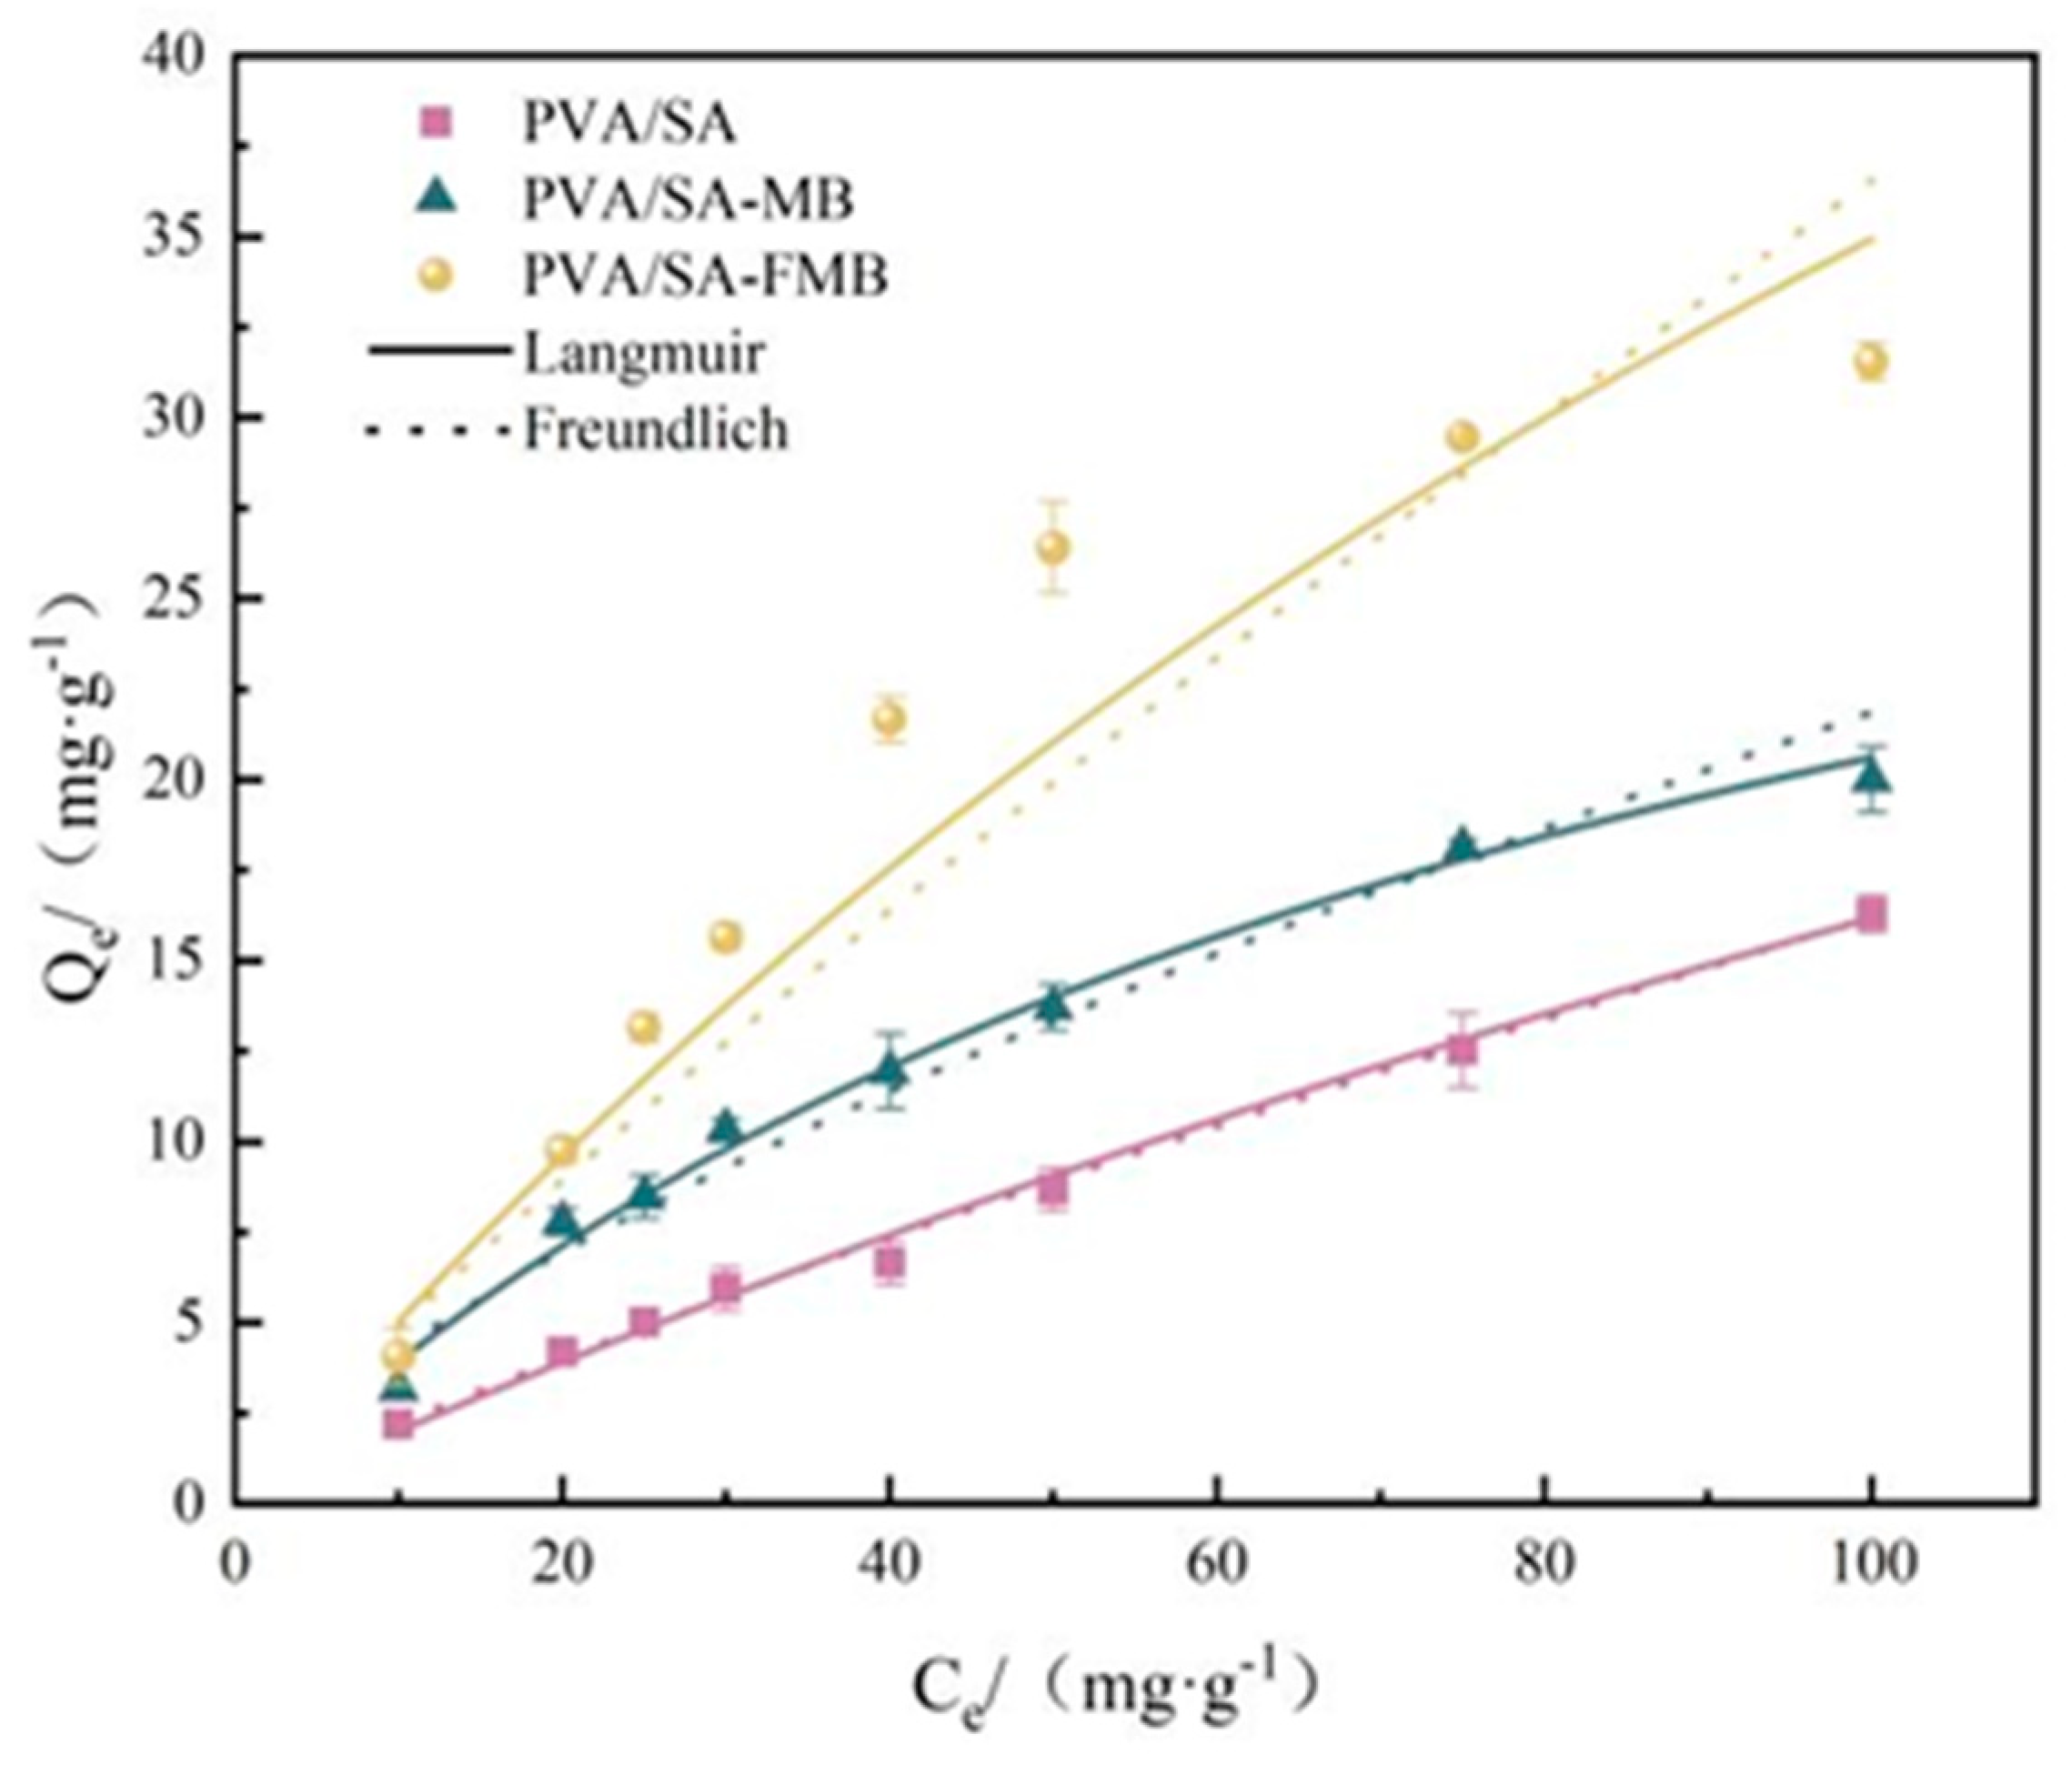
3.3.3. Isothermal Adsorption Experiment
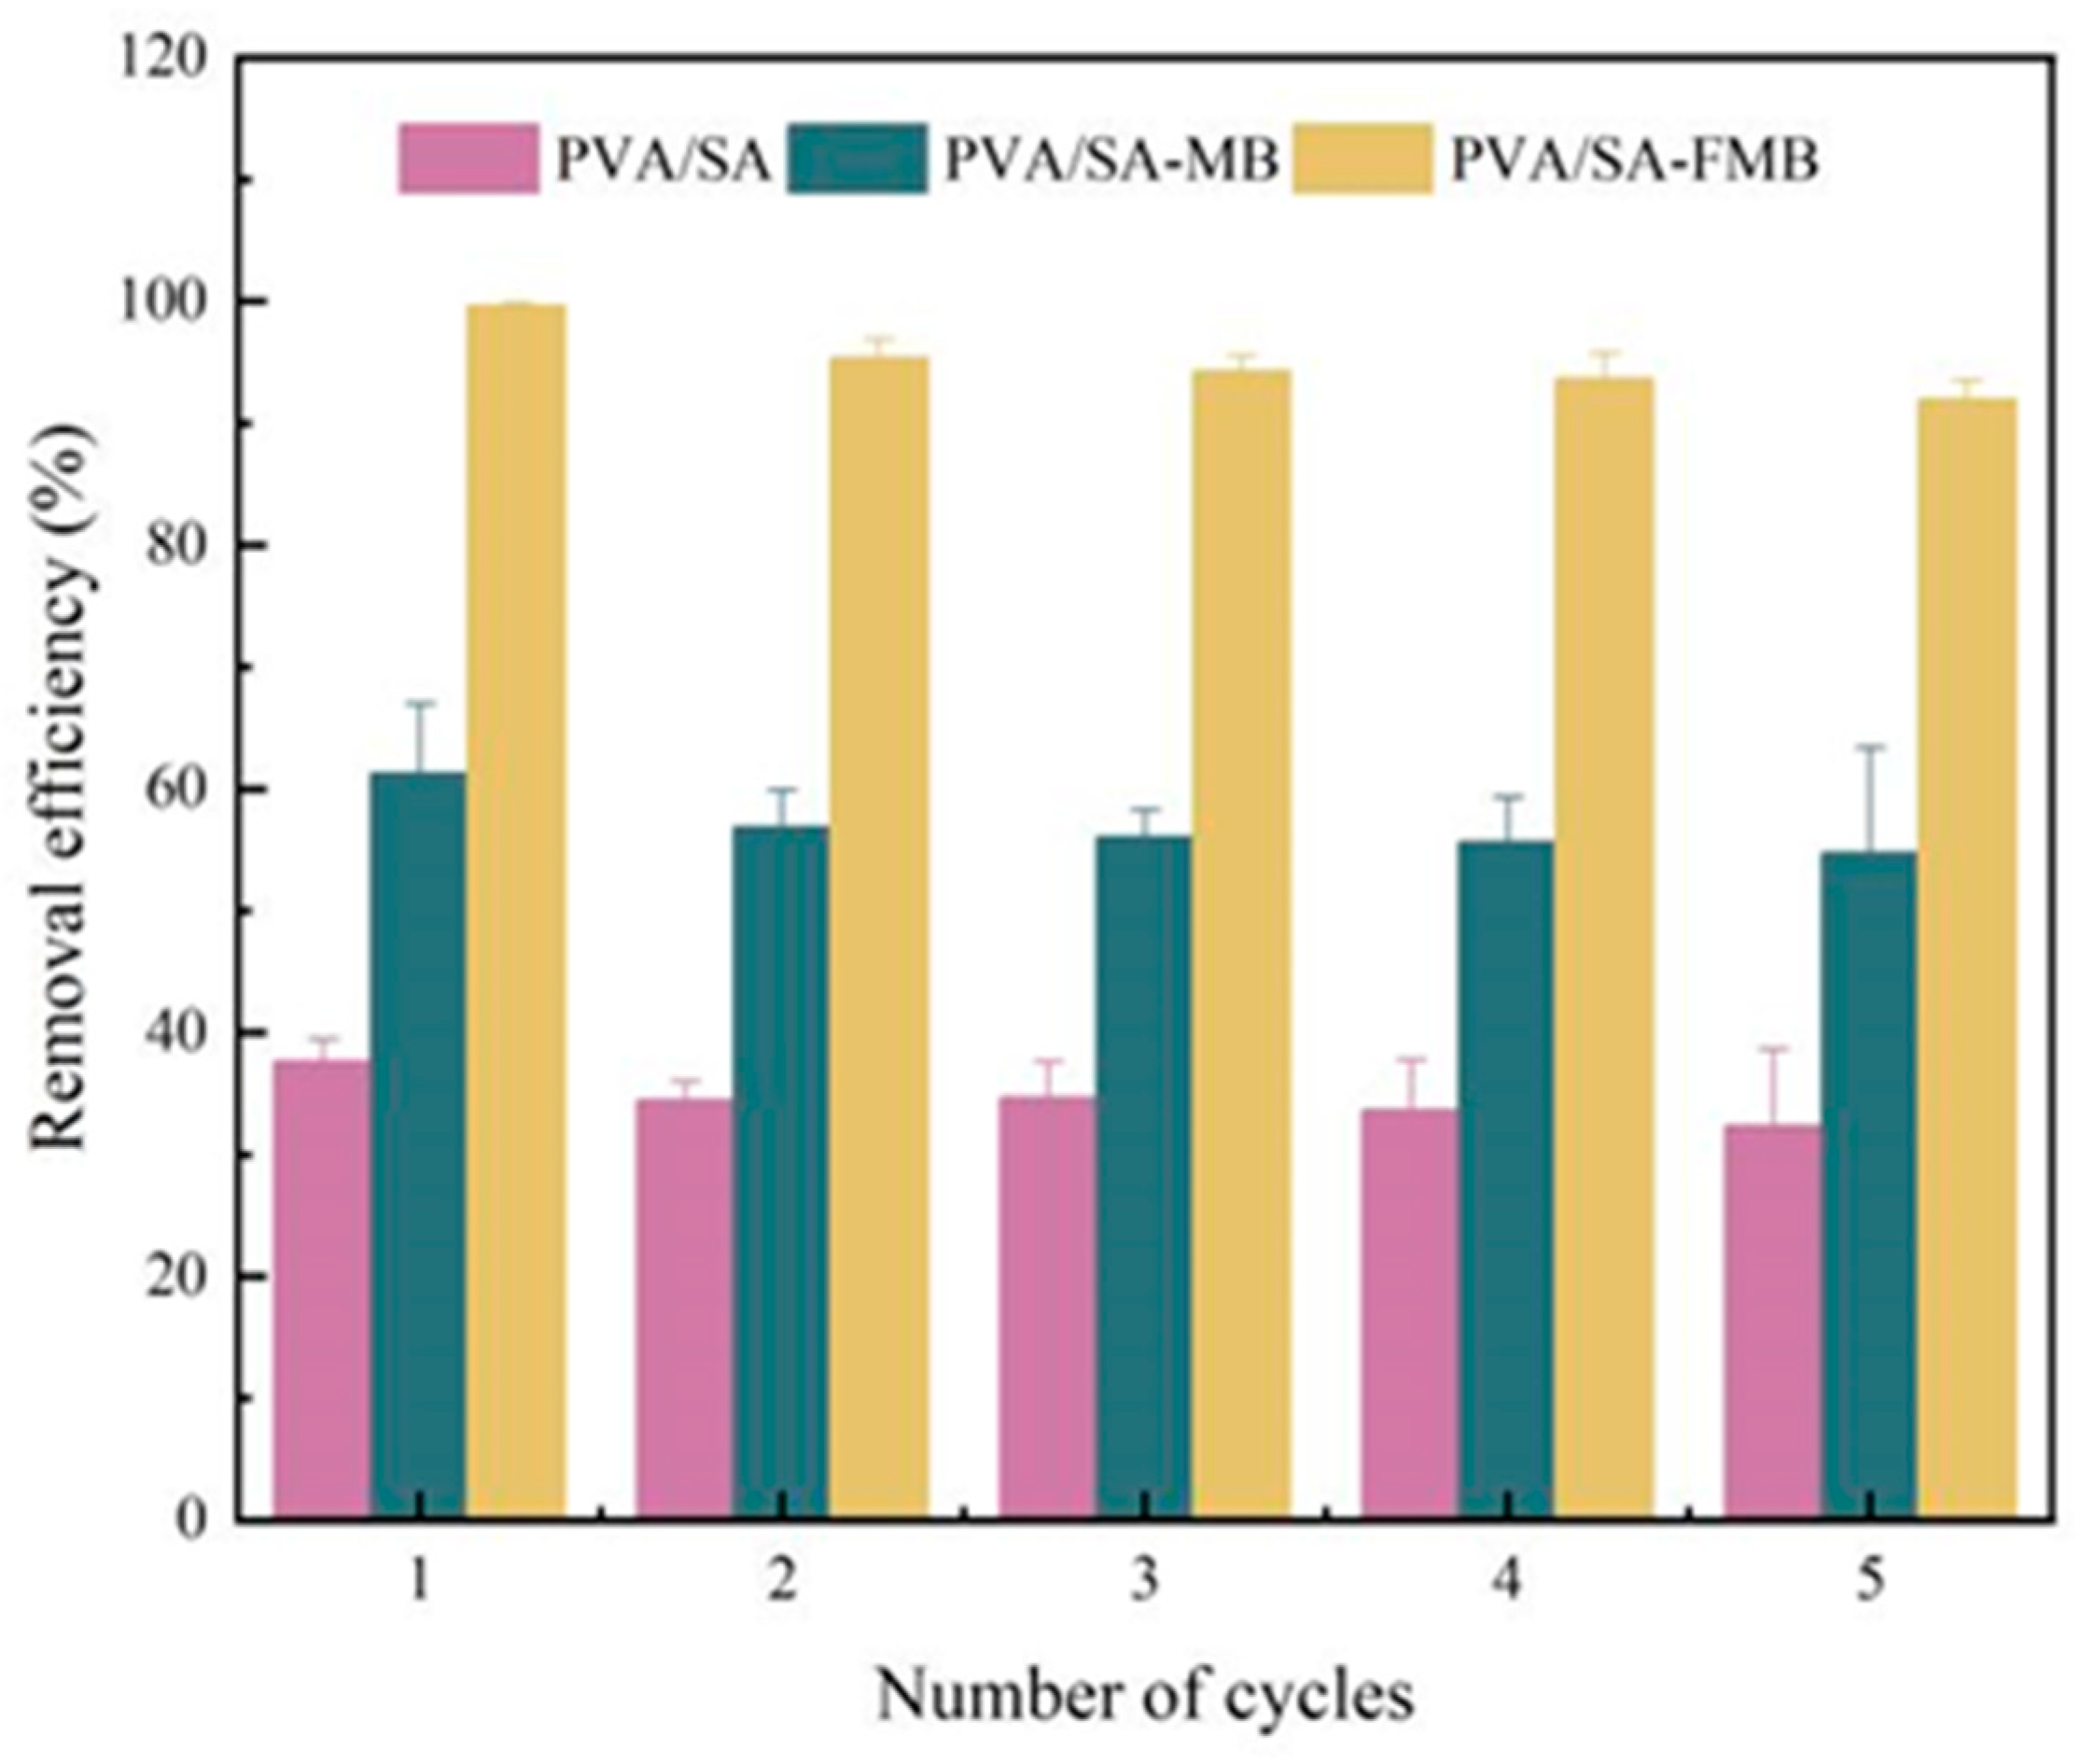
3.3.4. Adsorption Cycle Regeneration Experiment
3.4. Exploration of Adsorption Mechanism
3.4.1. Electrostatic Adsorption
3.4.2. FTIR Analysis after Cr(VI) Adsorption
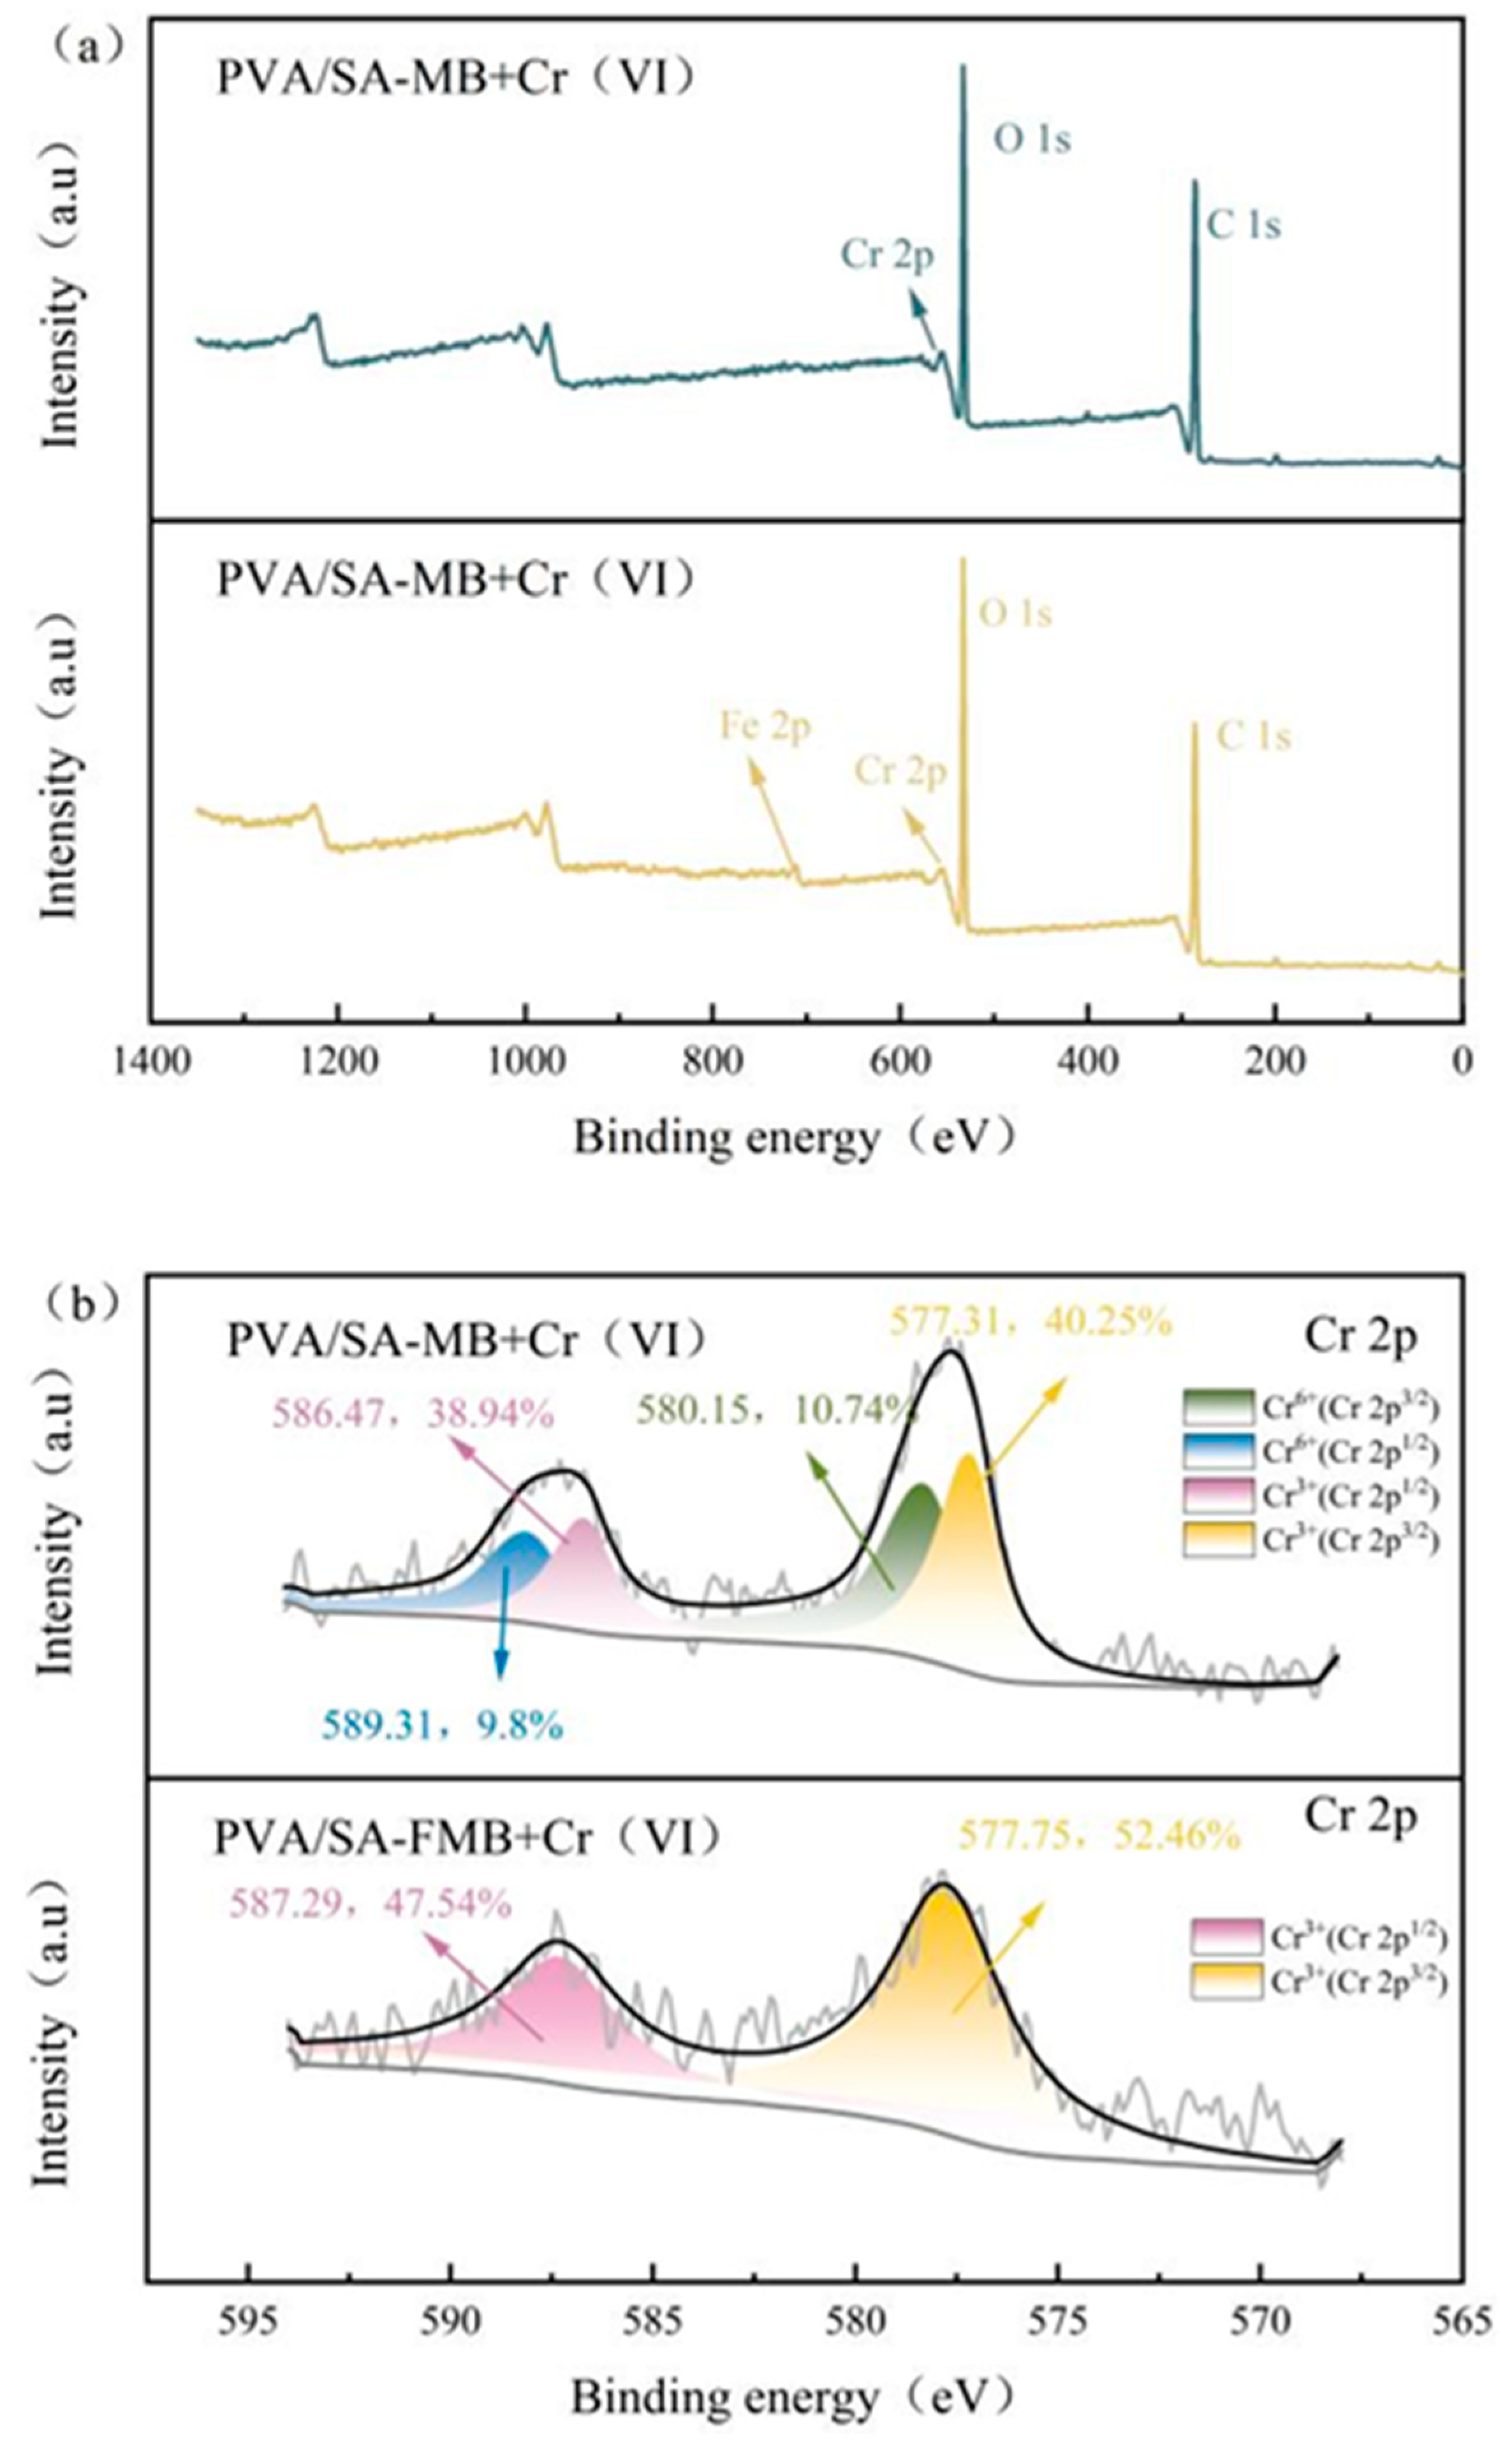
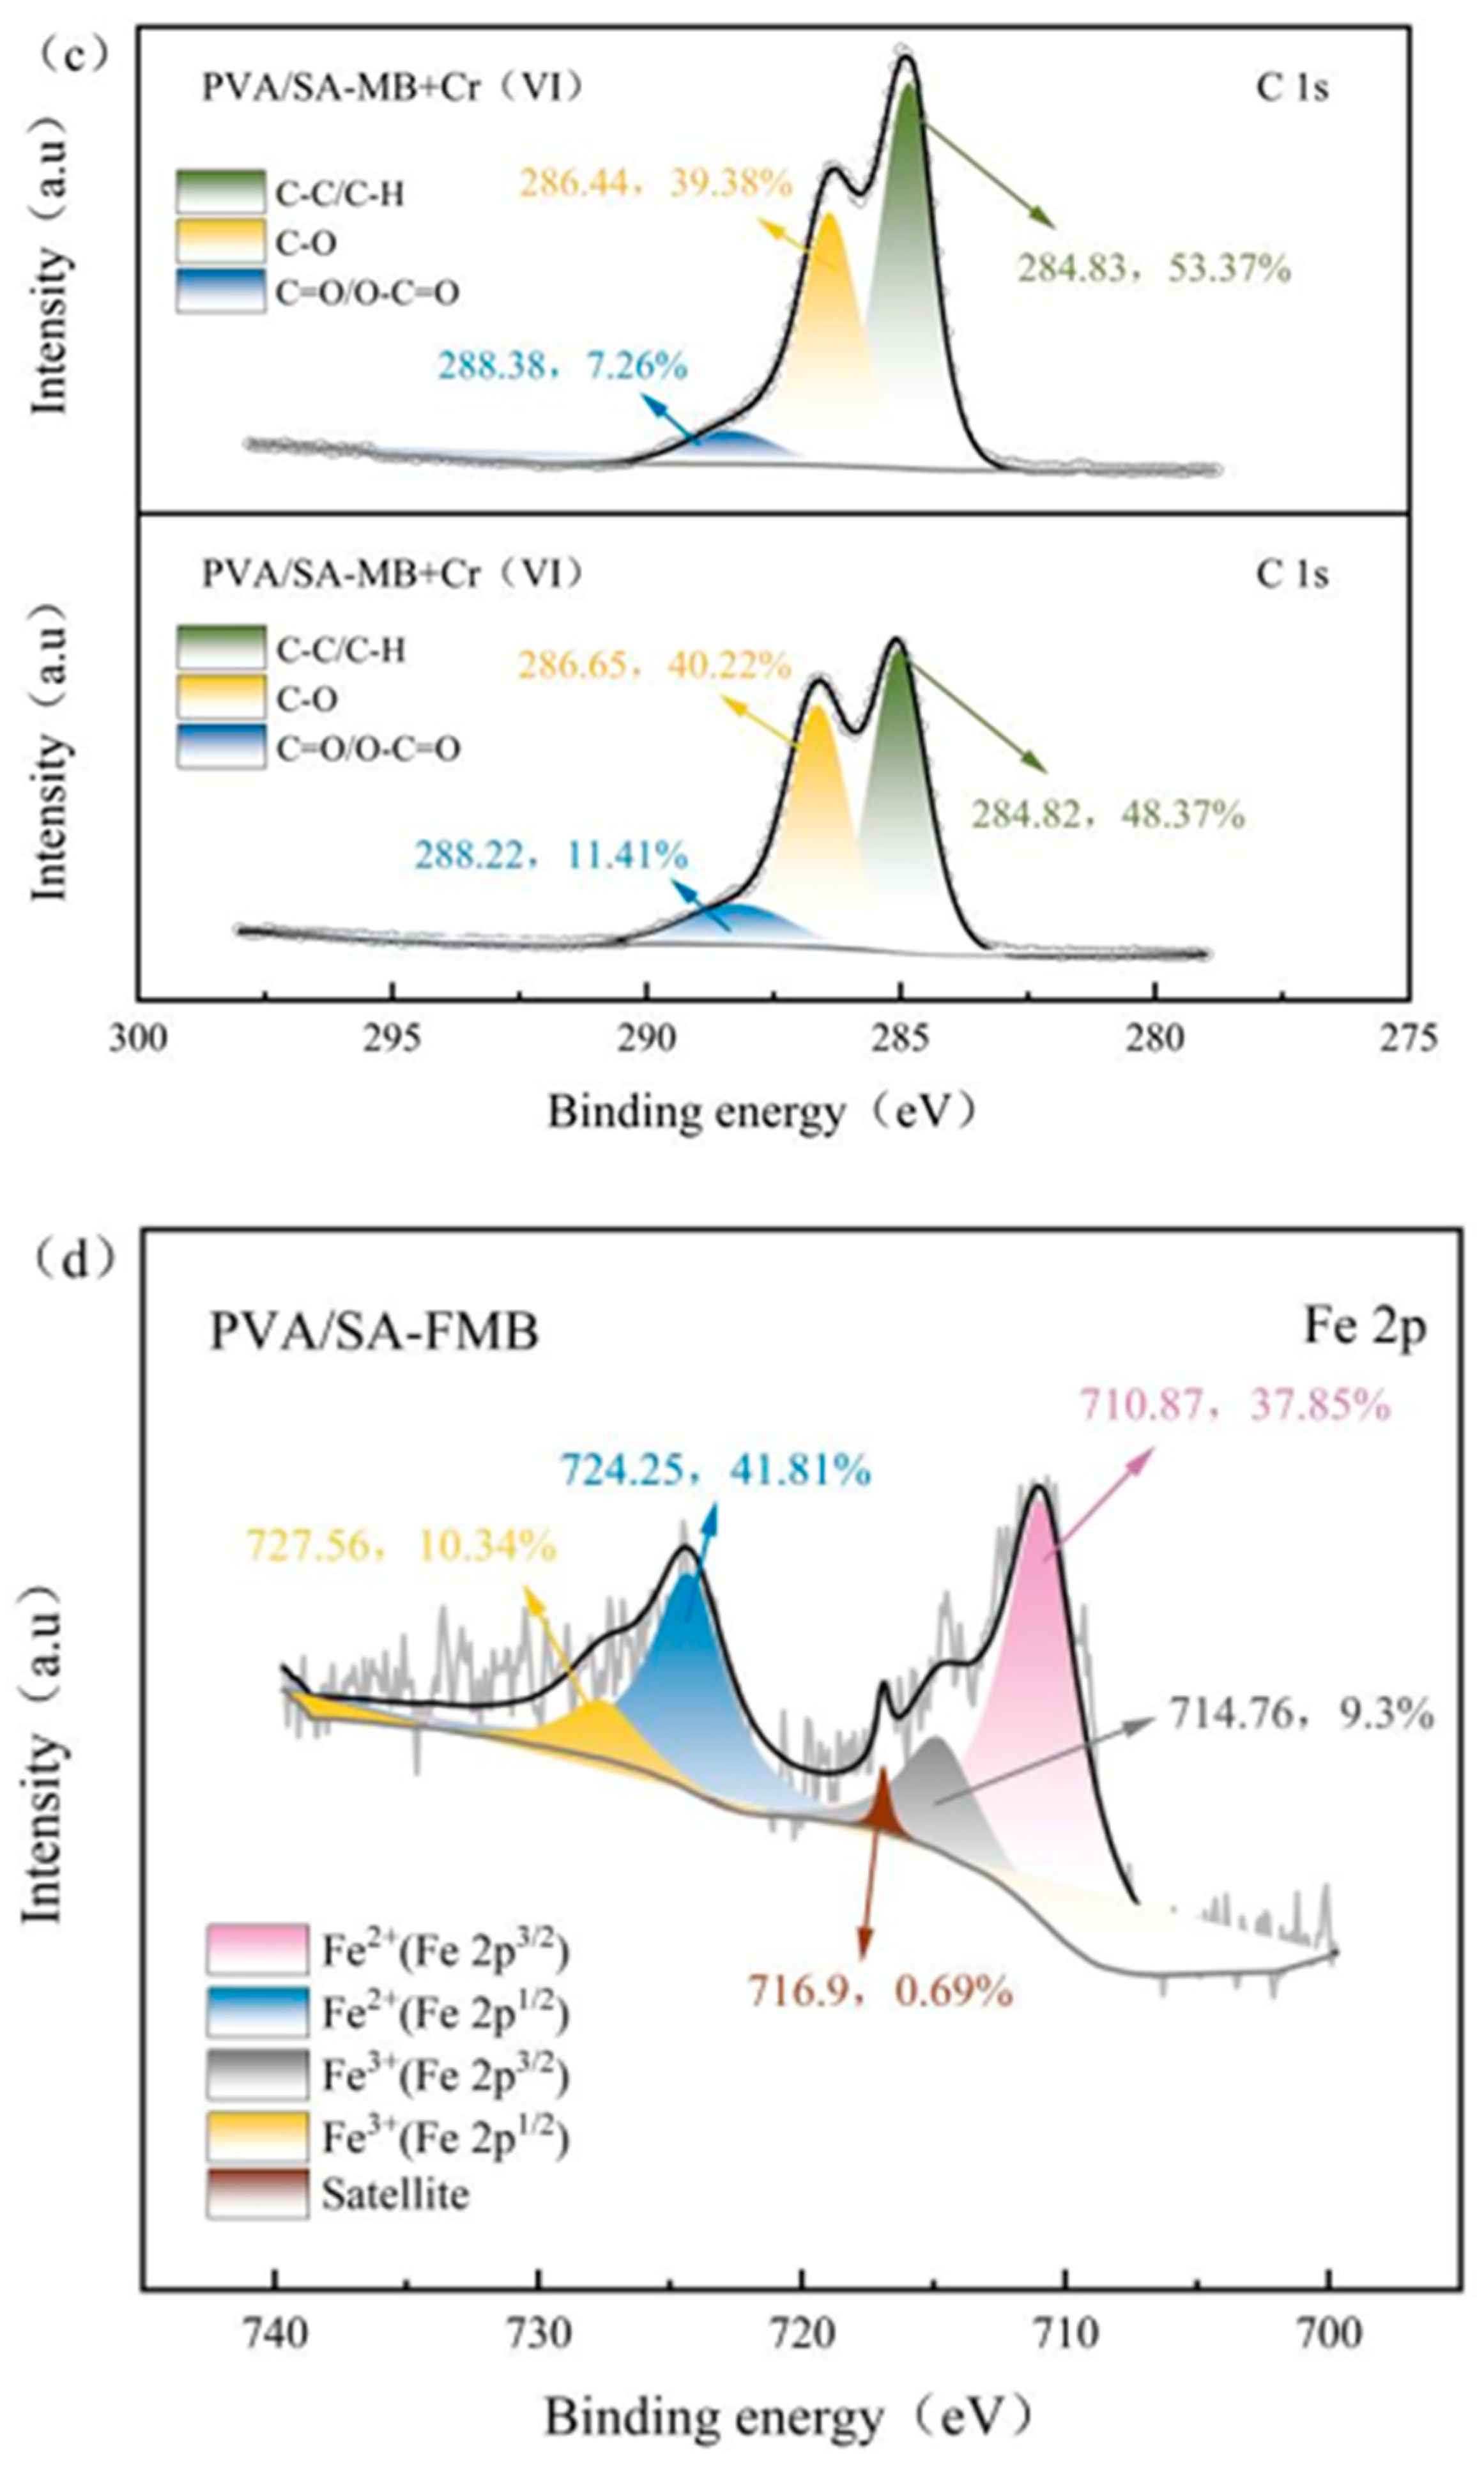
3.4.3. XPS Analysis after Cr(VI) Adsorption
4. Conclusions
Author Contributions
Funding
Data Availability Statement
Conflicts of Interest
References
- Rashid, R.; Shafiq, I.; Akhter, P.; Iqbal, M.J.; Hussain, M. A state-of-the-art review on wastewater treatment techniques: The effectiveness of adsorption method. Environ. Sci. Pollut. Res. 2021, 28, 9050–9066. [Google Scholar] [CrossRef]
- Pakade, V.E.; Tavengwa, N.T.; Madikizela, L.M. Recent advances in hexavalent chromium removal from aqueous solutions by adsorptive methods. RSC Adv. 2019, 9, 26142–26164. [Google Scholar] [CrossRef] [PubMed]
- King, A.H. Brown Seaweed Extracts (Alginates). In Food Hydrocolloids; CRC Press: Boca Raton, FL, USA, 2019; pp. 115–188. [Google Scholar]
- Rhim, J.W. Physical and mechanical properties of water resistant sodium alginate films. LWT-Food Sci. Technol. 2004, 37, 323–330. [Google Scholar] [CrossRef]
- Gao, X.; Guo, C.; Hao, J.; Zhao, Z.; Long, H.; Li, M. Adsorption of heavy metal ions by sodium alginate based adsorbent-a review and new perspectives. Int. J. Biol. Macromol. 2020, 164, 4423–4434. [Google Scholar] [CrossRef] [PubMed]
- Wróblewska-Krepsztul, J.; Rydzkowski, T.; Michalska-Pożoga, I.; Thakur, V.K. Biopolymers for Biomedical and Pharmaceutical Applications: Recent Advances and Overview of Alginate Electrospinning. Nanomaterials 2019, 9, 404. [Google Scholar] [CrossRef] [PubMed]
- Thakur, S.; Sharma, B.; Verma, A.; Chaudhary, J.; Tamulevicius, S.; Thakur, V.K. Recent progress in sodium alginate based sustainable hydrogels for environmental applications. J. Clean. Prod. 2018, 198, 143–159. [Google Scholar] [CrossRef]
- Zhang, H.; Han, X.; Liu, J.; Wang, M.; Zhao, T.; Kang, L.; Zhong, S.; Cui, X. Fabrication of modified alginate-based biocomposite hydrogel microspheres for efficient removal of heavy metal ions from water. Colloids Surf. A Physicochem. Eng. Asp. 2022, 651, 129736. [Google Scholar] [CrossRef]
- Kaklamani, G.; Cheneler, D.; Grover, L.M.; Adams, M.J.; Bowen, J. Mechanical properties of alginate hydrogels manufactured using external gelation. J. Mech. Behav. Biomed. Mater. 2014, 36, 135–142. [Google Scholar] [CrossRef] [PubMed]
- Mahou, R.; Borcard, F.; Crivelli, V.; Montanari, E.; Passemard, S.; Noverraz, F.; Gerber-Lemaire, S.; Bühler, L.; Wandrey, C. Tuning the properties of hydrogel microspheres by adding chemical cross-linking functionality to sodium alginate. Chem. Mater. 2015, 27, 4380–4389. [Google Scholar] [CrossRef]
- Alshehari, A.M.; Salim, E.; Oraby, A.H. Structural, optical, morphological and mechanical studies of polyethylene oxide/sodium alginate blend containing multi-walled carbon nanotubes. J. Mater. Res. Technol. 2021, 15, 5615–5622. [Google Scholar] [CrossRef]
- Xiang, X.; Yi, X.; Zheng, W.; Li, Y.; Zhang, C.; Wang, X.; Chen, Z.; Huang, M.; Ying, G.G. Enhanced biodegradation of thiamethoxam with a novel polyvinyl alcohol (PVA)/sodium alginate (SA)/biochar immobilized Chryseobacterium sp H5. J. Hazard. Mater. 2023, 443, 130247. [Google Scholar] [CrossRef]
- Zain, N.; Suhaimi, M.S.; Idris, A. Development and modification of PVA–alginate as a suitable immobilization matrix. Process Biochem. 2011, 46, 2122–2129. [Google Scholar] [CrossRef]
- Idris, A.; Zain NA, M.; Suhaimi, M.S. Immobilization of Baker’s yeast invertase in PVA–alginate matrix using innovative immobilization technique. Process Biochem. 2008, 43, 331–338. [Google Scholar] [CrossRef]
- Lv, X.; Jiang, G.; Xue, X.; Wu, D.; Sheng, T.; Sun, C.; Xu, X. Fe0-Fe3O4 nanocomposites embedded polyvinyl alcohol/sodium alginate beads for chromium (VI) removal. J. Hazard. Mater. 2013, 262, 748–758. [Google Scholar] [CrossRef]
- Ramdhan, T.; Ching, S.H.; Prakash, S.; Bhandari, B. Time dependent gelling properties of cuboid alginate gels made by external gelation method: Effects of alginate-CaCl2 solution ratios and pH. Food Hydrocoll. 2019, 90, 232–240. [Google Scholar] [CrossRef]
- Hameed, B.H.; Din, A.M.; Ahmad, A.L. Adsorption of methylene blue onto bamboo-based activated carbon: Kinetics and equilibrium studies. J. Hazard. Mater. 2007, 141, 819–825. [Google Scholar] [CrossRef] [PubMed]
- Crini, G.; Badot, P.M. Application of chitosan, a natural aminopolysaccharide, for dye removal from aqueous solutions by adsorption processes using batch studies: A review of recent literature. Prog. Polym. Sci. 2008, 33, 399–447. [Google Scholar] [CrossRef]
- Kumar, L.; Kumar, P.; Narayan, A.; Kar, M. Rietveld analysis of XRD patterns of different sizes of nanocrystalline cobalt ferrite. Int. NanoLett. 2013, 3, 8. [Google Scholar] [CrossRef]
- Fei, Y.; Yong, L.; Sheng, H.; Ma, J. Adsorptive removal of ciprofloxacin by sodium alginate/graphene oxide composite beads from aqueous solution. J. Colloid Interface Sci. 2016, 484, 196–204. [Google Scholar] [CrossRef] [PubMed]
- Fan, H.; Ma, X.; Zhou, S.; Huang, J.; Liu, Y.; Liu, Y. Highly efficient removal of heavy metal ions by carboxymethyl cellulose-immobilized Fe3O4 nanoparticles prepared via high-gravity technology. Carbohydr. Polym. 2019, 213, 39–49. [Google Scholar] [CrossRef] [PubMed]
- Yan, L.; Dong, F.-X.; Li, Y.; Guo, P.-R.; Kong, L.-J.; Chu, W.; Diao, Z.-H. Synchronous removal of Cr(VI) and phosphates by a novel crayfish shell biochar-Fe composite from aqueous solution: Reactivity and mechanism. J. Environ. Chem. Eng. 2022, 10, 107396. [Google Scholar] [CrossRef]
- Chen, J.H.; Xing, H.T.; Guo, H.X.; Weng, W.; Hu, S.R.; Li, S.X.; Huang, Y.H.; Sun, X.; Su, Z.B. Investigation on the adsorption properties of Cr (VI) ions on a novel graphene oxide (GO) based composite adsorbent. J. Mater. Chem. A 2014, 2, 12561–12570. [Google Scholar] [CrossRef]
- Srivastava, S.; Tyagi, R.; Pant, N. Pant, Adsorption of heavy metal ions on carbonaceous material developed from the waste slurry generated in local fertilizer plants. Water Res. 1989, 23, 1161–1165. [Google Scholar] [CrossRef]
- Zhang, W.; Zhang, S.; Wang, J.; Wang, M.; He, Q.; Song, J.; Wang, H.; Zhou, J. Hybrid functionalized chitosan-Al2O3@SiO2 composite for enhanced Cr(VI) adsorption. Chemosphere 2018, 203, 188. [Google Scholar] [CrossRef] [PubMed]
- Song, L.; Liu, F.; Zhu, C.; Li, A. Facile one-step fabrication of carboxymethyl cellulose based hydrogel for highly efficient removal of Cr(VI) under mild acidic condition. Chem. Eng. J. 2019, 369, 641–651. [Google Scholar] [CrossRef]
- Park, D.; Yun, Y.-S.; Park, J.M. The past, present, and future trends of biosorption. Biotechnol. Bioprocess Eng. 2005, 10, 86–102. [Google Scholar] [CrossRef]
- Zhang, S.; Lyu, H.; Tang, J.; Song, B.; Zhen, M.; Liu, X. A novel biochar supported CMC stabilized nano zero-valent iron composite for hexavalent chromium removal from water. Chemosphere 2019, 217, 686–694. [Google Scholar] [CrossRef]
- Wan, Z.; Cho, D.-W.; Tsang, D.C.; Li, M.; Sun, T.; Verpoort, F. Concurrent adsorption and micro-electrolysis of Cr(VI) by nanoscale zerovalent iron/biochar/Ca-alginate composite. Environ. Pollut. 2019, 247, 410–420. [Google Scholar] [CrossRef]
- Yu, Y.; An, Q.; Jin, L.; Luo, N.; Li, Z.; Jiang, J. Unraveling sorption of Cr (VI) from aqueous solution by FeCl3 and ZnCl2-modified corn stalks biochar: Implicit mechanism and application. Bioresour. Technol. 2020, 297, 122466. [Google Scholar] [CrossRef]
- Yusuff, A.S.; Lala, M.A.; Thompson-Yusuff, K.A.; Babatunde, E.O. ZnCl2-modified eucalyptus bark biochar as adsorbent: Preparation, characterization and its application in adsorption of Cr (VI) from aqueous solutions. S. Afr. J. Chem. Eng. 2022, 42, 138–145. [Google Scholar] [CrossRef]


| Variables | Code | Horizontal Coding | ||
|---|---|---|---|---|
| −1 | 0 | 1 | ||
| SA/% | A | 0.4 | 0.6 | 0.8 |
| PVA/% | B | 2.4 | 3 | 3.6 |
| CaCO3/g | C | 0.3 | 0.6 | 0.9 |
| FMB/g | D | 0.24 | 0.3 | 0.36 |
| No. | A | B | C | D | Adsorption Amount of Cr(VI)/mg/g | No. | A | B | C | Adsorption Amount of Cr(VI)/mg/g | Adsorption Amount of Cr(VI)/mg/g | ||
|---|---|---|---|---|---|---|---|---|---|---|---|---|---|
| Test Value | Predicted Value | Test Value | Predicted Value | ||||||||||
| 1 | −1 | −1 | 0 | 0 | 18.95 | 19.41 | 16 | 0 | 1 | 1 | 0 | 19.05 | 19.08 |
| 2 | 1 | −1 | 0 | 0 | 20.71 | 20.86 | 17 | −1 | 0 | −1 | 0 | 15.59 | 15.2 |
| 3 | −1 | 1 | 0 | 0 | 18.86 | 19.36 | 18 | 1 | 0 | −1 | 0 | 15.64 | 15.38 |
| 4 | 1 | 1 | 0 | 0 | 19.53 | 19.74 | 19 | −1 | 0 | 1 | 0 | 15.81 | 15.31 |
| 5 | 0 | 0 | −1 | −1 | 18.9 | 18.77 | 20 | 1 | 0 | 1 | 0 | 17.31 | 16.95 |
| 6 | 0 | 0 | 1 | −1 | 20.63 | 20.95 | 21 | 0 | −1 | 0 | −1 | 25.12 | 24.98 |
| 7 | 0 | 0 | −1 | 1 | 18.87 | 19.22 | 22 | 0 | 1 | 0 | −1 | 23.52 | 23.01 |
| 8 | 0 | 0 | 1 | 1 | 17.92 | 18.71 | 23 | 0 | −1 | 0 | 1 | 22.96 | 22.71 |
| 9 | −1 | 0 | 0 | −1 | 18.89 | 19.04 | 24 | 0 | 1 | 0 | 1 | 24.1 | 23.49 |
| 10 | 1 | 0 | 0 | −1 | 22.5 | 22.82 | 25 | 0 | 0 | 0 | 0 | 24.96 | 25.32 |
| 11 | −1 | 0 | 0 | 1 | 21.23 | 21.01 | 26 | 0 | 0 | 0 | 0 | 24.88 | 25.32 |
| 12 | 1 | 0 | 0 | 1 | 19.12 | 19.06 | 27 | 0 | 0 | 0 | 0 | 26.14 | 25.32 |
| 13 | 0 | −1 | −1 | 0 | 18.76 | 18.83 | 28 | 0 | 0 | 0 | 0 | 25.47 | 25.32 |
| 14 | 0 | 1 | −1 | 0 | 17.51 | 17.88 | 29 | 0 | 0 | 0 | 0 | 25.15 | 25.32 |
| 15 | 0 | −1 | 1 | 0 | 19.59 | 19.31 | |||||||
| Items | Sum of Squares | Degrees of Freedom | Mean Square | F-Value | p-Value | Significance |
|---|---|---|---|---|---|---|
| Model | 221.27 | 14 | 15.8 | 85.33 | <0.0001 | ** |
| A | 3.5 | 1 | 3.5 | 18.88 | 0.0117 | * |
| B | 0.12 | 1 | 0.12 | 0.67 | 0.0836 | |
| C | 3.03 | 1 | 3.03 | 16.34 | 0.0187 | ** |
| D | 2.67 | 1 | 2.67 | 14.43 | 0.0131 | * |
| AB | 1.54 | 1 | 1.54 | 8.29 | 0.3395 | |
| AC | 0.53 | 1 | 0.53 | 2.84 | 0.2048 | |
| AD | 7.08 | 1 | 7.08 | 38.22 | 0.0001 | * |
| BC | 0.13 | 1 | 0.13 | 0.69 | 0.5227 | |
| BD | 0.86 | 1 | 0.86 | 4.62 | 0.0245 | * |
| CD | 0.71 | 1 | 0.71 | 3.82 | 0.0276 | * |
| A2 | 92.01 | 1 | 92.01 | 496.79 | <0.0001 | ** |
| B2 | 6.98 | 1 | 6.98 | 37.7 | <0.0001 | ** |
| C2 | 136.42 | 1 | 136.42 | 736.54 | <0.0001 | ** |
| D2 | 0.41 | 1 | 0.41 | 2.2 | 0.0191 | * |
| Residual | 2.59 | 14 | 0.19 | |||
| Missing fitting item | 1.54 | 10 | 0.15 | 0.58 | 0.4732 | |
| Absolute error | 1.05 | 4 | 0.26 | |||
| Total | 223.86 | 28 |
| Samples | C | O | N | O/C | (O + N)/C |
|---|---|---|---|---|---|
| PVA/SA-MB | 68.85 | 30.09 | 1.06 | 0.4370 | 0.4524 |
| PVA/SA-FMB | 24.07 | 73.89 | 2.04 | 3.0698 | 3.1545 |
| Sample | BET Surface Area/(m2·g−1) | V/ <1.1 nm (cm3·g−1) | V/ <1.1 nm (cm3·g−1) | Average Pore Diameter/ (nm) |
|---|---|---|---|---|
| PVA/SA | 100.6120 | 0.00289 | 0.228412 | 9.21610 |
| PVA/SA-MB | 441.7465 | 0.09947 | 0.4146567 | 4.05464 |
| PVA/SA-FMB | 344.2612 | 0.16795 | 0.451204 | 5.32073 |
| Microspheres | Qe/(mg·g−1) | Quasi-First-Order Kinetics | Quasi-Second-Order Kinetics | ||||
|---|---|---|---|---|---|---|---|
| Qt/ (mg·g−1) | k1/ min−1 | R2 | Qt/ (mg·g−1) | k1/(g·mg−1·min−1) | R2 | ||
| PVA/SA | 9.34 | 9.28 | 0.0053 | 0.94 | 11.04 | 5.29 × 10⁻⁴ | 0.92 |
| PVA/SA-MB | 14.07 | 13.36 | 0.0105 | 0.92 | 14.52 | 0.0011 | 0.95 |
| PVA/SA-FMB | 26.03 | 22.61 | 0.0277 | 0.95 | 24.99 | 0.0016 | 0.99 |
| Microspheres | Rd12 | kid1/ (mg∙g−1∙h−0.5) | C′1 (mg·g−1) | Rd22 | kid2/ (mg∙g−1∙h−0.5) | C′2 (mg·g−1) |
|---|---|---|---|---|---|---|
| PVA/SA | 0.76865 | 0.53247 | 1.51448 | 0.0366 | 0.01627 | 8.83264 |
| PVA/SA-MB | 0.89788 | 0.63434 | 1.86151 | 0.38649 | 0.01919 | 12.99951 |
| PVA/SA-FMB | 0.94667 | 1.26448 | 5.58574 | 0.94309 | 0.19211 | 18.76642 |
| Microspheres | Langmuir | Freundlich | |||||
|---|---|---|---|---|---|---|---|
| Qm/ (mg·g−1) | KL/(L·mg−1) | n | R2 | KF/(L·mg−1) | n | R2 | |
| PVA/SA | 46.81 | 0.0052 | 1.51–1.05 | 0.97 | 0.38 | 1.23 | 0.96 |
| PVA/SA-MB | 48.86 | 0.0079 | 1.79–1.08 | 0.99 | 0.57 | 1.25 | 0.98 |
| PVA/SA-FMB | 59.93 | 0.0107 | 2.08–1.11 | 0.99 | 1.44 | 1.47 | 0.98 |
Disclaimer/Publisher’s Note: The statements, opinions and data contained in all publications are solely those of the individual author(s) and contributor(s) and not of MDPI and/or the editor(s). MDPI and/or the editor(s) disclaim responsibility for any injury to people or property resulting from any ideas, methods, instructions or products referred to in the content. |
© 2024 by the authors. Licensee MDPI, Basel, Switzerland. This article is an open access article distributed under the terms and conditions of the Creative Commons Attribution (CC BY) license (https://creativecommons.org/licenses/by/4.0/).
Share and Cite
Zuo, J.; Ren, J.; Jiang, L.; Tan, C.; Li, J.; Xia, Z.; Wang, W. Preparation of PVA/SA-FMB Microspheres and Their Adsorption of Cr(VI) in Aqueous Solution. Processes 2024, 12, 443. https://doi.org/10.3390/pr12030443
Zuo J, Ren J, Jiang L, Tan C, Li J, Xia Z, Wang W. Preparation of PVA/SA-FMB Microspheres and Their Adsorption of Cr(VI) in Aqueous Solution. Processes. 2024; 12(3):443. https://doi.org/10.3390/pr12030443
Chicago/Turabian StyleZuo, Jinlong, Jin Ren, Liming Jiang, Chong Tan, Junsheng Li, Zhi Xia, and Wei Wang. 2024. "Preparation of PVA/SA-FMB Microspheres and Their Adsorption of Cr(VI) in Aqueous Solution" Processes 12, no. 3: 443. https://doi.org/10.3390/pr12030443
APA StyleZuo, J., Ren, J., Jiang, L., Tan, C., Li, J., Xia, Z., & Wang, W. (2024). Preparation of PVA/SA-FMB Microspheres and Their Adsorption of Cr(VI) in Aqueous Solution. Processes, 12(3), 443. https://doi.org/10.3390/pr12030443