
Kinetic Investigation of the Oxidative Thermal Decomposition of Levonorgestrel
by
 , , , , and
Amalia Ridichie
1 ,
,
Adriana Ledeţi
2,* ,
,
Francisc Peter
1,3,* ,
,
Ionuţ Ledeţi
1,2 ,
,
Cornelia Muntean
1 and
Matilda Rădulescu
4 1
Faculty of Industrial Chemistry and Environmental Engineering, University Politehnica Timisoara, 2 Victoriei Square, 300006 Timisoara, Romania
2
Advanced Instrumental Screening Center, Faculty of Pharmacy, Victor Babeş University of Medicine and Pharmacy, 2 Eftimie Murgu Square, 300041 Timisoara, Romania
3
Research Institute for Renewable Energy, University Politehnica Timisoara, 138 Gavril Musicescu, 300501 Timisoara, Romania
4
Department XIV, Faculty of Medicine, Victor Babeş University of Medicine and Pharmacy, 2 Eftimie Murgu Square, 300041 Timisoara, Romania
*
Authors to whom correspondence should be addressed.
Processes 2023, 11(11), 3210; https://doi.org/10.3390/pr11113210
Submission received: 10 October 2023
/
Revised: 6 November 2023
/
Accepted: 9 November 2023
/
Published: 10 November 2023
(This article belongs to the Special Issue Application of Process Systems Engineering in Continuous Pharmaceutical and Biopharmaceutical Manufacturing)
Abstract
:In this study, we have focused on studying the heterogenous degradation kinetics regarding the decomposition of the emergency contraceptive agent levonorgestrel (LNG), which is a second-generation synthetic progestogen that is the active component of the racemic mixture of norgestrel. The degradation processes of the active pharmaceutical ingredient (API) were compared with the ones obtained from a model system containing the API along with the excipients that are found in a commercialized pharmaceutical formulation in a mass ratio of 1:1 (LNGMIX), in order to observe if the excipients have a stabilizing or destabilizing effect on the degradation of this progestogen. To achieve this, the following investigational methods were used: FTIR (Fourier transform infrared) spectroscopy and thermal analysis (TG/DTG/DSC analysis). For the kinetic analysis, the data obtained from two main decomposition processes observed on the DTG curves were used and processed with a preliminary method, namely ASTM E698, and two isoconversional methods: Friedman and Flynn–Wall–Ozawa. The isoconversional study revealed that the decomposition mechanisms of both LNG and LNGMIX are complex, and the excipients have a stabilizing effect on the decomposition of the API in tablet.
1. Introduction
Kinetic studies are, nowadays, of great importance in the characterization of pharmaceuticals, including active pharmaceutical ingredients, excipients, and even coating and packaging materials [1,2,3,4]. The degradation processes that occur can be physical (crystallization of amorphous drugs, transitions in crystalline states, moisture adsorption, formation, and growth of crystals) or chemical (hydrolysis, oxidation, photolysis, dehydration, and racemization). The main role of the kinetic analysis is in determining the shelf-life and the storage conditions of the pharmaceutical formulations, in order to maintain an optimal concentration and release profile of the active substances [5]. The importance of the stability and degradation of APIs is of great interest nowadays, especially in the field of pharmaceuticals that are not completely investigated by physico-chemical means. Also, since the excipients can greatly modify the behavior and stability of the API (as stabilizing or destabilizing agents) during the manufacturing process (especially for generic forms), the information regarding their behavior in complex mixtures is crucial and leads to a coherent selection of auxiliaries in the development of new solid dosage forms.
Levonorgestrel, namely, 17alpha-ethynyl-18-methylestr-4-en-17beta-ol-3-one (Figure 1), is a second-generation synthetic progestogen that is the active component of the racemic mixture of norgestrel, primarily used as an emergency contraceptive [6,7]. It is also used off-label for treating endometrial hyperplasia, menorrhagia, endometriosis, and menopausal hormone therapy. The therapeutic effect is the result of the interaction of levonorgestrel with the progesterone and androgen receptors. Thus, it postpones the release of gonadotropin-releasing hormone, furthermore suppressing the secretion of the luteinizing hormone. These effects will delay or even inhibit ovulation and will increase the thickness of the layer of the cervical mucus, which will block the passage of the spermatozoon [7,8]. The pharmacokinetics of levonorgestrel are well known, the active substance presenting a rapid absorption reaching the maximal serum concentration in 2 h with a half-time absorption of approximately 1 h. However, when administered alongside estrogens, such as ethinylestradiol, the pharmacokinetic profile of levonorgestrel becomes unpredictable, disclosing a significant variation in the plasma concentrations [9,10]. Currently, in the pharmaceutical field there are various pharmaceutical formulations containing levonorgestrel, such as the following: intrauterine devices, tablets, and implants.
A pharmaceutical formulation contains, in addition to the APIs, numerous pharmaceutical excipients, added both to increase the patient′s compliance with the treatment and to facilitate the technological process of obtaining the pharmaceutical form. Today, the biggest challenge for pharmaceutical technology is to develop a drug formula in which the interactions between the APIs and excipients is reduced to a minimum, in order to not interfere with the biopharmaceutical profile of the therapeutic molecule. Those interactions can be observed in the preformulation state with the help of thermoanalytical tools. The analysis method employs the heating of the sample in isothermal or non-isothermal conditions and evaluating the mass loss, phase transitions, and polymorphic transformations [11]. Furthermore, thermal analysis offers valuable information about the thermal stability of the inclusion complexes of the APIs with cyclodextrins [12,13,14], binary or ternary adducts [15], and cocrystals [16,17].
Due to the lack of information about the thermal stability and the decomposition process of levonorgestrel, the main purpose of this paper is to elucidate the thermolysis mechanism of LNG by using kinetic analysis. This type of analysis uses the data obtained from the thermoanalytical curves and isoconversional methods in order to calculate the apparent activation energy (Ea). The use of the term “apparent” in heterogenous kinetics is due to the fact that complex heterogeneous reactions comprising several steps are usually carried out on complex analytic matrices, and the unit of energy reported to mol of analyte is ambiguous. In addition, in the literature, the term “apparent” is also used in the evaluation of activation enthalpy [18,19].
The main advantage of the isoconversional methods is represented by the possibility of using them without knowing or assuming an explicit model for the differential or integral conversion functions. The kinetic analysis was performed by following the so-called “four principles” recommendations made by the International Confederation for Thermal Analysis and Calorimetry (ICTAC) Kinetics Committee, namely the following: (I) avoiding the use of kinetic methods that use a single heating rate curve; (II) using model-fitting or model-free (isoconversional) kinetic methods that are obtained at several different heating rates; (III) accurately using only one integral isoconversional method instead of several integral isoconversional methods; and (IV) evaluating the variation in Ea vs. α, and if the variation is significant, avoiding replacing the dependence with a single average value, since it is a clear indication of a multistep nature of the decomposition process [20,21,22,23,24,25].
The Flynn–Wall–Ozawa isoconversional method (FWO) is a relatively easy method used for the determination of the Ea in the function of the conversion degree, by employing the data from the thermogravimetric analysis curves, mass loss vs. temperature [26]. The disadvantage of this method is the use of various approximations for the temperature integral [27].
The Friedman isoconversional method (FR) is a differential method in which no approximation is used. Usually, the values obtained for the Ea are higher than the values calculated with the FWO method due to the different methods of calculation and the lack of approximations [27,28].
In this study, we aim to fully characterize the thermal stability of LNG, as well as the decomposition process that takes place when the sample is heated in an oxidative atmosphere. The necessity of carrying out stability investigations is of great importance in the physical chemistry of pharmaceuticals, because the physical and chemical processes will influence the biopharmaceutical profile of these compounds, with direct consequences in their bioavailability and therapeutic effect. Also, for hormone therapy, the degradation of the solid-state modification of APIs from this class is even more important than for other active ingredients, since pharmaceutical formulations containing hormones are generally “poor” in APIs, these compounds being administered in doses usually in orders of micrograms or a few milligrams per tablet, so any modification of the concentration of the API in the presence of excipients due to physico-chemical interaction will affect the biological effect.
The results obtained for the pure API are going to be compared to those acquired for a pharmaceutical formulation that contains a 1.5 mg LNG/tablet and for an enriched mixture formed between the tablet and LNG in a mass ratio of 1:1. Firstly, for the kinetic studies, a preliminary method was employed, namely ASTM E698, and then two isoconversional methods were used for the approximation of the activation energy: Flynn–Wall–Ozawa and Friedman. To confirm the identity and the purity of the LNG, FTIR analysis was performed, and in addition, the same analytical method was used to confirm the presence of LNG in the tablet and the mixture.
2. Materials and Methods
2.1. Samples and Preparation
Levonorgestrel (LNG) was acquired from Sigma-Aldrich (St. Louis, MO, USA) and the purity was according to British Pharmacopoeia (BP) Reference Standard. The sample was used in the studies as received.
The pharmaceutical formulation (LNGTAB) that was investigated contained 1.5 mg LNG/tablets, sold under the name Escapelle 1.5 mg (batch T2C001E), produced in Budapest, Hungary, by Gedeon Richter. In this study, one tablet was used and the excipients, as presented on the summary of product features, are as follows: potato starch, anhydrous silicon dioxide, magnesium stearate, talc, corn starch, and lactose monohydrate. The mass of the tablet was 201.38 mg, which was crushed in an agate mortar with a pestle, triturated, sieved, and then placed in a sealed brown vial at 25 °C, in the absence of light.
For the preparation of the mixture (LNGMIX), 75.2 mg of the powder obtained by triturating the tablet in an agate mortar and an equivalent quantity of LNG were added to obtain a mass ratio of 1:1. The LNGMIX was processed and stored identically as LNGTAB.
The batches for the excipients used are as follows: talc (#BCBQ7164V, from Sigma, Roedermark, Germany), starch (SZBF167, from Grain Processing Corporation, Muscatine, IA, USA), magnesium stearate (#SZBF2590V, from Sigma, Germany), silicon dioxide (3157040314, from Degussa AG., Frankfurt, Germany), and lactose monohydrate (#SLBK4809V, from Sigma, Germany).
2.2. FTIR Analysis
For obtaining the FTIR data, a Jasco FT/IR-670 Plus (Jasco Corporation, Tokyo, Japan) instrument was used, without any further purification of the samples, using the KBr dispersion and pelleting method. The selected spectral domain was between 4000–400 cm−1. The spectrum was built after 32 successive scans at 2 cm−1.
2.3. Thermal Analysis
For the thermal analysis, the Setline TGA (SETARAM, Caluire, France) instrument was employed, in order to obtain the TG (thermogravimetric/mass curve) and DTG data (derivative thermogravimetric/mass derivative), using an open alumina crucible. The heating process was conducted in dynamic air flow (100 mL·min−1) under non-isothermal conditions, employing five different heating rates of β = 2, 4, 6, 8, and 10 °C·min−1, from a temperature of 40 °C up to 500 °C, each sample having a mass of approximately 10 mg. The DSC curves of LNG, LNGMIX, LNGTAB, and the pharmaceutical excipients present in the tablet were recorded on a NETZSCH DSC 204F1 Phoenix (NETZSCH, Selb, Germany) using sealed aluminum crucibles in inert nitrogen medium with a flow rate of 20 mL·min−1. Each TG experiment was performed in duplicate and the results were practically identical.
2.4. Kinetic Analysis
The kinetic analysis was performed on the data obtained from the first decomposition process observed on the DTG curves for the LNG, tablet, and mixture, using the AKTS—Thermokinetics Software version 4.46 (AKTS AG TechnoArk, Siders, Switzerland). The abbreviations used respect the recommendations of the International Confederation for Thermal Analysis and Calorimetry (ICTAC) Kinetics Committee: α—conversion degree, t—time, β—linear heating rate (C·min−1), A—pre-exponential factor according to kinetic model of Arrhenius (min−1), f(α)—the differential conversion function, g(α)—the integral conversion function, Ea—activation energy (kJ·mol−1), R—universal gas constant (J·mol−1·K−1), T—absolute temperature (K), and Δm—mass loss on a certain temperature interval.
3. Results and Discussion
3.1. FTIR Analysis
The FTIR spectra were determined for all three samples, namely, levonorgestrel as pure active pharmaceutical ingredient (LNG), the powder obtained from triturating the tablet containing 1.5 mg of levonorgestrel (LNGTAB), and the mixture (LNGMIX), which contains LNG and LNGTAB in a mass ratio of 1:1. The spectra of LNGTAB and LNGMIX confirmed the presence of LNG in each sample. The obtained FTIR spectra for all three samples are presented in Figure 2.
The wavenumbers of each absorption band observed on the spectrum of LNG can be correlated with the functional groups and chemical bonds of the API. The results correspond to the data presented in the scientific literature [29,30], which demonstrate both the identity and the degree of analytical purity of the analyzed substance. Firstly, there can be observed a large absorption band with two bands at 3430 cm−1 and 3348 cm−1, characteristic of the stretching vibrations of the dimeric hydroxyl group. Also, for this functional group, at 1066 cm−1 a strong absorption band is revealed, caused by the stretching vibration of the C–O bond. The in-plane bending vibrations of the –OH group are found at 1363 cm−1. For the carbonyl group, the absorption band is shifted to a lower wavenumber, due to the conjugation of the double bond determining a delocalization of the π electrons of those unsaturated groups; thus, the stretching vibrations are observed at the wavenumber equal to 1653 cm−1. The stretching and bending vibrations of the C–C(=O)–C group show a moderate absorption with two medium-intensity bands at 1210 cm−1 and 1131 cm−1, which results from the stretching of C–C–C and C–C(=O)–C bending in the C–C–C group. The C=C bond from the cycloalkene determines an absorption band at 1617 cm−1 due to the stretching vibrations of this group. For the monosubstituted terminal alkyne, no absorption band is observed in the spectral range of 2140–2100 cm−1, but the stretching vibrations of the C–H bond are detected as an intense band at 3267 cm−1. Also, the bending vibrations of the same bond are highlighted by two strong bands at 692 cm−1 and 657 cm−1, which are overtoned by a weak, broad band with a maxim at 1233 cm−1. For the methyl group, the FTIR spectra revealed an absorption band at 2957 cm−1 characteristic of the symmetrical stretching vibrations and a band at 2868 cm−1 associated with the asymmetrical stretching vibrations. The symmetrical bending vibrations for –CH3 are observed at the wavenumber 1389 cm−1 and the asymmetrical ones at 1446 cm−1; usually it overlaps the scissoring vibration of the methylene groups, but in this case, due to conjugation, the band for this type of vibration is distinct at 1469 cm−1. For the cycloalkanes, the stretching vibrations of C–H bonds appear at 2979 cm−1 and 2932 cm−1; a slight shift is caused by the conjugation. The bending vibrations of the same bond are observed at 1458 cm−1.
The spectra for LNGTAB and LNGMIX are more complex due to the presence of excipients, namely the following: potato starch, anhydrous silicon dioxide, magnesium stearate, talc, corn starch, and lactose monohydrate. Even so, the absorption bands which characterize each functional group and chemical bond observed on the chemical structure of LNG can be distinguished, confirming the presence of the API in each sample. The FTIR spectrum of LNGTAB shows more attenuated absorption bands for LNG, due to the presence of the excipients. For the excipients, the presence of lactose monohydrate and starch is certified by the broader absorption band in the spectral region of 3715–2994 cm−1, with two peaks at 3383 cm−1 and 3562 cm−1, which is determined by the stretching vibrations of the hydroxyl group. The ether group from the starch molecule revealed a strong absorption band at 1094 cm−1, caused by the asymmetrical stretching vibrations of the C–O–C bond. The enriched sample with the API, namely LNGMIX, shows a FTIR spectrum with more accentuated absorption bands for LNG, compared to the one for LNGTAB, confirming the addition of LNG and allowing a more accurate identification of the absorption bands for the excipients.
3.2. Thermal Analysis
The TG/DTG data obtained for LNG, LNGTAB, and LNGMIX are presented in Figure 3, Figure 4 and Figure 5.
The thermal profile of LNG (Figure 3) reveals a two-step degradation process, as seen in data collected in Table 1. The small mass loss that takes place below 70 °C represents the release of superficially adsorbed water, and after this process, LNG is thermally stable up to 192 °C. The mass loss is accompanied by the melting of the API, which takes place at 243 °C (DSC curve shown in Figure S1), in good agreement with the 232–239 °C temperature range mentioned in PubChem [31].
The two main decomposition processes that occur during the thermolysis of LNG are well individualized in the TG/DTG curves, with the mass loss becoming considerable with the increase in the temperature. However, TG data indicate a considerable thermal stability for this API, which can be explained by the presence of the nortestosterone moiety in the structure, grafted with functional moieties that can form H-bonds in a solid state (namely, the 17β-hydroxy and the respective 3-carbonyl groups).
The thermal profile of LNGTAB (Figure 4) reveals a four-step degradation process, as seen in data collected in Table 1. The more complex decomposition profile of the tablet was expected, since it contains several excipients that are reactive under thermal treatment. The first decomposition process that occurs up to 115 °C is associated with the water loss from the tablet, mainly contained in the excipients, especially in lactose monohydrate. In order to obtain a clear view of the decomposition process of LNGTAB, the thermal data for lactose monohydrate were recorded in the same experimental conditions (TG/DTG curve shown in Figures S5 and S6). As can be seen in Table 1, the additional processes on the thermoanalytical profile of LNGTAB are due to the presence of excipients, mainly lactose. However, the shifting of the additional processes in LNGTAB vs. lactose monohydrate is due to the presence of the other excipients. Also, the presence of the API in this sample is hard to be evidenced due to the overlapping effect of lactose decomposition, as well as for the missing thermal events that take place in the 355–483 °C temperature range observed for LNG and not for LNGTAB.
In Figure 5, the thermal behavior of the LNGMIX sample is presented, consisting of equal mass amounts of the tablet and API. The necessity of preparing such a mixture for the kinetic study is due to the fact that in the commercialized formulation, the mass of the API represents only approximately 0.75% of the total mass of the tablet, so a clear revealing of the processes using thermal analysis would be impossible. The preparation of an enriched mixture where the API represents 50% of the mass in the mixture with excipients makes this system more appropriate for kinetic investigations. As can be seen in data presented in Table 1, in corroboration with the thermoanalytical data shown in Figure 4, the profile of LNGMIX reveals all the processes of LNG and LNGTAB, making it the ideal system for characterizing the behavior of the API in the presence of excipients.
3.3. Kinetic Investigations
Since thermal analysis did not reveal the second process of the decomposition of the API in LNGTAB (due to the small amount of the API reported in relation to the amount of excipients), kinetic investigations were abandoned for this sample. In order to check the excipients’ effect on the kinetics of the decomposition of the API, we have prepared the LNGMIX sample, as described in Section 2.1.
Initially, we have investigated the kinetics of degradation of “process 1” for both LNG (consisting of process I from Table 1) and LNGMIX (consisting of processes III + IV from Table 1) on the DTG ranges presented for each heating rate in Table 2, followed by the investigations of “process 2”.
First of all, using the selected DTG temperature intervals shown in Table 2, we have generated the reaction progress vs. T (Figure 6), as well as the reaction rate vs. T curves for both samples (Figure 7). For both samples, it can be seen that the increase in the heating rate determines the shift of the investigated process to higher temperatures, in good agreement with the well-known fact that mass/heat transfer is affected by a higher inertia at higher heating rates.
The analysis of the reaction rate vs. T reveals the increase in reaction rate for each sample, with the increase in temperature, as well as the shifting of the peak to higher temperatures. For LNG, the reaction rate reveals a single maxima, while for LNGMIX, the reaction rate reveals a multistep process, as shown in Figure 7.
Initially, the ASTM E698 method was employed as a preliminary investigational tool (Figure S7); the linear plotting of the ASTM E698 method indicates for both investigated samples two practically identical apparent activation energies, namely the following: for LNG, Ea is 92.5 kJ·mol−1, while for LNGMIX, Ea is 93.9 kJ·mol−1, which may suggest that the degradation process of this API is independent of the presence of excipients in the analytical matrix.
In order to investigate the kinetics of degradation in depth, with the effects of the excipients, two isoconversional methods, namely, the differential method of Friedman (FR) and integral method of Flynn–Wall–Ozawa, were used. The theoretical fundamentals of heterogeneous solid-state kinetics were elsewhere reported [32], so here we present only the linearized equations that mathematically correlate to the physical quantities that describe the above-mentioned kinetic models.
The linearized model of the differential FR method is shown in Equation (1), while for the integral FWO method is shown in Equation (2), with respect to the abbreviations presented in Section 2.4.
The plotting of vs. (1/T) generates the so-called Friedman family of linear dependencies, and from their slopes the values of apparent activation energies can be obtained (Figure 8).
The plotting of vs. (1/T) generates the FWO family of linear dependencies (Figure 9), and the apparent activation energies can be obtained in a similar manner as for the FR method, the results of which are summarized in Table 3.
The analysis of the variation in each individual Ea value vs. α allows for an estimation of the complexity of the degradation of the heterogenous process, since it is generally known that the main cause of this variation is due to the existence of parallel, consecutive, or reversible reactions that accompany the main transformation [33,34]. For the processes which consist of sequences of complex reactions, the Ea vs. α can reveal the minimum and/or maximum inflection points, and as well as sequences where Ea is independent of conversion degree. In order to obtain a clear view of the variation in Ea vs. α, the data presented in Table 3, Figure 10 were drawn up.
As can be seen in Figure 10a, the decreasing dependence of Ea on α by the FWO method may suggest that the “process 1” of the degradation of LNG is a kinetic process that consists of an endothermic reversible reaction followed by an irreversible one; for such processes, at low conversions (α < 0.3), the beginning of the irreversible reaction is limited by the reversible reaction, while at high conversions (α > 0.3), Ea is dictated solely by the irreversible degradative process [33]. For the variation in Ea on α by the FR method, the tendency is similar at the beginning of the process (for α < 0.2, Ea decreases based on α), while in the 0.2 < α < 0.95 range, the Ea is not α-dependent, remaining in the variation range , which confirms the complex mechanism of the decomposition of LNG, but which is independent of the heating rate of the samples.
In the case of LNGMIX (Figure 10b), a different mechanism of decomposition is evidenced: at conversion degrees α ≤ 0.4, the tendency is similar to that of pure LNG, but with the increase in α, the mechanism drastically changes. This can be simply explained by the fact that competitive processes that degrade the excipients take place (especially for lactose monohydrate, which has the main decomposition process in this temperature, as seen in Figures S5 and S6). However, by comparing the values of activation energies for the degradation of these two samples at α < 0.4, we can conclude that the excipients have a stabilizing role in formulation, leading to an increase in stability of approx. 30% in terms of apparent activation energy.
In order to check the stabilizing effect of lactose and/or other excipients on the decomposition of LNG, we have investigated the second process of the degradation of LNG and LNGMIX. The advantage of investigating the kinetics of degradation of this process is due to the fact that lactose no longer exists in the analytical matrix, so the values of activation energies are no longer influenced by it. All the iconography and data associated with this investigation are presented in the Supplementary Materials (Figures S8–S12 and Table S1), except for the variation in Ea vs. α, which is presented in Figure 11.
The variation in Ea values vs. α for the investigated “process 2” reveal a similar FWO profile for LNG, suggesting that the decomposition mechanism in this step is similar to the one for the decomposition of LNG in the inferior temperature range (“process 1”). However, this similarity is not observed when using the FR method, where due to the differential processing of kinetic data, the variation is more scattered, confirming that this decomposition is also complex. For LNGMIX, a clear change of mechanism is observed, in comparison with the results obtained for LNGMIX during “process 1”.
Taking into account that “process 2” takes place in the absence of lactose, we have checked the stabilizing/destabilizing effect of this excipient on the first decomposition process, by calculating the ratio between the mean Ea values for LNGMIX and LNG for each isoconversional method, using the values from Table 3 (“process 1”, Ēa,LNG,FR1 = 89 kJ·mol−1; Ēa,LNG,FWO1 = 103 kJ·mol−1; Ēa,LNGMIX,FR1 = 130 kJ·mol−1; Ēa,LNGMIX,FWO1 = 134 kJ·mol−1) and Table S1 (“process 2”, Ēa,LNG,FR2 = 143 kJ·mol−1; Ēa,LNG,FWO2 = 179 kJ·mol−1; Ēa,LNGMIX,FR2 = 176 kJ·mol−1; Ēa,LNGMIX,FWO2 = 216 kJ·mol−1).
The ratios obtained for “process 1” were Ēa,LNGMIX,FR1/Ēa,LNG,FR1 = 1.46 for the FR method and Ēa,LNGMIX,FWO1/Ēa,LNG,FWO1 = 1.30 for the FWO method (in the presence of lactose); and for “process 2” the values were Ēa,LNGMIX,FR2/Ēa,LNG,FR2 = 1.23 for the FR method and Ēa,LNGMIX,FWO2/Ēa,LNG,FWO2 = 1.21 (in the absence of lactose). By analyzing the obtained ratios, we can conclude that the thermolysis of the mixture requires more energy for “process 1”, where lactose is present (by at least 30% higher in terms of activation energy), while in the second process, the stability is increased by approx. 20% by the remaining auxiliaries from formulation.
4. Conclusions
In this study, we deal with the instrumental screening of the emergency contraceptive agent levonorgestrel, both as a pure pharmaceutical ingredient and also in the presence of a complex analytical matrix, containing the excipients from a commercialized pharmaceutical formulation, prepared in our lab, in a mass ratio of 1:1 LNG and mixture of excipients.
Initially, three samples were investigated by FTIR spectroscopy in order to confirm the presence/identity of the API: LNG, LNGTAB, and LNGMIX; the results of spectral analysis confirmed the identity and purity of LNG, as well as the presence of this API in both the commercialized tablet (LNGTAB) and the enriched formulation LNGMIX. However, thermal analysis data failed to reveal the presence of the API in LNGTAB (the second process of decomposition of the API in LNGTAB is not evidenced in thermoanalytical curves); kinetic investigations were abandoned for this sample. In order to check the excipients’ effect, we have compared the kinetics of the decomposition of LNG versus LNGMIX, for both “process 1” of degradation and, respectively, “process 2” of degradation.
As the first kinetic study, the ASTM E698 method was employed as a preliminary investigational tool which indicated for both investigated samples two practically identical apparent activation energies, namely the following: for LNG, Ea is 92.5 kJ·mol−1, while for LNGMIX, Ea is 93.9 kJ·mol−1, which may suggest that the degradation process of this API is independent of the presence of excipients in the analytical matrix. Obtaining these values that are independent of any particular model involves a forced fitting to a first-order reaction mechanism, which can lead to flawed values for Ea.
In order to investigate the kinetics of degradation in depth, with the effects of the excipients, two isoconversional methods, namely, the differential method of Friedman (FR) and integral method of Flynn–Wall–Ozawa, were used. A discussion regarding the complexity of the mechanism of decomposition is carried out, emphasizing as well the stabilizing effects of the excipients, especially the effect of lactose.
Supplementary Materials
The following supporting information can be downloaded at: https://www.mdpi.com/article/10.3390/pr11113210/s1, Figure S1. The DSC curve recorded for LNG at β = 10 °C·min−1 on 30–300 °C temperature range; Figure S2. The DSC curve recorded for LNGMIX at β = 10 °C·min−1 on 30–300 °C temperature range; Figure S3. The DSC curve recorded for LNGTAB at β = 10 °C·min−1 on 30–300 °C temperature range; Figure S4. The DSC curve recorded for the excipients present in the pharmaceutical formulation in dynamic air atmosphere at β = 10 °C·min−1; Figure S5. Thermoanalytical data (TG) recorded for the excipients present in the pharmaceutical formulation in dynamic air atmosphere at β = 10 °C·min−1; Figure S6. Thermoanalytical data (DTG) recorded for the excipients present in the pharmaceutical formulation in dynamic air atmosphere at β = 10 °C·min−1; Figure S7. The plot according to the ASTM E698 kinetic method with the estimated activation energy of “process 1” for (a) LNG and (b) LNGMIX; Figure S8. The reaction progress vs. temperature for “process 2” at selected heating rates for (a) LNG and (b) LNGMIX; Figure S9. The reaction rate vs. temperature for “process 2” at selected heating rates for (a) LNG and (b) LNGMIX; Figure S10. The plot according to the ASTM E698 kinetic method with the estimated activation energy of “process 2” for (a) LNG and (b) LNGMIX; Figure S11. Linear plotting of the FR differential isoconversional method of the analyzed “process 1” of decomposition for (a) LNG and (b) LNGMIX; Figure S12. Linear plot of the FWO integral isoconversional method of the analyzed “process 2” of the decomposition process for (a) LNG and (b) LNGMIX; Table S1. Variation in Ea vs. α for both samples LNG and LNGMIX for “process 2” using the FR and FWO isoconversional methods.
Author Contributions
Conceptualization, A.R. and M.R.; data curation, A.R., A.L., I.L., C.M. and M.R.; formal analysis, I.L. and C.M.; investigation, A.R., F.P. and C.M.; methodology, A.L., F.P., I.L., C.M. and M.R.; resources, M.R.; software, A.R. and A.L.; supervision, A.L., F.P. and I.L.; validation, A.L.; visualization, M.R.; writing—original draft, A.R.; writing—review and editing, A.L., F.P. and I.L. All authors have read and agreed to the published version of the manuscript.
Funding
This research received no external funding.
Data Availability Statement
Raw data are available from the corresponding author of this work, on request.
Conflicts of Interest
The authors declare that they have no known competing financial interest or personal relationships that could have appeared to influence the work reported in this paper.
References
- Rodante, F.; Catalani, G.; Vecchio, S. Kinetic analysis of single or multi-step decomposition processes. Limits introduced by statistical analysis. J. Therm. Anal. Calorim. 2002, 68, 689–713. [Google Scholar]
- Vecchio, S.; Rodante, F.; Tomassetti, M. Thermal stability of disodium and calcium phosphomycin and the effects of the excipients evaluated by thermal analysis. J. Pharm. Biomed. Anal. 2001, 24, 1111–1123. [Google Scholar] [CrossRef] [PubMed]
- Verma, R.K.; Szilagyi, I.M.; Pielichowska, K.; Raftopoulos, K.N.; Šimon, P.; Melnikov, A.P.; Ivanov, D.A. Good laboratory practice in thermal analysis and calorimetry. J. Therm. Anal. Calorim. 2023, 148, 2211–2231. [Google Scholar] [CrossRef]
- Wan, Y.; He, H.; Li, F.; Zhang, P.; Gao, X.; Wang, Y.; Gan, Z.; Li, Y. Thermal stability, thermodynamics and kinetic study of (R)-(–)-phenylephrine hydrochloride in nitrogen and air environments. J. Therm. Anal. Calorim. 2023, 148, 2483–2499. [Google Scholar] [CrossRef]
- Akash, M.S.H.; Rehman, K. Drug Stability and Chemical Kinetics; Springer: Singapore, 2020; pp. 1–284. [Google Scholar]
- Ciou, H.H.; Lee, T.H.; Wang, H.C.; Ding, Y.R.; Tseng, C.J.; Wang, P.H.; Tsai, M.H.; Tzeng, S.L. Repurposing gestrinone for tumor suppressor through P21 reduction regulated by JNK in gynecological cancer. Transl. Res. 2022, 243, 21–32. [Google Scholar] [CrossRef] [PubMed]
- Chao, Y.-S.; Frey, N. Ulipristal Versus Levonorgestrel for Emergency Contraception: A Review of Comparative Clinical Effectiveness and Guidelines; Canadian Agency for Drugs and Technologies in Health: Ottawa, ON, Canada, 2018.
- Dinehart, E.; Lathi, R.B.; Aghajanova, L. Levonorgestrel IUD: Is there a long-lasting effect on return to fertility? J. Assist. Reprod. Genet. 2020, 37, 45–52. [Google Scholar] [CrossRef] [PubMed]
- Basaraba, C.N.; Westhoff, C.L.; Pike, M.C.; Nandakumar, R.; Cremers, S. Estimating systemic exposure to levonorgestrel from an oral contraceptive. Contraception 2017, 95, 398–404. [Google Scholar] [CrossRef] [PubMed]
- Fotherby, K. Pharmacokinetics of gestagens: Some problems. Am. J. Obstet. Gynecol. 1990, 163, 323–328. [Google Scholar] [CrossRef]
- Saadatkhah, N.; Carillo Garcia, A.; Ackermann, S.; Leclerc, P.; Latifi, M.; Samih, S.; Patience, G.S.; Chaouki, J. Experimental methods in chemical engineering: Thermogravimetric analysis—TGA. Can. J. Chem. Eng. 2020, 98, 34–43. [Google Scholar] [CrossRef]
- Topuz, F.; Kilic, M.E.; Durgun, E.; Szekely, G. Fast-dissolving antibacterial nanofibers of cyclodextrin/antibiotic inclusion complexes for oral drug delivery. J. Colloid Interface Sci. 2021, 585, 184–194. [Google Scholar] [CrossRef]
- Pires, F.Q.; Pinho, L.A.; Freire, D.O.; Silva, I.C.R.; Sa-Barreto, L.L.; Cardozo-Filho, L.; Gratieri, T.; Gelfuso, G.M.; Cunha-Filho, M. Thermal analysis used to guide the production of thymol and Lippia origanoides essential oil inclusion complexes with cyclodextrin. J. Therm. Anal. Calorim. 2019, 137, 543–553. [Google Scholar] [CrossRef]
- Szente, L.; Puskás, I.; Sohajda, T.; Varga, E.; Vass, P.; Nagy, Z.K.; Farkas, A.; Várnai, B.; Béni, S.; Hazai, E. Sulfobutylether-beta-cyclodextrin-enabled antiviral remdesivir: Characterization of electrospun- and lyophilized formulations. Carbohydr. Polym. 2021, 264, 118011. [Google Scholar] [CrossRef] [PubMed]
- Rout, S.R.; Kenguva, G.; Giri, L.; Kar, A.; Dandela, R. Binary to ternary drug-drug molecular adducts of the antihypertensive drug ketanserin (KTS) with advanced physicochemical properties. Chem. Commun. 2023, 59, 4640–4643. [Google Scholar] [CrossRef] [PubMed]
- Gunnam, A.; Nangia, A.K. Solubility improvement of curcumin with amino acids. CrystEngComm 2021, 23, 3398–3410. [Google Scholar] [CrossRef]
- Nugrahani, I.; Jessica, M.A. Amino acids as the potential co-former for co-crystal development: A review. Molecules 2021, 26, 3279. [Google Scholar] [CrossRef] [PubMed]
- Caillard, D.; Martin, J.L. (Eds.) Chapter 6 Experimental studies of Peierls-Nabarro-type friction forces in metals and alloys. In Pergamon Materials Series; Elsevier: Pergamon, Turkey, 2003; Volume 8, pp. 159–224. [Google Scholar]
- Krisyuk, B.E.; Sypko, T.M.; Zyuzin, I.N. Mechanism of thermal decomposition of 1-tert-butyl- and 1-ethyl-2-methoxydiazene-1-oxides. FirePhysChem 2023, 3, 142–148. [Google Scholar] [CrossRef]
- Vyazovkin, S.; Chrissafis, K.; Di Lorenzo, M.L.; Koga, N.; Pijolat, M.; Roduit, B.; Sbirrazzuoli, N.; Suñol, J.J. ICTAC Kinetics Committee recommendations for collecting experimental thermal analysis data for kinetic computations. Thermochim. Acta 2014, 590, 1–23. [Google Scholar] [CrossRef]
- Vyazovkin, S.; Burnham, A.K.; Criado, J.M.; Pérez-Maqueda, L.A.; Popescu, C.; Sbirrazzuoli, N. ICTAC Kinetics Committee recommendations for performing kinetic computations on thermal analysis data. Thermochim. Acta 2011, 520, 1–19. [Google Scholar] [CrossRef]
- Koga, N.; Vyazovkin, S.; Burnham, A.K.; Favergeon, L.; Muravyev, N.V.; Pérez-Maqueda, L.A.; Saggese, C.; Sánchez-Jiménez, P.E. ICTAC Kinetics Committee recommendations for analysis of thermal decomposition kinetics. Thermochim. Acta 2023, 719, 179384. [Google Scholar] [CrossRef]
- Vyazovkin, S.; Achilias, D.; Fernandez-Francos, X.; Galukhin, A.; Sbirrazzuoli, N. ICTAC Kinetics Committee recommendations for analysis of thermal polymerization kinetics. Thermochim. Acta 2022, 714, 179243. [Google Scholar] [CrossRef]
- Vyazovkin, S.; Burnham, A.K.; Favergeon, L.; Koga, N.; Moukhina, E.; Pérez-Maqueda, L.A.; Sbirrazzuoli, N. ICTAC Kinetics Committee recommendations for analysis of multi-step kinetics. Thermochim. Acta 2020, 689, 178597. [Google Scholar] [CrossRef]
- Muravyev, N.V.; Vyazovkin, S. The Status of Pyrolysis Kinetics Studies by Thermal Analysis: Quality Is Not as Good as It Should and Can Readily Be. Thermo 2022, 2, 435–452. [Google Scholar] [CrossRef]
- Flynn, J.H.; Wall, L.A. A quick, direct method for the determination of activation energy from thermogravimetric data. J. Polym. Sci. Part B Polym. Lett. 1966, 4, 323–328. [Google Scholar] [CrossRef]
- Starink, M.J. The determination of activation energy from linear heating rate experiments: A comparison of the accuracy of isoconversion methods. Thermochim. Acta 2003, 404, 163–176. [Google Scholar] [CrossRef]
- Friedman, H.L. New methods for evaluating kinetic parameters from thermal analysis data. J. Polym. Sci. Part B Polym. Lett. 1969, 7, 41–46. [Google Scholar] [CrossRef]
- Silverstein, R.M.; Webster, F.X.; Kiemle, D.J. Spectrometric Identification of Organic Compounds, 6th ed.; John Wiley & Sons: Hoboken, NJ, USA, 2004. [Google Scholar]
- Stuart, B.H. Infrared Spectroscopy: Fundamentals and Applications; John Wiley & Sons: Hoboken, NJ, USA, 2004; ISBN 0470011130. [Google Scholar]
- Norgestrel on Pubchem. Available online: https://pubchem.ncbi.nlm.nih.gov/compound/Norgestrel (accessed on 22 August 2023).
- Baul, B.; Ledeţi, A.; Cîrcioban, D.; Ridichie, A.; Vlase, T.; Vlase, G.; Peter, F.; Ledeţi, I. Thermal Stability and Kinetics of Degradation of Moxonidine as Pure Ingredient vs. Pharmaceutical Formulation. Processes 2023, 11, 1738. [Google Scholar] [CrossRef]
- Vyazovkin, S.; Wight, C.A. Kinetics in Solids. Annu. Rev. Phys. Chem. 1997, 48, 125–149. [Google Scholar] [CrossRef]
- Vyazovkin, S.V.; Lesnikovich, A.I. An approach to the solution of the inverse kinetic problem in the case of complex processes. Part 1. Methods employing a series of thermoanalytical curves. Thermochim. Acta 1990, 165, 273–280. [Google Scholar] [CrossRef]
Figure 1.
Chemical structure of levonorgestrel.

Figure 2.
FTIR spectra for LNG, LNGTAB, and LNGMIX.

Figure 3.
Thermoanalytical data (TG/DTG) recorded for LNG in dynamic air atmosphere at β = 10 °C·min−1.
Figure 3.
Thermoanalytical data (TG/DTG) recorded for LNG in dynamic air atmosphere at β = 10 °C·min−1.

Figure 4.
Thermoanalytical data (TG/DTG) recorded for LNGTAB in dynamic air atmosphere at β = 10 °C·min−1.
Figure 4.
Thermoanalytical data (TG/DTG) recorded for LNGTAB in dynamic air atmosphere at β = 10 °C·min−1.

Figure 5.
Thermoanalytical data (TG/DTG) recorded for LNGMIX in dynamic air atmosphere at β = 10 °C·min−1.
Figure 5.
Thermoanalytical data (TG/DTG) recorded for LNGMIX in dynamic air atmosphere at β = 10 °C·min−1.
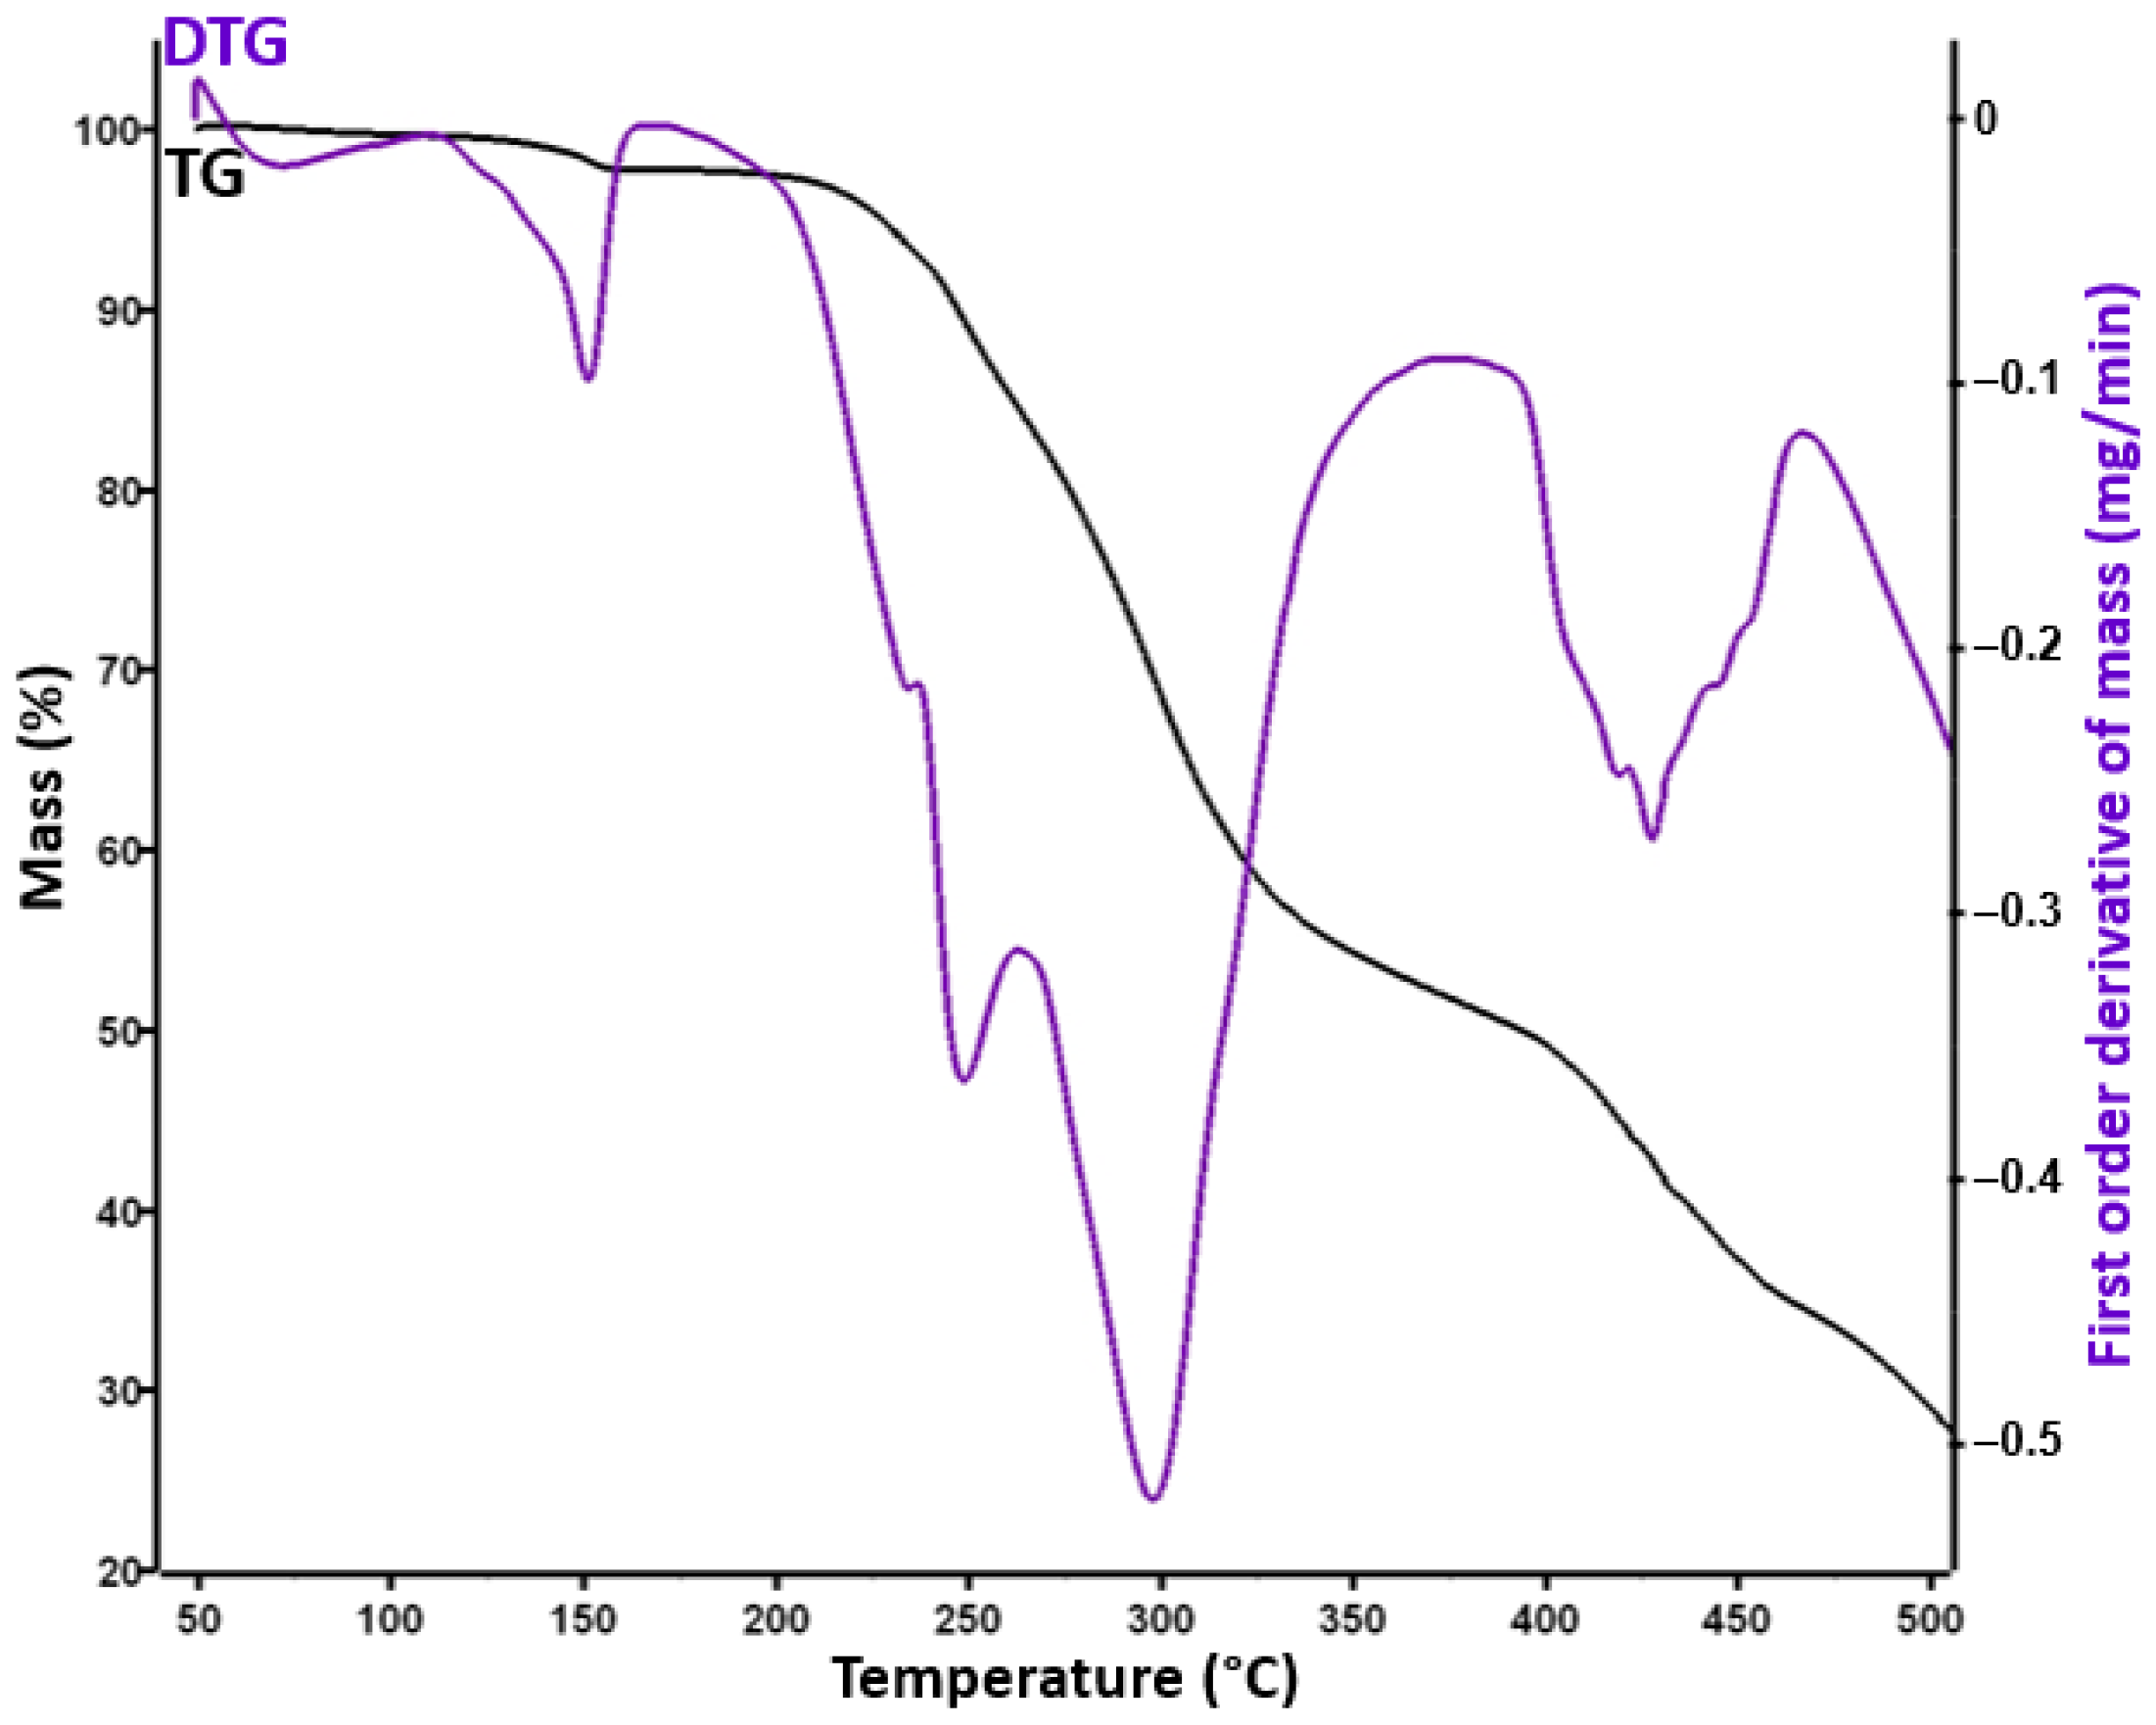
Figure 6.
The reaction progress vs. temperature for “process 1” at selected heating rates for (a) LNG and (b) LNGMIX.
Figure 6.
The reaction progress vs. temperature for “process 1” at selected heating rates for (a) LNG and (b) LNGMIX.

Figure 7.
The reaction rate vs. temperature for “process 1” at selected heating rates for (a) LNG and (b) LNGMIX.
Figure 7.
The reaction rate vs. temperature for “process 1” at selected heating rates for (a) LNG and (b) LNGMIX.
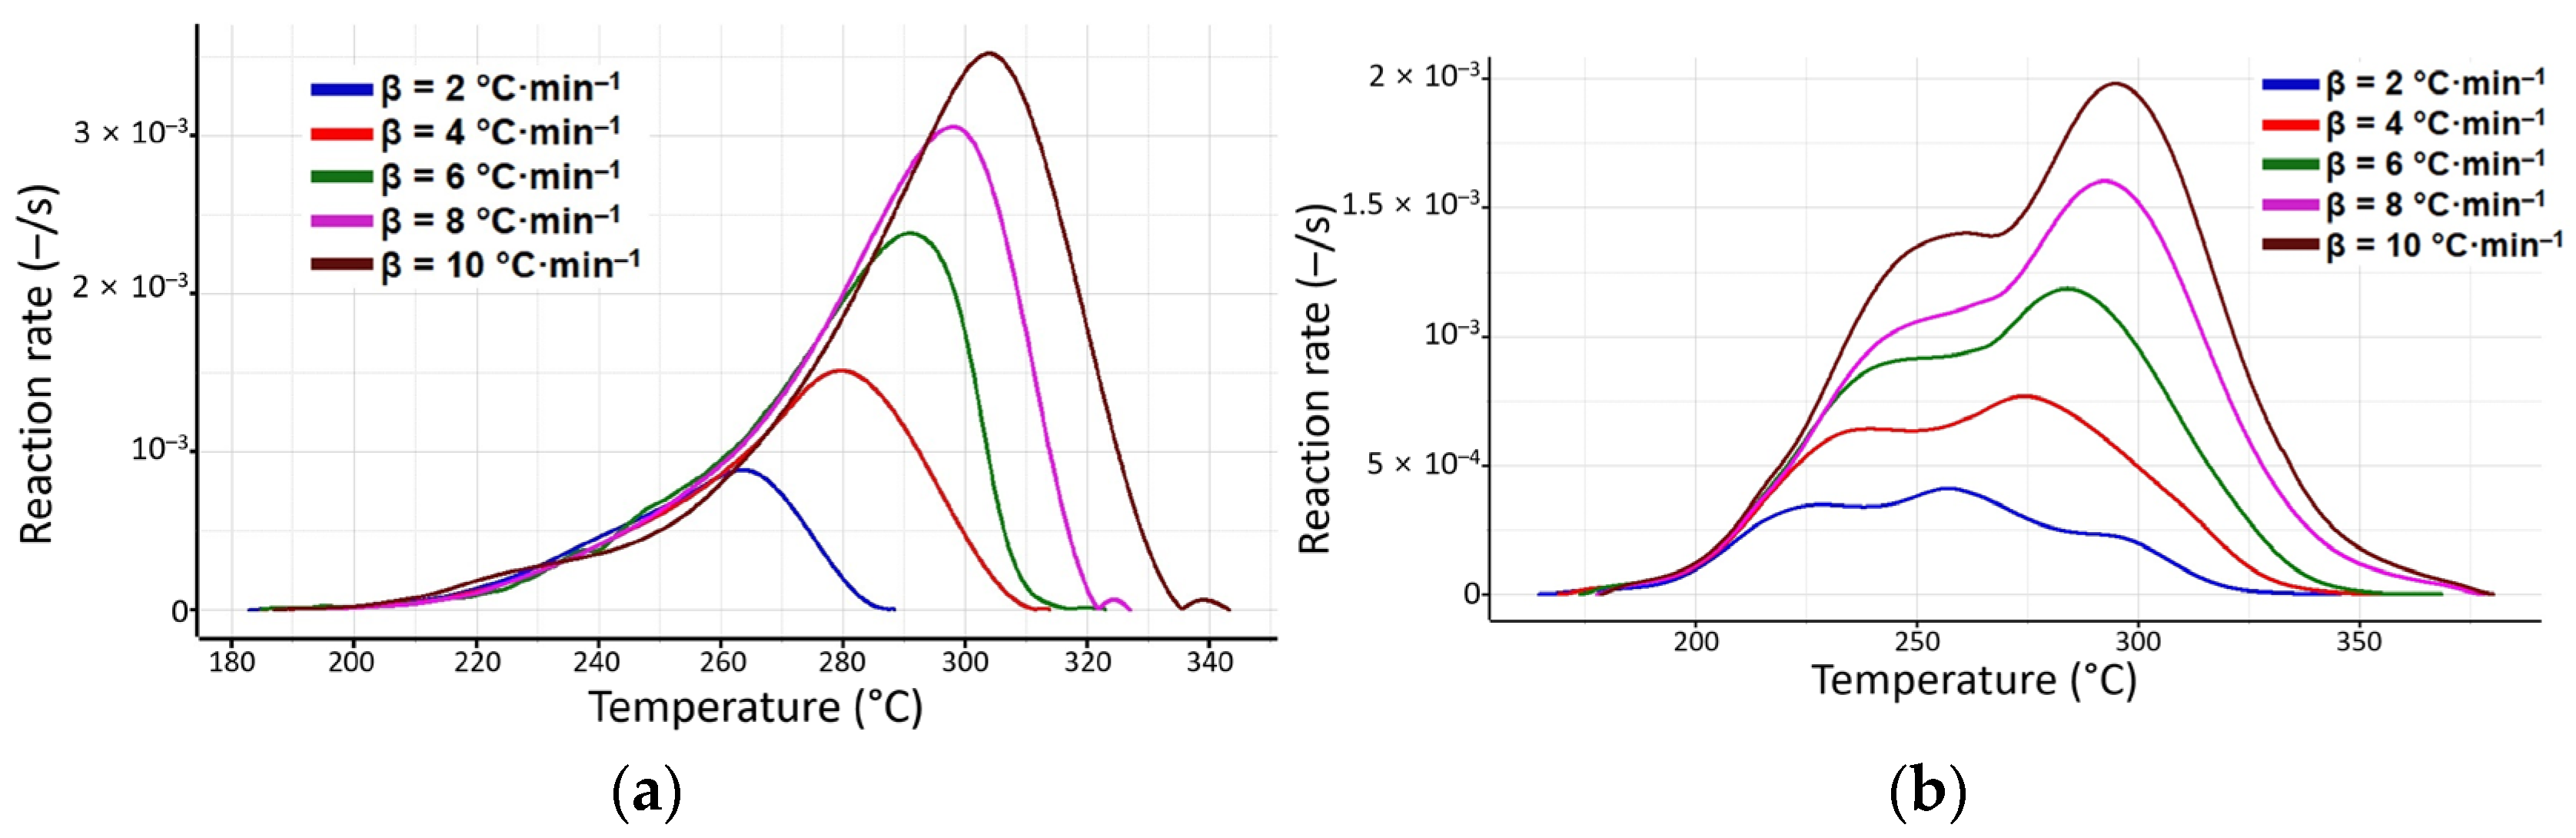
Figure 8.
Linear plotting of the FR differential isoconversional method of the analyzed “process 1” of decomposition for (a) LNG and (b) LNGMIX.
Figure 8.
Linear plotting of the FR differential isoconversional method of the analyzed “process 1” of decomposition for (a) LNG and (b) LNGMIX.

Figure 9.
Linear plot of the FWO integral isoconversional method of the analyzed “process 1” of decomposition process for (a) LNG and (b) LNGMIX.
Figure 9.
Linear plot of the FWO integral isoconversional method of the analyzed “process 1” of decomposition process for (a) LNG and (b) LNGMIX.
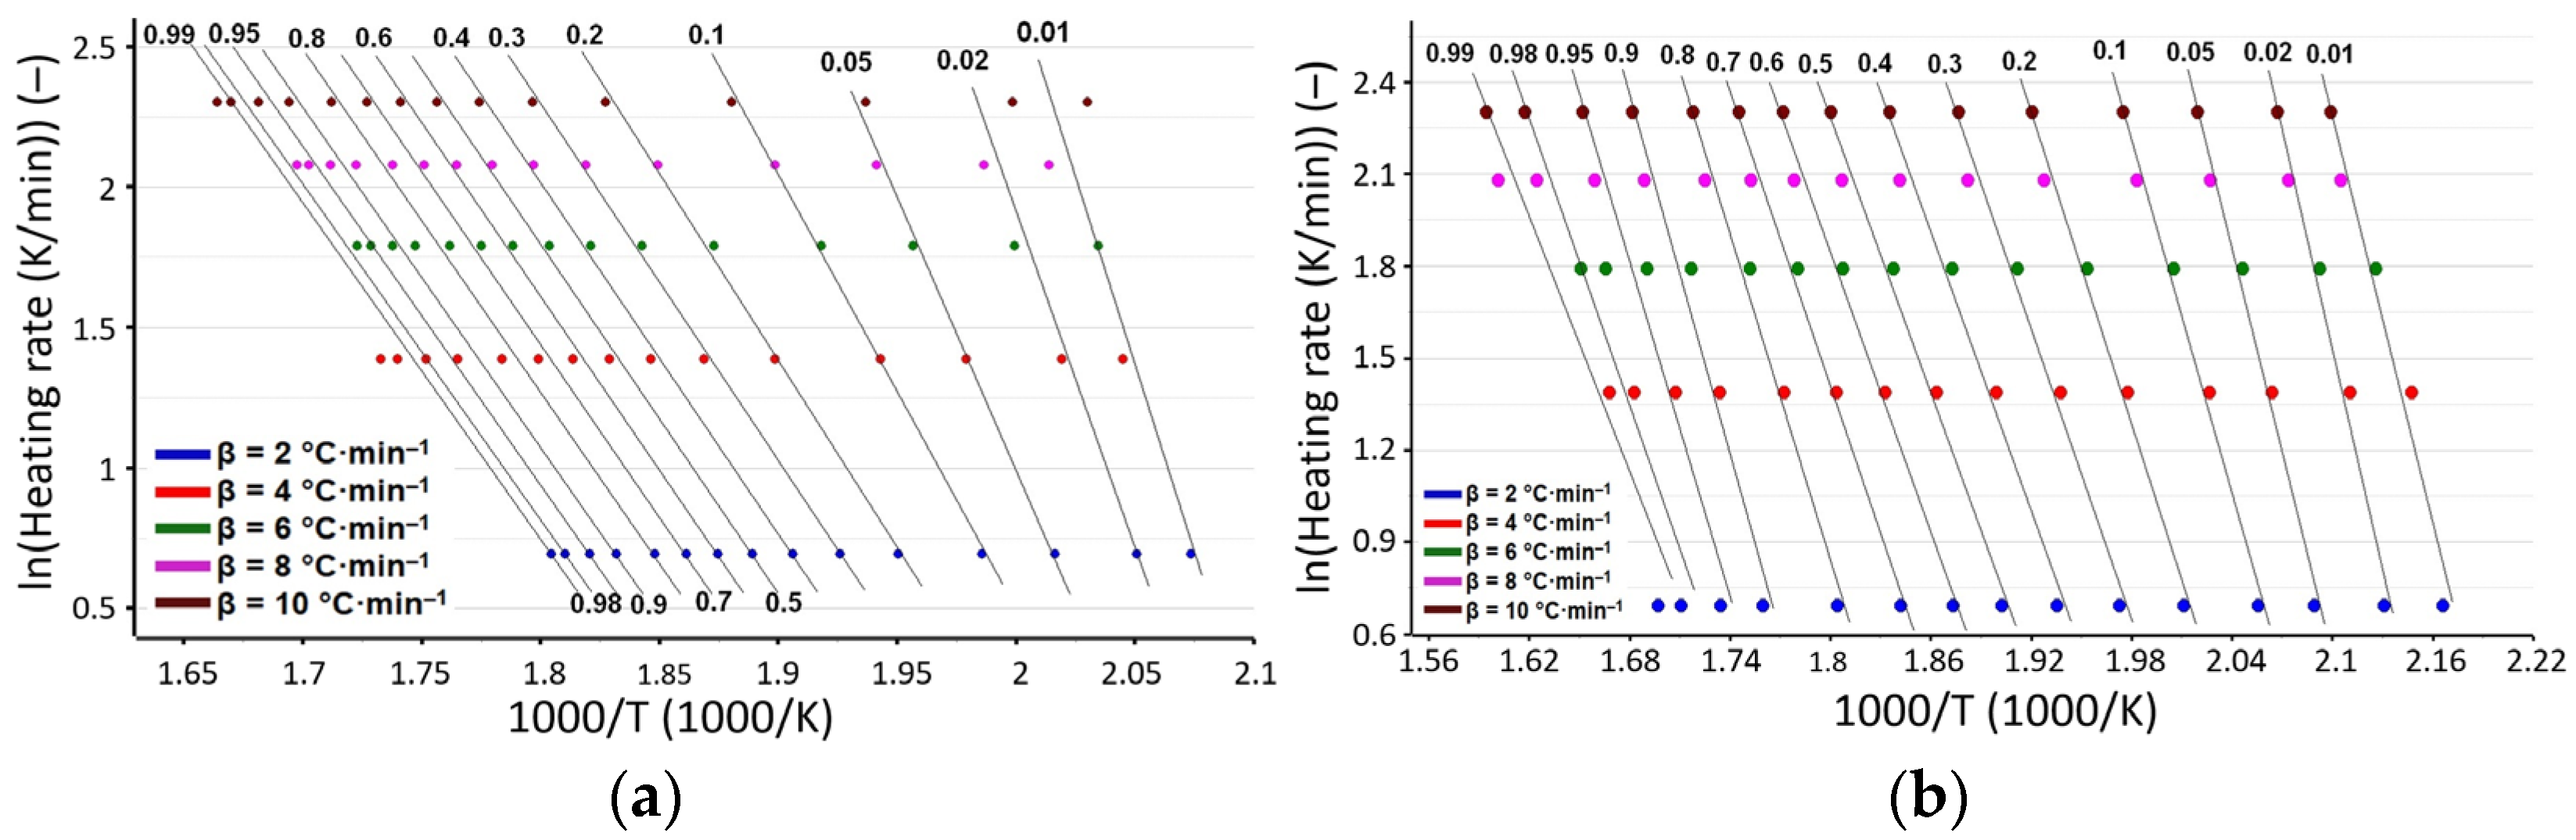
Figure 10.
Variation in Ea vs. α according to the FWO and FR isoconversional methods of the analyzed decomposition “process 1” for (a) LNG and (b) LNGMIX. With * is represented the superior limit , while with ** is represented the inferior limit .
Figure 10.
Variation in Ea vs. α according to the FWO and FR isoconversional methods of the analyzed decomposition “process 1” for (a) LNG and (b) LNGMIX. With * is represented the superior limit , while with ** is represented the inferior limit .

Figure 11.
Variation in Ea vs. α according to the FWO and FR isoconversional methods of the analyzed decomposition “process 2” for (a) LNG and (b) LNGMIX. With * is represented the superior limit , while with ** is represented the inferior limit .
Figure 11.
Variation in Ea vs. α according to the FWO and FR isoconversional methods of the analyzed decomposition “process 2” for (a) LNG and (b) LNGMIX. With * is represented the superior limit , while with ** is represented the inferior limit .


Table 1.
Decomposition steps observed during thermolysis of LNG, LNGTAB, LNGMIX, and lactose at β = 10 °C·min−1 in dynamic air flow.
Table 1.
Decomposition steps observed during thermolysis of LNG, LNGTAB, LNGMIX, and lactose at β = 10 °C·min−1 in dynamic air flow.
| Sample | Decomposition Step | Ti (°C) | Tf (°C) | Tmax·DTG (°C) | Tpeak·DSC (°C) | Δm (%) |
|---|---|---|---|---|---|---|
| LNG | I | 192 | 355 | 306 | 243 | 28.3 |
| II | 355 | 483 | 433; 443 | - | 41.04 | |
| LNGTAB | I | 50 | 115 | 68 | 67.1 | 1.8 |
| II | 115 | 165 | 151 | 149.8 | 3.72 | |
| III | 165 | 267 | 242 | 215; 229 | 19.9 | |
| IV | 267 | 384 | 306 | - | 45.4 | |
| LNGMIX | I | 51 | 110 | 71 | - | 0.48 |
| II | 110 | 178 | 151 | 149 | 1.88 | |
| III | 178 | 263 | 233; 248 | 214; 238 | 13.34 | |
| IV | 263 | 380 | 297 | - | 32.61 | |
| V | 380 | 466 | 418; 427 | - | 17.17 | |
| Lactose monohydrate | I | 100 | 171 | 146 | 147 | 4.99 |
| II | 218 | 264 | 236 | 220; 239 | 8.7 | |
| III | 264 | 391 | 306 | - | 60.6 | |
| Silicon dioxide | - | - | - | - | - | - |
| Magnesium stearate | I | 68 | 117 | 101 | 91; 116 | 3.24 |
| II | 204 | 437 | 404; 413 | - | 76.44 | |
| III | 437 | 520 | 460 | - | 10.18 | |
| Starch | I | 30 | 141 | 72 | 105 | 10.11 |
| II | 228 | 346 | 303 | - | 59.12 | |
| Talc | - | - | - | - | - | - |
Table 2.
DTG temperature interval for “process 1” (°C) for the kinetic analysis of both LNG and LNGTAB at selected heating rates.
Table 2.
DTG temperature interval for “process 1” (°C) for the kinetic analysis of both LNG and LNGTAB at selected heating rates.
| β (°C·min−1) | DTG Temperature Interval for “Process 1” (°C) for Kinetic Analysis of Samples | |
|---|---|---|
| LNG | LNGMIX | |
| 2 | 182–288 | 164–345 |
| 4 | 184–313 | 169–356 |
| 6 | 184–322 | 173–368 |
| 8 | 187–327 | 177–378 |
| 10 | 192–355 | 178–380 |
Table 3.
Variation in Ea vs. α for both samples LNG and LNGMIX for “process 1” using the FR and FWO isoconversional methods.
Table 3.
Variation in Ea vs. α for both samples LNG and LNGMIX for “process 1” using the FR and FWO isoconversional methods.
| α | Variation in Ea (kJ·mol−1) vs. α for Process 1 for | |||
|---|---|---|---|---|
| LNG | LNGMIX | |||
| FR | FWO | FR | FWO | |
| 0.05 | 99.1 | 153.8 | 145.1 | 175.6 |
| 0.1 | 82.7 | 122.1 | 124.9 | 152.1 |
| 0.15 | 80.8 | 110.9 | 119.7 | 141.1 |
| 0.2 | 82.3 | 105.3 | 115.1 | 133.9 |
| 0.25 | 84.8 | 102.2 | 112.3 | 128.4 |
| 0.3 | 87.3 | 100.4 | 111.9 | 124.5 |
| 0.35 | 89.5 | 99.4 | 111.5 | 121.7 |
| 0.4 | 91.1 | 98.8 | 110.8 | 119.7 |
| 0.45 | 91.9 | 98.5 | 112.7 | 118.6 |
| 0.5 | 91.9 | 98.2 | 115.6 | 118.4 |
| 0.55 | 91.5 | 98.0 | 119.3 | 118.9 |
| 0.6 | 91.0 | 97.8 | 125.6 | 120.1 |
| 0.65 | 90.5 | 97.5 | 133.9 | 122.4 |
| 0.7 | 90.1 | 97.3 | 144.9 | 126.2 |
| 0.75 | 89.9 | 97.0 | 158.7 | 132.1 |
| 0.8 | 89.9 | 96.7 | 171.5 | 140.5 |
| 0.85 | 89.8 | 96.3 | 172.6 | 149.7 |
| 0.9 | 89.6 | 95.9 | 151.4 | 154.0 |
| 0.95 | 89.1 | 95.2 | 110.3 | 144.5 |
| Ēa/kJ·mol−1 | 89 ± 1 | 103 ± 3 | 130 ± 5 | 134 ± 4 |
Disclaimer/Publisher’s Note: The statements, opinions and data contained in all publications are solely those of the individual author(s) and contributor(s) and not of MDPI and/or the editor(s). MDPI and/or the editor(s) disclaim responsibility for any injury to people or property resulting from any ideas, methods, instructions or products referred to in the content. |
© 2023 by the authors. Licensee MDPI, Basel, Switzerland. This article is an open access article distributed under the terms and conditions of the Creative Commons Attribution (CC BY) license (https://creativecommons.org/licenses/by/4.0/).
Share and Cite
MDPI and ACS Style
Ridichie, A.; Ledeţi, A.; Peter, F.; Ledeţi, I.; Muntean, C.; Rădulescu, M. Kinetic Investigation of the Oxidative Thermal Decomposition of Levonorgestrel. Processes 2023, 11, 3210. https://doi.org/10.3390/pr11113210
AMA Style
Ridichie A, Ledeţi A, Peter F, Ledeţi I, Muntean C, Rădulescu M. Kinetic Investigation of the Oxidative Thermal Decomposition of Levonorgestrel. Processes. 2023; 11(11):3210. https://doi.org/10.3390/pr11113210
Chicago/Turabian StyleRidichie, Amalia, Adriana Ledeţi, Francisc Peter, Ionuţ Ledeţi, Cornelia Muntean, and Matilda Rădulescu. 2023. "Kinetic Investigation of the Oxidative Thermal Decomposition of Levonorgestrel" Processes 11, no. 11: 3210. https://doi.org/10.3390/pr11113210
Note that from the first issue of 2016, this journal uses article numbers instead of page numbers. See further details here.