1. Introduction
According to Fast-Berglund and Stahre [
1], systems are gradually achieving a dominant position due to the trend toward organizational socialization. Small-batch customization needs have created significant challenges for the industry’s operational and productive processes. Simultaneously, this trend has promoted the development of traditional production systems, leading to innovations in production systems, namely through the decomposition of certain tasks, and the full use of distributed production resources, and also the adoption of more flexible ways to satisfy customer needs. Production task specificities are increasing and becoming more customized, dynamic, and uncertain [
2].
As stated by Zaidi et al. [
3], the customer-focused production system has become the main trend in recent years due to its ability to distribute tasks and establish a good match between supply and demand. This trend has been followed by the development of new types of intelligent production, such as Industry 4.0.
In addition, despite the focus on the customer, the production processes must contribute to the mitigation of occupational risks, namely through the minimization of ergonomic risks. As specified by Dalle Mura and Dini [
4], ergonomics is an essential area for solving problems related to assembly lines due to its impact on productivity and human-factor issues. One of the key aspects of the assembly operation that might lead to an overload for the worker is the frequent execution of repetitive movements and the manipulation of heavy items. The adequate distribution of assembly operations, as well as the relative workloads on a production line, can substantially improve ergonomic aspects according to the anthropometric and physiological profile of the worker [
5].
According to Hills et al. [
6], physical activity-based techniques are frequently employed to assess the nature and magnitude of movement performed by subjects in various contexts. Often, objective physical activity monitoring methods are used to predict human metabolic energy expenditure. Once metabolic energy is employed to determine the ergonomic weight of the workers [
7], according to Battini et al. [
8], the three primary ergonomic parameters measured during physical work—level, repetitiveness, and duration—can be described by the estimation of ergonomic risks using metabolic energy. Thus, excessive energy expenditure, which is related to repetitive movements during work, is linked to metabolic stress, fatigue, and discomfort. In addition, workers frequently alter the muscle demand patterns to compensate for the exhaustion caused by the repetitive movements, leading to inadequate postures.
On the other hand, task scheduling is a process that exerts a considerable influence on the performance of manufacturing activities, lowering costs, and reducing ergonomic risks [
9]. In the task scheduling process, the proper distribution of human resources among activities is crucial to the production schedule [
10]. In organizations, tasks must be scheduled and allocated, considering the nature of the task and staff availability. Thus, to increase an organization’s capacity for decision-making, it is essential to develop an adequate optimization model for human resource management.
Evolutionary optimization algorithms have been extensively used to solve a variety of optimization problems. Besides their parallelism capacity, these algorithms are chosen due to several of their intelligent characteristics, including adaptability, self-organization, and self-learning [
11]. Thus, to obtain optimal allocation solutions, many evolutionary models have been used.
According to Gupta and Garg [
12], the ant colony optimization (ACO) algorithm is the most effective technique for solving NP-complete problems, such as the travelling salesman problem. The algorithm was proposed by Dorigo and Blum [
13] as a nature-inspired metaheuristic for solving hard combinatorial optimization problems in a satisfactory computation time.
Numerous applications for the ACO algorithm have been suggested to solve the task scheduling problem. Moosavi et al. [
14] presented a population-based heuristic algorithm, based on an ACO algorithm, to solve the problem of human resources scheduling for a residential care facility to help to deal with the situation of the COVID-19 pandemic by creating a new objective function, minimizing the number of different staff members displaced within each room.
Li and Wu [
15] proposed a method based on an ACO algorithm to define user-quality requirements for task completion while taking load balancing into account in System Wide Information Management (SWIM) task-scheduling, allowing task execution time to be reduced, system resource utilization to be improved, and SWIM to remain in an equilibrium load-balanced state. Campos Ciro et al. [
16] applied an ACO method to solve a scheduling problem related to a mechanical production facility to reduce the total flow time, considering a multi-skill resource constraint, and allowing its application to large industrial problems. To solve a problem of combinatorial optimization related to the scheduling of a surgery room, including the restrictions of multiple nurses, Xiang et al. [
17] suggested a modified ACO algorithm with a two-level ant graph model and three types of pheromones. Mak et al. [
18] created a methodology based on ACO algorithms to solve for the manufacturing of cell creation and scheduling problems, allowing them to reduce the material distance of movement while considering specific constraints, for instance, product delivery due dates, among others.
There is a dearth of research on task-scheduling issues that take occupational risk into account, even though the occupational health and safety field has always kept up with industrial revolutions and advances, responding constructively to new technologies and adaptive needs. [
7].
By proposing a new approach based on an ant colony optimization algorithm to solve a task scheduling problem while considering occupational risk aspects, this work seeks to fill a gap in the literature and enable the reduction of occupational risks as well as the improvement of production operations efficiency.
According to Botti et al. [
19], a task rotation strategy based on the exchange between high- and low-demanding tasks provides the workers with an important recovery period. Thus, this work aims to create a method that allows for the diversification of content in the tasks carried out during a workday by the rotation and alternation of tasks, ensuring the minimization of ergonomic risks. Therefore, the main purposes of this work are the identification and quantification of ergonomic risks involved in the wine industry and the implementation of a method to optimize task scheduling from the perspective of ergonomic risk mitigation.
2. Materials and Methods
The methodology applied in this work was based on two stages. The first one included the occupational risk assessment associated with the wine sector, integrating the detection, assessment, and estimation of ergonomic risks; the second stage comprised the production task scheduling optimization by applying an ACO algorithm.
Thus, the first stage encompassed two vectors; the first one was based on an ergonomic risk survey, which was substantiated by the work of several authors [
20,
21,
22,
23], and the second vector quantified the ergonomic risks, determined by the estimation of energy expenditure based on the energy spent in the several tasks that comprise the manufacturing processes, determined by comparing the specific tasks to those already assessed and classified in the work of Ainsworth et al. [
24,
25,
26].
The second stage concerns the application of an ACO algorithm which includes the data from the prior stage. Due to its outstanding performance, when compared to several algorithms, including the genetic algorithm, the ACO algorithm was chosen for certain types of problems, such as solving dynamic integrated process-planning and scheduling [
27].
2.1. The Optimization Model
For the combinatorial optimization type of problem, the variables are chosen from a finite set of values, and the aim is to find the best values to maximize or minimize a goal [
28,
29]. The ACO employs a technique to avoid scanning the whole search space and focuses exclusively on the most favourable areas [
30].
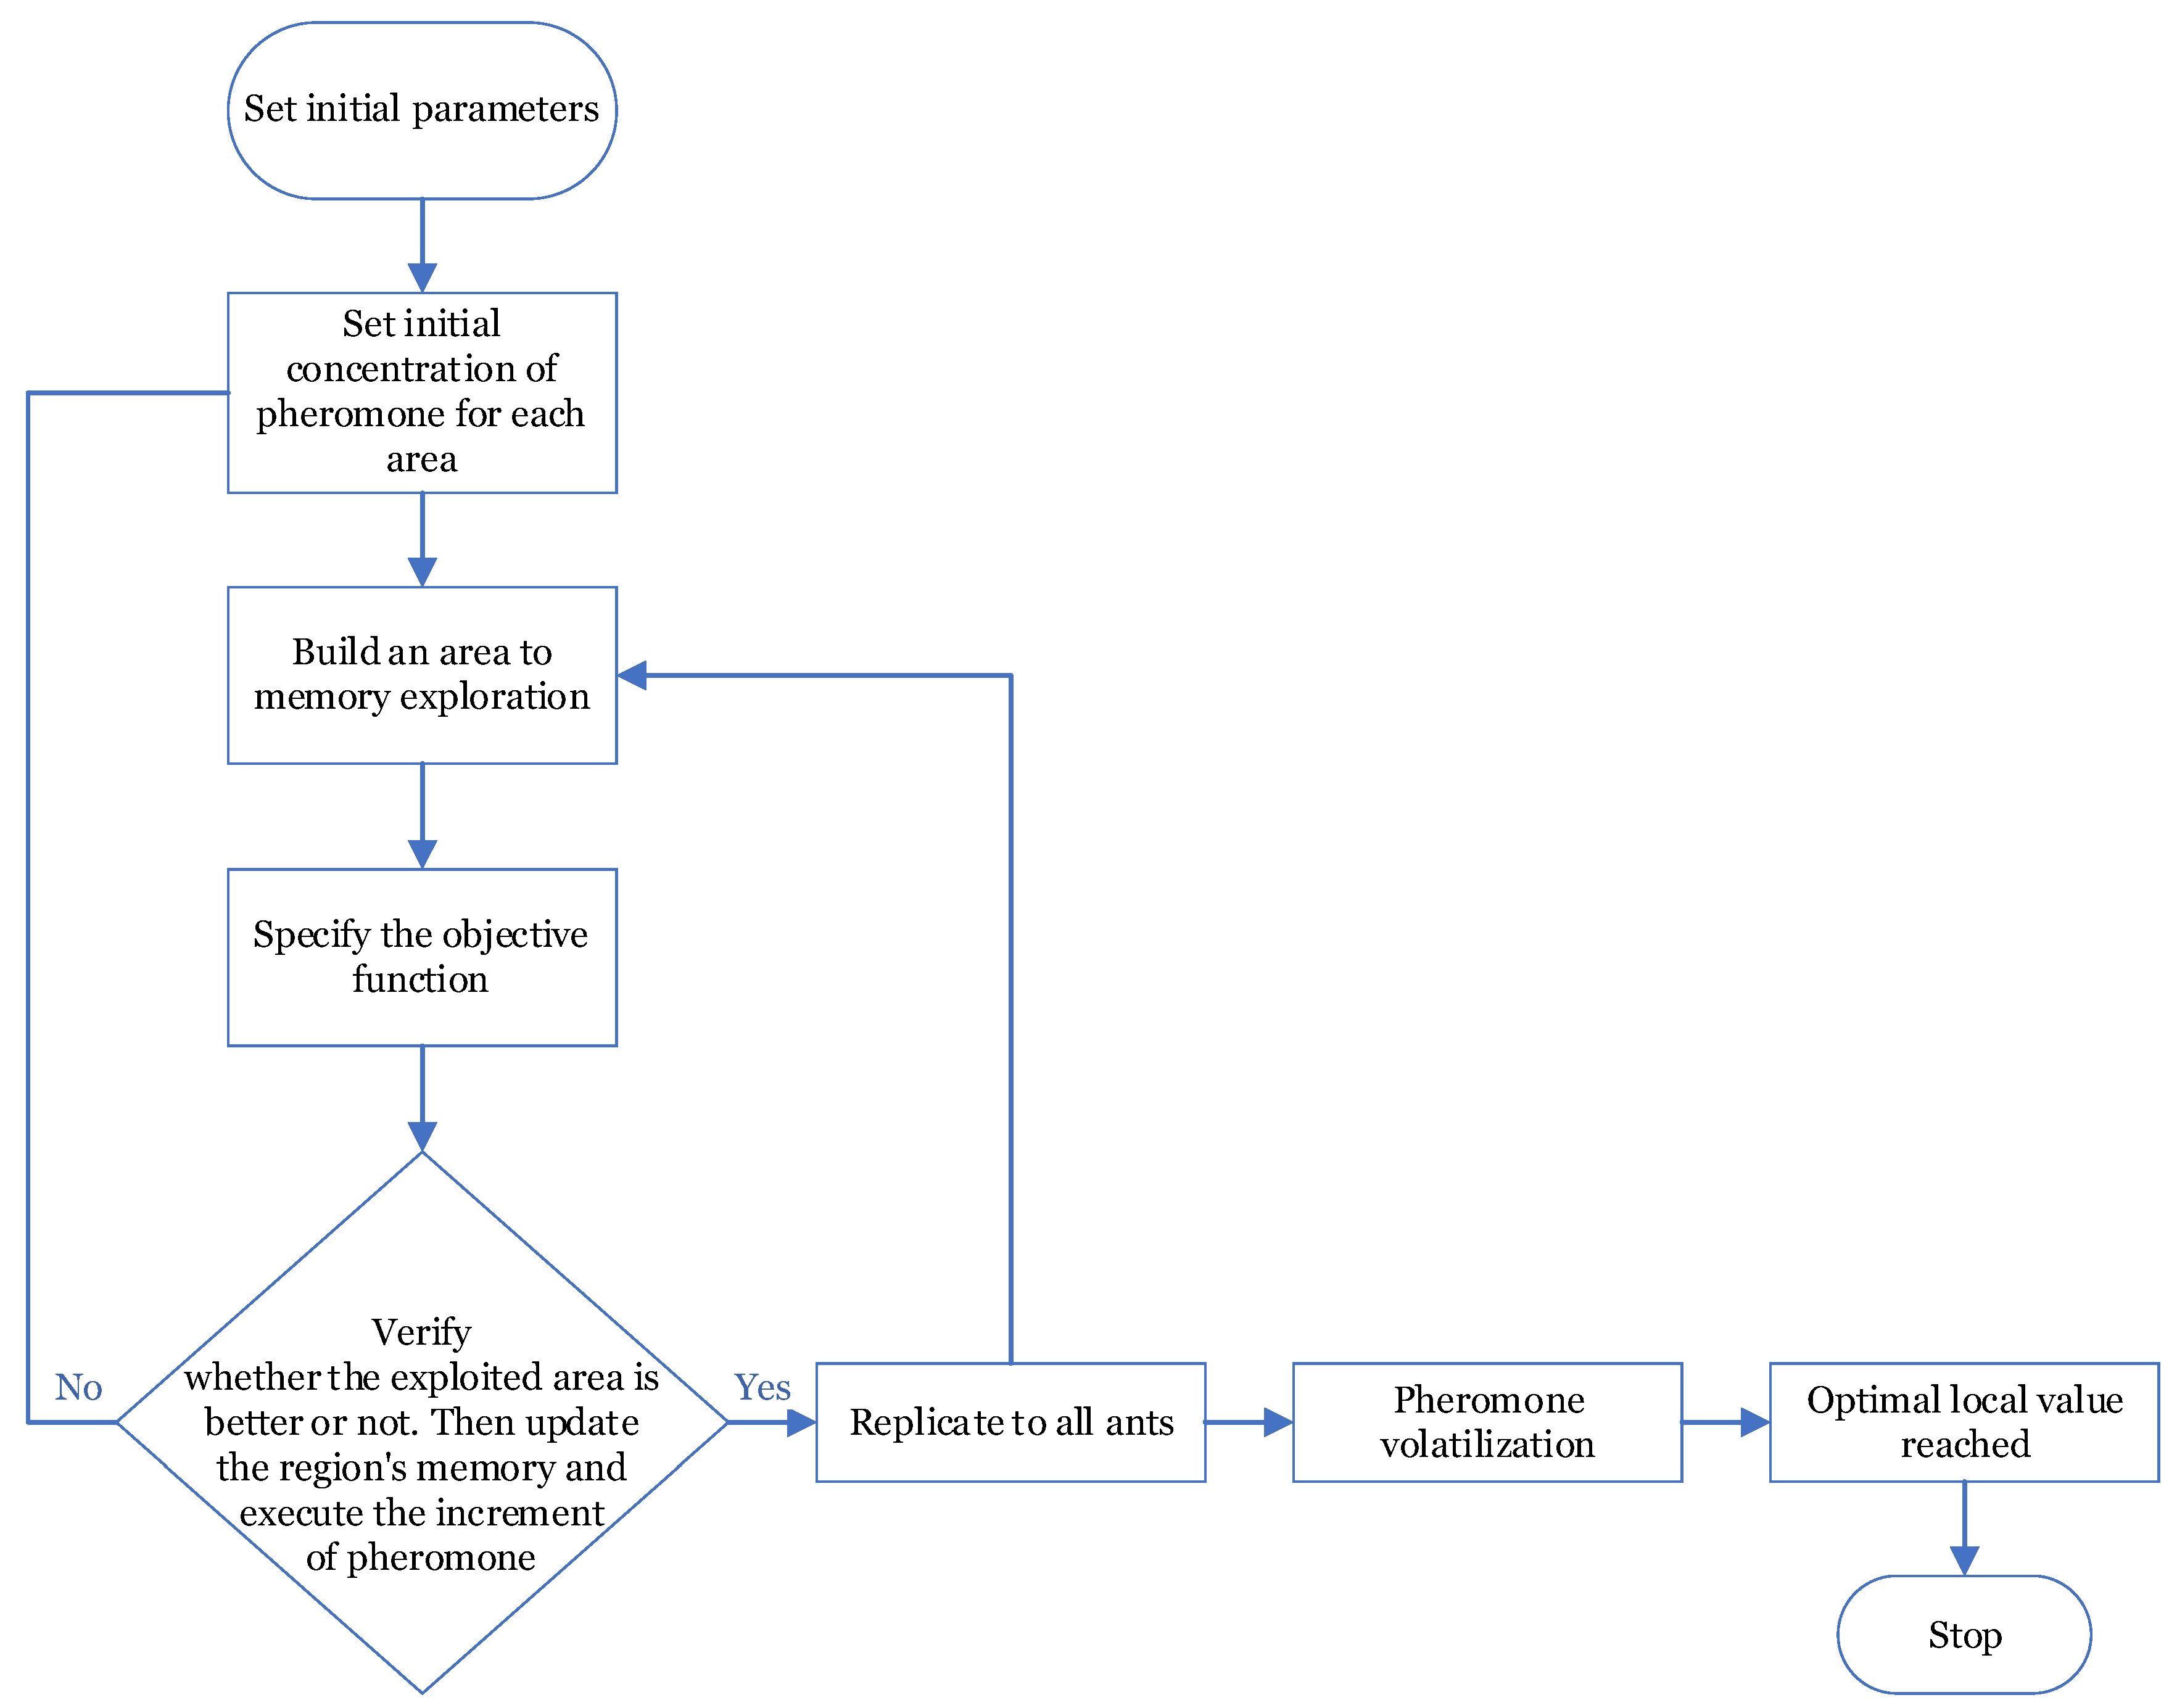
The flowchart described in
Figure 1 shows the main steps for the implementation of an ACO algorithm. In the first place, the variables must be created, and then ACO produces the global ants and computes their fitness. At this point, the pheromone concentration is initialized for each area. As the iterations evolve, global ants are sequentially generated, their fitness is computed, the pheromone intensity is updated, and the weak areas are limited. If there is an improvement of fitness, then the local ants are moved to the promising areas; else, a new direction for the random search will be selected. The cycles of ACO are based on local and global searches. As a result, local ants have the capacity to migrate in the direction of a latent area, bringing the optimum solution according to the probability of transition related to the area [
31].
The model’s purpose is to optimize the scheduling of tasks in a production department by reorganizing spatial positions, considering the node distances in-between. The representation of the nodes, which represent tasks in the production department, is carried out in a Cartesian coordinate system, where the x coordinate axis represents the sequence of activities to be performed throughout the production process in each scenario, according to their affinities or precedence, while the y coordinate axis concerns the metabolic equivalents (MET) associated with each activity/task, according to the ergonomic risk assessment performed. Therefore, the nodes (activities) are distributed along a plane with two dimensions and organized according to the respective MET and task sequence coordinates. Regarding the dimension of the graphs, this is directly related to the number of work activities established for each scenario.
The structure of the graph obtained represents the sequence of activities to be performed throughout the production process in each scenario, according to respective affinities or precedence, considering the weight of the associated metabolic equivalents according to the assessment of ergonomic risks.
It is important to highlight that the metabolic energy values used in the ergonomic risk assessment were estimated by considering the tasks studied by Ainsworth et al. [
24,
25,
26], whose average value for each activity was calculated as displayed in
Table 1.
The core operators that resolve combinatorial operational problems were implemented in the ACO [
32]:
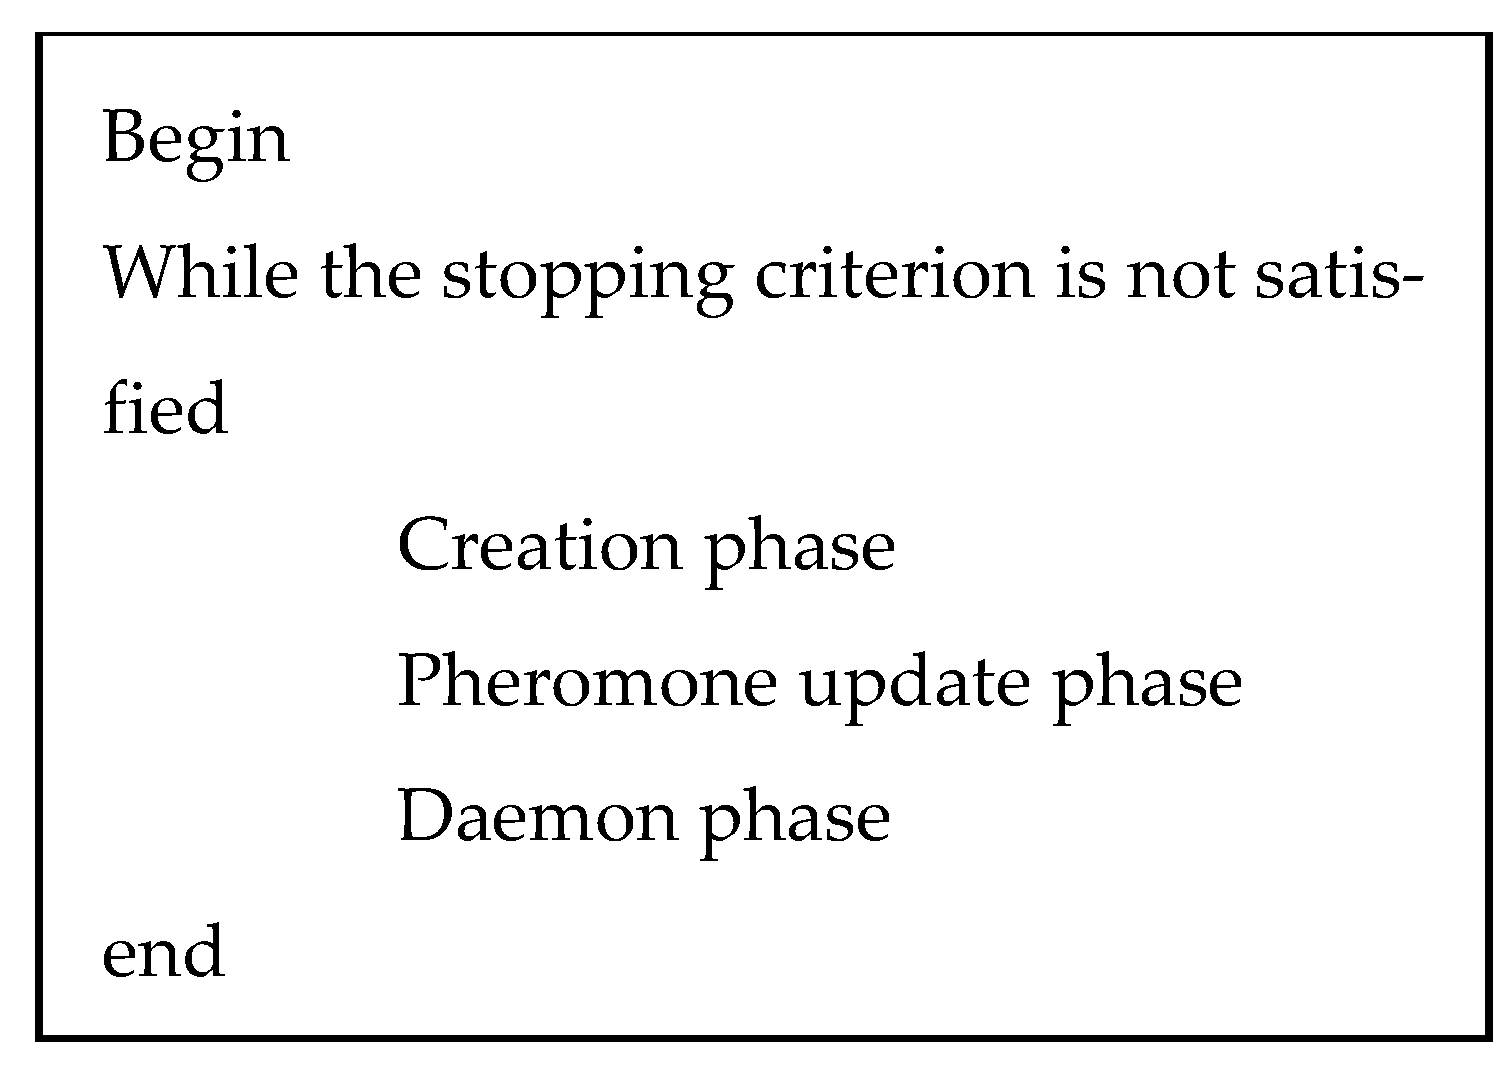
The pseudocode of the ACO algorithm and the sequence of the main phases are shown in
Figure 2.
2.1.1. Main Objective
Due to the many criteria applicable to the wine industry, such as flowtime, load balancing, matching proximity, turnaround time, and total weighted completion time, among others, the problem of job scheduling can be formulated as a multi-objective type of problem [
33].
In the present study, the load-balancing criterion, which is related to the ergonomic load, was considered the main optimization objective. The ergonomic load is based on metabolic energy metrics, which occur when several tasks inherent in the production process are performed. It is considered the best algorithm for task scheduling problems when its application provides a considerable reduction in the value of the ergonomic load, which translates into the minimization capability of efficient human expenditure of metabolic energy. Thus, the expenditure of metabolic energy is defined as:
where
Sched corresponds to all possible schedules, and
Jobs is the group of all jobs to be scheduled, denoting the time that tasks are finished [
33].
2.1.2. Creation Phase
Artificial ants are produced during the creation phase using a limited number of possible solutions. A set of values drawn from the finite main set may be considered as each ant [
34].
A component from the main assembly is selected and added to the artificial ant in this phase. The process is done based on the solution build engine.
At this stage, apart from the main assembly is chosen and added to the artificial ant. The solution construction engine is used to guide the process.
The selection process is carried out using the following probability [
35]:
where
shows the number of edge pheromones
i,
j, and
α defines the effect of the pheromone,
specifies the edge desirability.
i,
j, and
β define influence of desirability [
35].
A weighting function is used to determine if an edge is desirable. This function, which is essentially a heuristic, assigns a value to each edge’s quality. To reduce the distance,
can be defined as follows [
36]:
where
corresponds to the length of the edge
i,
j.
2.1.3. Pheromone Phase
In this stage, the communication capacity between the artificial ants and the capabilities for decision-making regarding the creation phase are provided. The phase consists of pheromone evaporation and pheromone deposit [
28,
29]. Pheromone concentration is calculated and updated using the following equations:
where
e is the pheromone evaporation rate, representing the rate of pheromone volatilization per unit of time, and
specifies the proportion of remaining pheromone,
. The pheromone evaporation rate is proportional to
, and inversely proportional to the effect between the solutions achieved.
is the pheromone increase during the
t time between tasks
i and
j. The computation is made according to the following equation:
is the length (value of cost) of each kth ant’s route travelled, that is, the value of the objective function that must be satisfied for the ant to find a solution, and is the tour done by ant k at iteration t.
2.1.4. Daemon Phase
As stated by Monteiro et al. [
37], in the ACO algorithm, ants communicate with each other locally through the phenomenon of dissemination.
At this stage, a centralized command structure is added to aid the ants in determining the optimum solution to a particular problem. Different methods can be employed to affect the research. For instance, it is possible to keep the optimal path used in each iteration or include more local searches in each artificial ant, a process that is equivalent to elitism in the genetic algorithm [
37].
2.1.5. Algorithm Execution
The algorithm used follows these general steps:
Step 1. Pheromone initialization. The initial inputs and parameters for applying the model to each scenario were as per the following:
Initial number of ants = 50;
Maximum number of iterations = 30;
Initial concentration of pheromones (
CFi), which is calculated using the following equation:
where
Na corresponds to the number of edges,
to the length of each edge, and
m to the average of the length of the edges.
Initial matrix of pheromones = 1 (for all edges);
Desirability of each edge, determined according to Equation (3);
Pheromones’ evaporation rate: 0.5 (scale of values between 0 to 1);
Exponential parameters of pheromones: α = 1;
Exponential desirability parameter: β = 1.
Step 2. Placement of all ants at the starting point, randomly. The dimensions of edges are calculated as follows, according to the elements of the
x and
y position vectors:
Position vector (x): sequential number assigned to each node according to the affinity between the different tasks;
Position vector (y): metabolic equivalent assigned to each node (task) according to the ergonomic risk assessment performed.
Except for x and y position vectors, all the other parameters are kept constant, being common in all established scenarios. Given the heaviness of the simulations in the longer scenarios, a limit of three simulations per scenario and three iterations per simulation was established.
Step 3. Each ant computes the probability of the current task being selected at each location in the set of optional locations based on Equation (2). Then, the ant chooses the matching location for the current task, according to the roulette method.
Based on Equation (2), each ant calculates the probability that the actual task will be chosen at each position in the array of alternative locations. The ant then applies the roulette approach to select the best location for the actual task.
Step 4. When an ant completes a solution, the pheromone is updated on the matching scheme path found by the ant according to Equations (4) and (5). Then, the solution is compared with the previous optimal solution, which updates the optimal solution.
According to Equations (4) and (5), the pheromone is updated along the matching scheme path discovered by the ant when a solution is completed. The optimal solution is then updated by comparing the new solution to the prior one.
Step 5. If all the ants finish their tour, Nc = Nc + 1 (Nc is the number of iterations), the global optimum solution is calculated through Equations (3) and (4) and the pheromone is updated based on that optimum path which was applied to the rule for the pheromone global update; otherwise, Step 3 is repeated.
Step 6. If the current iteration count is lower than the maximum number of iterations, the data are cleared, and the process returns to Step 2. Or else, stop iterating and provide the best option.
2.2. Optimization Model Application
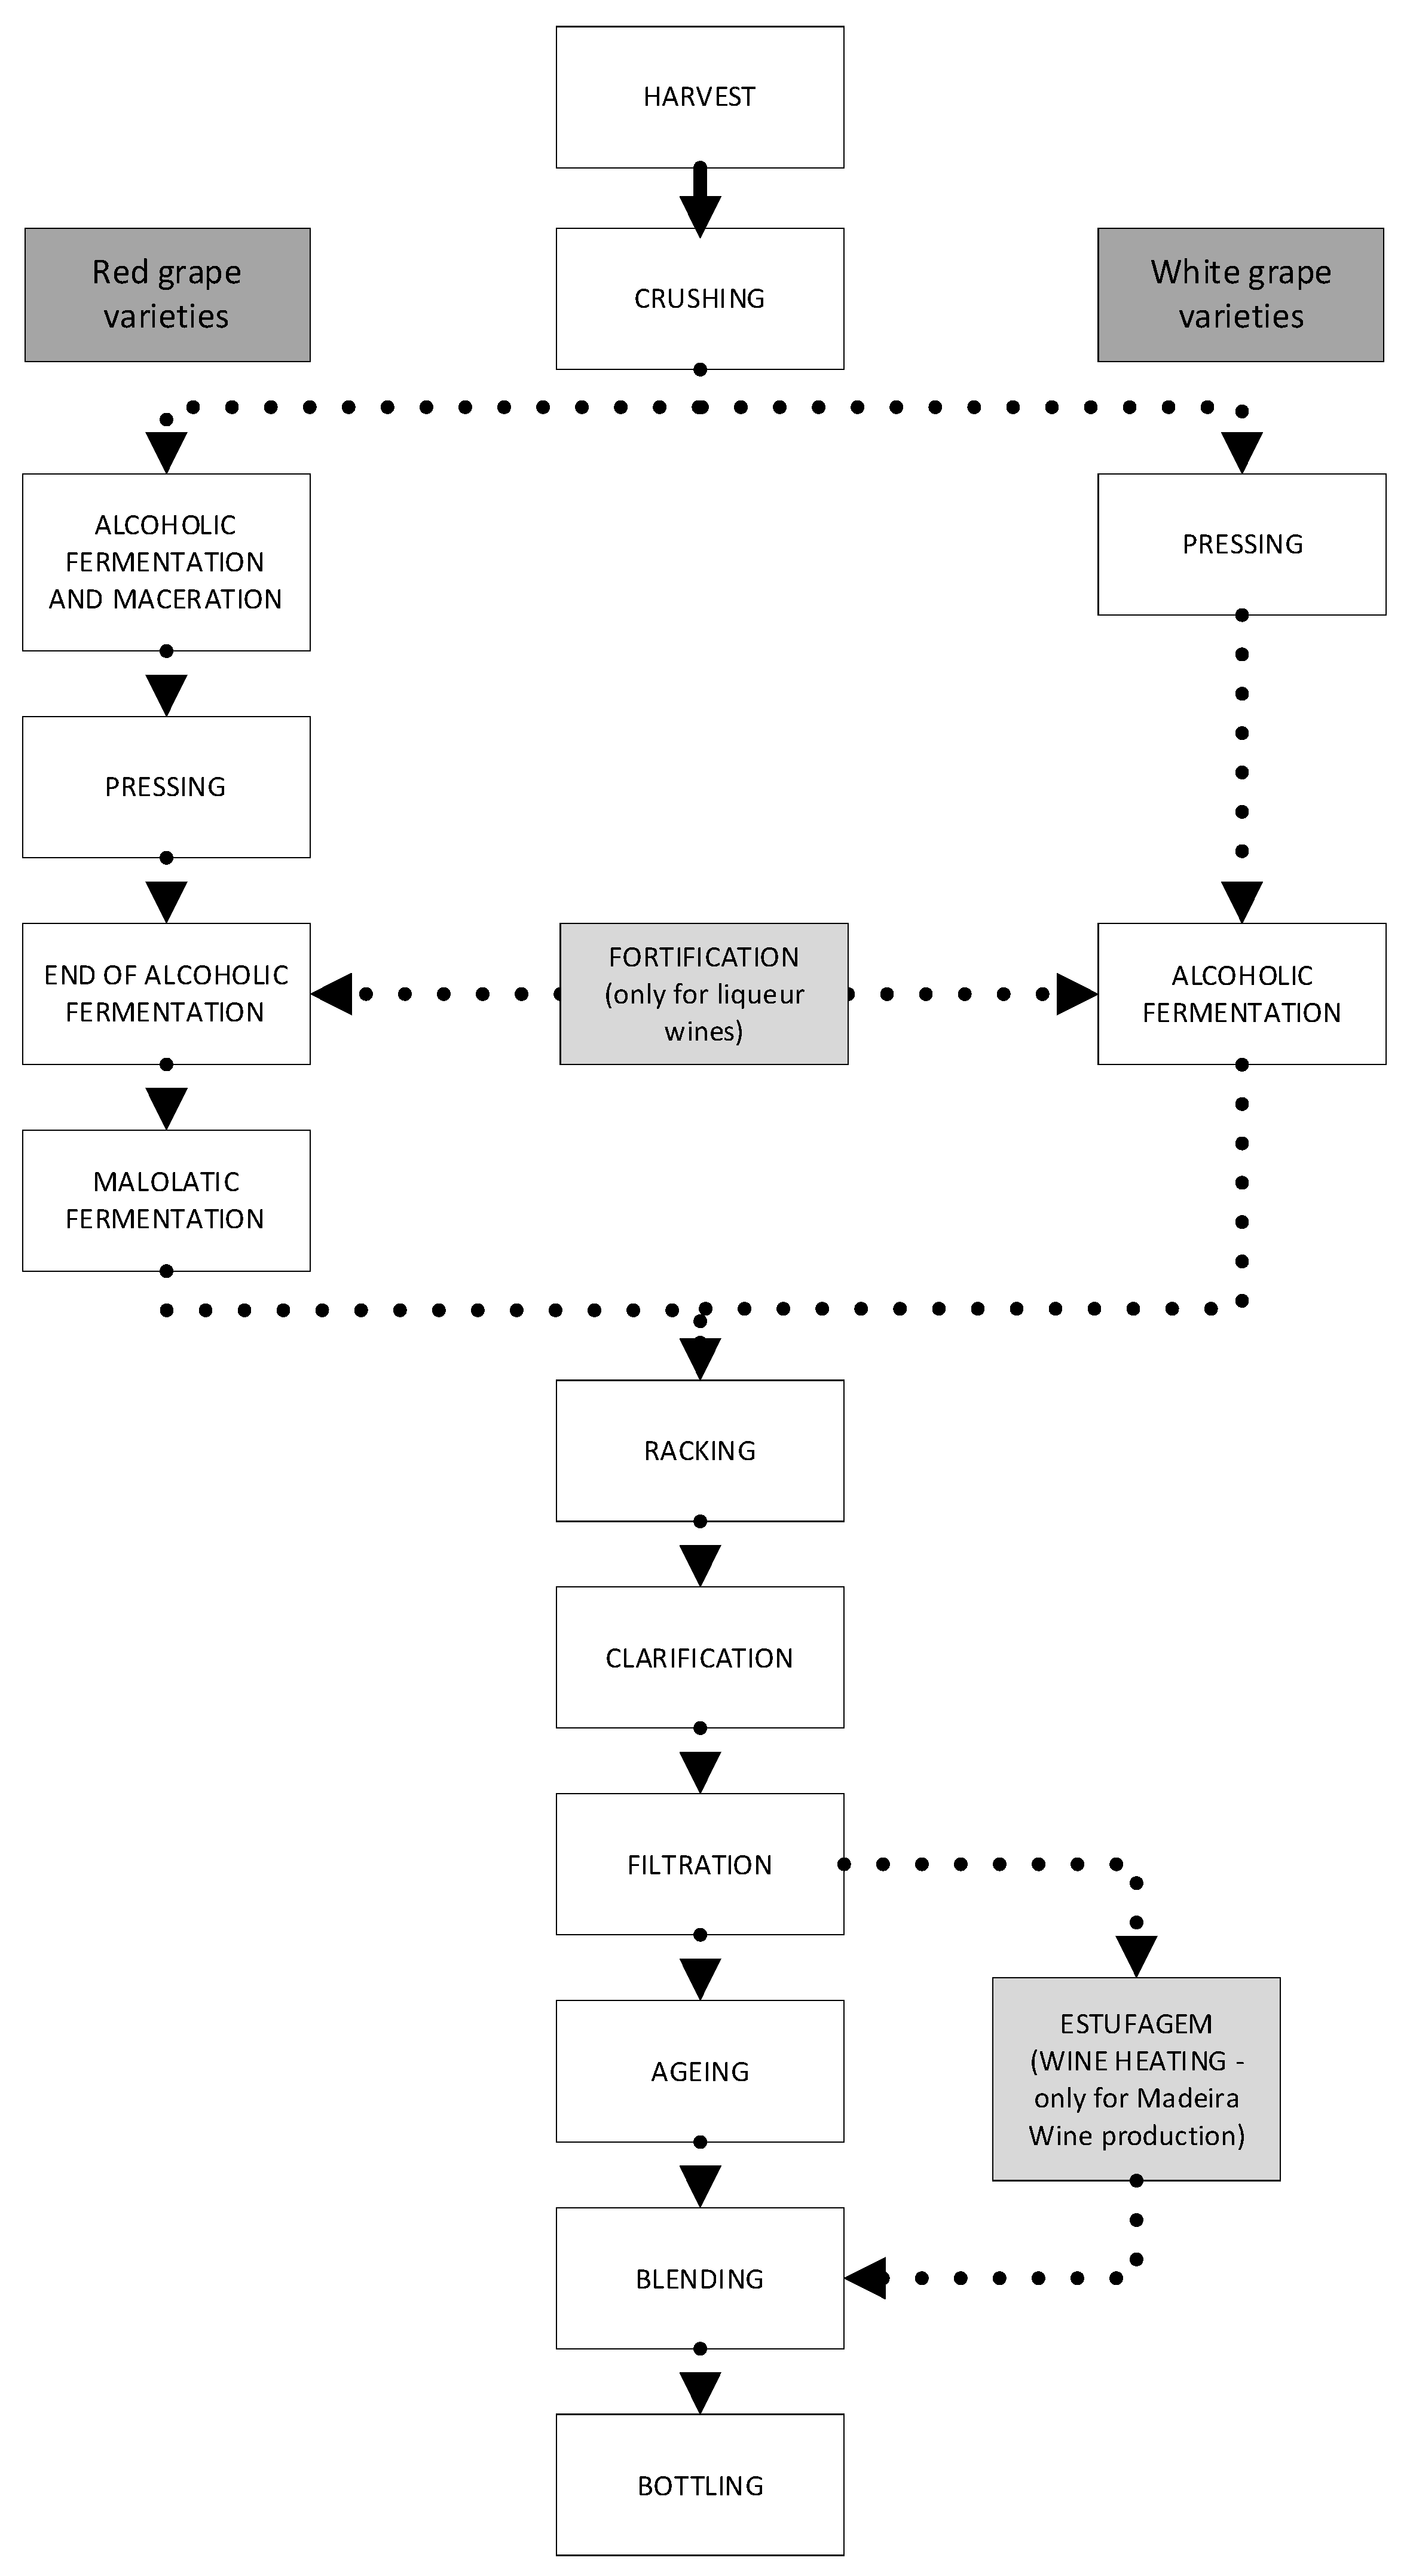
Red, rosé, and white table wines, as well as some liqueur wines, particularly the generous wines of Porto and Madeira, are produced using several methods that are cross-cutting to the creation of table and liqueur wines. The main unit activities of the several winemaking processes for the various varieties of wines are shown in
Figure 3.
The optimization method followed a four-scenario approach (see
Table 2), differentiated by the two seasons that characterize seasonality: during the grape’s harvest and after the grape’s harvest.
Two profiles of production were differentiated according to the inclusion or exclusion of the specific process of wine heating, which is specific to Madeira wine production. The optimization model was based on an ant colony optimization algorithm to reduce the costs associated with the expenditure of metabolic energy determined for each activity in MatLab.
3. Results
The ant colony optimization model was applied based on the findings obtained from the ergonomic risk assessment.
Table 3 presents estimations of the metabolic energies spent on activities during the production processes for the four scenarios. The following elements are presented for each scenario: the main activities considered in this study, the task sequence order (Seq), the values of metabolic equivalent for each task (MET), and the intensity level of each task (level).
In order to simplify and focus the study on the ergonomic load effect on the reorganization of tasks and the consequent distribution of human resources, the estimation of metabolic energy expenditure was based on the standard data from the work elaborated by Ainsworth et al. [
24,
25,
26]. However, an estimation of the expenditure of metabolic energy associated with physical activity can be made for specific and individual situations through the following equation:
where
EC is the metabolic energy expenditure, intended to be obtained for a specific case in kilocalories,
E corresponds to the metabolic energy expenditure studied and presented in the compendium elaborated by Ainsworth et al. [
24,
25,
26] in MET, and
the specific task duration in hours. Therefore, the use of Equation (8) aims to bring the values of metabolic energy closer to reality.
Regarding the intensity level of each task,
Table 4 shows the classifications of physical activity, differentiated into five levels according to the task intensity and demand.
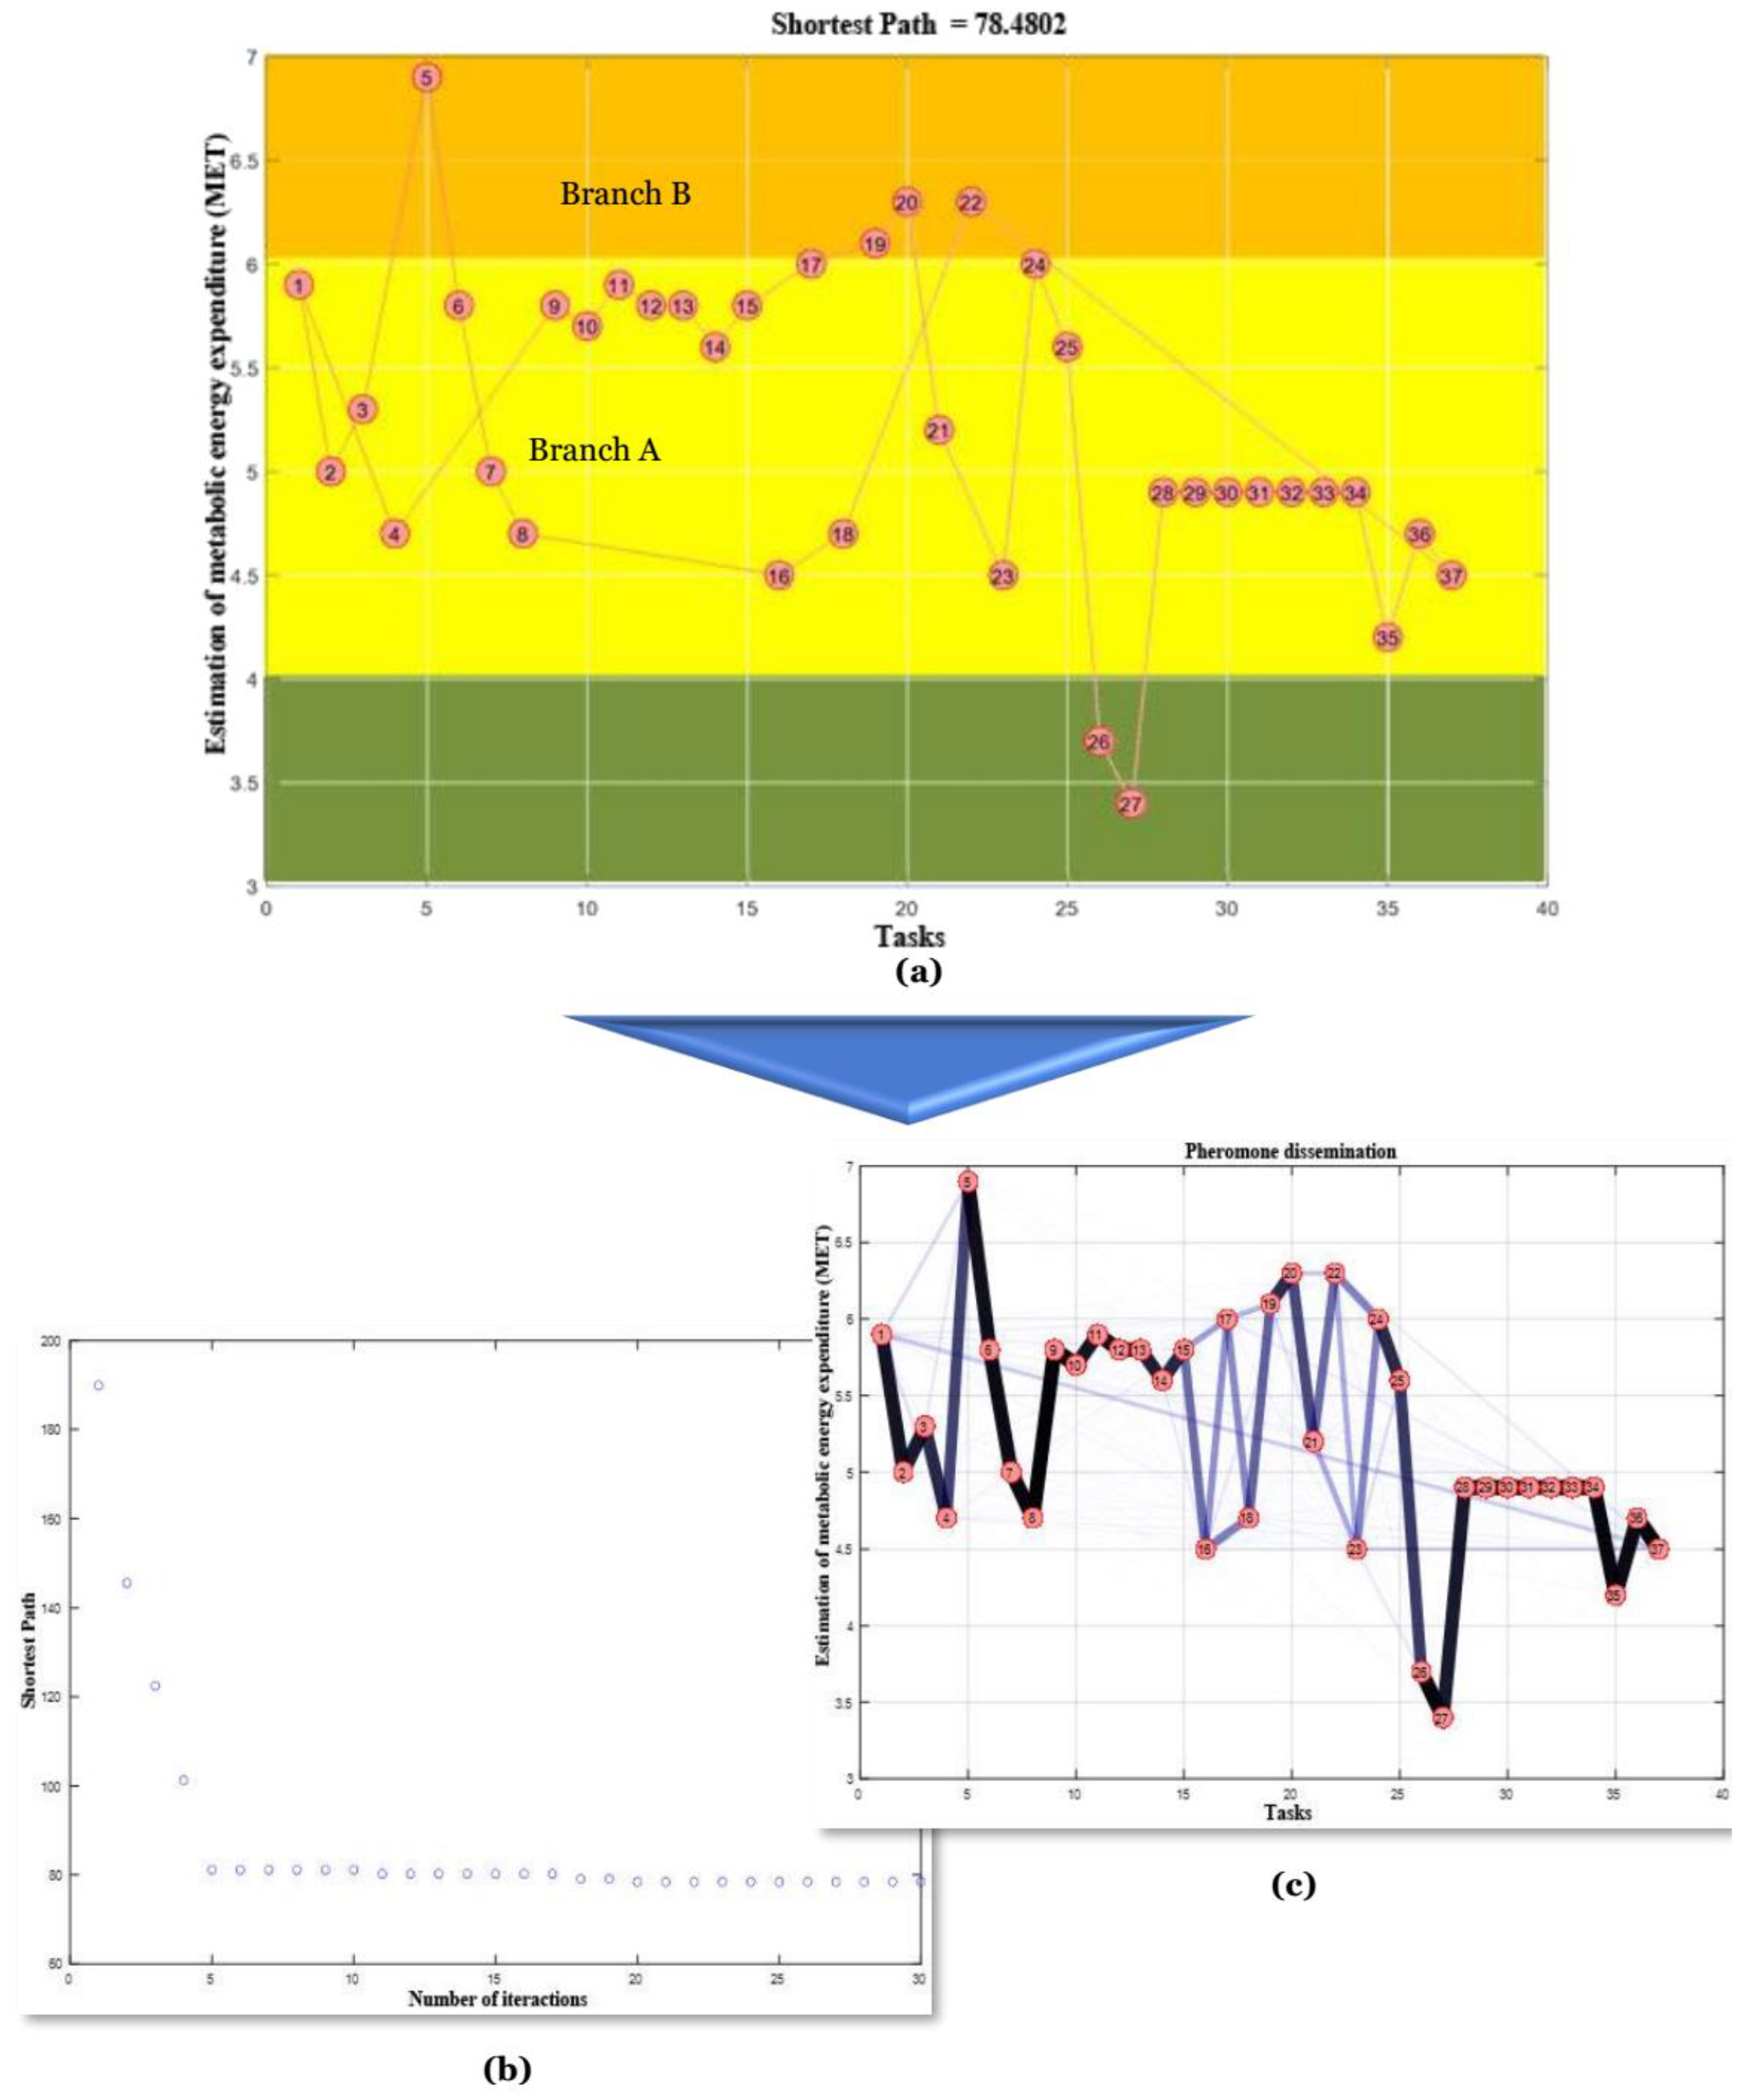
As a result of applying the optimization model to each scenario, three different types of graphs were obtained:
The first graph contains the shortest path between the initial node (task 1) and the final node (last task), which is represented in the form of a double bridge, where one of the branches is shorter than the other;
The second graph presents the dissemination of pheromones and the paths with the highest concentration of pheromones.
Additionally, a graphical representation of the evolution of the shortest path optimization along the iterations was obtained.
3.1. Results for Scenario 1
In this scenario, the optimization model was carried out based on the evaluation of the ergonomic risks associated with the expenditure of metabolic energy, which, in turn, were related to the performance of several activities inherent in the production process concerning the production process of Madeira wine during the high season (during the harvest).
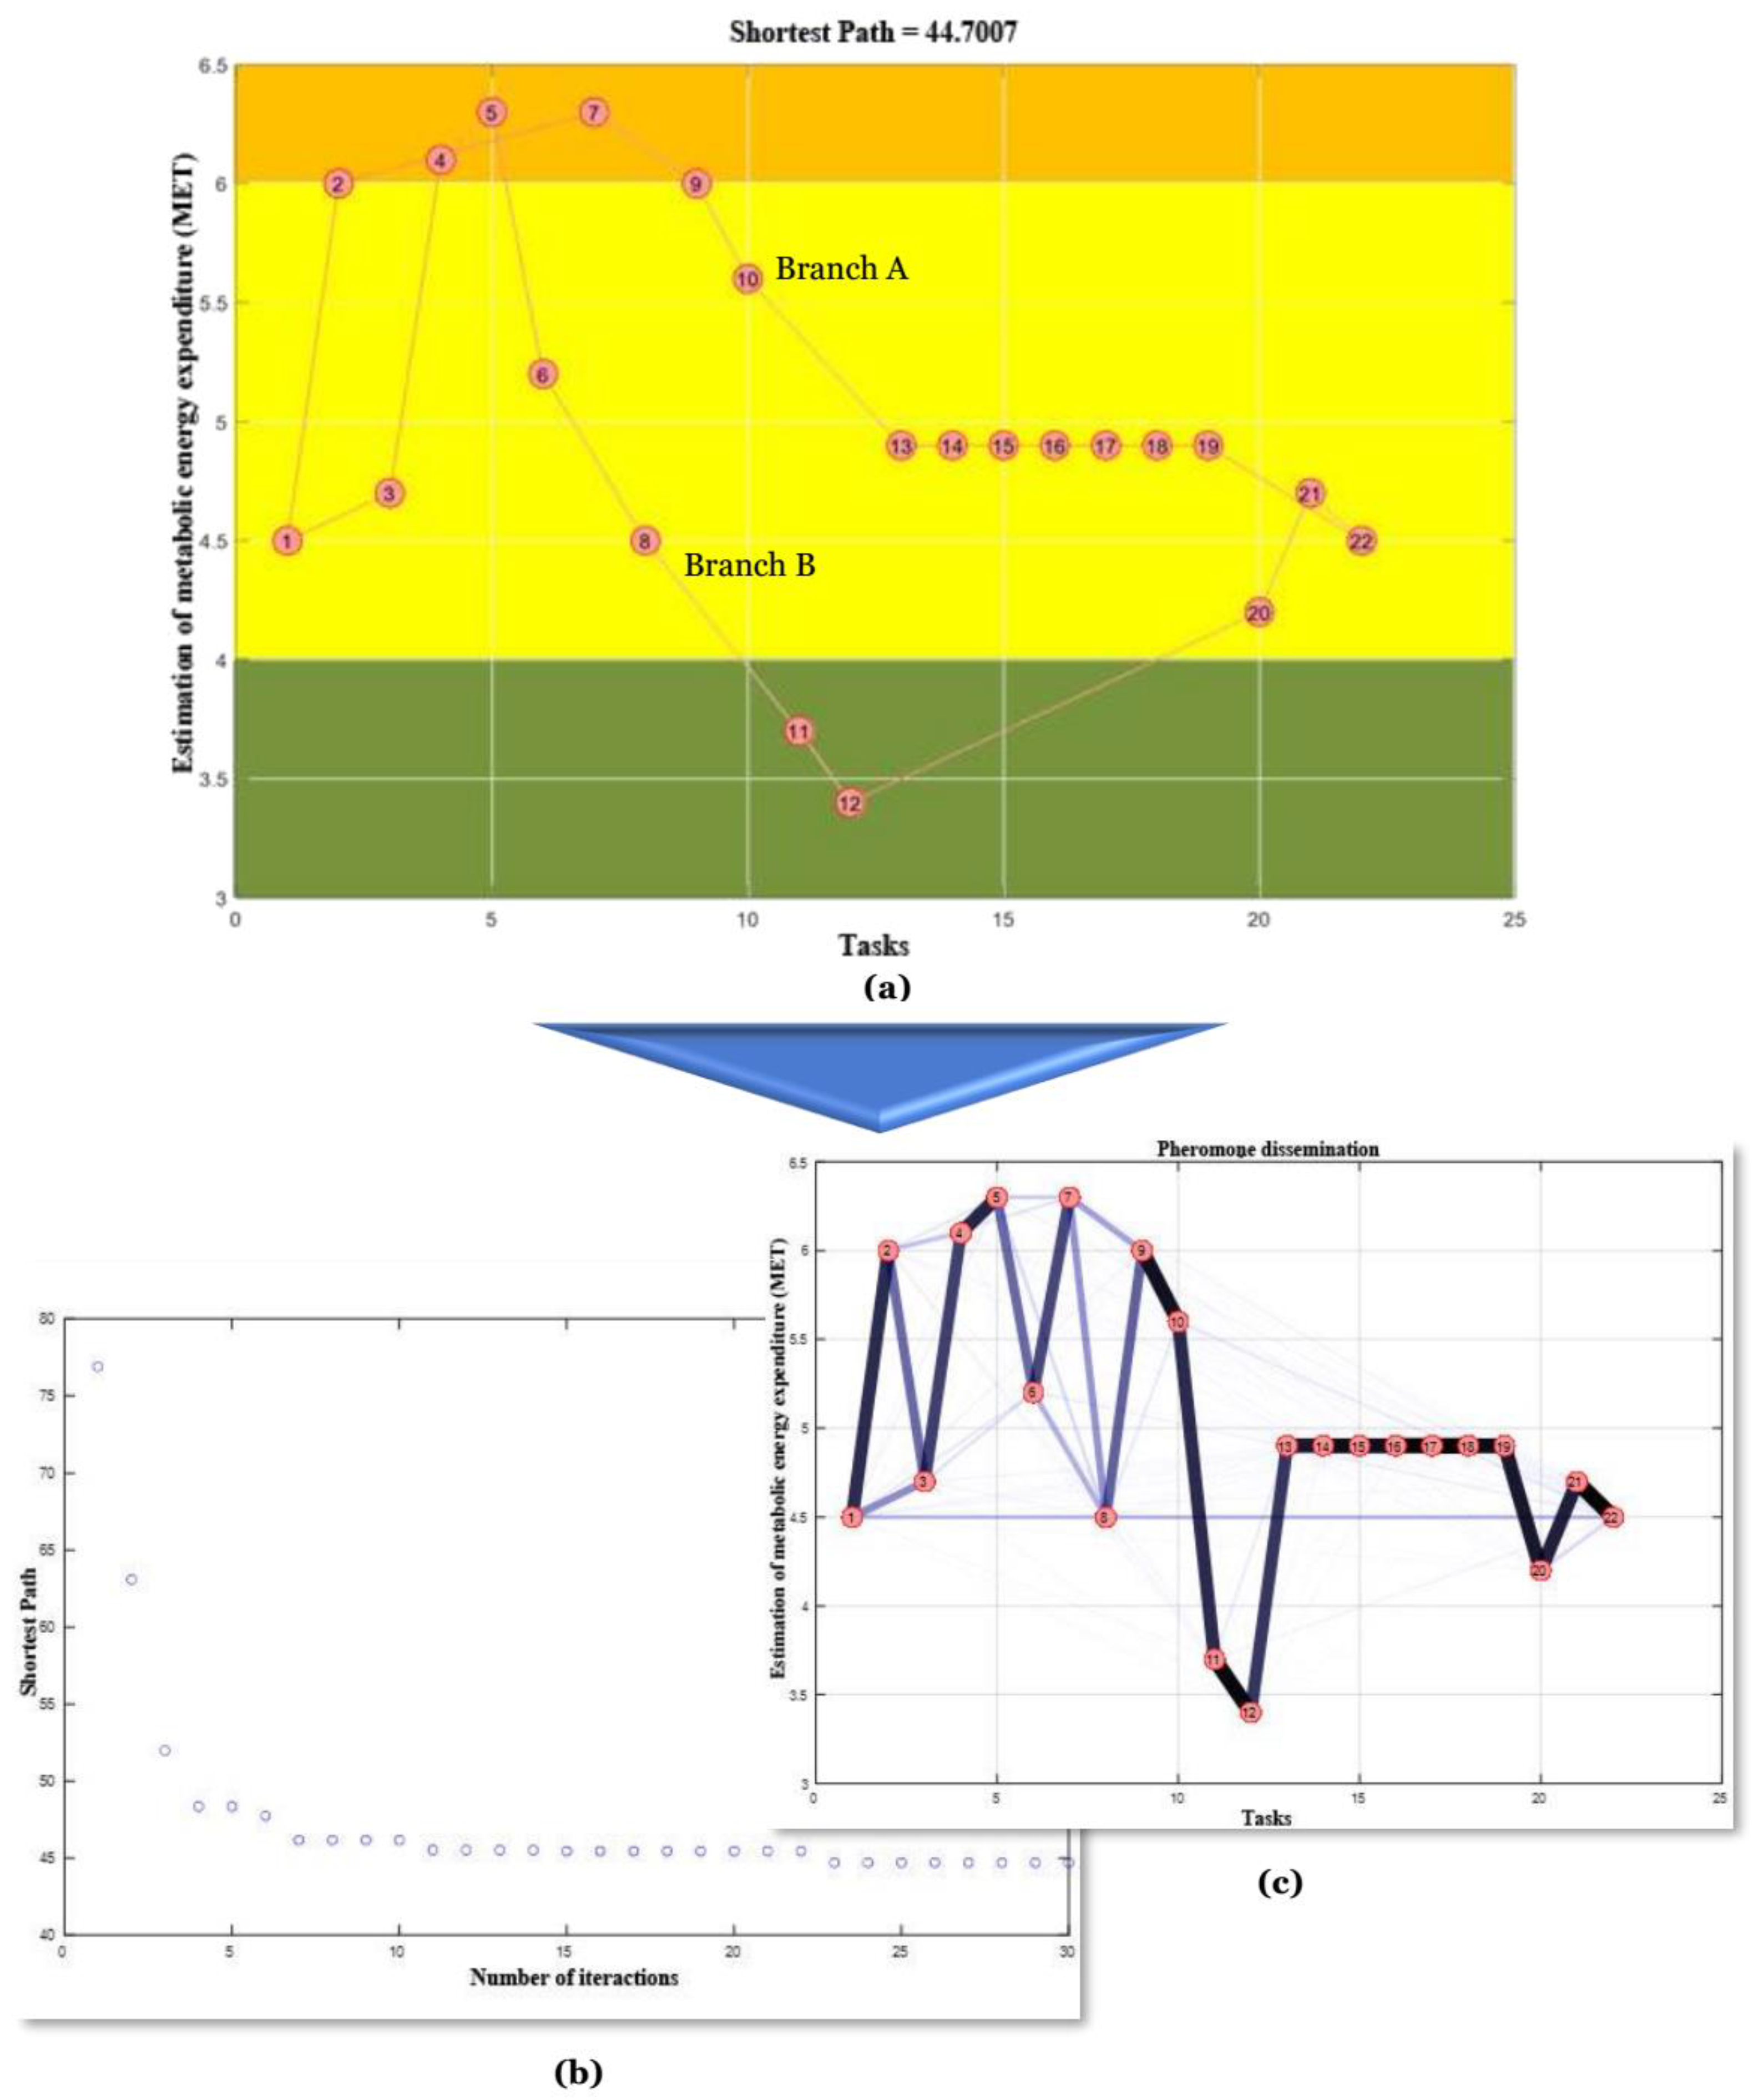
Figure 4a shows a graph of the solution obtained for optimizing the planning of production activities for the high season (during the harvest), with an indication of the various levels of metabolic energy expenditure in METs, with the five most demanding activities (in ergonomic terms) located in the orange-coloured area, the two least demanding activities in the green-coloured area, and the remaining activities in the yellow area, making it possible to follow the evolution of the shortest path minimization process through
Figure 4b, as well as through the graph with the respective dissemination of pheromones in the different paths along with the iterations (
Figure 4c).
Through the results obtained (
Figure 4a), it is possible to verify that the tasks with a higher affinity, and consequently shorter edges, are distributed sequentially along branch B, while the others are distributed along branch A.
Through the analysis of
Figure 4a, we verified the existence of a good sequence between the tasks (in terms of efficiency in the operationalization of processes), with a greater balance concerning the prevention of potential ergonomic risks through the rotation of tasks that are more demanding in terms of ergonomics. This highlights those tasks which have lower metabolic equivalents (equal to or less than 5) along the sequence of activities in the branches where they are inserted, which contribute more significantly to the minimization of the overall cost in terms of expenditure of metabolic energy, namely:
In branch A, there are six activities with MET values lower than 5 and five activities with MET values higher than 5, with a certain symmetry being verified along branch A in terms of MET values;
In branch B, there are fourteen activities with MET values below 5 and fourteen activities with MET values above 5, thus verifying a symmetry in the distribution of tasks along branch A in terms of MET values.
Thus, the results suggest the formation of two teams to carry out tasks from the reception of the grapes (task 1) to the respective winemaking (task 12), with sequences of six to seven tasks, which can work in alternation or turnover.
For the execution of tasks ranging from fortifying the wines (task 13) to carrying out the final corrections (task 25), with sequences of three to ten tasks each, it is recommended that two teams be formed with a work regime of alternation and rotation.
Finally, it would be suitable to form a team to carry out the tasks from the reception of packaging materials (task 26), through bottling, to the dispatch process (task 37), with a sequence of twelve tasks, with the last being shared with the other teams.
3.2. Results for Scenario 2
In this second scenario, the optimization model was applied while considering the evaluation of ergonomic risks associated with the metabolic energy spent during the execution of activities inherent to the production process, considering the Madeira wine production process during the low season (after the harvest). It should be noted that for this scenario, activities related to the harvest season were excluded, namely those related to the reception of grapes and the winemaking and fermentation processes. Thus, the sequence of activities starts with activity 1 (stabilization/clarification), which corresponds to activity 16 in the complete sequence of activities, including activities specific to the harvest season.
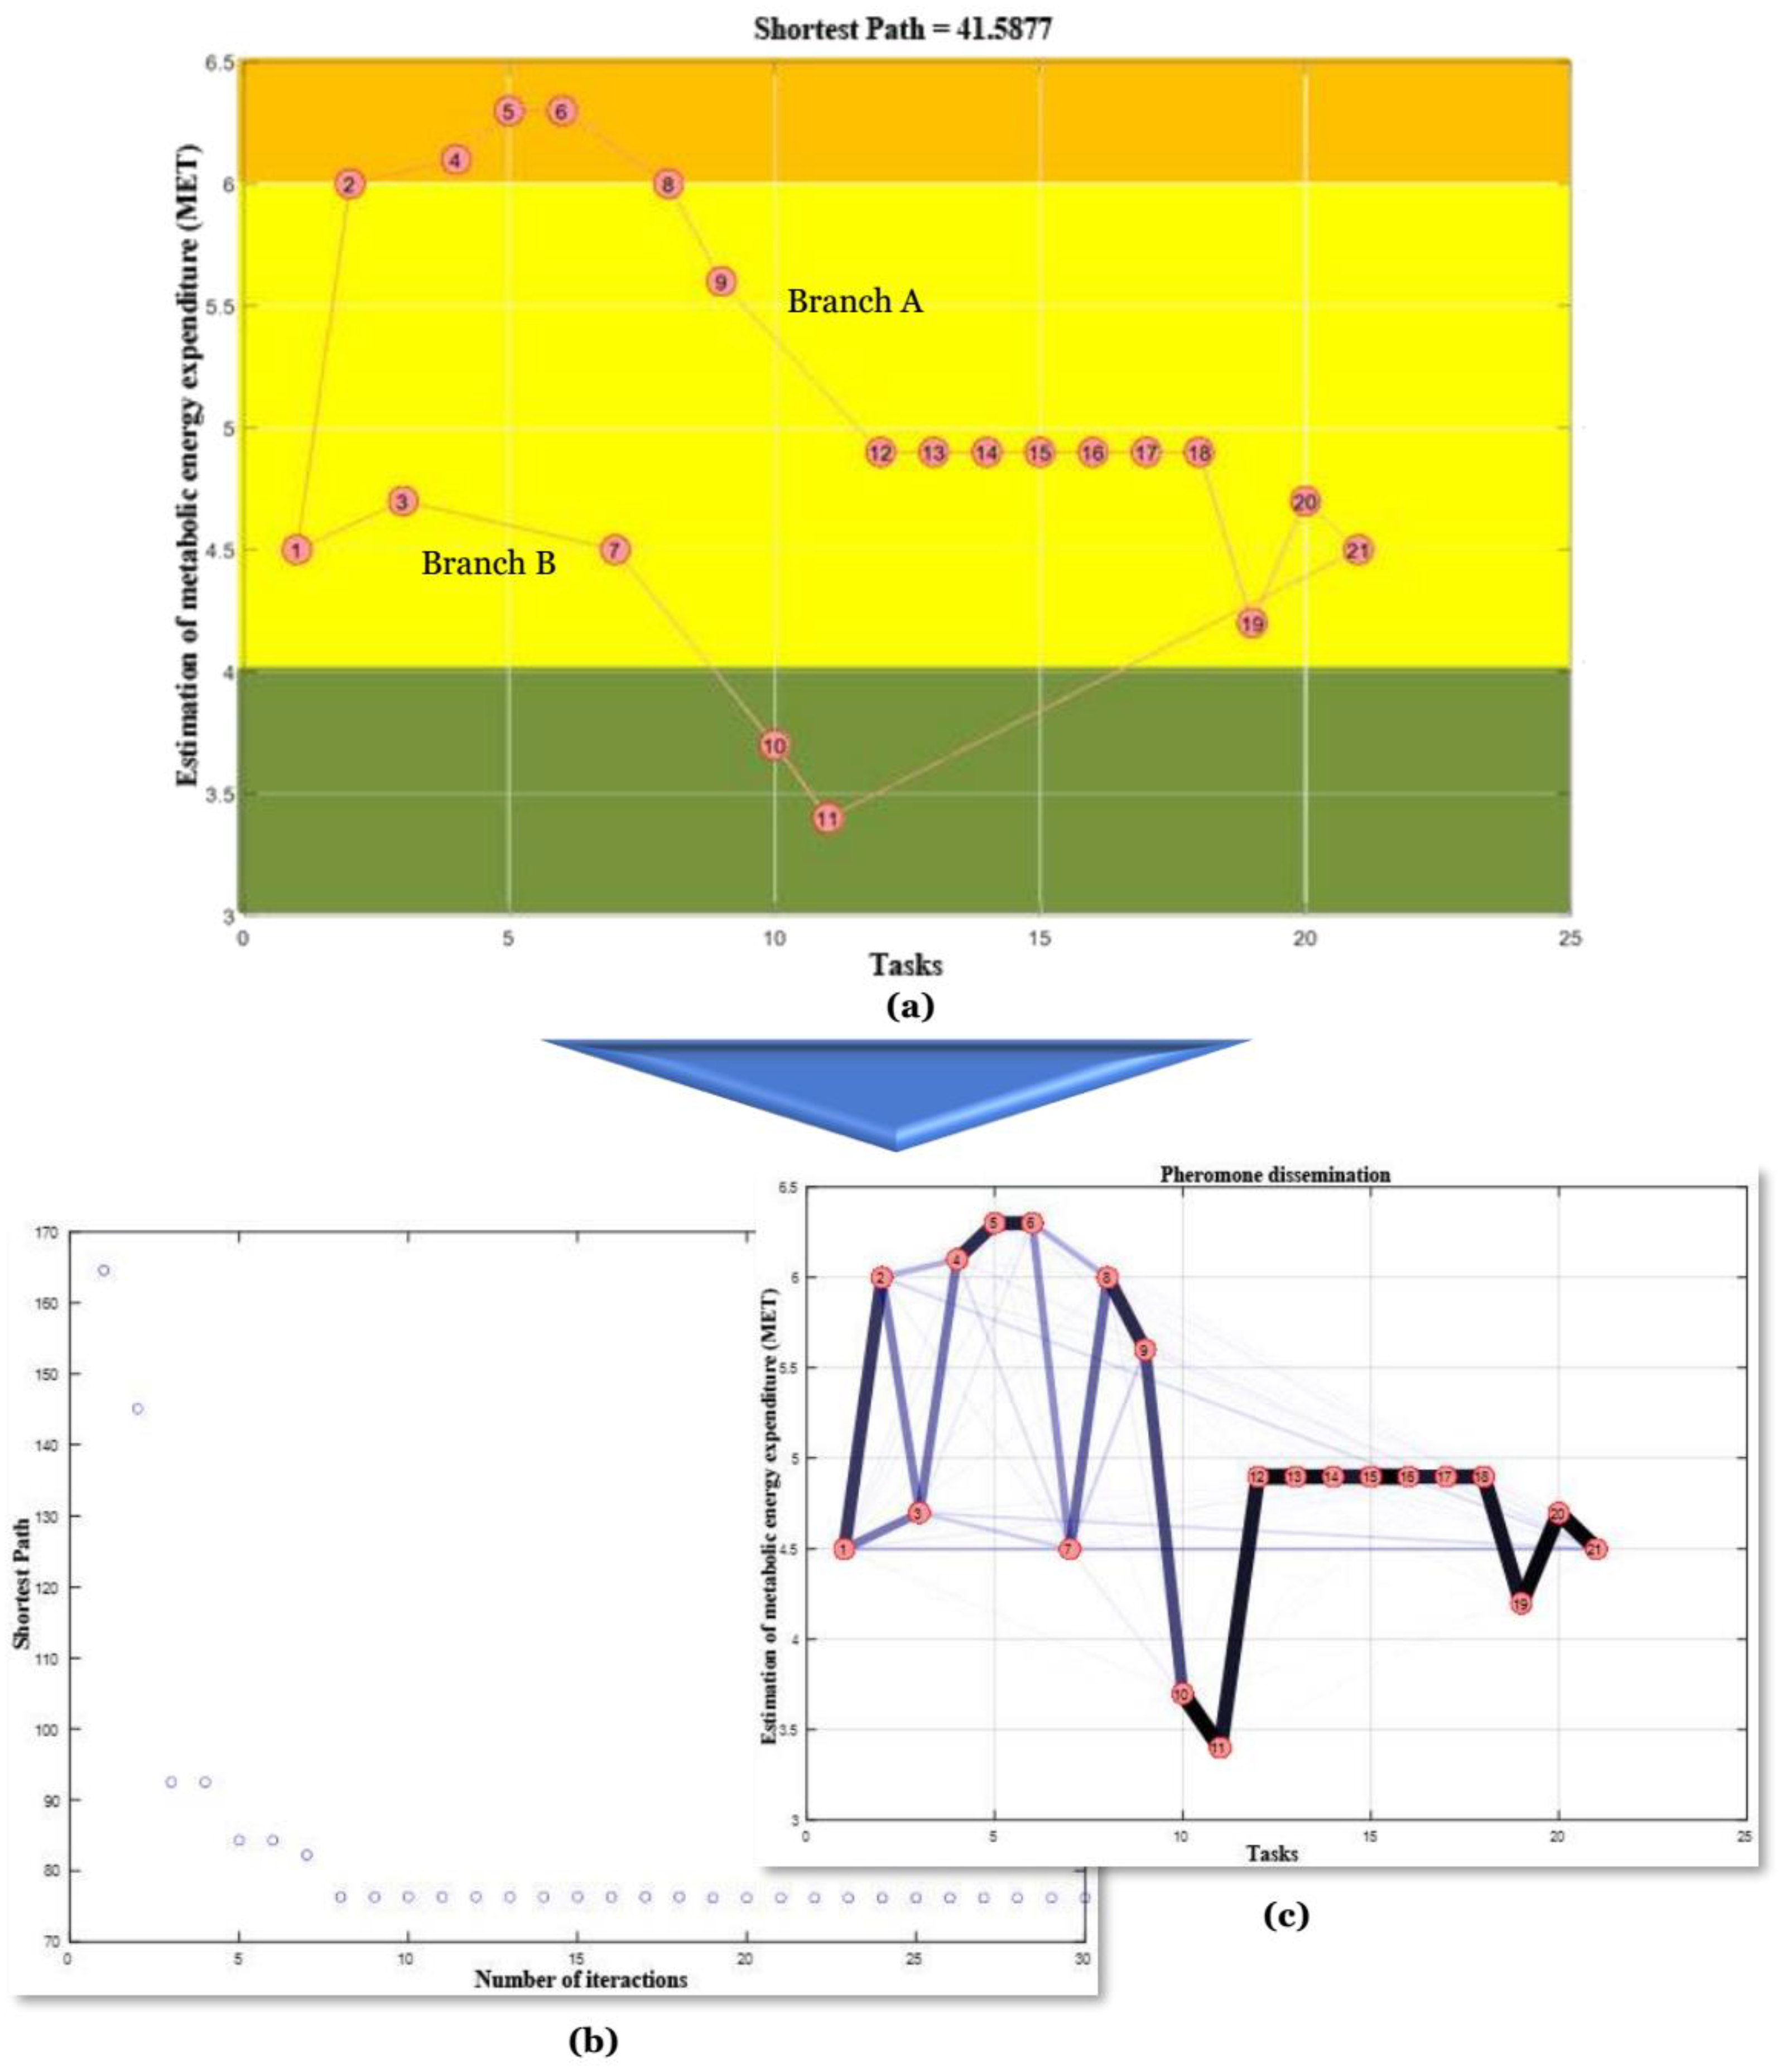
Figure 5a shows the solution of optimizing the planning of production activities, with an indication of the various levels of metabolic energy expenditure in METs. It is possible to observe the five most demanding activities in ergonomic terms, located in the orange-coloured area, the two least demanding activities in the green-coloured area, and the remaining activities in yellow.
According to the results obtained (
Figure 5a), we verified that those tasks with a higher affinity, and consequently shorter edges, are distributed sequentially along branch A, while the others are distributed on branch B.
Figure 5a shows that the sequences of tasks are favourable to the efficient operationalization of processes, with a greater balance around the prevention of potential ergonomic risks through the rotation of more demanding tasks (in ergonomic terms).
It is noteworthy that there are tasks with lower metabolic equivalents (equal to or less than 5) along the sequence of activities in the corresponding branches, which significantly contribute to the minimization of the overall cost in terms of metabolic energy expenditure.
It can be observed that, in both branches, there is a disproportionality favourable to the minimization of the global cost in terms of expenditure of metabolic energy, which is due to the greater number of activities with MET values below 5.
The results obtained for this scenario suggest the formation of two teams to carry out the tasks from the stabilization/clarification process (task 1) to the elaboration of the final corrections in the wines (task 10), with sequences of five to six tasks, which can work on an alternating and rotating basis.
Finally, it would be desirable to form one team to carry out the tasks from the reception of packaging materials (task 11), through bottling, to the dispatch process (task 22), with a sequence of five to eight tasks, with the last one shared with the other teams.
3.3. Results for Scenario 3
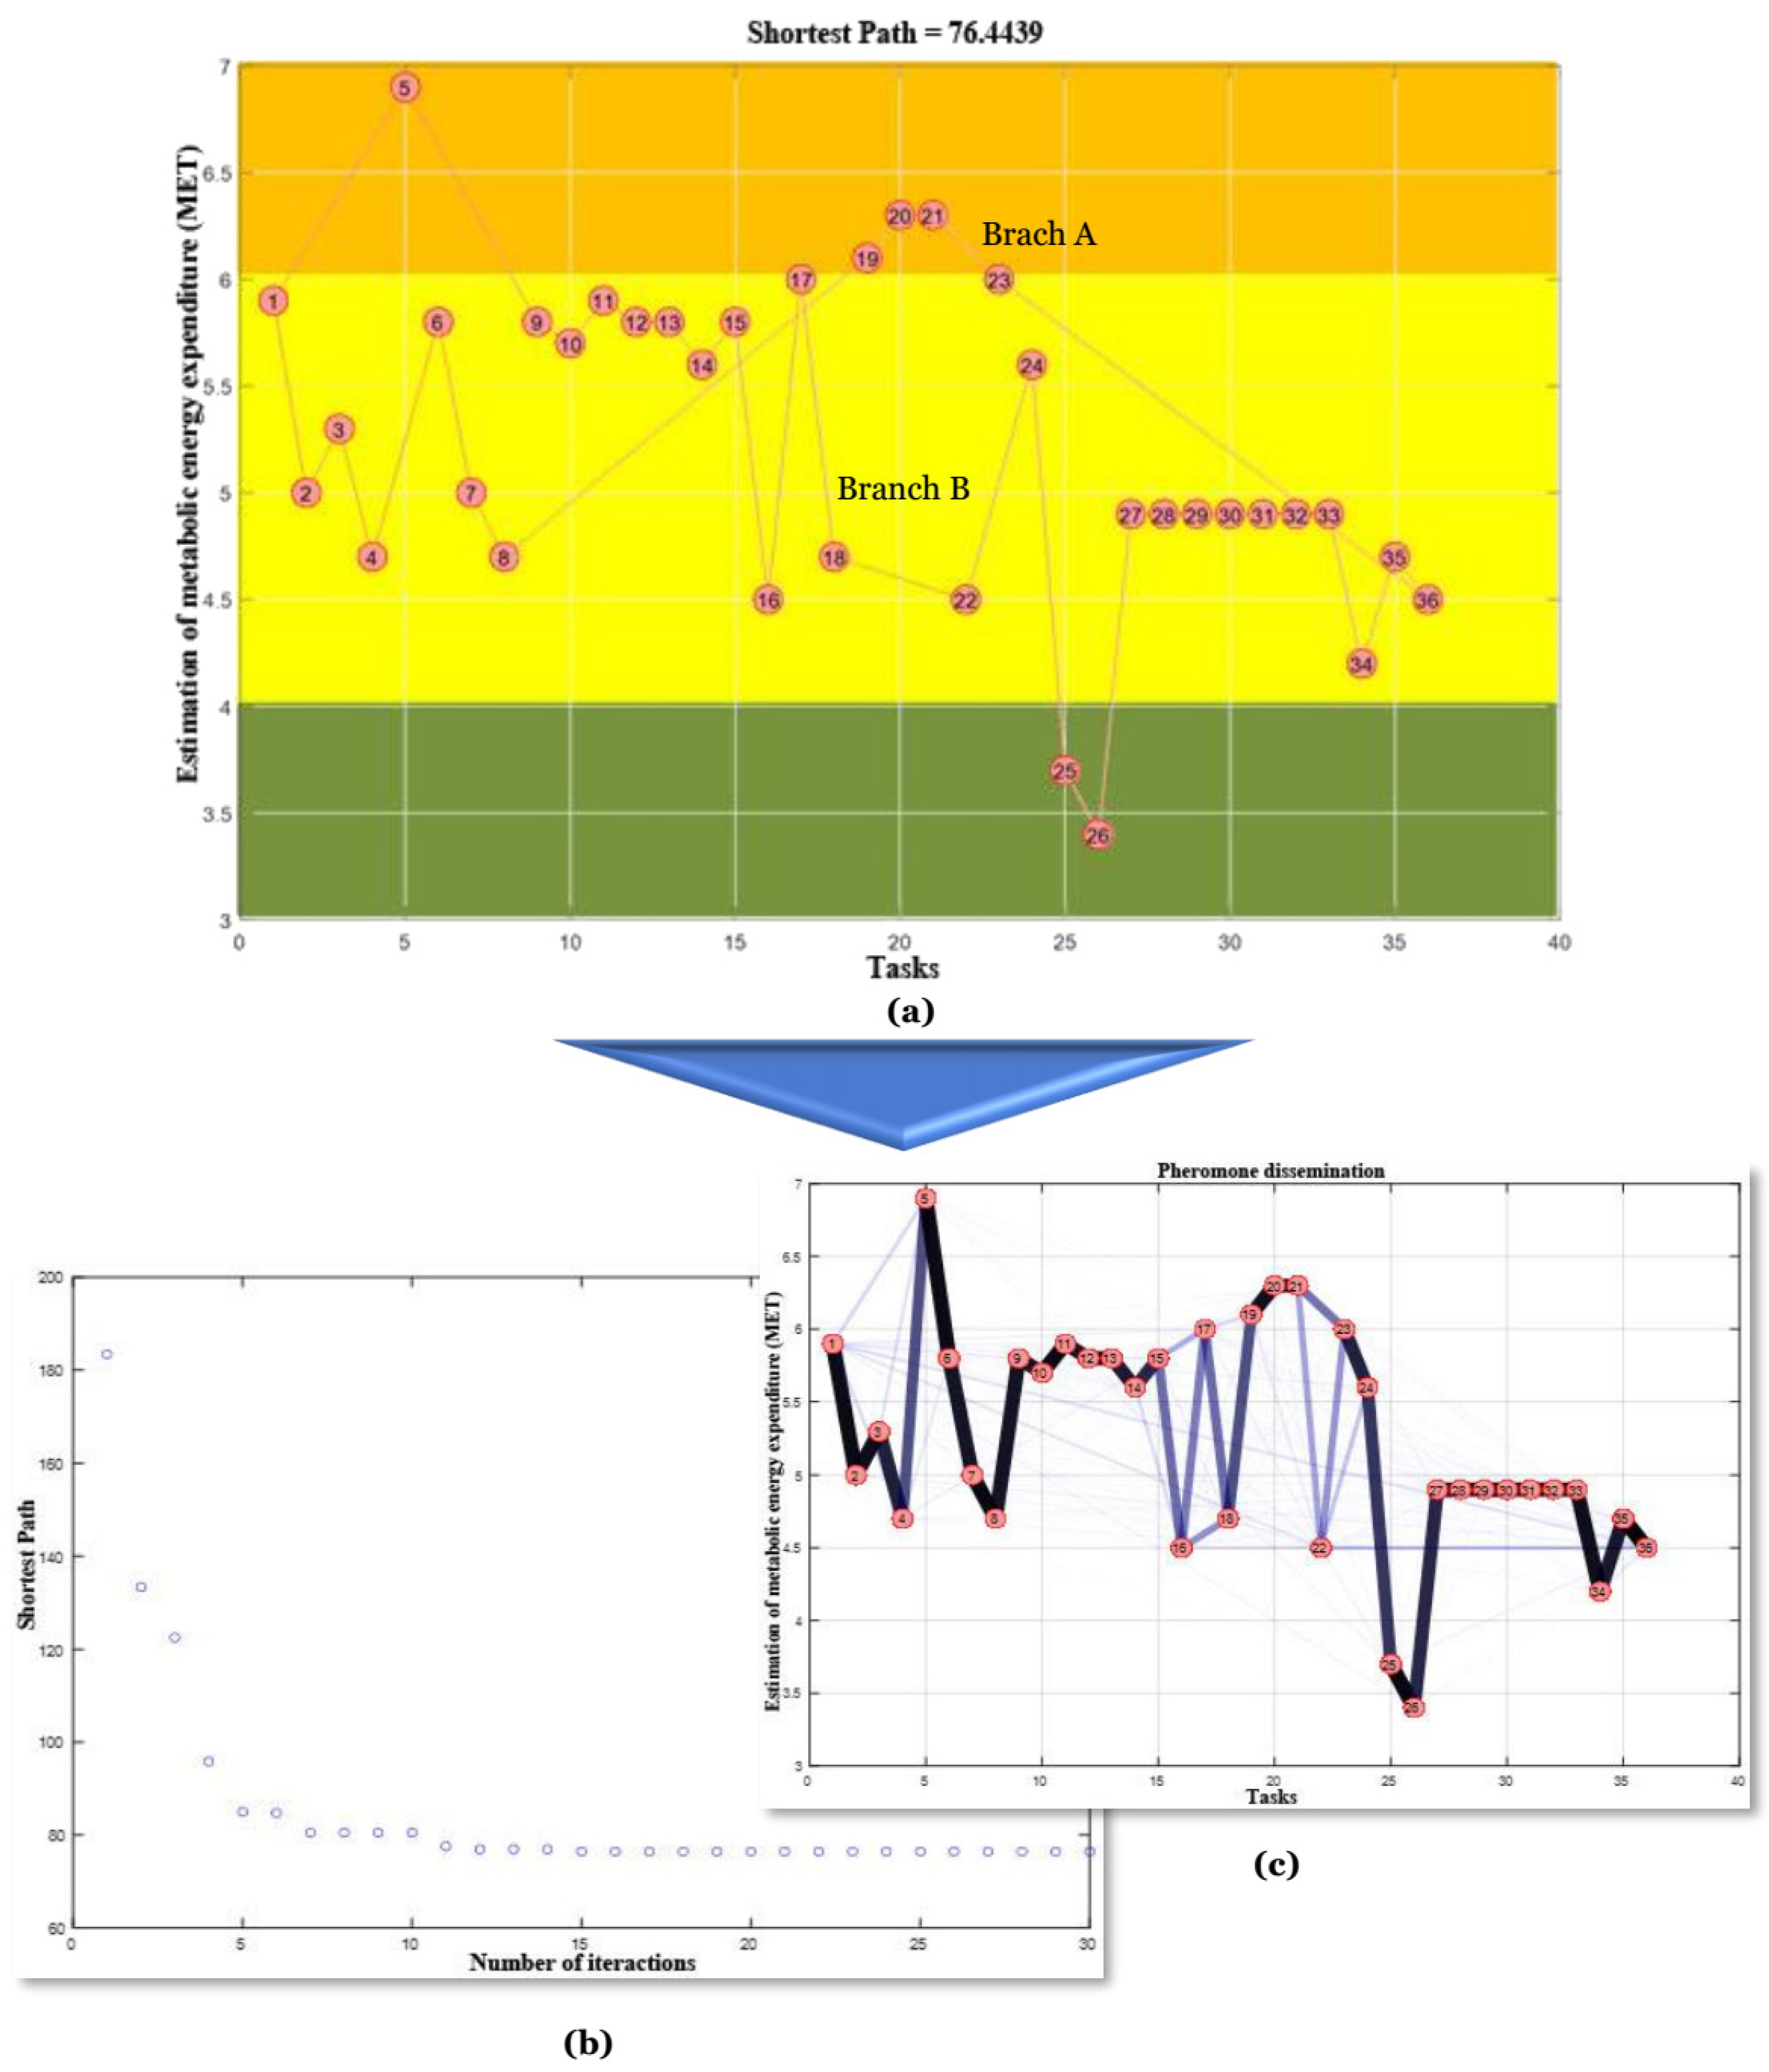
Figure 6a shows the solution obtained for optimizing the planning of production activities for the high season (during the harvest), showing an indication of the various levels of metabolic energy expenditure in METs, with the five most demanding activities in ergonomic terms located in the orange area, the two least demanding activities in the green area, and the remaining activities in the yellow area. It is possible to follow the evolution of the shortest path minimization process through
Figure 6b, as well as the graph concerning the respective dissemination of pheromones for the different paths along the iterations (
Figure 6c).
Through the results obtained (
Figure 6a), it is possible to verify that, similarly to scenario 1, those tasks with a higher affinity, and consequently shorter edges, are mostly distributed in sequence along branch B, while the rest are distributed along branch A.
Through the analysis of the graph in
Figure 6a, we verify that there is a good linkage between the tasks in terms of efficiency in the operationalization of processes, and a greater balance in terms of the prevention of potential ergonomic risks, through the rotation of more demanding tasks (in ergonomic terms), highlighting those tasks with lower metabolic equivalents (equal to or less than 5) along the sequence of activities in the branches where they are inserted, which contribute more significantly to the minimization of global cost in terms of metabolic energy expenditure.
In
Figure 6a, there is a certain asymmetry along branch A in terms of MET values, with an increase in the overall cost due to the greater number of tasks with MET values greater than 5. However, there is only one activity with a MET value greater than 6.
Similarly, in branch B, there is also an asymmetry in terms of MET, in the distribution of activities, and in general. There is a tendency to minimize the overall cost since there is a greater number of tasks with equal MET values or values less than 5, although there are four tasks that have MET levels greater than 6.
Thus, similarly to scenario 1, the results suggest the formation of two teams to carry out tasks from the reception of the grapes (task 1) to the respective winemaking (task 12), with sequences of six to seven tasks on an alternating or rotating basis.
For the execution of the tasks ranging from fortifying the wines (task 13) to carrying out the final corrections (task 25), with sequences of four to nine tasks each, it would be advisable to form two teams that are alternated and rotated.
Finally, it would be advisable to form a team to carry out the tasks from the reception of packaging materials (task 26), through bottling, to the dispatch process (task 37), with a sequence of eleven tasks, the last of which being shared with the other teams.
3.4. Results for Scenario 4
In this last scenario, the optimization model was applied considering the evaluation of ergonomic risks associated with the metabolic energy spent on the performance of activities inherent to the production process, as shown in
Table 3, excluding the wine heating process, during the period of low demand (after the harvest).
It should be noted that for this scenario, activities related to the harvest season were excluded, namely those related to the reception of grapes and the winemaking and fermentation processes.
Figure 7a shows the selected solution from among the three simulations performed to optimize the planning of production activities for the low season (after the harvest period), with an indication of the various levels of metabolic energy expenditure in METs. It is possible to observe the most demanding activities in ergonomic terms located in the orange-coloured area, the less demanding activities in the green-coloured area, and the remaining activities in the yellow-coloured area. Regarding the evolution of the shortest path minimization process, it is possible to follow this through
Figure 7b, as well as observe the graph regarding the respective dissemination of pheromones for the different paths along the different iterations (
Figure 7c).
According to the results obtained (
Figure 7a), it is possible to see that those tasks with a higher affinity, and consequently shorter edges, are distributed sequentially along branch A, while the others are distributed through branch B.
From
Figure 7a, we verify the existence of a chain between the tasks that is favourable to the efficient operationalization of processes, with a greater balance around the prevention of potential ergonomic risks through the rotation of more demanding tasks (in ergonomic terms). It is noteworthy that there are tasks that have lower metabolic equivalents (equal to or less than 5) along the sequence of activities in the corresponding branches, which significantly contribute to minimizing the overall cost in terms of metabolic energy expenditure.
Thus, it appears that in both branches, there is a disproportionality favourable to the minimization of the global cost in terms of expenditure of metabolic energy, which is due to a greater number of activities with MET values below 5.
The results obtained for this scenario suggest the formation of two teams to carry out the tasks between the stabilization/clarification process (task 1) and the elaboration of the final corrections in the wines (task 10), with sequences of five to six tasks, which can work on an alternating and rotating basis, with another team carrying out the tasks ranging from the reception of packaging materials (task 11), through bottling, to the dispatch process (task 22), with a sequence of eleven tasks, with sharing and cooperation with the other teams.
3.5. Comparison of Results between Scenarios
Through the results obtained, a comparison was made between the established scenarios (see
Table 2) and those scenarios in which the data were more important, and this is summarized in
Table 5.
The data presented in
Table 5 were differentiated according to the respective stages of the production process.
Table 5 shows that, in all scenarios, both branches share tasks that belong to the same phase of the production process.
By comparing scenarios 1 and 3, which include the entire production process, we verify that neither scenario has a significant difference in terms of profile, except the third phase of the winemaking operations in branch A of both scenarios, where the activities of stabilization/clarification (16) and sulphitation (18) in scenario 1 are replaced by the sequence of activities related to storage and aging (19, 20) in scenario 3, which includes the additional activity of the stabilization/clarification process (23).
A similar situation occurs between scenarios 2 and 4, where the sequence ‘7, 9, 10’ in scenario 2 is changed to ‘4, 5, 6, 8, 9’ in scenario 4, with an increment of two additional tasks in the winemaking phase, accentuating the disproportionality between branches A and B in scenario 4.
This difference occurs due to the weight-reducing effect of the wine-heating process, which relates to a low value of metabolic energy expenditure. This break in the sequence of tasks lowers the overall value of metabolic energy expenditure. As a result, in scenarios 1 and 4, a break in the sequence of tasks occurs in branch A, giving rise to a redistribution of tasks between both branches to balance the overall metabolic energy value.
4. Discussion and Limitations
The current work was based on a literature review, both in terms of a theoretical foundation and practical application. Due to this fact, the study’s main limitations are intrinsically linked to the estimation of data based on previous studies developed by various authors, particularly those which surveyed and evaluated ergonomic risks, as well as the operations that integrate production processes, making it necessary to confirm and update these data in terms of the practical applicability of future works.
The task scheduling optimization method, based on the estimation of metabolic energy expenditure as an assessment method of ergonomic load, allows for the reorganization of tasks according to their degree of ergonomic risk, preserving an admissible prioritized sequence of tasks with operational affinity and efficiency from the point of view of the operationalization of processes, while the potential ergonomic risks are simultaneously minimized by the rotation and alternation of operative teams between the tasks with higher and lower values of metabolic equivalents. For each scenario, two task-sequence branches were obtained, allowing for the better rotation of teams and, consequently, a feasible reorganization of human resources for each specified scenario.
Through the results, a suitable number of teams was estimated and distributed along the sequence of tasks, working in parallel, series, and in task-sharing modes, leading to the minimization of the ergonomic load. Concerning high-season scenarios 1 and 3, five operative teams were estimated to be required, the size of each dependent upon the dimensions of the organization, whereas for low-season scenarios 2 and 4, three teams were estimated, highlighting the fact that the last task of each scenario can be shared by all teams, maintaining fluidity in the performance of the processes.
Regarding the effect of the wine heating process, which is an exclusive process within the Portuguese wine industry and used for the specific production of Madeira wine, variations were found as this process provides a weight-reducing effect due to its low value of metabolic energy expenditure, providing a break in the sequence of tasks in one of the branches and lowering the overall value of metabolic energy expenditure. This allows for a redistribution of the tasks between both branches to establish a balance.
This work is based on the standard data from the work of Ainsworth et al. [
24,
25,
26], which in turn is based on the study of several activities in different contexts other than industrial winemaking. Thus, for future work, it would be significantly beneficial to conduct an ergonomic risk assessment following the metabolic energy expenditure approach using the indirect calorimetry method, which will provide data that closer resemble reality, reducing the heterogeneity effect of the experimental subjects regarding the physical constitutions, genders, and ages of the operators involved, and confirming the structure of the task sequences obtained by the method used in this work.
Also, it would be pertinent to update and confirm the data relative to the survey and the assessment of ergonomic risks, as well as the identification of the operations that integrate the several production processes. This implies a practical approach in a real work environment context within an organization or several organizations to assess all production methodologies and their respective operations, including the inherent risks during the execution of activities in the physical areas where the activities are usually carried out.
Another aspect that can significantly contribute to the improvement of the methodology related to the models used in this study is the development of a multi-criteria decision-support method (TOPSIS, PROMETHEE, or VIKOR, among other methods), which can significantly contribute to the improvement of the methodology in association with other models and scenarios regarding layout optimization and methods for selecting Industry 4.0 tools suitable for minimizing ergonomic risks.
Finally, the incorporation of additional approaches based on heuristics, such as large neighbourhood search or mixed-integer programming, or hybrid algorithms, such as an algorithm composed of spectral partitioning and a genetic algorithm, or the ant genetic algorithm, is worth considering for future works that evaluate the effectiveness of the model used in this study. Additionally, it would also be relevant to explore other alternative search methods, including complete and local searches.


