1. Introduction
Brittleness is a crucial parameter describing the behavior of rock and soil material failure [
1,
2,
3], and is closely influenced by mineral composition [
4], loading condition [
5], micro-fracture [
6], physical properties [
7,
8] and mechanical characteristics [
9,
10,
11]. In underground engineering field, the brittleness index provides a convenient and effective method to assess the mechanical properties and failure mode of surrounding rock. In shale gas production, the brittleness of shale is key index to evaluate the mechanical properties of shale gas reservoirs. Generally, low brittleness of shale means the shale gas reservoirs have typically low porosity and low permeability; development of this type of shale gas is difficult, and economic benefits are minimal [
12,
13]. In underground excavation and tunnel engineering, the brittleness of surrounding rock has been widely utilized to judge the stability of rock masses and the tendency of rock burst [
14,
15,
16]. Therefore, precisely quantifying the brittleness of rock plays a significant role in deep rock mass engineering construction projects and disaster prevention measures.
Recently, Ref. [
17] suggested that the deformation and failure behavior of rock is a destabilizing phenomenon accompanied by the storage, dissipation, transformation, and release of energy. Thus, a series of brittleness indices have been proposed to evaluate rock brittleness based on energy evolution in recent years. Ref [
18] believed that the more elastic strain energy is stored in the rock during pre-peak stage, the more brittle the rock is. Ref. [
19] stated that the more brittle rock is, the more the elastic strain energy and less additional input energy is required for failure. Ref [
20] suggested that brittle rock requires more elastic strain energy than additional input energy during the failure process. Ref. [
21] suggested that brittle rock could generate little dissipated energy in the pre-peak stage, and the dissipated energy has a negative impact on brittle rock failure. Ref. [
22] stated that the more elastic strain energy is stored in the pre-peak stage and used for failure in the post-peak stage, the more brittle the rock is. Ref. [
23] concluded that brittle rock could store a large amount of elastic strain energy in the pre-peak stage and requires little additional input energy when failure occurs. Ref. [
24] studied the influence of residual elastic strain energy on rock brittleness and defined two similar kinds of rock brittleness indices as the proportion of stored elastic strain energy required for failure. Ref. [
25] stated that rock brittleness can be represented by the dissipation rate of the failure energy. Ref [
26] believed that the additional input energy could be transferred into total elastic strain energy. The aforementioned rock brittleness indices are listed in the
Table 1.
In this study, the energy evolution characteristics of rocks was analyzed during the whole deformation and failure process. A new energy-based brittleness index was redefined as the dissipated proportion of ultimate elastic strain energy relative to post-peak failure energy and residual elastic strain energy. A series of mechanical compression tests were conducted on shale samples to verify the reliability and accuracy of the new index. The results prove that the new index can present more kinds of rock and is more precise for characterization of the brittleness of rock than the other existing brittleness indices.
2. Establishment of the Brittleness Index
Based on previous studies [
28,
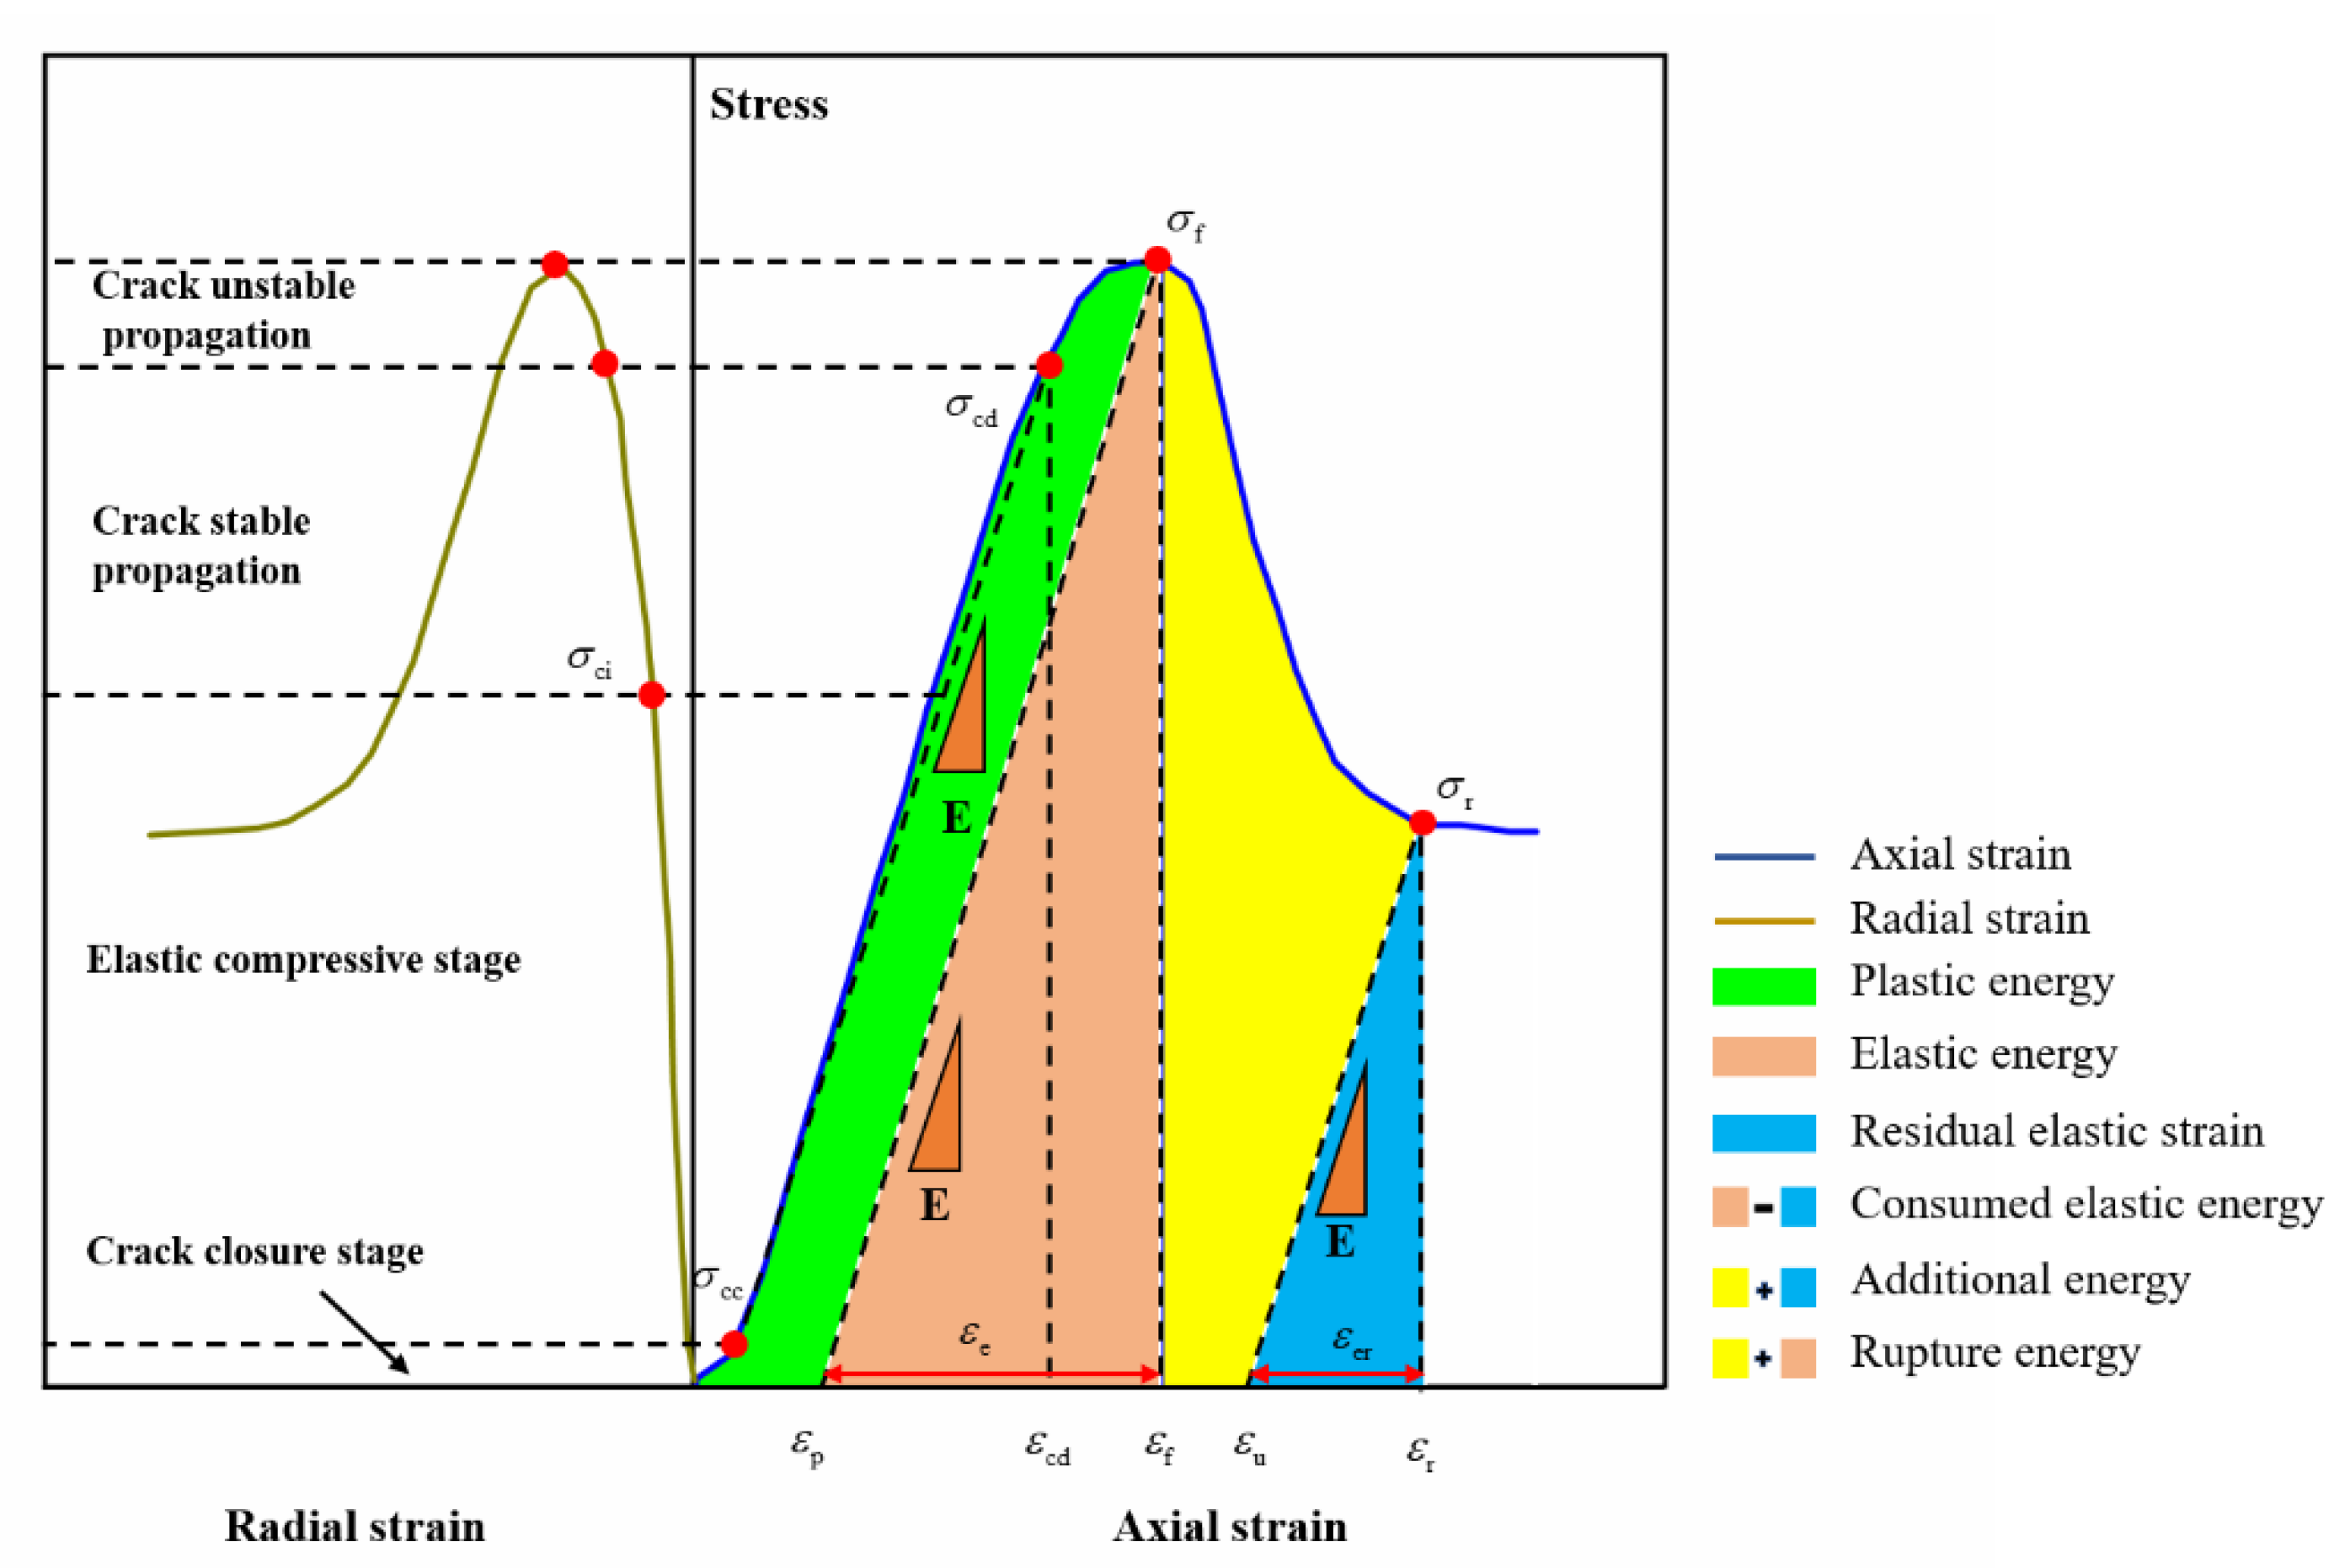
29], the deformation and failure characteristic and energy evolution of brittle rocks in the complete stress–strain curve are presented in
Figure 1.
During rock deformation by an external force, the deformation of rock elements can be considered a closed system, assuming that the physical process has no heat exchange with the outside world, and the input energy during the pre-peak loading stage can be divided into two parts: elastic strain energy and dissipated energy [
30]. The elastic strain energy is stored in the rock during loading, which is gradually released during unloading and is the major energy cause of rock deformation and failure. Then, the energy is dissipated due to plastic strain and microdamage of the rock, which is irrecoverable with the unloading of the stress [
31]. When the elastic strain energy reaches the rock energy storage limit, the rock enters the failure stage. One part of the concentrated elastic strain energy in the rock leads to rock failure, another part dissipates due to microdamage of the rock, and the residual elastic strain energy exhibits two different states depending on loading conditions. Regarding the uniaxial compression condition, the residual elastic strain energy is mainly be converted into kinetic energy when the rock fragments break. Nevertheless, for the triaxial compression condition, the residual elastic strain energy is stored in the rock, leading the rock to reach its residual strength phase.
Based on the analysis of rock energy evolution characteristics and the test results of rocks with different brittleness degrees from previous studies, we found that the rock energy evolution characteristics in the post-peak failure stage can characterize the brittleness index of rocks, and it is believed that the more brittle the rocks are, the less stored pre-peak elastic strain energy converts into post-peak failure energy due to the microdamage of rocks and the less post-peak residual elastic strain energy stored in the rocks, resulting in reduced residual strength of the rocks. In addition, regarding rocks with higher brittleness, the post-peak failure energy is mainly converted from the elastic strain energy stored in the pre-peak stage; for rocks with lower brittleness, the post-peak failure energy is not only transformed from the elastic strain energy in the pre-peak stage but also provided by the additional input strain energy.
On this basis, the evaluation criterion of the rock brittleness index based on ultimate elastic strain energy is established as follows:
where
is the ultimate elastic strain energy,
is the post-peak failure energy, and
is the residual elastic strain energy. The higher the value of
, the more brittle the rock. When
reaches its maximum value of 1, the rock shows ideal brittleness characteristics. The lower the value of
, the more ultimate elastic strain energy is required for failure of the rock, and the plasticity of the rock presents more obviously. If the value of
is negative, the ultimate elastic strain energy is not sufficient to cause rock failure, and additional input failure energy is required in the post-peak stage, which means that this kind of rock exhibits more pronounced plasticity than general rocks. Therefore, it is believed that the newly established rock brittleness index,
, can reflect a wider range of rock brittleness degrees than the previously proposed rock brittleness indices. The following series of laboratory tests were carried out to verify the reliability and universality of the brittleness index,
, based on the ultimate elastic strain energy.
3. Materials and Methodology
According to the literature [
32,
33], conventional triaxial compression (CTC) tests are crucial to evaluate the brittleness of rocks by the corresponding brittleness index, and the brittleness of the same kind of rock decreases with increasing confining pressure. Hence, the evaluation accuracy of a rock brittleness index can be judged by the variation trend of rock brittleness index values under different confining pressures.
3.1. Specimen Preparation
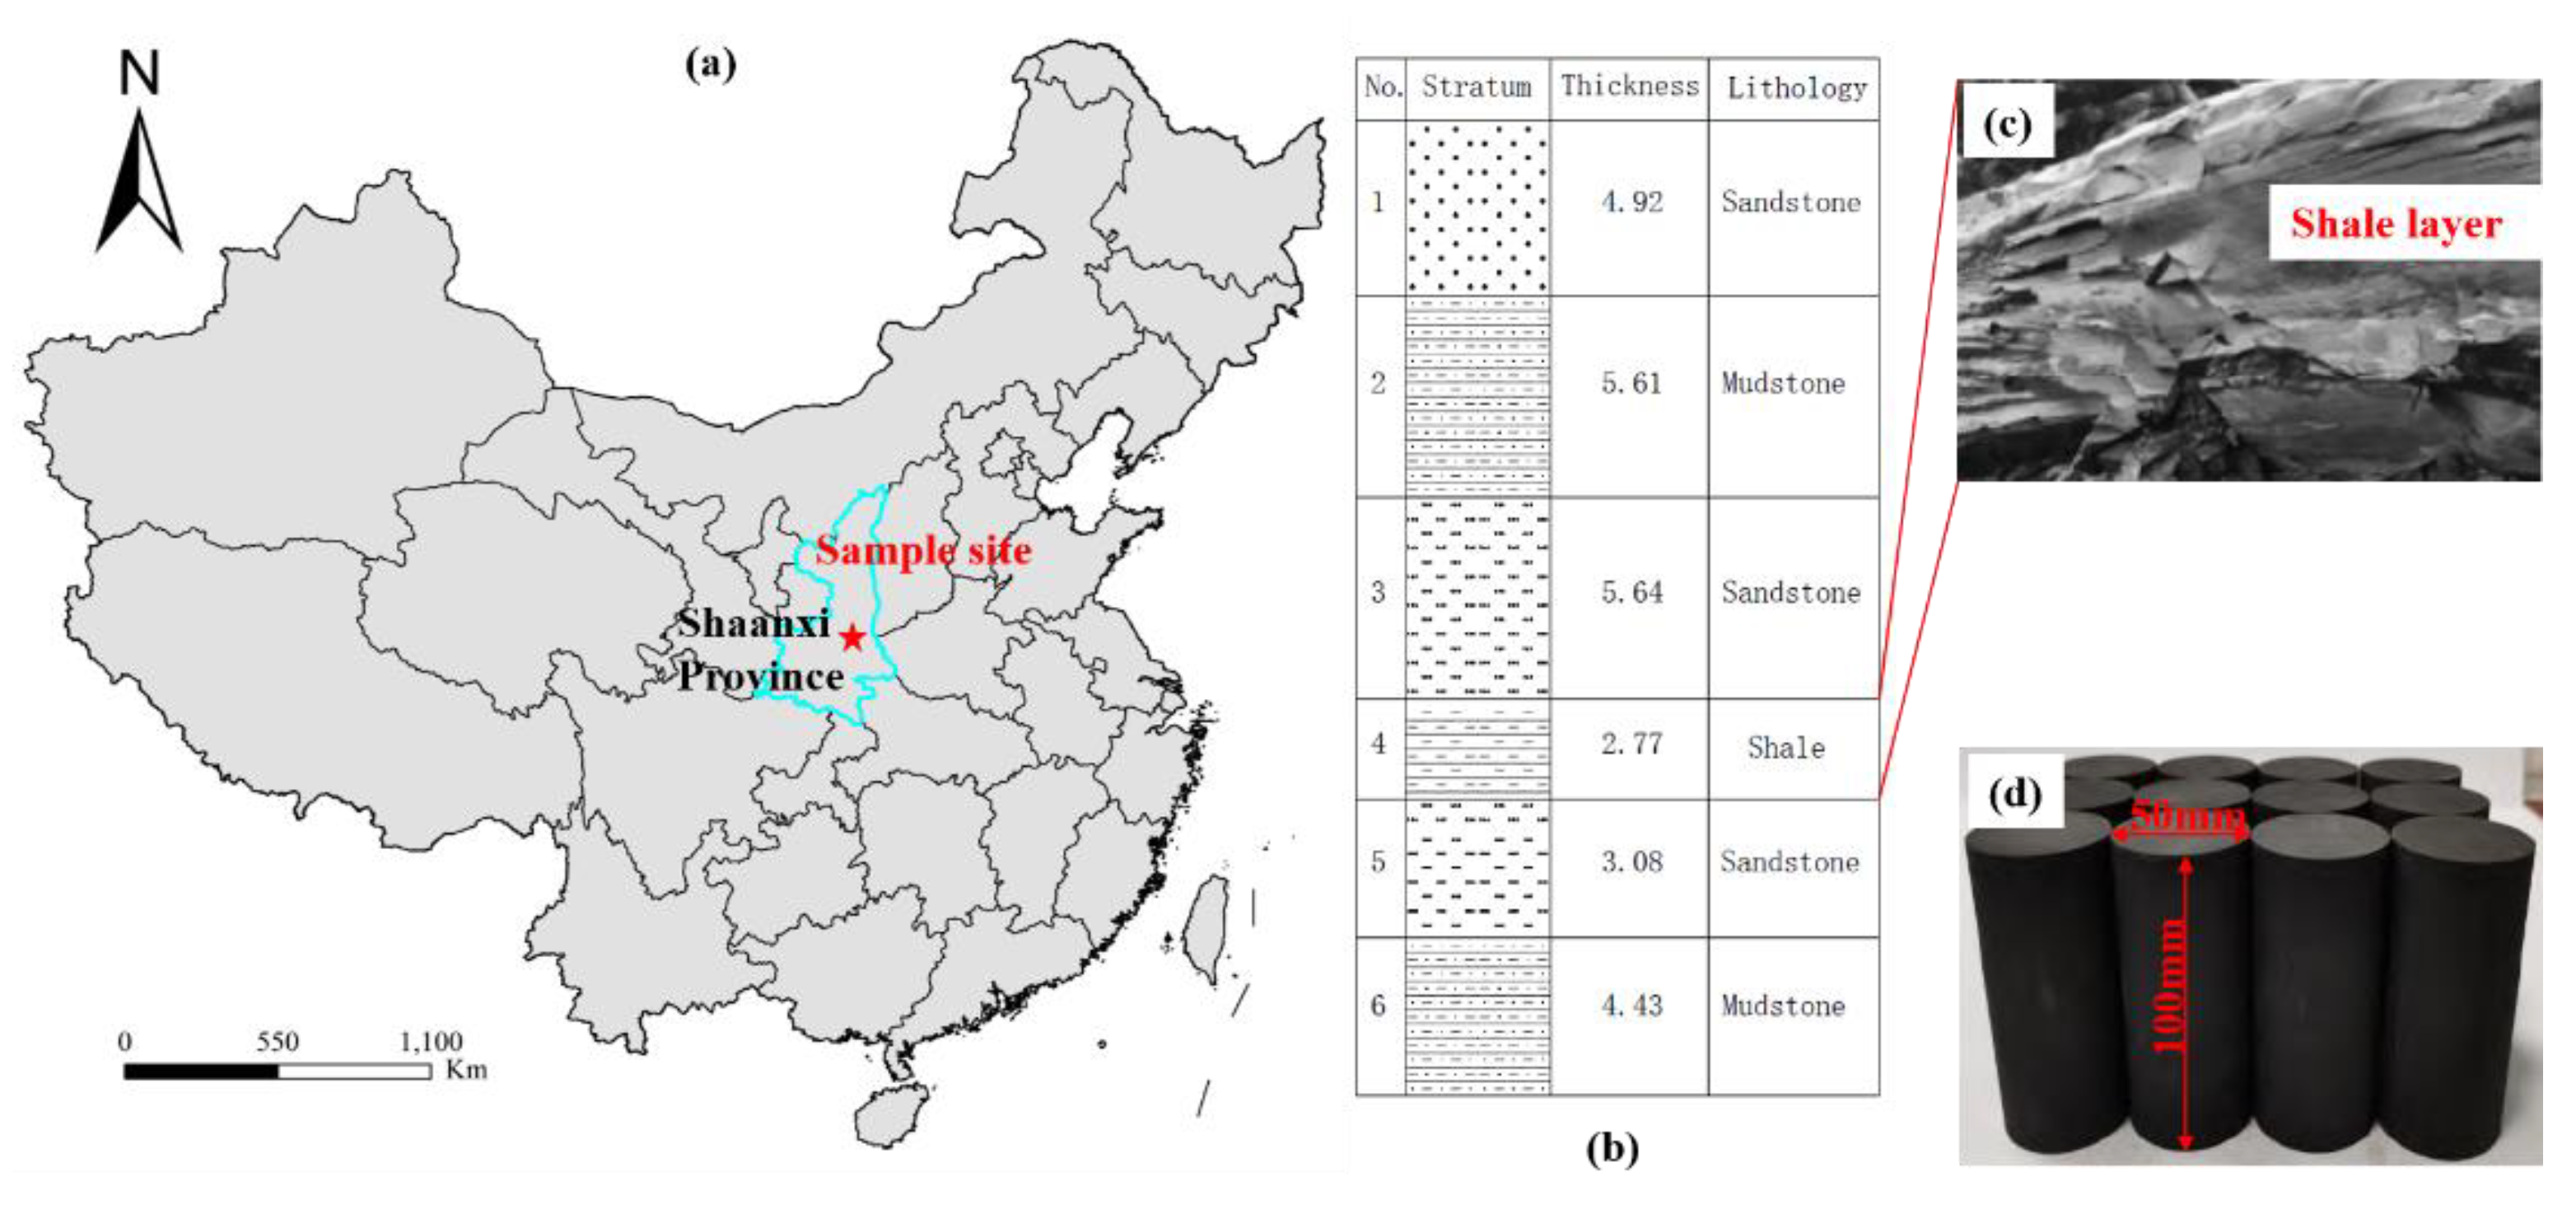
The specimens used in this research were shale rock; an intact shale block was mined from Shaanxi Province in China for test preparation. According to a suggestion by the International Society for Rock Mechanics (ISRM), the cylindrical granite specimens were cored with a diameter of 50 mm and a height of 100 mm from an identical block to minimize scattering of the test results. In particular, the shale strata were perpendicular to the axis of the cylindrical specimen. Additionally, sample ends were carefully ground and polished by a grinding machine until the deviation ranges of the flatness and roughness were less than 0.5 mm and 0.05 mm, respectively. The procedures of specimen preparation and stratigraphy formation of the shale rock are shown in
Figure 2.
Table 2 lists the basic physical and mechanical properties of the shale rock.
3.2. Method and Instructions
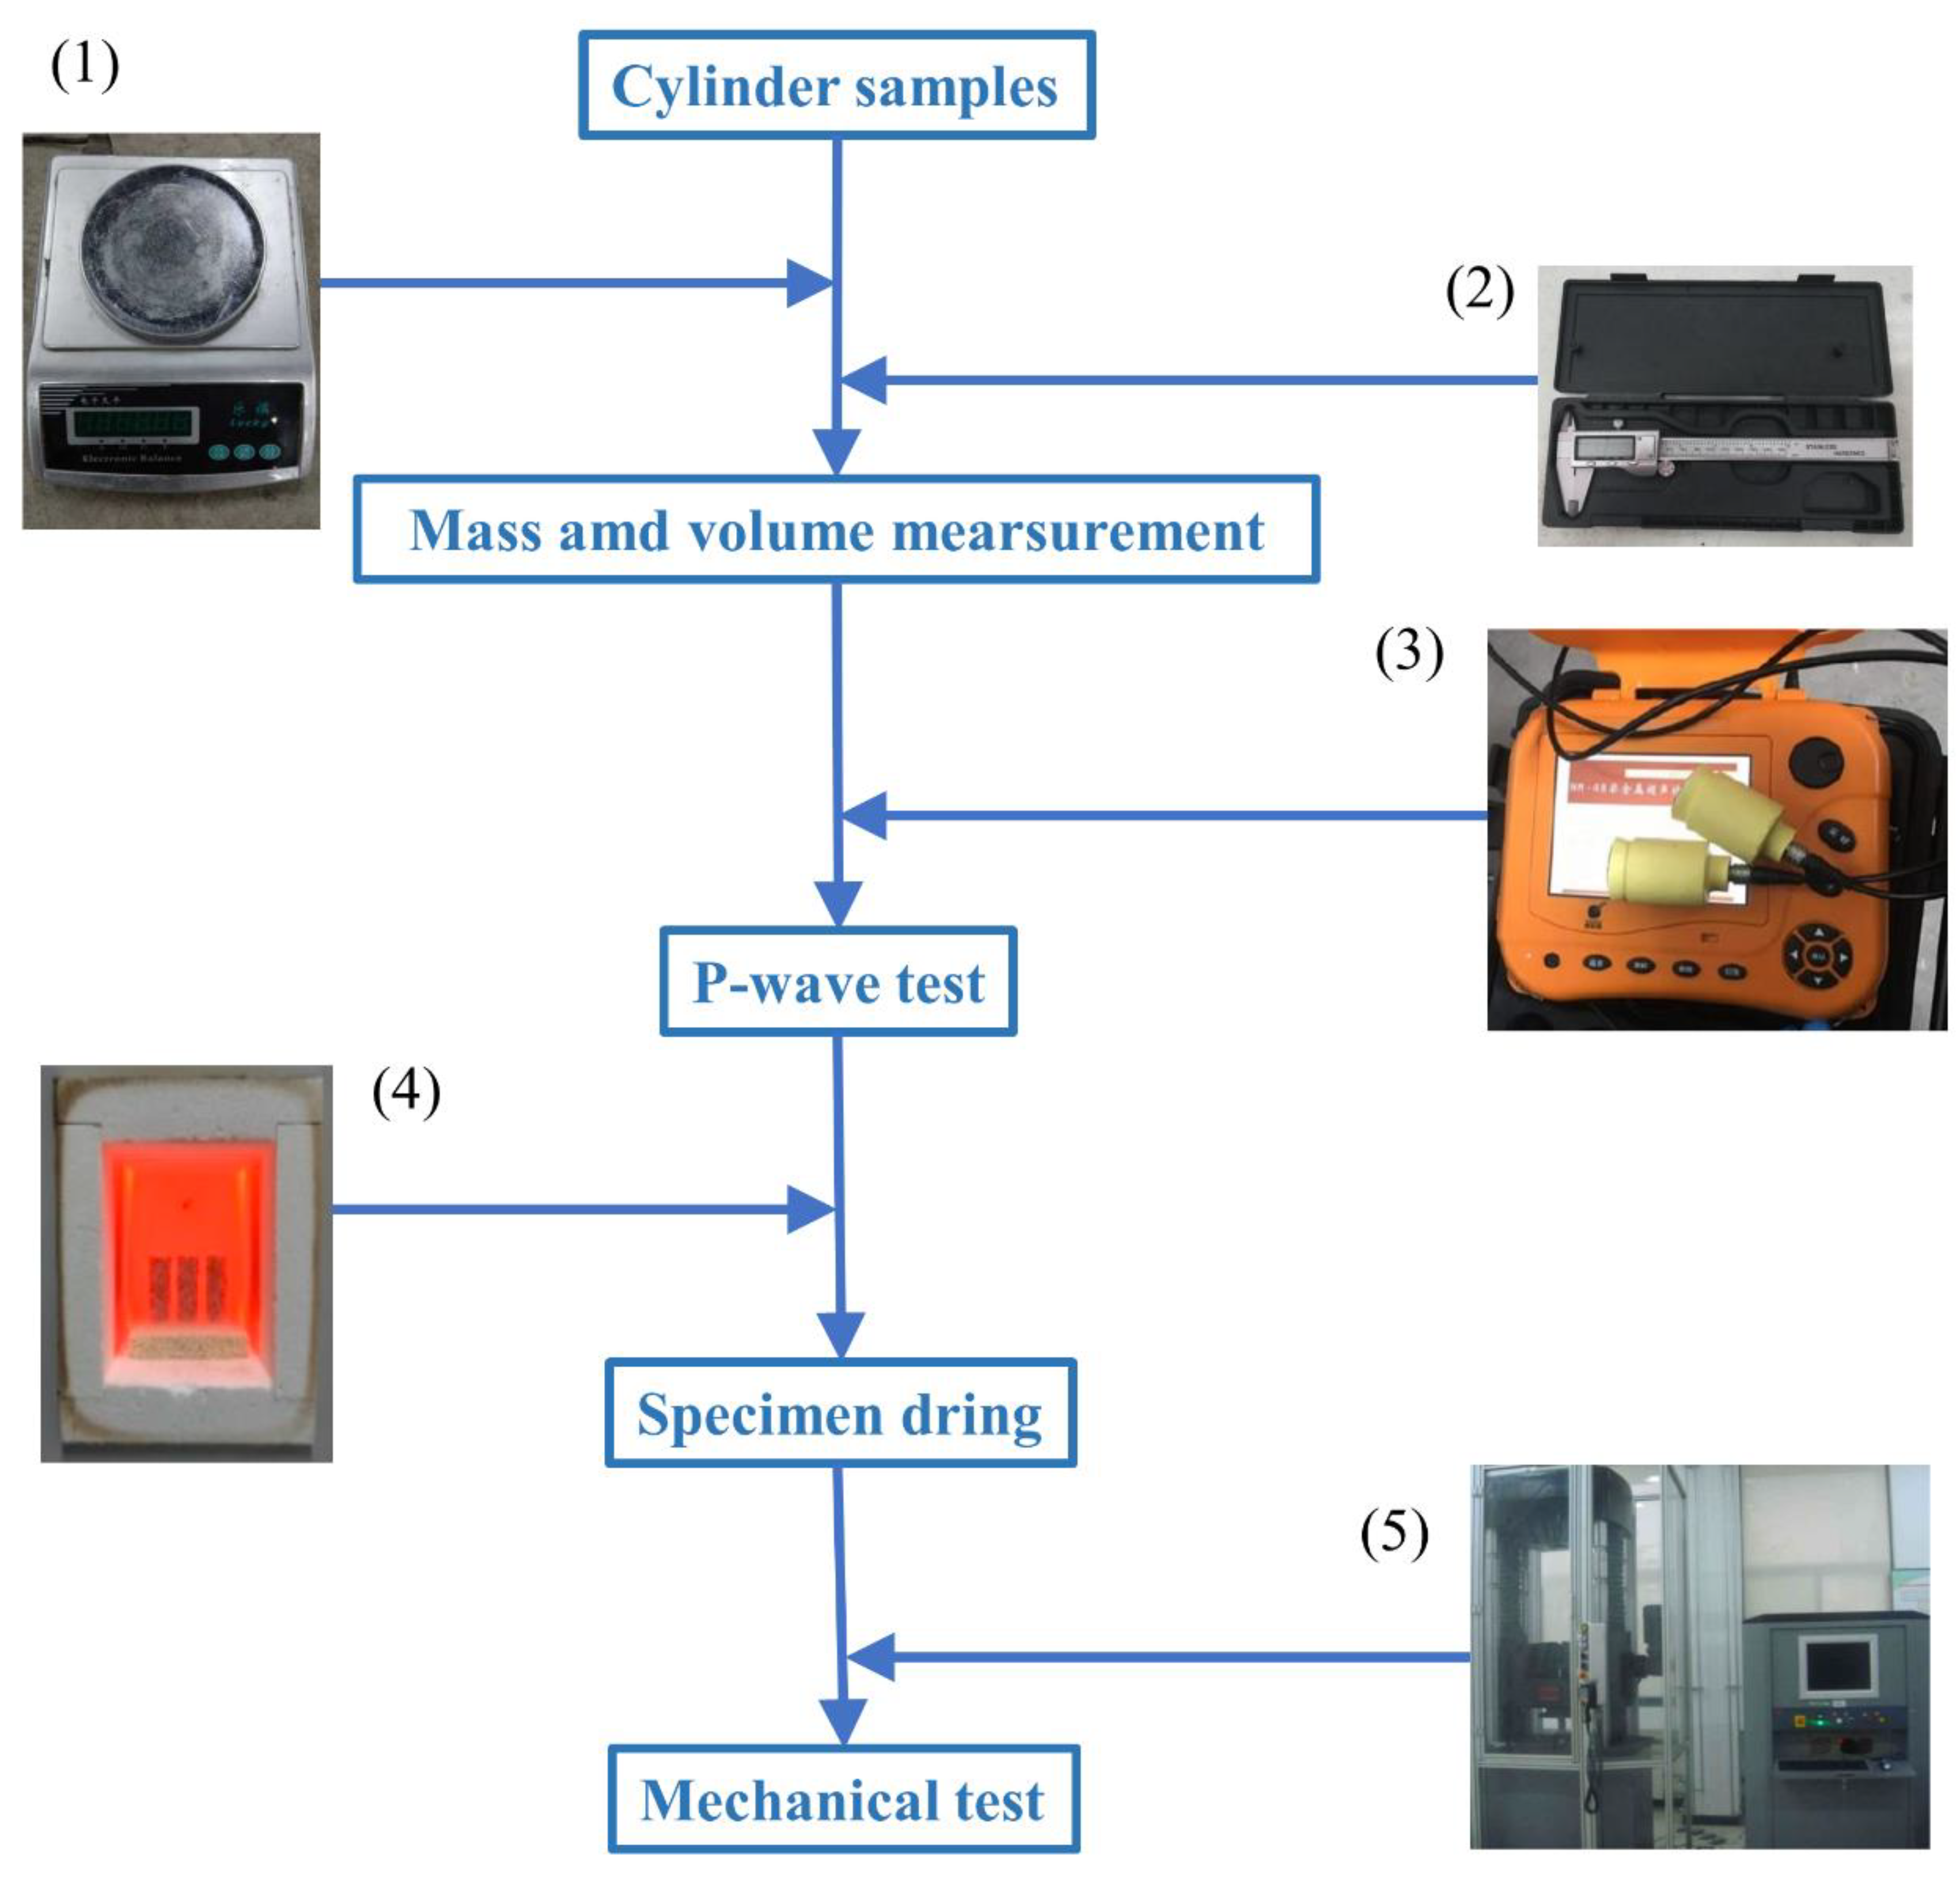
Figure 3 shows the complex experimental process and equipment. The specific procedures are as follows:
In the CTC tests, 7 levels of confining pressure (i.e., 0, 10, 20, 30, 50, and 70 MPa) were predetermined to investigate the brittleness evolution of the shale.
Mass and volume measurements were employed using a balance and a conventional caliper, respectively. Bulk density of the shale samples was calculated from the ratio of the sample mass to the sample volume.
An ultrasonic wave test was performed on the prepared samples. If the P-wave velocities of shale samples were abnormal, those samples were excluded to avoid the influence of microcracks on the test results.
A total of 35 cylindrical shale specimens were divided into 7 groups based on the predetermined confining pressure.
Before the mechanical tests, all the specimens were heated to 45 °C for 48 h in a dry oven and cooled to room temperature naturally to eliminate the influence of moisture.
The laboratory experiments were conducted using an MTS-4000 rigid servo-controlled triaxial compression test system with a loading capacity of 2200 KN and a maximum confining pressure of 120 MPa. Axial deformation was measured by an MTS system in real time. Radial deformation was monitored using a radial linear variable differential transducer, which was wrapped tightly around the specimen.
3.3. Experimental Procedure
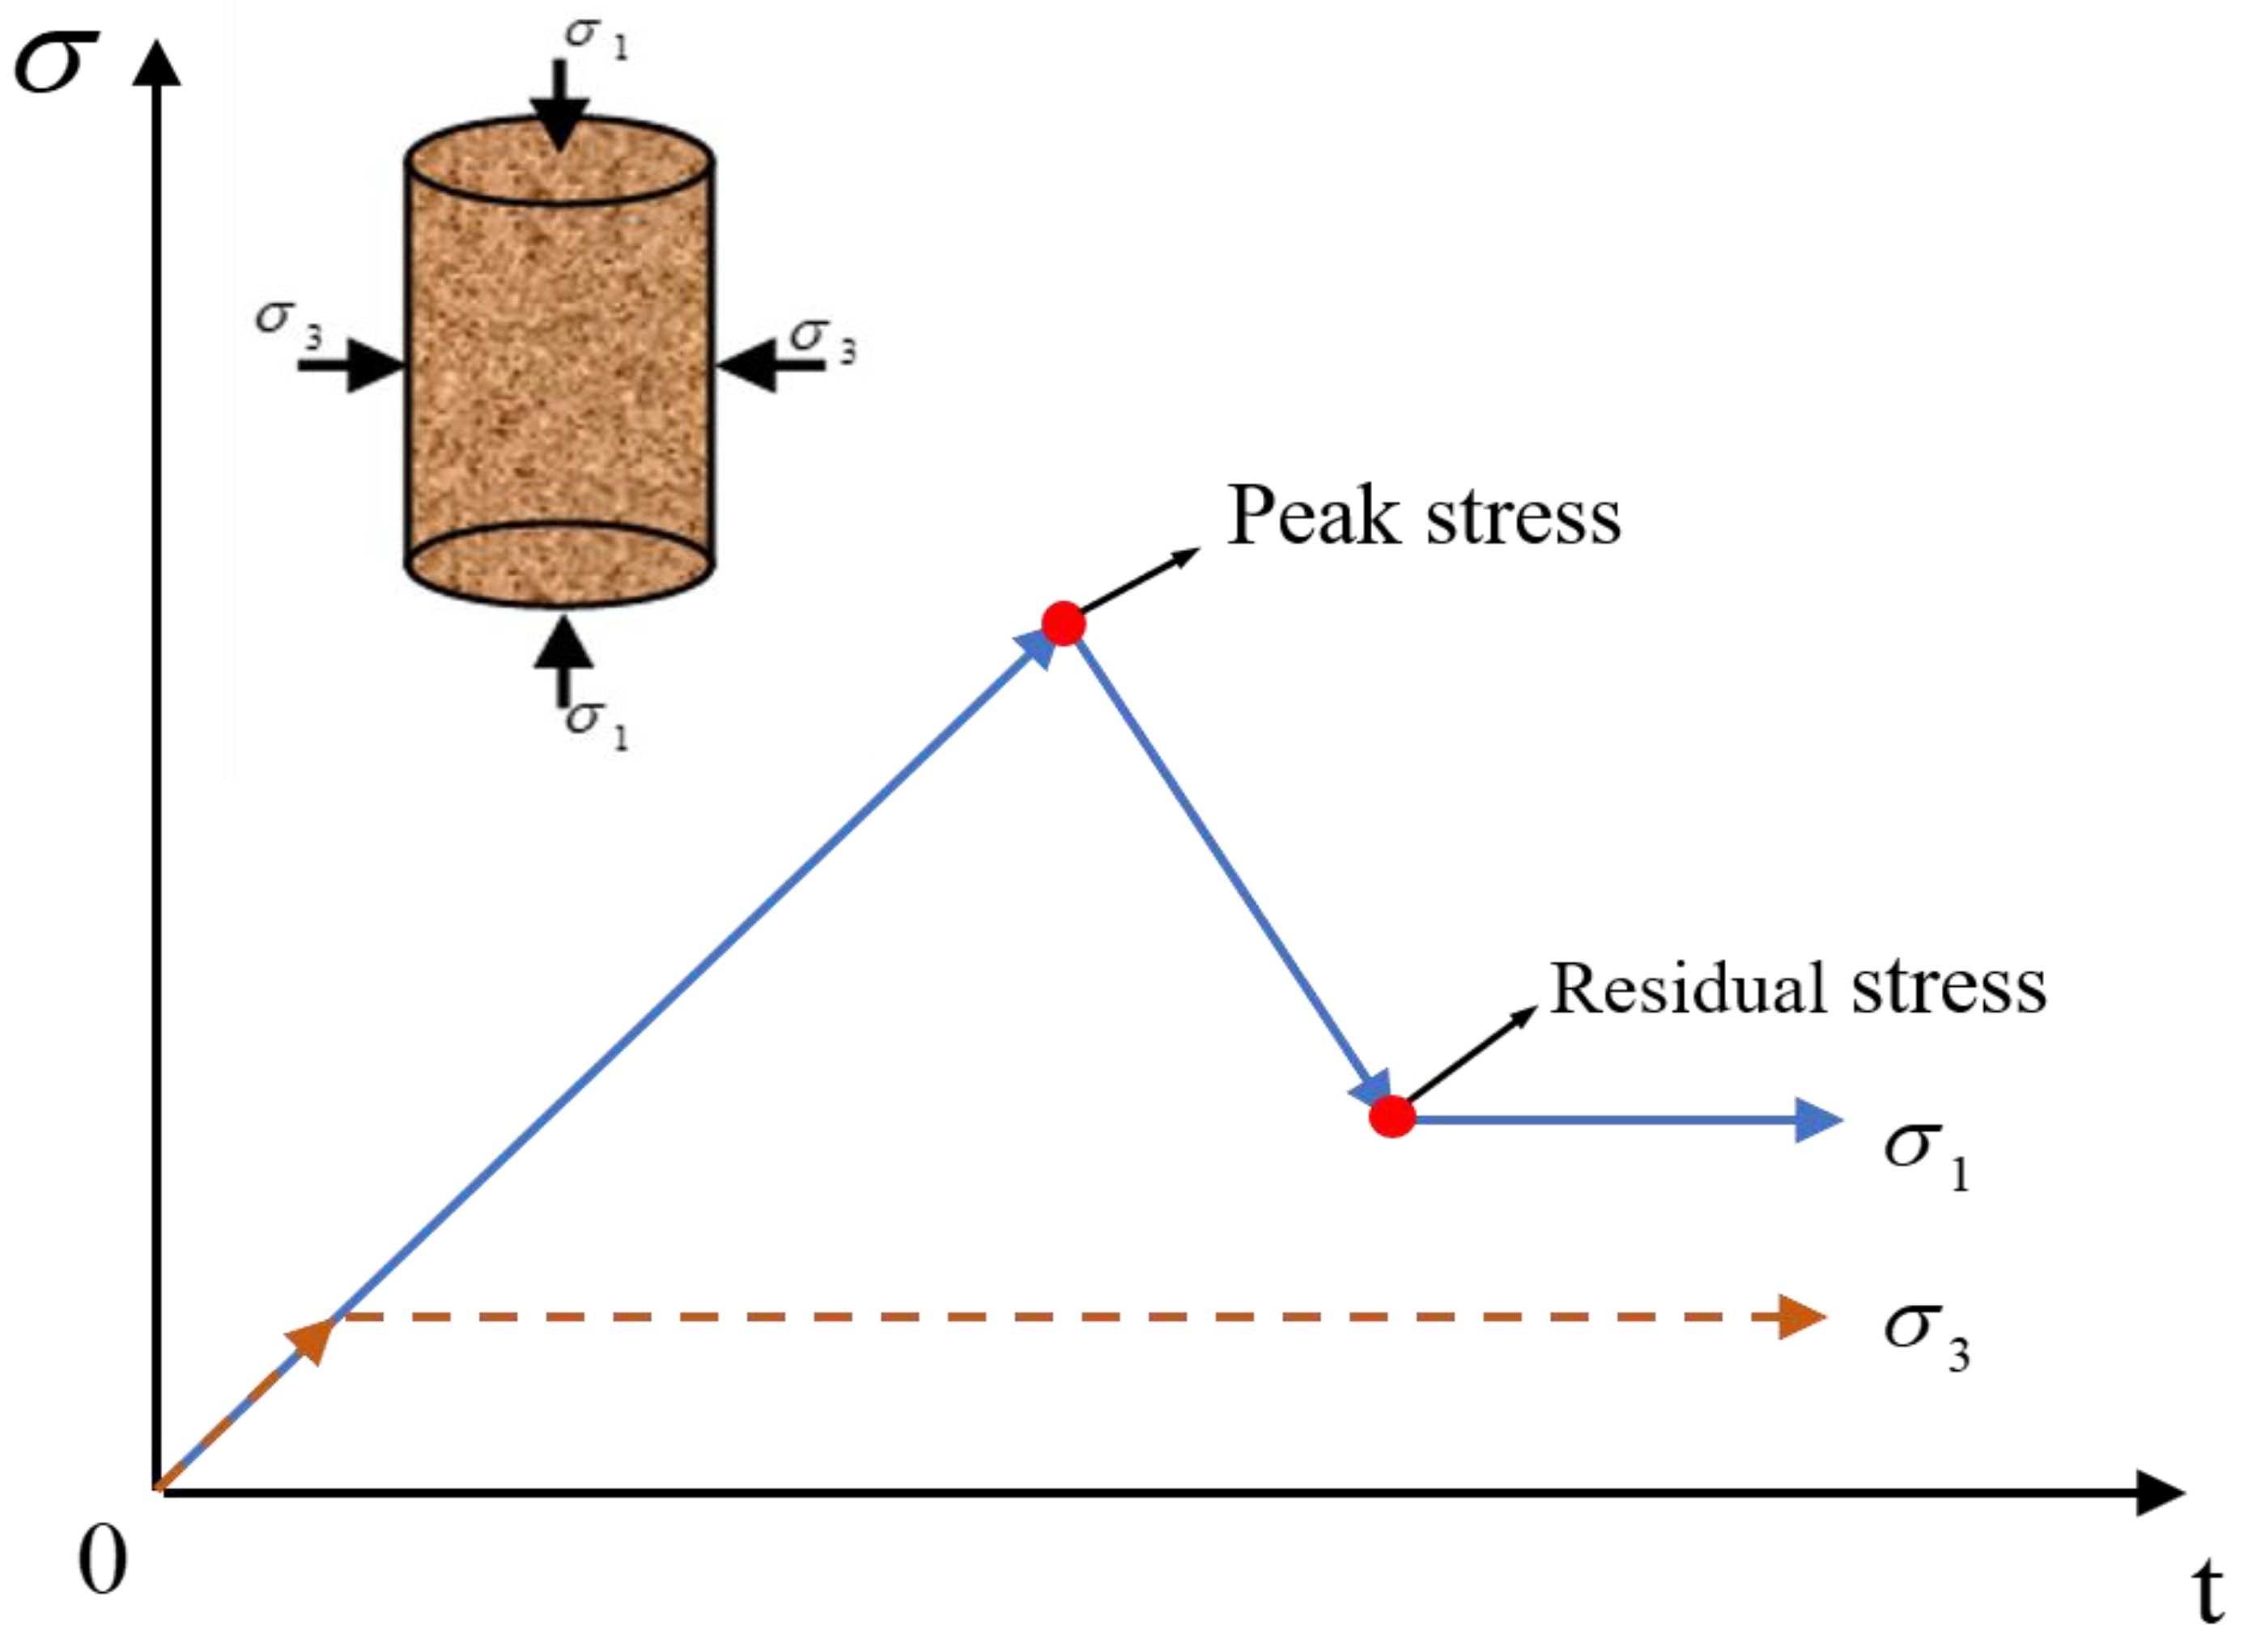
For comparison, a conventional uniaxial compression (CUC) test was first performed on the shale samples before CTC testing. A consistent loading mode of axial stress control was used for all CUC and CTC tests. To obtain reliable complete stress–strain curves, the loading rate was set to a low value of 0.05 MPa/s. The CTC tests for shale samples were conducted for six different scenarios with confining pressures of 5, 10, 20, 30, 50, and 70 MPa. The experimental loading paths of the CTC tests are shown in
Figure 4.
The specific operational procedures of the CTC laboratory experiments were as follows:
Step 1: at the beginning of the test, the shale sample was placed at the center of the test system platen, and a 1 KN axial load was applied to fix the shale sample. This prevented movement of the shale sample during the application of confining load, thus avoiding the impact of eccentric axial load on the test data.
Step 2: the axial pressure and confining pressure were simultaneously loaded to the test, with the confining pressure value set at a loading rate of 0.05 MPa/s; then, the confining pressure was kept constant during testing.
Step 3: the axial pressure was loaded to the surface of the shale sample at a constant axial stress control loading rate of 0.05 MPa/s until failure occurred.
To ensure the accuracy of the research data, each test scenario was repeated five times (i.e., each test scenario with five test cases under the same testing conditions).
4. Results
4.1. Stress–Strain Curves
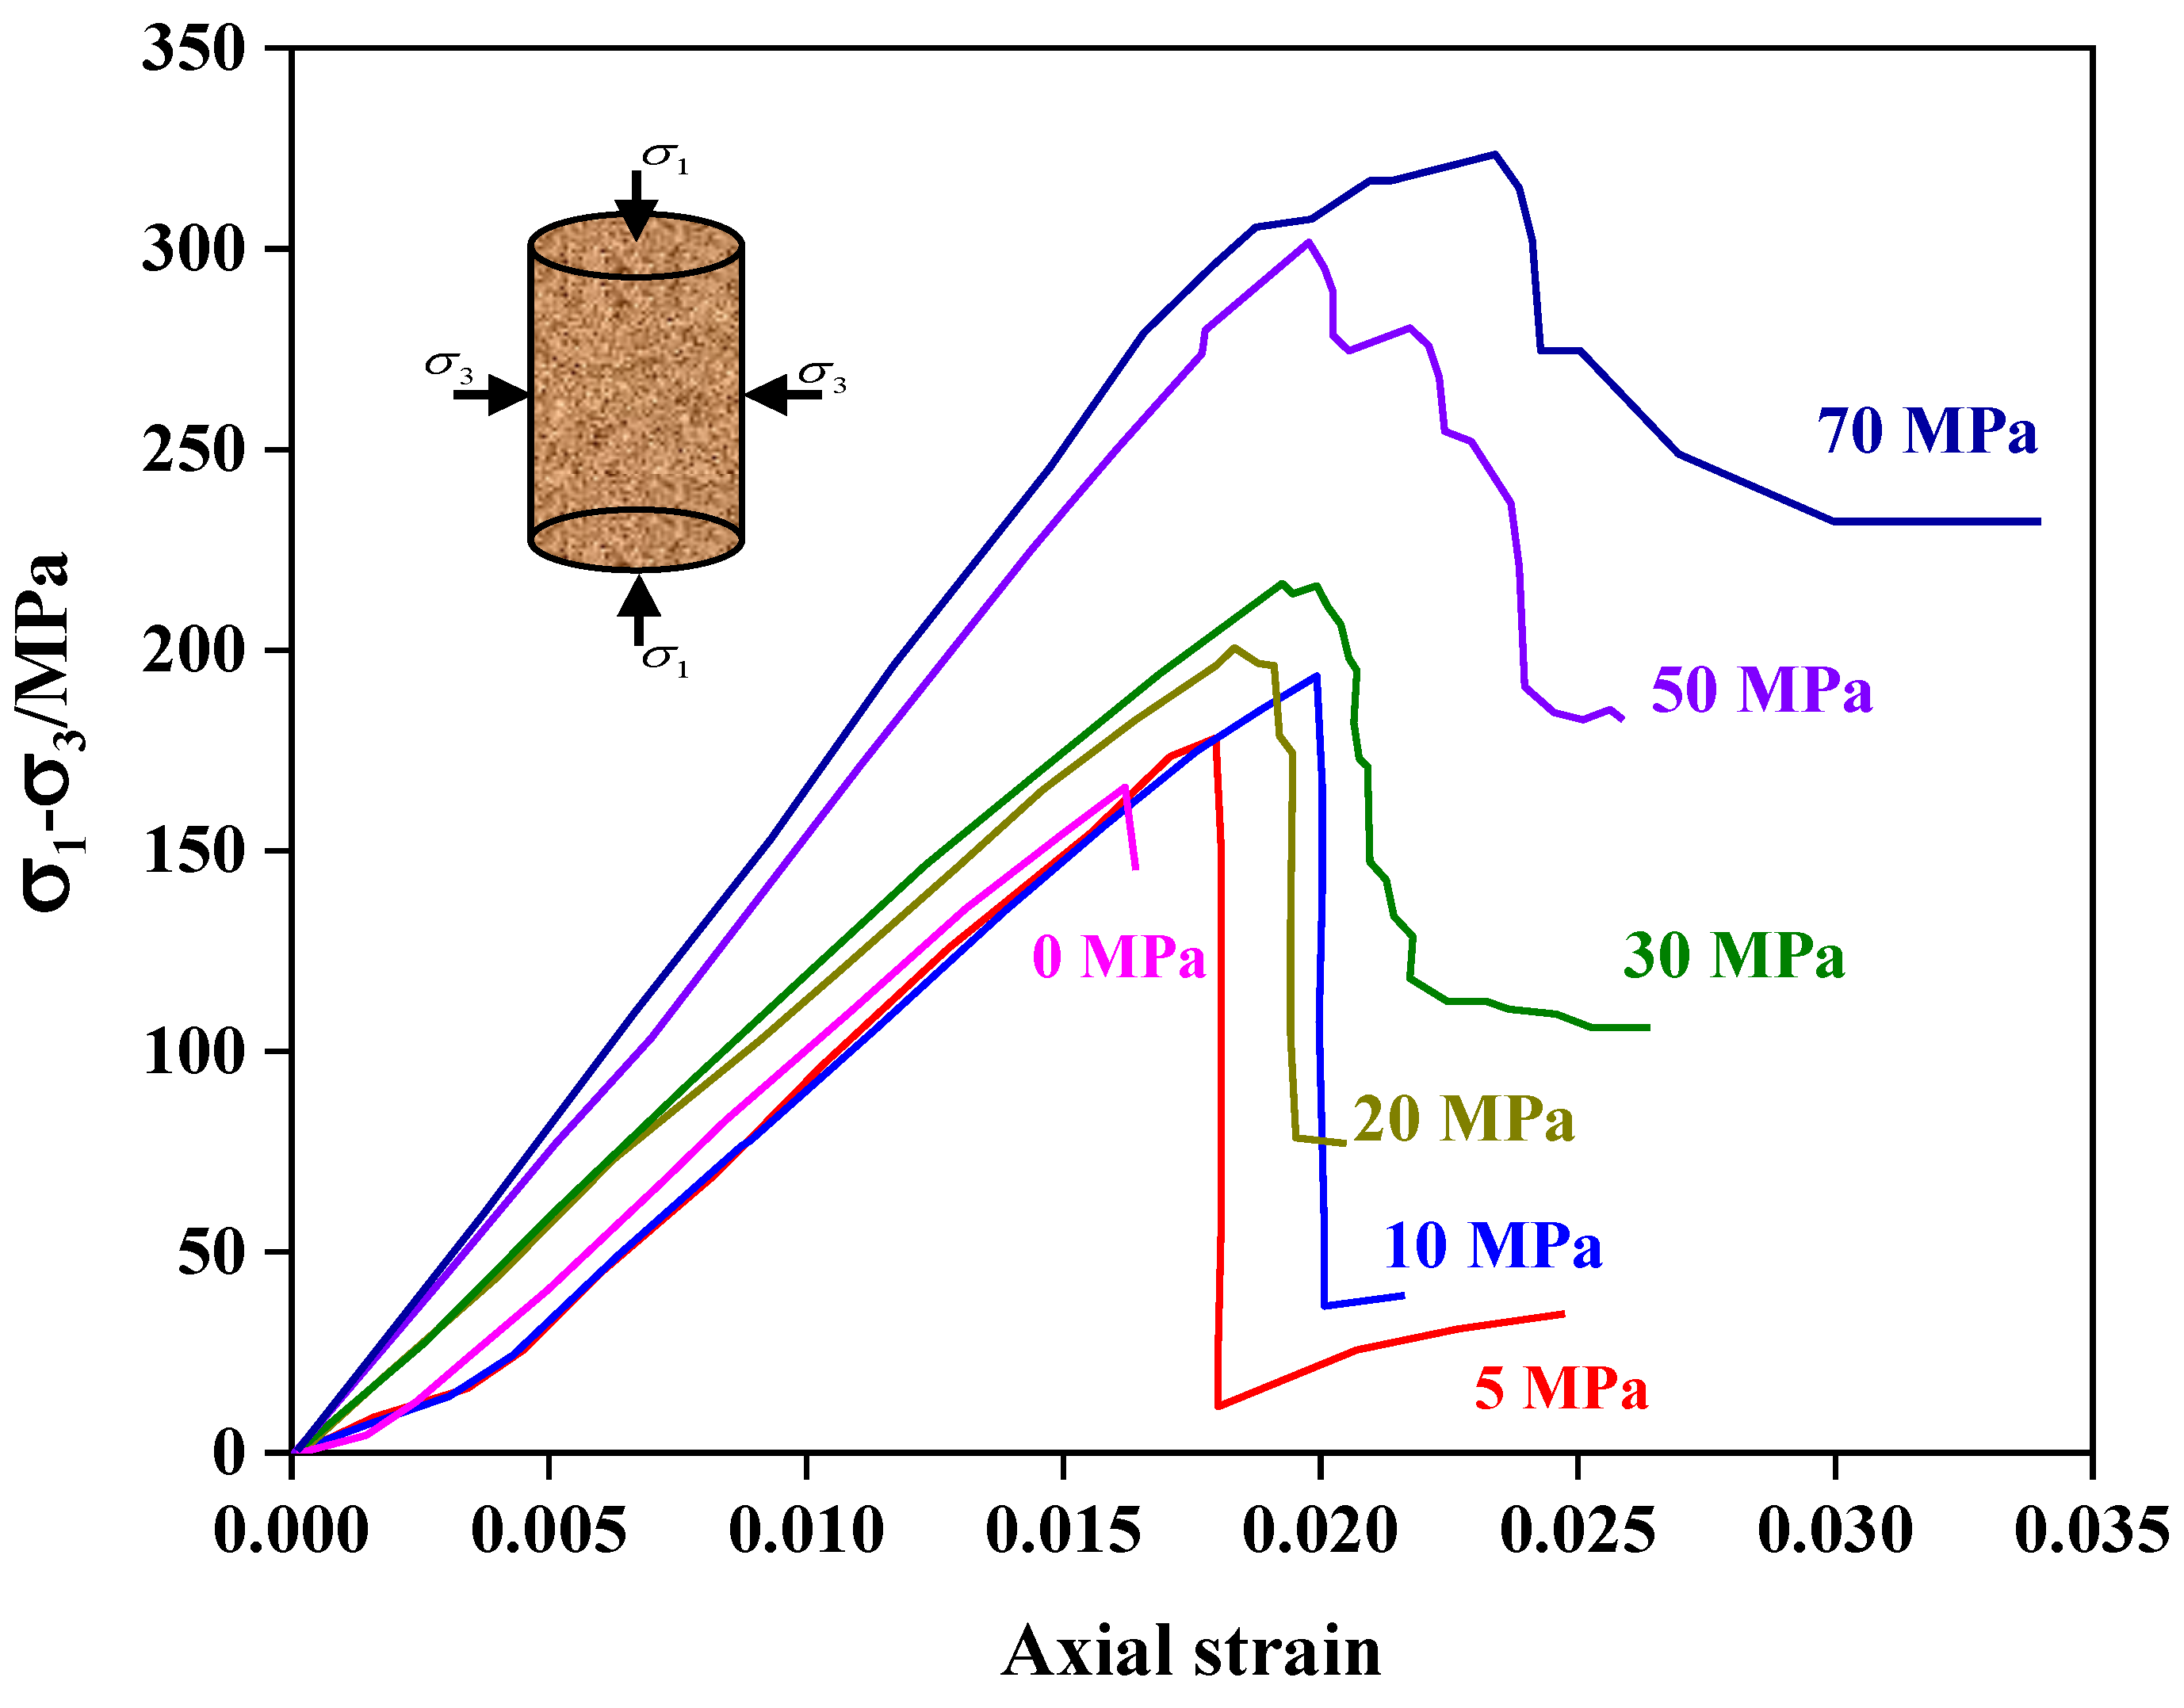
Figure 5 shows the complete stress–strain curves of the shale specimens under different confining pressures. The statistical analysis results of the tested shale rock are listed in
Table 3 and
Table 4.
The complete stress–strain response of the rock under different confining pressures can be divided into four stages: (1) natural crack closure stage: the natural microcracks of rocks gradually closed, and the rocks are compacted; (2) linear elastic deformation stage: the stress–strain curve is almost straight; (3) microcrack stable expansion stage: new microcracks stably develop in rocks; (4) microcrack unstable expansion stage: new microcracks connect with each other in rock, and macrocracks develop gradually until failure occurs. Additionally, when the confining pressure is 0, 5, or 10 MPa, the natural crack closure stage and the linear elastic deformation stage are obvious, whereas the microcrack stable expansion stage and the microcrack unstable expansion stage are almost nonexistent. This indicates that the rocks show high brittleness, with a high brittleness index. Furthermore, the natural crack closure stage almost disappears, whereas the microcrack stable expansion stage presents obviously for rocks under confining pressures of 20 MPa and 30 MPa, which indicates that the brittleness of the rock decreases. Additionally, regarding rocks under 50 MPa and 70 MPa confining pressure, the microcrack unstable expansion stage slowly becomes evident, which means that the brittleness of the rock further declines. Overall, the brittleness of rocks gradually decreases with increased confining pressure, which is consistent with the results of previous studies [
10,
34]. The peak stress and residual strength of the rock increase with increasing confining pressure, indicating that more ultimate elastic strain energy is required for rock failure and more elastic strain energy is stored after rocks fail, with an increase in the confining pressure.
4.2. Reliability Verification of
According to the complete stress–strain curves of the rock, the rock brittleness index
based on the ultimate elastic strain energy can be calculated as follows:
When the ultimate axial strain,
, corresponding to the peak stress is less than the minimum axial strain,
, in the ideal post-peak unloading stage, the post-peak failure energy,
, can be expressed as:
When the ultimate axial strain,
, corresponding to the peak stress is higher than the minimum axial strain,
, in the ideal post-peak unloading stage, the post-peak failure energy,
, can be calculated as follows:
where
is the modulus of elasticity of the rock; and
,
, and
are the ultimate axial strain corresponding to the peak stress, the minimum axial strain in the post-peak ideal unloading stage, and the initial axial strain in the residual strength stage, respectively (
Figure 1). The post-peak ideal unloading line is defined as a straight line parallel to the line of the pre-peak elastic deformation loading stage from the starting point of residual strength stage.
Table 5 lists the calculated brittleness index,
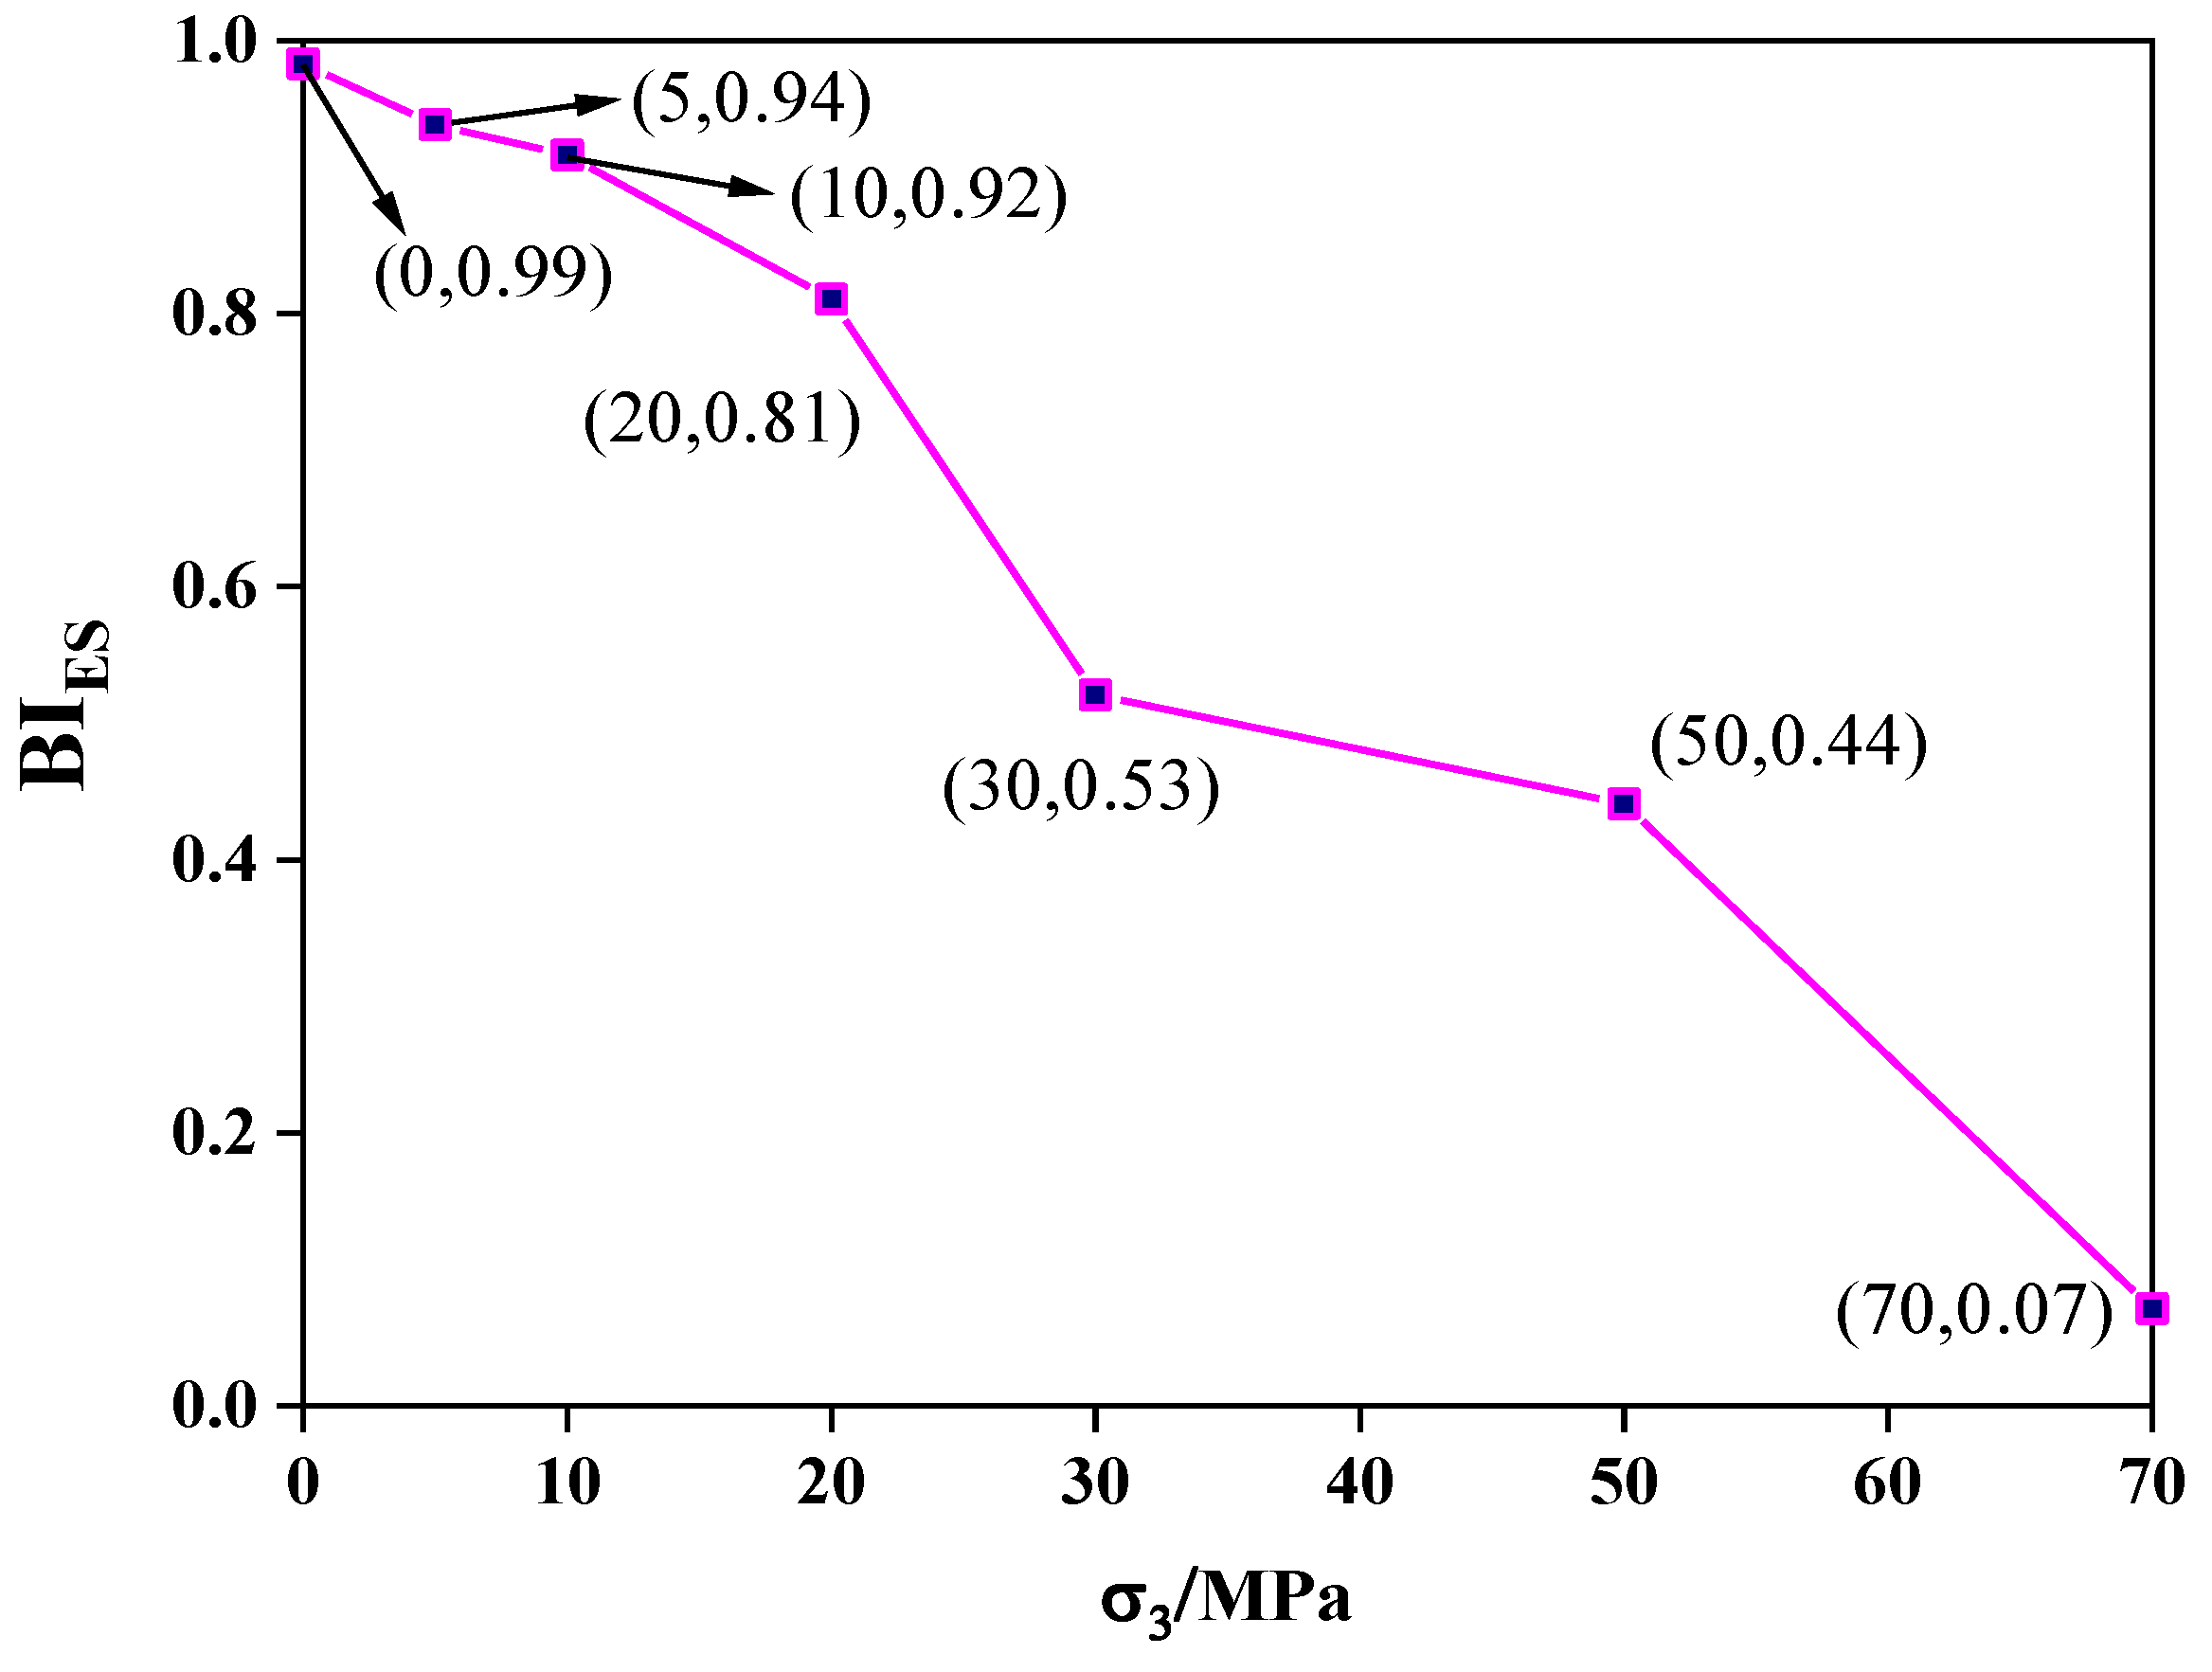
, under different confining pressures. To intuitively exhibit the influence of confining pressure,
Figure 6 demonstrates the variations in the brittleness index,
, with confining pressure.
The brittleness index, , gradually decreases with an increase in confining pressure. Furthermore, based on the definition of the brittleness index, (the lower the value of , the less brittle the rock is), the variable trend indicates that the brittleness index, , can sufficiently reflect the brittleness characteristics of rocks. In addition, results were in agreement with the characteristics of the stress–strain curves obtained from shale samples under different confining pressures; the rock shows higher brittleness, and the value is higher under the confining pressures of 0 MPa, 5 Mpa, and 10 Mpa. The brittleness of the rock is lower, and the value of is lower when the confining pressure is 20 MPa or 30 Mpa, and both values further decrease when the confining pressure is 50 MPa or 70 MPa.
4.3. Universality Verification of
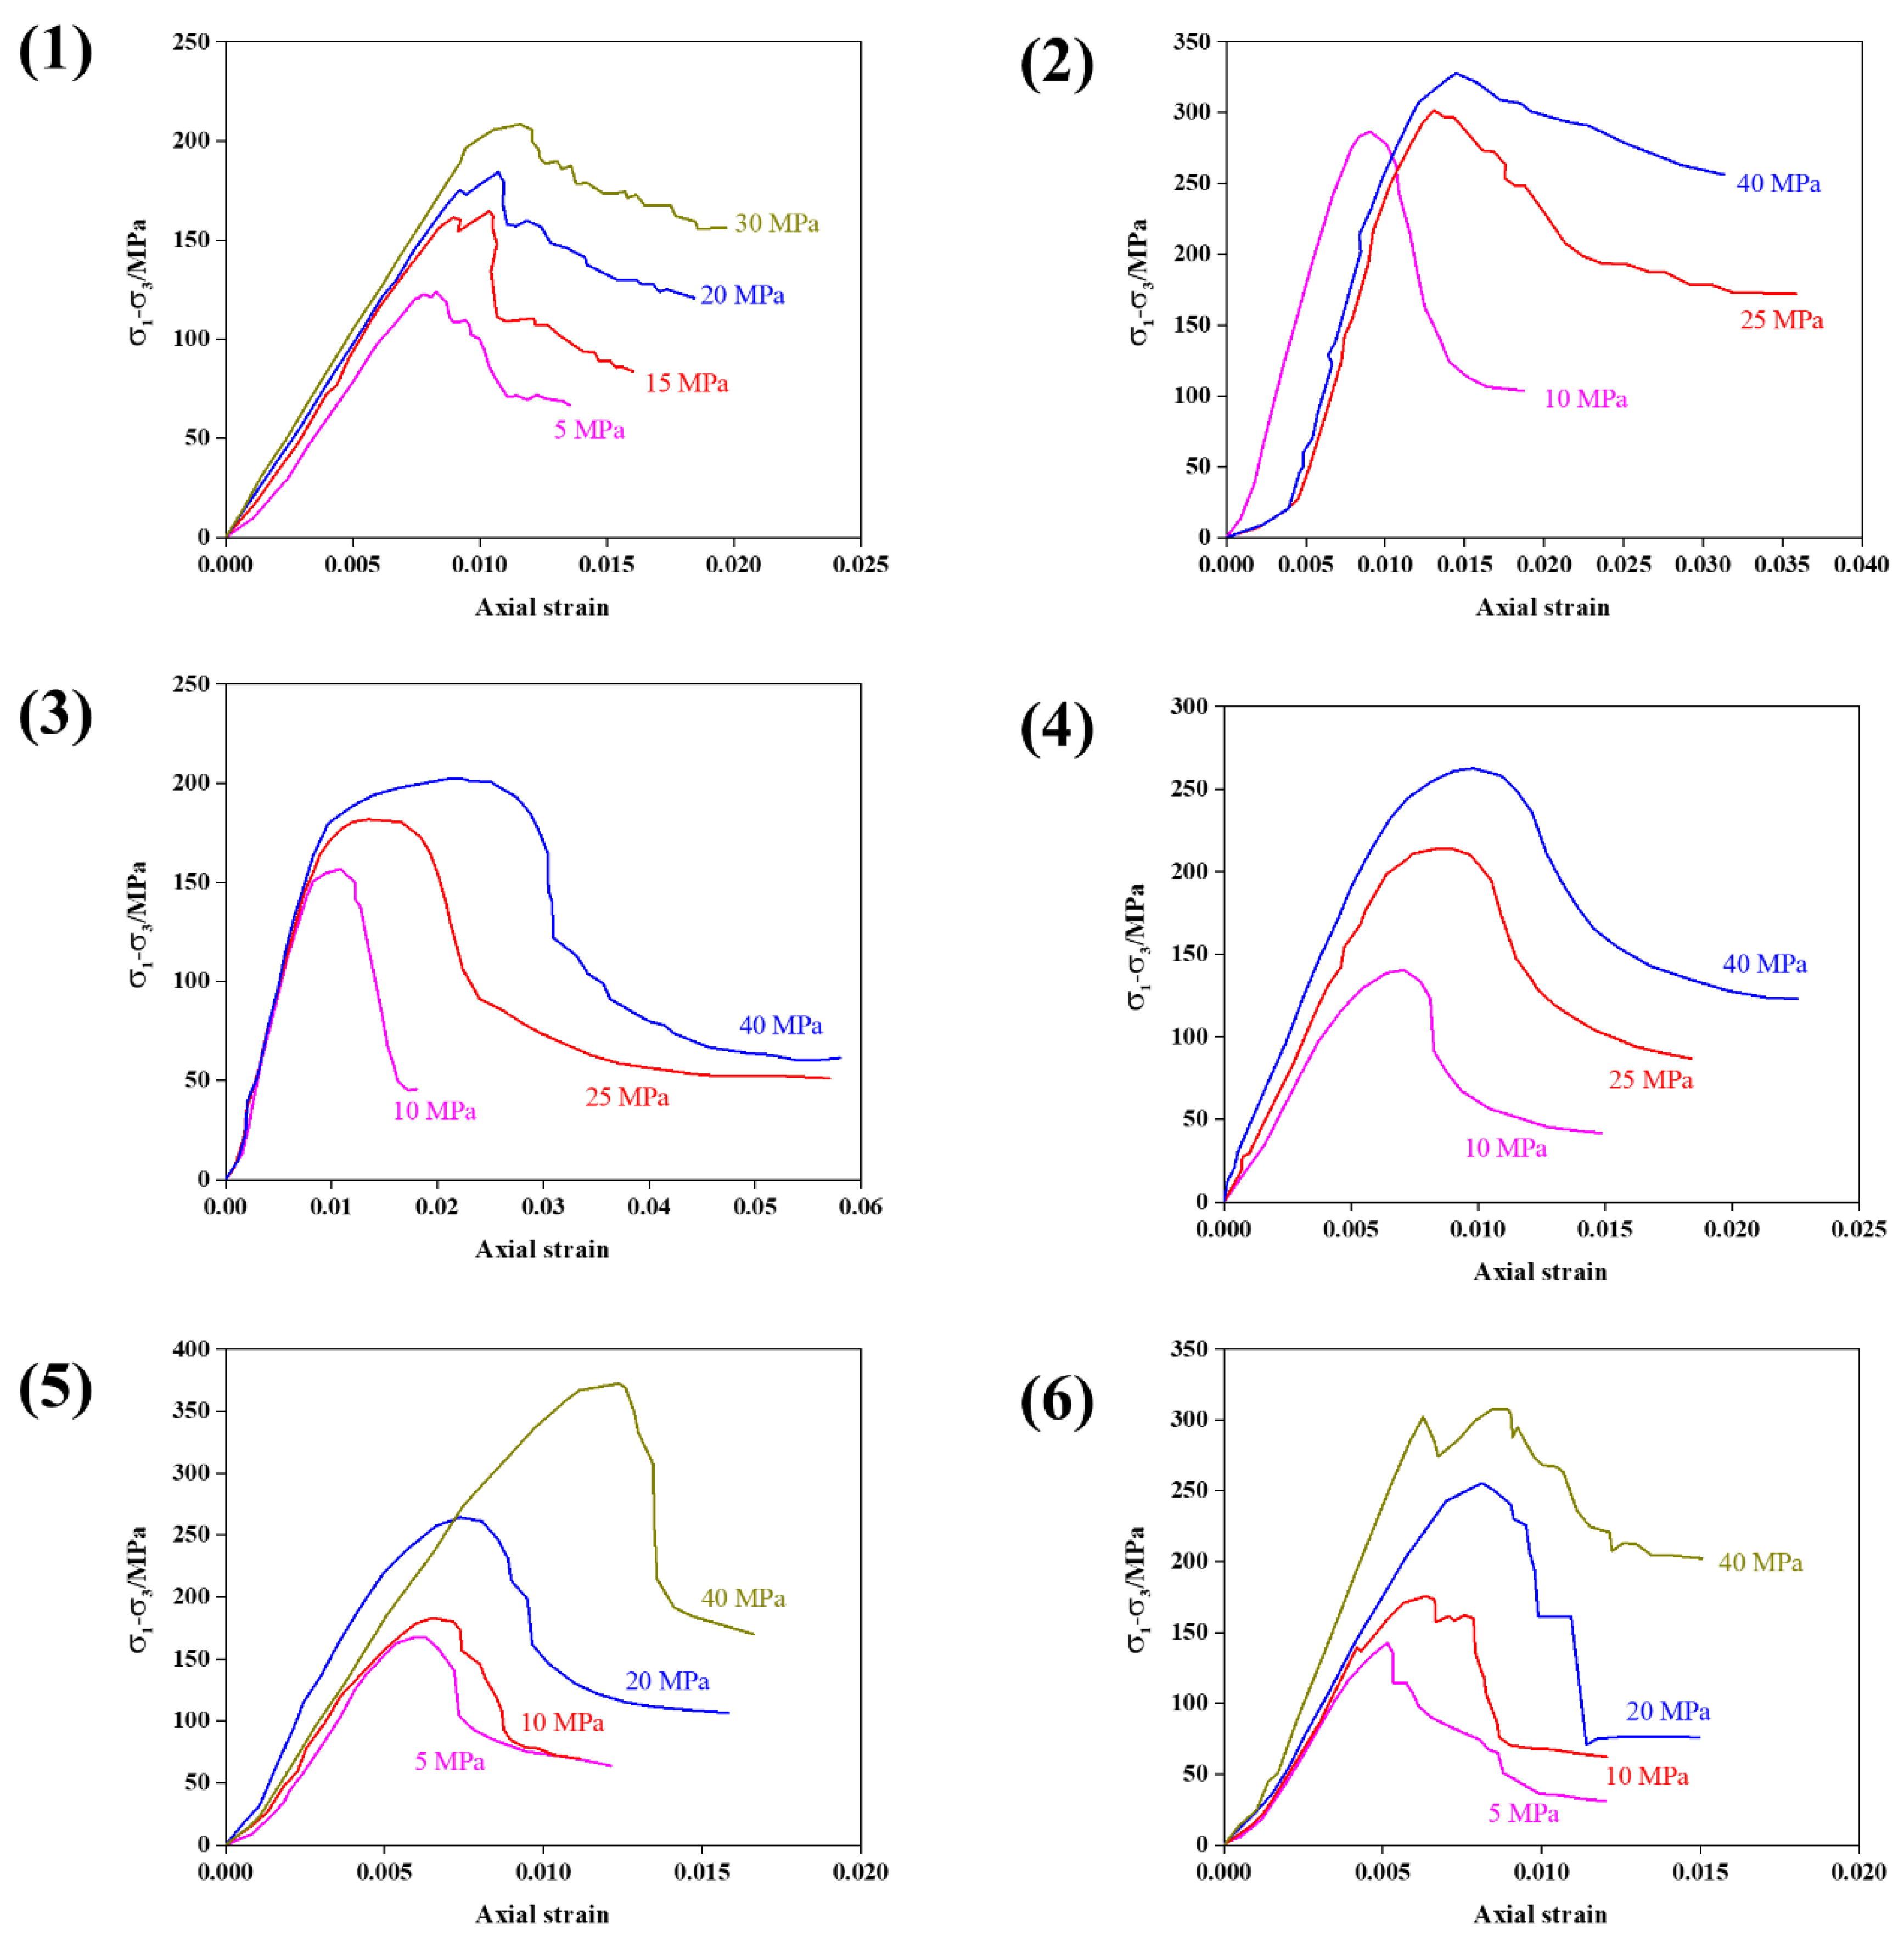
To verify the universality of the proposed brittleness index,
, the CTC test data of six types of rocks (i.e., sandstone [
35], shale 1 [
23], shale 2 [
23], glutenite [
26], granite [
36], and gneiss [
36]) are cited. The corresponding stress–strain curves are exhibited in
Figure 7.
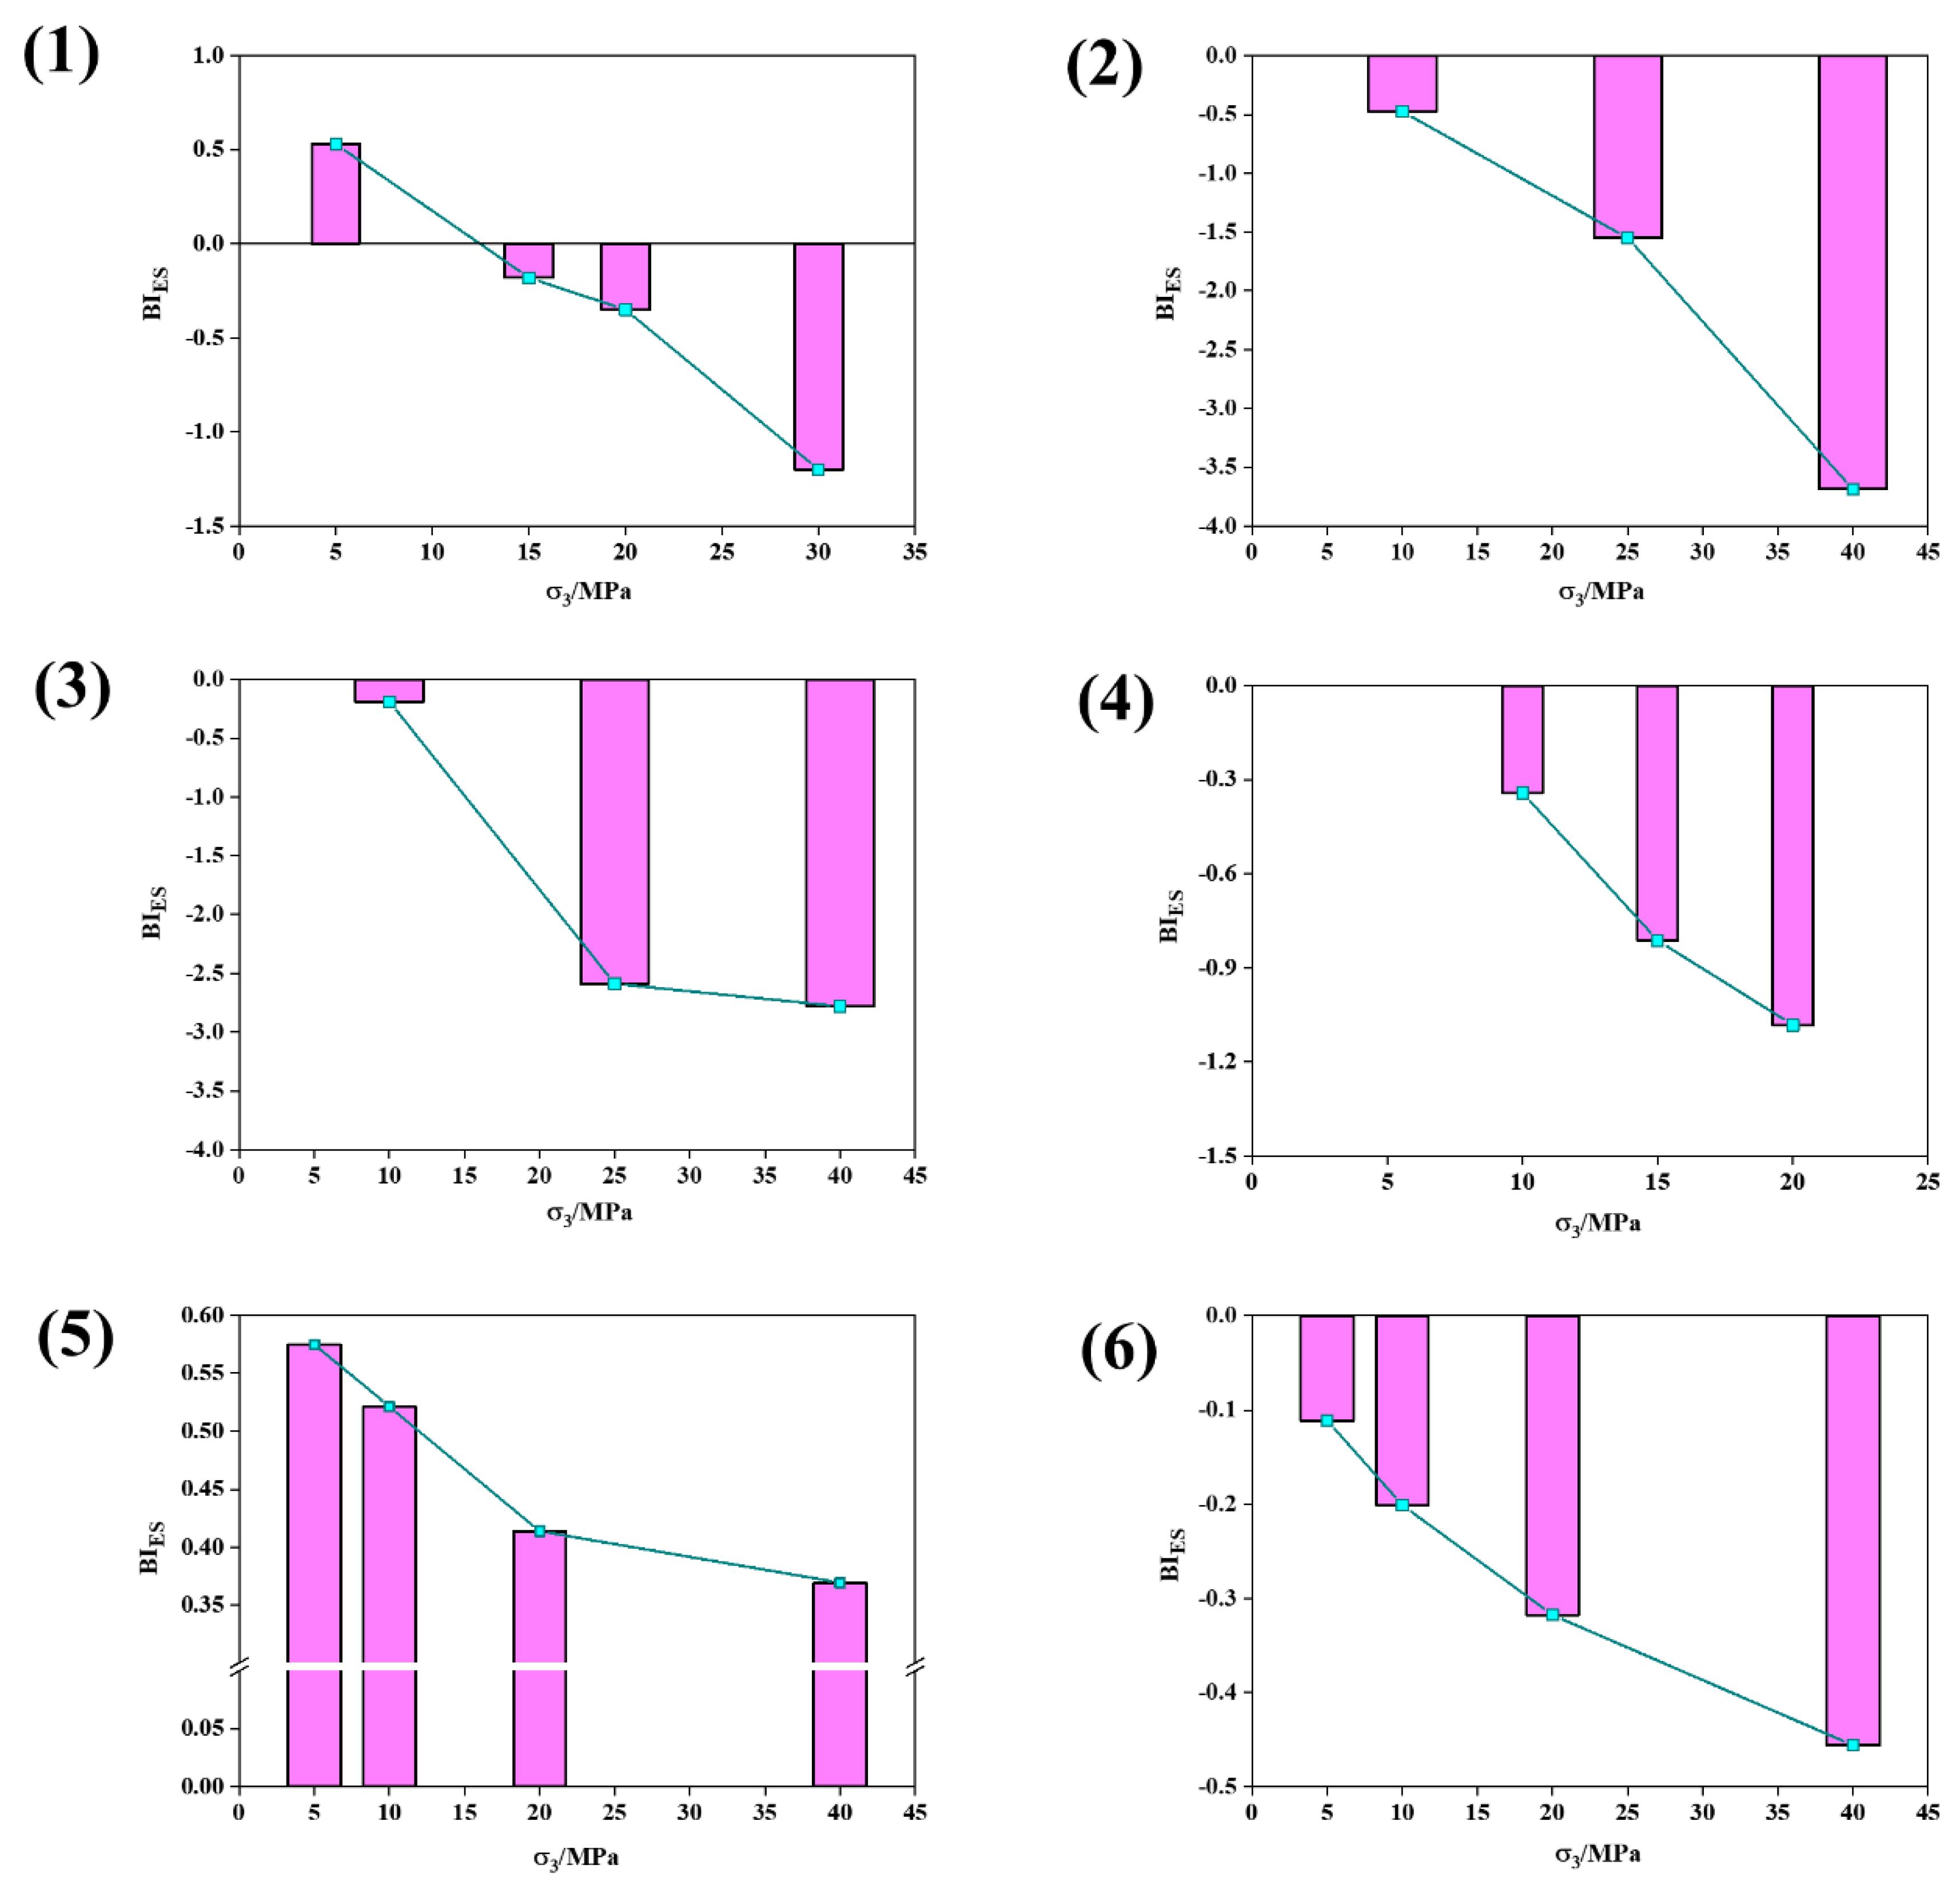
Table 6 lists the results of six types of rocks calculated by the proposed brittleness index,
, on the basis of experimental data. The variation of values of
are further demonstrated in
Figure 8.
The calculated value of the brittleness index,
, for six types of rock gradually decreases with increasing confining pressure, which is consistent with the deformation and failure characteristics of brittle rocks, indicating that
can reflect a wide range of brittle rocks. In addition, negative values of
, as shown in
Figure 8, show that such rocks exhibit more ductile characteristics under the corresponding confining pressures, resulting in the ultimate elastic strain energy not being sufficient to damage the rock and requiring additional input strain energy in the post-peak stage. In summary, the brittleness index,
, can reflect various types of rocks and characterize a wide range of rock brittleness.
5. Discussion
A novel brittleness index,
, based on ultimate elastic strain energy is proposed, taking the relationship between the energy evolution characteristics and the brittleness of rocks into account. To verify the superiority of
, the new brittleness index was compared with 11 existing brittleness indices, which are summarized in
Section 1.
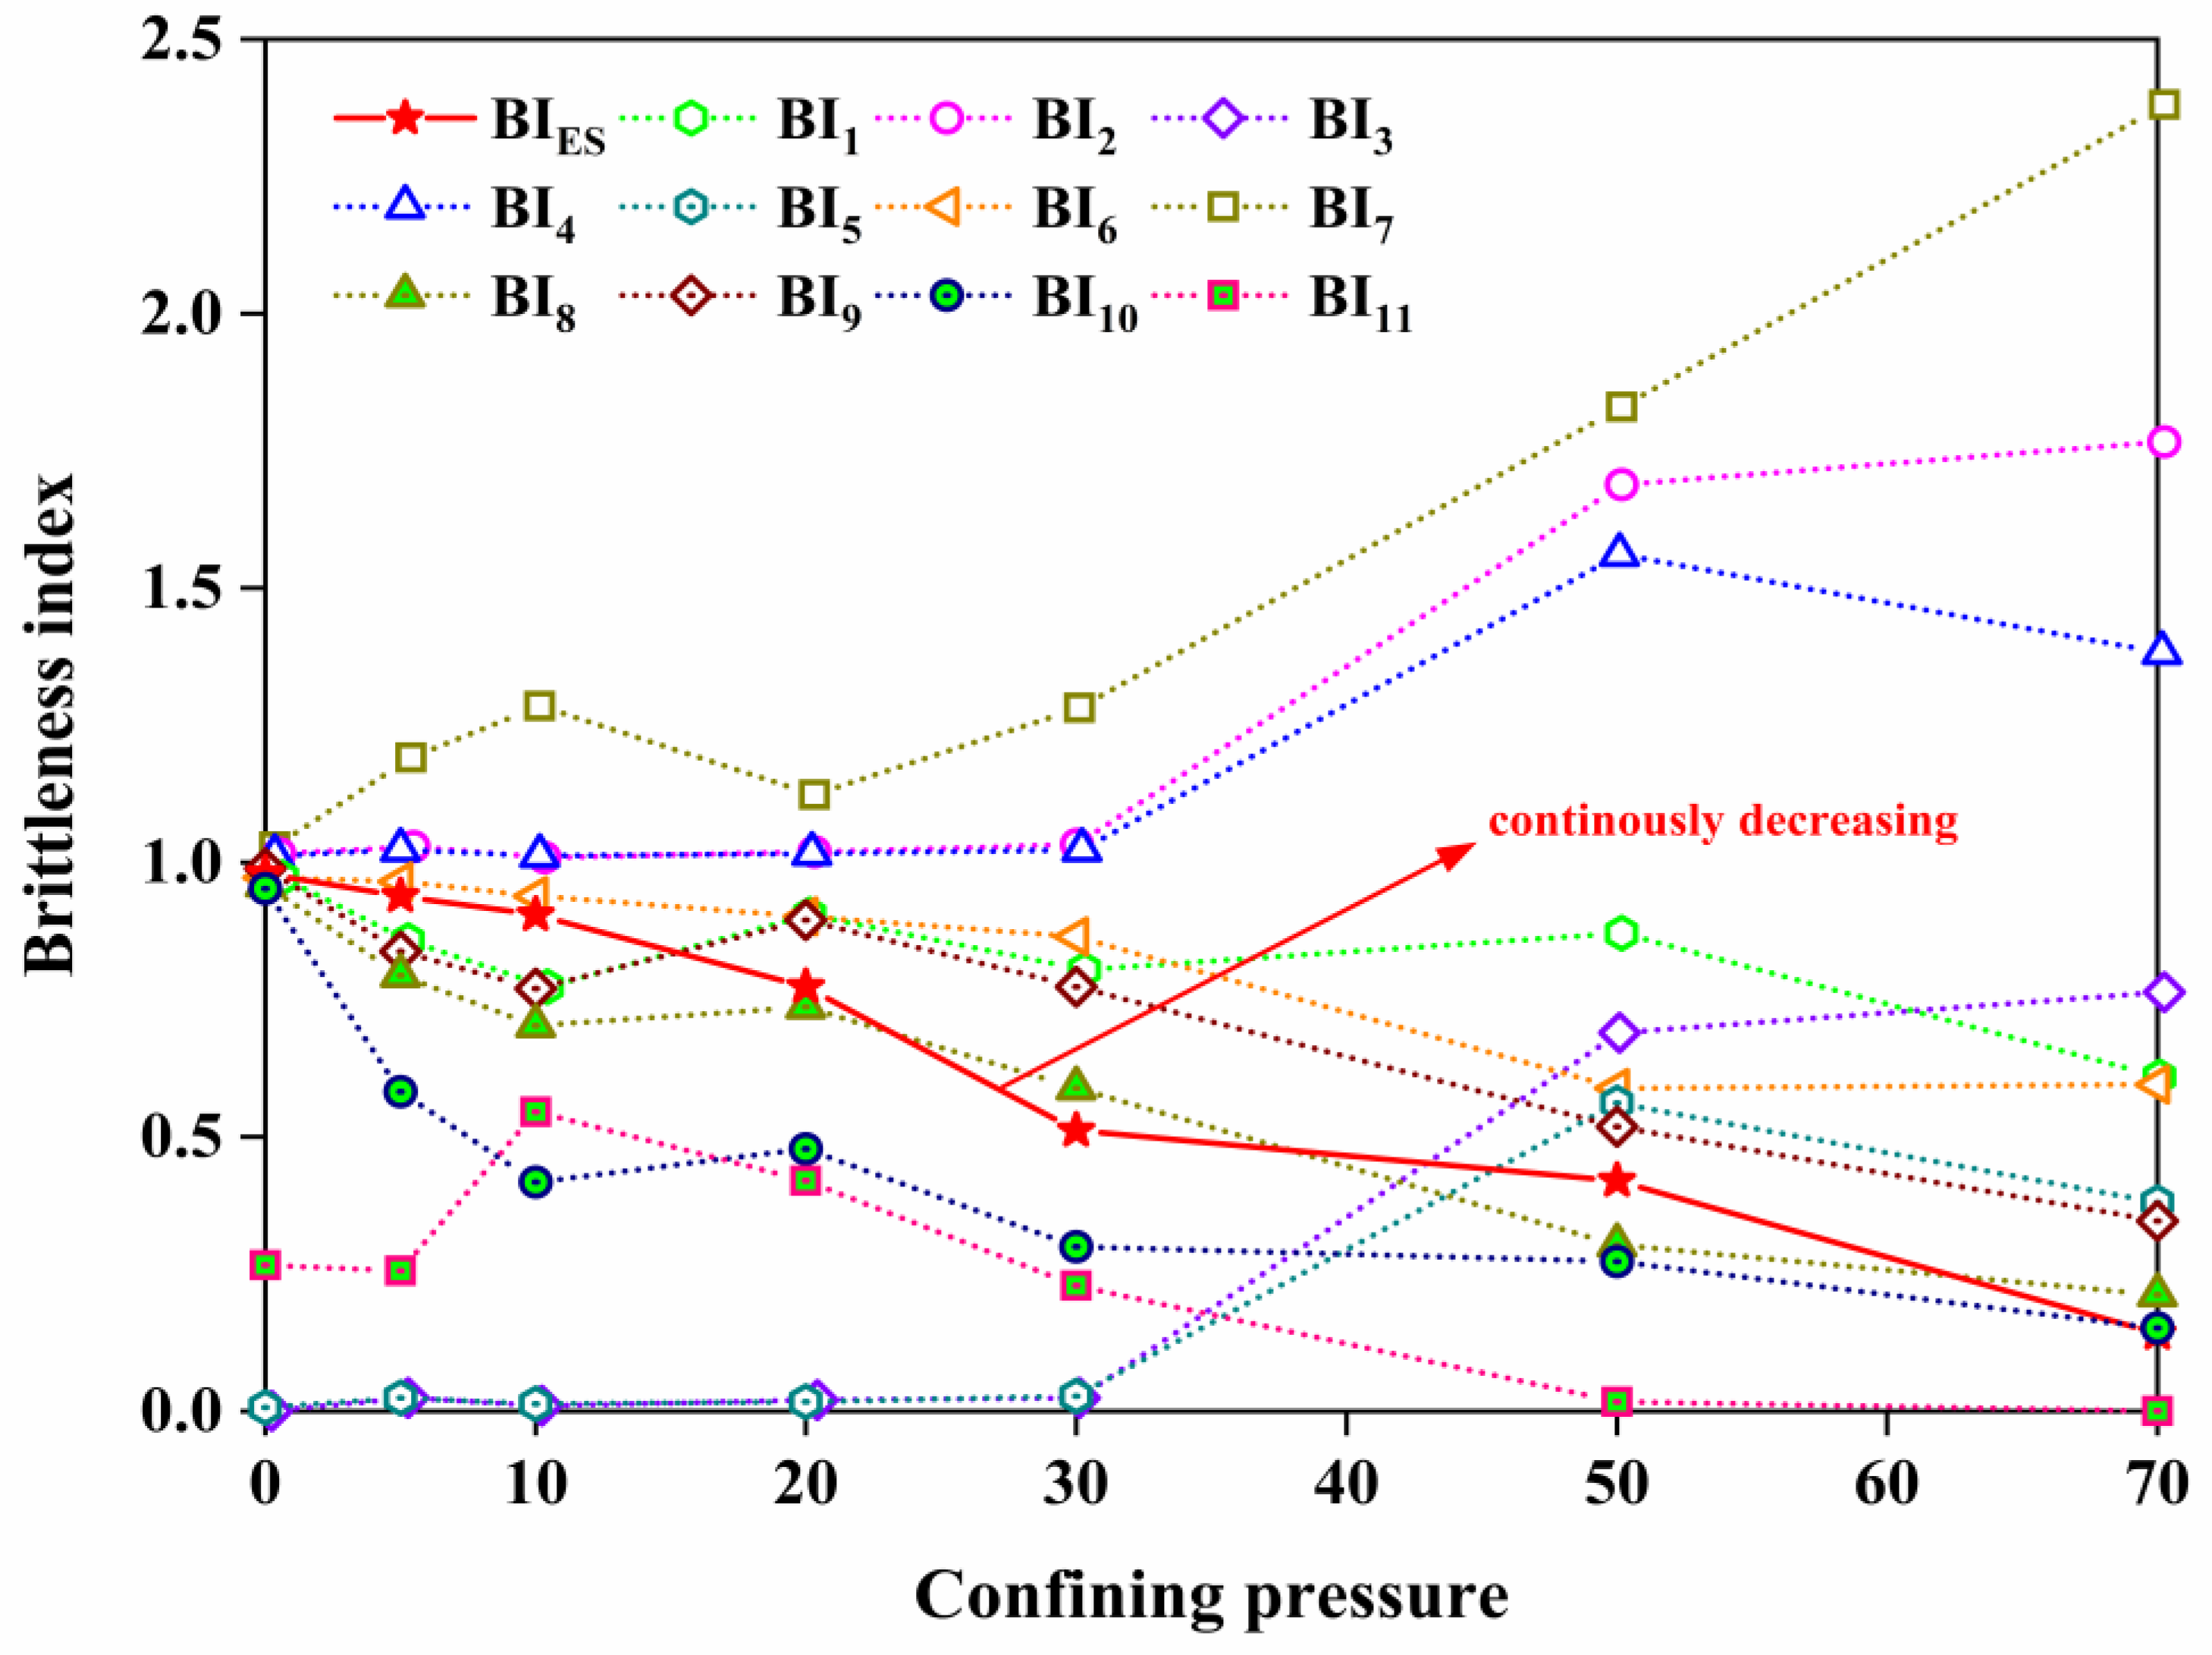
Table 7 lists the calculated results of 11 existing energy-based brittleness indices based on the experimental data of the shale samples in CTC tests. The variation trend of
and the 11 calculated brittleness indices are further exhibited in
Figure 9 to compare their brittleness evaluation accuracies.
The brittleness indices, except the proposed , exhibit fluctuations with an increase in the confining pressure, which failed to reflect the brittleness characteristics of shale samples. The fluctuating change trends mean that those brittleness indices cannot evaluate rock brittleness accurately. The proposed brittleness index decreases continuously with increasing confining pressure, which is consistent with the deformation and failure characteristics of rocks. The decreasing tendency of the value as with increasing confining pressure indicates that the new brittleness index can accurately assess the brittleness evolution of rocks. Consequently, it can be concluded that the novel brittleness index characterizes the brittleness of rocks more accurately than existing indices.
All the brittleness indices compared in
Figure 9 can reflect rock brittleness accurately in one of the typical aspects, but there is not a unified judgment standard for their accuracies. Therefore, the evaluation accuracy of rock brittleness can only be judged by the variation trend, with rock brittleness continuously decreasing with increasing confining pressures, as shown in
Figure 9.
6. Conclusions
In this study, a new brittleness evolution index is proposed on the basis of energy evolution analysis during the whole process of rock deformation and failure. The following conclusions can be drawn from the results of this work:
Based on the ultimate elastic strain energy, a novel rock brittleness index is proposed to characterize brittleness evolution during the whole process of deformation and failure of rocks.
A series of shale CTC tests were conducted to verify the reliability of the new brittleness index, and the testing results indicate that the new index can precisely reflect rock brittleness. Furthermore, the CTC testing data of six types of rocks were cited to verify the universality of the new brittleness index, and the results show that the new brittleness index can reflect various kinds of rock brittleness.
The new brittleness index was compared with 11 existing brittleness indices based on the shale CTC testing data; the calculation results of existing brittleness indices exhibit fluctuations with increasing confining pressure, whereas the values of the new index continuously decrease, indicating that the new brittleness index can characterize rock brittleness more precisely than the existing brittleness indices.
In this study, we conducted a series of rock CTC tests to reveal the energy storage law. However, the energy storage law exists in rock under one-dimensional, two-dimensional, and three-dimensional loading conditions. Therefore, further research is required, including a series of cycling, loading, and unloading triaxial compression tests to analyze the three-dimensional compression energy storage characteristics. Moreover, an accurate calculation method of peak elastic strain energy and residual elastic strain energy can be obtained.
Author Contributions
Methodology, X.Z.; investigation, L.S.; data curation, Y.C.; writing—original draft preparation, L.S.; writing—review and editing, Y.C.; visualization, X.Z.; supervision, J.X. and F.S.; project administration, X.Z.; funding acquisition, J.X. All authors have read and agreed to the published version of the manuscript.
Funding
This research was funded by [the Independent Research Project of State Key Laboratory of Coal Resources and Safe Mining, CUMT] grant number [SKLCRSM001] And [the Key projects of the Joint Fund of the National Natural Science Foundation of China] grant Number [U21A20107].
Institutional Review Board Statement
Not applicable.
Informed Consent Statement
Not applicable.
Data Availability Statement
The data used to support the findings of this study are included within the article. Informed consent was obtained from all subjects involved in the study. Written informed consent has been obtained from the patient(s) to publish this paper.
Acknowledgments
This paper was supported by the Independent Research Project of State Key Laboratory of Coal Resources and Safe Mining, CUMT (Grant Number SKLCRSM001) and the Key projects of the Joint Fund of the National Natural Science Foundation of China (Grant Number U21A20107).
Conflicts of Interest
The authors declare no conflict of interest.
References
- Munoz, H.; Taheri, A.; Chanda, E.K. Fracture Energy-Based Brittleness Index Development and Brittleness Quantification by Pre-peak Strength Parameters in Rock Uniaxial Compression. Rock Mech. Rock Eng. 2016, 49, 4587–4606. [Google Scholar] [CrossRef]
- Jahandari, S.; Li, J.; Saberian, M.; Shahsavarigoughari, M. Experimental study of the effects of geogrids on elasticity modulus, brittleness, strength, and stress-strain behavior of lime stabilized kaolinitic clay. GeoResJ 2017, 13, 49–58. [Google Scholar] [CrossRef]
- Ma, J.; Wang, Y.; Niu, X.; Jiang, S.; Liu, Z. A comparative study of mutual information-based input variable selection strategies for the displacement prediction of seepage-driven landslides using optimized support vector regression. Stoch. Hydrol. Hydraul. 2022, 1–21. [Google Scholar] [CrossRef]
- Zhang, L.-G.; Qu, S.-N.; Li, S.-B.; Li, W.; Guan, B.; Wang, C.-H. The properties and relationship of the brittleness, mineral composition and porosity for tight oil reservoirs. Strength Fract. Complex. 2017, 10, 89–99. [Google Scholar] [CrossRef]
- Wang, T.; Zhang, H.; Gamage, R.-P.; Zhao, W.; Ge, J.; Li, Y. The evaluation criteria for rock brittleness based on double-body analysis under uniaxial compression. Geomech. Geophys. Geo-Energ. Geo-Resour. 2020, 6, 49. [Google Scholar] [CrossRef]
- Xiao, W.; Zhang, D.; Yang, H.; Yu, B.; Li, S. Evaluation and analysis of sandstone brittleness under the influence of temperature. Geomech. Geophys. Geo-Energ. Geo-Resour. 2021, 8, 23. [Google Scholar] [CrossRef]
- Aligholi, S.; Lashkaripour, G.R.; Ghafoori, M. Strength/Brittleness Classification of Igneous Intact Rocks Based on Basic Physical and Dynamic Properties. Rock Mech. Rock Eng. 2017, 50, 45–65. [Google Scholar] [CrossRef]
- Qian, K.R.; He, Z.L.; Chen, Y.Q.; Liu, X.W.; Li, X.Y. Prediction of brittleness based on anisotropic rock physics model for kerogen-rich shale. Appl. Geophys. 2017, 14, 463–479. [Google Scholar] [CrossRef]
- Li, Z.; Zhang, S.; Cao, F. Brittleness Evaluation of Chang7 Reservoir in Longdong Area Based on Mechanical Parameters and Stress. In IOP Conference Series: Earth and Environmental Science; IOP Publishing: Bristol, UK, 2020; p. 514. [Google Scholar]
- Tao, W.; Tang, H.; Wang, Y.; Ma, J. Evaluation of methods for determining rock brittleness under compression. J. Nat. Gas Sci. Eng. 2020, 78, 103321. [Google Scholar] [CrossRef]
- Xu, J.; Pu, H.; Sha, Z. Experimental Study on the Effect of Brittleness on the Dynamic Mechanical Behaviors of the Coal Measures Sandstone. Adv. Civ. Eng. 2021, 2021, 6679333. [Google Scholar] [CrossRef]
- Liu, Y.-S.; Zhu, Z.-P.; Pan, R.-F.; Wu, H.-Z.; Jin, J.-N. Brittleness evaluation of Wufeng and Longmaxi Formation high-quality shale reservoir in southeast of Chongqing. Environ. Earth Sci. 2022, 81, 169. [Google Scholar]
- Kang, Y.; Shang, C.; Zhou, H.; Huang, Y.; Zhao, Q.; Deng, Z.; Wang, H.; Ma, Y.Z. Mineralogical brittleness index as a function of weighting brittle minerals—from laboratory tests to case study. J. Nat. Gas Sci. Eng. 2020, 77, 103278. [Google Scholar] [CrossRef]
- Iman, R.K.; Mohammadreza, Z.-R.; Mohsen, S.; Ziba, Z.Z. An intelligent approach to brittleness index estimation in gas shale reservoirs: A case study from a western Iranian basin. J. Nat. Gas Sci. Eng. 2017, 44, 177–190. [Google Scholar] [CrossRef]
- Chen, X.H.; Deng, X.L.; Li, Z.H. Mechanics analysis on the conditions of rock burst occurrence in the coal mass of roadway rib. J. Coal Sci. Eng. 2008, 14, 213–216. [Google Scholar] [CrossRef]
- Naji, A.M.; Emad, M.Z.; Rehman, H.; Yoo, H. Geological and geomechanical heterogeneity in deep hydropower tunnels: A rock burst failure case study. Tunn. Undergr. Space Technol. 2019, 84, 507–521. [Google Scholar] [CrossRef]
- Wu, S.; Wu, Z.; Zhang, C. Rock burst prediction probability model based on case analysis. Tunn. Undergr. Space Technol. 2019, 93, 103069. [Google Scholar] [CrossRef]
- Xie, H.; Ju, Y.; Li, L.; Peng, R. Energy mechanism of deformation and failure of rock masses. Chin. J. Rock Mech. Eng. 2008, 27, 1729–1740. [Google Scholar]
- Hucka, V.; Das, B. Brittleness determination of rocks by different methods. Int. J. Rock Mech. Min. Sci. Geomech. Abstr. 1974, 11, 389–392. [Google Scholar] [CrossRef]
- Tarasov, B.G.; Randolph, M.F. Superbrittleness of rocks and earthquake activity. Int. J. Rock Mech. Min. Sci. 2011, 48, 888–898. [Google Scholar] [CrossRef]
- Boris, T.; Yves, P. Universal criteria for rock brittleness estimation under triaxial compression. Int. J. Rock Mech. Min. Sci. 2013, 59, 57–69. [Google Scholar]
- Ai, C.; Zhang, J.; Li, Y.-W.; Zeng, J.; Yang, X.L.; Wang, J.G. Estimation Criteria for Rock Brittleness Based on Energy Analysis During the Rupturing Process. Rock Mech. Rock Eng. 2016, 49, 4681–4698. [Google Scholar] [CrossRef]
- Iman, R.K.; Mohammadjavad, A.; Hamed, M. Shale brittleness evaluation based on energy balance analysis of stress-strain curves. J. Pet. Sci. Eng. 2018, 67, 1–19. [Google Scholar]
- Song, H.Q.; Zuo, J.P.; Chen, Y.; Li, L.Y.; Hong, Z.J. Revised energy drop coefficient based on energy characteristics in whole process of rock failure. Rock Soil Mech. 2019, 40, 91–98. [Google Scholar]
- Li, N.; Zou, Y.; Zhang, S.; Ma, X.; Zhu, X.; Li, S.; Cao, T. Rock brittleness evaluation based on energy dissipation under triaxial compression. J. Pet. Sci. Eng. 2019, 183, 106349. [Google Scholar] [CrossRef]
- Li, L.; Zhai, M.; Zhang, L.; Zhang, Z.; Huang, B.; Li, A.; Zuo, J.; Zhang, Q. Brittleness Evaluation of Glutenite Based on Energy Balance and Damage Evolution. Energies 2019, 12, 3421. [Google Scholar] [CrossRef] [Green Version]
- Li, Y.; Zhou, L.; Li, D.; Zhang, S.; Tian, F.; Xie, Z.; Liu, B. Shale Brittleness Index Based on the Energy Evolution Theory and Evaluation with Logging Data: A Case Study of the Guandong Block. ACS Omega 2020, 5, 13164–13175. [Google Scholar] [CrossRef]
- Martin, C.D. Rock Stability Considerations for Siting and Constructing a KBS-3 Repository Based on Experiences from Aespoe HRL, AECL’s URL, Tunnelling and Mining. 2001. Available online: https://inis.iaea.org/search/search.aspx?orig_q=RN:33004840 (accessed on 25 May 2022).
- Wen, T.; Tang, H.; Huang, L.; Hamza, A.; Wang, Y. An empirical relation for parameter mi in the Hoek–Brown criterion of anisotropic intact rocks with consideration of the minor principal stress and stress-to-weak-plane angle. Acta Geotech. 2020, 16, 551–567. [Google Scholar] [CrossRef]
- Xie, H.; Li, L.; Peng, R.; Ju, Y. Energy analysis and criteria for structural failure of rocks. J. Rock Mech. Geotech. Eng. 2009, 1, 11–20. [Google Scholar] [CrossRef] [Green Version]
- Li, J.; Hong, L.; Zhou, K.; Xia, C.; Zhu, L. Influence of Loading Rate on the Energy Evolution Characteristics of Rocks under Cyclic Loading and Unloading. Energies 2020, 13, 4003. [Google Scholar] [CrossRef]
- Wang, H.; He, M.; Pang, F.; Chen, Y.; Zhang, Z. Energy dissipation-based method for brittleness evolution and yield strength determination of rock. J. Pet. Sci. Eng. 2021, 200, 108376. [Google Scholar] [CrossRef]
- Zhang, H.; Wang, Z.; Ruan, B.; Li, Z.; Zhao, W.; Ranjith, P.G.; Wang, T. A brittleness evaluation method of rock constitutive relationship with Weibull distribution based on double-body system theory. J. Pet. Sci. Eng. 2021, 8, 3333–3347. [Google Scholar] [CrossRef]
- Shi, X.; Wang, M.; Wang, Z.; Wang, Y.; Lu, S.; Tian, W. A brittleness index evaluation method for weak-brittle rock by acoustic emission technique. J. Nat. Gas Sci. Eng. 2021, 95, 104160. [Google Scholar] [CrossRef]
- Xia, Y.J.; Li, L.C.; Tang, C.A.; Li, X.Y.; Ma, S.; Li, M. A New Method to Evaluate Rock Mass Brittleness Based on Stress–Strain Curves of Class I. Rock Mech. Rock Eng. 2017, 50, 1123–1139. [Google Scholar] [CrossRef]
- Kuang, Z.; Qiu, S.; Li, S.; Du, S.; Huang, Y.; Chen, X. A New Rock Brittleness Index Based on the Characteristics of Complete Stress–Strain Behaviors. Rock Mech. Rock Eng. 2021, 54, 1109–1128. [Google Scholar] [CrossRef]
Figure 1.
Deformation and failure characteristics and energy evolution of brittle rocks in a typical stress–strain curve ( is crack closure stress, is crack initiation stress, is crack damage stress, is failure stress, is residual stress, is strain in crack damage state, is failure strain, is residual strain, is elastic strain, is elastic strain at residual state, and is Young’s modulus).
Figure 2.
Specimen preparation: (a) sampling location; (b) stratigraphy formation; (c) shale layer in field; (d) prepared specimens.
Figure 2.
Specimen preparation: (a) sampling location; (b) stratigraphy formation; (c) shale layer in field; (d) prepared specimens.
Figure 3.
Experimental scheme and instructions: (1) mass measurement; (2) volume determination; (3) ultrasonic wave device; (4) heating oven; (5) mechanical test system.
Figure 3.
Experimental scheme and instructions: (1) mass measurement; (2) volume determination; (3) ultrasonic wave device; (4) heating oven; (5) mechanical test system.
Figure 4.
Loading path of CTC tests.
Figure 4.
Loading path of CTC tests.
Figure 5.
Typical stress–strain curve of shale samples in CTC tests.
Figure 5.
Typical stress–strain curve of shale samples in CTC tests.
Figure 6.
Relationship between of the shale samples and the corresponding confining pressures.
Figure 6.
Relationship between of the shale samples and the corresponding confining pressures.
Figure 7.
Stress–strain curves of six types of rocks: (1) Sandstone; (2) Shale 1; (3) Shale 2; (4) Glutenite; (5) Granite; (6) Gneiss.
Figure 7.
Stress–strain curves of six types of rocks: (1) Sandstone; (2) Shale 1; (3) Shale 2; (4) Glutenite; (5) Granite; (6) Gneiss.
Figure 8.
Calculation results of of six types of rocks: (1) Sandstone; (2) Shale 1; (3) Shale 2; (4) Glutenite; (5) Granite; (6) Gneiss.
Figure 8.
Calculation results of of six types of rocks: (1) Sandstone; (2) Shale 1; (3) Shale 2; (4) Glutenite; (5) Granite; (6) Gneiss.
Figure 9.
Comparison of with existing energy-based brittleness indices based on the shale samples in the CTC tests.
Figure 9.
Comparison of with existing energy-based brittleness indices based on the shale samples in the CTC tests.
Table 1.
Summary of existing rock brittleness indices based on the energy evolution characteristic.
Table 1.
Summary of existing rock brittleness indices based on the energy evolution characteristic.
| Brittleness Index | Remarks | Reference | Insufficient Issues |
|---|
| is the ultimate elastic strain energy;
is the peak dissipated energy;
is the post-peak failure energy;
is the residual elastic strain energy;
is the additional input energy;
is the consumed elastic strain energy;
is the peak elastic strain energy of the absolute brittle rock; | [19] | only takes the pre-peak energy evolution of rock into consideration, whereas the post-peak stage also has a considerable influence on the rock brittleness. |
| [20] | Both of and simplify the relationship of the pre-peak elastic modulus and post-peak deformation modulus, resulting a low accuracy of assessment. |
| [21] |
| [22] | The formulae of and are paradoxical. |
| [22] |
| [23] | defines the fracture energy as the area under the post-peak curve, subtracting the residual elastic strain energy. However, it also includes the peak elastic strain energy. |
| [24] | and join different factors with multiplication, which lacks a theoretical basis. |
| [25] |
| [25] |
| [26] |
| [27] | The calculation method of is not verified and thus not credible. |
Table 2.
Physical and mechanical properties of the shale samples.
Table 2.
Physical and mechanical properties of the shale samples.
Density
kg/m3 | P-Wave Velocity
/m·s−1 | Elastic Modulus
/GPa | Uniaxial Peak Strength
/MPa |
|---|
| 2503 | 4156.62 | 18.94 | 172.43 |
Table 3.
Statistical analysis results of peak stress in CTC tests.
Table 3.
Statistical analysis results of peak stress in CTC tests.
Confining Pressure
/MPa | Peak Stress
/MPa | Mean Value
/MPa | Absolute Deviation | Relative Deviation
(%) | Standard Deviation
/(m/s) | Coefficient of Variation
(%) |
|---|
| 0 | 165.86 | 167.70 | 1.8367 | 1.0952 | 0.6586 | 0.3927 |
| 167.59 | 0.1067 | 0.0636 |
| 169.64 | 1.9433 | 1.1588 |
| 168.85 | 1.1533 | 0.6877 |
| 169.23 | 1.5333 | 0.9143 |
| 5 | 181.78 | 179.99 | 1.7860 | 0.9923 | 0.5714 | 0.3175 |
| 178.59 | 1.4040 | 0.7800 |
| 180.32 | 0.3260 | 0.1811 |
| 180.79 | 0.7960 | 0.4422 |
| 178.49 | 1.5040 | 0.8356 |
| 10 | 194.79 | 194.57 | 0.2240 | 0.1151 | 0.3377 | 0.1736 |
| 193.58 | 0.9860 | 0.5068 |
| 193.78 | 0.7860 | 0.4040 |
| 195.42 | 0.8540 | 0.4389 |
| 195.26 | 0.6940 | 0.3567 |
| 20 | 201.59 | 200.50 | 1.0880 | 0.5426 | 0.4359 | 0.2174 |
| 200.37 | 0.1320 | 0.0658 |
| 199.78 | 0.7220 | 0.3601 |
| 199.16 | 1.3420 | 0.6693 |
| 201.61 | 1.1080 | 0.5526 |
| 30 | 217.64 | 217.03 | 0.6140 | 0.2829 | 0.2019 | 0.0930 |
| 216.79 | 0.2360 | 0.1087 |
| 216.48 | 0.5460 | 0.2516 |
| 216.74 | 0.2860 | 0.1318 |
| 217.48 | 0.4540 | 0.2092 |
| 50 | 302.78 | 302.44 | 0.3420 | 0.1131 | 0.2818 | 0.0932 |
| 303.06 | 0.6220 | 0.2057 |
| 301.49 | 0.9480 | 0.3135 |
| 301.89 | 0.5480 | 0.1812 |
| 302.97 | 0.5320 | 0.1759 |
| 70 | 324.95 | 324.80 | 0.1520 | 0.0468 | 0.2891 | 0.0890 |
| 324.09 | 0.7080 | 0.2180 |
| 324.08 | 0.7180 | 0.2211 |
| 325.78 | 0.9820 | 0.3023 |
| 325.09 | 0.2920 | 0.0899 |
Table 4.
Statistical analysis results of strain corresponding with peak stress in CTC tests.
Table 4.
Statistical analysis results of strain corresponding with peak stress in CTC tests.
Confining Pressure
/MPa | Strain
/% | Mean Value
/% | Absolute Deviation | Relative Deviation
(%) | Standard Deviation
/(m/s) | Coefficient of Variation
(%) |
|---|
| 0 | 1.62 | 1.63 | 0.0100 | 0.6135 | 0.0164 | 1.0043 |
| 1.69 | 0.0600 | 3.6810 |
| 1.58 | 0.0500 | 3.0675 |
| 1.61 | 0.0200 | 1.2270 |
| 1.62 | 0.0100 | 0.6135 |
| 5 | 1.71 | 1.71 | 0.0020 | 0.1171 | 0.0166 | 0.9713 |
| 1.76 | 0.0520 | 3.0445 |
| 1.69 | 0.0180 | 1.0539 |
| 1.65 | 0.0580 | 3.3958 |
| 1.73 | 0.0220 | 1.2881 |
| 10 | 1.99 | 1.98 | 0.0020 | 0.1004 | 0.0161 | 0.8082 |
| 1.95 | 0.0420 | 2.1084 |
| 2.05 | 0.0580 | 2.9116 |
| 2.01 | 0.0180 | 0.9036 |
| 1.96 | 0.0320 | 1.6064 |
| 20 | 1.83 | 1.83 | 0.0020 | 0.1092 | 0.0151 | 0.8228 |
| 1.89 | 0.0580 | 3.1659 |
| 1.81 | 0.0220 | 1.2009 |
| 1.84 | 0.0080 | 0.4367 |
| 1.79 | 0.0420 | 2.2926 |
| 30 | 1.99 | 1.99 | 0.0060 | 0.3006 | 0.0169 | 0.8455 |
| 1.95 | 0.0460 | 2.3046 |
| 1.97 | 0.0260 | 1.3026 |
| 2.06 | 0.0640 | 3.2064 |
| 2.01 | 0.0140 | 0.7014 |
| 50 | 1.98 | 1.98 | 0.0020 | 0.1009 | 0.0195 | 0.9825 |
| 1.97 | 0.0120 | 0.6054 |
| 2.04 | 0.0580 | 2.9263 |
| 2.01 | 0.0280 | 1.4127 |
| 1.91 | 0.0720 | 3.6327 |
| 70 | 2.34 | 2.34 | 0.0000 | 0.0000 | 0.085 | 0.3626 |
| 2.34 | 0.0000 | 0.0000 |
| 2.37 | 0.0300 | 1.2821 |
| 2.31 | 0.0300 | 1.2821 |
| 2.34 | 0.0000 | 0.0000 |
Table 5.
Calculated brittleness index, , of the shale samples in the CTC tests.
Table 5.
Calculated brittleness index, , of the shale samples in the CTC tests.
Confining Pressure
/MPa | Peak Strength
/MPa | Residual Strength
/MPa |
/(mJ/mm3) |
/(mJ/mm3) |
/(mJ/mm3) | |
|---|
| 0 | 167.66 | 10.54 | 0.904 | 0.010 | 0.004 | 0.99 |
| 5 | 179.99 | 34.82 | 1.357 | 0.032 | 0.045 | 0.94 |
| 10 | 194.77 | 39.67 | 1.615 | 0.119 | 0.011 | 0.92 |
| 20 | 200.92 | 76.94 | 2.549 | 0.234 | 0.247 | 0.81 |
| 30 | 217.02 | 106.06 | 1.999 | 0.921 | 0.029 | 0.53 |
| 50 | 302.49 | 185.67 | 2.716 | 1.175 | 0.343 | 0.44 |
| 70 | 324.82 | 250.12 | 2.813 | 1.721 | 0.884 | 0.07 |
Table 6.
Results of six types of rocks calculated based on .
Table 6.
Results of six types of rocks calculated based on .
| Rock | Confining Pressure
/MPa | Peak Strength
/MPa | Residual Strength
/MPa | |
|---|
| Sandstone | 5 | 136.52 | 64.89 | 0.53 |
| 15 | 164.59 | 82.46 | −0.18 |
| 20 | 173.30 | 106.84 | −0.35 |
| 30 | 183.45 | 128.69 | −1.2 |
| Shale 1 | 10 | 301.56 | 106.79 | −0.47 |
| 25 | 332.91 | 195.41 | −1.55 |
| 40 | 369.54 | 264.39 | −3.68 |
| Shale 2 | 10 | 169.36 | 51.28 | −0.19 |
| 15 | 210.54 | 64.31 | −2.59 |
| 20 | 245.82 | 72.49 | −2.78 |
| Glutenite | 10 | 142.34 | 47.30 | −0.34 |
| 15 | 215.38 | 88.94 | −0.81 |
| 20 | 266.40 | 125.93 | −1.0824 |
| Granite | 5 | 172.64 | 95.34 | 0.57 |
| 10 | 184.02 | 86.51 | 0.52 |
| 20 | 267.43 | 119.06 | 0.41 |
| 40 | 375.09 | 186.75 | 0.36 |
| Gneiss | 5 | 143.51 | 49.59 | −0.11 |
| 10 | 256.84 | 66.84 | −0.20 |
| 20 | 207.91 | 76.94 | −0.31 |
| 40 | 3.6.86 | 201.97 | −0.45 |
Table 7.
Calculated results of various brittleness indices based on shale CTC test data.
Table 7.
Calculated results of various brittleness indices based on shale CTC test data.
| | Brittleness Indices |
|---|
| | | | | | | | | | | |
|---|
| 0 | 0.97 | 1.02 | 0.01 | 1.01 | 0.01 | 0.97 | 1.03 | 0.96 | 0.99 | 0.96 | 0.27 | 0.98 |
| 5 | 0.86 | 1.03 | 0.02 | 1.02 | 0.02 | 0.97 | 1.19 | 0.79 | 0.84 | 0.79 | 0.26 | 0.94 |
| 10 | 0.77 | 1.01 | 0.01 | 1.01 | 0.01 | 0.94 | 1.28 | 0.70 | 0.77 | 0.70 | 0.55 | 0.90 |
| 20 | 0.90 | 1.02 | 0.02 | 1.02 | 0.02 | 0.90 | 1.12 | 0.74 | 0.89 | 0.74 | 0.42 | 0.77 |
| 30 | 0.80 | 1.03 | 0.02 | 1.02 | 0.03 | 0.86 | 1.28 | 0.59 | 0.77 | 0.59 | 0.23 | 0.51 |
| 50 | 0.87 | 1.69 | 0.69 | 1.56 | 0.56 | 0.59 | 1.83 | 0.30 | 0.52 | 0.30 | 0.02 | 0.42 |
| 70 | 0.61 | 1.77 | 0.76 | 1.38 | 0.38 | 0.60 | 2.38 | 0.21 | 0.35 | 0.21 | 0.00 | 0.14 |
| Publisher’s Note: MDPI stays neutral with regard to jurisdictional claims in published maps and institutional affiliations. |
© 2022 by the authors. Licensee MDPI, Basel, Switzerland. This article is an open access article distributed under the terms and conditions of the Creative Commons Attribution (CC BY) license (https://creativecommons.org/licenses/by/4.0/).


