


User-Driven: A Product Innovation Design Method for a Digital Twin Combined with Flow Function Analysis

Abstract
1. Introduction
2. Related Research Foundation
2.1. Requirement-Driven Product Innovation Design
2.2. Digital Twin and Product Design
2.2.1. Application of Digital Twin in Product Design
2.2.2. Process Model of Digital Twin Innovation Design
2.3. Flow Function Analysis
2.3.1. Application of Flow Function Analysis in Product Design
2.3.2. Basic Definition of Flow
2.3.3. Characterization of Flow Function
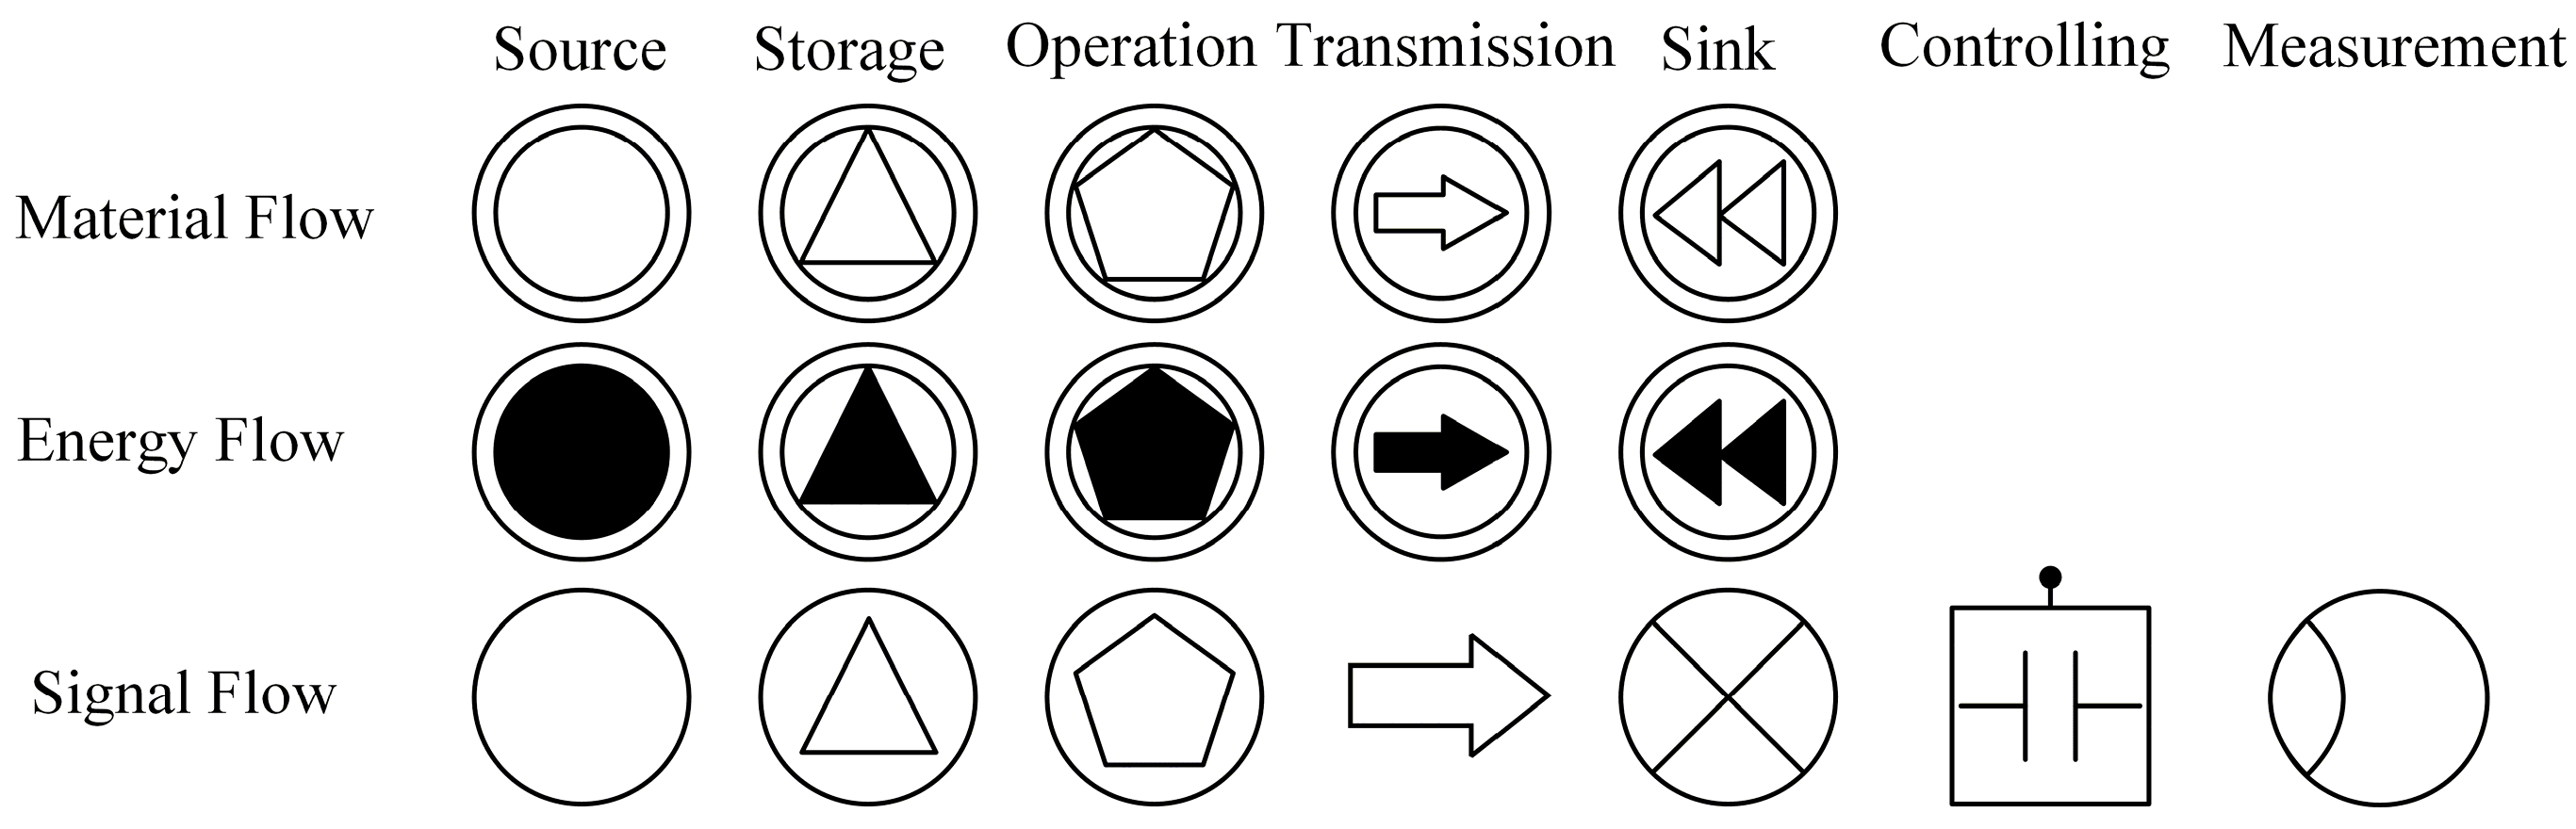
- is the combination of input and output flow pairs in a component, including at most three-dimensional flows: signal flow, material flow, and energy flow.
- for changes in the flow properties in the component, such as the conversion of mechanical energy into wind energy in the energy flow.
- for components required for functional implementation.
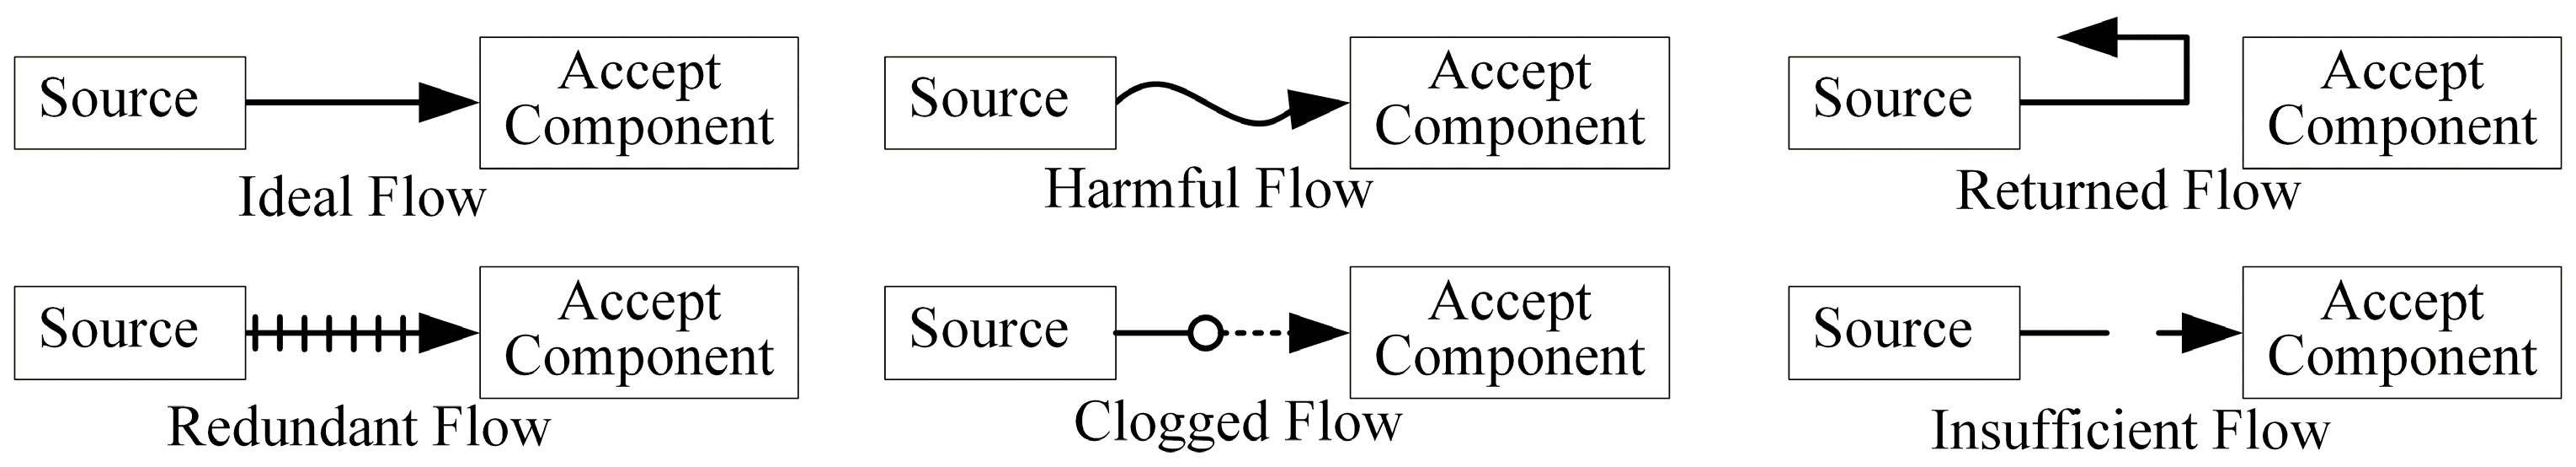
- Returned flow: a flow that reverses from the output end to the input end during transmission and is affected by itself or the external environment.
- Clogged flow: a flow that is not smooth and cannot realize normal function due to flow obstruction. When the flow is completely blocked, it is a special form of clogged flow. Stagnant flow refers to a flow that is temporarily or permanently at a standstill.
- Insufficient flow: a flow with a flow flux below the allowable value of the flow channel, in which the system function is not fully realized.
- Ideal flow: a flow with optimal flow flux for smooth operation
- Redundant flow: an excessive flow that is beyond the allowable value of the flow channel.
- Harmful flow: a flow that brings out harmful effects.
2.4. Proposed Method
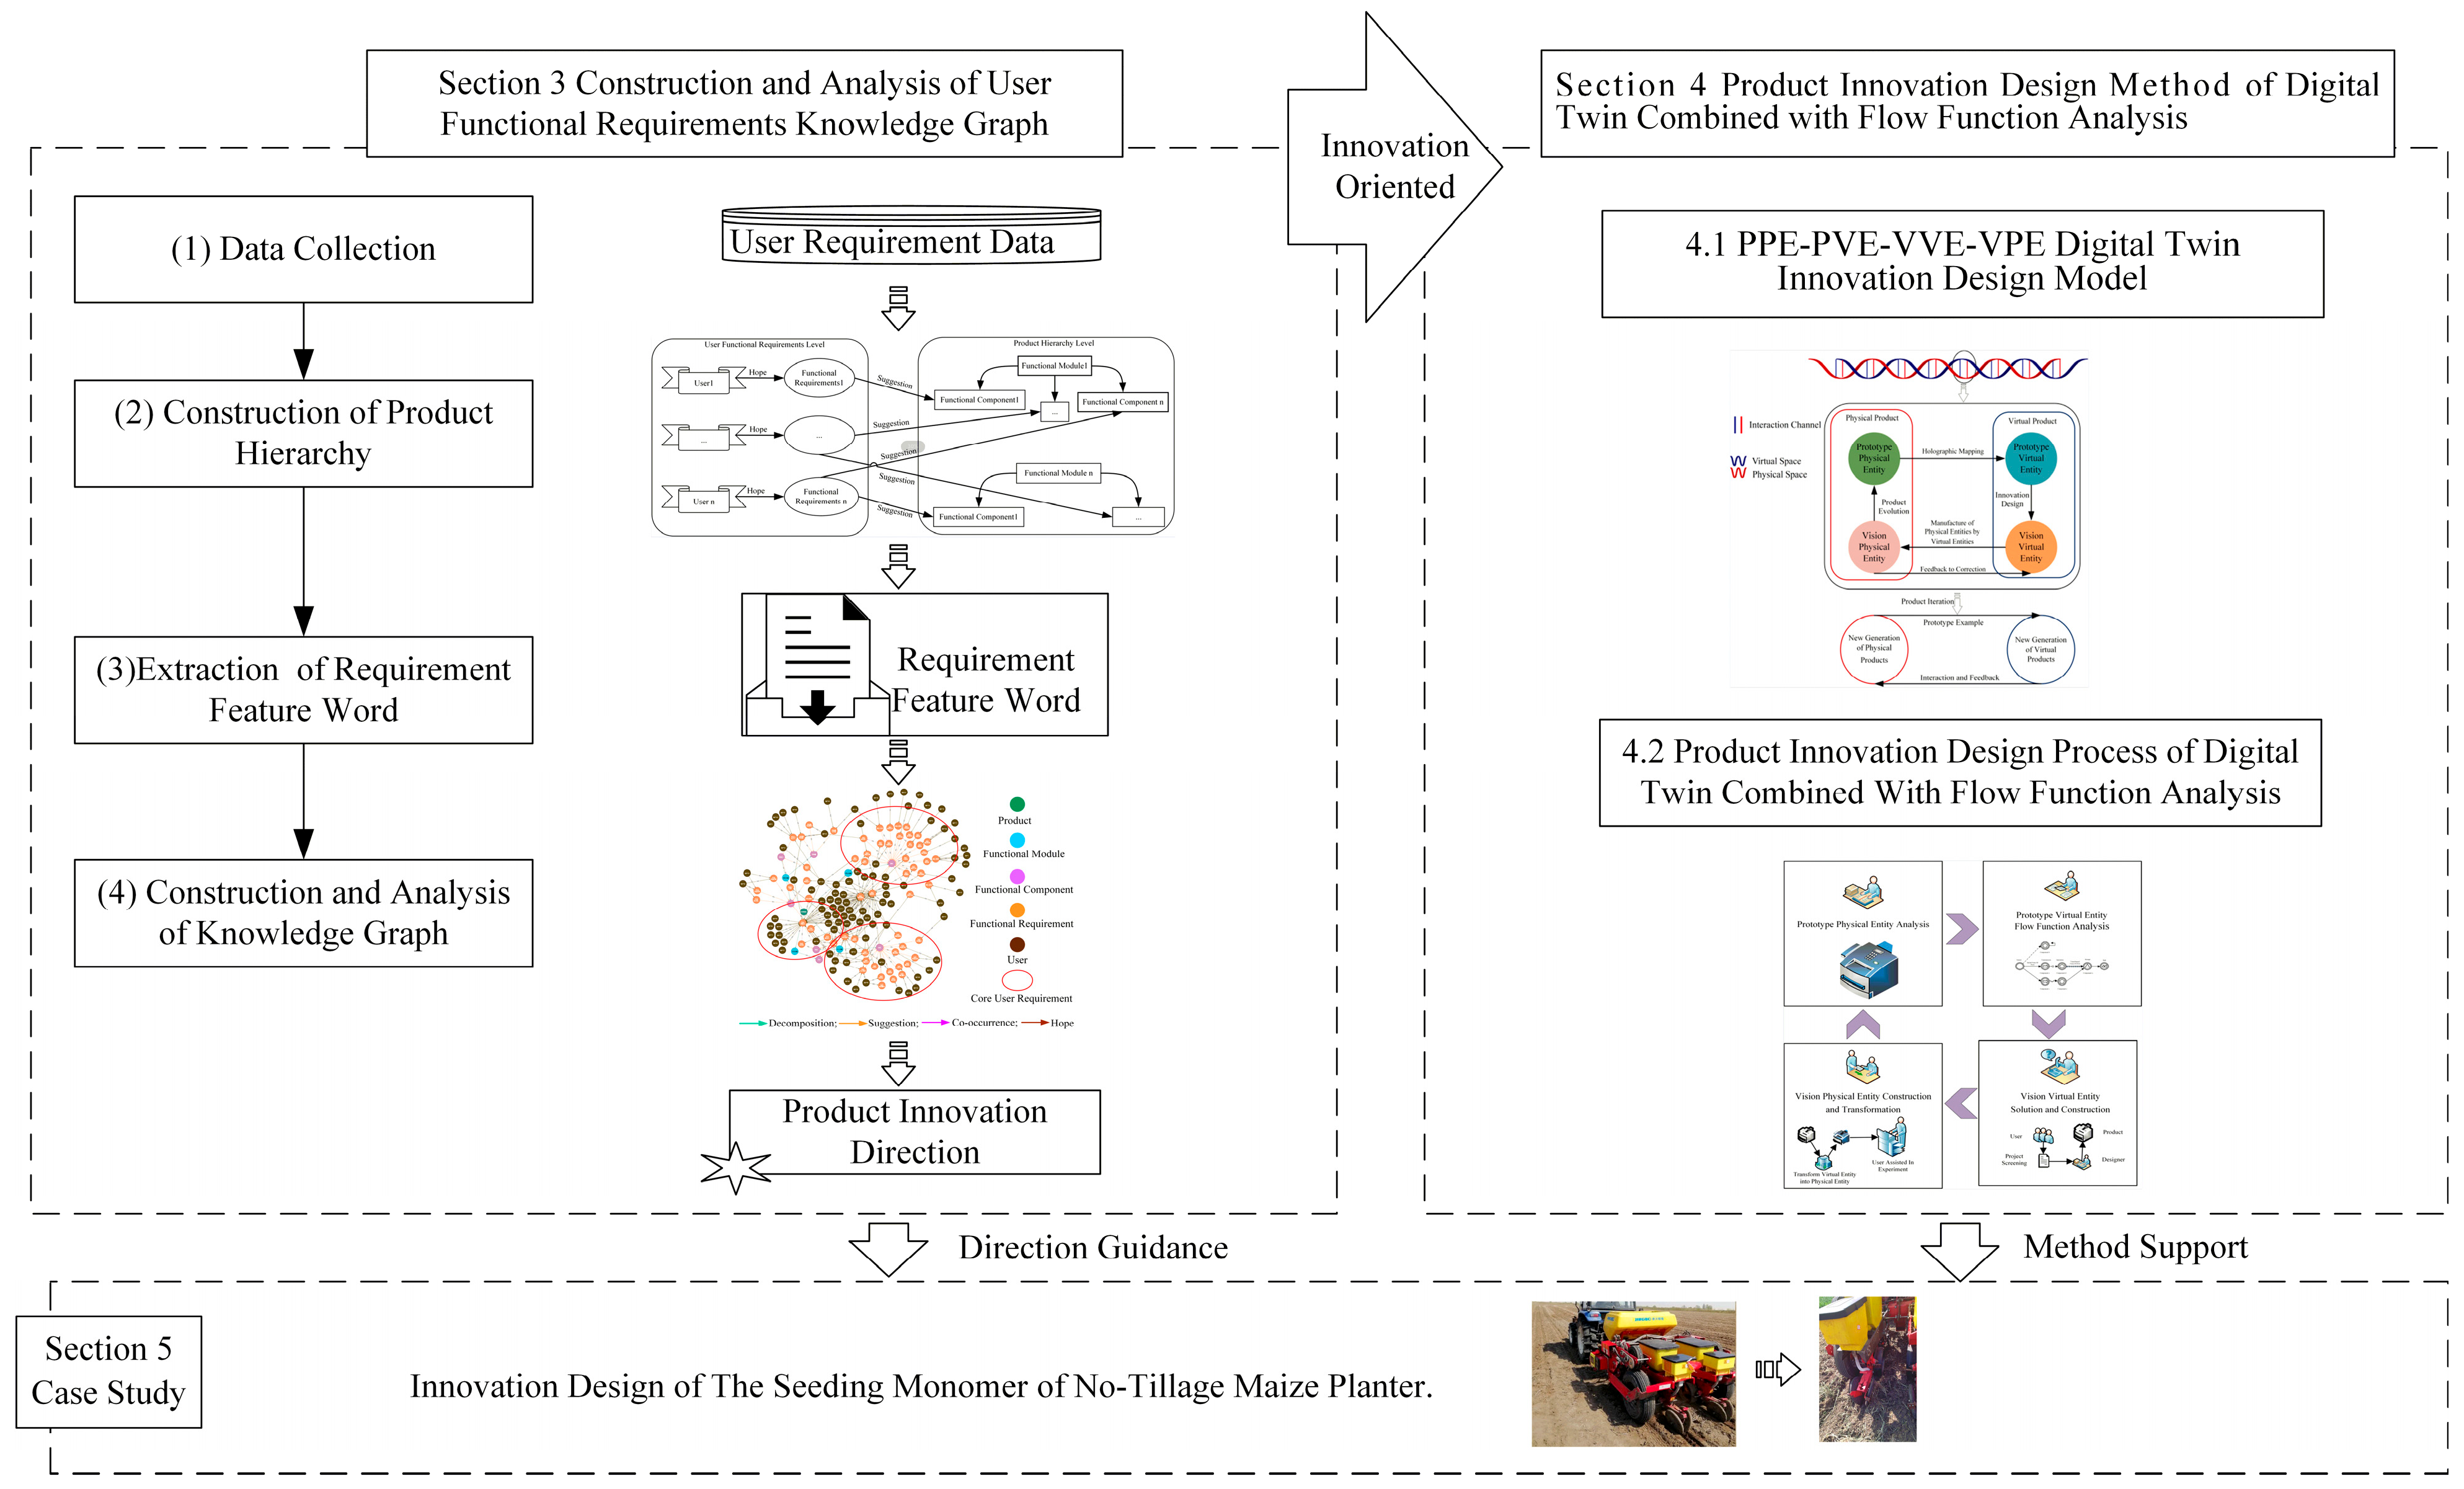
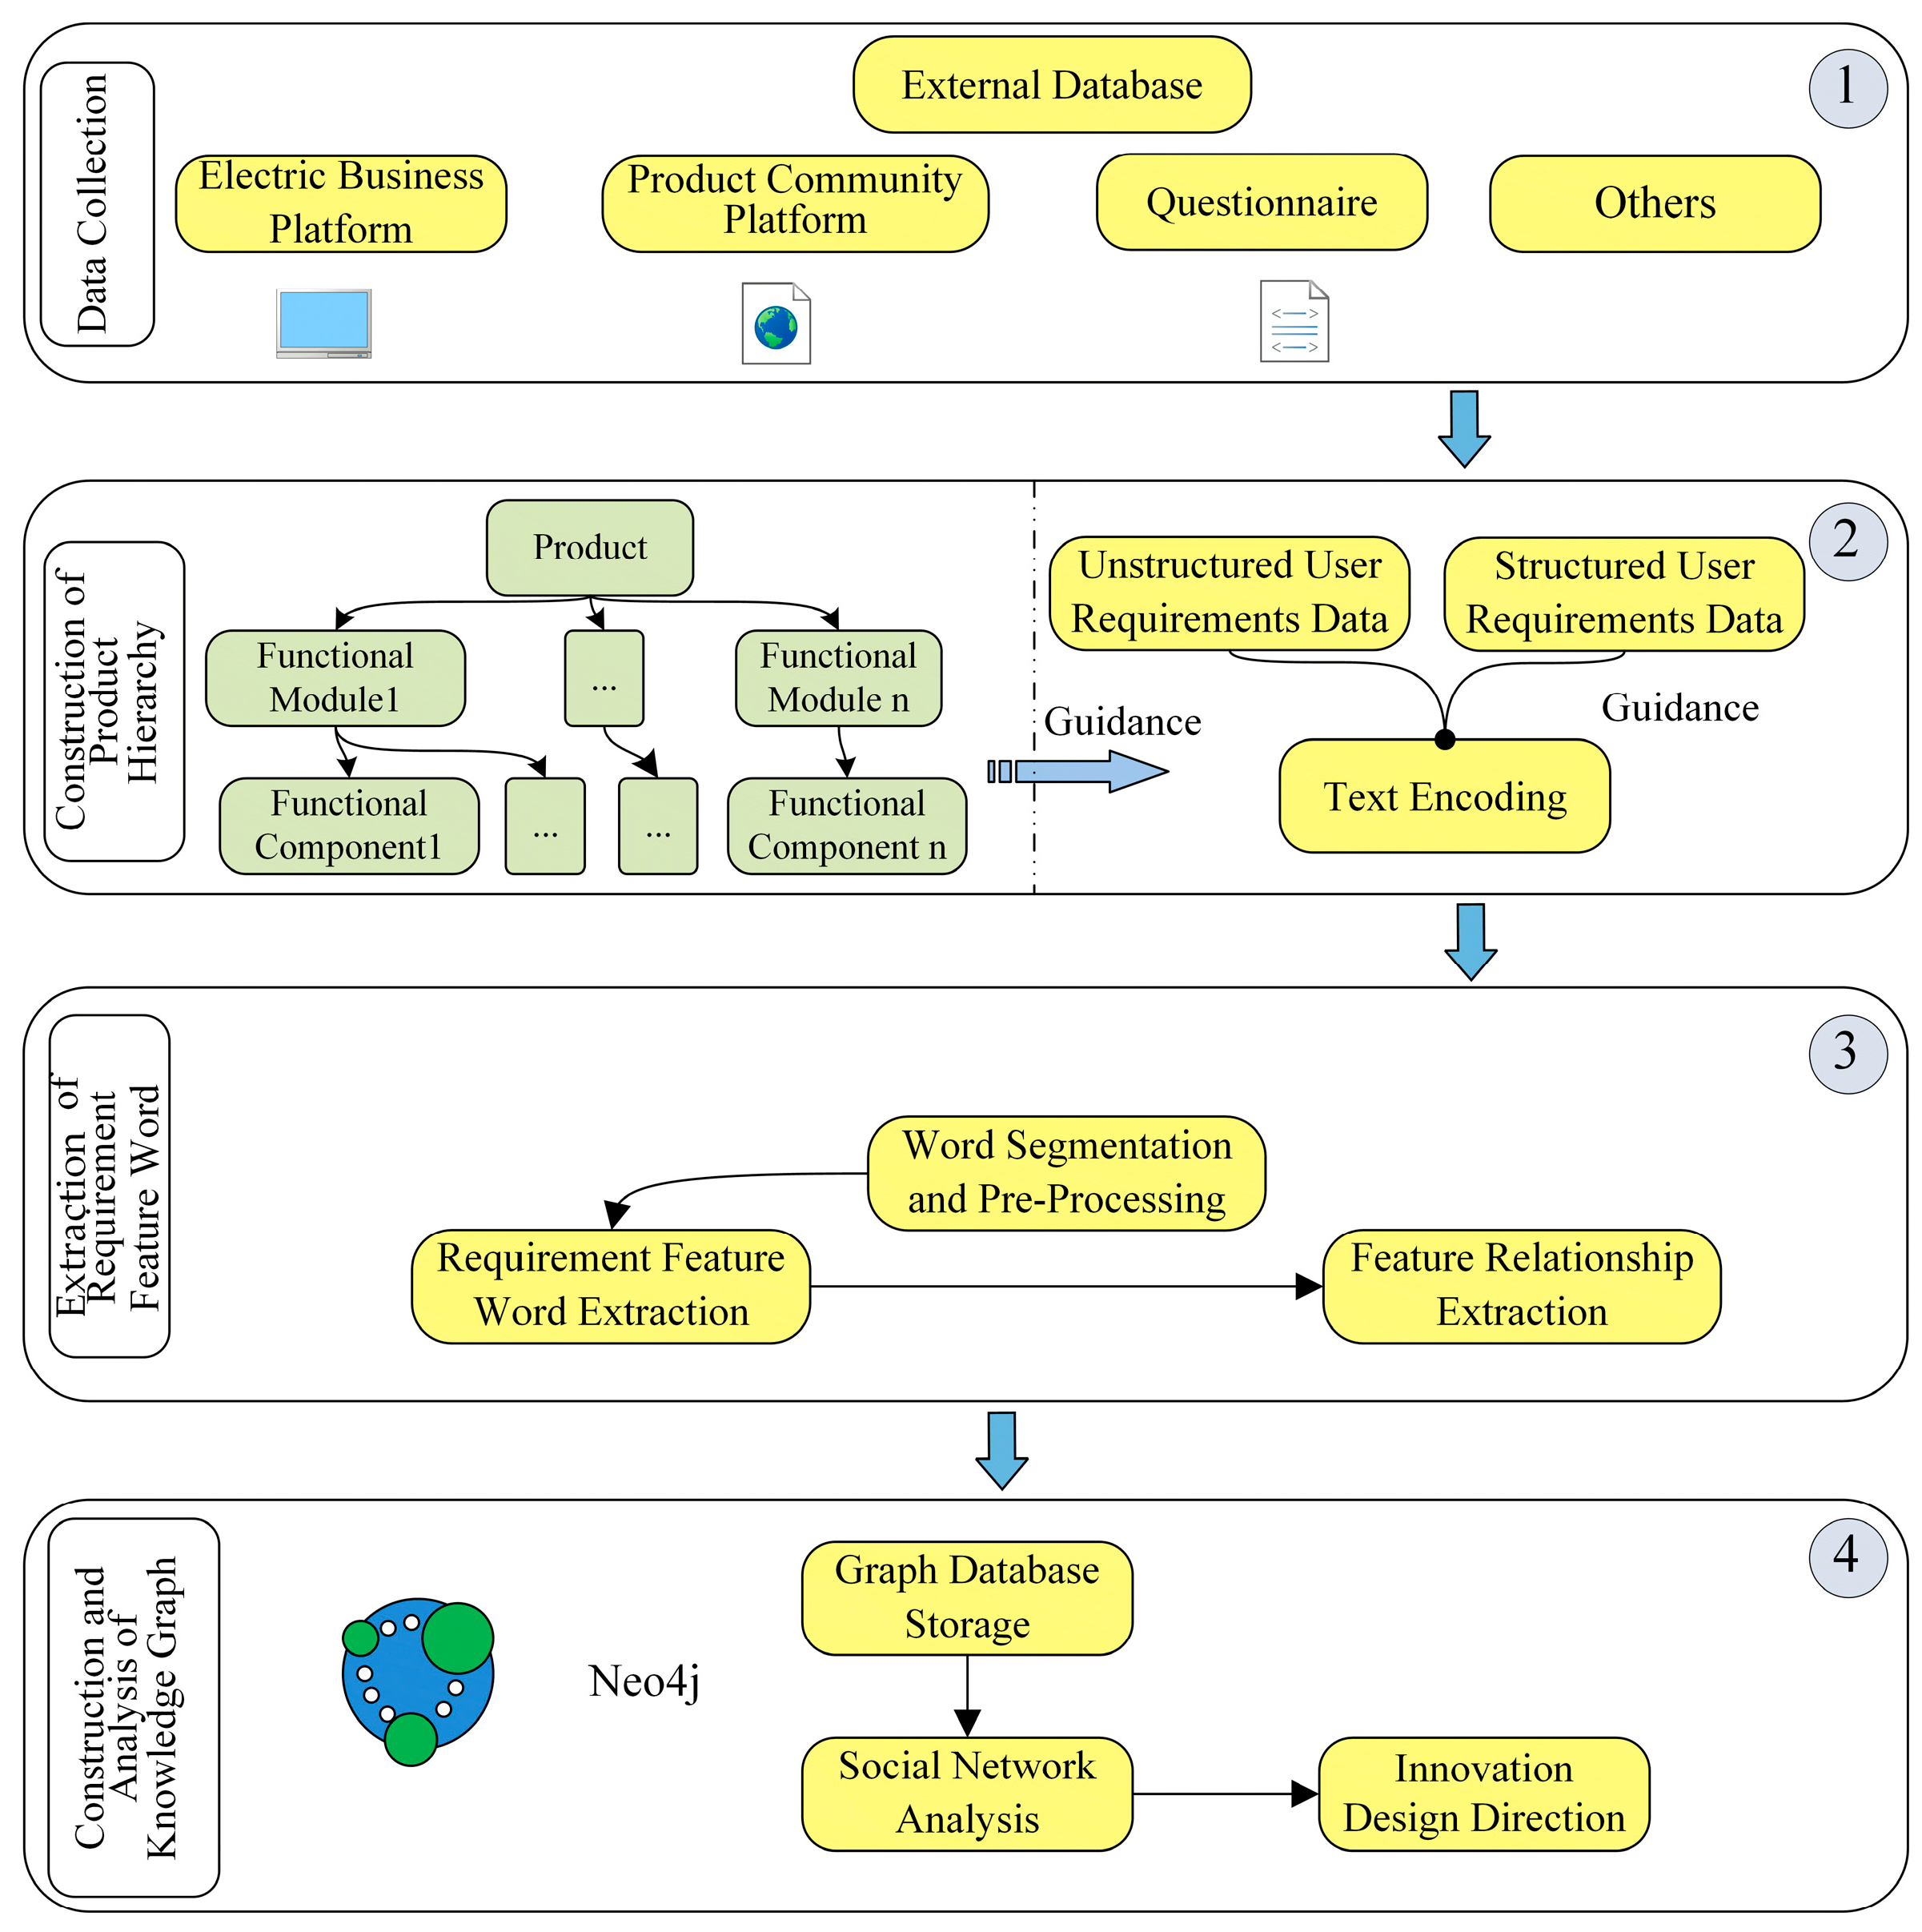
3. Construction and Analysis of User Functional Requirements Knowledge Graph
- (1)
- Data AcquisitionThe sales volume leads to different percentages of structured data and unstructured data in user requirements. Structured data is easier to analyze and the corresponding technology is mature enough. For products with large sales volumes, such as floor sweepers and electric vehicles, crawler technology is mainly used to collect semi-structured and unstructured user functional requirements text data from e-commerce platforms and product communities. User feedback survey methods such as telephone interviews and questionnaires are used to assist in obtaining structured data. For products with small sales volume, such as CNC machine tools and shield machines, researchers mainly use telephone interviews, questionnaires and other user feedback surveys to acquire structured text data, and use crawler technology to assist in acquiring semi-structured and unstructured user functional requirements data in the product sales platform.
- (2)
- Construction of Product HierarchyThe purpose of constructing the product hierarchy is to classify the user functional requirements text data hierarchically. The construction of the product hierarchy is divided into three types: manual construction, semi-automatic construction, and automatic construction [58]. The construction process of the product hierarchy should indicate the functional structure relationship between product-functional and module-functional components. Since the study of the conceptual hierarchy of products is mostly conducted from the perspective of functional decomposition, the manual construction method is mainly used. Based on the reverse fishbone, the product function is decomposed to build a product hierarchy level.Decomposition of products into functional modules, as shown in Equation (2) [36].where is the target product, is the functional module of the target product, and . Thus, the above equation can be expressed from the functional components [36]:where is the functional component of the functional module of the product, .Since users’ functional requirements for the product only stay on the surface of the popular functions, and few of the requests are related to the functional components of the product, the user requirements text processing can realize the classification of user requirements by the functional component level of the product (see Figure 5). At the same time, the processing of user requirements text can also modify the constructed product hierarchy.
- (3)
- Extraction of Requirement Feature WordsRequirement feature words are the characteristic words of users to express the content of requirements. The selection of feature words should contain the terms of the product domain to which they belong and the words or phrases that can summarize the user requirements. As a kind of entity, there are three types of feature word extraction: traditional entity extraction, machine learning-based entity extraction, and neural network-based entity extraction [59]. The extraction of feature words from documents requires two processes: one is word separation and text pre-processing, the other is feature word extraction. A dictionary of requirements is required to be constructed before word separation to improve the accuracy of word separation.The relationship extraction of feature words is a key step to link scattered knowledge units into a network. Relationship extraction is to obtain some semantic relationship or class of relationship between entities through documents or semantics [60]. The relationship extraction includes two modes, namely, extraction of a relationship itself as well as extractions of an entity and relationship at the same time. The former can be further divided into template-based relationship extraction, machine learning-based relationship extraction, and deep learning-based relationship extraction [61]. The pattern matching-based relationship extraction method requires domain experts to develop extraction rules and match the rules with data to complete extraction.
- (4)
- Construction and Analysis of Knowledge Graph
- (A)
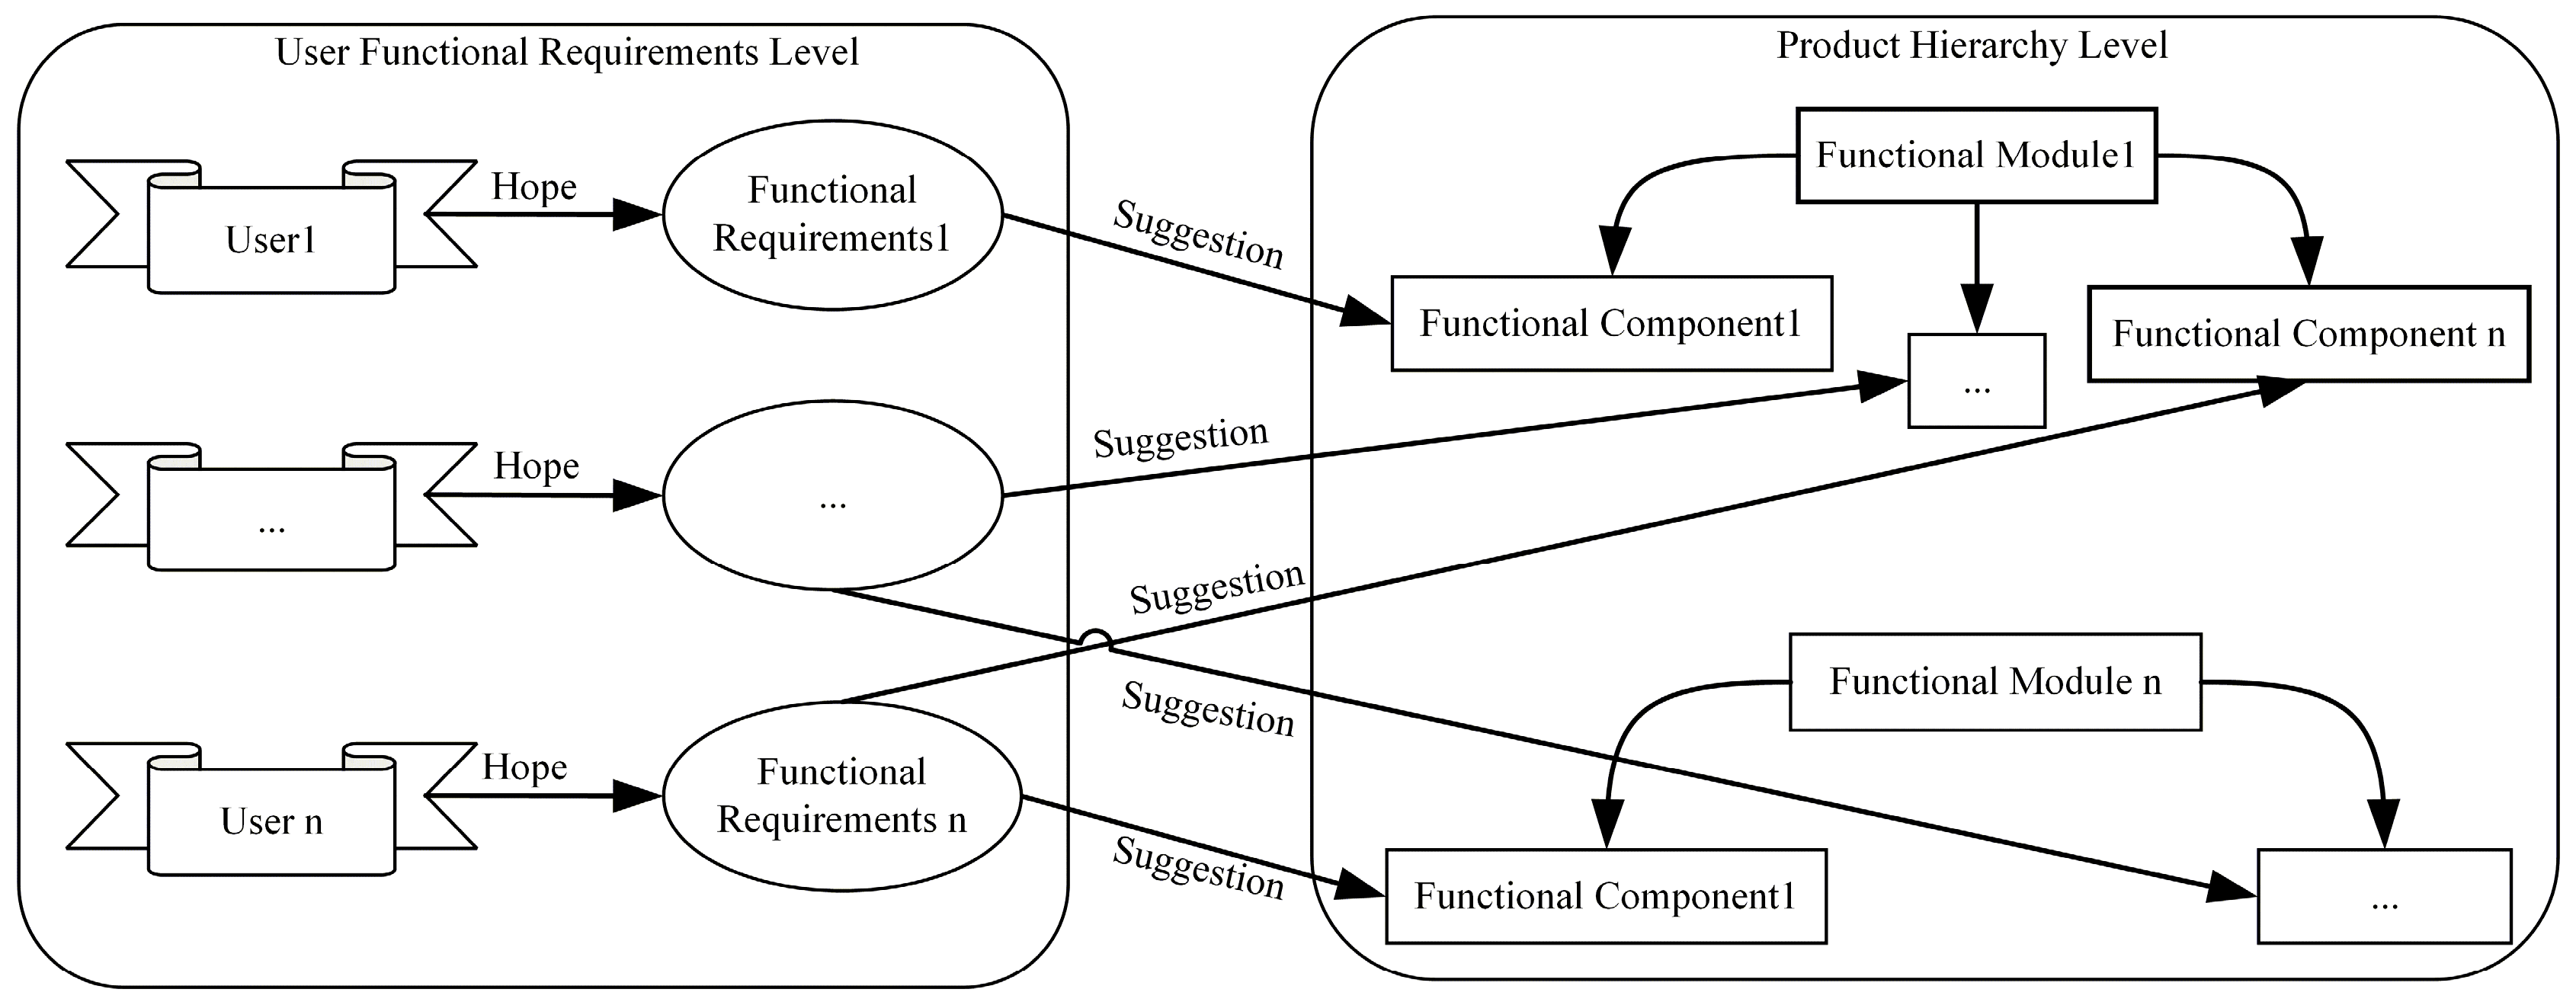
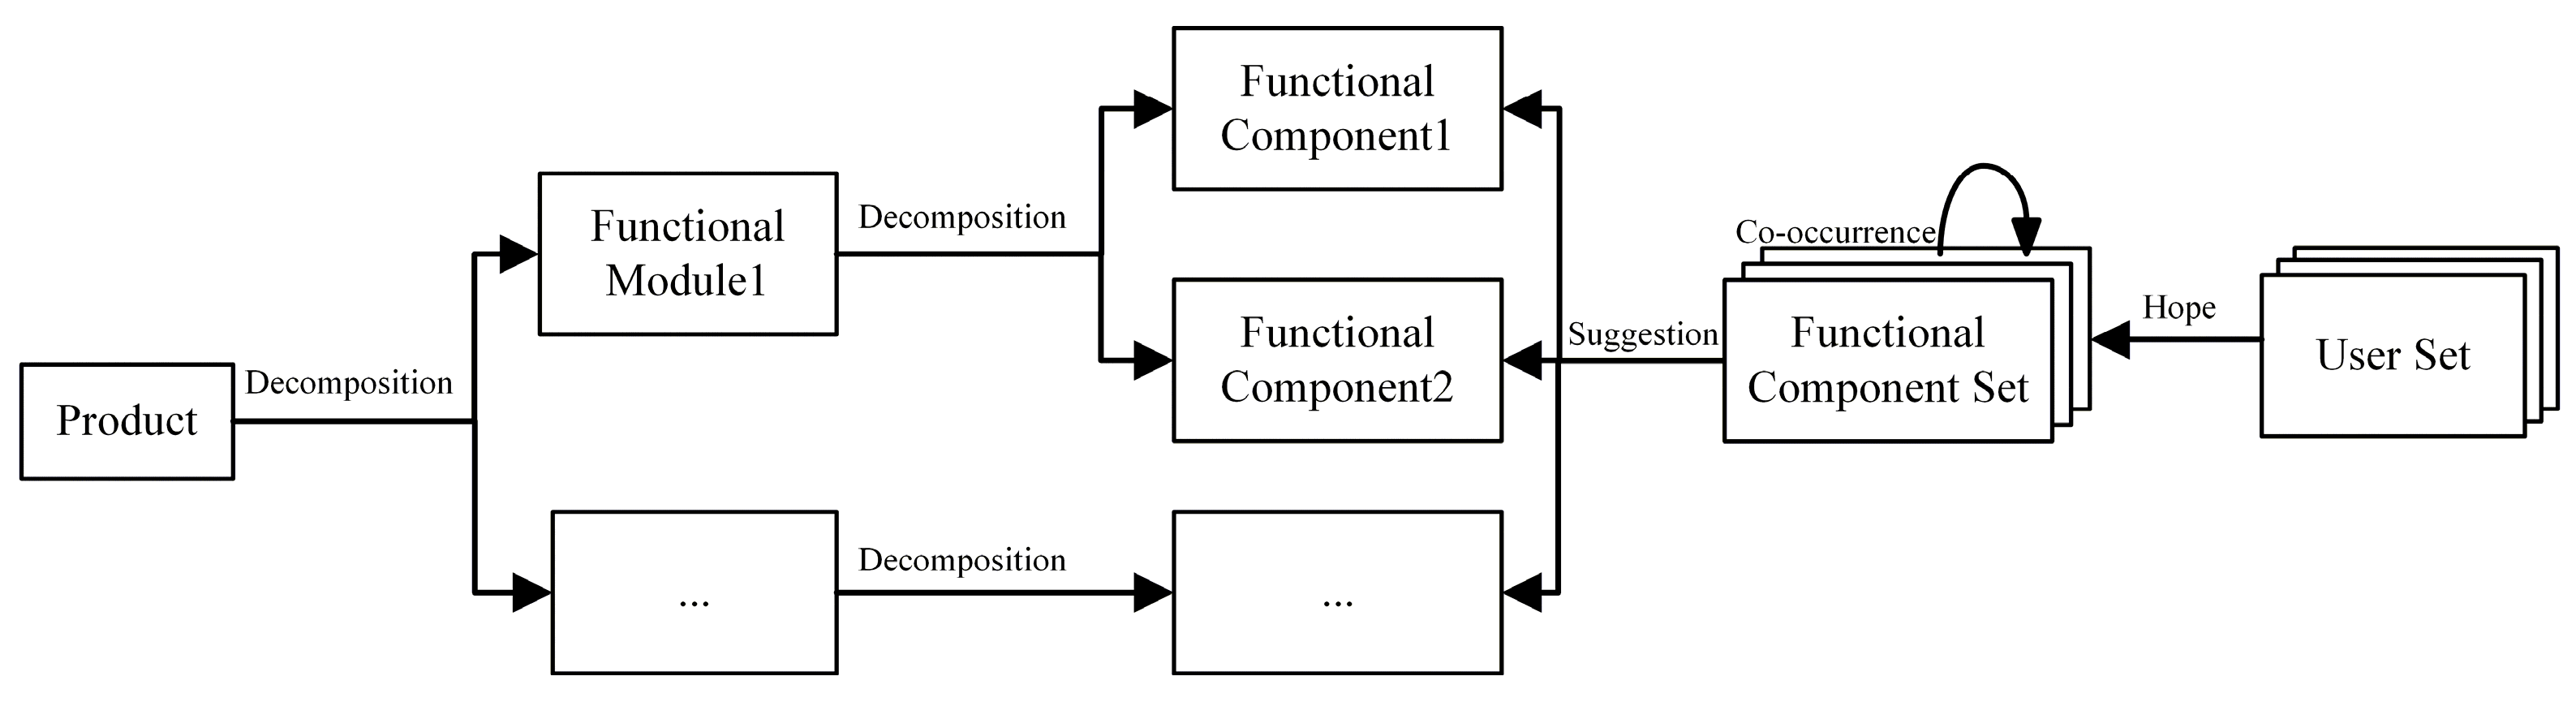
- Construction of Knowledge GraphKnowledge graphs are constructed in two ways: bottom-up and top-down [62]. The bottom-up approach is a data-driven approach, which is applicable to open domain knowledge graphs. The top-down construction is mostly applied to industry-specific vertical domains, and can meet the requirements of professionalism, complex and changeable business requirements, and high-quality data. The top-down construction of the knowledge graph is used for known products.The user requirements knowledge graph defined in this paper consists of five nodes: user, requirement, functional component, functional module, and product. Corresponding relationships need to be established among each node. The relationship between feature words of functional requirements is co-occurrence. The product is decomposed into each functional module, and the functional module is decomposed into functional components. The functional requirements suggest that the functional components have what the user wants. According to the relationship between the nodes, the model of a user requirement knowledge graph can be constructed, as shown in Figure 6.
- (B)
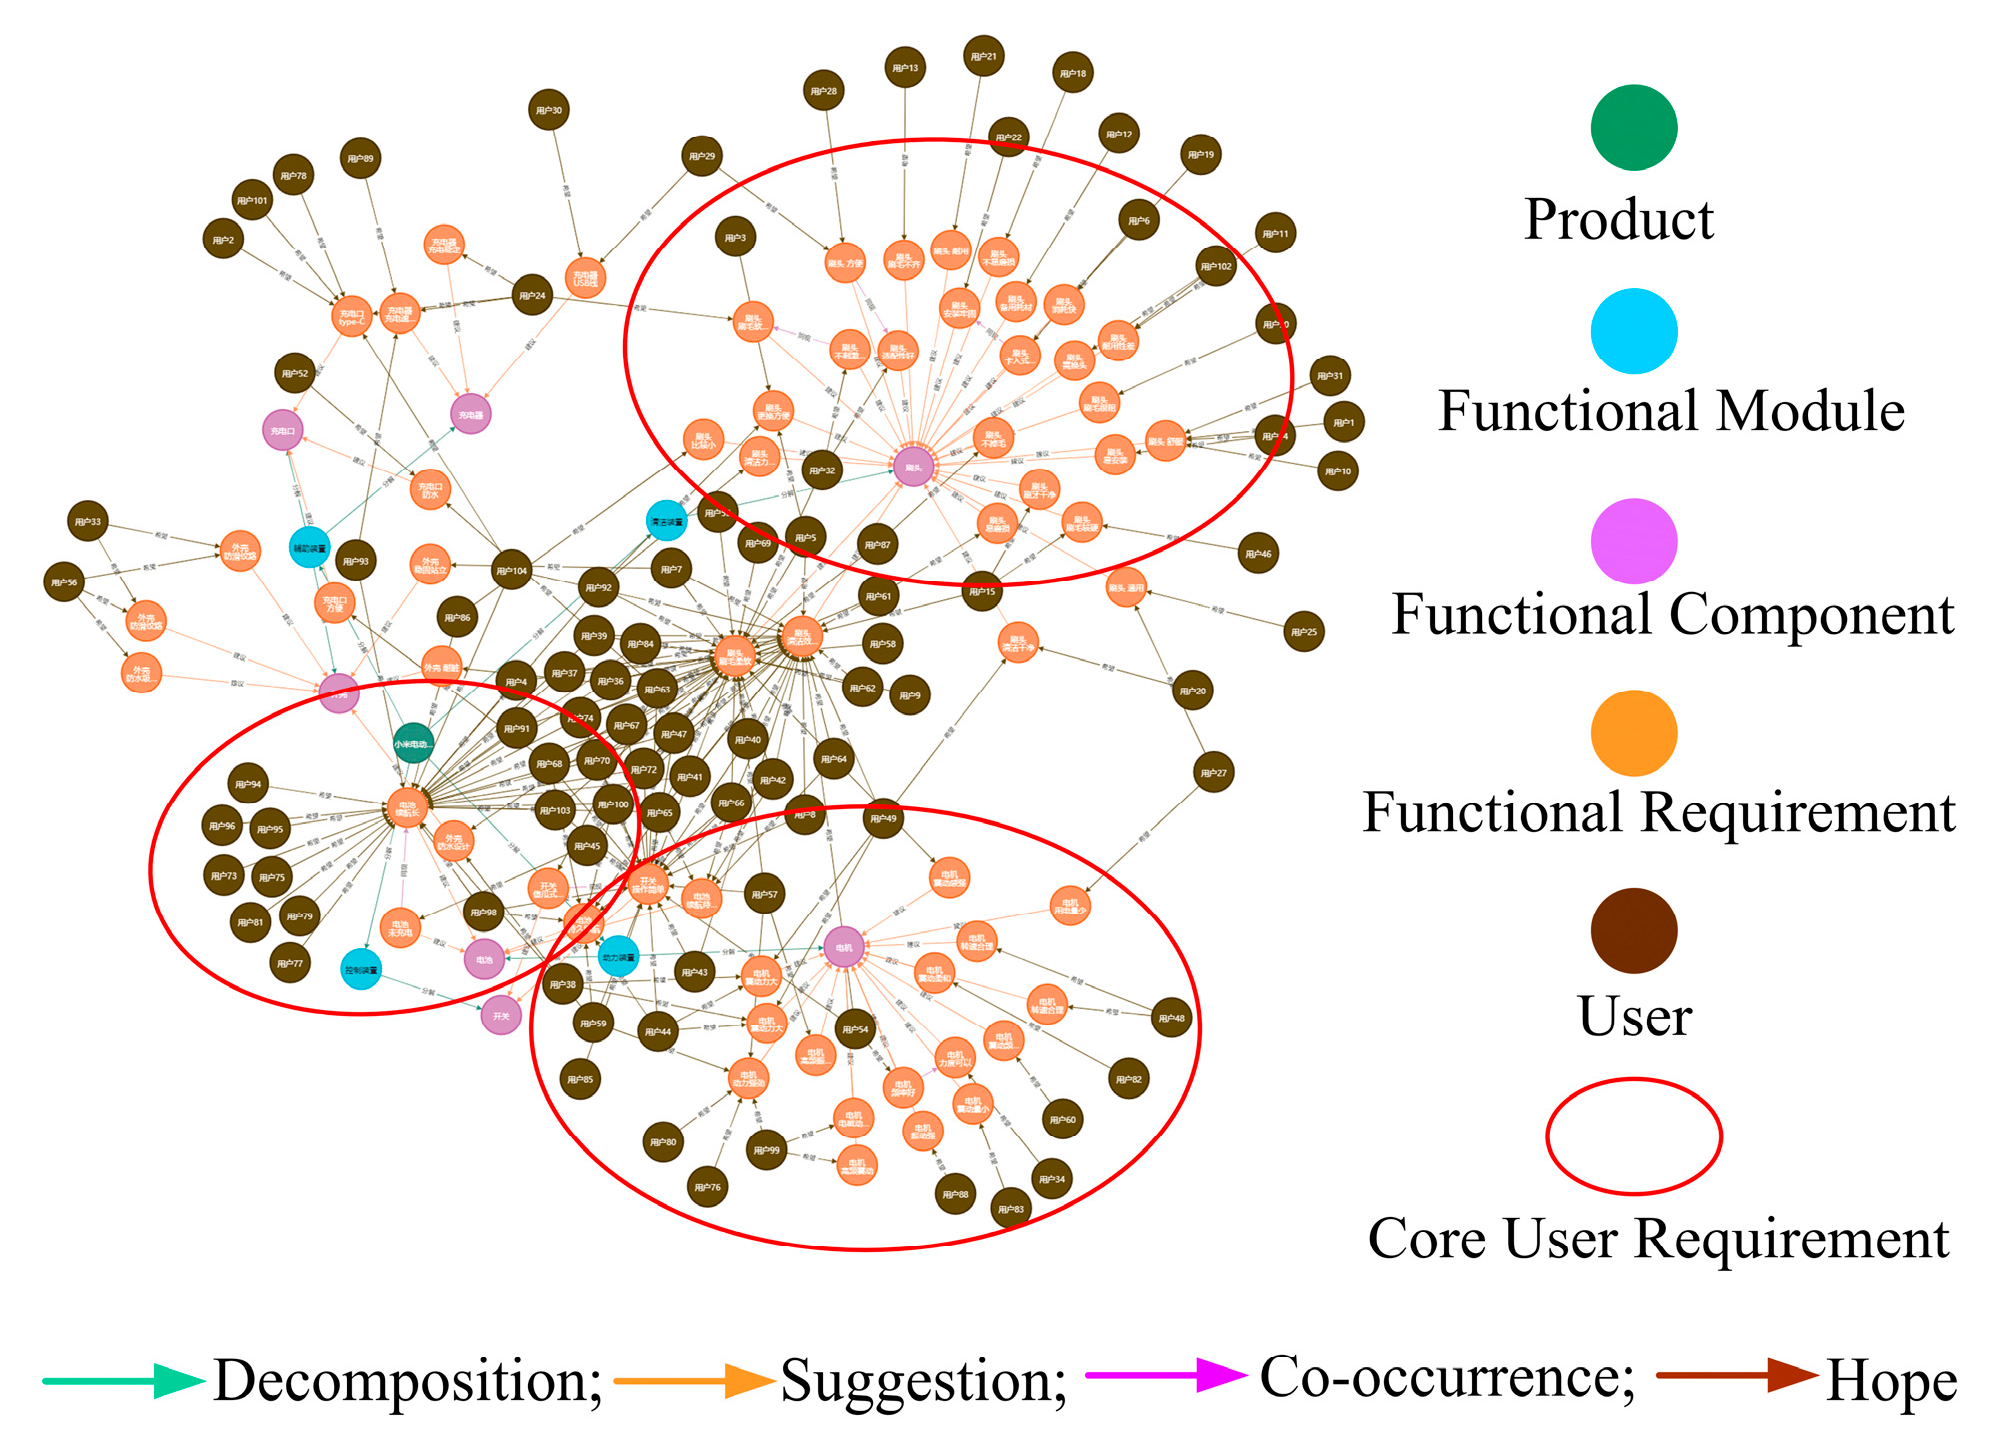
- Knowledge Graph Analysis Based on Social NetworkA social network is composed of network nodes (social actors) and edges (relationships), which investigates on the network structural relationships and their properties [63]. The knowledge graph is also a complex network model consisting of nodes and edges (relations), and the centrality of the knowledge graph network can be clarified by using the social network analysis method. By analyzing the betweenness centrality of the knowledge graph, the claims of most users to product functional components indicate that the node may be defective. Since there are unintuitive and inaccurate descriptions of the users’ requirements for the product, the construction of a user requirements knowledge graph can only provide directions for finding product functional defects and functional improvements.Through the crawler technology, some user reviews of Xiaomi electric toothbrushes (T300 type) on the JD e-commerce platform were obtained. The knowledge graph is constructed in the way described in this section in Figure 7. Through the analysis of the betweenness centrality of the knowledge graph, the users focused on the functional components of the toothbrush head, motor, and battery of the toothbrush, indicating that the direction of product innovation should be around the above components.
4. Product Innovation Design Method of Digital Twin Combined with Flow Function Analysis
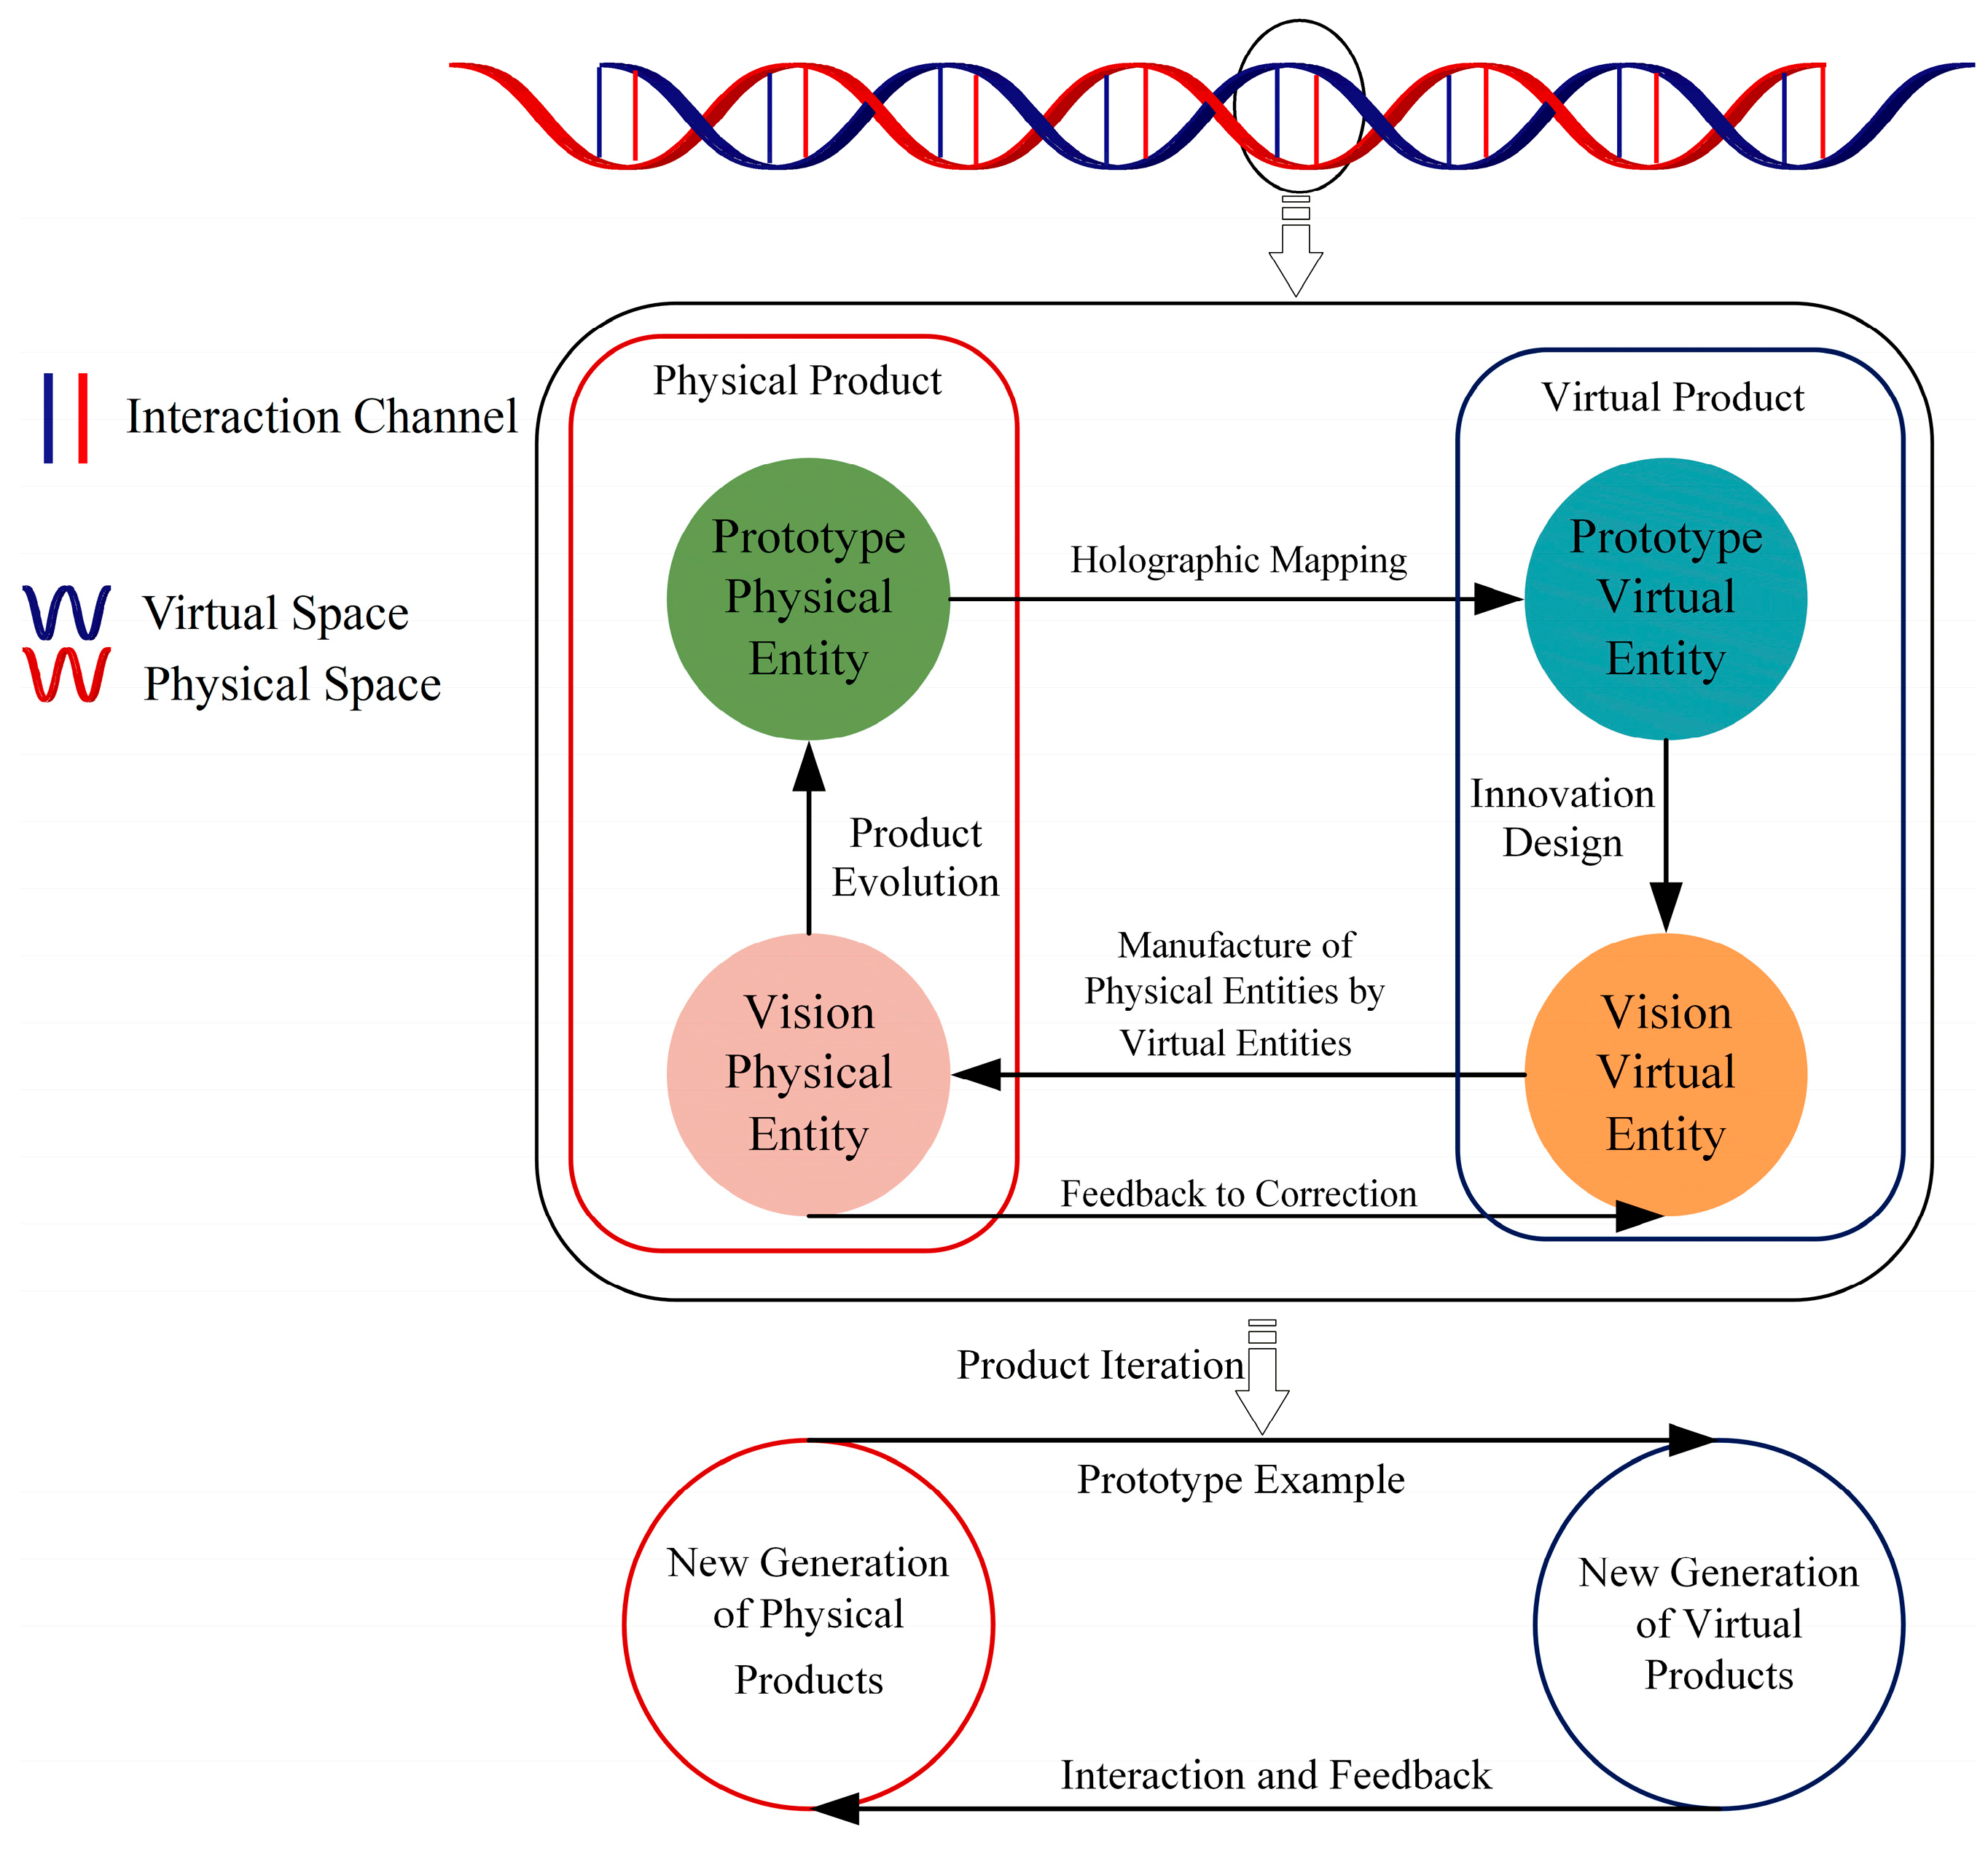
4.1. PPE-PVE-VVE-VPE Digital Twin Innovation Design Model
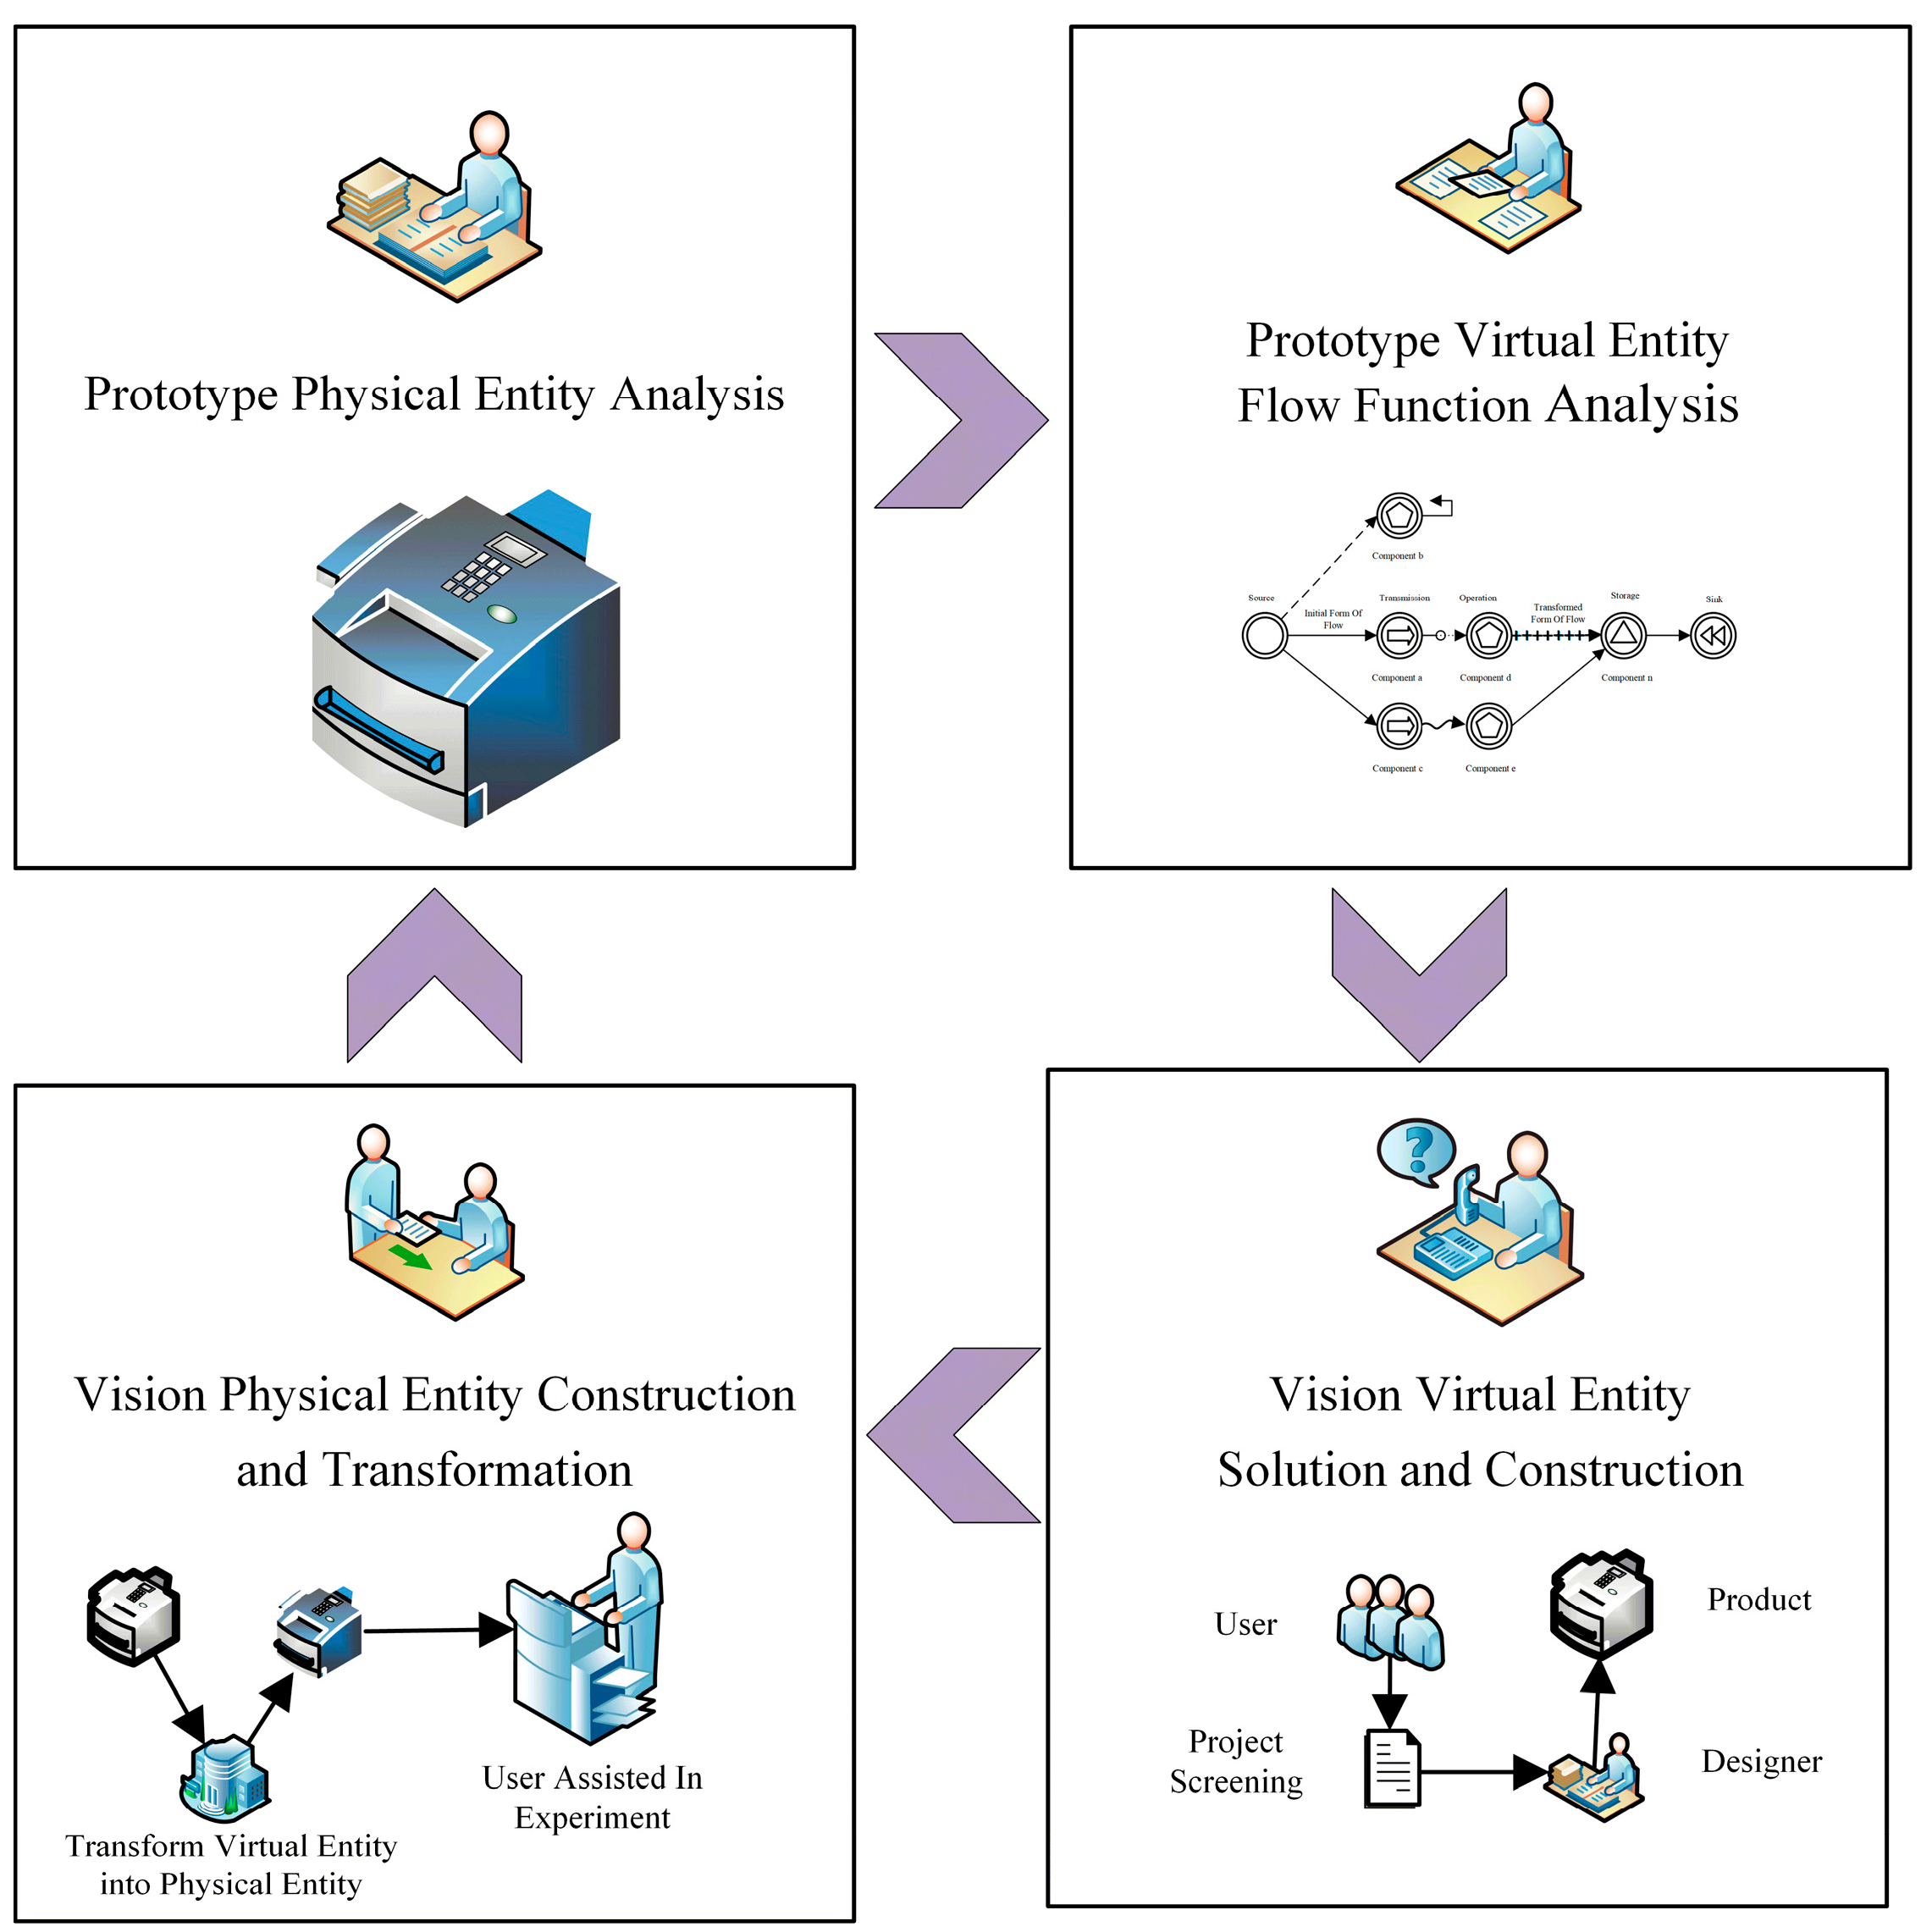
- (1)
- Clarify the composition of the PPE by using the physical product as the prototype physical entity.
- (2)
- Make a holographic projection of physical entities into virtual space to construct PVE and analyze the defects of the PVE products in virtual space.
- (3)
- Based on the defect analysis of the PVE, solve the innovation scheme and construct the VVE which should be simulated and rehearsed in virtual space.
- (4)
- Based on the interaction between virtual and reality, replicate the VVE to the physical space to construct the VPE, which moves under the constraints of the real environment of the physical world. The VPE that meets the actual operating conditions of the physical world is transformed into a new PPE, and those that do not meet the requirements are returned to the VVE to re-conduct function solving as well as the simulation and rehearsal.
4.2. Product Innovation Design Process of Digital Twin Combined with Flow Function Analysis
- (1)
- PPE (Prototype Physical Entity) AnalysisPPE is the basis for improvement and innovation. Through the PPE analysis, functional components (real physical structure), super-system components, properties of material flow, energy flow as well as signal flow, and functional behaviors are clarified.
- (2)
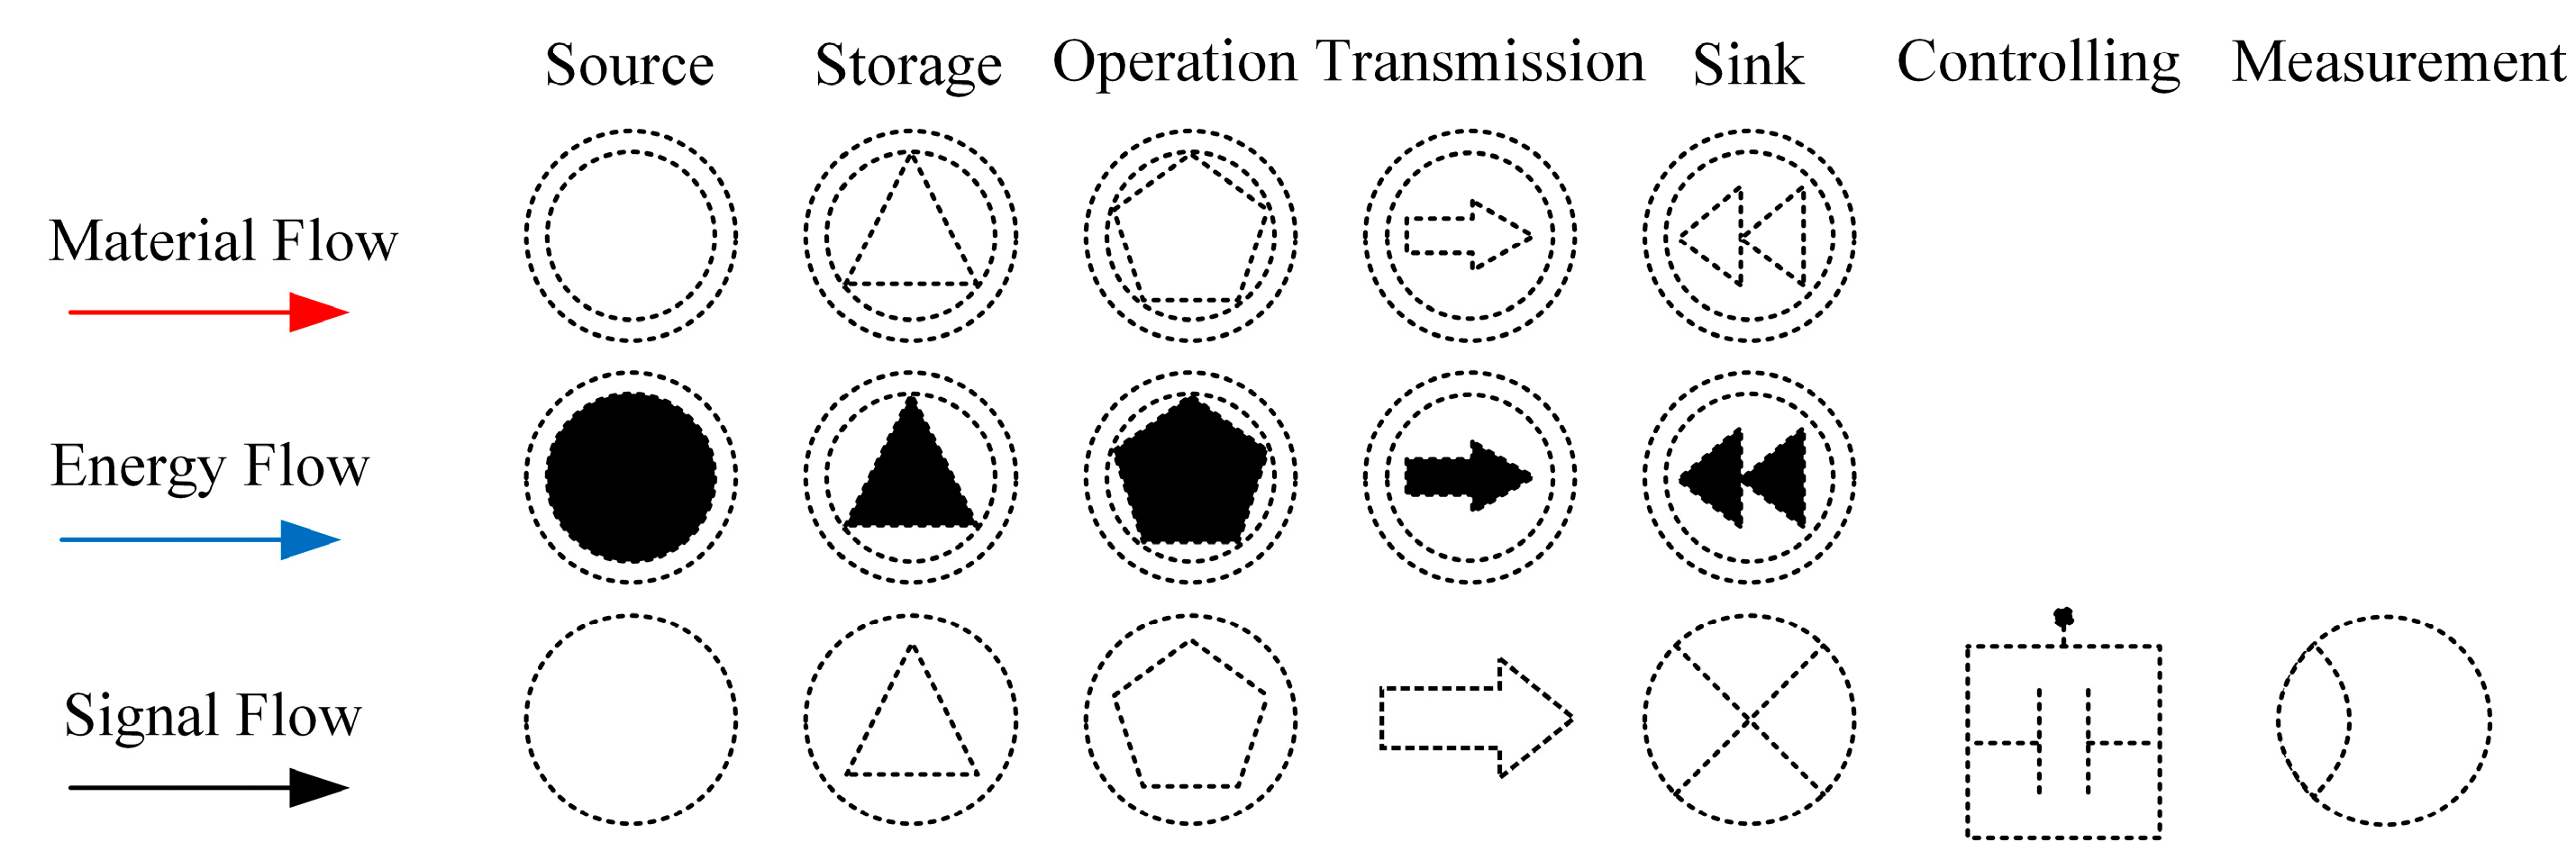
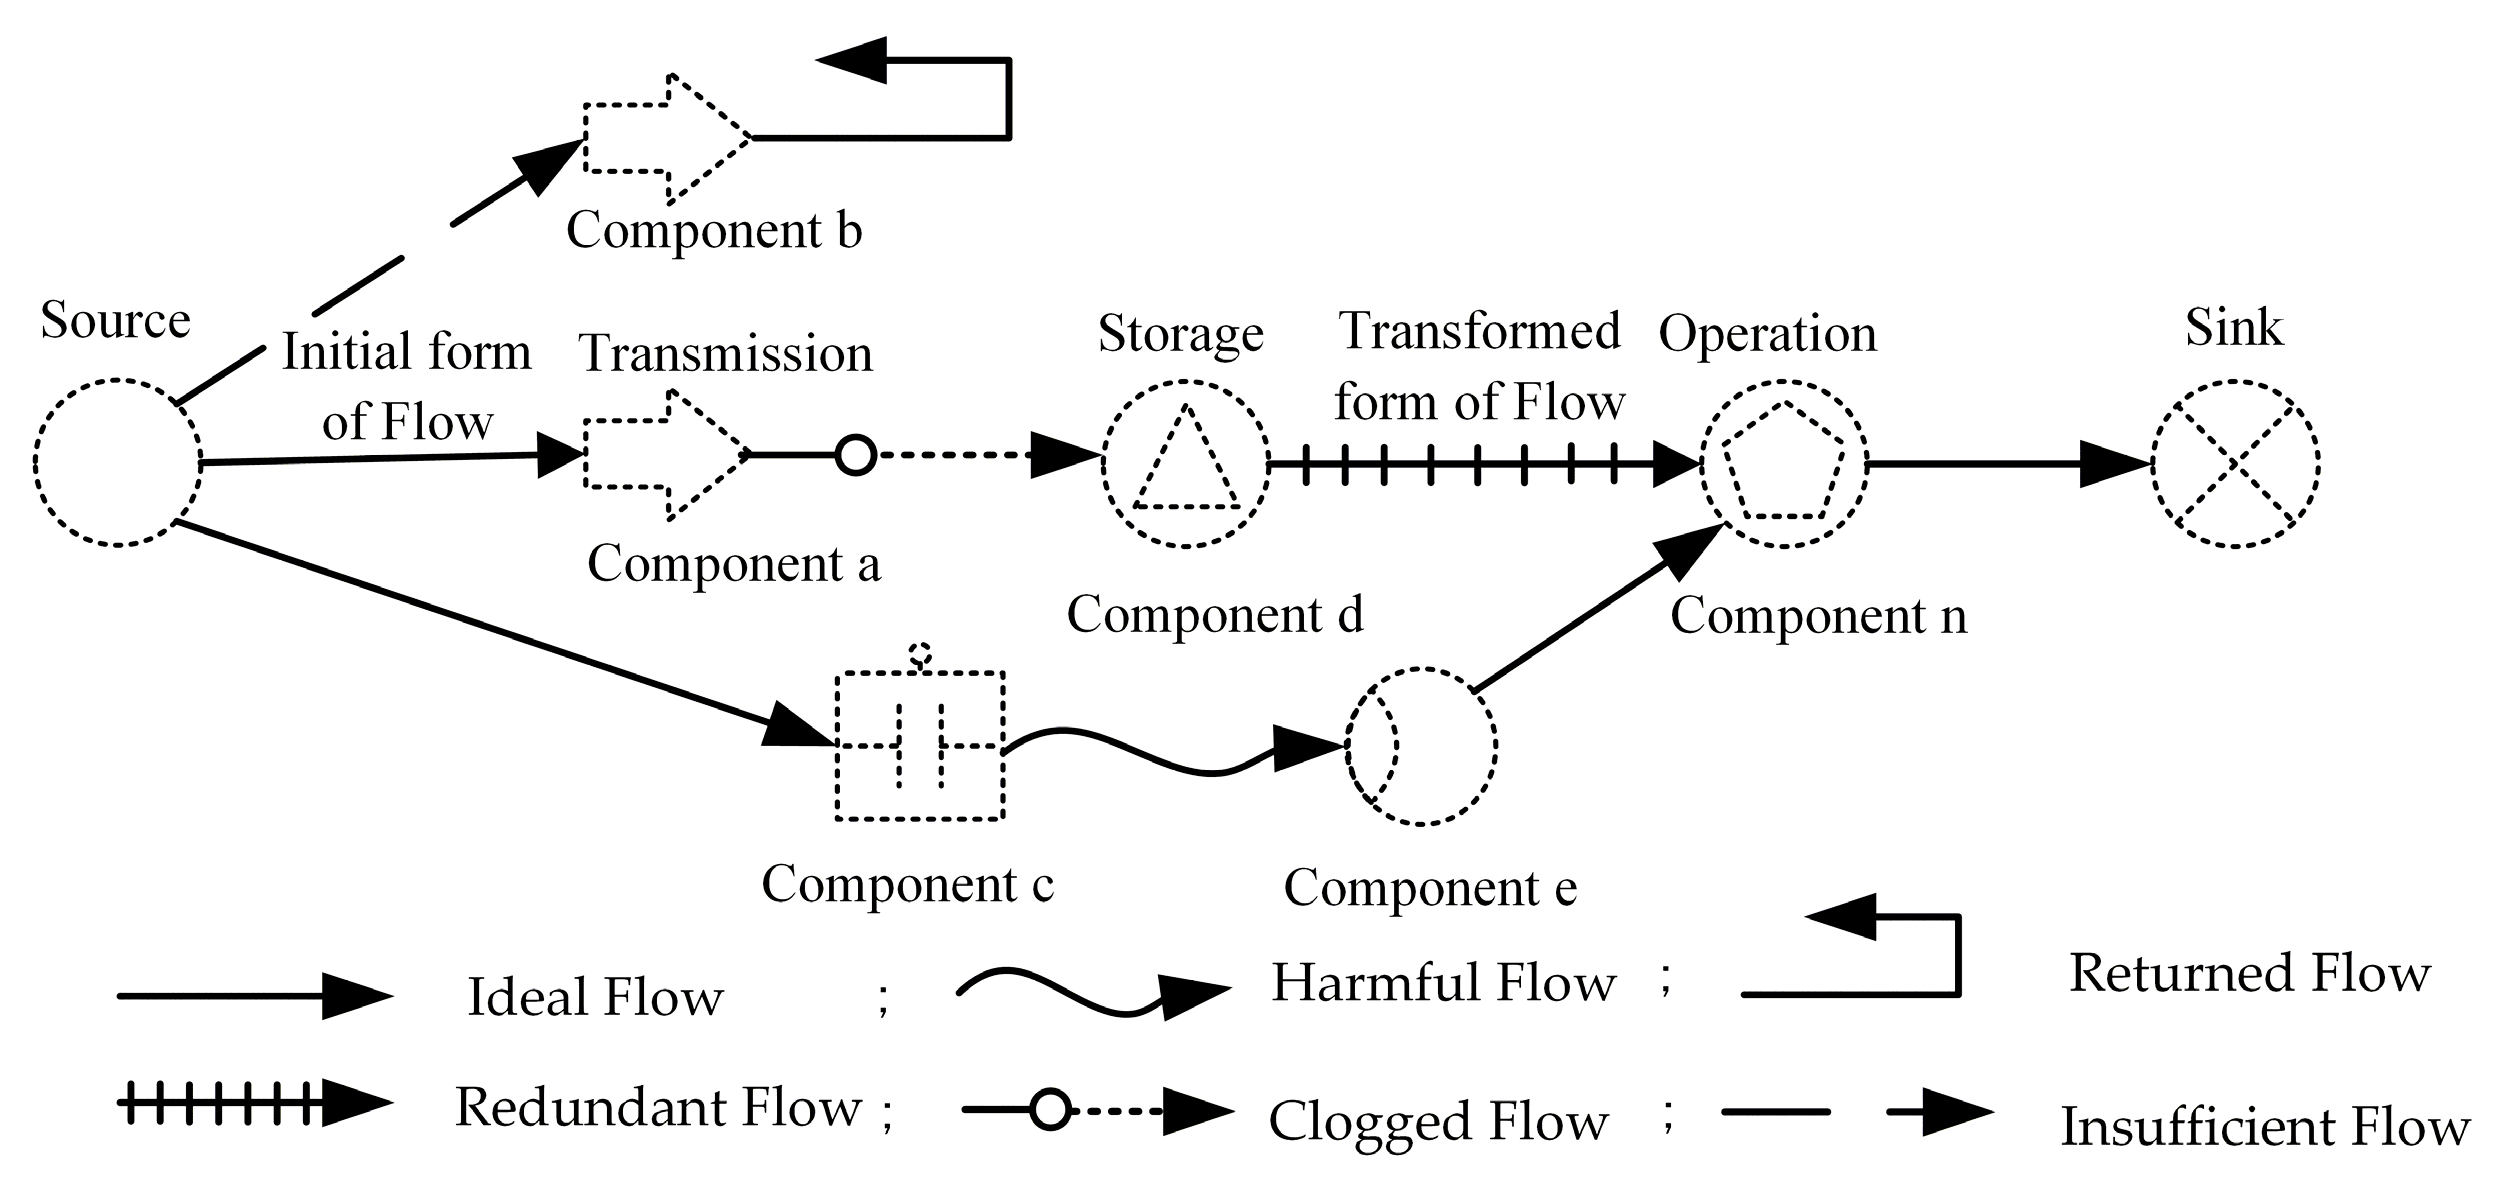
- PVE (Prototype Virtual Entity) Flow Function AnalysisPVE is the re-establishment of all production factors of PPE in virtual space by using sensors or other data acquisition methods, which includes functional components, super-system components, three-dimensional flows and their functional behaviors.PVE is a holographic mapping of the PPE. The flow function analysis of PVE is based on the analysis of the products in the physical domain. In the virtual domain of DT, the flow paths and transformation forms of material flow, energy flow, and signal flow are analyzed, and the flow channels, accumulation and consumption of the flows are identified, which provide guidelines for product improvement and innovation. However, different from the function model of physical products, it should be adjusted on the basis of the entity model in the physical domain. For the virtual flows, the PVE function symbols are shown in Figure 10.When analyzing the flow function of PVE, the components that users focused on (i.e., the innovation direction fits) should be the core analysis point. The steps are as follows.
- (a)
- Respectively, find system components, super-system components, and system functional objects through which material, energy, and signal flow in a product pass.
- (b)
- Identify the flow functions and categories realized by the material flow, energy flow, and signal flow among each component, and clarify the initial form and transformation form of the flows.
- (c)
- Analyze the flow direction and transmission path of product material, energy, and signal flow based on a time sequence.
- (d)
- Use a graphical representation to demonstrate flow function relationships and flow paths, and create a flow function model diagram.
- (e)
- Identify defective flows in the flow function model.
The function model of signal flow in the DT space is built as an example, as shown in Figure 11.The flow function model takes “source” as the starting point and “sink” as the ending point. The component title is marked directly below the component flow function. The functions of material flow, energy flow, and signal flow between each component are connected by returning, clogging, insufficient, ideal, redundant, and harmful flow segments with flow transformation patterns marked on the segments. The function model of the signal flow is constructed according to the generation of signal flow, the flow path between components, and the time sequence of disappearance. - (3)
- VVE (Vision Virtual Entity) Solution and Construction
- (I)
- Getting VVE Based on Flow Evolution PathsThe key aspect of product innovation design is to solve the function and obtain a new functional principal solution or functional realization scheme [65]. The flow function analysis method analyzes the flow transfer path and transformation of material flow, energy flow and signal flow in the product, screens the spatial and temporal distribution of the three-dimensional flows and the accumulation and consumption of each link, performs defective flow improvements based on the flow evolution paths, thus solves and constructs VVE through the improvement of defective flows and the evolution of the ideal flow.According to the defects and evolutionary directions of different flows, nine flow evolution paths have been proposed in the literature [56] (see Appendix A) in order to provide effective guidance on enhancing the beneficial flow, eliminating the harmful flow, and achieving innovative product design. Matching relationship between flow evolution paths and defective flows is shown in Table 1.Conceptual design focuses on being user-oriented and generating new design solutions based on product improvement directions. Designers propose several conceptual solutions based on the flow evolution paths to correct and improve the defective flows in virtual space. The extensibility and virtualization of the DT space allow the visualization of the conceptual solutions in front of the designers, forming VVE.
- (II)
- Evaluation of Conceptual SolutionsThe user’s perspective is used to filter out solutions that better fit their requirements to construct the VVE, which enhances the user’s participation in the product innovation design process. Meanwhile, whether the new design satisfies the user’s requirements is indirectly verified. The fuzzy comprehensive evaluation method quantitatively evaluates the satisfaction degree of upgraded product function and the matching degree of requirement by setting evaluation factors from the perspective of the user. It should be pointed out that the rationality of the selected evaluation factors is a direct contributor to the selection results. The selection of evaluation factors should be in line with the direction of product improvement and user requirements. To achieve this, the design experts should bring their advantages of rich experience and extensive knowledge in this field into full play, and reason with the evaluation factors based on the available product design standards or experience [66]. The evaluation factor set is supposed to be selected based on whether it is irreplaceable, practical, scientifically rational, integral, and all-rounded.The steps of a fuzzy comprehensive evaluation for user-oriented functional dimensions are as follows.
- Step 1. Identify the comment set .
- Step 2. Determine the set of evaluation factors .
- Step 3. Determine the set of weight vectors .where , and , denote the weight coefficients under the evaluation index.
- Step 4. Determine the affiliation and single-factor evaluation matrix. The evaluation of a single indicator yields a single-factor evaluation matrix.
- Step 5. Calculate the comprehensive evaluation matrix .where
- (III)
- VVE Simulation and RehearsalVVE is derived and detached from PVE. The main purpose of the construction of VVE is to visually express the shape parameters, assembly relations and actual operation. Through 3D modeling and rendering software (such as NX-electromechanical conceptual design module, Unity 3D, Catia, AMESim, 3DMax, Blender, Maya, etc.) combined with system simulation software (such as MATLAB, ANSYS, ABAQUS, ADAMS, EDEM, Visual Studio development platform, etc.), the rehearsal and verification of VVE are realized.
- (4)
- VPE (Vision Physical Entity) Construction and TransformationAccording to the interactive mapping of the VVE and VPE, the virtual to physical transformation is realized through workshop manufacturing activities; thus, realize the construction of the VPE. In the transformation process of the VPE, users, as experiencers, truly participate in and judge the VPE that moves under the constraints of the real environment of the physical world. Those physical entities that satisfy the following two points can be transformed into the new prototype. The first is in line with the actual operating constraints of the physical world, and the second is in line with the actual usage requirements of users. The physical entity part that does not meet any of the two points should return to the previous step for redesigning.
5. Case Study
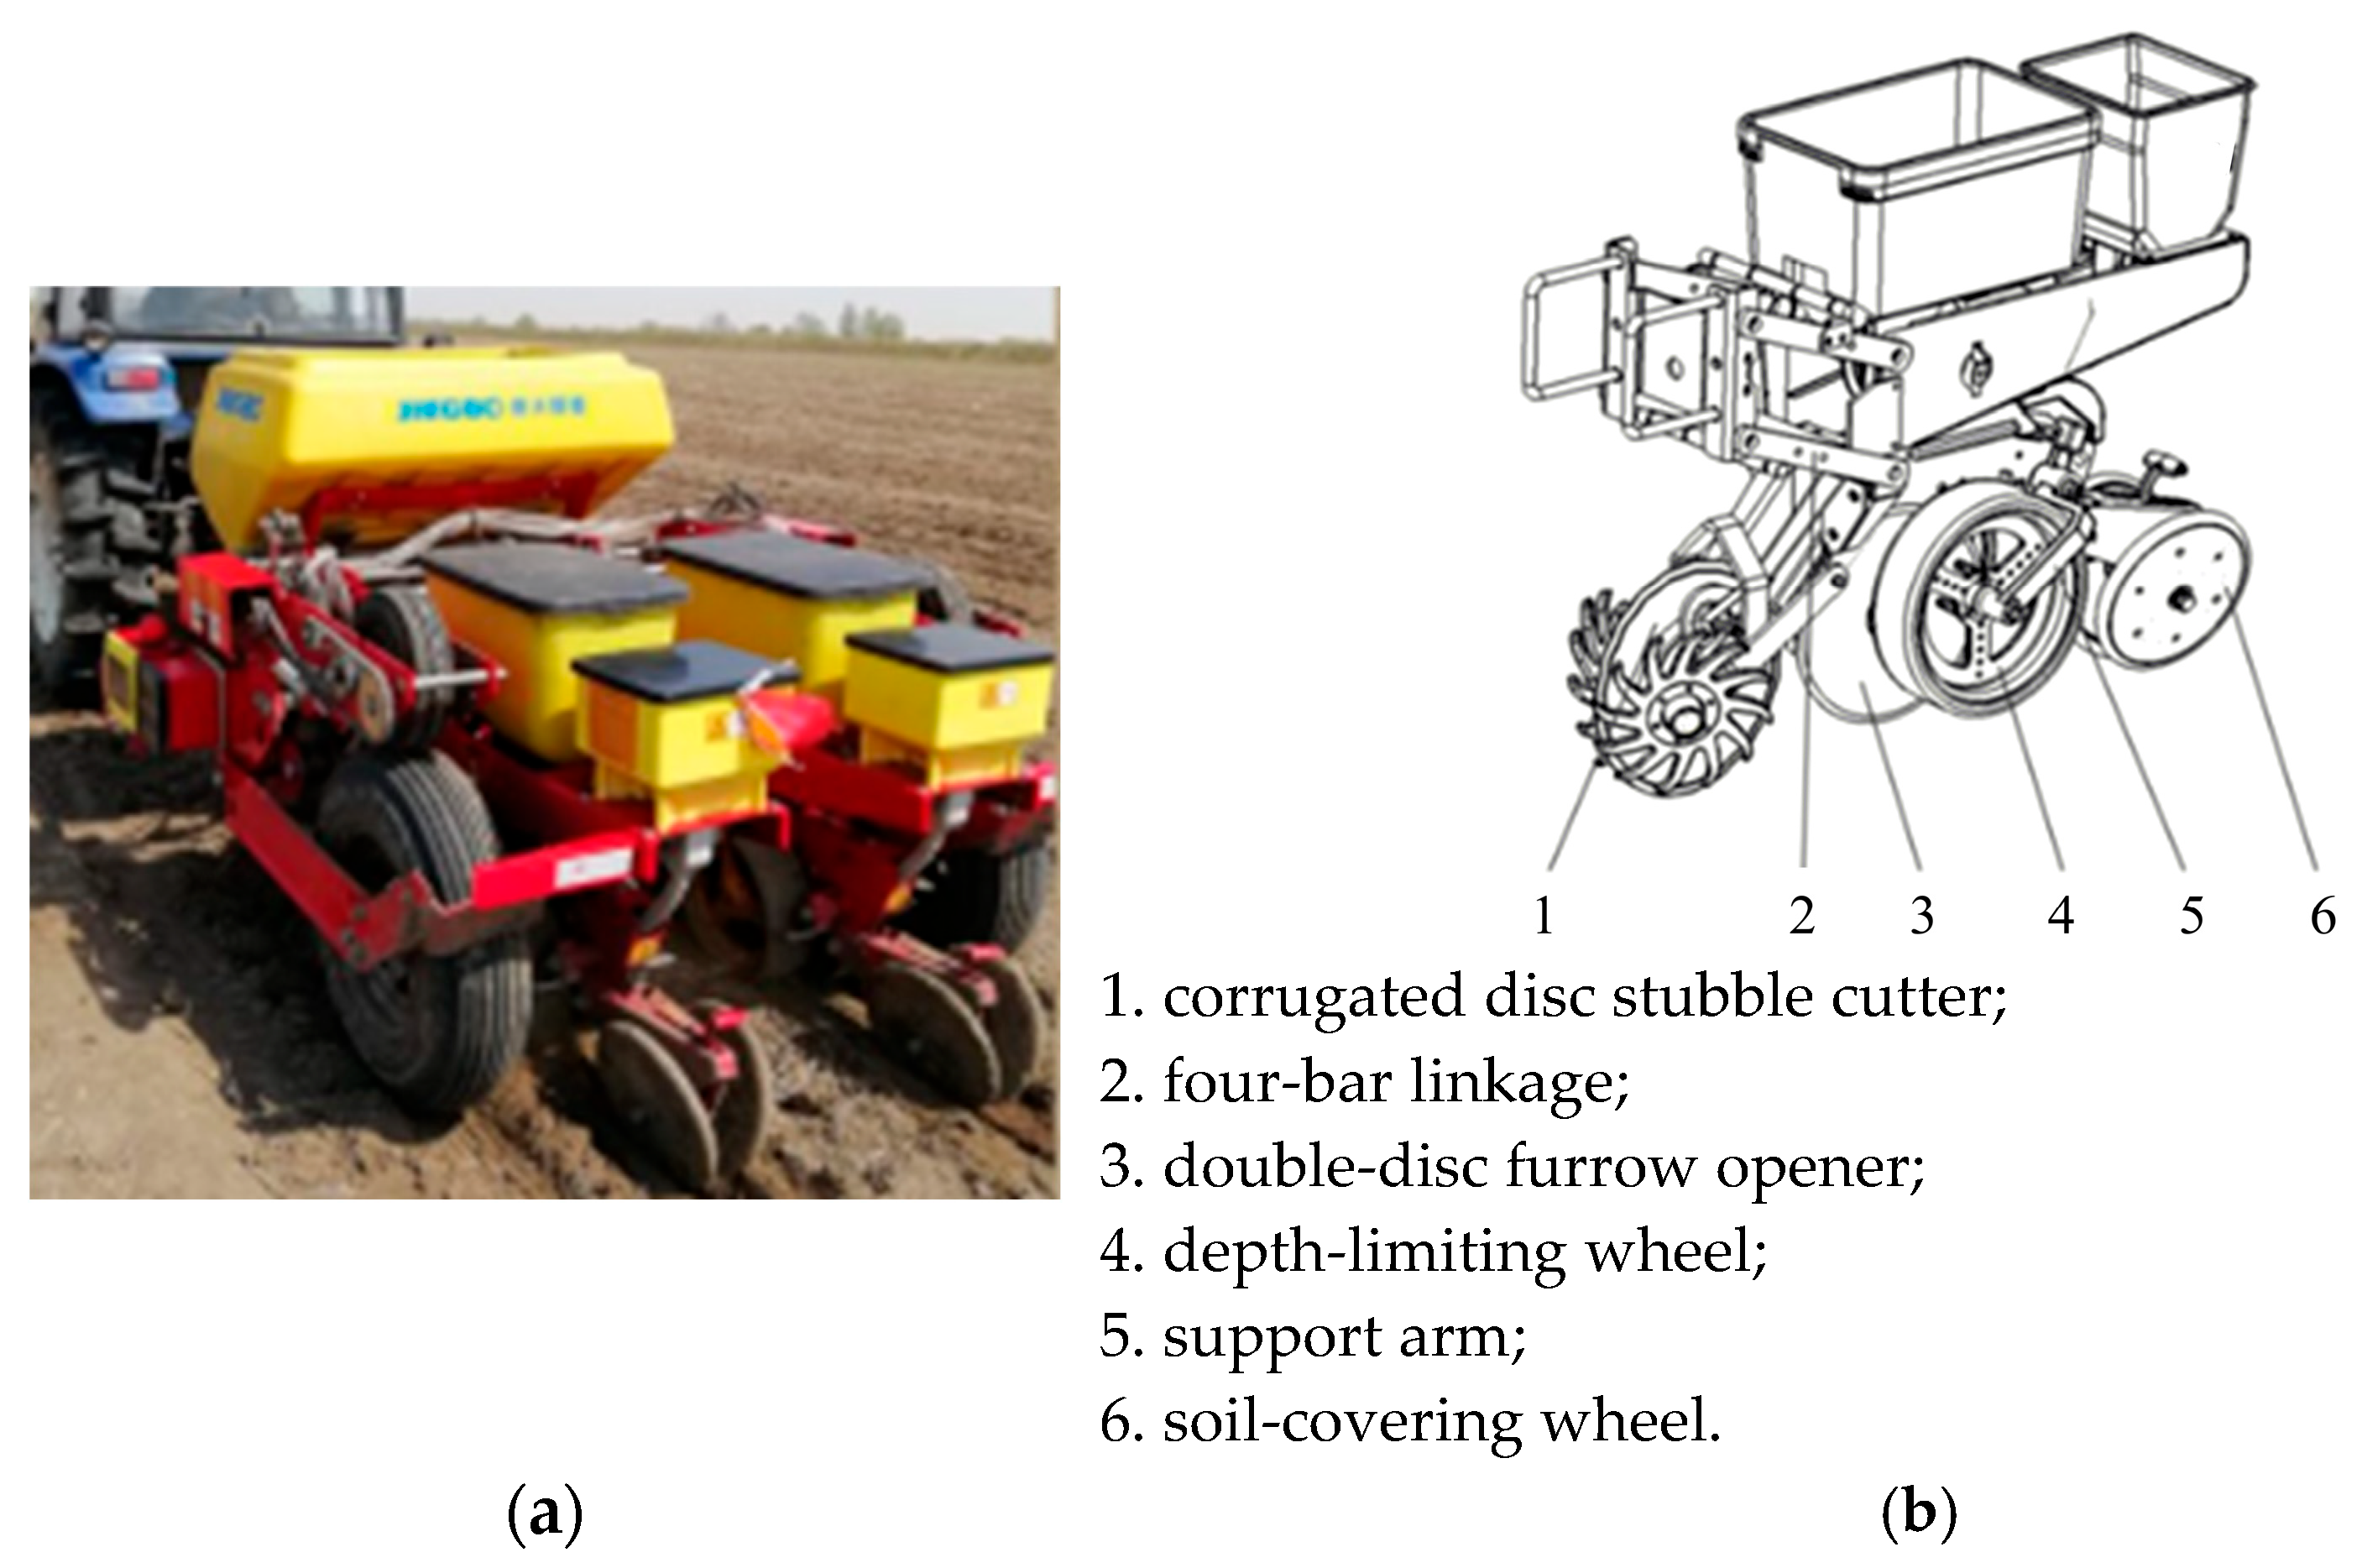
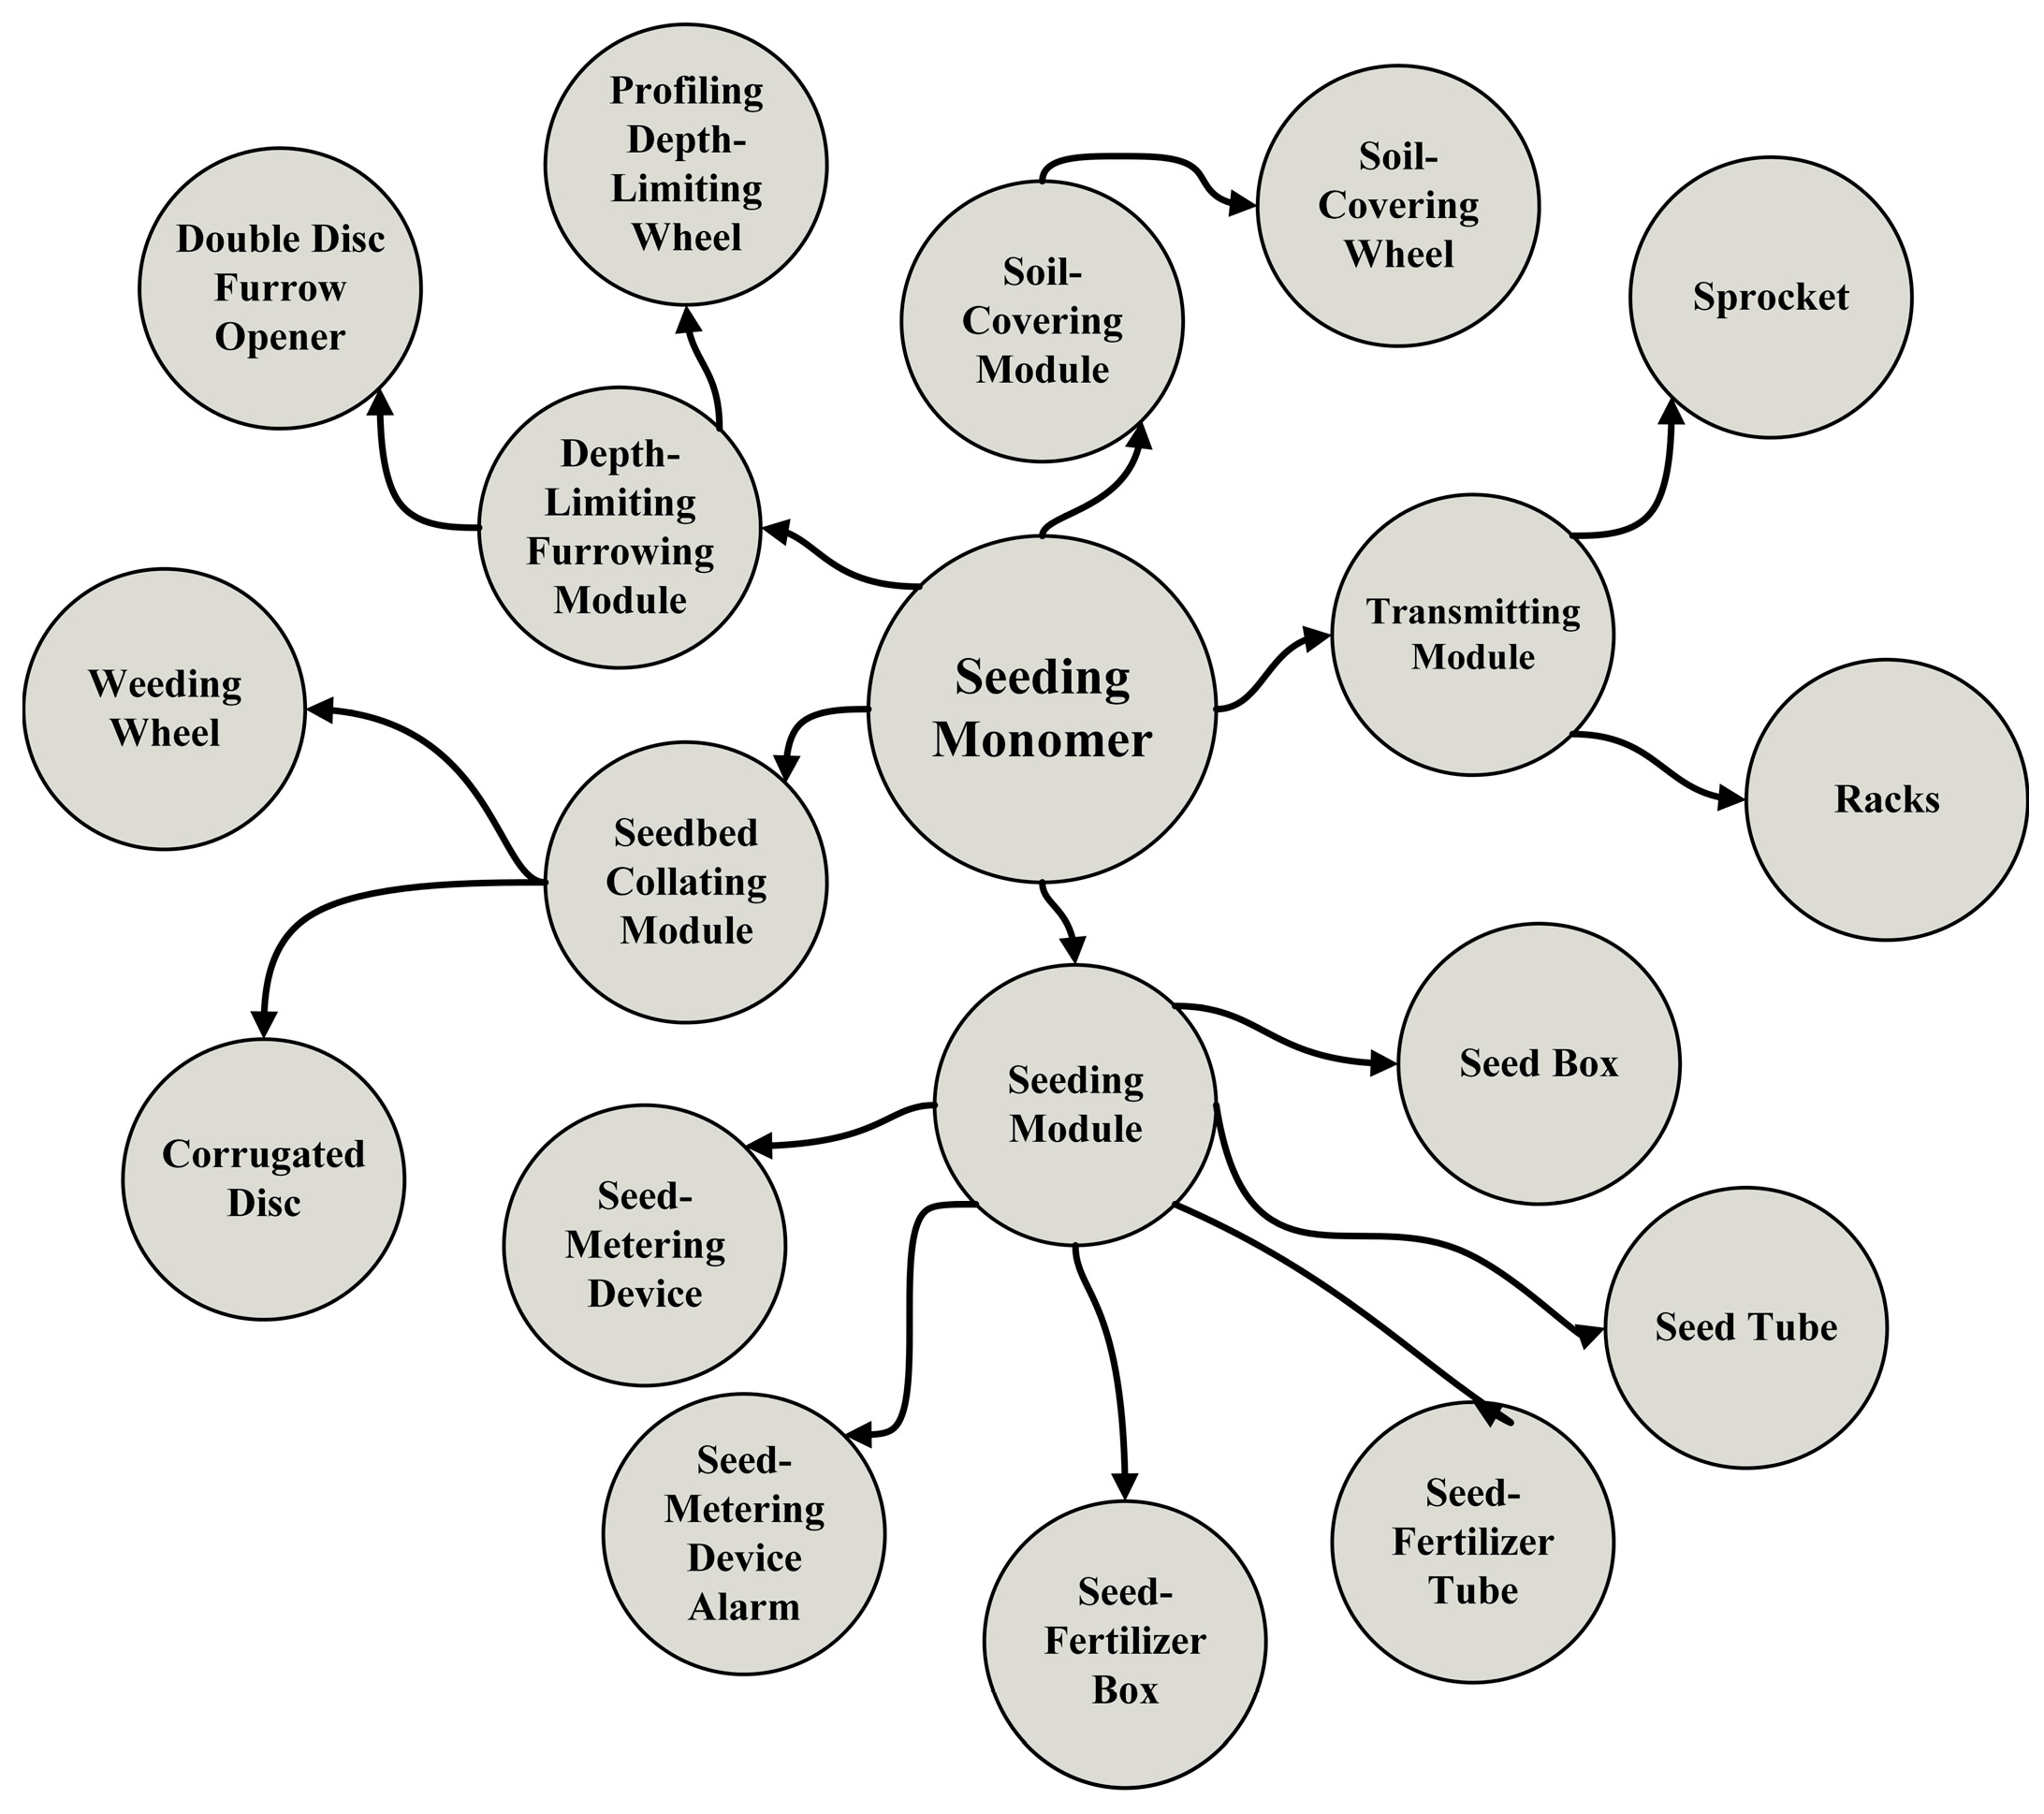
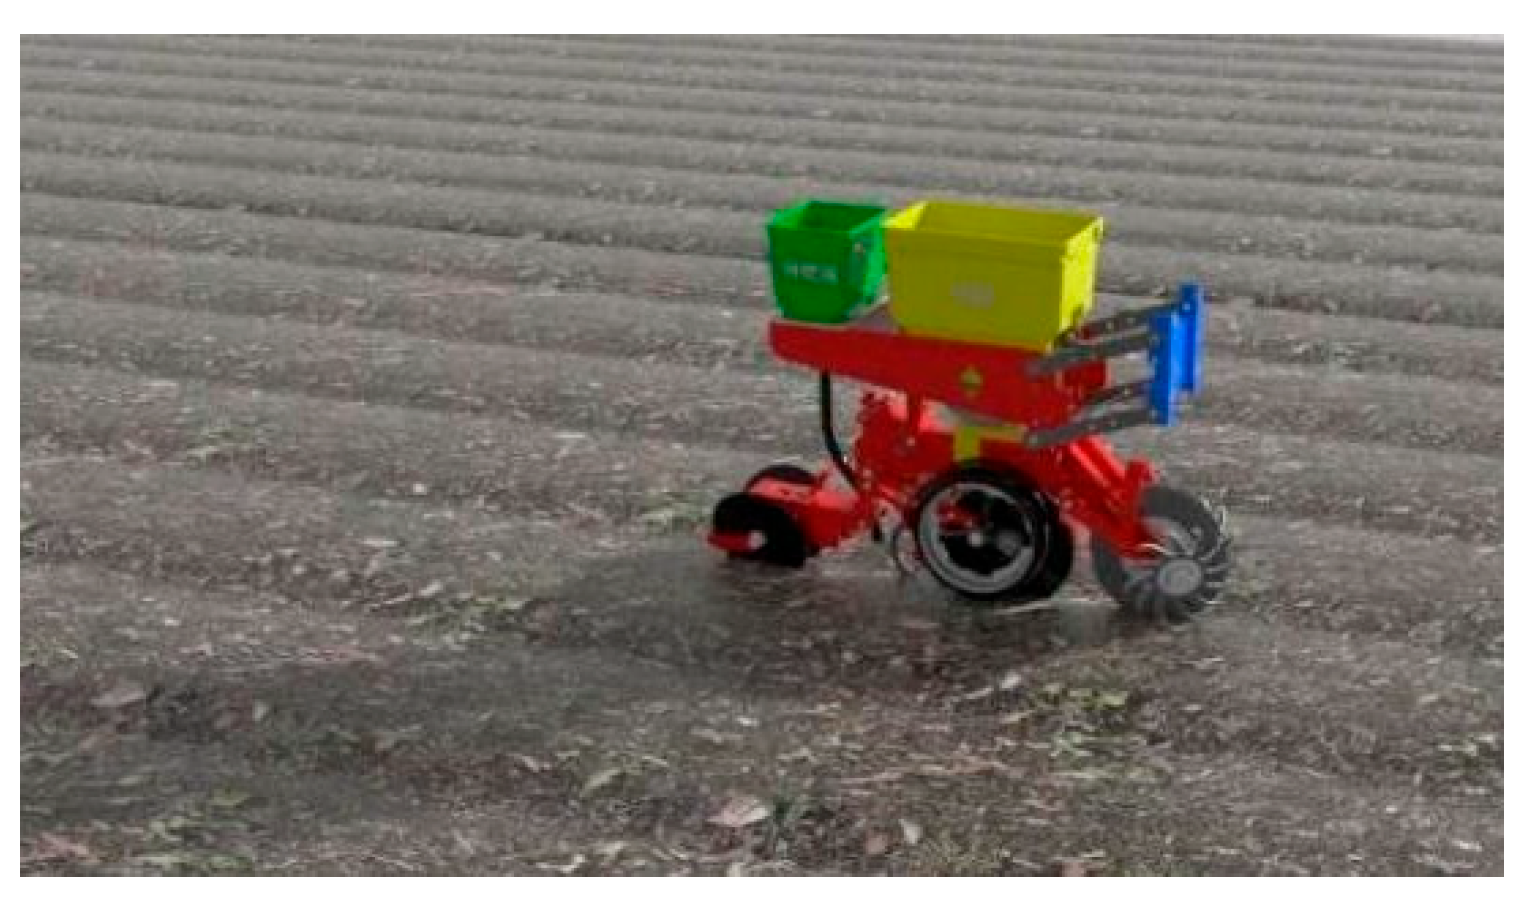
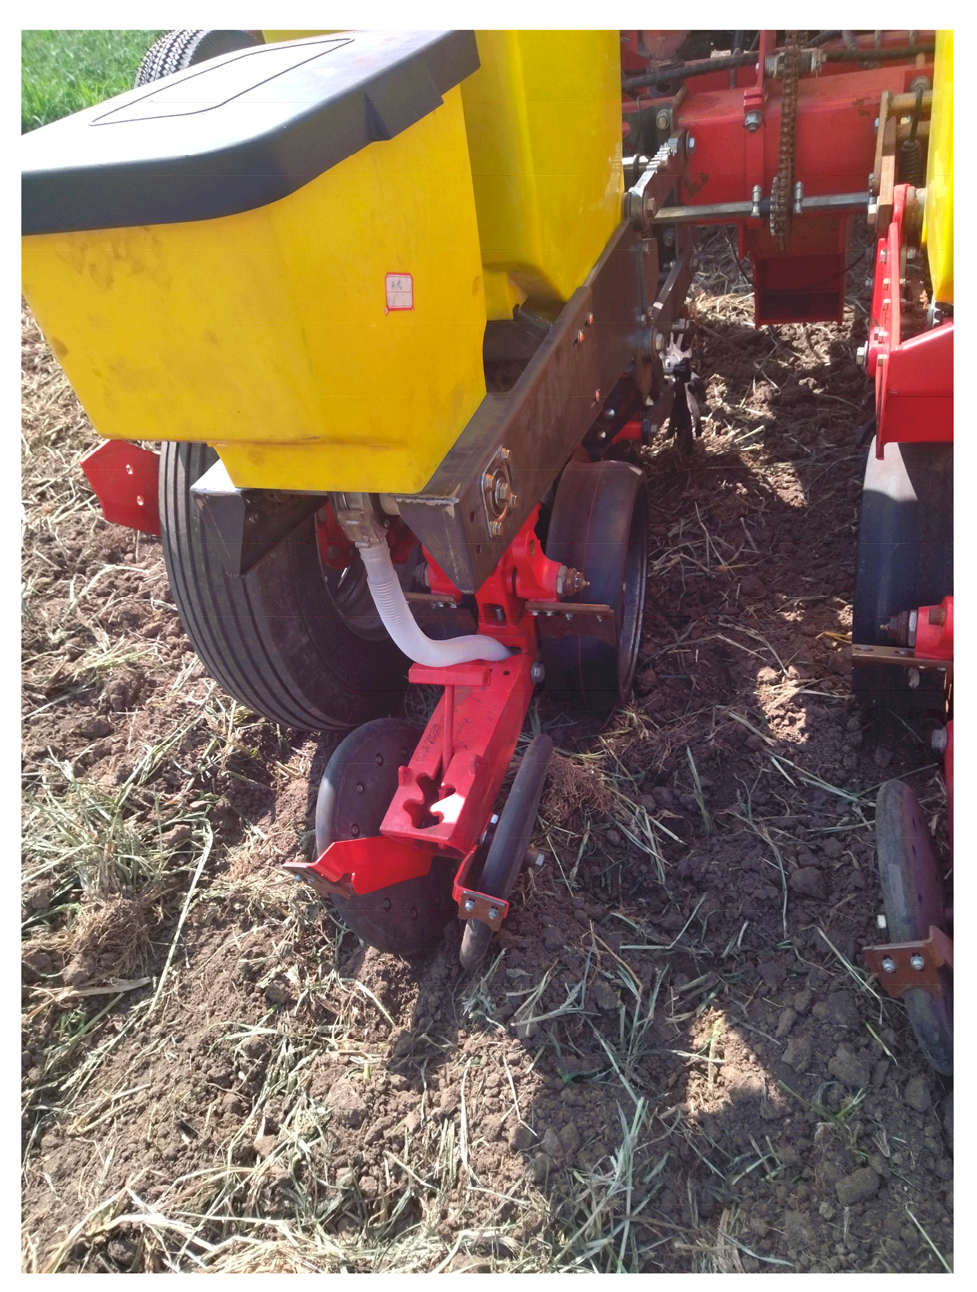
5.1. Composition and Working Principle of Seeding Monomer
5.2. Construction and Analysis of User Requirements Knowledge Graph
- (1)
- Data AcquisitionAlthough the sales volume of the selected product is low, and the usage time and user range are relatively fixed, no relevant suggestions can be found in the comments and suggestions section of its official website (https://www.nongjitong.com/company/dewo/feedback.html accessed on 1 April 2022). Through cooperation with enterprises, this paper collects data from 15 April 2022 to 31 May 2022, by means of interviews and questionnaires from users. A total of 80 data provided by users are collected (71 data are filtered for the description of product functional requirements). The interview and questionnaire data collection card is shown in Appendix B.The user requirements are processed with the content of user suggestions for the product in the data collection card as the main content and the components suggested by users for improvement as the auxiliary content. The purpose of data processing is to clarify the mapping relationship between the functional requirements of user concerns and the functional components of the product.
- (2)
- Construction of Product HierarchyFunctional decomposition of the seeding monomer is carried out according to Equation (2), and the functional hierarchy of the product is constructed, as shown in Equation (4).where , ,
- ,
- ,
- ,
- .
The conceptual hierarchy of the product is decomposed according to the above functions, as shown in Figure 13. - (3)
- Requirement Feature WordsSince the audience range of the product is relatively fixed, and the construction of terms used in the seeding monomer has not formed a norm, the construction process of the dictionary of requirement feature words is constructed jointly by designers and sales personnel. Due to the small number of requirement texts, this paper adopts artificial word separation to analyze the texts. Only some requirement feature words are provided in Appendix C for demonstration.The text analysis and processing of user requirements performed in the stage of constructing the product concept system have already clarified the functional hierarchy of the technical system and the product keywords, and the extraction of feature relationships can be realized by directly calculating the co-occurrence of the feature words during the relationship extraction. The relationship of feature words is shown in Appendix D.
- (4)
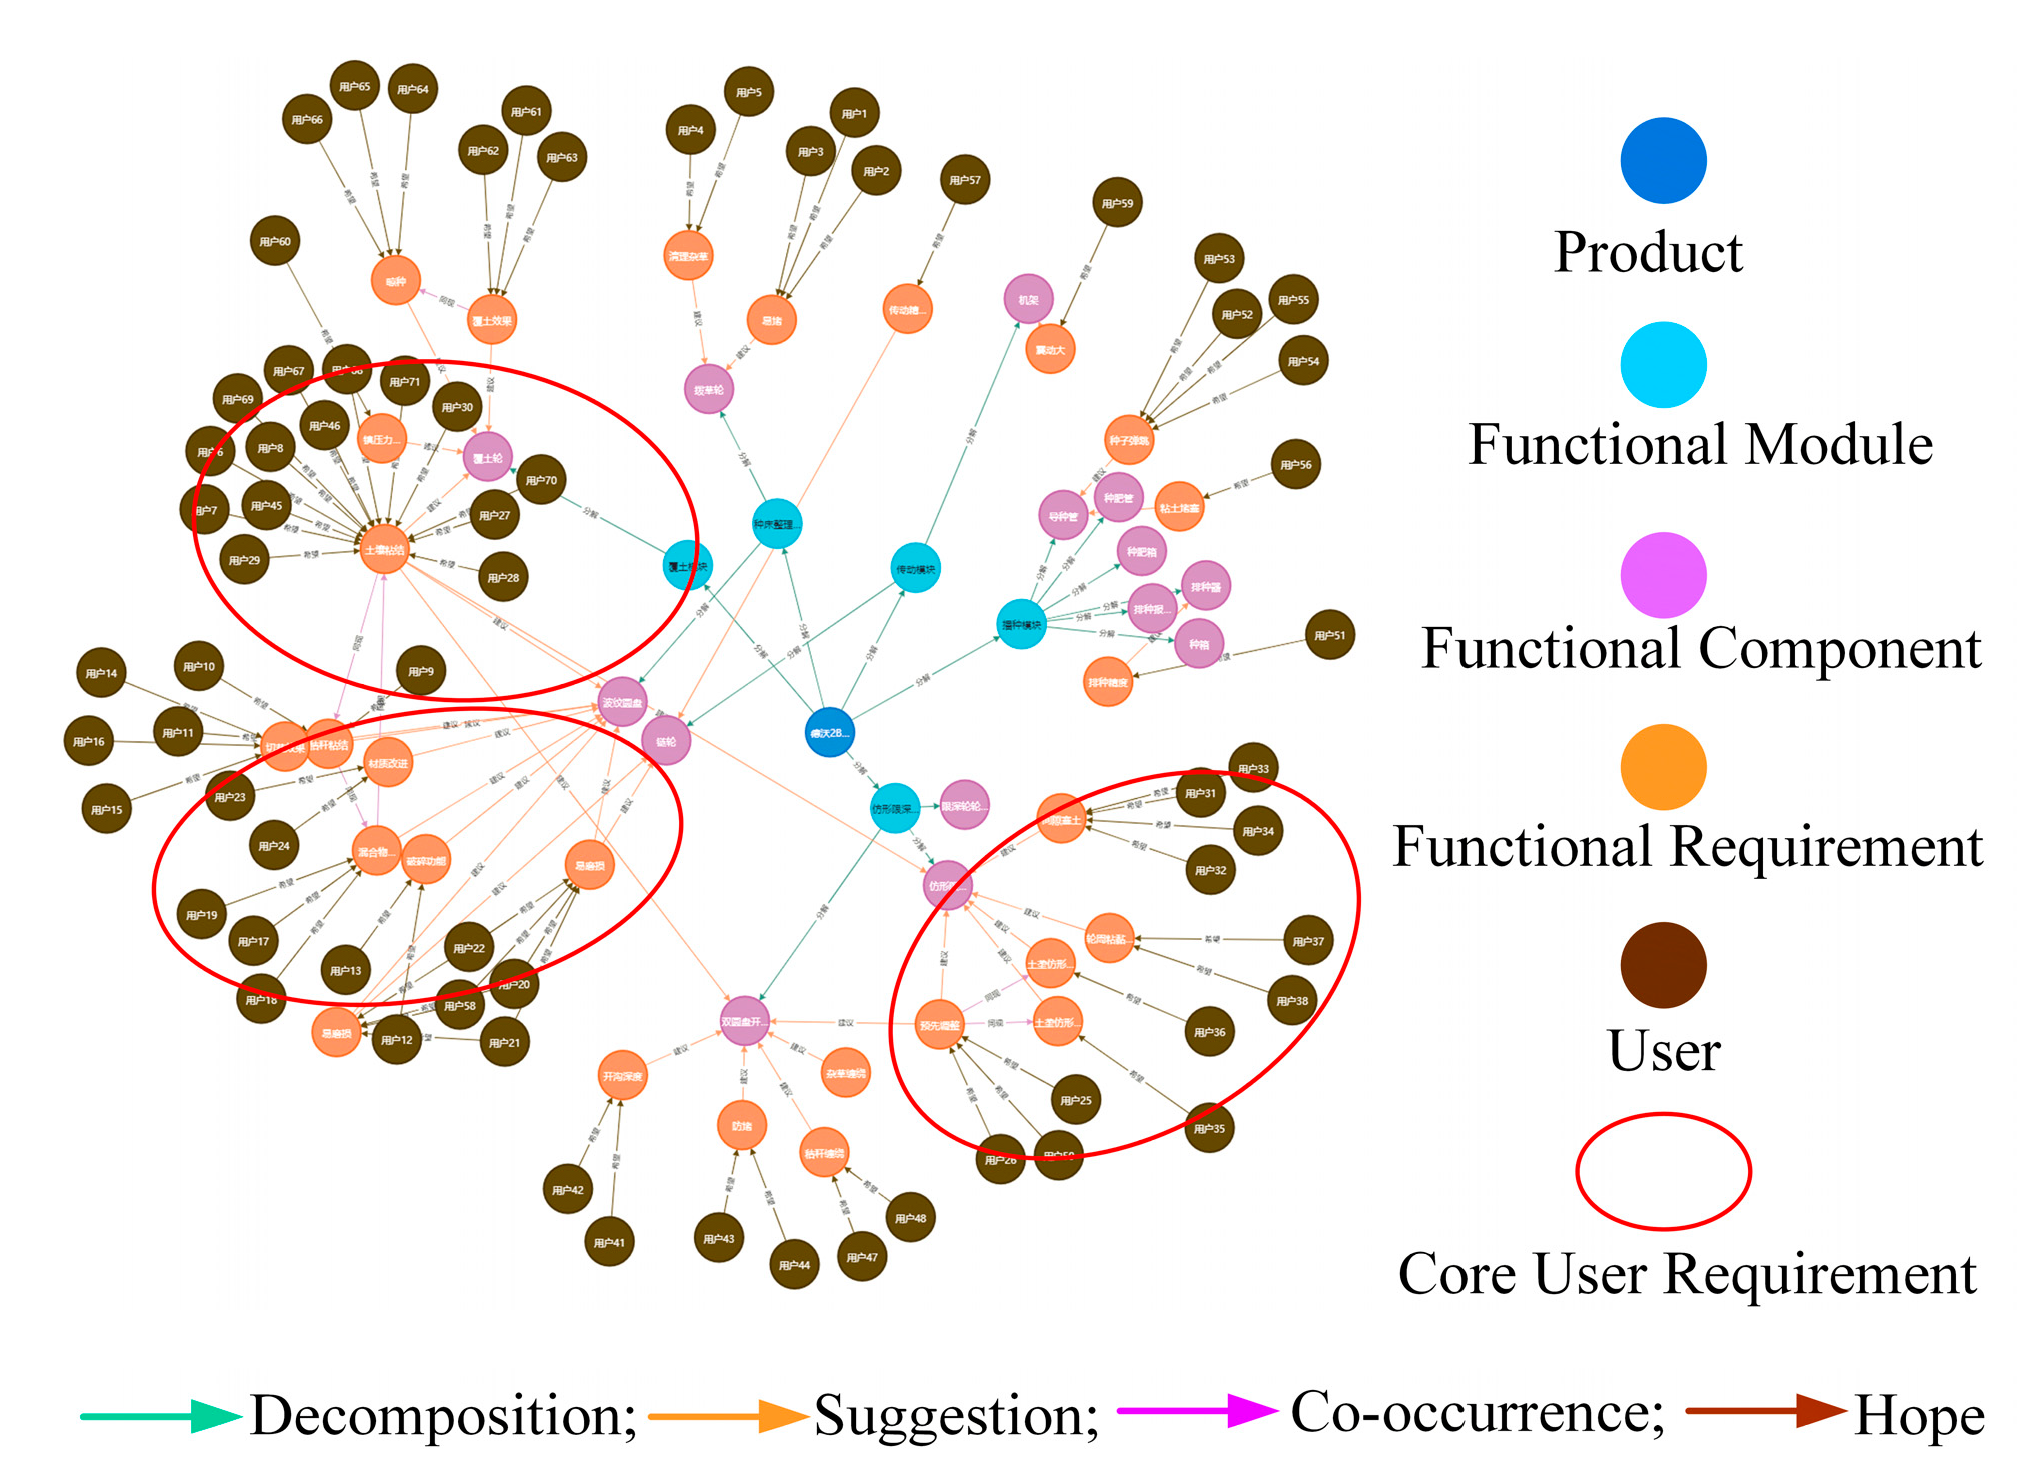
- Construction and Analysis of User Requirements Knowledge GraphBy bulk importing the above data in Neo4j software, the user requirements knowledge graph is established (see Figure 14). The betweenness centrality based on social network analysis identifies the functional components of the product that may have functional defects as well as the direction of functional improvement from the perspective of the users as a whole. Through the betweenness centrality analysis, it is concluded that the main focus should be on the improvement and innovation design of components such as the corrugated disc, the profiling depth-limiting wheel, soil-covering wheel.
5.3. Innovation Design of Digital Twin Combined with Flow Function Analysis
- (1)
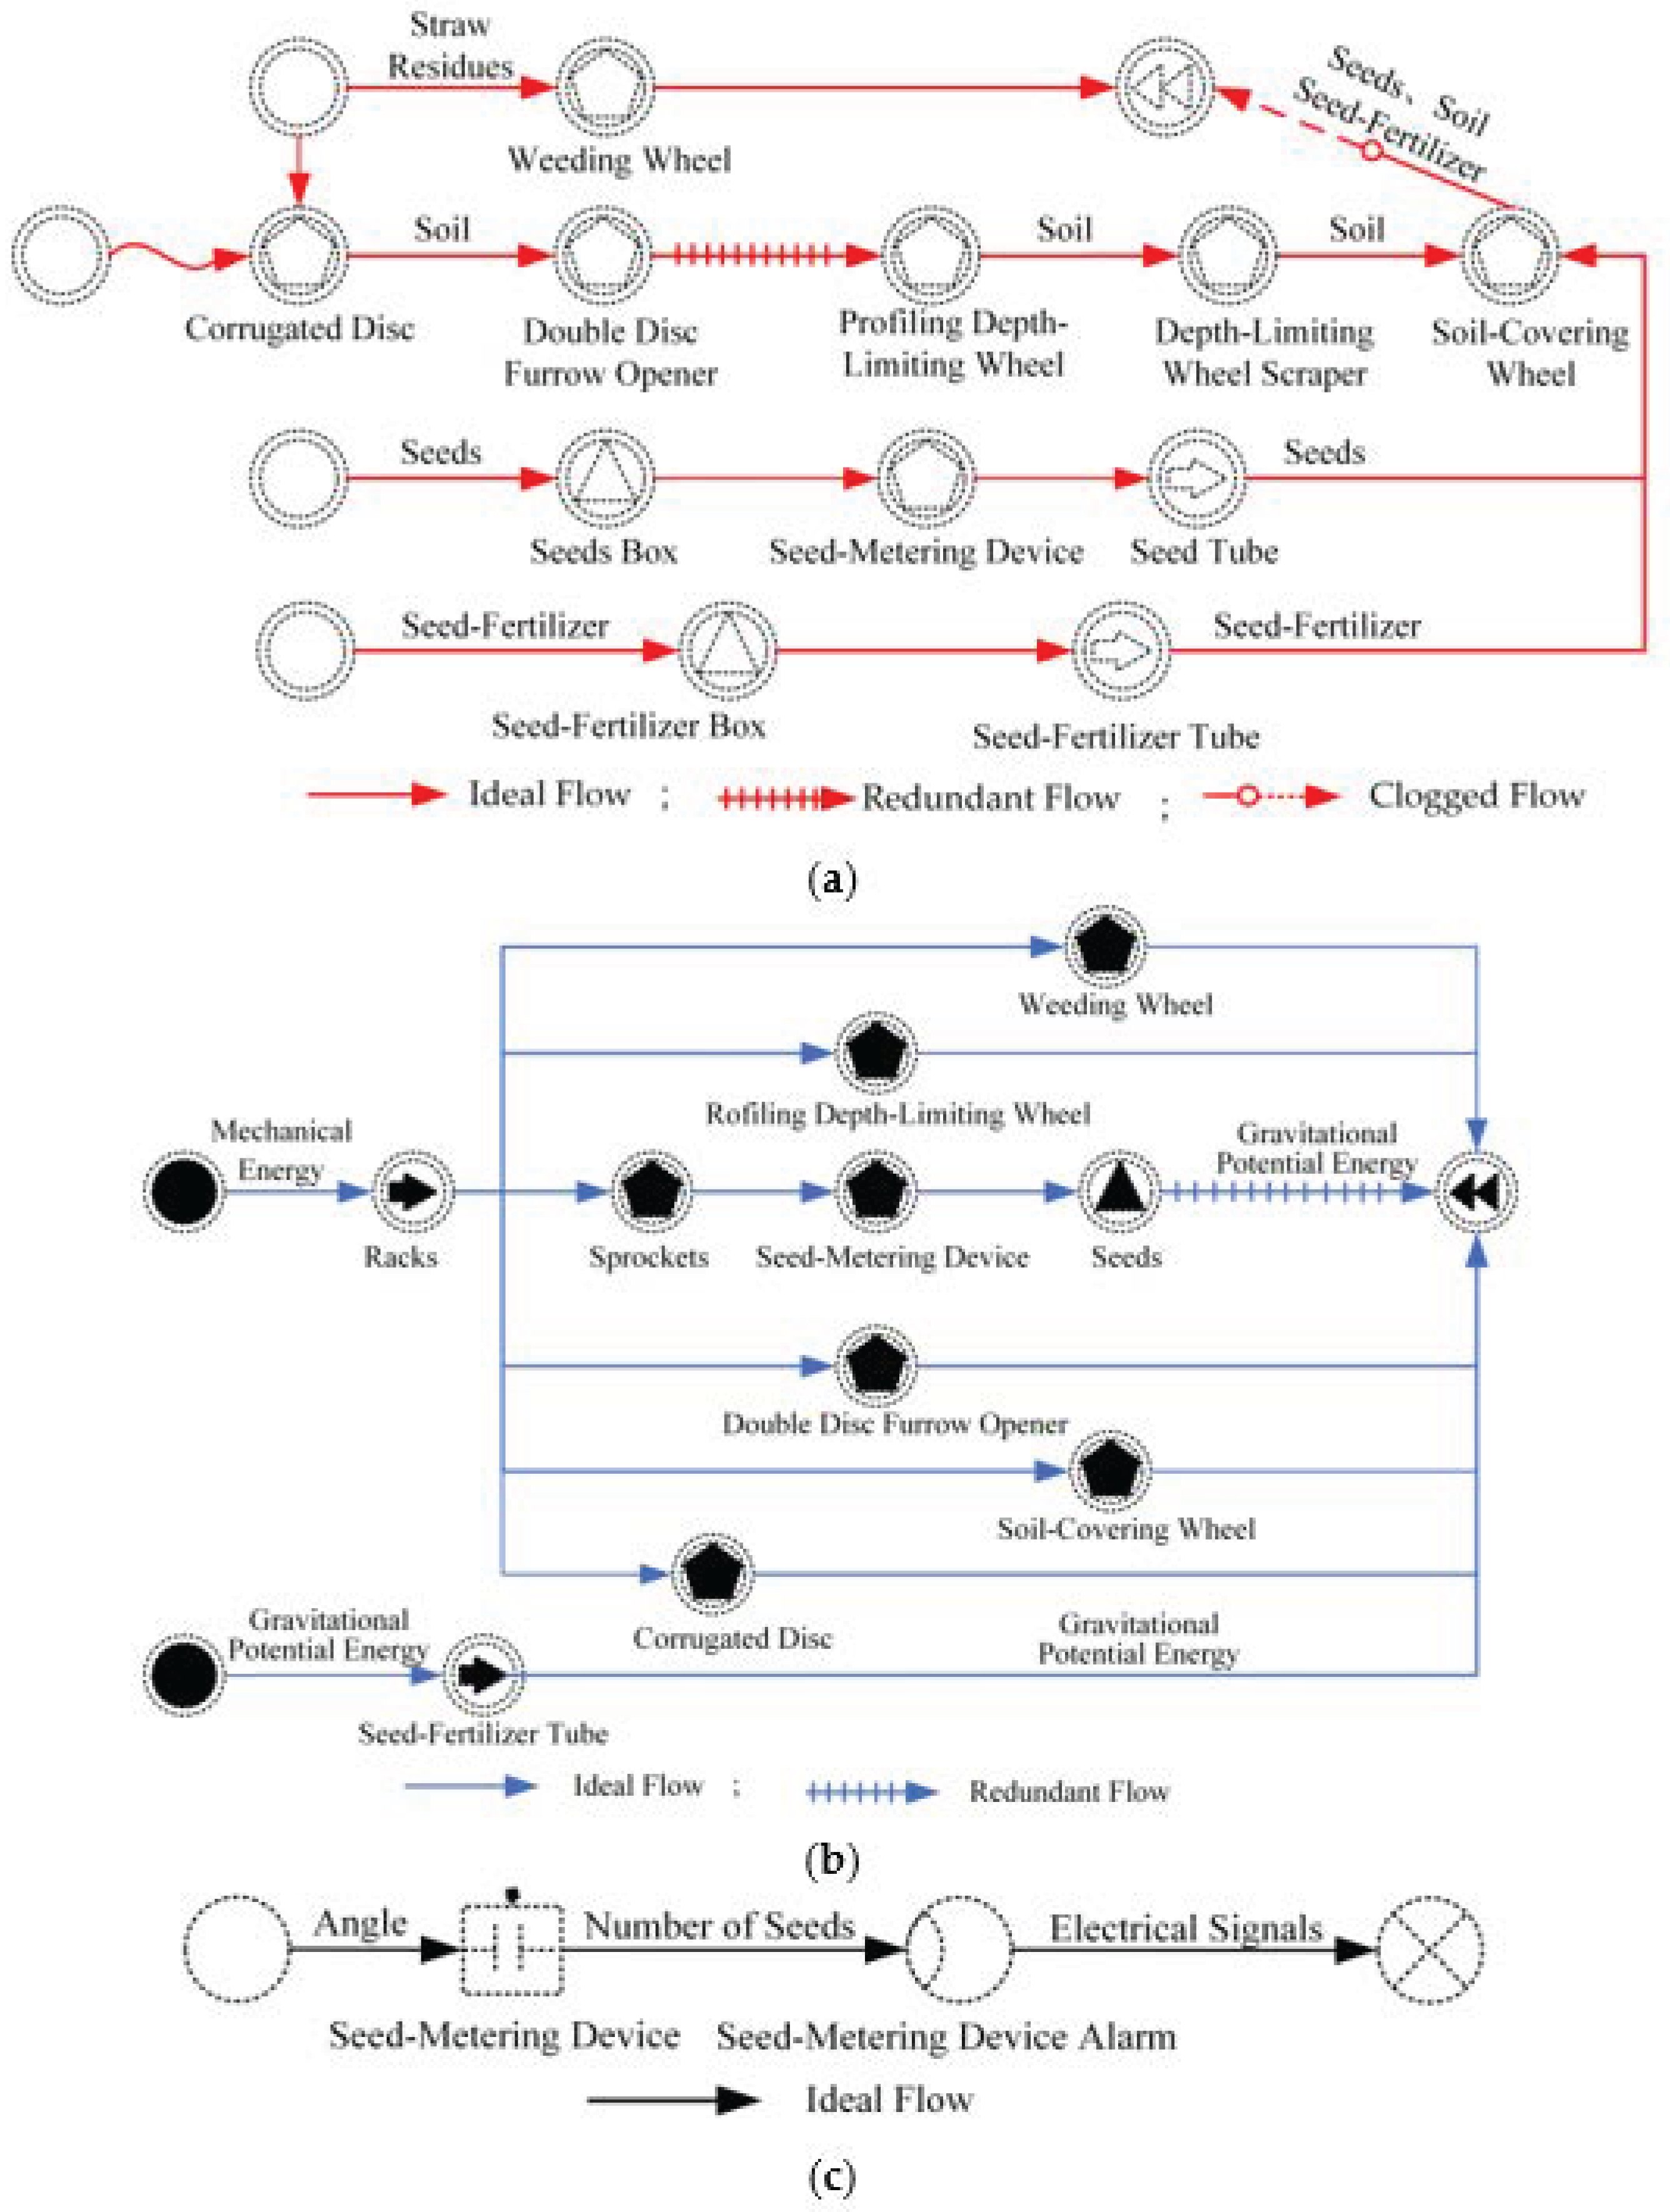
- PPE AnalysisThe PPE of seeding monomer of the no-tillage maize planter consists of the physical mechanical structure, the flows, and the functions achieved.The material flow is maize seed, seed fertilizer, soil, and straw residues. The sowing of seeds is achieved through changes to all four. The energy flow is the mechanical energy transferred through the racks since the machine is hooked up to the tractor to work. Additionally, the signal flow is the manifestation of the above material and energy flows.Super-system component: soilObject: maize seed, fertilizer, soil, straw residuesFunctional components of product: racks, weeding wheel, corrugated disc, profiling depth-limiting wheel, double-disc furrow opener, depth-limiting wheel scraper, seed box, fertilizer box, sprockets, seed-metering device, seed tube, fertilizer tube, seed-metering alarm, soil-covering wheel.
- (2)
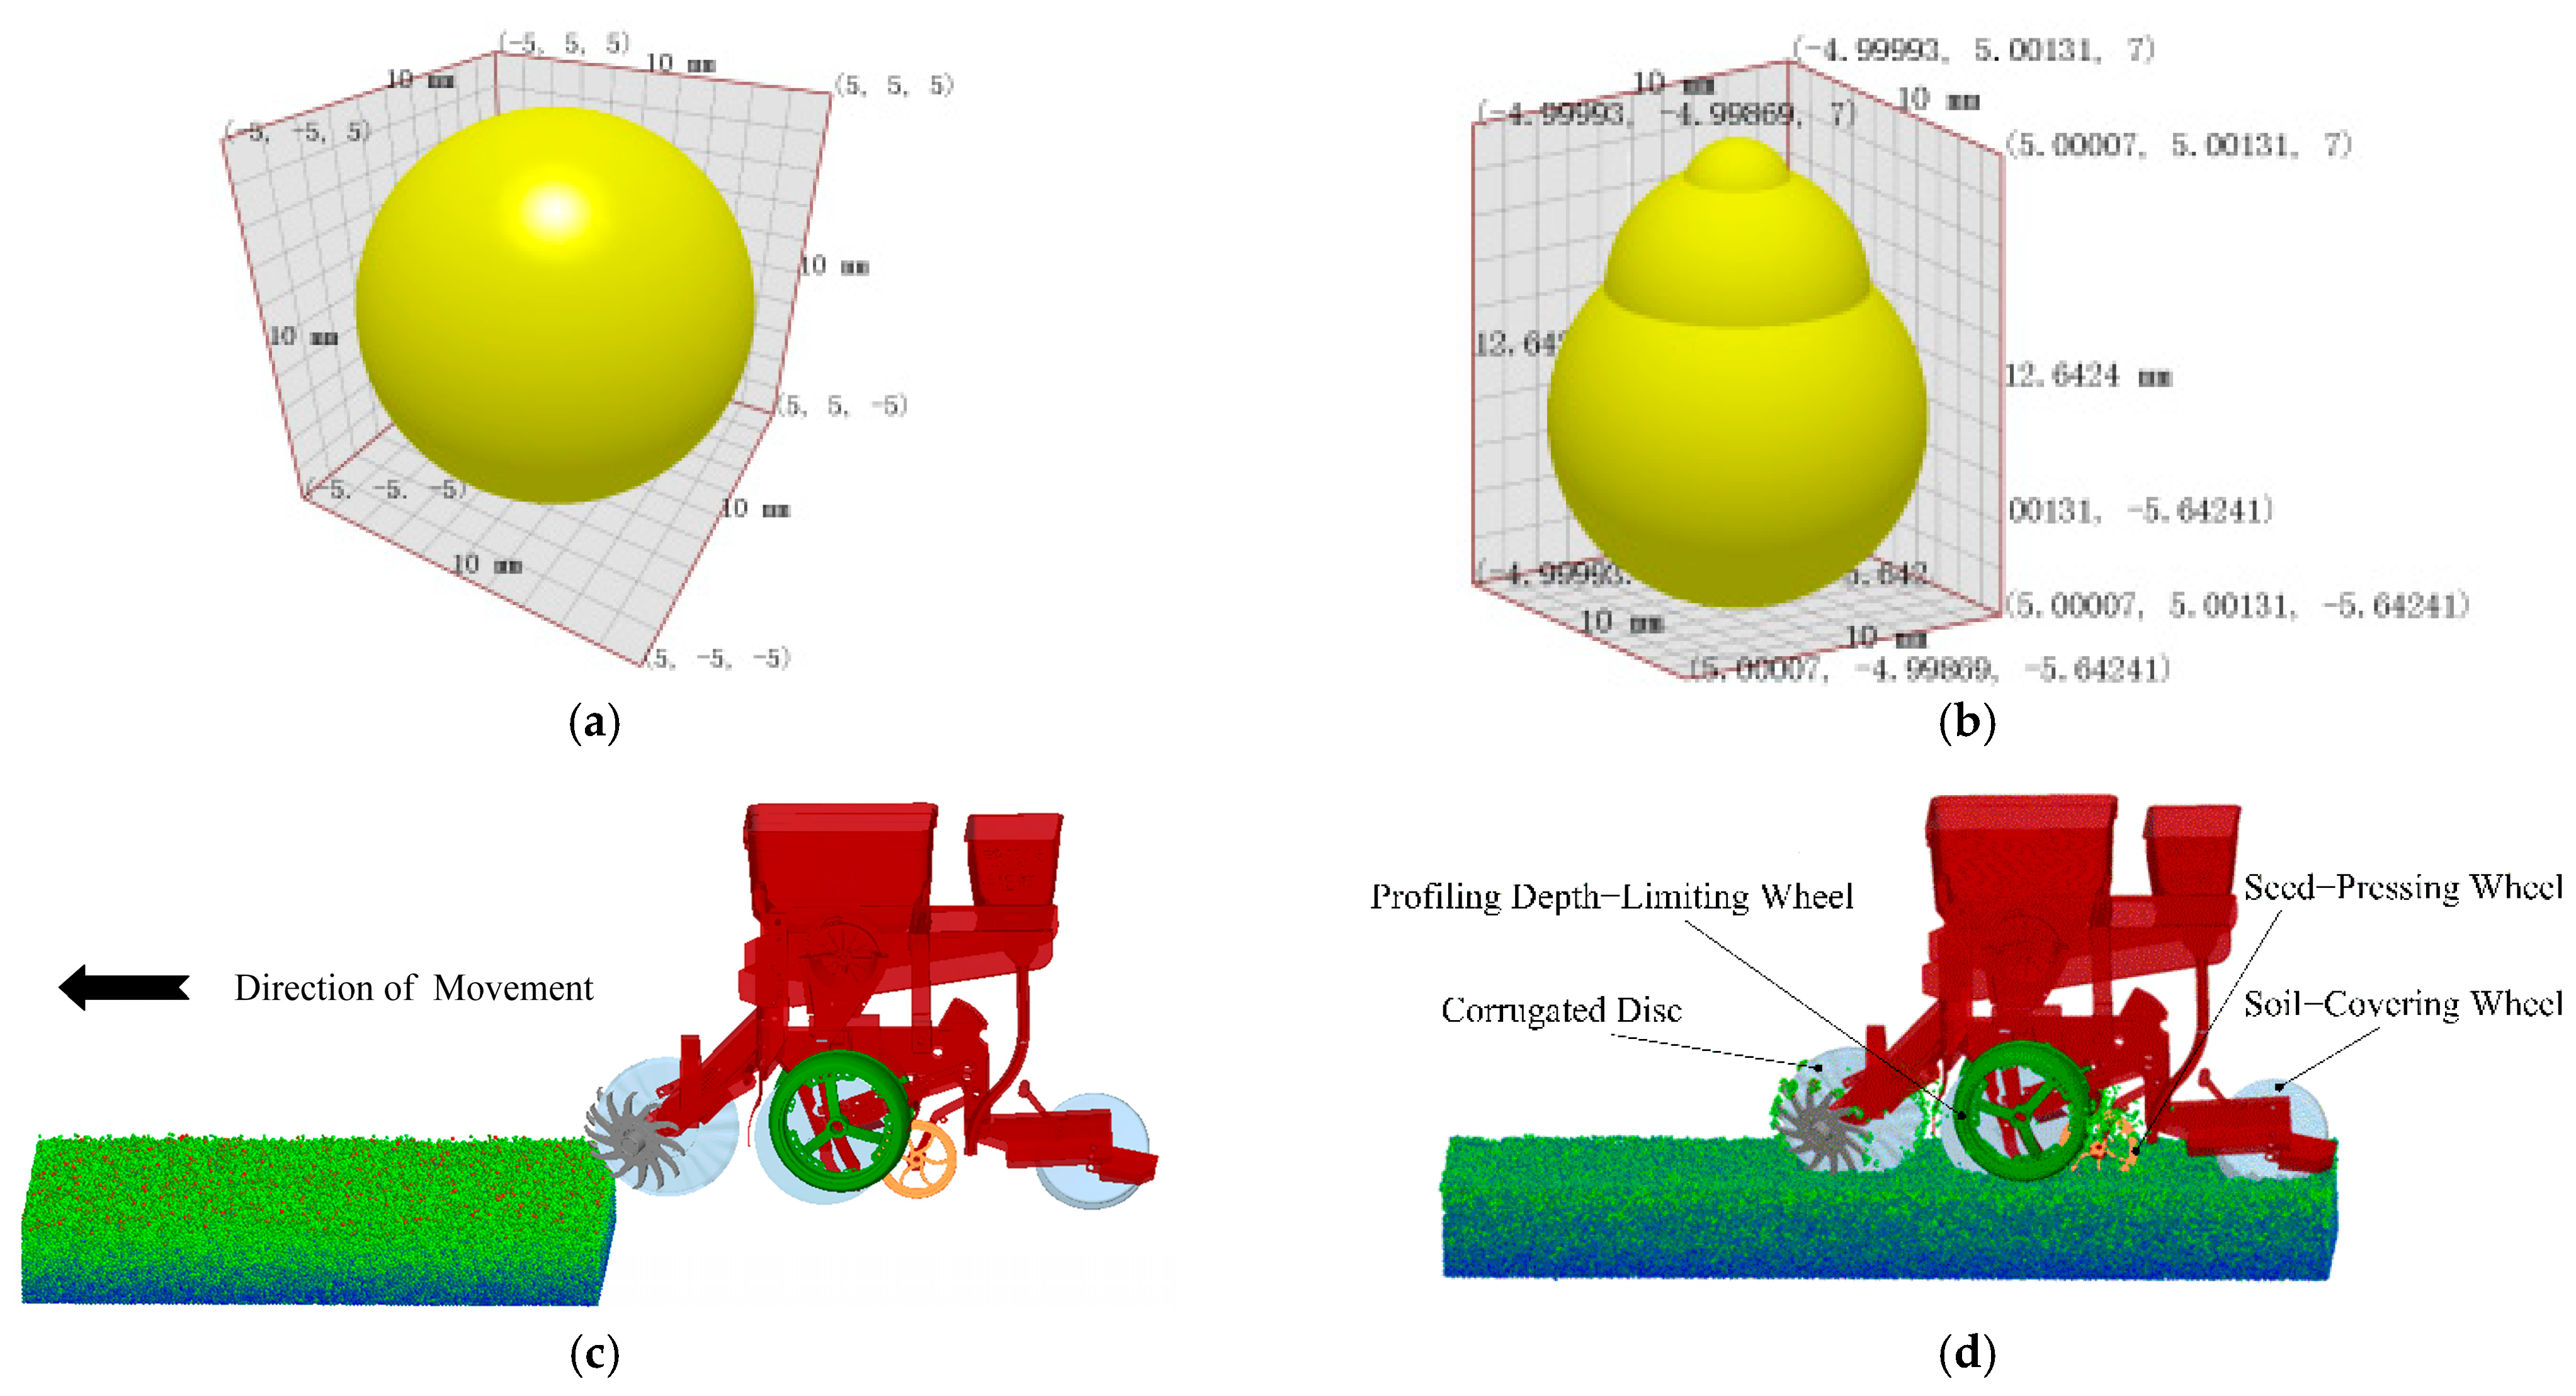
- PVE Flow Function Model Construction and AnalysisPVE is a digital mapping implemented by PPE in virtual space using holographic mapping technology. The mapping process includes functional components, super-system components, three-dimensional flows and its functional behavior of seeding monomer.From the knowledge graph, it can be seen that users mainly focus on the functional improvement and innovation design of components such as corrugated discs, profiling depth-limiting wheels and soil-covering wheels, so the above components should be the main focus in flow function analysis.The seeding monomer works by mixing soil, seed-fertilizer and seeds, and the list of material flow functions is shown in Appendix E.The no-tillage seeding monomer is hooked up to the tractor in the form of traction, and the power is transferred directly to the other devices through the racks. The energy flow function is listed in Appendix F.The no-tillage seeding monomer is a kind of machinery with low automation, and the sensors of the no-tillage seeding monomer are only used to supervise whether the seeding monomer is working properly. The no-tillage seeding monomer usually adopts the form of manual pre-intervention to adjust the seeding monomer to the required working form, etc. This paper focuses on the overall process of the sowing function realization of seeding monomer, so the number of seeds metering during the sowing process is taken as the signal flow, and the list of signal flow functions is shown in Appendix GThe three-dimensional flows function models are constructed separately according to the above table, as shown in Figure 15.
- (3)
- VVE Construction and DT Simulation
- (I)
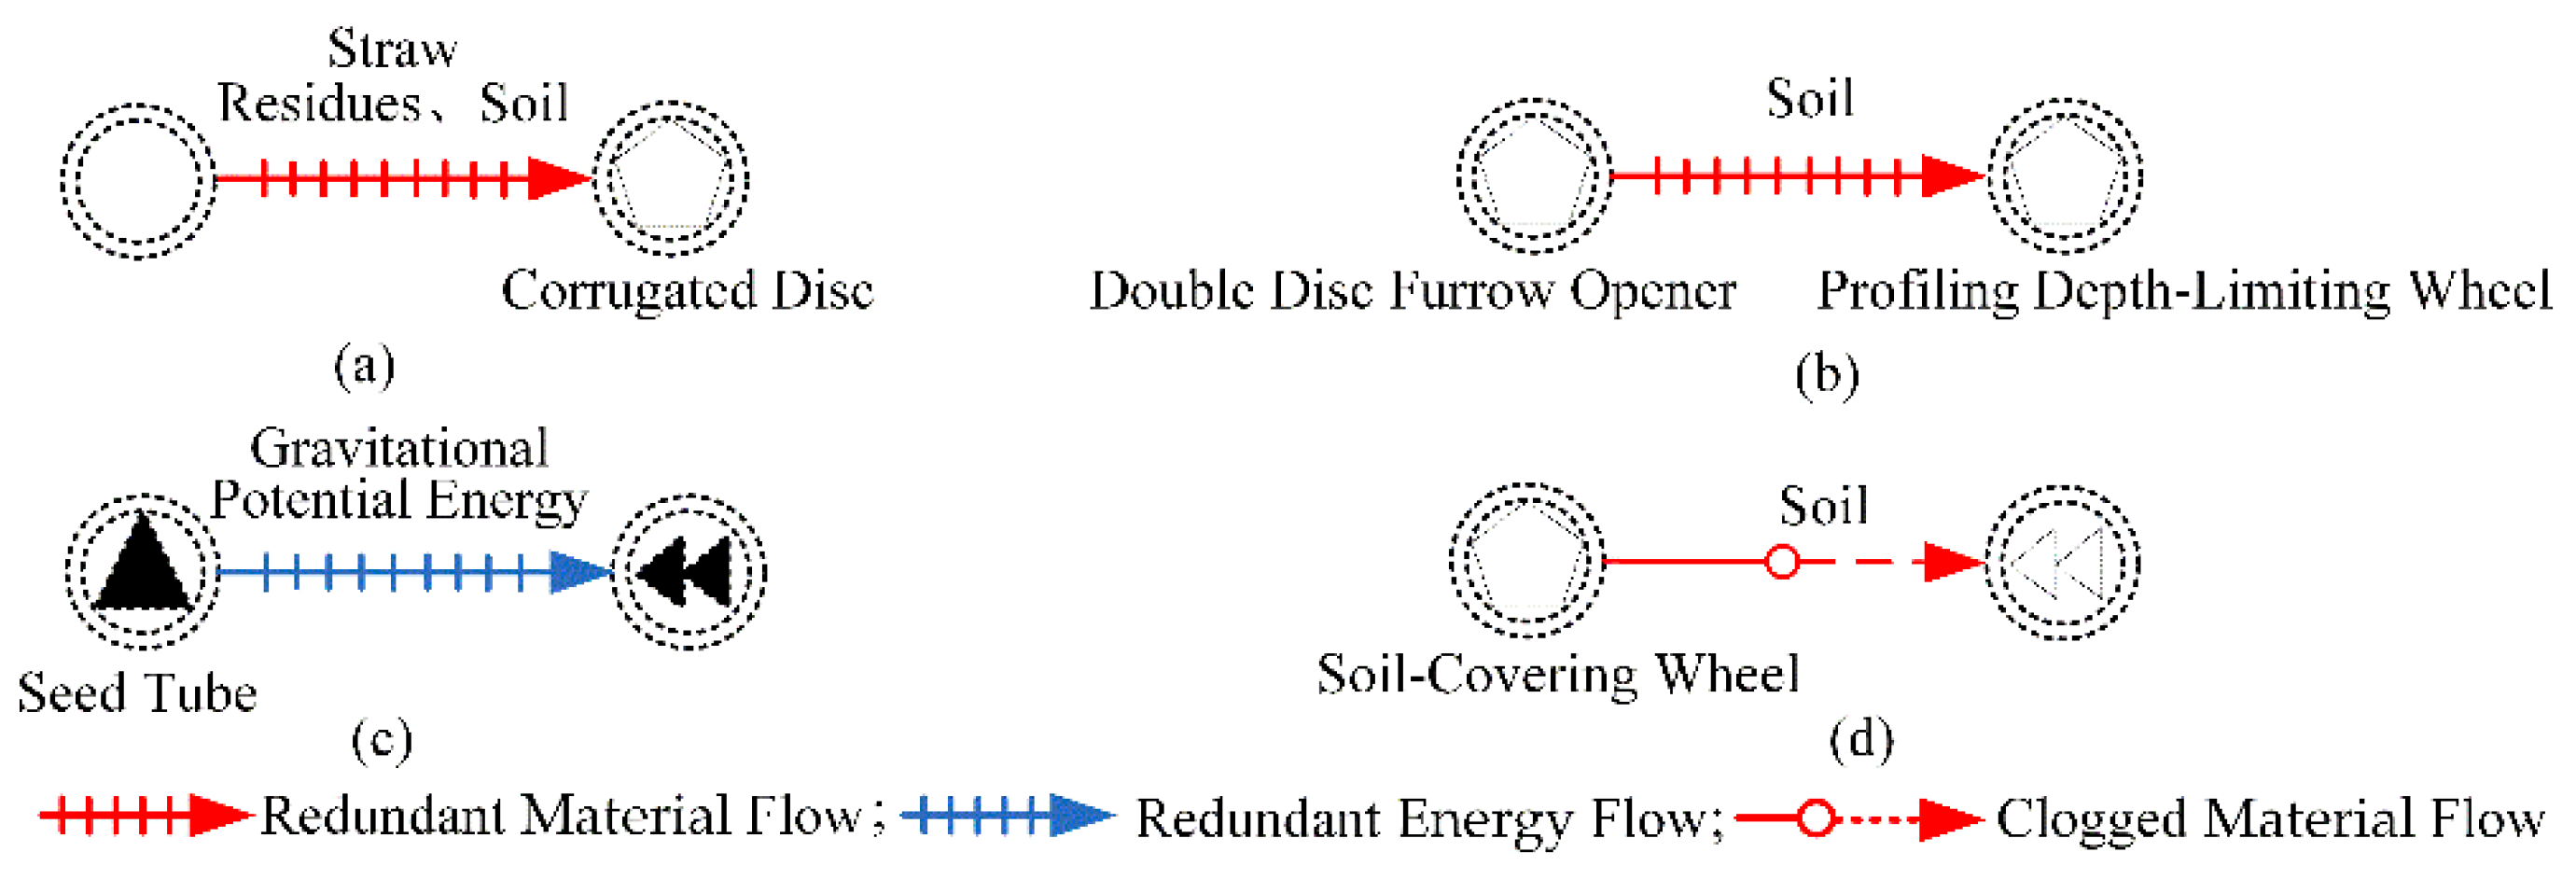
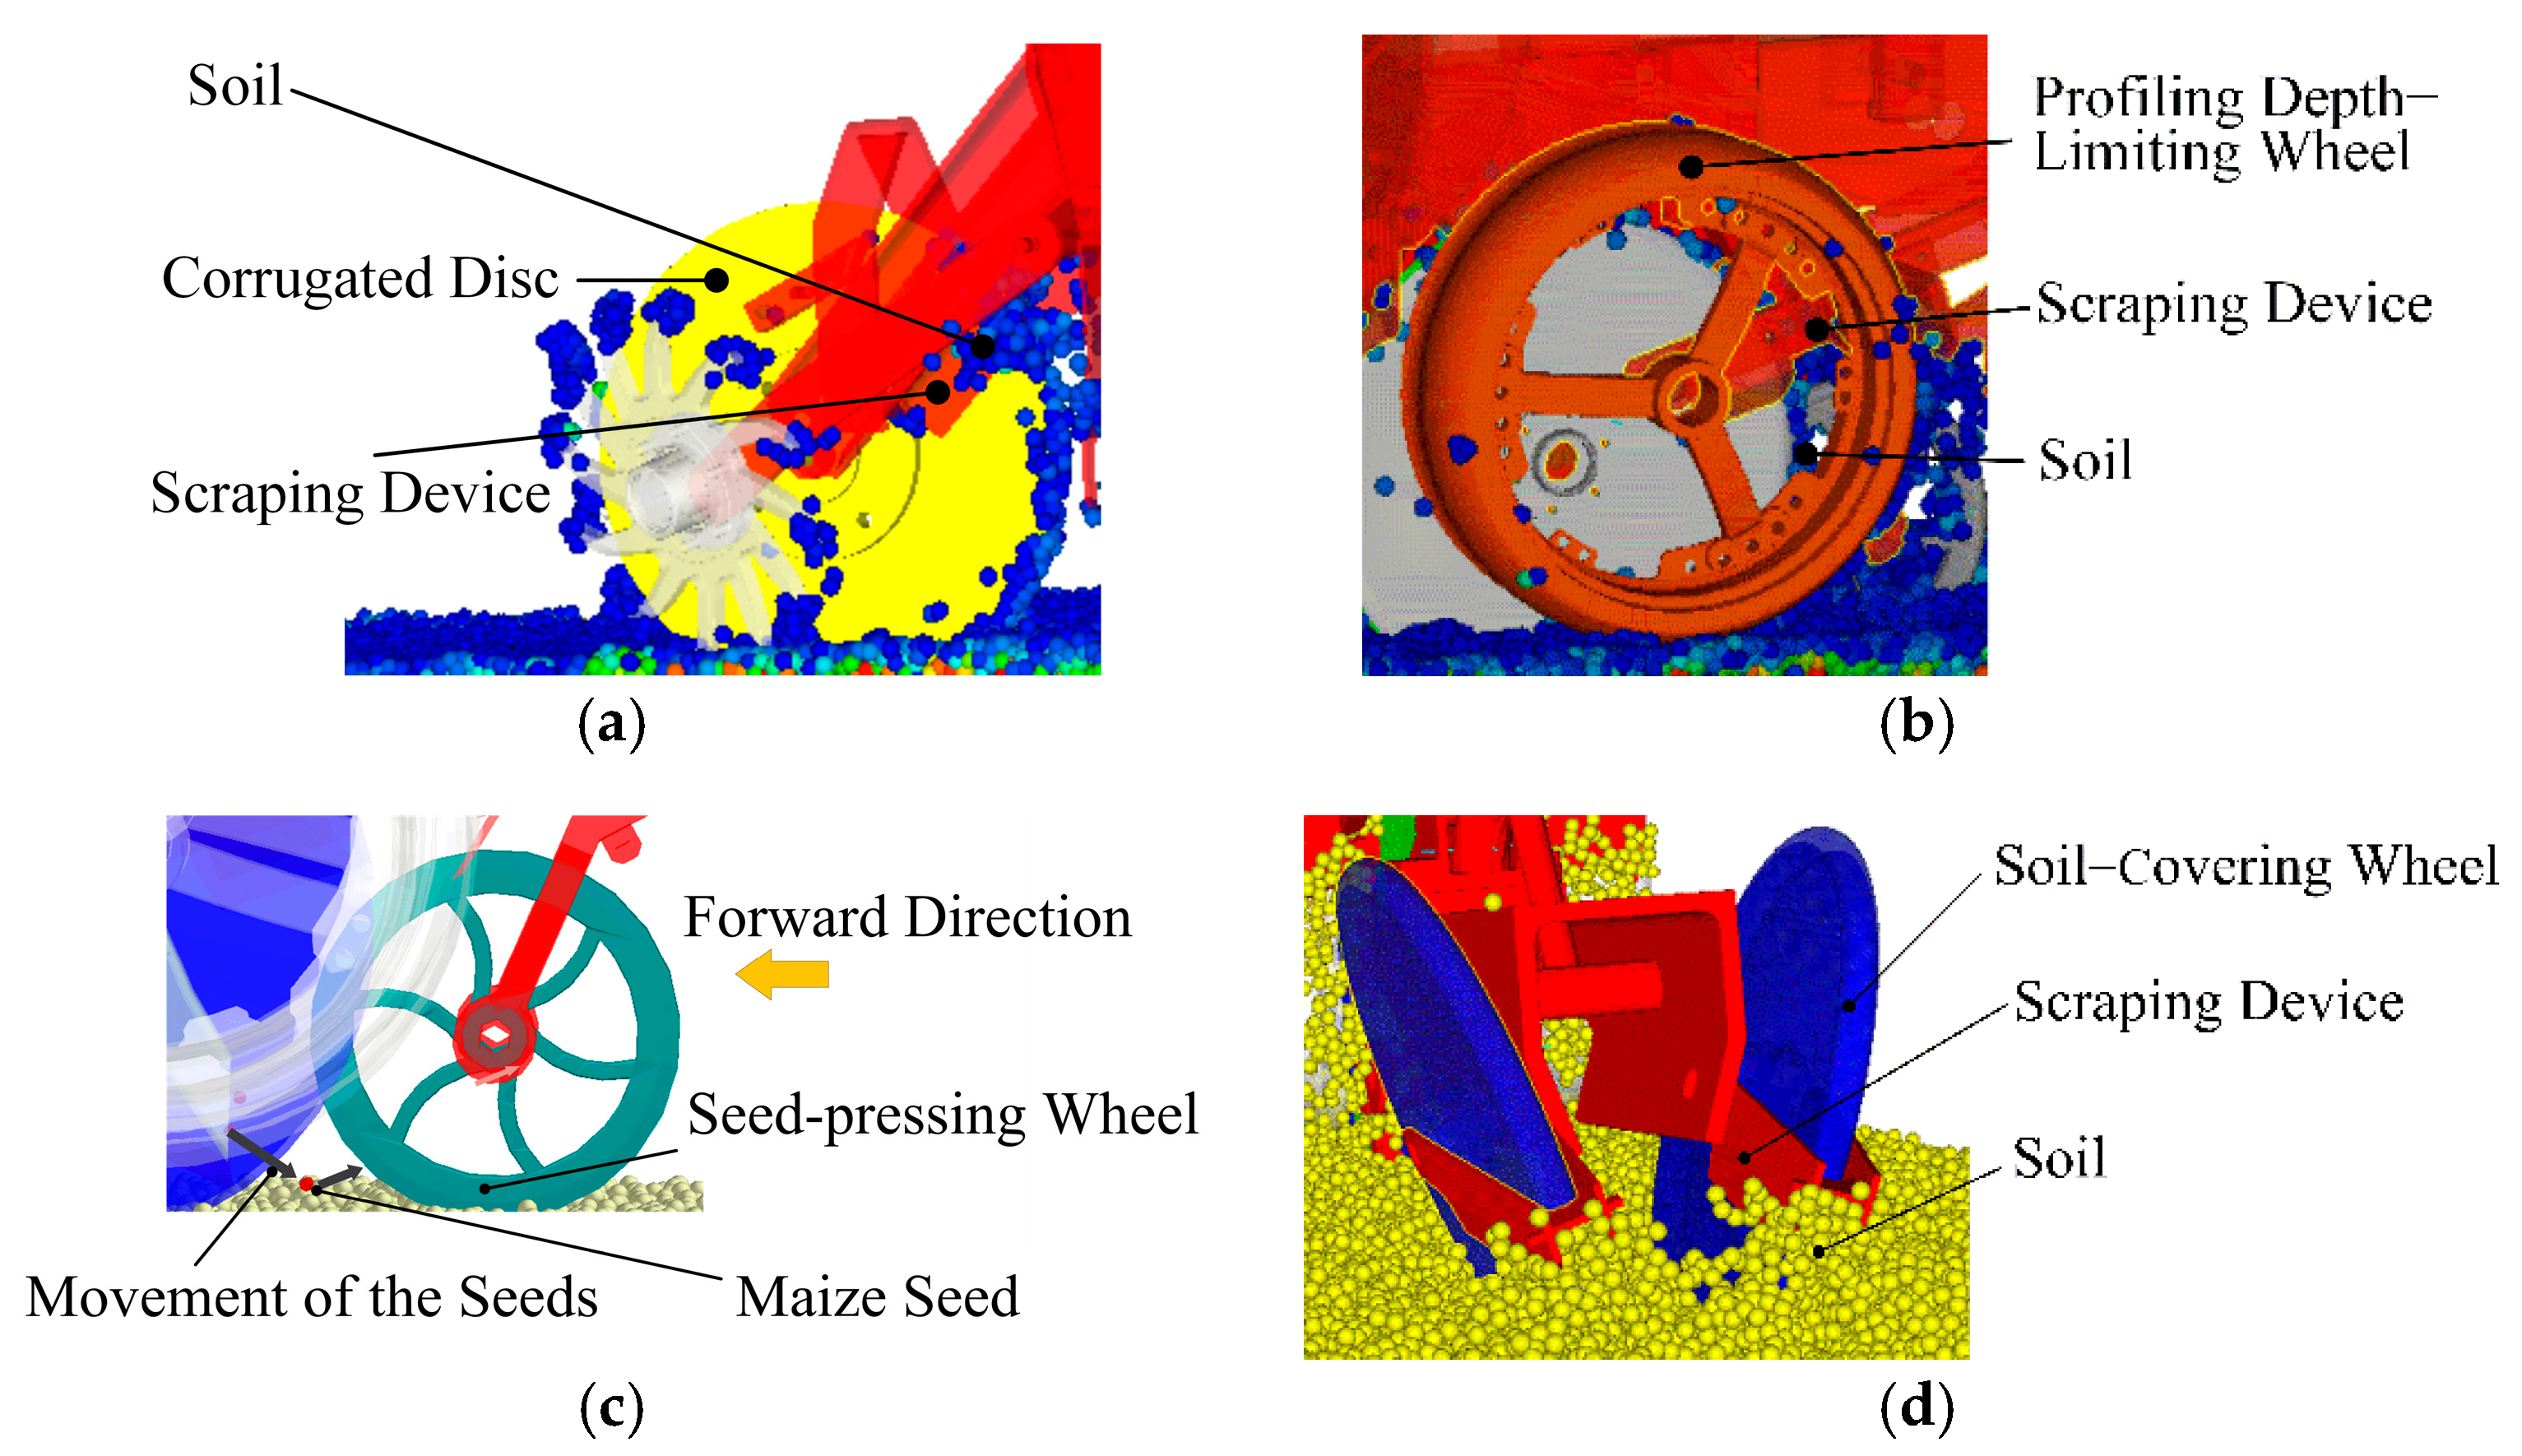
- VVE SolutionBased on the flow function model, four defective flows are identified, as shown in Figure 16.For the redundancy of straw residues or soil to the corrugated disc in Figure 16a, conceptual solution 1 is proposed by applying FE2 to add soil-scraping devices for cleaning soil on both sides of the corrugated disc; conceptual solution 2 is proposed by applying FE3 to change the wave structure of the corrugated disc.For the redundancy of soil inside the profiling depth-limiting wheel in Figure 16b, FE2 is applied to propose conceptual solution 3 to increase the scraping mechanism inside the profiling depth-limiting wheel. FE3 is applied to propose conceptual solution 4 to adjust the position of the double-disc furrow opener and profiling depth-limiting wheel so that the profiling depth-limiting wheel fits on the double-disc furrow opener. FE3 is applied to propose conceptual solution 5 to increase the waist-shaped hole dredge area of the profiling depth-limiting wheel.For the redundancy of the seeds energy in the process of falling on the soil in Figure 16c, FE2 is applied to propose a conceptual solution 6 to add a seed-pressing wheel behind the seed tube.For the problem of insufficient soil coverage in the soil-covering wheel in Figure 16d, FE7 is applied to propose conceptual solution 7, where a scraper is installed around the soil-covering wheel and soil-separation point.The above conceptual schemes are visualized by SolidWorks 3D modeling software in virtual space. Additionally, since conceptual scheme 3 does not produce substantial structural changes, it is not visually modeled here, as shown in Figure 17.
- (II)
- Evaluation of Conceptual SolutionsAccording to the above conceptual solutions, the possible permutations and combinations are constructed, as shown in Equation (5).This manuscript randomly surveyed 10 user samples.
- Step 1. Determine the comment set .
- Step 2. An evaluation set is established and scored from the user’s perspective to sift through the virtual entity sets of the above requirements. The innovative design of the seeding unit is intended to improve the problems of the product, such as work failure by the sticky wet soil, seeds bouncing, seeds drying, which is also a direction that users are concerned about. Therefore, the quality of seeding, durability of structure, and stability of operation are selected as evaluation factors to establish an evaluation factor set.
- Step 3. Determine the set of weight vectors for the set of evaluation factors .where , and , denote the weight coefficients of the evaluation factors.
- Step 4. Determine the evaluation matrix. The evaluation of a single factor yields a single factor evaluation matrix .
- Step 5. Calculate the comprehensive evaluation matrixwhere .
Inputting into the above equations comes to the following conclusion:The evaluation matrix directly shows that VVE 6 (i.e., the combination of options 2, 5, 6, and 7) in the vision entity set is more popular among the surveyed users. Compared with the prototype physical product, the shape parameters of the corrugated disc are changed in the seedbed-collating module of VVE 6 (peak height 9 mm, width 27 mm, and the angle between the corrugated peak surface and the horizontal plane is 34°), and the corrugated disc scraping mechanism is added. In addition, the dredge area of the waist hole of the depth-limiting wheel is increased, the seed-pressing wheel is added to the rear end of the seed tube, and scrapers are added around the soil-covering wheel. - (III)
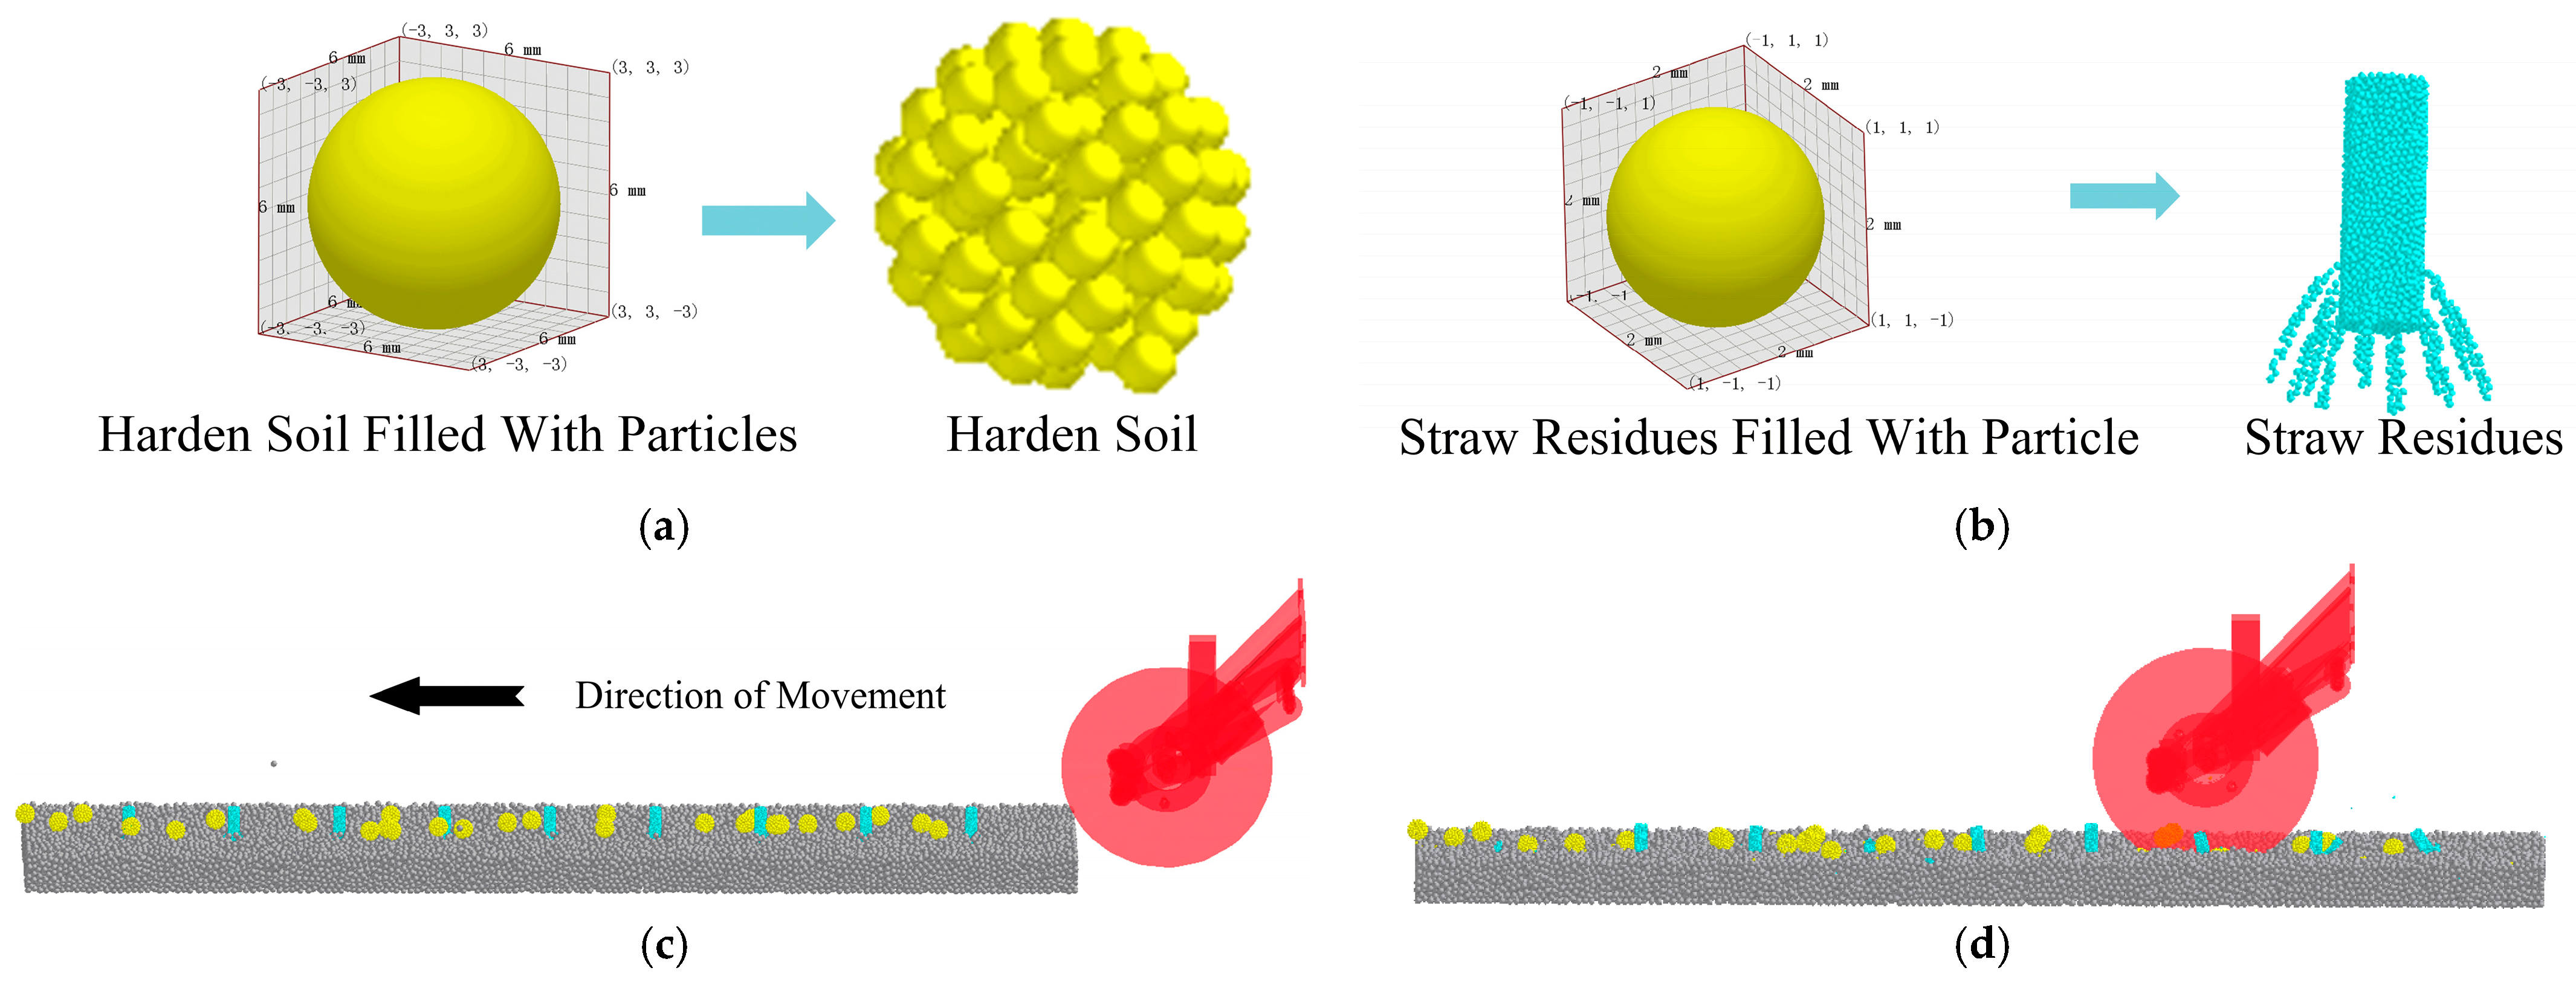
- VVE Simulation and RehearsalThe vision virtual seeding monomer is constructed in the virtual space for simulation and rehearsal. The service environment of the seeding monomer is sticky wet no-tillage black soil. Based on the collected soil data and the improved seeding monomer scheme, the modeling and rendering of VVE is realized in Cinema 4D (see Figure 18).The simulation and rehearsal of the VVE in the virtual environment are mainly reflected in the adaptation of the structure of the improved part to the parameters of the working environment. The discrete element method enables discrete element modeling of the sticky wet soil environment, seeds, etc., and achieves simulation verification combined with the seeding monomer. Based on the discrete element method, this paper carries out functional simulation of the vision virtual seeding monomer, focusing on the anti-sticky performance of the seeding monomer and the bouncing situation during seed sowing. At the same time, the innovative corrugated discs need to be verified for their crushing effect on sticky wet soil and straw residues. According to the above analysis, this part of the simulation is divided into two parts by combining the actual working principles of the seeding monomer.In the first part, based on EDEM and combined with the actual sowing environment and requirements, relevant parameters are set to realize the simulation of the anti-sticky performance of seeding monomer under the condition of sticky wet soil and the bouncing situation of the seeds during sowing, as shown in Figure 19. In this part, two types of particles, soil (see Figure 19a) and maize seed (see Figure 19b) are constructed. Since soil particles are small in the real world, to simplify the difficulty of simulation and rehearsal in the virtual space, a 5 mm sphere particle with a density of , Poisson’s ratio of 0.41 and a shear modulus of is chosen as an approximate substitute. Similarly, maize seed particles are approximately constructed with three-sphere filling accuracy, with a density of 1200 kg/m3, Poisson’s ratio of 0.4, and a shear modulus of . Additionally, the equipment-related parameters are all derived from the real seeding monomers in the physical world.The parameter results of the DT model for the improved seeding monomer in virtual space are shown in Figure 19c. The establishment processes of the DT simulation model are as follows. The maize seeds are generated by the particle factory set in the seed box and fall into the soil through the seed tube of the seed-metering device. The soil particles are generated by the particle factory and stacked to realize the construction of the soil particle bed, which is the functional object of the seeding monomer to realize the sowing function. The same motion constraints as in the physical environment are imposed on the seeding monomer, which is expected to be represented as a real mapping of physical entities in virtual space. The operation process of the digital twin of the seeding monomer in virtual space is shown in Figure 19d.Figure 20 is the working state diagram of the seeding monomer DT in virtual space after the improvement of simulation and rehearsal, where the overall constraints of the seeding monomer DT is consistent with those in the real world [67] and the forward speed is 8 km/h. The working condition of each improved device in the virtual sticky wet soil environment can be clearly seen from Figure 20.In Figure 19, the soil adhesion on the surface of the corrugated disc is lighter after the corrugated shape structure is improved (see Figure 20a), and the clay stuck on the improved corrugated disc can be removed by the additional scraping device. The soil stuck on the inner side of the depth-limiting wheel is lighter after the waist hole form of the depth-limiting wheel is improved (see Figure 20b), and the stuck soil is scraped off when passing through the additional scraping device on the inner side of the depth-limiting wheel. After the seeds are discharged from the seed-metering device, they free fall into the soil through the seed tube, and some of the seeds are pressed into the soil through the additional seed-pressing wheel (see Figure 20c). When the soil-covering wheel is covering the soil, the bonded soil falls back to the ground through the scrapers set around the wheel (see Figure 20d).In the second part, based on EDEM, related parameters of discrete elements are set in combination with no-tillage seeding environment and requirements to realize the crushing simulation of soil and straw residues by corrugated discs of seeding monomer, as shown in Figure 21. The parameters of the soil particle bed are set in the first part, and hardened soil is quickly replaced by small soil particles and the bond key between particles is established to realize the simulation (see Figure 21a). Straw residues are filled with pre-constructed straw residue particles and the bond key between particles is established to realize the simulation (see Figure 21b). Therefore, a total of three types of ordinary soil particles, hardened soil particles, and straw residue particles need to be constructed in this part. The density of small soil particles is 2100 kg/m3, Poisson’s ratio is 0.41, and shear modulus is . The density of straw residue particles is 110 kg/m3, Poisson’s ratio is 0.33, and shear modulus is . The equipment-related parameters are all derived from the real seeding monomers in the physical world. The parameter results of the DT model for the seedbed-collating module in virtual space are shown in Figure 21c. The establishment processes of the DT simulation model are as follows. After the construction of the soil particle bed, straw residues and hardened soil is realized by using the particle factory, constraints are added with reference to the motion process of this functional module in the physical world. The operation process of the DT in the virtual space is shown in Figure 21d.Figure 22 shows the working state of the improved corrugated disc after simulation and rehearsal, the overall structure of the seeding monomer in the simulation process is consistent with that in the real world, and the forward speed is 8 km/h. It can be seen from Figure 22 that the improved corrugated disc still has a good crushing effect on the soil and straw, and the change of the corrugated shape does not affect the crushing function of the mechanism.
- (4)
- VPE Construction and TransformationThe VVE determined after the evaluation is mapped and transformed to VPE, including detailed design, process design, parts processing, product assembly, production debugging, etc. The redesigned VPE of the seeding unit is shown in Figure 23.
- (5)
- Field Experiment VerificationUsers test the vision physical seeding monomer on an experimental field in Harbin Pingfang District in June 2022. The field test shows that: compared with the original model, the amount of residual clay in the seedbed-collating device, depth-limiting device and soil-covering device decrease by 57.5%, 10% and 26.2%, respectively, and the number of seeds bouncing decreases by 65%.Compared with the prototype seeding monomer, the designed no-tillage seeding monomer achieves functional optimization with minimum cost and solves the problems of the no-tillage seeding monomer such as work failure caused by sticky soil of the corrugated disc and profiling depth-limiting wheel, seed bouncing in the process of seed-tube sowing, and seed drying caused by soil adhesion during soil-covering wheel operating. After virtual simulation and actual sowing verification in the physical world, the VPE meets the agronomic requirements, and the innovatively designed no-tillage sowing monomer is transformed into a new type.
6. Conclusions and Prospect
- (1)
- To begin with, the products are finely decomposed according to the functional structure. The knowledge graph of user requirements is subsequently constructed based on mapping the relationship between user requirements and product functional components. Moreover, the social network analysis of the knowledge graph is carried out to obtain the direction of the product innovation design. Through the real-time participation and guidance of user requirements in the product design process, the alignment between product development solutions and user functional requirements is improved.
- (2)
- In addition, the PPE-PVE-VVE-VPE digital twin innovation design model is constructed. Additionally, interactive iteration between the physical entity and the virtual entity is demonstrated as a specific process. The process enhances the applicability of the digital twin in product design.
- (3)
- This paper proposes a product innovation design process based on a user requirements knowledge graph, combining the advantages of virtual-real synthesis of digital twin as well as the dynamic and temporal properties of flow function analysis. Effectively, the process solves the problems of lack of specific methods and path guidance in digital twin product design, and the problem of low user participation. At the same time, it provides new ideas and methods for product innovation design.
Author Contributions
Funding
Institutional Review Board Statement
Informed Consent Statement
Data Availability Statement
Conflicts of Interest
Appendix A. Flow Evolution Path
| Flow Evolution Path |
| FE1 introduces new flows. To introduce material flow/energy flow/signal flow into the system or super-system FE2 introduces new channels. To transfer the flow within the system to the supersystem, or to reallocate the flow path through the bypass channel within the system. FE3 changes flow properties. To change the potential, resistance, and other attributes of the flow to improve the liquidity. FE4 improves flow channels. To enhance the properties of flow channel or to clear problem regions to enhance liquidity. FE5 recycling flow. To utilize recyclable materials, energy, information, and other resources. FE6 recycling flow. To cut unnecessary defect flow or harmful flow. FE7 reduces flow conversion. To remove intermediate links and reduce the number of flow conversions and transmission levels. FE8 cut-off flow channel. To cut damaged and unnecessary flow channels FE9 parasitic flow. To attach one flow to another for synergy. |
Appendix B. Interview and Questionnaire Data Collection Cards
| Product technical parameters | Transmission form: rack using hook-up traction, seed-metering device using chain drive Seed-metering device form: finger-clip type Weeding form: bilateral involute gear type Loose soil stubble form: corrugated disc Sowing and furrowing form: double disc Profiling form: double side widened rubber wheel Soil-covering form: V-shaped opposed rubber wheel Functions of alarm: alarm when missing sowing, and count grain numbers Sowing depth (mm): 10–75 Adjustment range of plant spacing (mm): 70–410 | |||||||
| Users are asked to answer the following questions based on real-life situations you have encountered during the operation of the seeding monomer. | ||||||||
| Username | Gender | Interview time | Duration of user operation | |||||
| Contact number | Product number | |||||||
| Very satisfied → Very dissatisfied | ||||||||
| Degree of user satisfaction with the whole machine during the realization of the seeding monomer function | 5☐ 4☐ 3☐ 2☐ 1☐ | |||||||
| Degree of user satisfaction with the components during the realization of the seeding monomer function | 5☐ 4☐ 3☐ 2☐ 1☐ | |||||||
| Year of product purchase | ||||||||
| Place of product use | ||||||||
| Working environment of the product | ||||||||
| Suggestions for the product | ||||||||
| Recommended components for improvement | ||||||||
| Advantages/Disadvantages of our products compared with similar products | ||||||||
Appendix C. List of Feature Words
| Products | Function Modules | Functional Components | Display of Feature Word |
| seeding monomer | profiling depth-limiting module | profiling depth-limiting wheel | pre-adjustment, soil adhesion, gap plugging, soil ridge profiling form, soil ridge profiling height, sticky soil around the wheel |
| Double-disc furrow opener | furrowing depth, anti-blocking, soil adhesion, straw winding, weed winding, pre-regulation | ||
| depth-limiting wheel scraper | clay removal, wheel scraping | ||
| seedbed collating module | weeding wheel | easy to block, weeds cleanup | |
| corrugated discs | soil adhesion, straw adhesion, crushing function, stubble cutting effect, mixture adhesion, easy to wear, material improvement | ||
| seeding module | seed-metering device | seeding accuracy | |
| seed tube | seed bouncing, clay clogging | ||
| transmitting module | sprockets | transmission accuracy, easy to wear | |
| racks | high vibration | ||
| soil-covering module | soil-covering wheel | soil-covering effect, seeds drying |
Appendix D. Result Table of Co-Occurrence Relationship of Feature Words
| Products | Function Modules | Functional Components | Feature Word Pairs |
| seeding monomer | profiling depth-limiting module | profiling depth-limiting wheel | pre-adjustment–soil ridge profiling form pre-adjustment–soil ridge profiling height |
| Double-disc furrow opener | pre-adjustment–furrowing depth | ||
| soil-covering module | soil-covering wheel | soil-covering effect–seeds drying | |
| seedbed collating module | corrugated discs | soil–straw–mixture adhesion |
Appendix E. List of Material Flow Function of No-Tillage Seeding Monomer
| System/Super-System Components | Initial Form of Flow | Function of Flow | Transformed Form of Flow | Category of Flow |
| Weeding wheel | Straw residues | Operation | - | Ideal |
| Corrugated discs | Straw residues, Soil | Operation | - | Harmful |
| Double-disc furrow opener | Soil | Operation | - | Ideal |
| Profiling depth-limiting wheel | Soil | Operation | - | Redundant |
| Depth-limiting wheel scraper | Adhesive soil | Operation | - | Ideal |
| Seed box | Seeds | Storage | - | Ideal |
| Seed-fertilizer box | Seed-fertilizer | Storage | - | Ideal |
| Seed-metering device | Seeds | Operation | - | Ideal |
| Seed tube | Seeds | Transmission | Seeds | Ideal |
| Seed-fertilizer management | Seed-fertilizer | Transmission | Fertilizer | Ideal |
| Soil-covering wheel | Seeds, Seed-fertilizer, Soil | Operation | Seed, Seed-fertilizer, Soil mixture | Clogged |
Appendix F. List of Energy Flow Functions of No-Tillage Seeding Monomer
| System/Super-System Components | Initial Form of Flow | Function of Flow | Transformation Form of Flow | Category of Flow |
| Racks | Mechanical energy | Transmission | - | Ideal |
| Weeding wheel | Mechanical energy | Operation | - | Ideal |
| Corrugated discs | Mechanical energy | Operation | - | Ideal |
| Double-disc furrow opener | Mechanical energy | Operation | - | Ideal |
| Profiling depth-limiting wheel | Mechanical energy | Operation | - | Ideal |
| Sprockets | Mechanical energy | Transmission | - | Ideal |
| Seeding monomer | Mechanical energy | Operation | - | Ideal |
| Seeds, Seed-fertilizer | Mechanical energy | Storage | Gravitational potential energy | Ideal |
| Soil-covering wheel | Mechanical energy | Operation | - | Ideal |
Appendix G. List of Signal Flow Functions of No-Tillage Seeding Monomer
| System/Super-System Components | Initial Form of Flow | Function of Flow | Transformation Form of Flow | Category of Flow |
| Seed-metering device | Angle | Controlling | Number of seeds | Ideal |
| Seed-metering device alarm | Number of seeds | Measurement | Electrical signals | Ideal |
References
- Conte, E.; Gani, R.; Ng, K.M. Design of formulated products: A systematic methodology. Aiche J. 2011, 57, 2431–2449. [Google Scholar] [CrossRef]
- Franke, N.; Schreier, M. Why customers value self-designed products: The importance of process effort and enjoyment. J. Prod. Innovat. Manag. 2010, 27, 1020–1031. [Google Scholar] [CrossRef]
- Sun, H.; Guo, W.; Shao, H.; Rong, B. Dynamical mining of ever-changing user requirements: A product design and improvement perspective. Adv. Eng. Inform. 2020, 46, 101174. [Google Scholar] [CrossRef]
- Sheng, B.; Wang, X.; Xiao, Z.; Shu, Y.; Huang, P.; Deng, L.; Yin, X. Modular product configuration method based on customer requirement analysis. Comput. Integr. Manuf. Syst. 2017, 23, 2091–2100. [Google Scholar]
- Tao, F.; Zhang, H.; Qi, Q.; Xu, J.; Sun, Z.; Hu, T.; Liu, X.; Liu, T.; Guan, J.; Chen, C.; et al. Theory of digital twin modeling and its application. Comput. Integr. Manuf. Syst. 2021, 27, 1–15. [Google Scholar]
- Vanderhorn, E.; Mahadevan, S. Digital Twin: Generalization, characterization and implementation. Decis. Support Syst. 2021, 145, 113524. [Google Scholar] [CrossRef]
- Zhao, M.; Zhang, W.; Wang, G. TRIZ Enhancement and Practical Applications; Beijing Industry Press: Beijing, China, 2015; pp. 84–91. [Google Scholar]
- Litvin, S. Flow Analysis; GEN3 Partners: Boston, MA, USA, 2015; pp. 15–20. [Google Scholar]
- Wagner, R.; Schleich, B.; Haefner, B.; Kuhnle, A.; Wartzack, S.; Lanza, G. Challenges and potentials of digital twins and industry 4.0 in product design and production for high performance products. Procedia CIRP 2019, 84, 88–93. [Google Scholar] [CrossRef]
- Feng, Y.; Zhao, Y.; Zheng, H.; Li, Z.; Tan, J. Data-driven product design toward intelligent manufacturing: A review. Int. J. Adv. Robot Syst. 2020, 17, 1729881420911257. [Google Scholar] [CrossRef]
- Bouskela, D.; Falcone, A.; Garro, A.; Jardin, A.; Otter, M.; Thuy, N.; Tundis, A. Formal requirements modeling for cyber-physical systems engineering: An integrated solution based on FORM-L and Modelica. Requir. Eng. 2022, 27, 1–30. [Google Scholar] [CrossRef]
- Kano, N. Attractive quality and must-be quality. Hinshitsu 1984, 14, 39–48. [Google Scholar]
- Feng, L.; Li, Z.; Wang, J.; Zhang, K.; Liu, P. Feature-oriented idetification and prioritiation of software product innovation opportunities considering the innovation preferences of customers. Compu. Integr. Manuf. Syst. 2021, 27, 3625–3638. [Google Scholar]
- Geng, X.; Xu, S.; Ye, C. Optimal design method of product function requirements considering quantitative KANO analysis. Compu. Integr. Manuf. Syst. 2016, 22, 1645–1653. [Google Scholar]
- Masao, K.; Yoji, A. Quality function deployment and company wide quality control in japan: A strategy for assuring that quality is built into products. Qual. Prog. 1983, 16, 25–29. [Google Scholar]
- Wang, N.; Li, K.; Zhang, H. Research on decision-making of air defense and anti-missile equipment system construction based on fuzzy QFD. Fire Control Command Control 2022, 47, 134–139. [Google Scholar]
- Xu, J.; Wang, S. Intelligent recycling product design for household food waste based on AHP-TRIZ method. J. Mach. Des. 2022, 39, 128–134. [Google Scholar]
- Li, X.; Liang, J.; Li, H. Design of earthquake rescue robot based on AHP/QFD and TRIZ. J. Mach. Des. 2021, 38, 121–128. [Google Scholar]
- Wang, Y.; Yu, S.; Xu, T. A user requirement driven framework for collaborative design knowledge management. Adv. Eng. Inform. 2017, 33, 16–28. [Google Scholar] [CrossRef]
- Ruan, N.; Zhao, Y. Research on User Demand Identification Based on Open Innovation Community. Soft Sci. 2017, 31, 20–24. [Google Scholar]
- Zhao, X.; Wei, F.; Bai, Y. Construction and application of product design model driven by user needs. J. Mach. Des. 2021, 38, 56–61. [Google Scholar]
- Su, Z.; Yu, S.; Chu, J.; Yu, M.; Kong, J.; Huang, Y. Requirement-dricen recognition method for key design features of products in cloud platform. Comput. Integr. Manuf. Syst. 2021, 27, 3604–3613. [Google Scholar]
- Wang, T. A novel approach of integrating natural language processing techniques with fuzzy TOPSIS for product evaluation. Symmetry 2022, 14, 120. [Google Scholar] [CrossRef]
- Chen, Z.; Wang, Y.; Zhao, B.; Cheng, J.; Zhao, X.; Duan, Z. Knowledge graph completion: A review. IEEE Access 2020, 8, 192435–192456. [Google Scholar] [CrossRef]
- Pahl, G.; Beitz, W.; Feldhusen, J.; Grote, K.-H. Engineering Design: A Systematic Approach; Springer International Publishing: London, UK, 1996. [Google Scholar]
- Tao, F.; Cheng, J.; Qi, Q.; Zhang, M.; Zhang, H.; Sui, F. Digital twin-driven product design, manufacturing and service with big data. Int. J. Adv. Manuf. Tech. 2018, 94, 3563–3576. [Google Scholar] [CrossRef]
- Bai, Z.; Sun, Y.; Xu, T.; Ding, M. Construction of product digital twin model based on design task in conceptual design. Chin. J. Eng. Des. 2020, 27, 681–689. [Google Scholar]
- Li, H.; Tao, F.; Wang, H.; Song, W.; Zhang, Z.; Fan, B.; Wu, C.; Li, Y.; Li, L.; Wen, X.; et al. Integration framework and key technologies of complex product design-manufacturing based on digital twin. Compu. Integr. Manuf. Syst. 2019, 25, 1320–1336. [Google Scholar]
- Zhou, Y.; Wu, C.; Sun, J.; Liu, F.; Li, H. Function model construction method based on digital twin for intelligent products. Compu. Integr. Manuf. Syst. 2019, 25, 1392–1404. [Google Scholar]
- Tan, Y.; Liu, L.; Zhang, P.; Sang, H.; Yang, Z.; Hua, X.; Xiong, G.; Zhang, Y. Research on the process model of innovative design for digital-twin data-driven bag filters. J. Mach. Des. 2020, 37, 18–25. [Google Scholar]
- Hribernik, K.; Wuest, T.; Thoben, K.D. Towards product avatars representing middle-of-life information for improving design, development and manufacturing processes. In Proceedings of the IFIP International Conference on Digital Product and Process Development Systems, Dresden, Germany, 10–11 October 2013; Springer: Berlin/Heidelberg, Germany, 2013; pp. 85–96. [Google Scholar]
- Liu, J.; Zhao, P.; Jing, X.; Cao, X.; Sheng, S.; Zhou, H. Dynamic design method of digital twin process model driven by knowledge-evolution machining features. Int. J. Prod. Res. 2021, 60, 2312–2330. [Google Scholar] [CrossRef]
- Hwang, S.B.; Jeong, S.J.; Yoon, S.W. The design of manufacturing simulation modeling based on digital twin concept. J. Korea Soc. Simul. 2020, 29, 11–20. [Google Scholar]
- Wu, C.; Chen, T.; Li, Z.; Liu, W. A function-oriented optimising approach for smart product service systems at the conceptual design stage: A perspective from the digital twin framework. J. Clean Prod. 2021, 297, 126597. [Google Scholar] [CrossRef]
- Damjanovic-Behrendt, V.; Behrendt, W. An open source approach to the design and implementation of digital twins for smart manufacturing. Int. J. Comput. Integ. M. 2019, 32, 366–384. [Google Scholar] [CrossRef]
- Lim, K.Y.H.; Zheng, P.; Chen, C.; Huang, L. A digital twin-enhanced system for engineering product family design and optimization. J. Manuf. Syst. 2020, 57, 82–93. [Google Scholar] [CrossRef]
- Dong, Y.; Tan, R.; Zhang, P.; Peng, Q.; Shao, P. Product redesign using functional backtrack with digital twin. Adv. Eng. Inform. 2021, 49, 101361. [Google Scholar] [CrossRef]
- Ma, X.; Tao, F.; Zhang, M.; Wang, T.; Zuo, Y. Digital twin enhanced human-machine interaction in product lifecycle. Procedia Cirp 2019, 83, 789–793. [Google Scholar] [CrossRef]
- Illmer, B.; Vielhaber, M. Synchronizing digital process twins between virtual products and resources—A virtual design method. Procedia CIRP 2019, 84, 532–537. [Google Scholar] [CrossRef]
- Grieves, M.W. Product lifecycle management: The new paradigm for enterprises. Int. J. Prod. Dev. 2005, 2, 71–84. [Google Scholar] [CrossRef]
- Schroeder, G.N.; Steinmetz, C.; Pereira, C.E.; Espindola, D.B. Digital twin data modeling with automationml and a communication methodology for data exchange. IFAC-Pap. 2016, 49, 12–17. [Google Scholar] [CrossRef]
- Tavares, P.; Silva, J.A.; Costa, P.; Moreira, A.P. Flexible work cell simulator using digital twin methodology for highly complex systems in industry 4.0. In Proceedings of the Iberian Robotics Conference, Seville, Spain, 22–24 November 2017; Springer: Cham, Switzerland, 2017; pp. 541–552. [Google Scholar]
- Zheng, Y.; Yang, S.; Cheng, H. An application framework of digital twin and its case study. J. Amb. Intel. Hum. Comp. 2019, 10, 1141–1153. [Google Scholar] [CrossRef]
- Borangiu, T.; Oltean, E.; Răileanu, S.; Anton, F.; Anton, S.; Iacob, I. Embedded digital twin for ARTI-type control of semi-continuous production processes. In Proceedings of the International Workshop on Service Orientation in Holonic and Multi-Agent Manufacturing, Paris, France, 1–2 October 2019; Springer: Cham, Switzerland, 2019; pp. 113–133. [Google Scholar]
- Tao, F.; Zhang, M.; Liu, Y.S.; Nee, A.Y.C. Digital twin driven prognostics and health management for complex equipment. Cirp Ann.-Manuf. Techn. 2018, 67, 169–172. [Google Scholar] [CrossRef]
- Isermann, R.; Münchhof, M. Identification of Dynamic Systems II: An Introduction with Applications; Springer Press: Berlin, Germany, 2011. [Google Scholar]
- Hu, C.; Chen, Y.; Liu, Z. Functional representation and intelligent synthesis approach of multi-disciplinary signal systems. J. Shanghai Jiaotong Univ. 2014, 48, 142–1148. [Google Scholar]
- Sun, Y.; Ikvanko, S. TRIZ’s Golden Key to Opening the Door of Innovation; Science Press: Beijing, China, 2015; p. 21. [Google Scholar]
- Jiang, H.; Ding, G.; Zhang, J. Evolution and operation mechanism of digital twin shopfloors. China. Mech. Eng. 2020, 31, 24–832,841. [Google Scholar]
- Kang, Y.; Tang, D. Multi-function product conceptual solution approach based on matrix. Compu. Integr. Manuf. Syst. 2014, 20, 915–2925. [Google Scholar]
- Zhang, J.; Wang, J.; Wei, X. Product modeling for conceptual design based on extended functional basis. Trans. Chin. Soc. Agric. Mach. 2008, 39, 129–133. [Google Scholar]
- Liu, Z.; Cao, G.; Bai, Y.; Song, R. Analysis and application of derivatization process of harmful function based on flow. Mach. Des. Manuf. 2019, 340, 263–267. [Google Scholar]
- Wang, J.; Zhang, J.; Liang, R. Multi-flow problem mining of complex electromechanical system based on flow analysis. In Proceedings of the International Conference on Mechanical Design, Beijing, China, 13–15 October 2017; Springer: Singapore, 2017; pp. 433–454. [Google Scholar]
- Wang, X.; Zhang, J.; Zhao, R.; Liu, J.; Ding, L. Multi-flow problem analysis and solution process model of complex electromechanical system. In Proceedings of the International TRIZ Future Conference, Cluj-Napoca, Romania, 14–16 October 2020; pp. 37–58. [Google Scholar]
- Zhang, J.; Liang, R.; Han, B.; Tan, R.; Sun, J. The problem flow network building and solving process model for complex product. J. Mec. Eng. 2018, 54, 60–173. [Google Scholar] [CrossRef]
- Fu, M.; Li, M.; Li, R.; Hao, Y.; Gu, Z. Construction of mechanical product flow function model and flow evolution path. Compu. Integr. Manuf. Syst. 2022, in press. [Google Scholar]
- Bryant, C.R.; McAdams, D.A.; Stone, R.B.; Kurtoglu, T.; Campbell, M.I. A computational technique for concept generation. In Proceedings of the International Design Engineering Technical Conferences and Computers and Information in Engineering Conference, Long Beach, CA, USA, 24–28 September 2005; American Society of Mechanical Engineers: New York, NY, USA, 2005; pp. 267–276. [Google Scholar]
- Kurtoglu, T.; Campbell, M.I.; Linsey, J.S. An experimental study on the effects of a computational design tool on concept generation. Des. Stud. 2009, 30, 676–703. [Google Scholar] [CrossRef]
- Zhang, K.; Li, X.; Yan, Y.; Zhu, Q.; Ma, J. Domain expert entity extraction method based on multi-feature bidirectional gated neural network. J. Nanjing Norm. Univ. 2021, 44, 28–135. [Google Scholar]
- Schutz, A.; Buitelaar, P. Relext: A tool for relation extraction from text in ontology extension. In Proceedings of the International Semantic Web Conference, Galway, Ireland, 6–10 November 2005; Springer: Berlin/Heidelberg, Germany, 2005; pp. 593–606. [Google Scholar]
- Li, G.; Li, Y.; Wang, H.; Xie, Q.; Huang, W.; Hou, J. Knowledge graph of power equipment health management: Basic concepts, key technologies and research progress. Automat. Electr. Power Syst. 2022, 46, 843–851. [Google Scholar]
- Zhang, D.; Liu, Z.; Jia, W.; Liu, H.; Tan, J. A review on knowledge graph and its application prospects to intelligent manufacturing. J. Mec. Eng. 2021, 57, 90–113. [Google Scholar]
- Scott, J. Social network analysis: Developments, advances, and prospects. Soc. Netw. Anal. Min. 2011, 1, 21–26. [Google Scholar] [CrossRef]
- Pei, A.; Qi, X.; Liu, Y.; Cao, S.; Ren, H.; Yang, R. Five-dimensional model-based digital twin tree topology. Appl. Res. Comput. 2020, 37, 240–243. [Google Scholar]
- Smith, S.; Smith, G.; Shen, Y. Redesign for product innovation. Des. Stud. 2012, 33, 160–184. [Google Scholar] [CrossRef]
- Li, W.; Liang, W.; Zhang, L.; Tang, Q. Performance assessment system of health, safety and environment based on experts’ weights and fuzzy comprehensive evaluation. J. Loss Prevent. Proc. 2015, 35, 95–103. [Google Scholar] [CrossRef]
- Zhang, P.; Chen, S.; Zhao, B.; Nie, Z. Research on decision making of design for coupling system based on complexity composite. Processes 2022, 10, 542. [Google Scholar] [CrossRef]


| Classification of Flow | Characteristics of Flow | Flow Evolution Path |
|---|---|---|
| Returned flow | The output end flows back to the input end during transmission | FE3 change flow properties, FE9 parasitic flow |
| Clogged flow | The effect of flow obstruction, the flow is not smooth and cannot achieve normal function | FE2 introduces new channels, FE3 changes flow properties, FE4 improves flow channels |
| Insufficient flow | The flow flux is less than the allowable value of the flow channel, and the system function is not fully realized | FE3 change flow properties, FE7 reduce flow conversion, FE9 parasitic flow |
| Ideal flow | Optimal flow flux for smooth operation | FE5 recycling flow, FE6 cut-off flow, FE8 cut-off flow channel |
| Redundant flow | The flow flux is larger than the allowable value of the flow channel, and the excess flow cannot pass through | FE2 introduces new channels, FE4 improves flow paths |
| Harmful flow | Harmful effects on other flows or flow channels | FE1 introduces new flows, FE3 changes flow properties, FE6 cut-off flow |
Publisher’s Note: MDPI stays neutral with regard to jurisdictional claims in published maps and institutional affiliations. |
© 2022 by the authors. Licensee MDPI, Basel, Switzerland. This article is an open access article distributed under the terms and conditions of the Creative Commons Attribution (CC BY) license (https://creativecommons.org/licenses/by/4.0/).
Share and Cite
Fu, M.; Hao, Y.; Gao, Z.; Chen, X.; Liu, X. User-Driven: A Product Innovation Design Method for a Digital Twin Combined with Flow Function Analysis. Processes 2022, 10, 2353. https://doi.org/10.3390/pr10112353
Fu M, Hao Y, Gao Z, Chen X, Liu X. User-Driven: A Product Innovation Design Method for a Digital Twin Combined with Flow Function Analysis. Processes. 2022; 10(11):2353. https://doi.org/10.3390/pr10112353
Chicago/Turabian StyleFu, Min, Yilin Hao, Zefei Gao, Xiaoqing Chen, and Xiaoyi Liu. 2022. "User-Driven: A Product Innovation Design Method for a Digital Twin Combined with Flow Function Analysis" Processes 10, no. 11: 2353. https://doi.org/10.3390/pr10112353
APA StyleFu, M., Hao, Y., Gao, Z., Chen, X., & Liu, X. (2022). User-Driven: A Product Innovation Design Method for a Digital Twin Combined with Flow Function Analysis. Processes, 10(11), 2353. https://doi.org/10.3390/pr10112353