
Numerical Investigation of the Knocking Combustion Characteristics of the N-Butanol/N-Octanol RCCI Engine


Abstract
:1. Introduction
2. Methodology
2.1. KIVA-CHEMKIN
2.2. Experimental Data
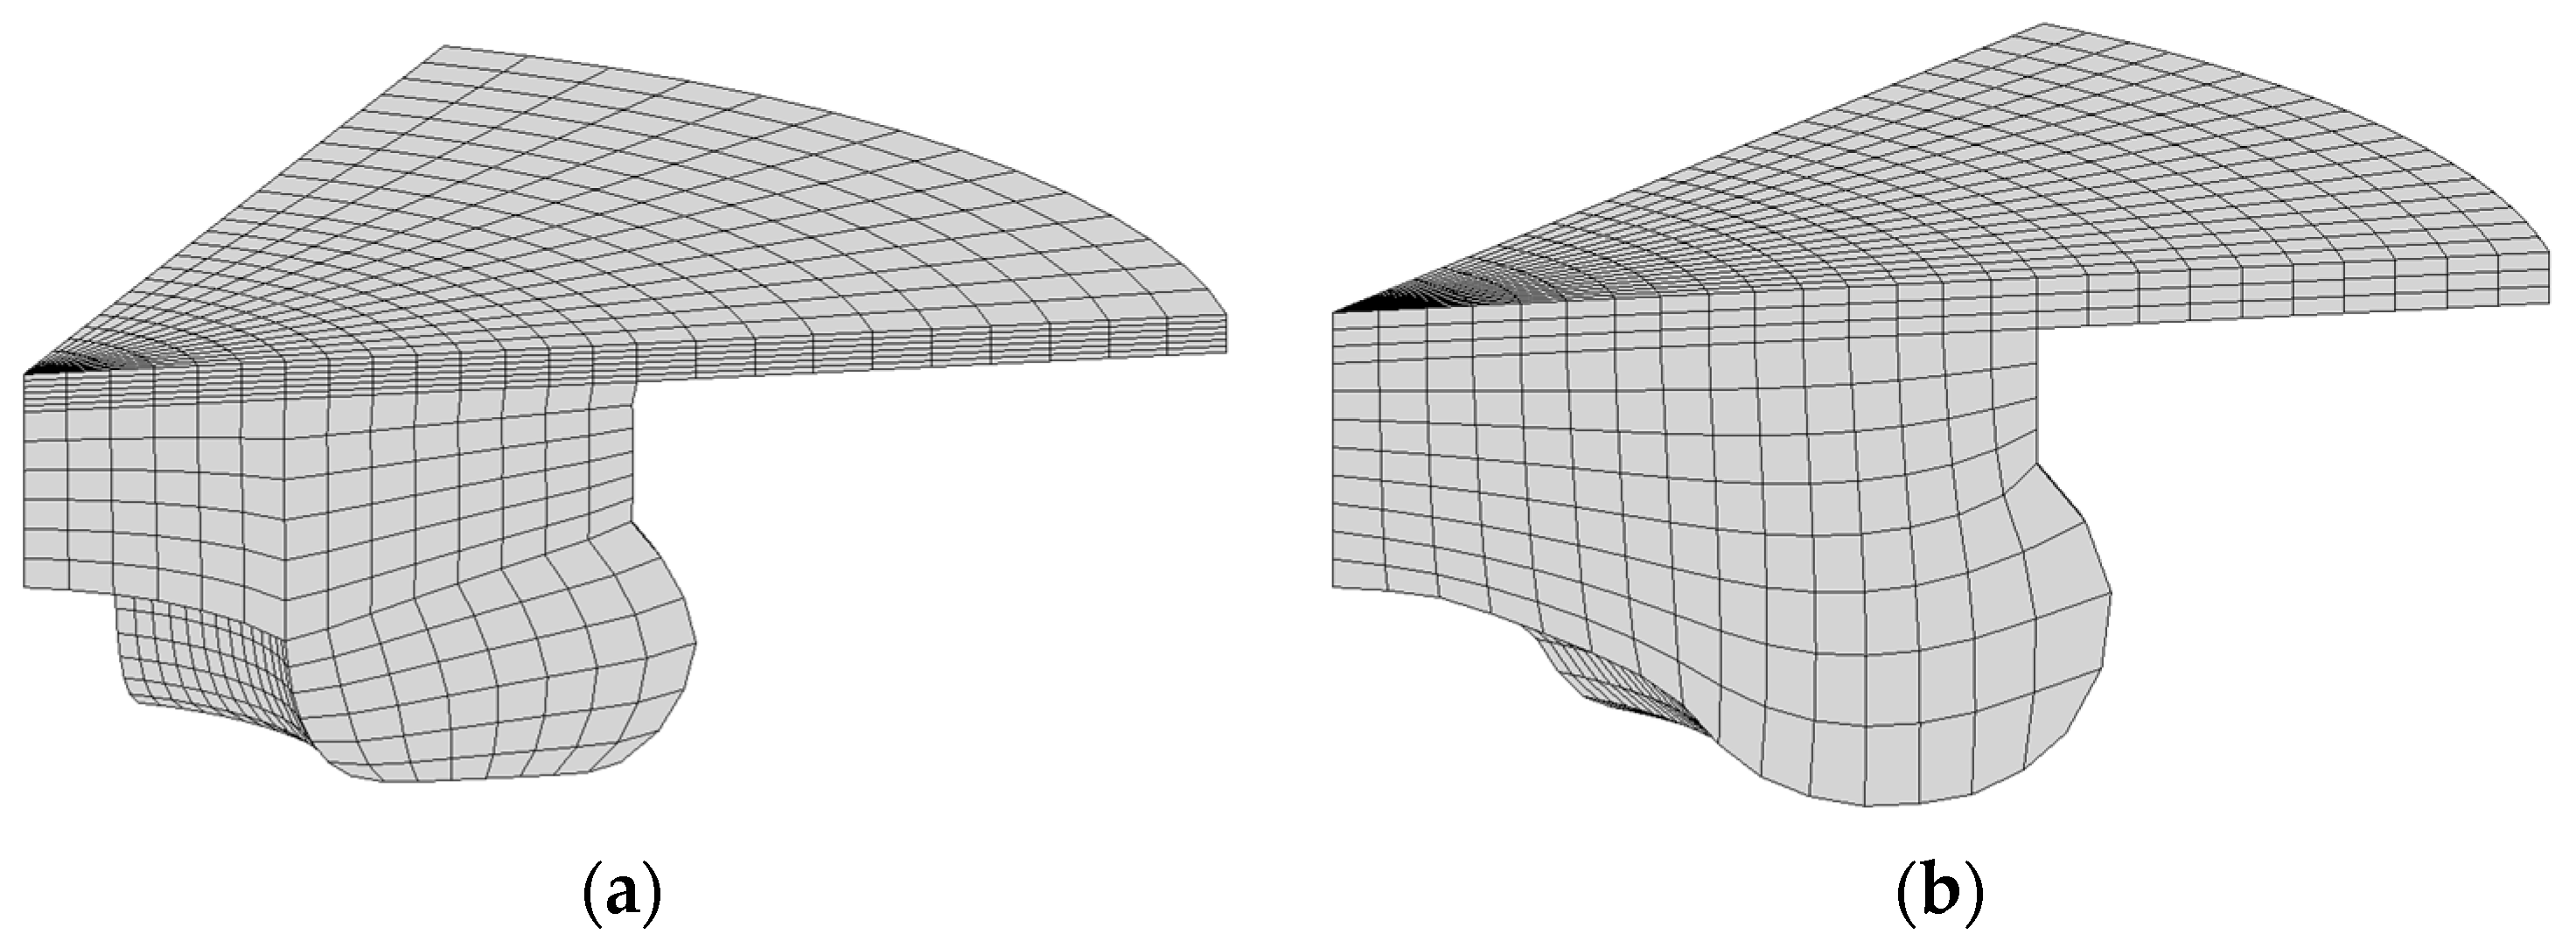
2.3. Grid Generation
2.4. Validation
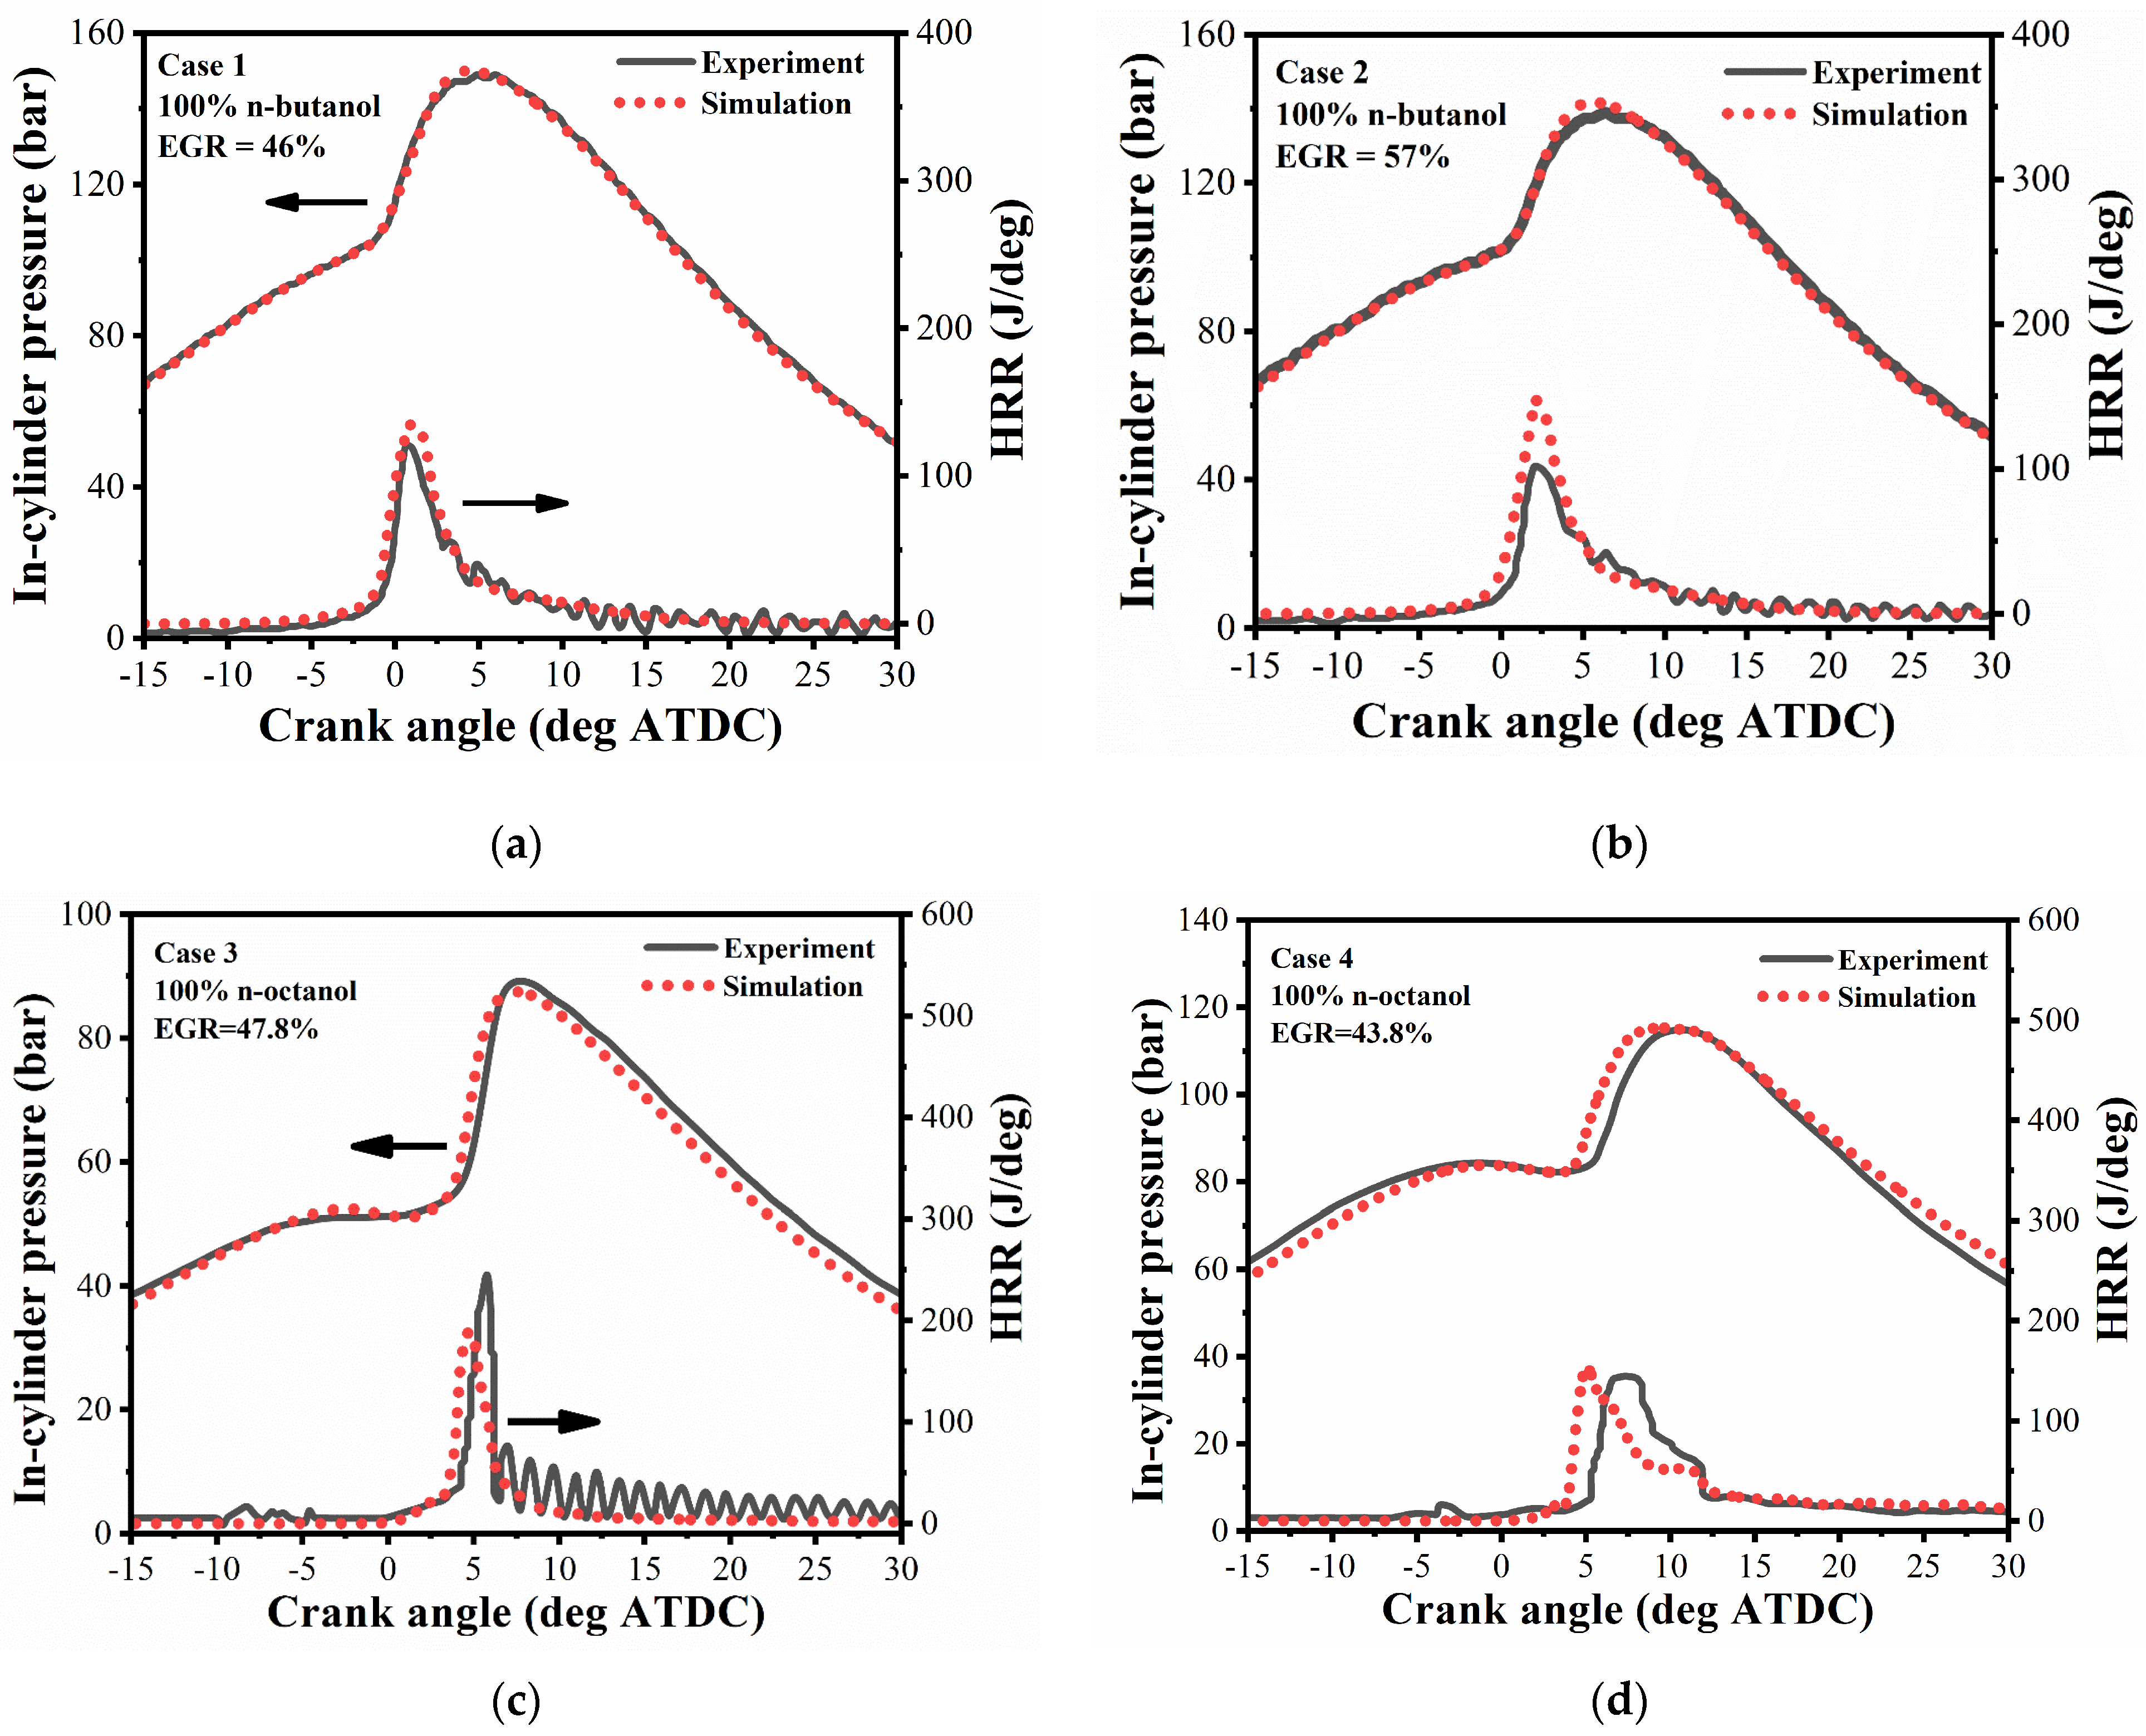
2.4.1. Validation Cases
2.4.2. Validation Results
2.5. Means of Knocking Analysis
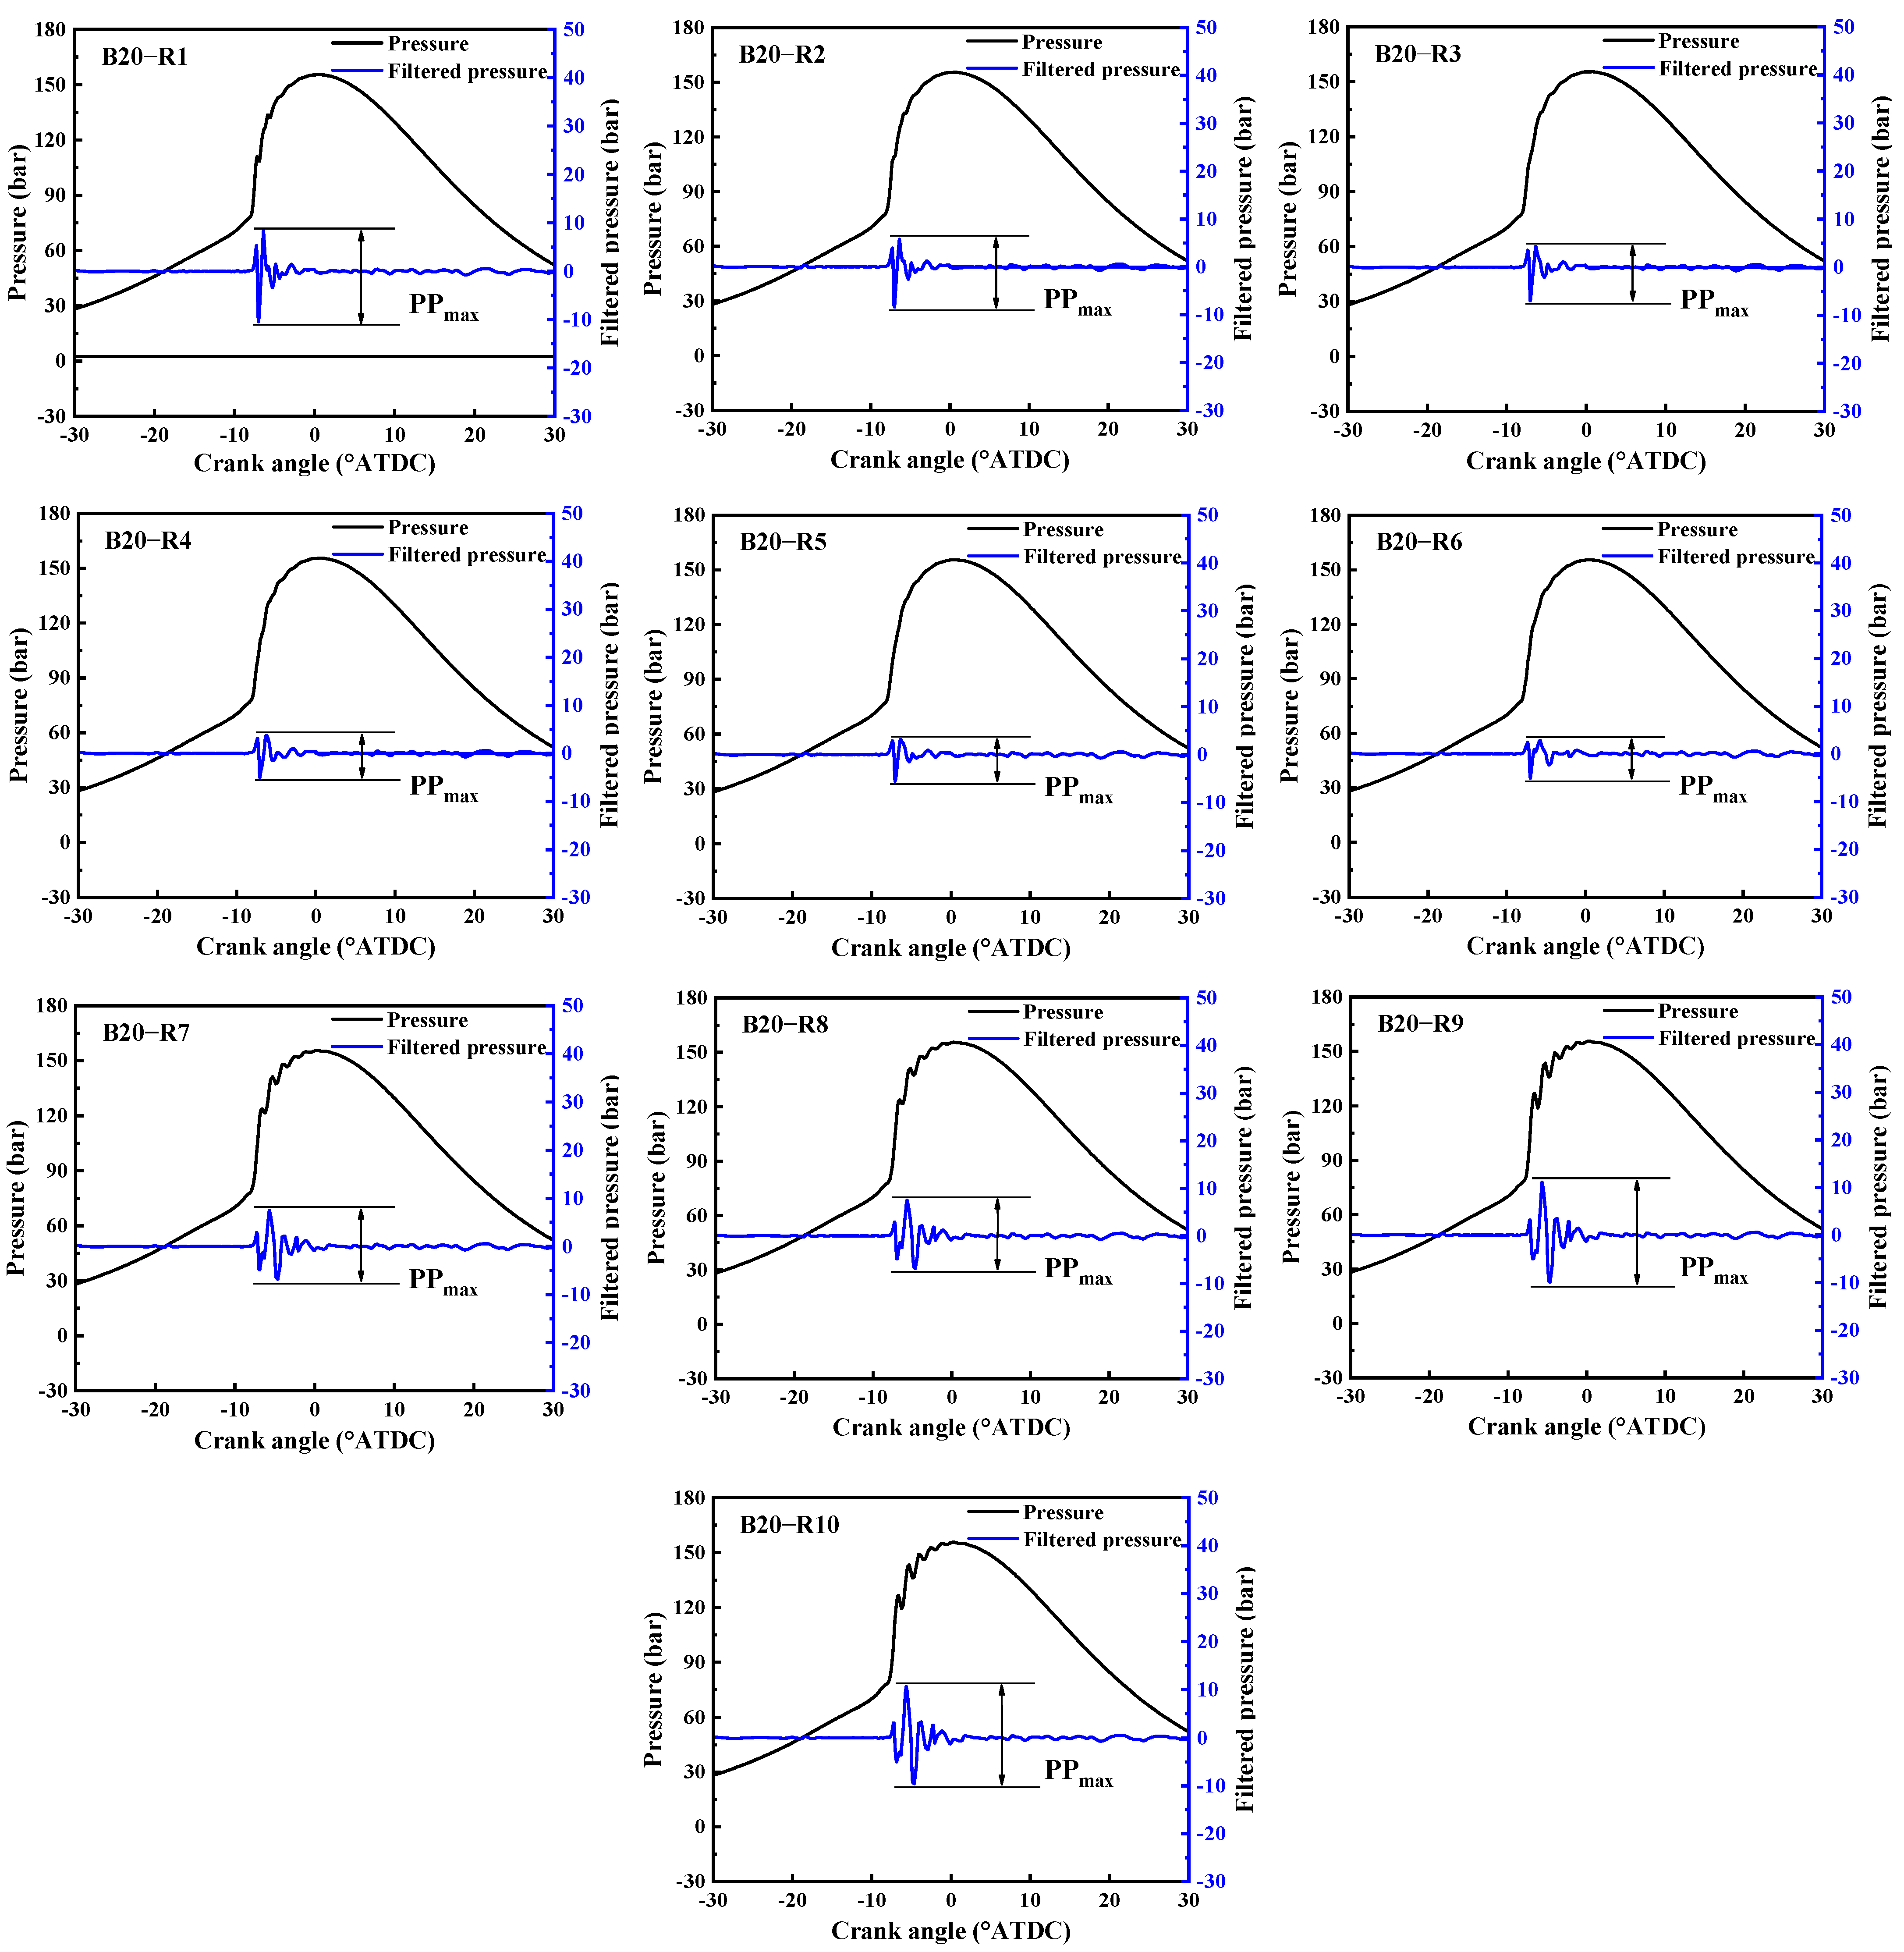
2.5.1. Local Regions Analysis
2.5.2. Knocking Identification
2.6. Study Cases
3. Results and Discussion
3.1. Characteristics of Knocking Combustion
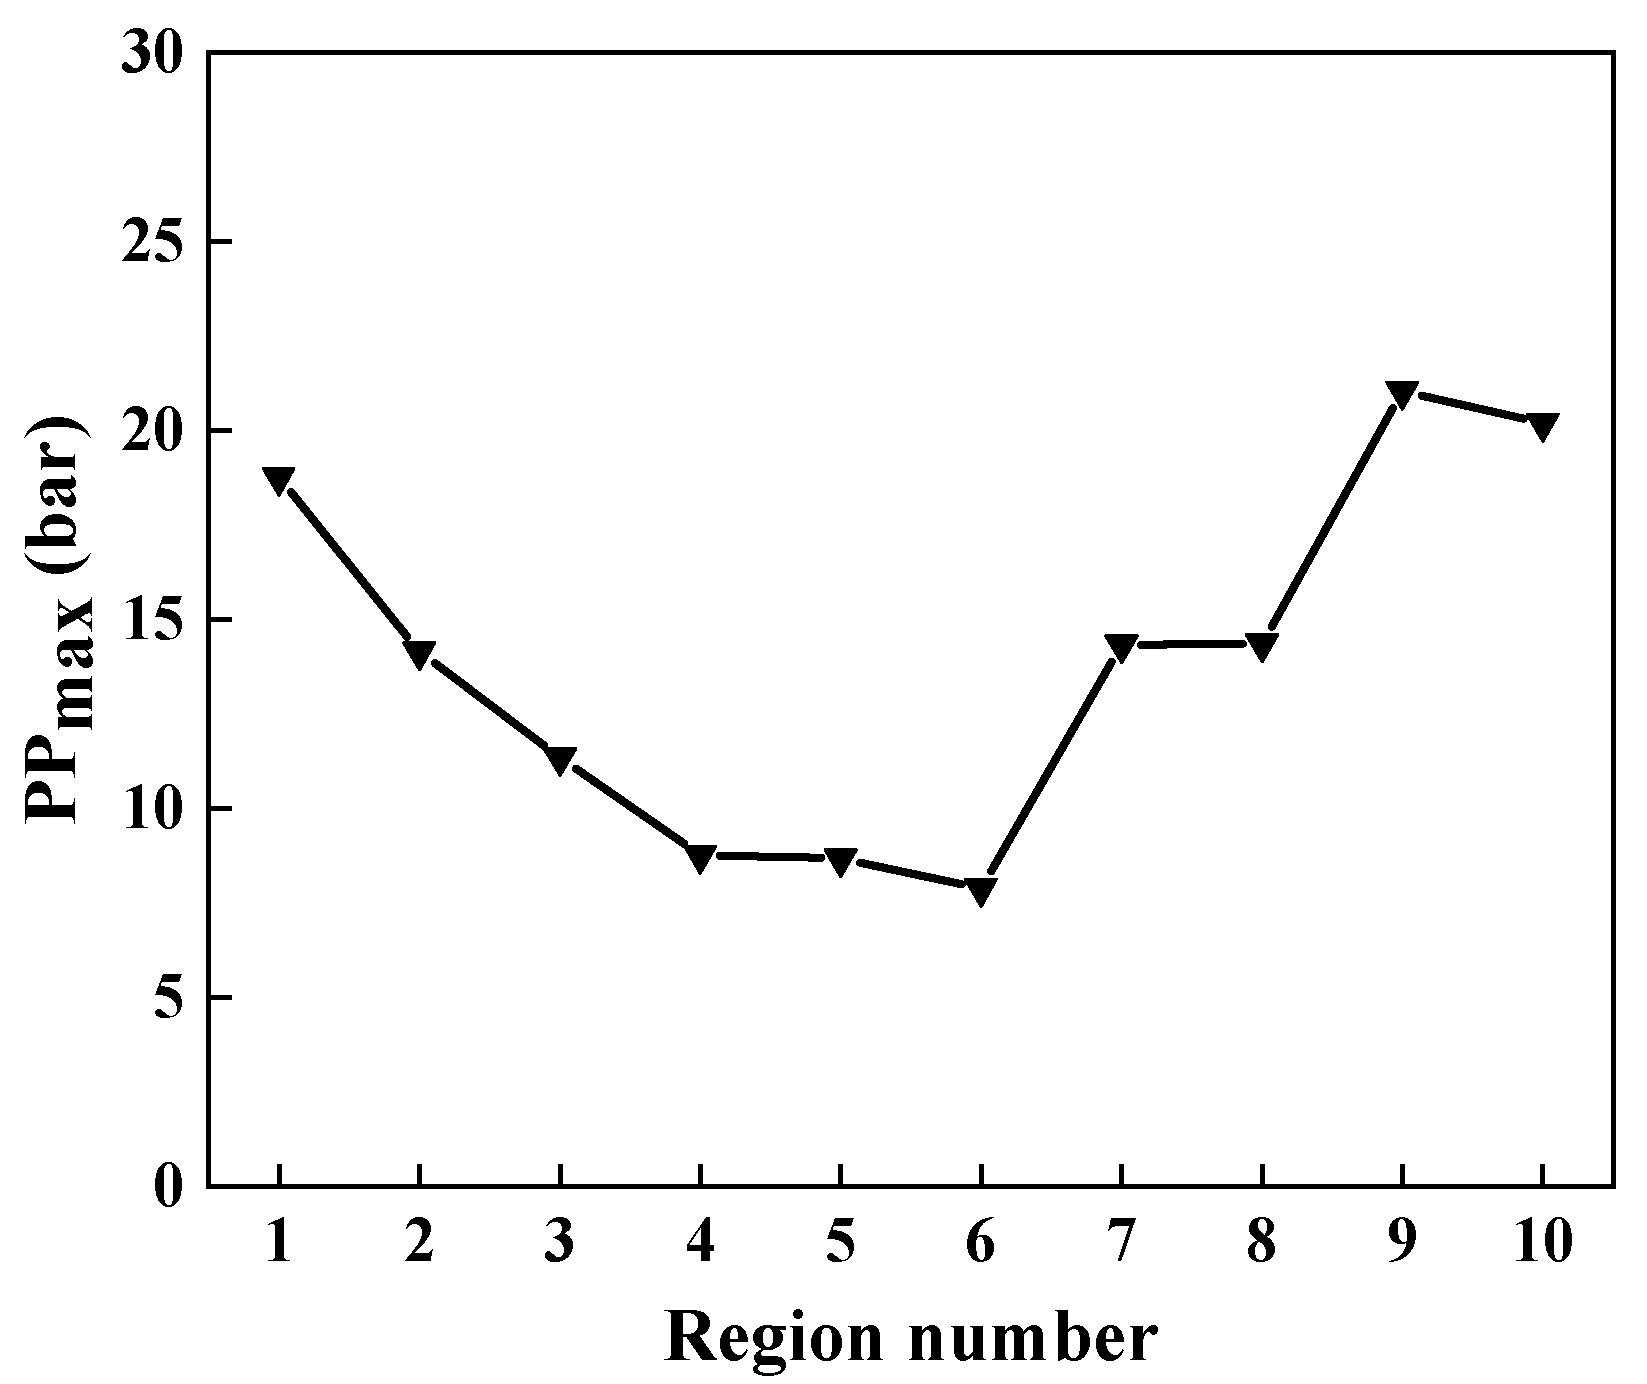
3.1.1. Local Pressure
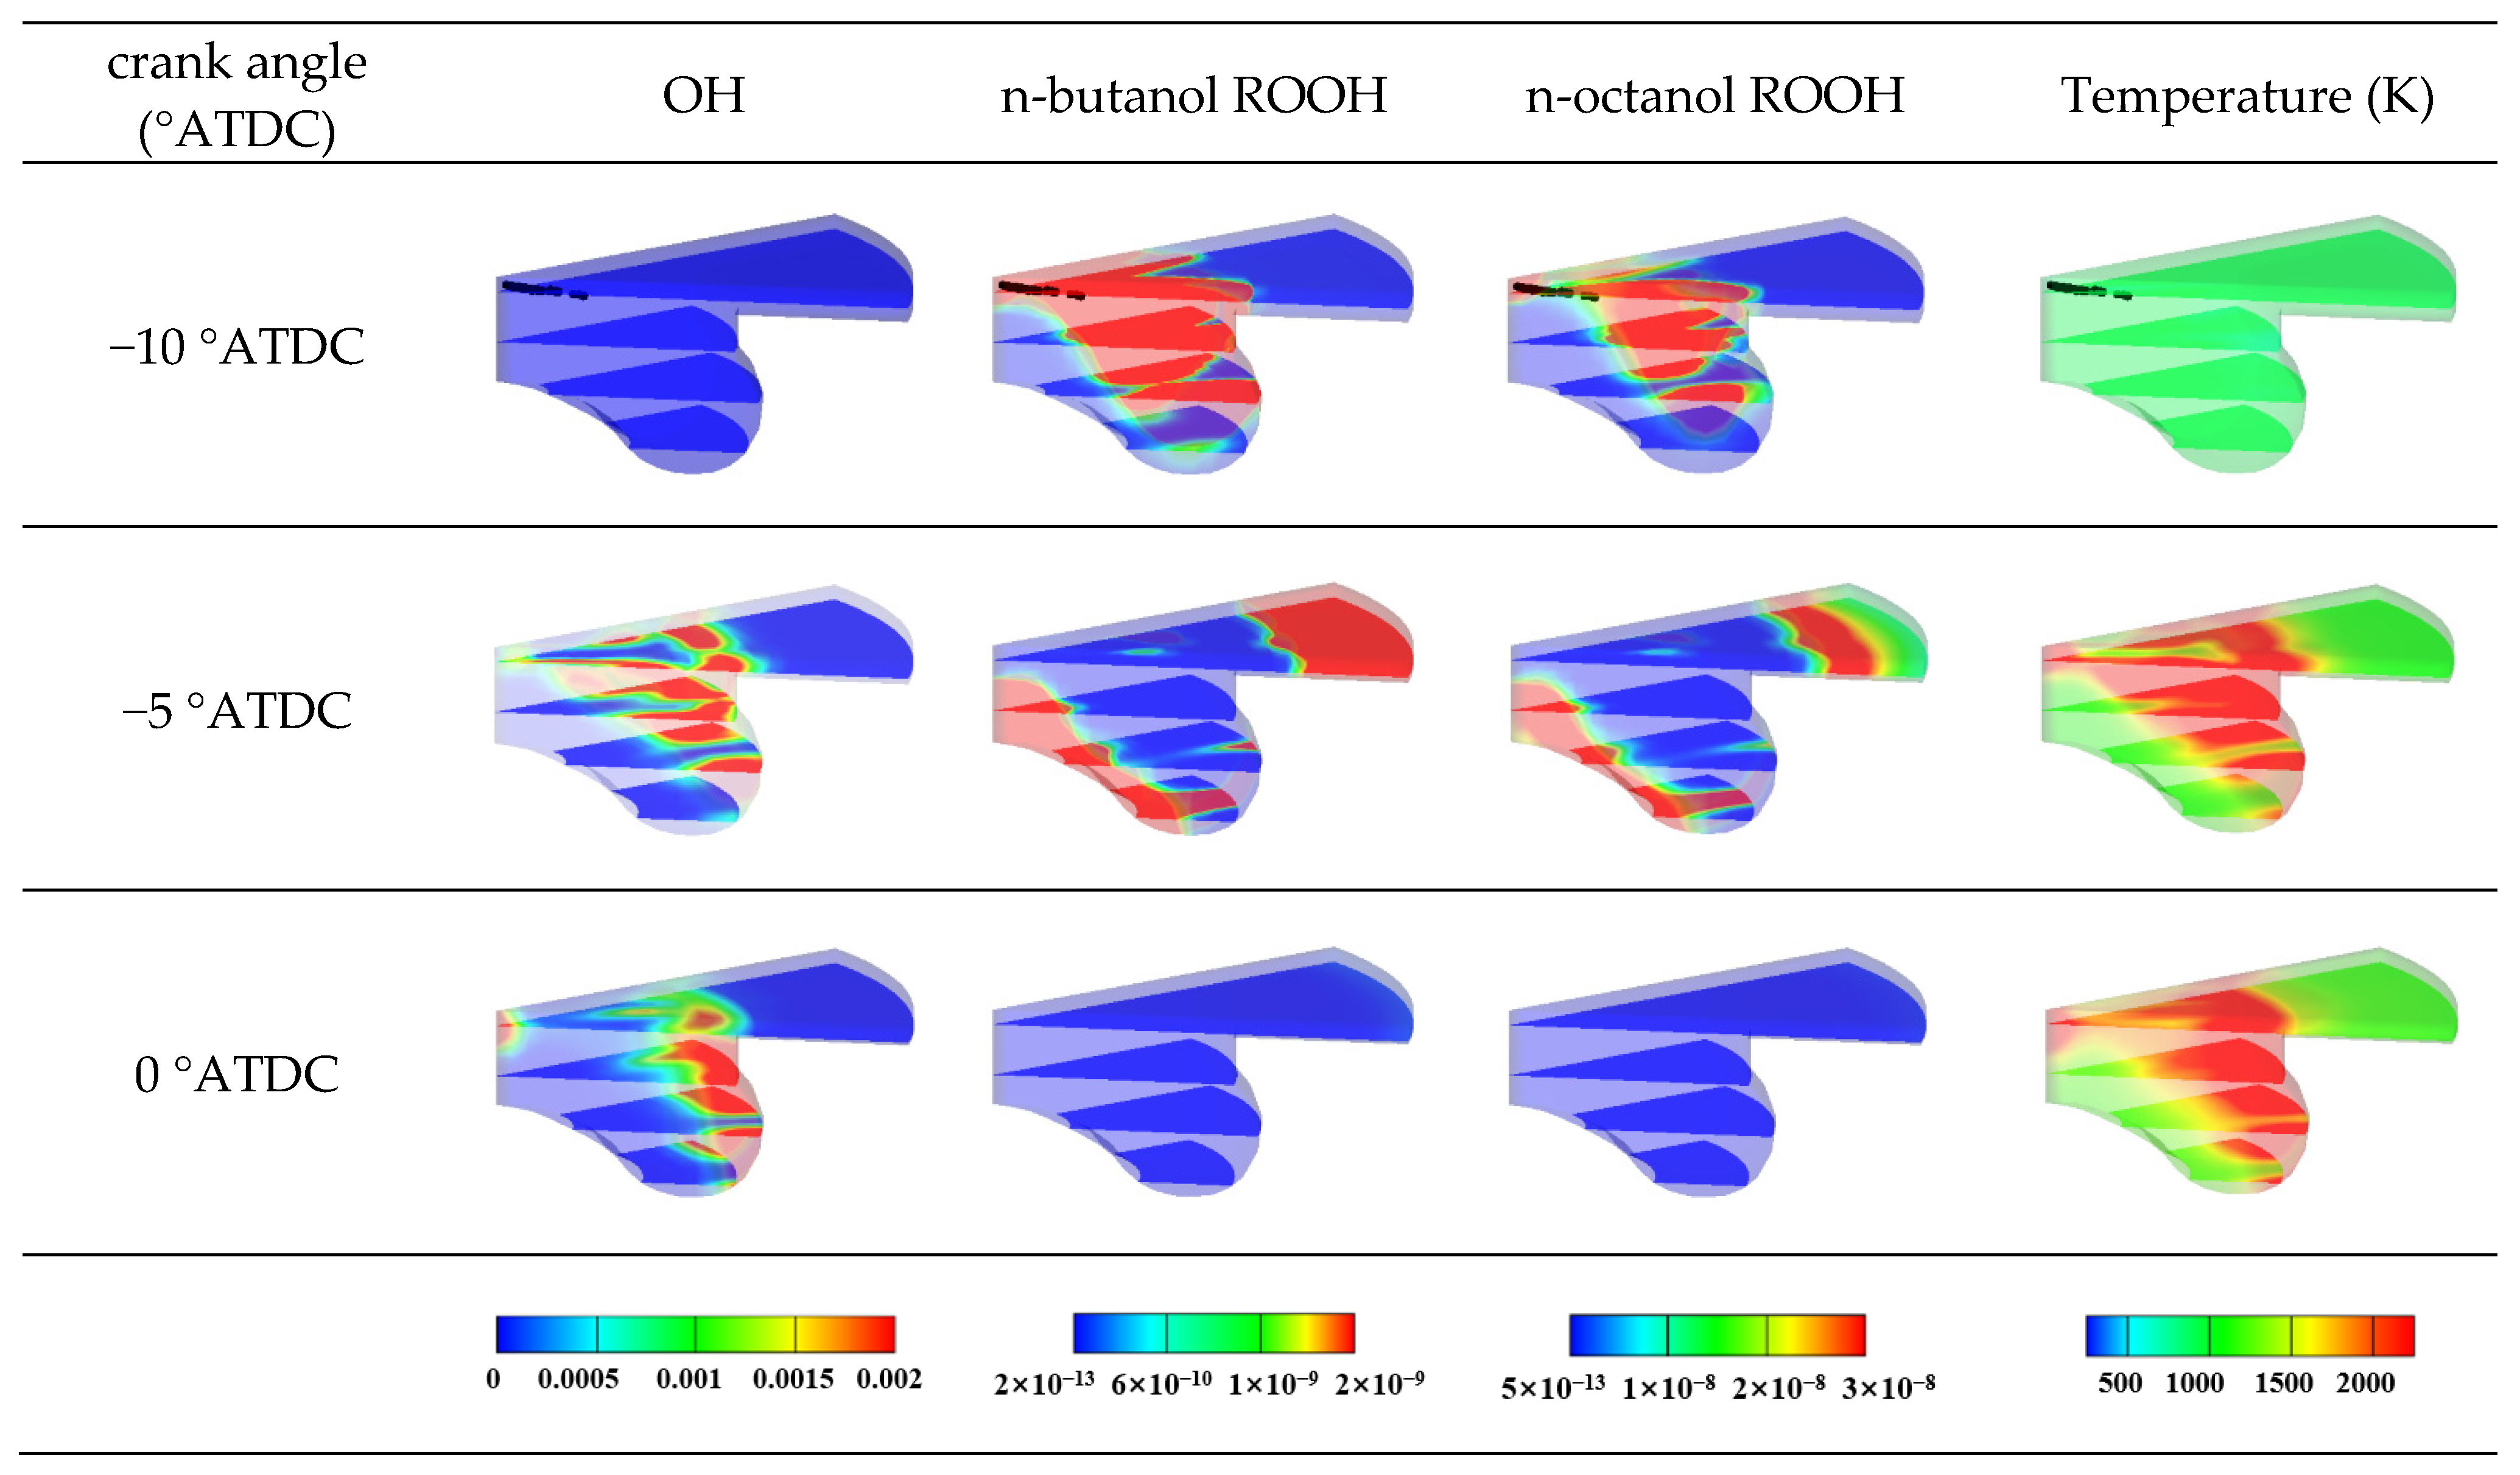
3.1.2. Temperature and Radical Concentration Analysis
3.1.3. Local HRR
3.1.4. Local PRR
3.2. Effects of Premixed Fuel Percentage
3.2.1. In-Cylinder Pressure and HRR
3.2.2. Maximum PRR
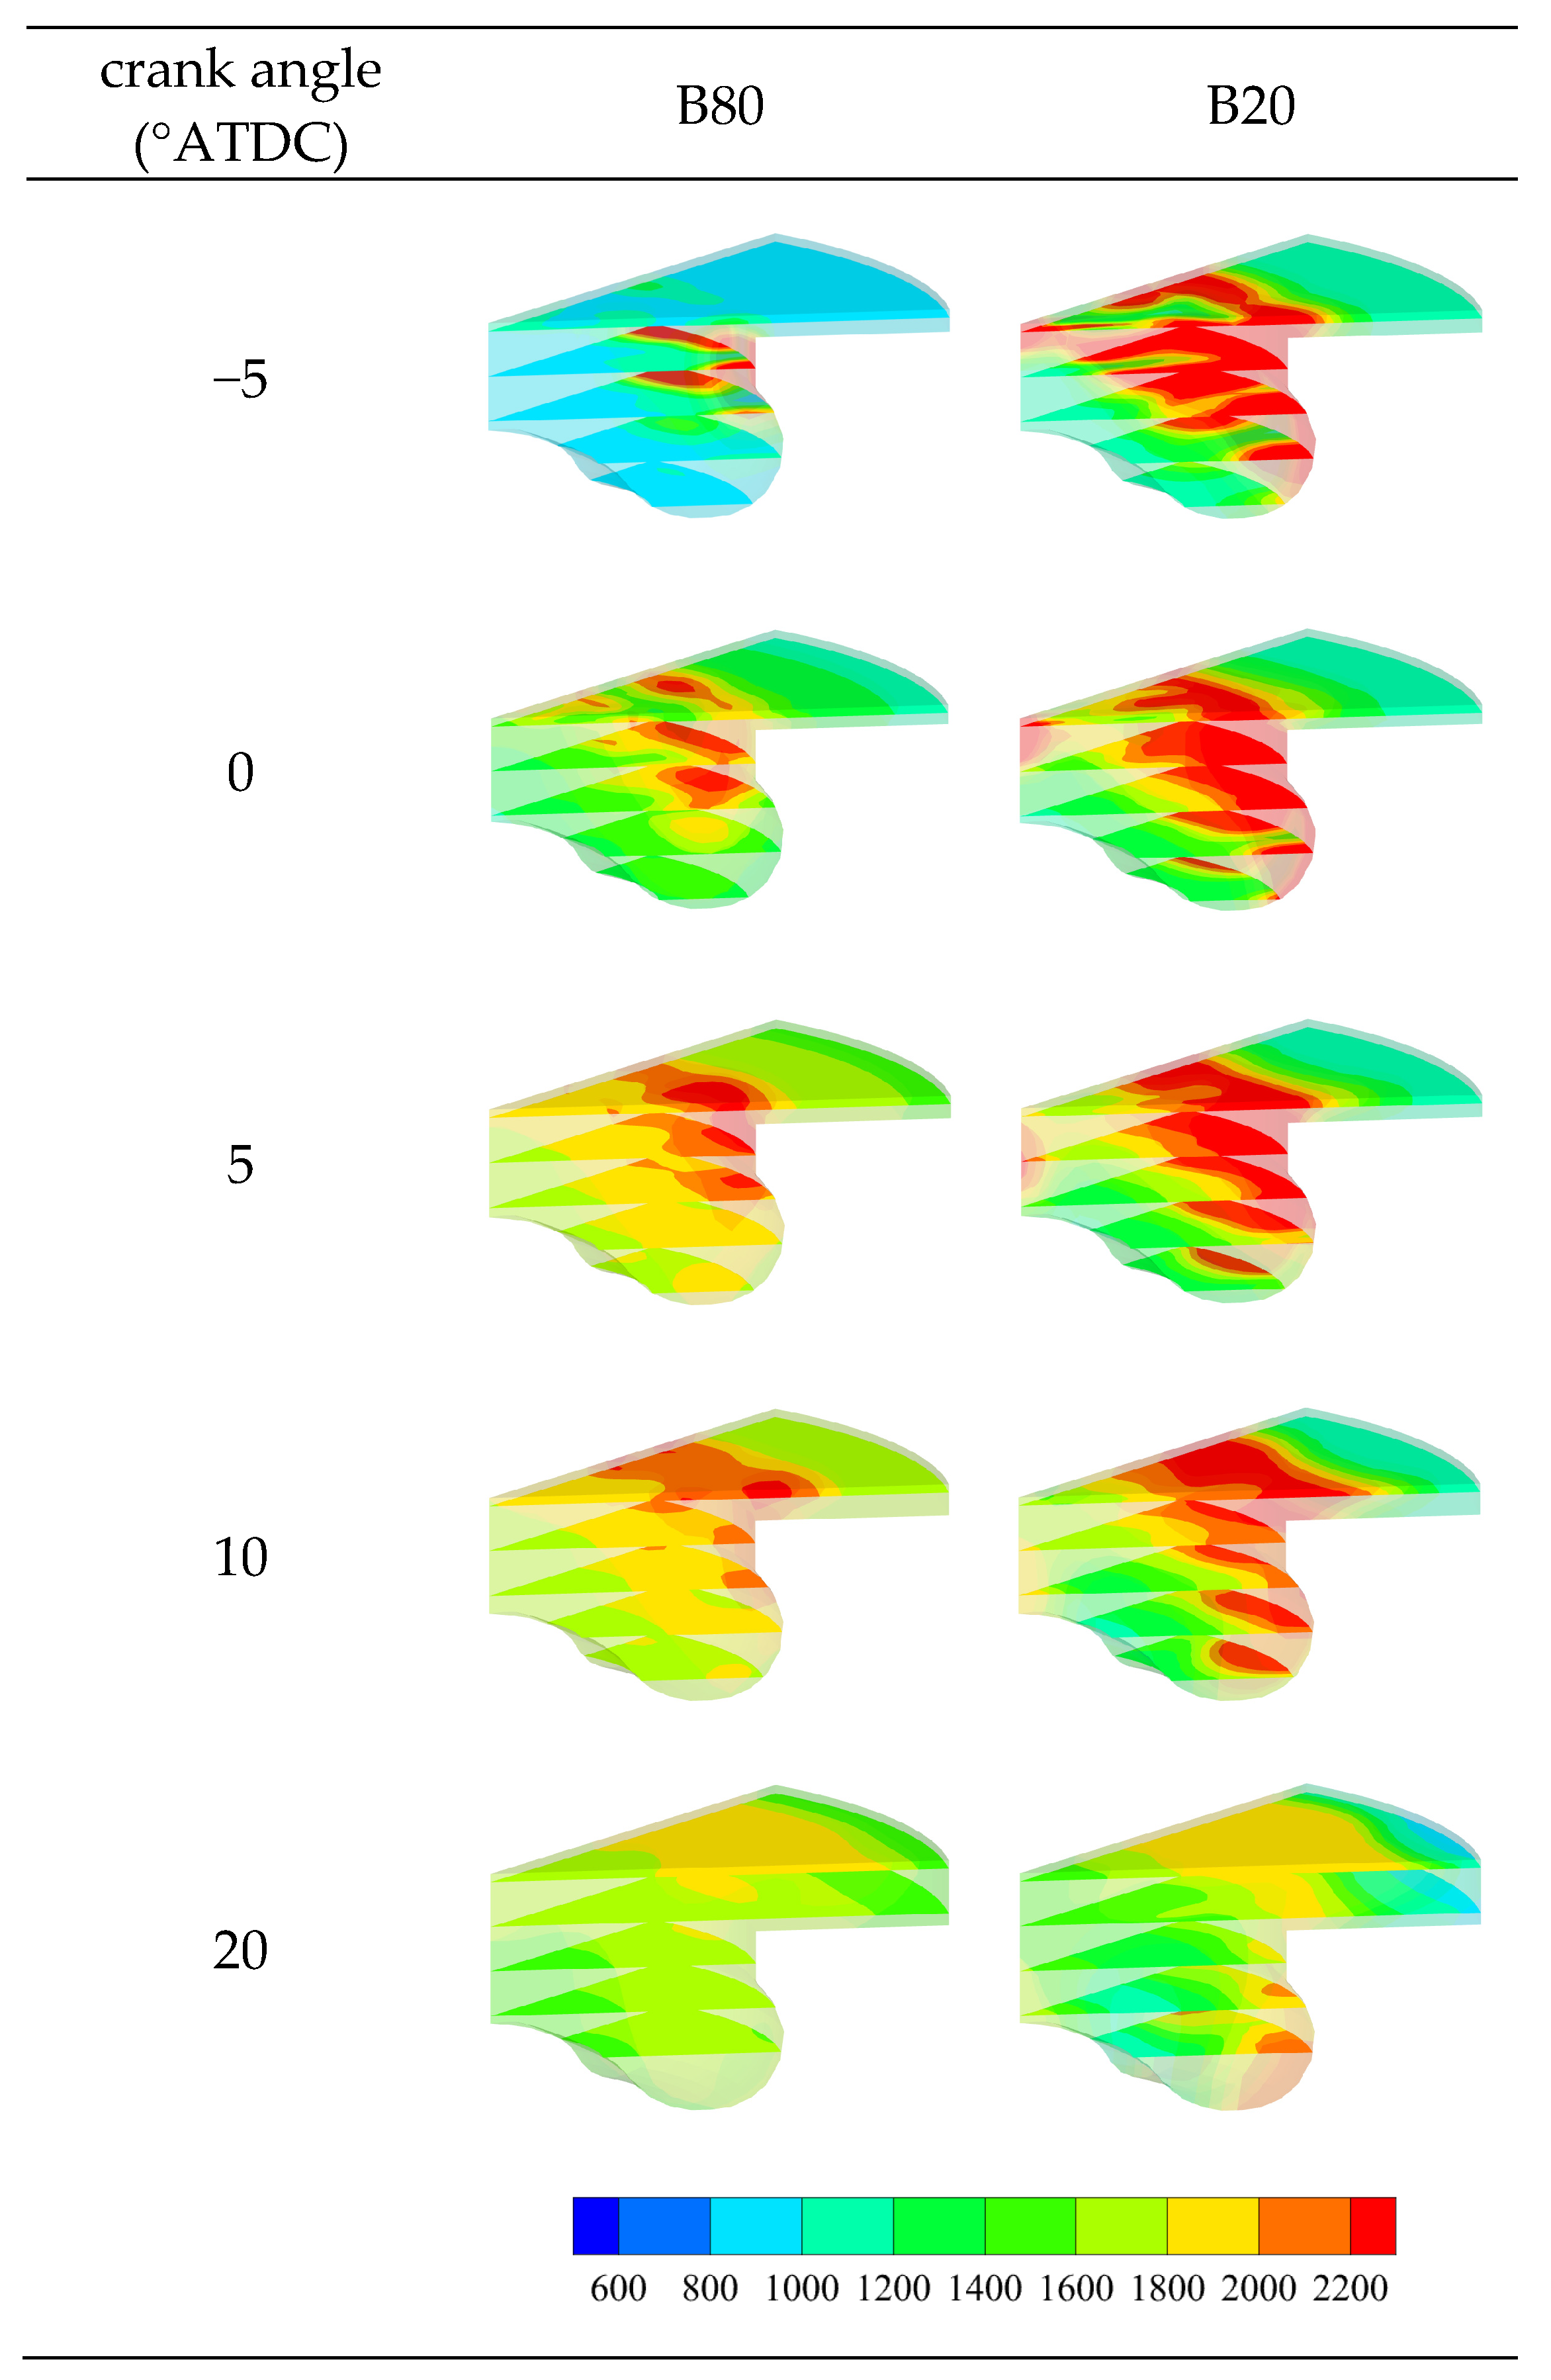
3.2.3. Temperature Distribution
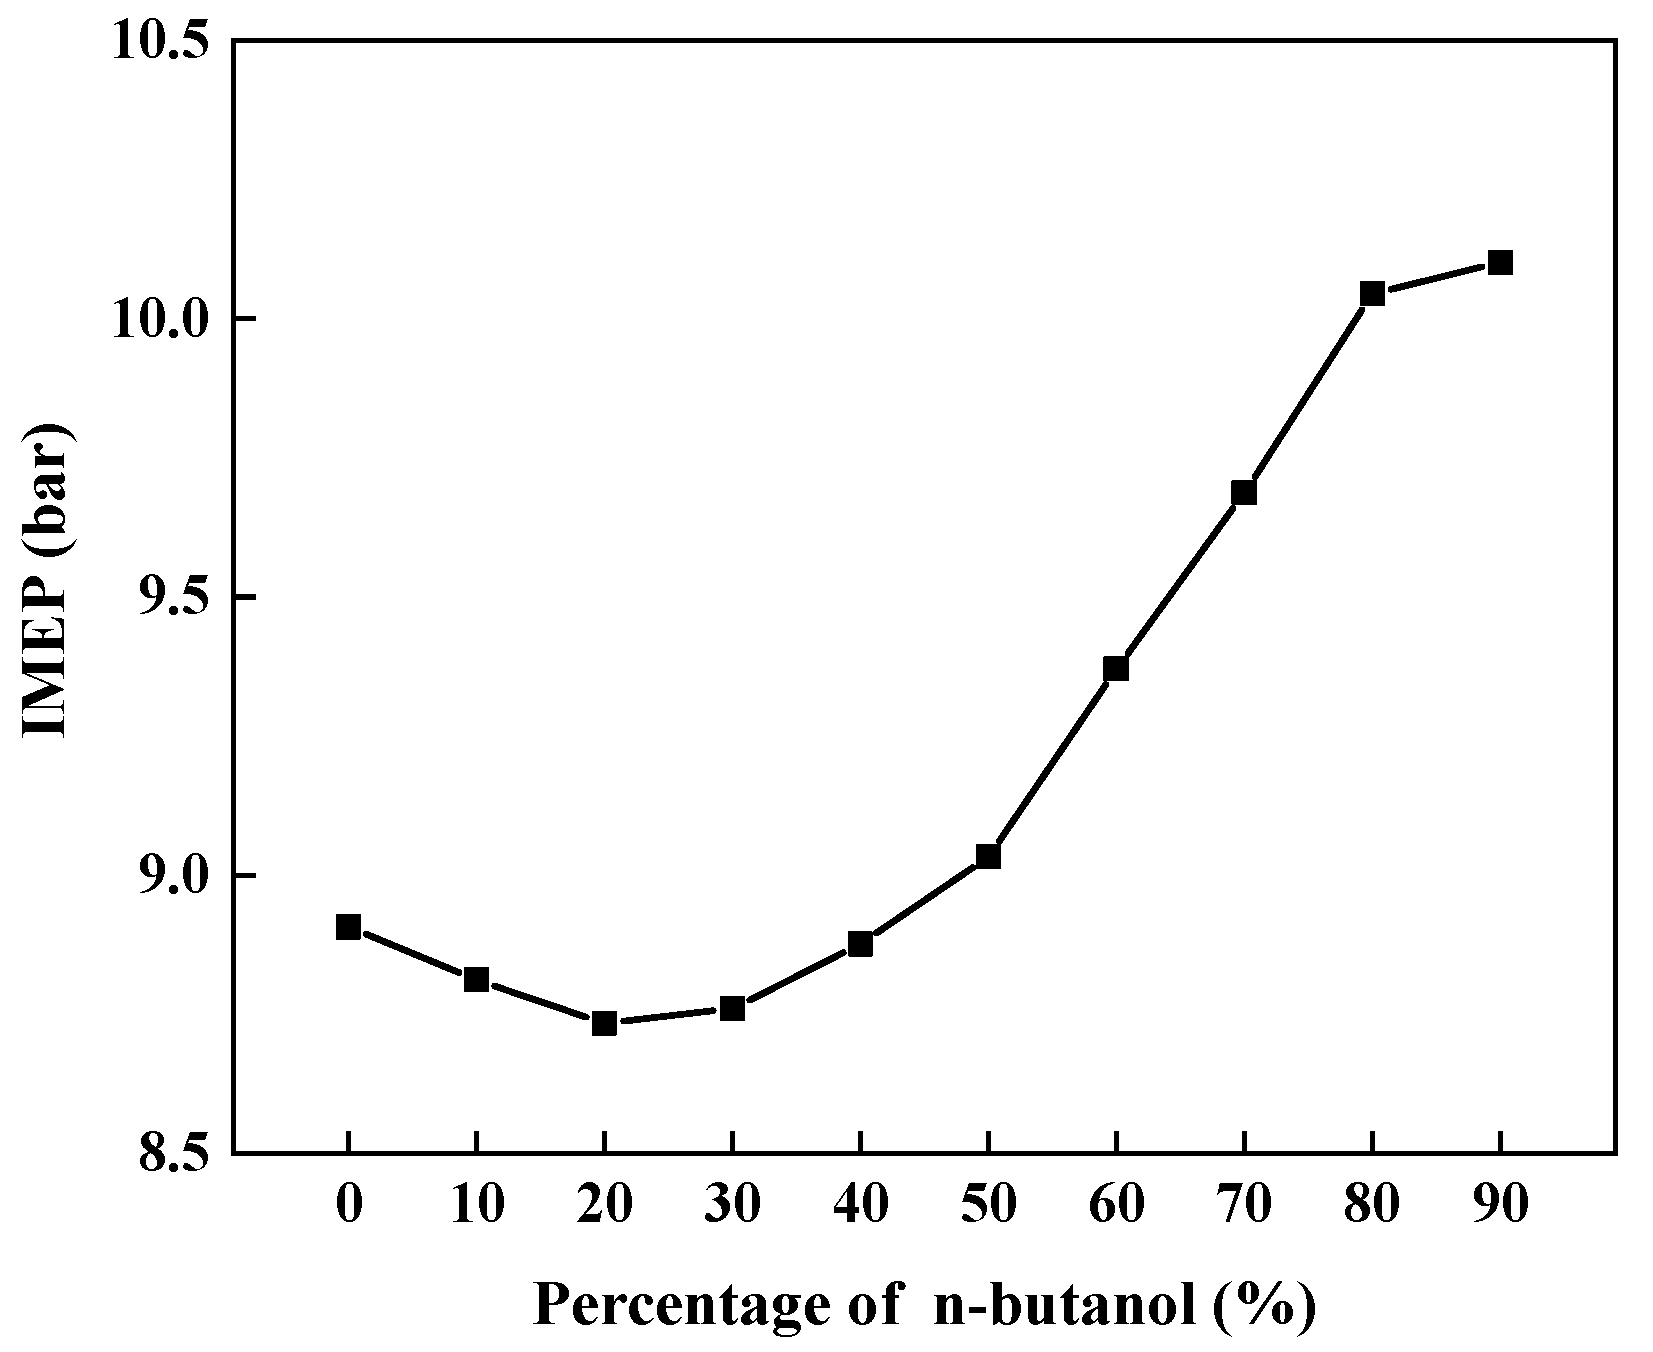
3.2.4. IMEP
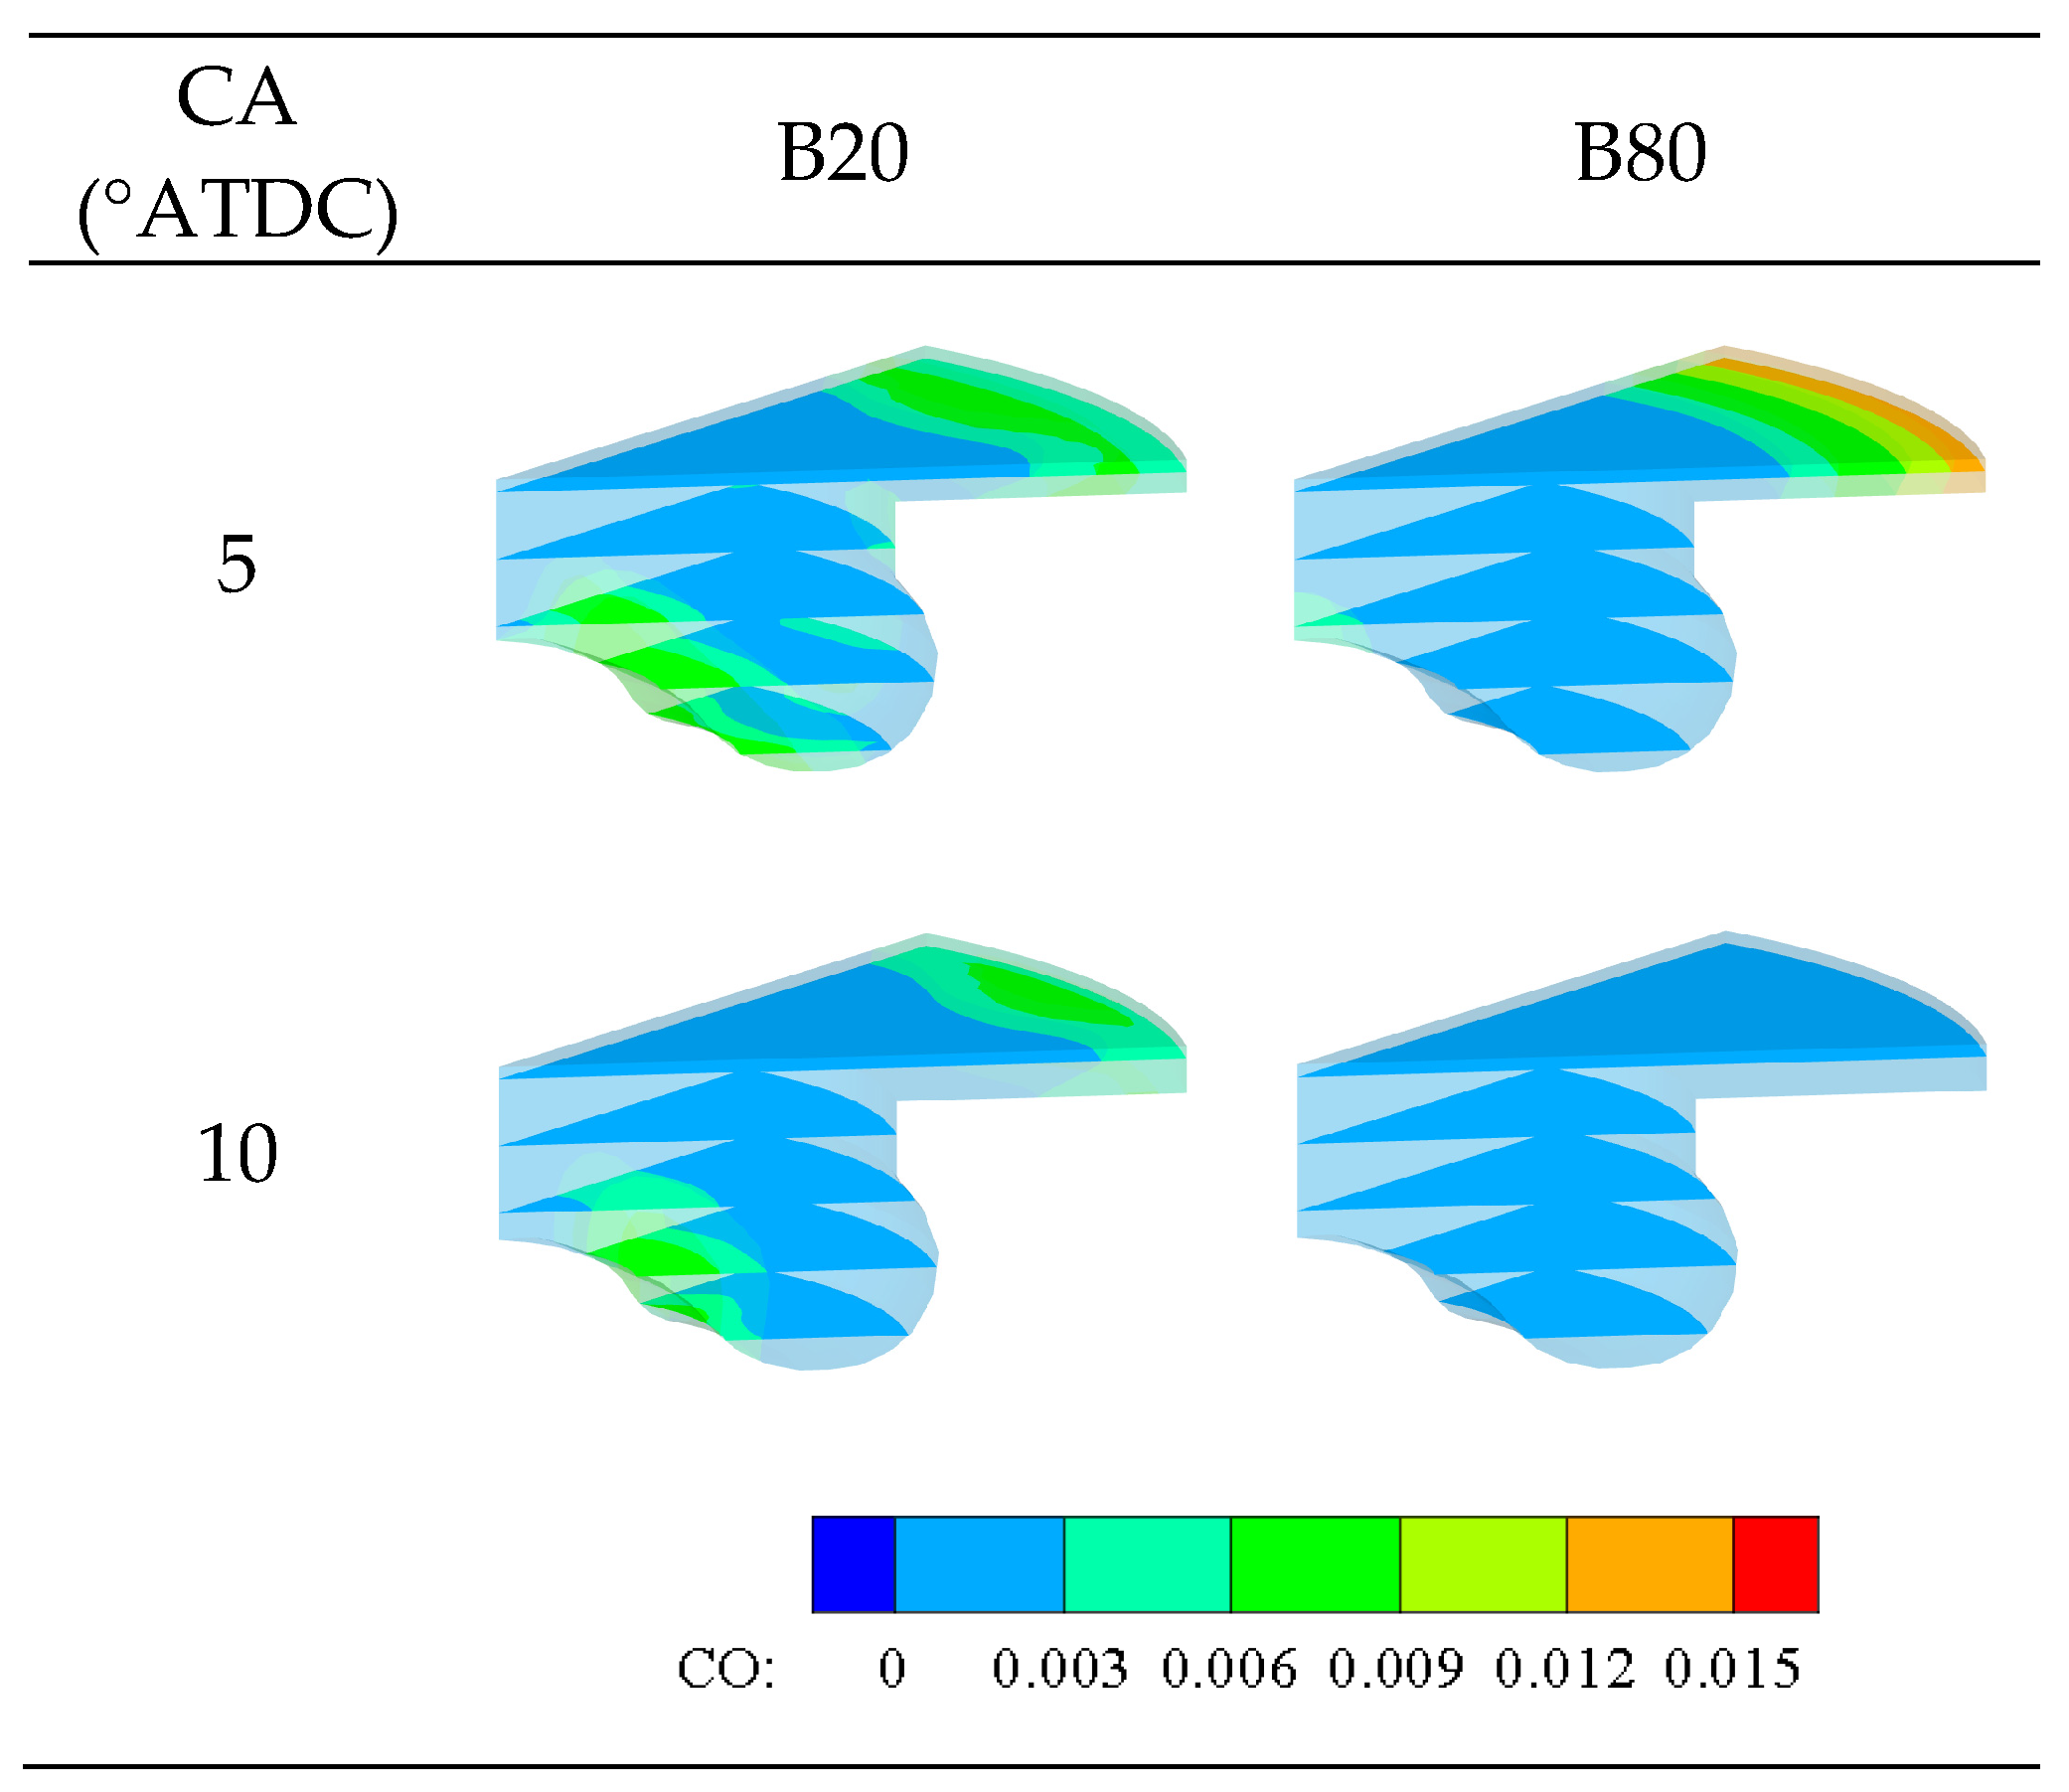
3.2.5. Emissions
3.3. Effects of IVC Timing
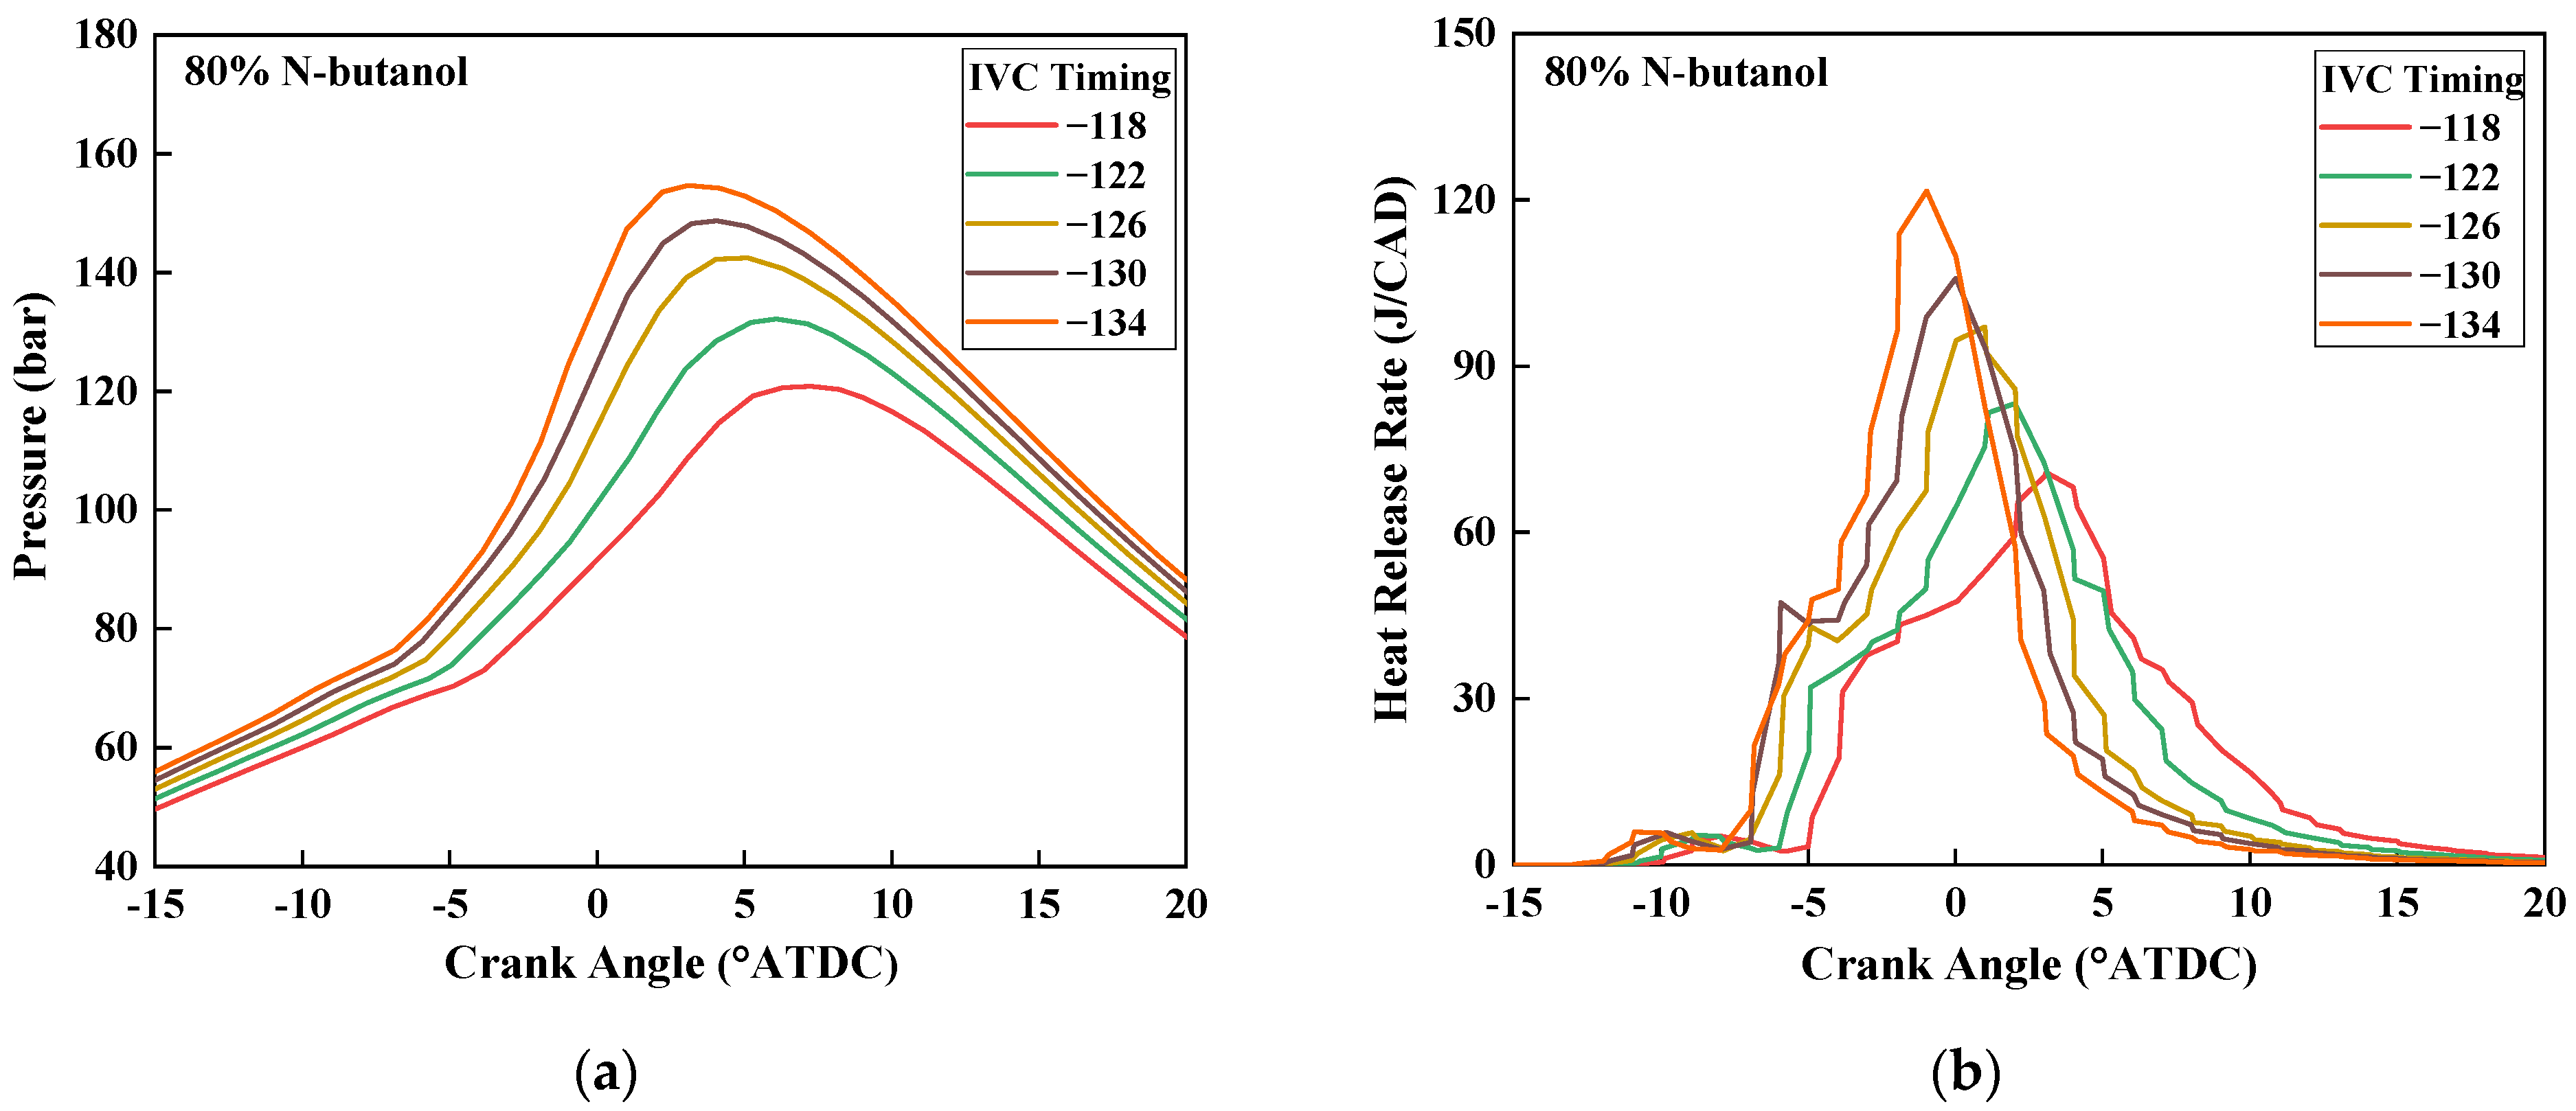
3.3.1. In-Cylinder Pressure and HRR
3.3.2. Maximum PRR
3.3.3. Temperature
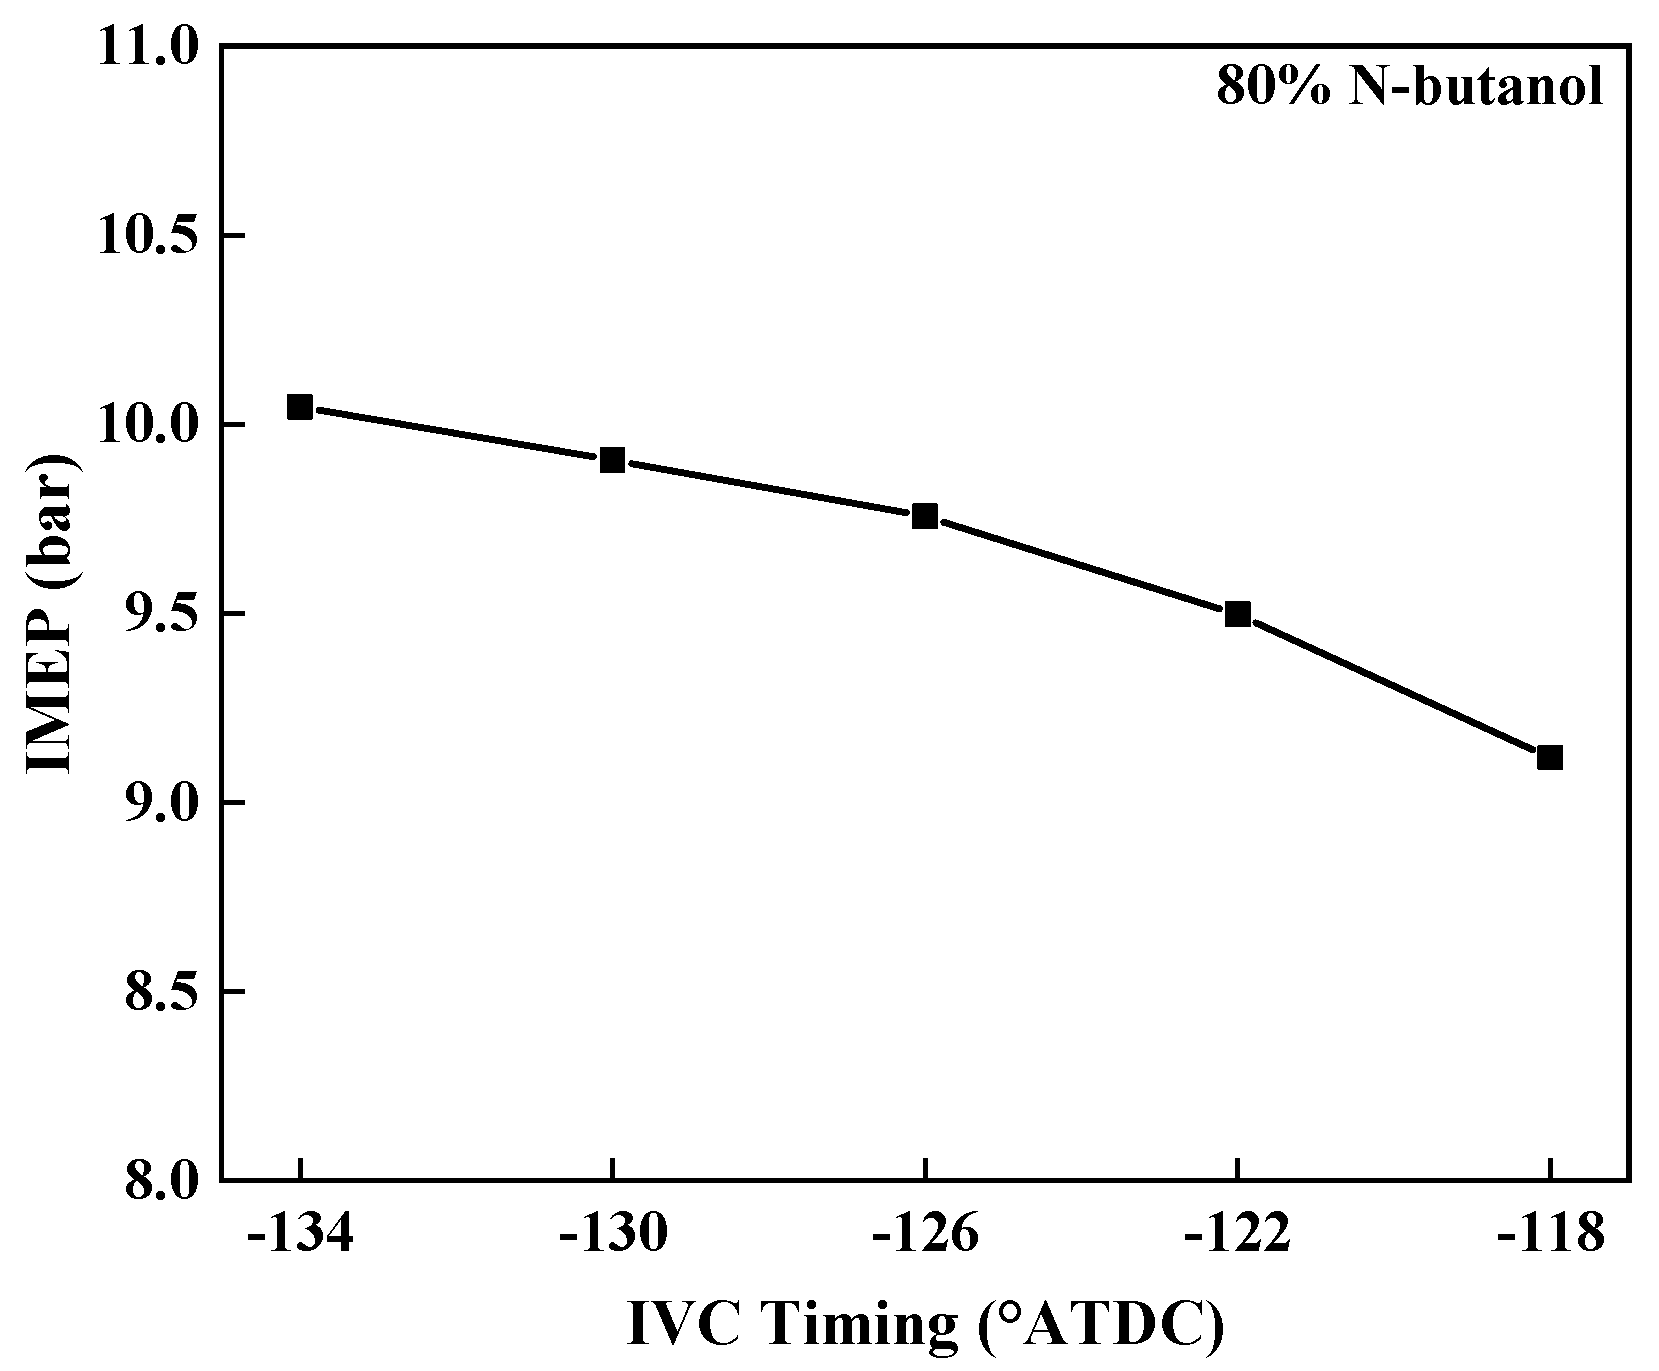
3.3.4. IMEP
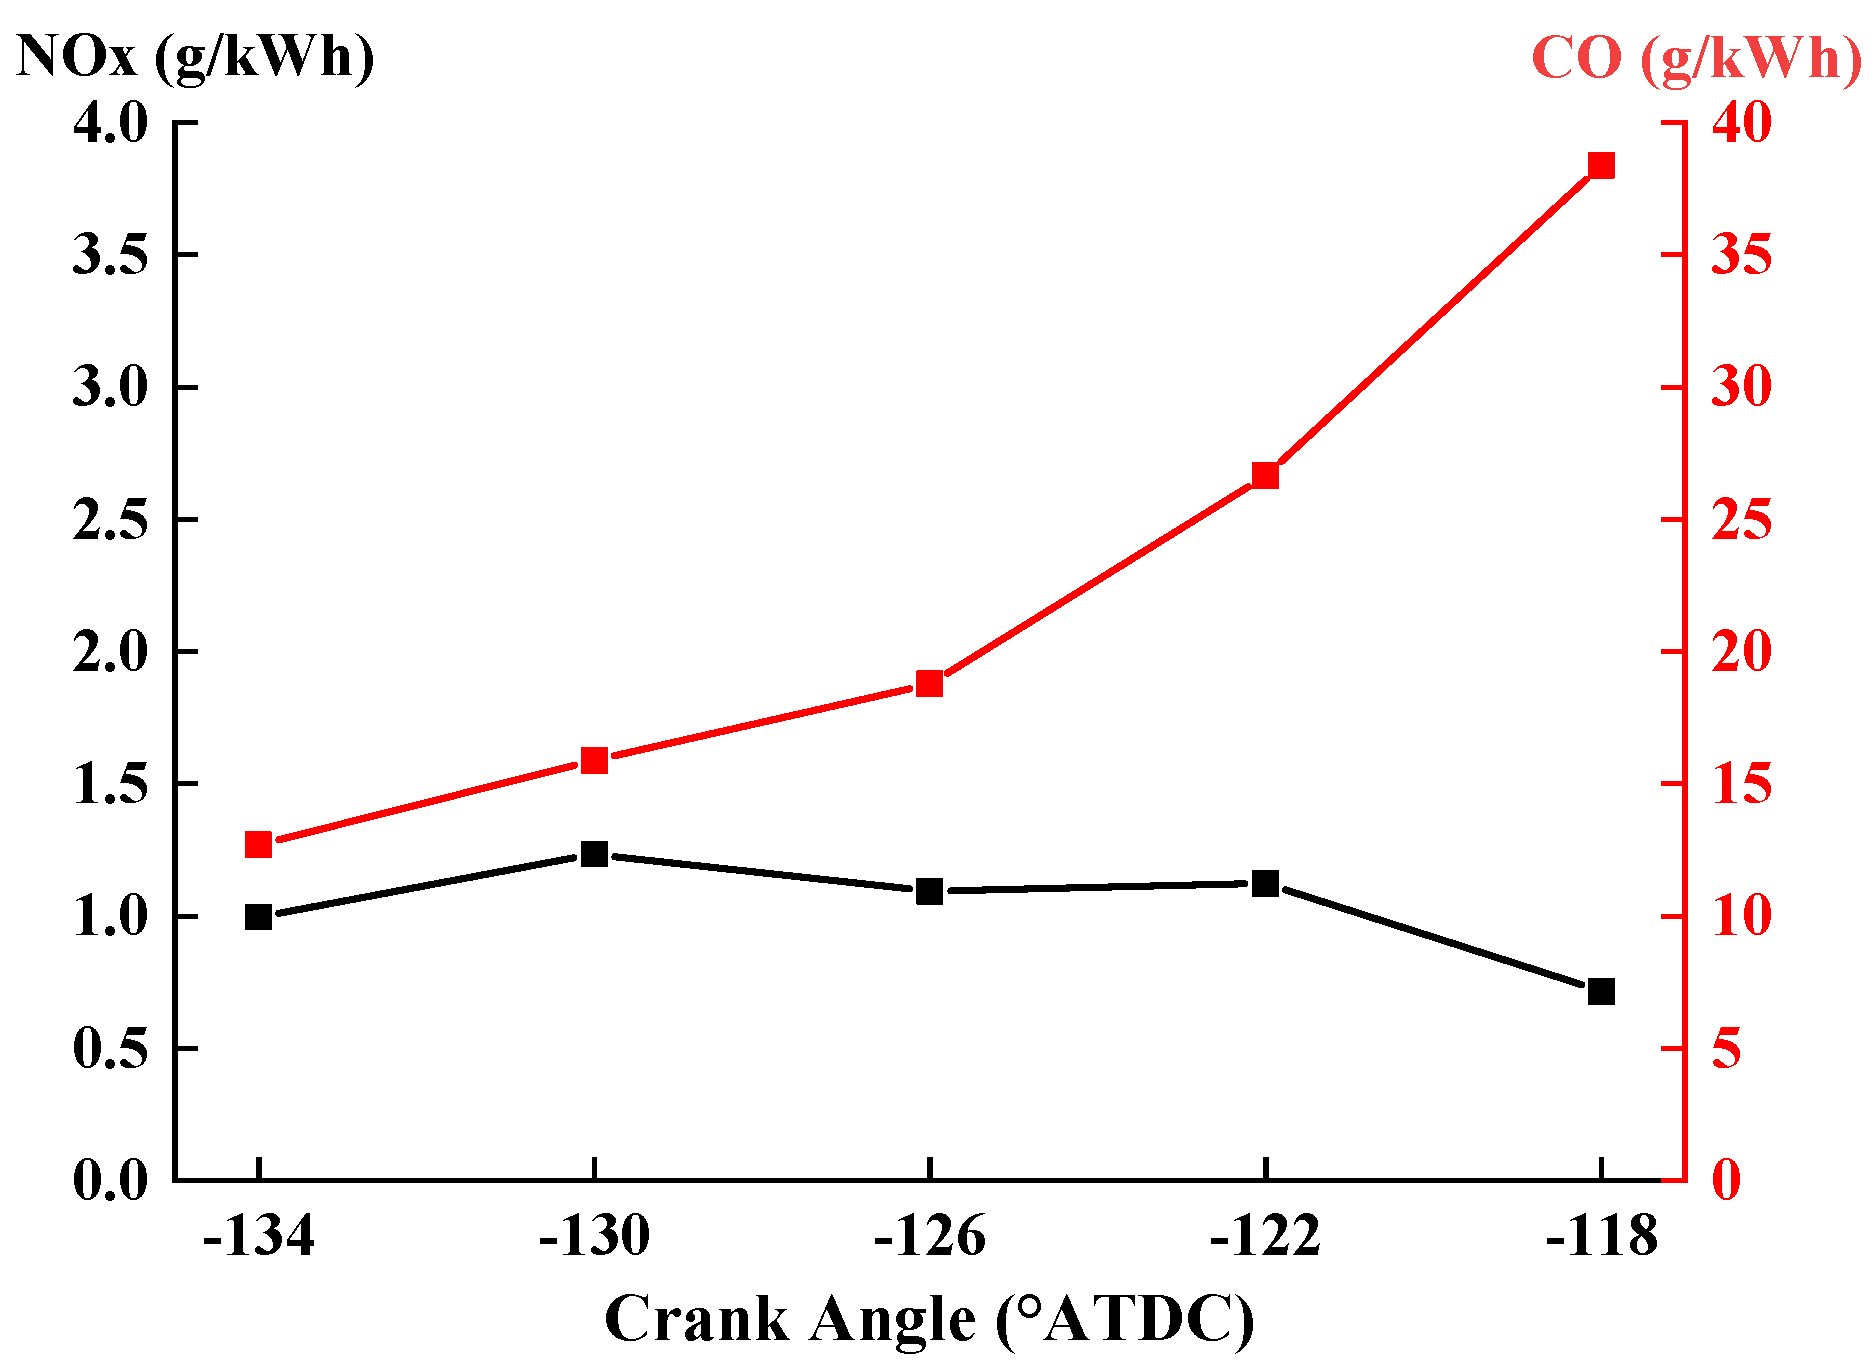
3.3.5. Emissions
4. Conclusions
- The B20 condition exhibited the most intense knocking. Early in the combustion process, low-temperature combustion of n-octanol and n-butanol started in the bowl area, moving gradually in two directions to the centerline and cylinder wall. Additionally, the low-temperature combustion of the n-octanol/n-butanol/air mixture produced the most pronounced pressure oscillation closest to the engine cylinder wall.
- Generally, increasing the premixed n-butanol percentage resulted in an extended ignition delay, lowered peak pressure, and reduced maximum PRR. Meanwhile, continuing to increase the premixed fuel percentage beyond 50% would increase IMEP while decreasing CO and NOx simultaneously. This result indicates that the selection of n-butanol as a premixed fuel is more competitive than gasoline.
- Retarding the IVC timing could also prolong the ignition delay, lower the peak pressure, decrease the maximum PRR, and deteriorate the IMEP. In addition, the CO emissions could be raised, but the NOx emissions decreased slightly.
- Compared with condition B20, which experiences the most intense knocking, the condition with a high premixed percentage (B80) and an IVC timing of −126 °ATDC could improve IMEP by 11.7% and decrease the maximum PRR by 63.4% for the engine.
Author Contributions
Funding
Institutional Review Board Statement
Informed Consent Statement
Data Availability Statement
Conflicts of Interest
References
- Niklawy, W.; Shahin, M.; Amin, M.I.; Elmaihy, A. Comprehensive analysis of combustion phasing of multi-injection HCCI diesel engine at different speeds and loads. Fuel 2022, 314, 123083. [Google Scholar] [CrossRef]
- Agarwal, A.K.; Singh, A.P.; Kumar, V. Particulate characteristics of low-temperature combustion (PCCI and RCCI) strategies in single cylinder research engine for developing sustainable and cleaner transportation solution. Environ. Pollut. 2021, 284, 117375. [Google Scholar] [CrossRef] [PubMed]
- Dimitrova, I.D.; Megaritis, T.; Ganippa, L.C.; Tingas, E.-A. Computational analysis of an HCCI engine fuelled with hydrogen/hydrogen peroxide blends. Int. J. Hydrogen Energy 2022, 47, 10083–10096. [Google Scholar] [CrossRef]
- Lu, Y.; Fan, C.; Liu, Y.; Pei, Y. Effects of speed extension on PCCI combustion and emissions in a heavy-duty diesel engine at medium load. Fuel 2022, 313, 123048. [Google Scholar] [CrossRef]
- Li, J.; Yang, W.; Zhou, D. Review on the management of RCCI engines. Renew. Sustain. Energy Rev. 2017, 69, 65–79. [Google Scholar] [CrossRef]
- Zhou, W.; Xi, H.; Zhou, S.; Zhang, Z.; Shreka, M. Numerical study on knock characteristics and mechanism of a heavy duty natural gas/diesel RCCI engine. Int. J. Hydrogen Energy 2022. [Google Scholar] [CrossRef]
- Karim, G.; Liu, Z. A Predictive Model for Knock in Dual Fuel Engines; SAE Technical Paper 921550; SAE International: Warrendale, PA, USA, 1992. [Google Scholar]
- Valipour Berenjestanaki, A.; Kawahara, N.; Tsuboi, K.; Tomita, E. End-gas autoignition characteristics of PREMIER combustion in a pilot fuel-ignited dual-fuel biogas engine. Fuel 2019, 254, 115634. [Google Scholar] [CrossRef]
- Yıldız, M.; Çeper, B.A. A comparative study on gasoline/diesel-fueled RCCI combustion at different premixed ratios and high-EGR diesel CI combustion in an IC engine under low load conditions. Fuel 2022, 324, 124596. [Google Scholar] [CrossRef]
- Yousefi, A.; Guo, H.; Birouk, M. Split diesel injection effect on knocking of natural gas/diesel dual-fuel engine at high load conditions. Appl. Energy 2020, 279, 115828. [Google Scholar] [CrossRef]
- Li, J.; Yu, X.; Xie, J.; Yang, W. Mitigation of high pressure rise rate by varying IVC timing and EGR rate in an RCCI engine with high premixed fuel ratio. Energy 2020, 192, 116659. [Google Scholar] [CrossRef]
- Wang, L.; Liu, J.; Ji, Q.; Sun, P.; Li, J.; Wei, M.; Liu, S. Experimental study on the high load extension of PODE/methanol RCCI combustion mode with optimized injection strategy. Fuel 2022, 314, 122726. [Google Scholar] [CrossRef]
- Sun, W.; Zeng, W.; Guo, L.; Zhang, H.; Yan, Y.; Lin, S.; Zhu, G.; Sun, Y. Experimental investigation into the effects of pilot fuel and intake condition on combustion and emission characteristics of RCCI engine. Fuel 2022, 325, 124912. [Google Scholar] [CrossRef]
- Chen, Z.; He, J.; Chen, H.; Geng, L.; Zhang, P. Comparative study on the combustion and emissions of dual-fuel common rail engines fueled with diesel/methanol, diesel/ethanol, and diesel/n-butanol. Fuel 2021, 304, 121360. [Google Scholar] [CrossRef]
- García, A.; Monsalve-Serrano, J.; Villalta, D.; Zubel, M.; Pischinger, S. Potential of 1-octanol and di-n-butyl ether (DNBE) to improve the performance and reduce the emissions of a direct injected compression ignition diesel engine. Energy Convers. Manag. 2018, 177, 563–571. [Google Scholar] [CrossRef]
- Li, J.; Liang, Y.; Yang, W. Combustion characteristics and emissions formation of a compression ignition engine fueled with C8 biofuels blends. Energy Sources Part A Recovery Utili. Environ. Eff. 2022, 44, 5991–6008. [Google Scholar] [CrossRef]
- Kerschgens, B.; Cai, L.; Pitsch, H.; Heuser, B.; Pischinger, S. Di-n-buthylether, n-octanol, and n-octane as fuel candidates for diesel engine combustion. Combust. Flame 2016, 163, 66–78. [Google Scholar] [CrossRef]
- Zhao, X.; Ma, X.; Chen, B.; Shang, Y.; Song, M. Challenges toward carbon neutrality in China: Strategies and countermeasures. Resour. Conserv. Recycl. 2022, 176, 105959. [Google Scholar] [CrossRef]
- Maghbouli, A.; Yang, W.; An, H.; Li, J.; Chou, S.K.; Chua, K.J. An advanced combustion model coupled with detailed chemical reaction mechanism for D.I diesel engine simulation. Appl. Energy 2013, 111, 758–770. [Google Scholar] [CrossRef]
- Li, J.; Zhou, D.; Yang, W. A multi-component reaction mechanism of n-butanol, n-octanol, and di-n-buthylether for engine combustion. Fuel 2020, 275, 117975. [Google Scholar] [CrossRef]
- Daubert, T.E. Physical and Thermodynamic Properties of Pure Chemicals: Data Compilation. In Design Institute for Physacal Property Data (DIPPR); CRC Press: Boca Raton, FL, USA, 1989. [Google Scholar]
- Han, X.; Zheng, M.; Tjong, J.; Li, T. Suitability Study of n-Butanol for Enabling PCCI and HCCI and RCCI Combustion on a High Compression-Ratio Diesel Engine; SAE Technical Paper 2015-01-1807; SAE International: Warrendale, PA, USA, 2015. [Google Scholar]
- Wang, D.; Yu, X.; Li, J.; Yang, W. Effects of combustion chamber shapes on combustion and emission characteristics for the n-octanol fueled compression ignition engine. J. Energy Eng. 2022, 148, 04022011. [Google Scholar] [CrossRef]
- Zhang, T.; Nilsson, L.J.; Björkholtz, C.; Munch, K.; Denbratt, I. Effect of using butanol and octanol isomers on engine performance of steady state and cold start ability in different types of Diesel engines. Fuel 2016, 184, 708–717. [Google Scholar] [CrossRef]
- Zhou, D.Z.; Yang, W.M.; An, H.; Li, J. Application of CFD-chemical kinetics approach in detecting RCCI engine knocking fuelled with biodiesel/methanol. Appl. Energy 2015, 145, 255–264. [Google Scholar] [CrossRef]
- Long, L.; Reitz, R.D.; Iyer, C.O.; Yi, J.W. Modeling Knock in Spark-Ignition Engines Using a G-equation Combustion Model Incorporating Detailed Chemical Kinetics; SAE Technical Paper 2007-01-0165; SAE International: Warrendale, PA, USA, 2007. [Google Scholar]
- Li, J.; Yang, W.; An, H.; Zhao, D. Effects of fuel ratio and injection timing on gasoline/biodiesel fueled RCCI engine: A modeling study. Appl. Energy 2015, 155, 59–67. [Google Scholar] [CrossRef]
- Cai, L.; Uygun, Y.; Togbé, C.; Pitsch, H.; Olivier, H.; Dagaut, P.; Sarathy, S.M. An experimental and modeling study of n-octanol combustion. Proc. Combust. Inst. 2015, 35, 419–427. [Google Scholar] [CrossRef]


| Engine Type | HCCI Engine | CCI Engine |
|---|---|---|
| fuel | n-butanol | n-octanol |
| bore (cm) | 8.6 | 7.5 |
| stroke (cm) | 8.6 | 8.83 |
| swept volume (L) | 0.499 | 0.39 |
| compression ratio | 18.2 | 15 |
| number of spray holes | -- | 8 |
| intake valve close (°ATDC) | −135 | −134.6 |
| exhaust valve open (°ATDC) | 100 | 120 |
| Case No. | 1 | 2 | 3 | 4 |
|---|---|---|---|---|
| Engine type | HCCI | HCCI | CCI | CCI |
| Fuel type | n-butanol | n-butanol | n-octanol | n-octanol |
| IMEP, bar | 6.5 | 6.5 | 6.8 | 9.4 |
| Speed, r/min | 1500 | 1500 | 1500 | 2280 |
| SOI timing, °ATDC | N.A. | N.A. | −9.5 | −5.3 |
| Injection duration, °CA | N.A. | N.A. | 5.5 | 17.4 |
| EGR rate, % | 46% | 57% | 47.8 | 43.8 |
| N-Butanol | N-Octanol | |
|---|---|---|
| boiling temperature, °C | 118 | 195 |
| density, kg/m3 | 810 | 817 |
| kinematic viscosity, mm2/s (40 °C) | 2.63 | 7.3 |
| heat of vaporization, kJ/kg | 582 | 562 |
| cetane number | 17–25 | 37 |
| lower heating value, MJ/kg | 33.21 | 37.6 |
| oxygen content, wt.% | 21.58 | 12.3 |
| Resonance Frequency | f10 | f 20 | f 01 | f 30 | f 40 | f 11 |
|---|---|---|---|---|---|---|
| theoretical value (kHz) | 7.04 | 11.67 | 14.65 | 16.06 | 20.33 | 20.38 |
| vibration mode |  |  |  |  |  |  |
Publisher’s Note: MDPI stays neutral with regard to jurisdictional claims in published maps and institutional affiliations. |
© 2022 by the authors. Licensee MDPI, Basel, Switzerland. This article is an open access article distributed under the terms and conditions of the Creative Commons Attribution (CC BY) license (https://creativecommons.org/licenses/by/4.0/).
Share and Cite
Li, J.; Wang, D.; Zhuang, C.; Gong, S.; Li, S. Numerical Investigation of the Knocking Combustion Characteristics of the N-Butanol/N-Octanol RCCI Engine. Processes 2022, 10, 2142. https://doi.org/10.3390/pr10102142
Li J, Wang D, Zhuang C, Gong S, Li S. Numerical Investigation of the Knocking Combustion Characteristics of the N-Butanol/N-Octanol RCCI Engine. Processes. 2022; 10(10):2142. https://doi.org/10.3390/pr10102142
Chicago/Turabian StyleLi, Jing, Dajian Wang, Cong Zhuang, Shiqi Gong, and Songhong Li. 2022. "Numerical Investigation of the Knocking Combustion Characteristics of the N-Butanol/N-Octanol RCCI Engine" Processes 10, no. 10: 2142. https://doi.org/10.3390/pr10102142
APA StyleLi, J., Wang, D., Zhuang, C., Gong, S., & Li, S. (2022). Numerical Investigation of the Knocking Combustion Characteristics of the N-Butanol/N-Octanol RCCI Engine. Processes, 10(10), 2142. https://doi.org/10.3390/pr10102142