Article

Effects of Injection Timing and Injection Volume on the Combustion and Emissions of a Two-Stroke Kerosene Direct Injection Engine

1
School of Mechanical and Electrical Engineering, Shandong Jianzhu University, Jinan 250101, China
2
School of Mechanical and Power Engineering, Nanjing Tech University, Nanjing 211816, China
3
School of Information and Electrical Engineering, Shandong Jianzhu University, Jinan 250101, China
*
Author to whom correspondence should be addressed.
Processes 2022, 10(9), 1728; https://doi.org/10.3390/pr10091728
Submission received: 3 August 2022 / Revised: 25 August 2022 / Accepted: 26 August 2022 / Published: 31 August 2022
(This article belongs to the Special Issue Combustion and Emission Performance of Internal Combustion Engines)

Abstract

:
To study the influence of injection time and injection volume on the working process of a two-stroke kerosene direct injection engine, an experimental study was carried out on an improved two-stroke inline three-cylinder gasoline engine, combined with calculations and analysis with GT-POWER and AVL FIRE software. The results showed that when the injection end angle increased from 50° to 70° before the top dead center (BTDC), the average pressure and temperature in the cylinder increased rapidly, the peak value of pressure and temperature and the cumulative heat release increased, and the combustion process in the cylinder was more sufficient. The fuel injection volume was set to 7.5 mg, 8 mg, and 8.5 mg. With increasing fuel injection volume, the average pressure and average temperature first increased and then decreased, the peak value gradually increased, the heat release rate and cumulative heat release increased sharply, the corresponding time gradually advanced, and the peak value gradually increased. With increasing fuel injection volume, CO, NO, and soot gradually increased, while CO2 slightly decreased.

1. Introduction

Kerosene fuel is widely used as a power source in the aviation field, for example, in small UAVs and special vehicles for the military [1,2]. Kerosene fuel has a high flash point, does not readily evaporate, and is relatively safe to use. However, compared with gasoline, when kerosene is used to replace traditional fuel for power, the combustion characteristics can vary greatly [3,4]. The structure and control parameters of an engine, such as injection time, injection volume, and intake air temperature, have an important impact on the combustion of kerosene fuel and the generation of emissions [5,6,7]. The injection time has a strong influence on the performance of two-stroke kerosene direct injection engines [8,9]. Some scientific research institutes have conducted numerical simulation research on injection time and injection volume through the three-dimensional computational fluid dynamics (CFD) numerical simulation tool AVL FIRE. For example, Gu et al. [10], from the Institute of Internal Combustion Engines of Tianjin University, carried out a numerical simulation of a two-stroke direct injection gasoline engine, and the effect of injection time on the mixture concentration distribution in the cylinder of this engine was analyzed. Jiang et al. [11], from Nanchang University, researched the concentration field distribution in the cylinder, and the variation trend of the mixture distribution with different injection times was obtained. Wei [12], from Jilin University, established a three-dimensional numerical simulation method, geometric model, computational grid, and combustion model of the EA888 engine. The effects of different fuel injection volumes on the amount of soot in the cylinder of the engine were researched [12].
In summary, at present, little research has been performed on the combustion and emission characteristics of two-stroke direct kerosene injection engines under different injection volumes at home and abroad; therefore, it is necessary to further study the effect of fuel injection volume on the combustion and emission of two-stroke kerosene direct injection engines.

2. Numerical Modeling of the Cylinder Working Process of a Two-Stroke Kerosene Direct Injection Engine

First, combined with the structural characteristics of a two-stroke kerosene engine, a simulation model of the working process in a cylinder is established.

2.1. Ignition and Combustion Model

The cylinder working process of the two-stroke kerosene direct injection engine belongs to the spark ignition premixed turbulent combustion mode [13]. The coherent flame model is selected in the simulation process [14], and the equation is listed as follows:
t   +   x j ( u j ) x j ( v t σ x j )   =   α j K     β j ρ f r ρ f u   ×   y f u f r S L 2
ρ f u t   +   x j ( u j ρ f u ) x j ( u j ρ f u ) x j ( v t σ ρ f u ρ f u x j )   =   y f u f r S L
where Σ is the flame surface density, vt is the kinematic viscosity, K is the average elongation, SL is the flame velocity, αj and βj are harmonic constants, ρfr is the gas density, and yfufr is the fuel mass fraction.
The extended coherent flame mode (ECFM) is a combustion model derived from an extension of the relevant flame model, selecting the ECFM model [15].
The two-step chemical reaction mechanism in ECFM is expressed as follows:
C n H m O q   +   ( n + m 4 q 2 ) O 2     n C O 2   + m 2 H 2 O
C n H m O q   + ( n 2 q 2 ) O 2     n C O + m 2 H 2
where m, n, and q are the numbers of carbon, hydrogen, and oxygen atoms in a fuel, respectively.

2.2. Nitrogen Oxide and Soot Models

2.2.1. Nitrogen Oxide Generation Model

The reaction mechanism of NOX can be expressed as the chemical reaction shown in Table 1.
The net yield of nitrogen oxides can be expressed as
t   +   x j ( u j )     x j ( v t σ x j )   =   α j K     β j ρ f r ρ f u   ×   y f u f r S L 2

2.2.2. Soot Generation Model

According to the two-step empirical model proposed by Hiroyasu et al., the soot concentration in the exhaust gas emitted by an engine is the result of the comprehensive interaction of the generation rates d M f o r m / d t and d M o x i d / d t :
d M s o o t d t = d M f o r m d t d M o x i d d t
d M form d t = M s f = K f M F V
d M oxid d t = M s o = 6 M W c ρ s d s M S ψ T
The Arrhenius expression is used for the reaction rates of formation and oxidation, as follows:
K f = A f P 0.5 e x p ( - E f / R T )
K o = A o P 1.8 e x p ( - E o / R T )
where A f is the prefactor, M F V is the fuel vapor quality, P is the pressure, E i is the activation energy, M W c is the carbon molecular weight, ρ S is the soot density, d S is the average soot particle diameter, M S is the soot quality, and ψ T is the surface reaction rate.

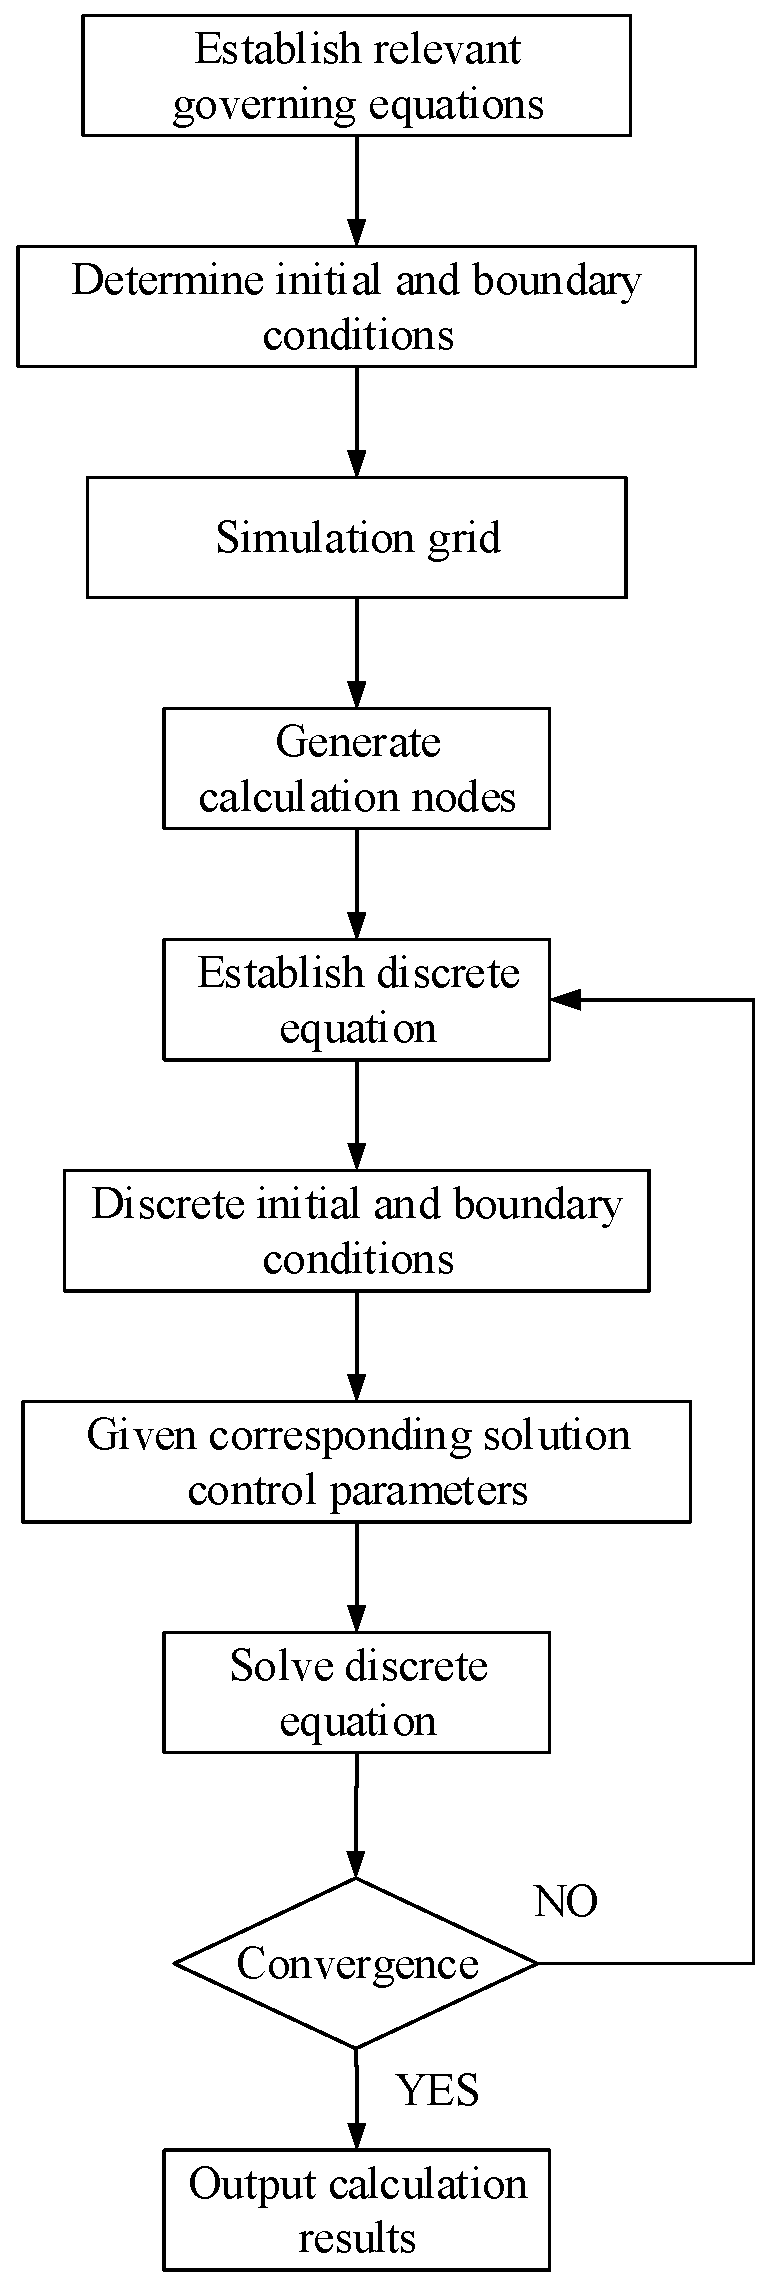
2.3. Numerical Calculation Method
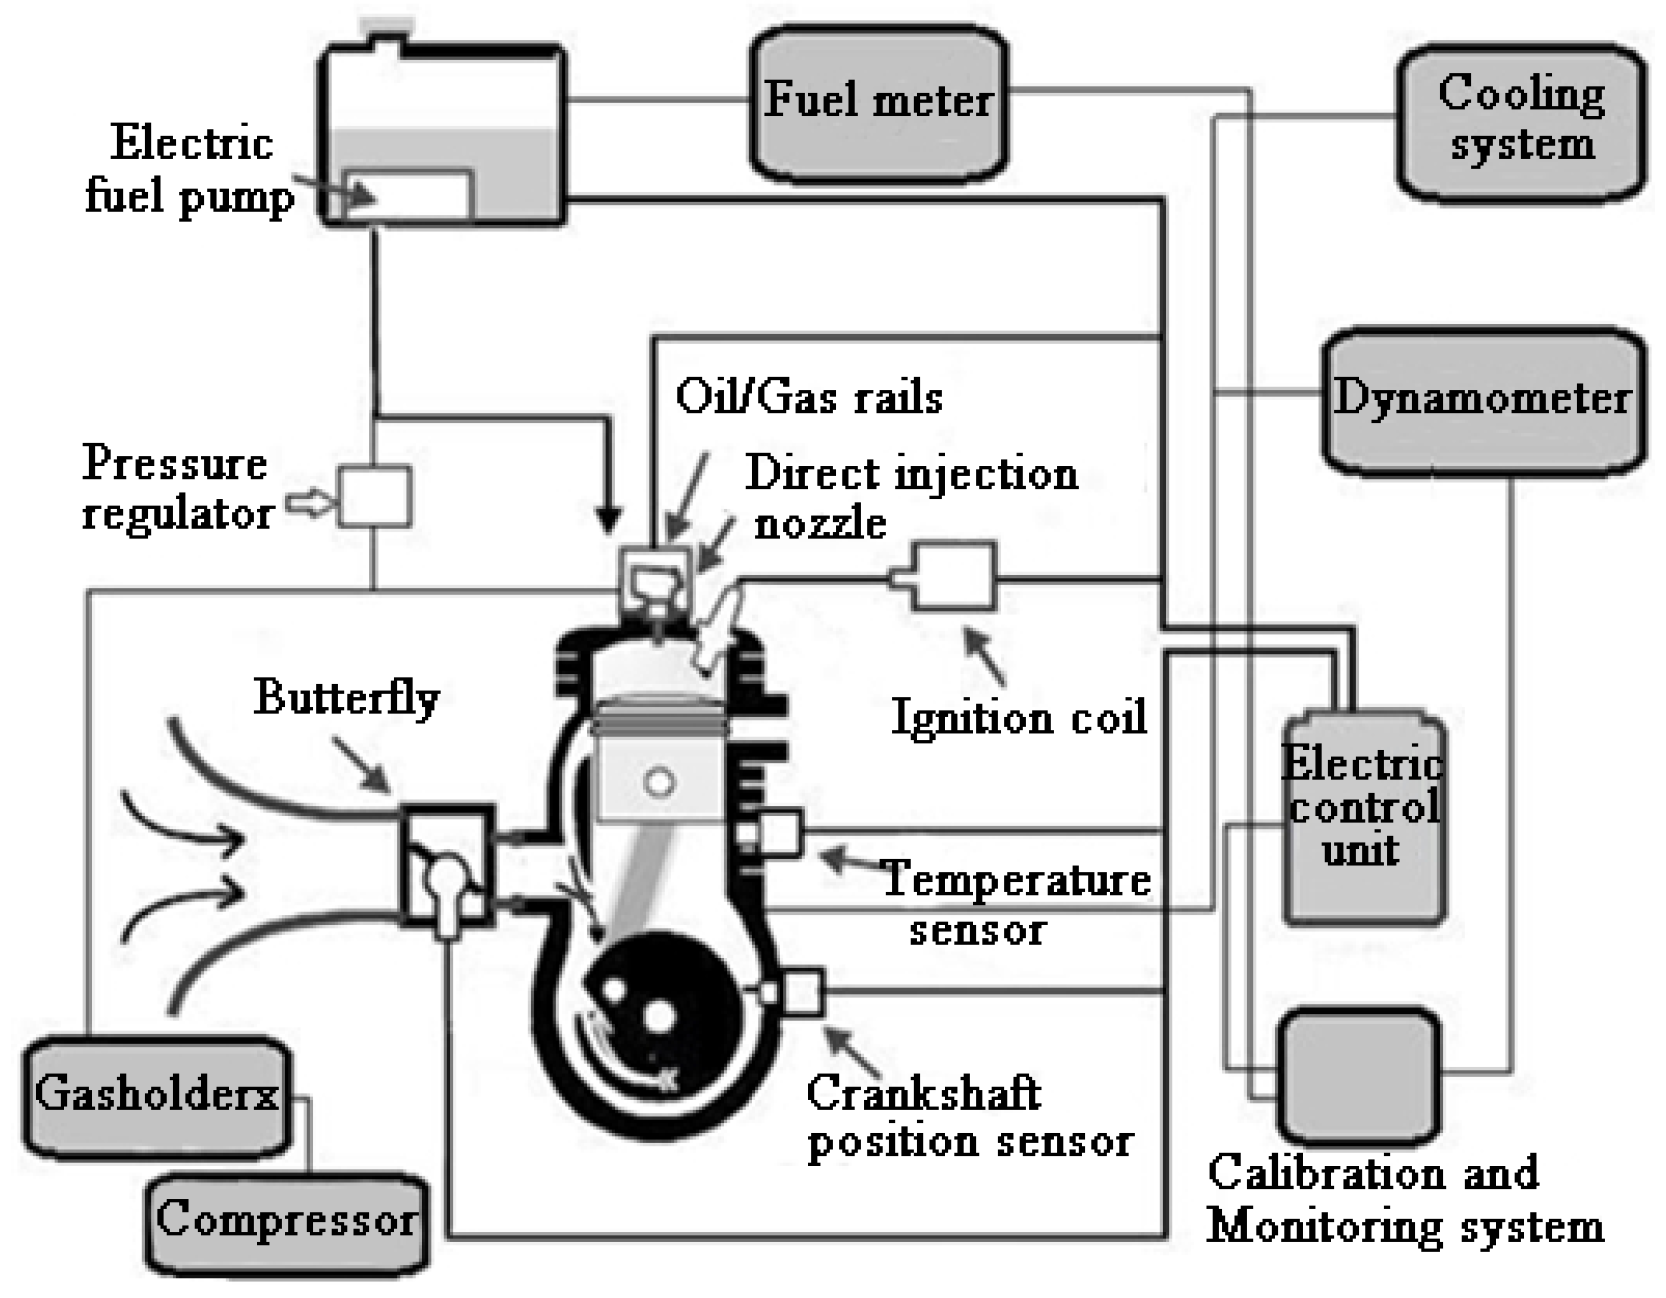
The AVL FIRE software (V2013.2, AVL List GmbH, Austria, 2013) was used for simulation calculation, and the calculation process is shown in Figure 1.

3. Test Equipment

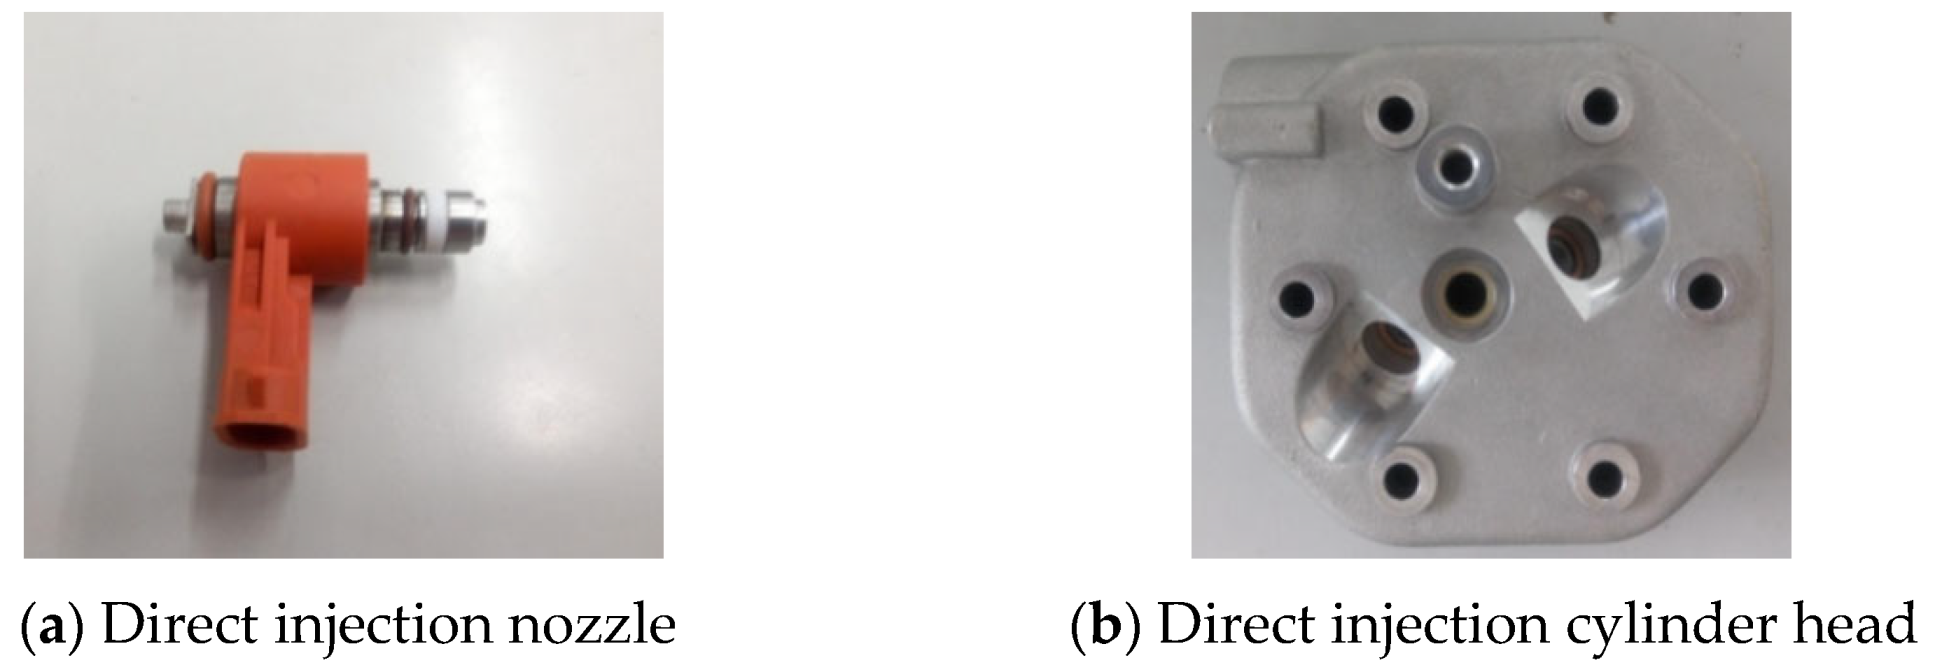
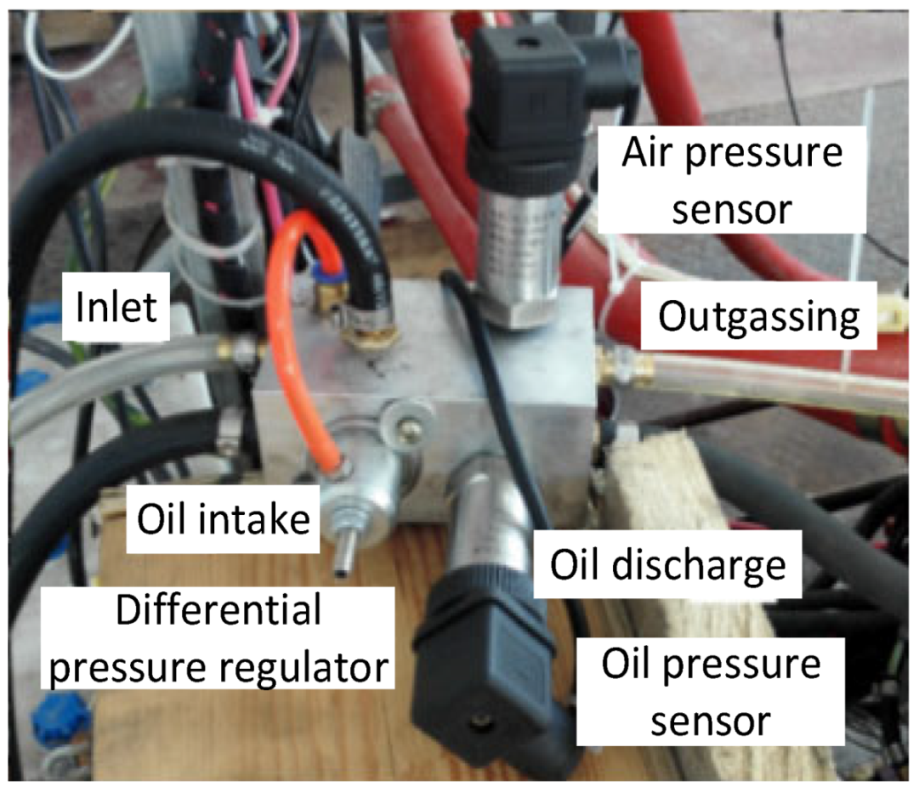
3.1. Combustion System

The engine used in this paper is based on a two-stroke inline three-cylinder intake port injection gasoline engine, in which the shape of the combustion chamber changes from a symmetrical basin to an offset deep pit bathtub. The direct injection nozzle adopts an air-assisted atomizer provided by the Australian Orbital company, as shown in Figure 2. Due to the difficulty in the atomization of heavy oil fuel relative to gasoline and the poor cold start performance, the low-pressure air-assisted fuel injection technology is adopted in the process of the direct injection modification of the prototype machine. The fuel atomization particles are small, and the spray characteristics are good. The average Souter diameter is about 5–8 μm. Table 2 is the comparison of physical and chemical properties between 3# aviation kerosene and gasoline. The basic parameters of the engine before and after modification are shown in Table 3.

3.2. Experimental Prototype

An air-assisted injection was adopted, and the block diagram of the test bench for the direct injection of kerosene in the cylinder is shown in Figure 3. Figure 4 is a photograph of the experimental prototype. Figure 5 shows the oil/air pressure difference regulation test system. Figure 6 is the control software interface used during the test; the control software monitors the parameters of the engine in real time.

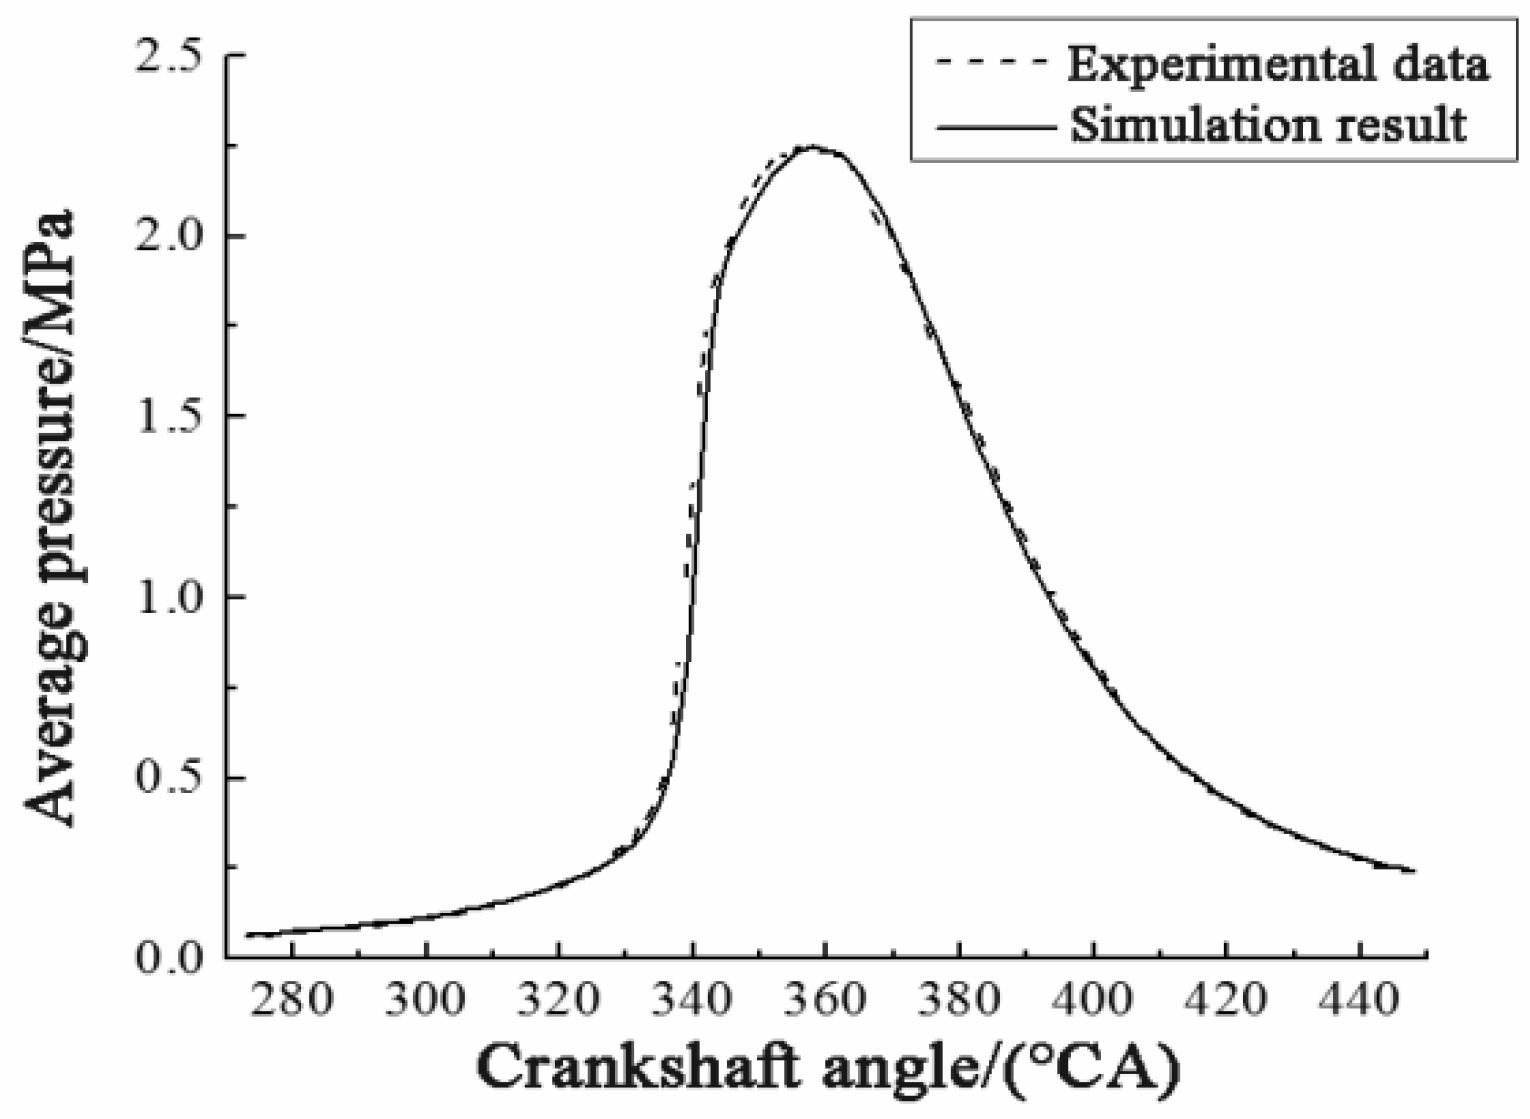
3.3. Validation of Numerical Calculation Model

In order to verify the validity of the three-dimensional combustion numerical model of the two-stroke kerosene direct injection engine established in this paper, the numerical simulation results of the in-cylinder pressure of the working cycle were compared with the in-cylinder pressure signal curve obtained from the bench test at the engine speed of 3000 r/min and 16% load condition. The results are shown in Figure 7.
It can be seen in Figure 7 that the in-cylinder pressure curve in the numerical simulation results is basically consistent with the in-cylinder pressure data obtained from the bench test, which verifies the established three-dimensional combustion numerical model and calculation method of the two-stroke kerosene direct injection engine; thus, the method is suitable for the numerical simulation of the combustion process of the engine.

4. Effect of Injection Time on Combustion and Emission

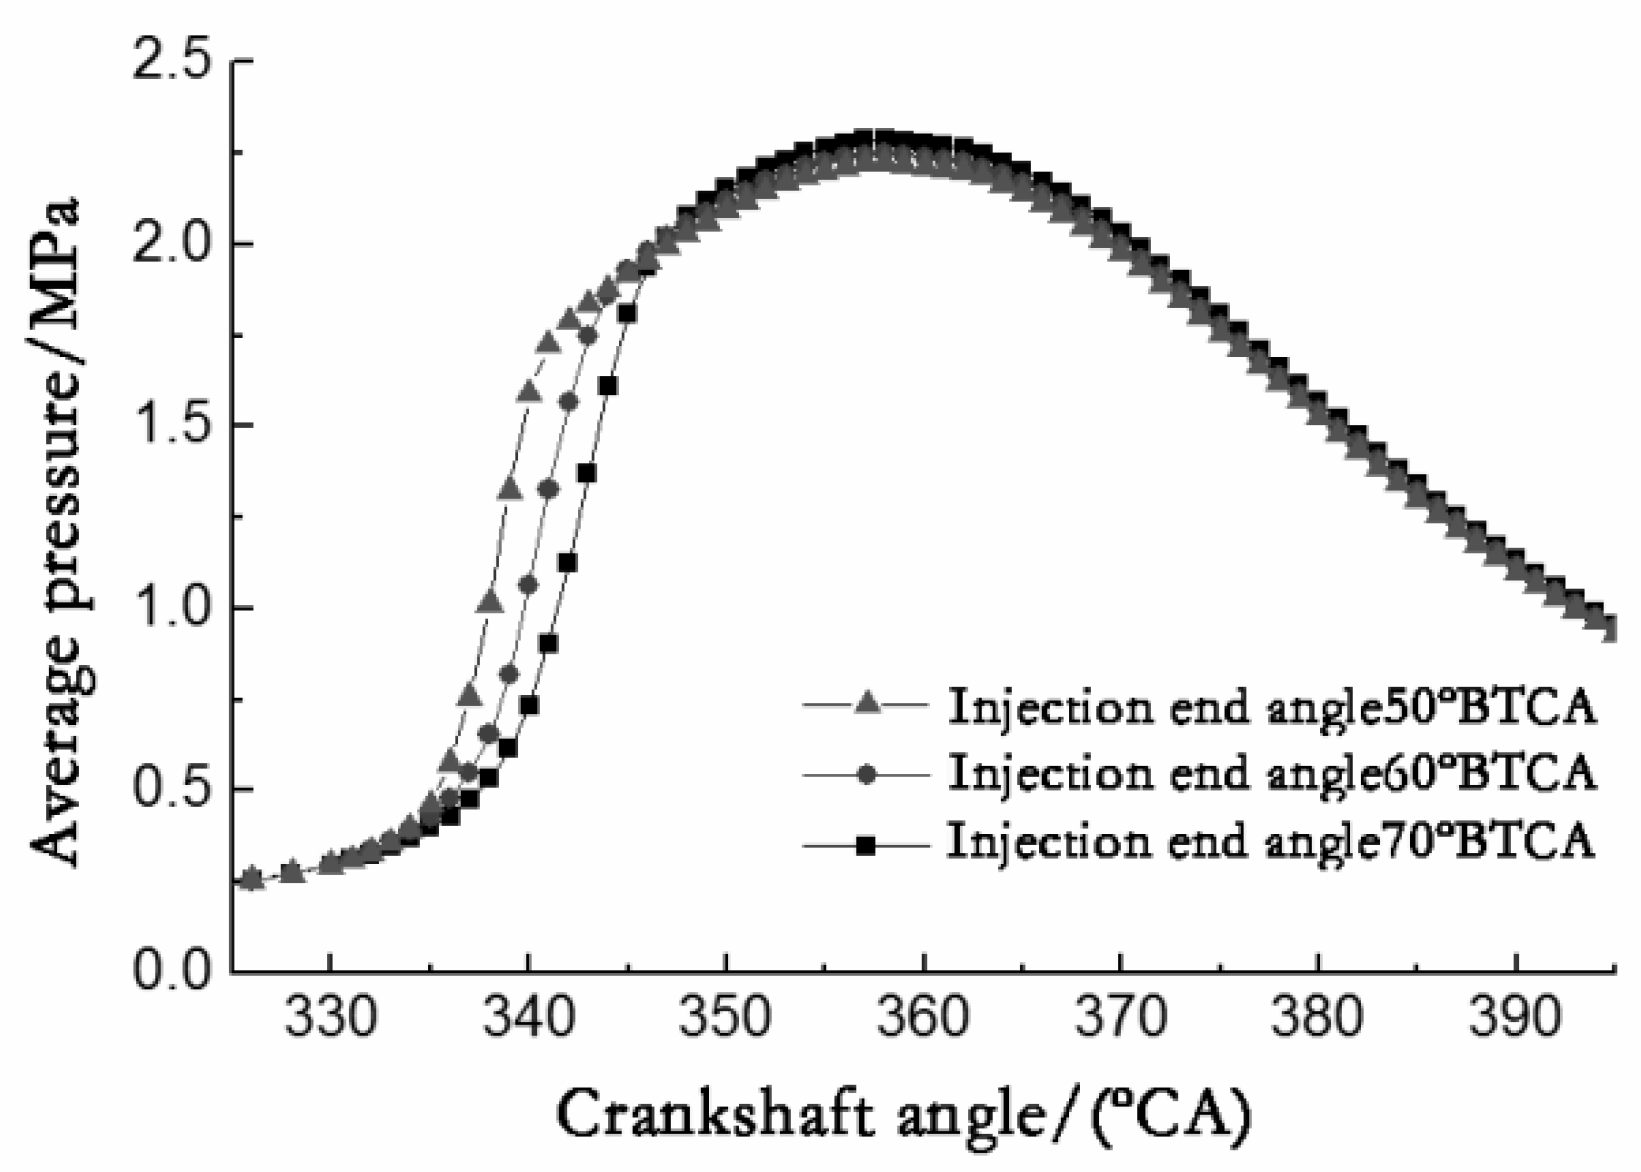
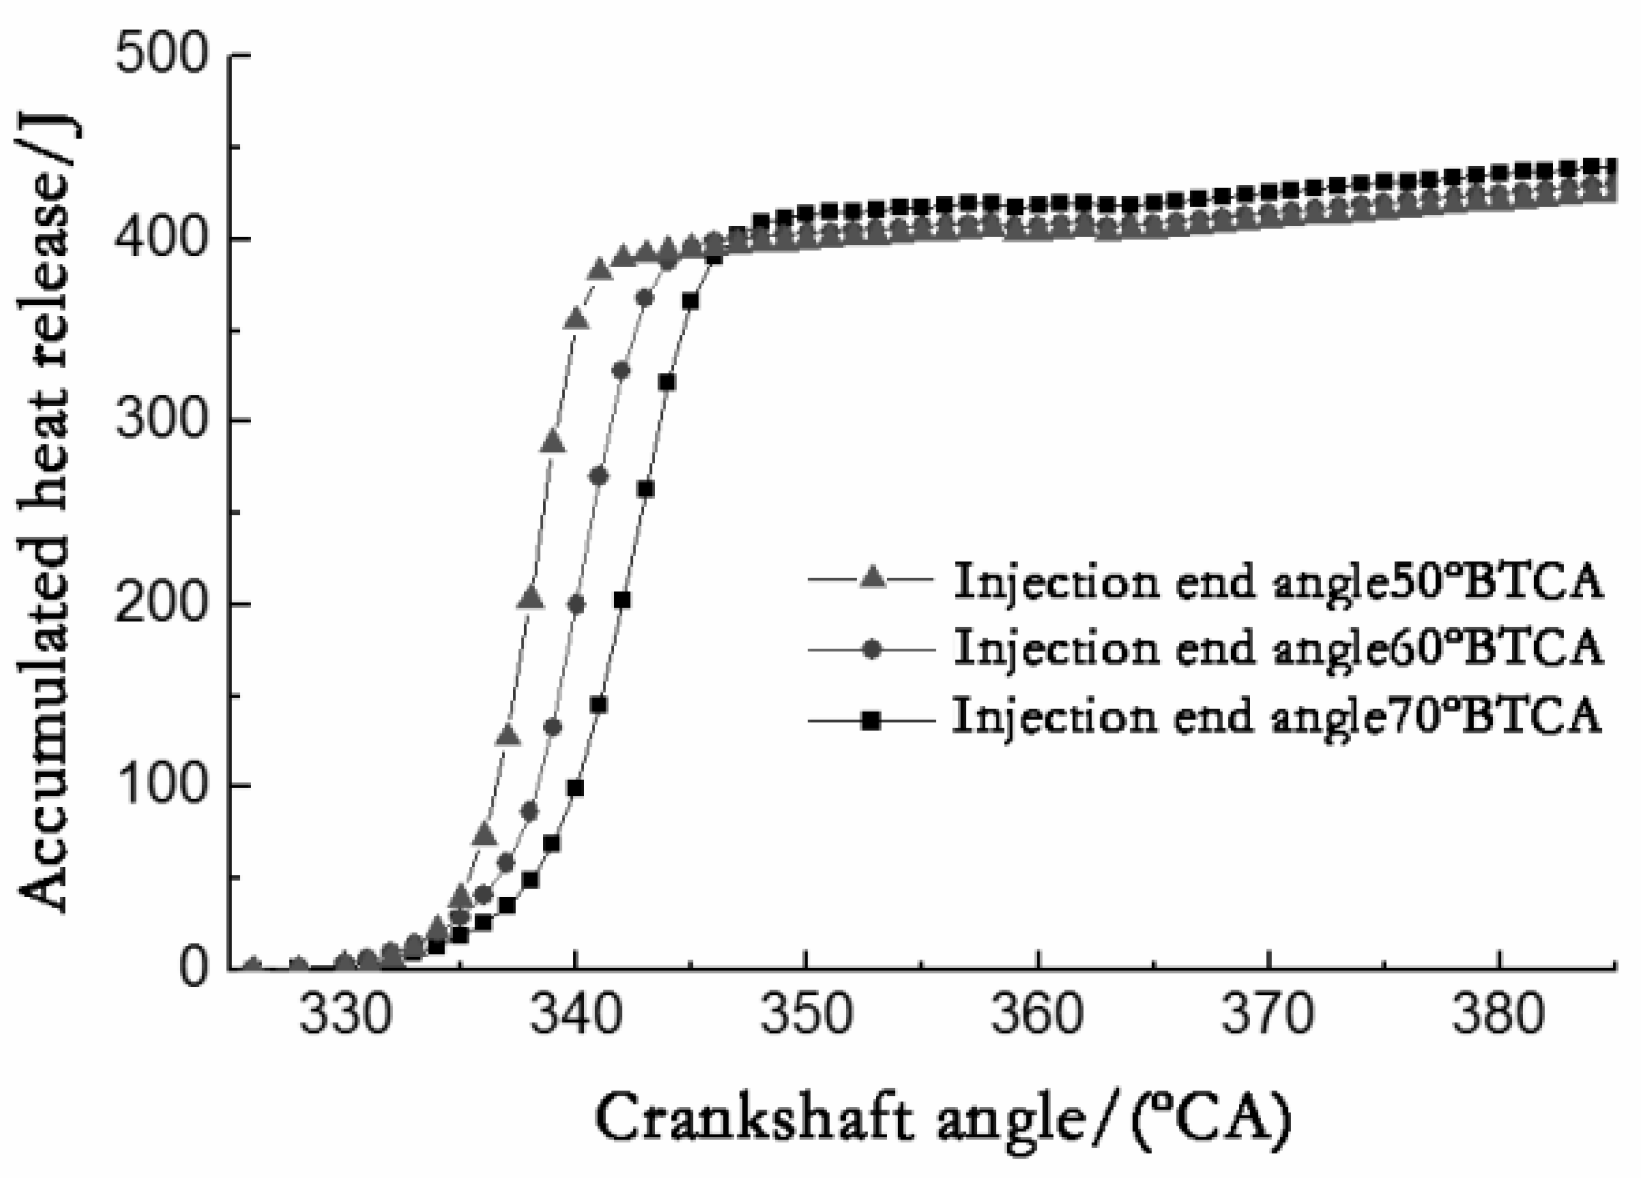
4.1. Effect of Injection End Angle on Combustion Characteristics

The speed was set to 3000 r/min, the load was set to 16%, the ignition advance angle was set to 30° before the top dead center (BTDC), the ignition energy was set to 30 mJ, and the fuel injection volume was set to 8.5 mg. The variation in the engine during the cylinder working process when the injection end angle was set to 50°–70° BTDC was calculated.
Figure 8 shows the average pressure results in the cylinder with different injection end angles. Within 335 crankshaft angle (°CA)~350 °CA, the average pressure in the cylinder rapidly increased. When the injection end angle changed from 50° to 70° BTDC, the time of the rapid increase in the cylinder pressure was slightly delayed, but the pressure peak showed a gradually increasing trend.
Figure 9 shows the simulation results of the heat release rate at different injection end angles. Within the range of 335 °CA~350 °CA, the average temperature rapidly rose. When the injection end angle changed from 50° to 70° BTDC, the temperature peak gradually increased.
Figure 10 shows the simulation results of the heat release rate at different injection end angles. Figure 11 shows the simulation results of the cumulative heat release corresponding to different injection end angles. With increasing injection end angle, the peak value of the heat release rate gradually increased. The cumulative heat release also showed a trend of gradual increase.

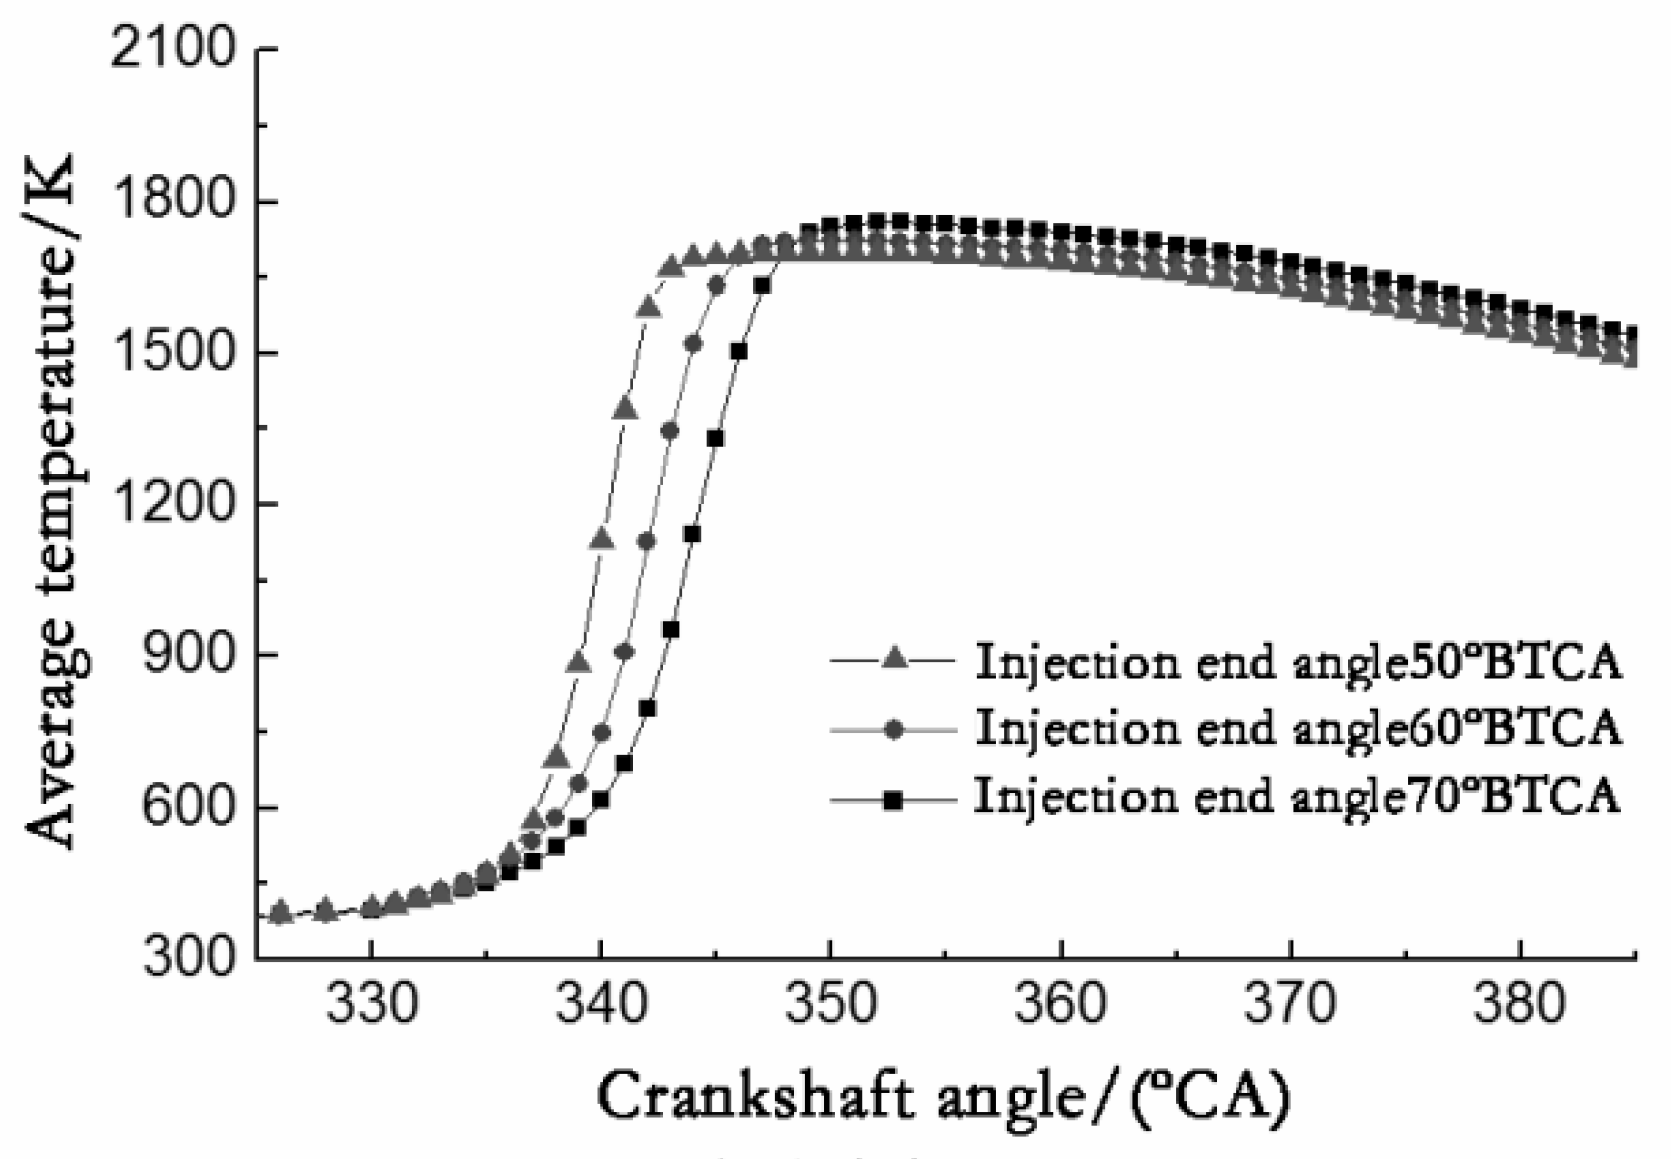
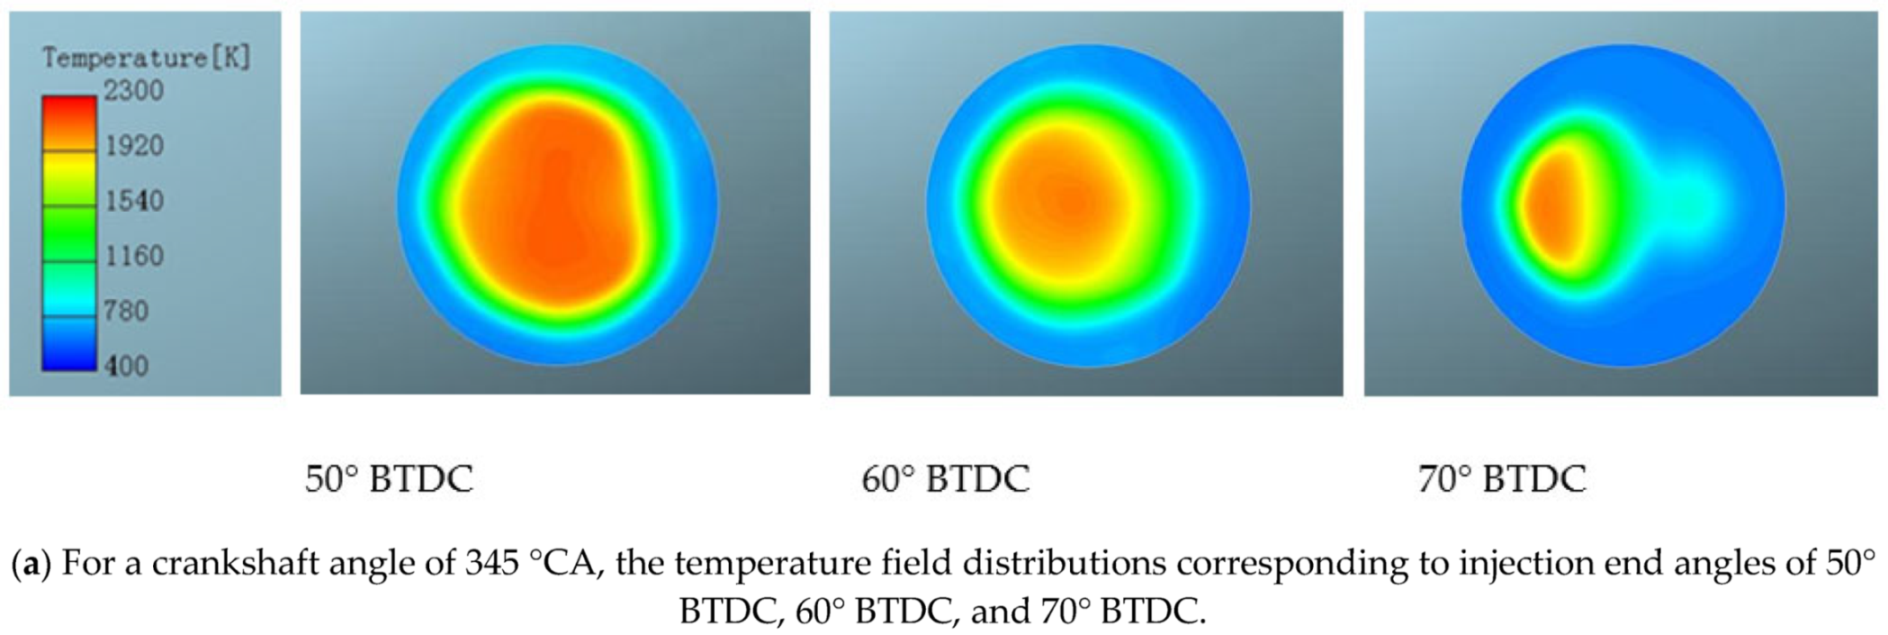
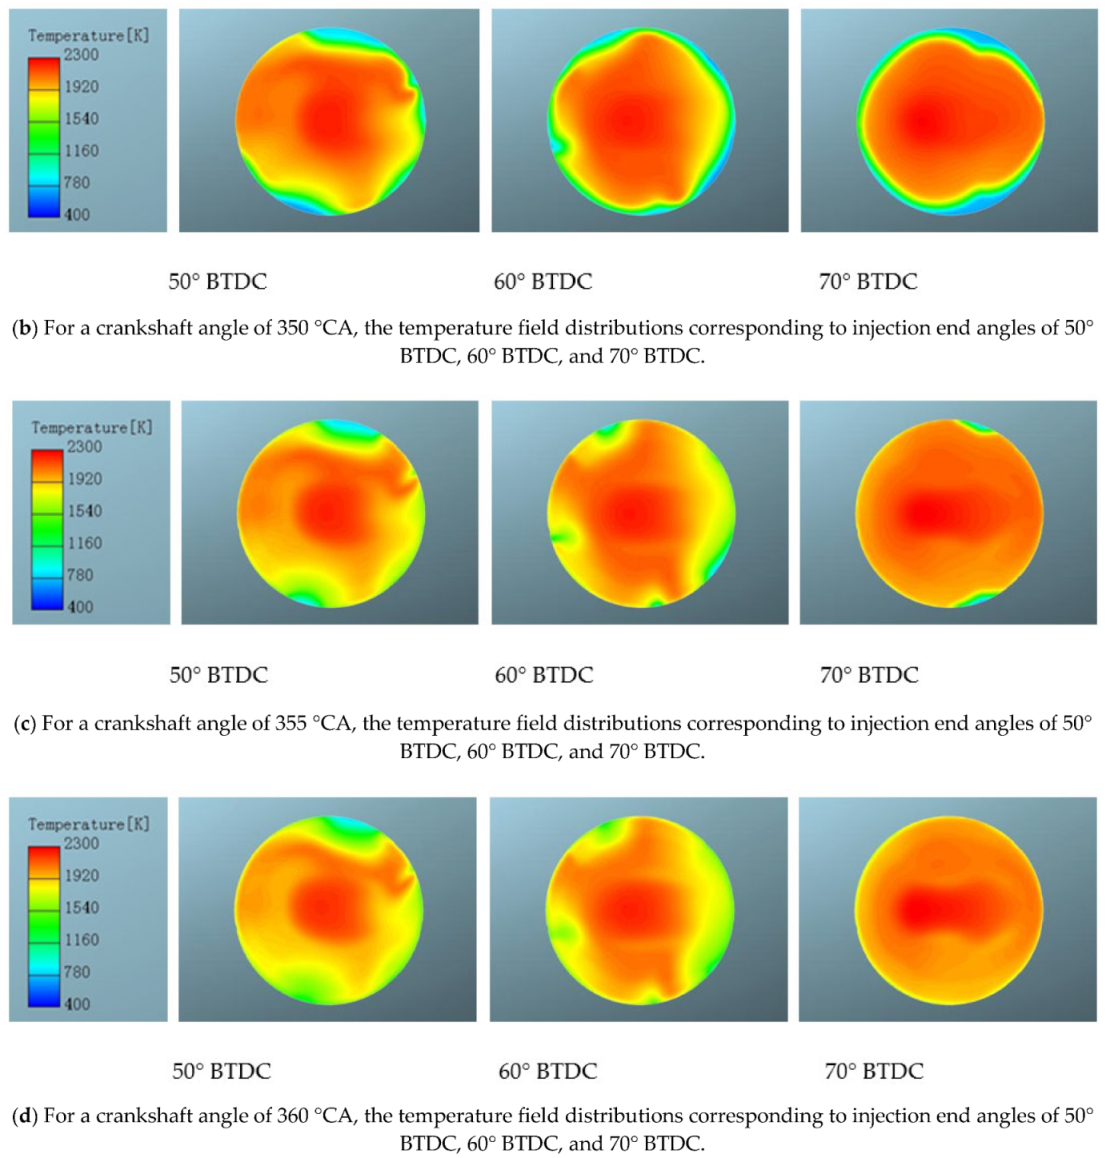
4.2. Effect of Injection End Angle on Temperature Field Distribution

The AVL FIRE software was used to study the combustion of the mixture in the cylinder and the generation process of the emissions of the two-stroke kerosene direct injection engine with variable ignition parameters. Figure 12 shows that, when the injection end angle was 50° BTDC, 60° BTDC, and 70° BTDC, the temperature field distribution in the cylinder corresponded to crankshaft angles of 345 °CA, 350 °CA, 355 °CA, and 360 °CA.
It can be seen in Figure 12a that when the injection end angle was 50° BTDC, and the piston rose to the crankshaft angle of 345 °CA, a large high-temperature area appeared in the cylinder, the front of the flame was large, and there was a temperature stratification between the combustible and unburned zones. Then, the piston rose to 350 °CA, and the range of the high-temperature area gradually broadened.
When the injection end angle was 60° BTDC, and the piston rose to the crankshaft angle of 345 °CA, a large high-temperature area appeared in the cylinder. However, when the injection end angle was 50° BTDC, the area and temperature of this fraction are reduced. When the piston moved up to the crankshaft angles of 350 °CA and 355 °CA, a large high-temperature burned zone gradually appeared in the cylinder. Compared with the injection end angle of 50° BTDC, the burned area in the cylinder slightly increased, the temperature distribution in the high-temperature area was more uniform, and the range of the unburned area was gradually reduced. When the piston continued to move upward and reached the top dead center at 360 °CA, the high-temperature area in the cylinder became larger, and the combustion temperature was significantly higher than the cylinder temperature when the injection end angle was 50° BTDC.
As the injection end angle continued to increase to 70° BTDC, the effect of the injection end angle increasing became more obvious. Although the high-temperature area in the cylinder at the crankshaft angle of 345 °CA was relatively small, the high-temperature area after the crankshaft angle of 350 °CA showed a gradually increasing trend, the temperature distribution in the high-temperature area was more uniform, and the range of the unburned area gradually reduced.
In summary, as the injection end angle gradually increased from 50° BTDC to 70° BTDC, the combustion process in the whole cylinder became more extensive after the piston rose to 350 °CA; when the combustion was nearly completed, the burned area in the cylinder was the largest.

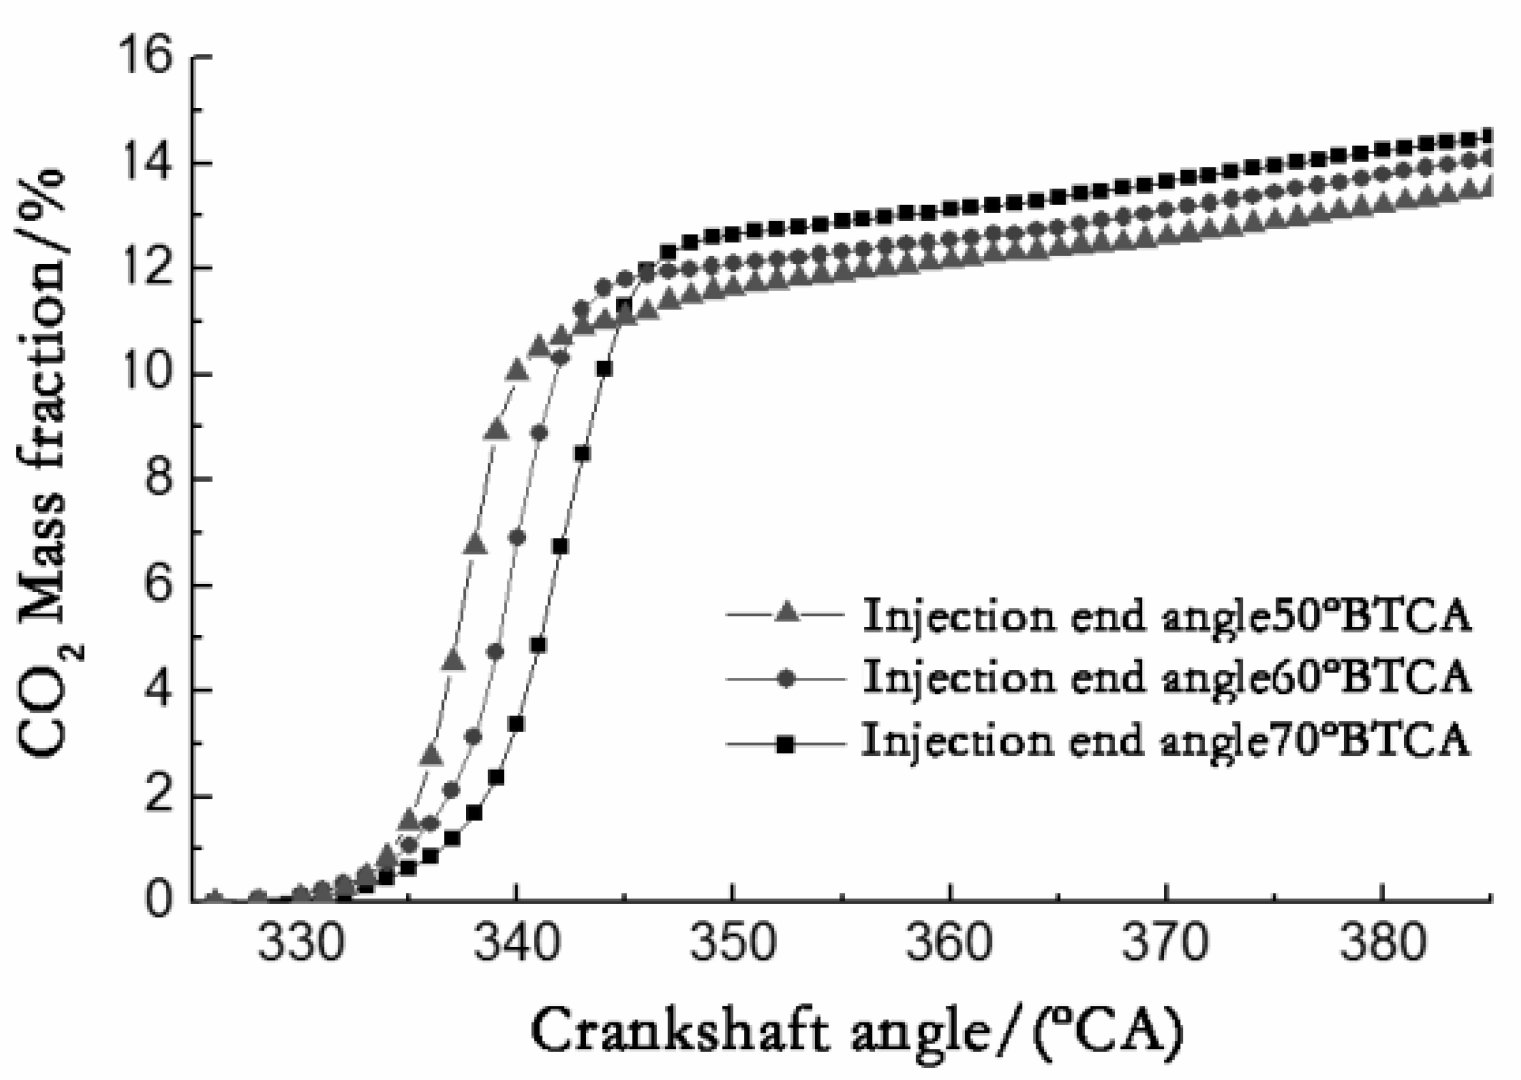
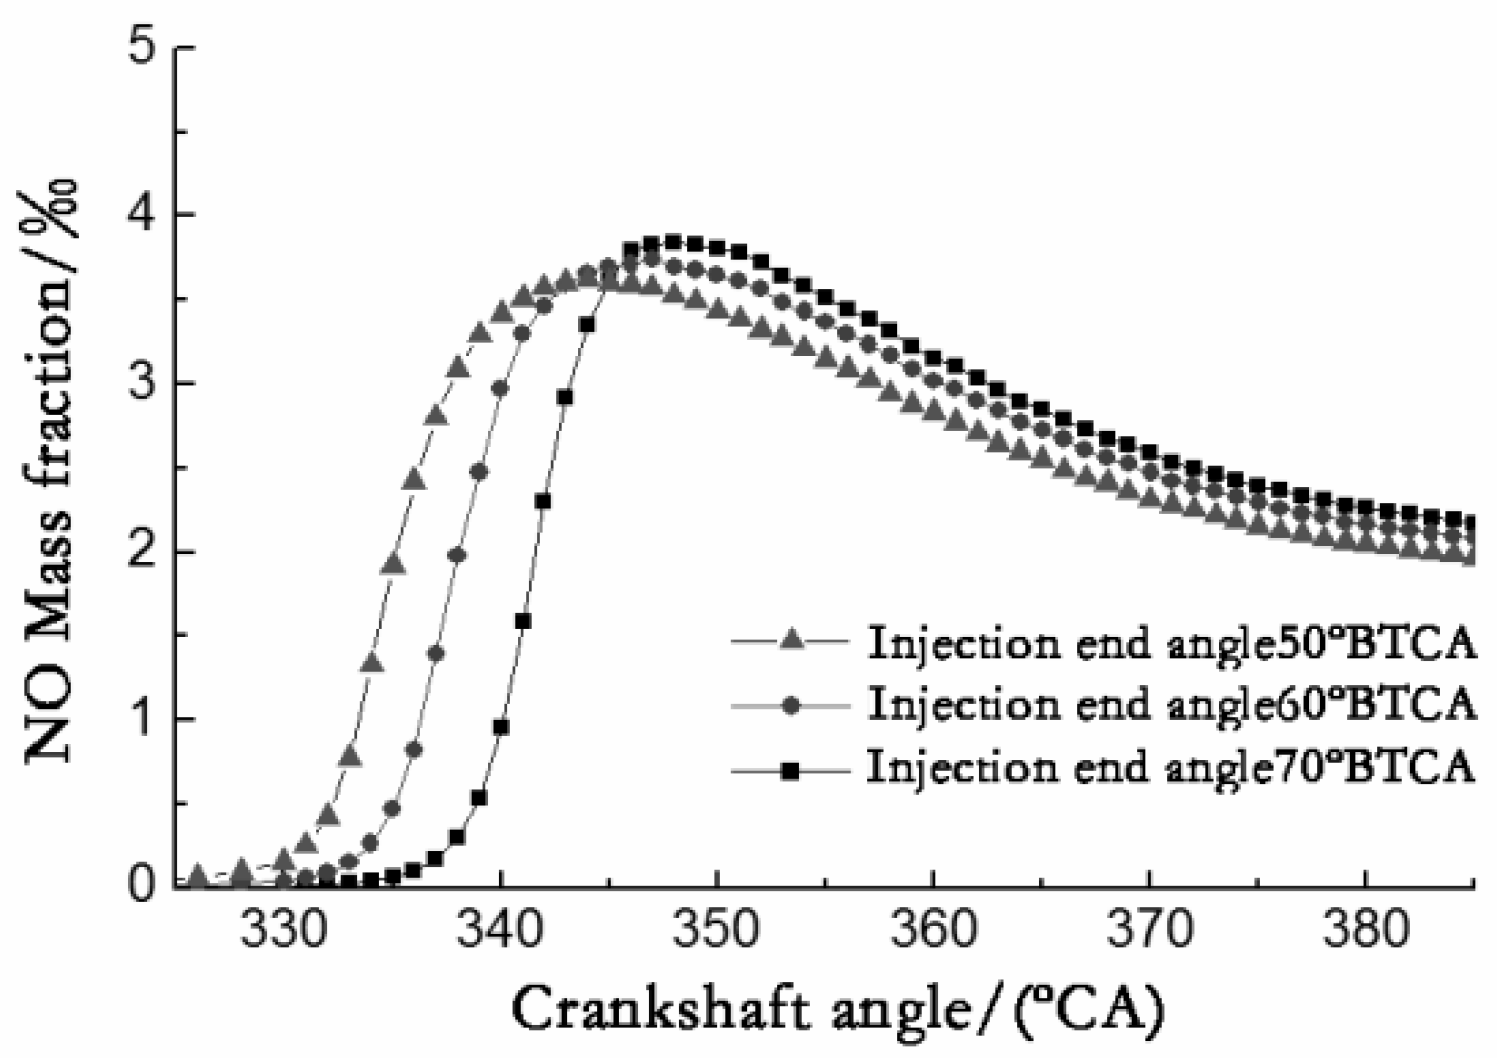
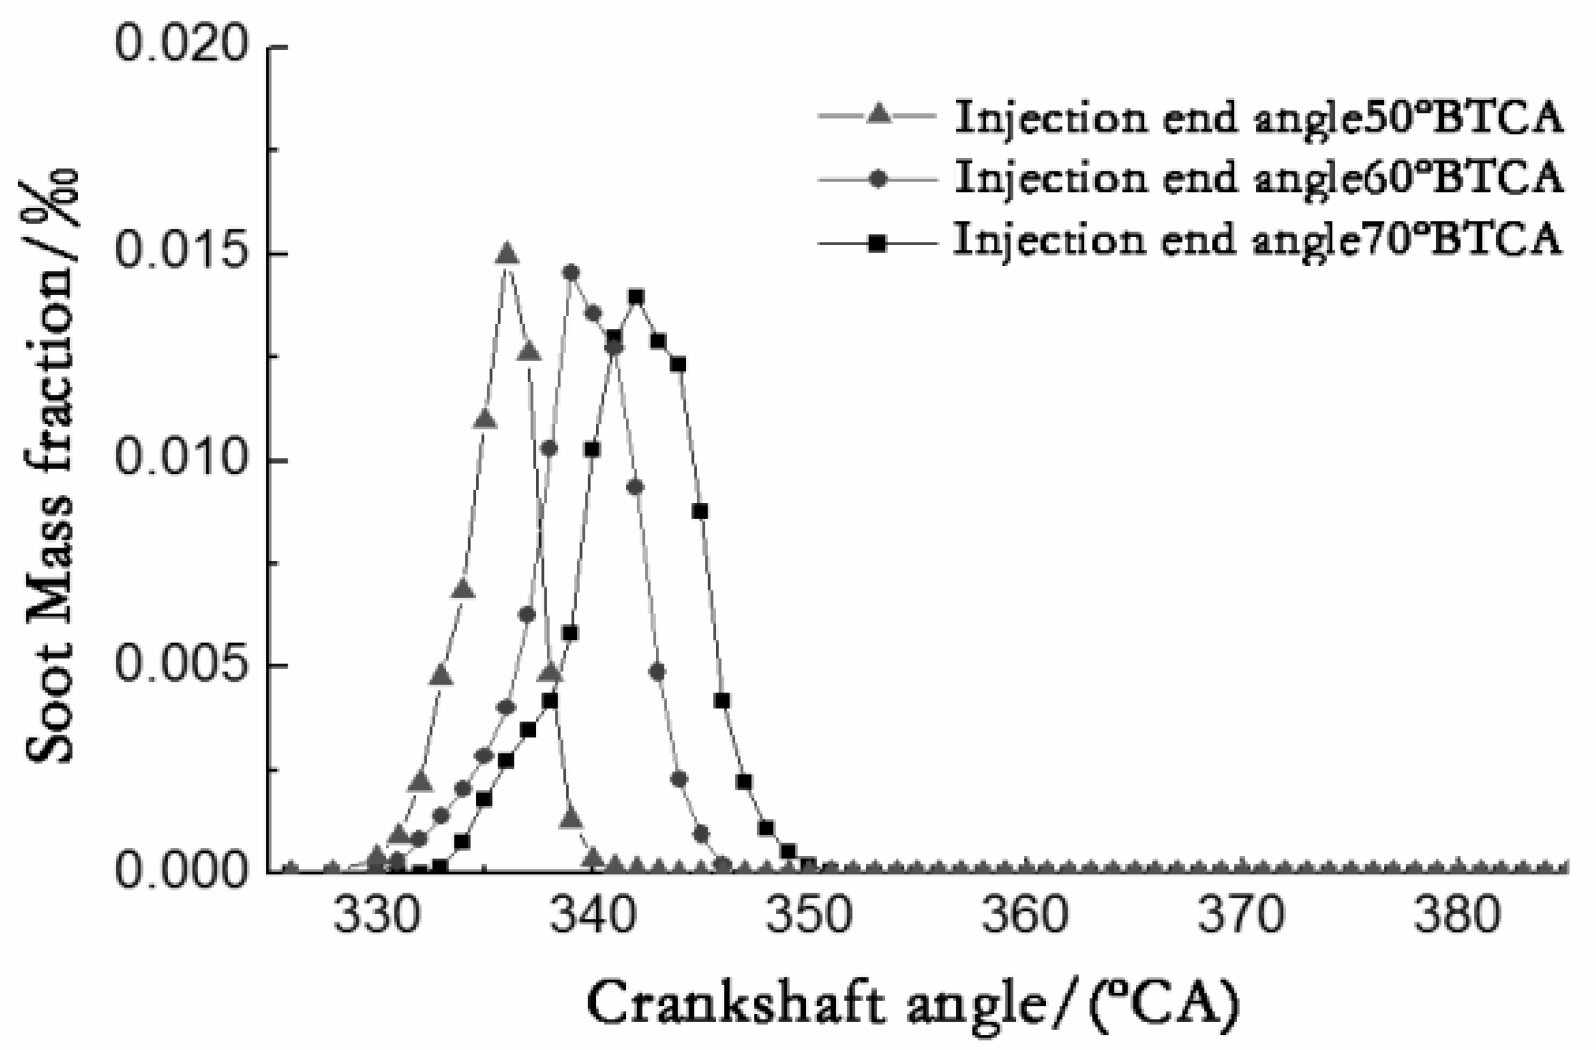
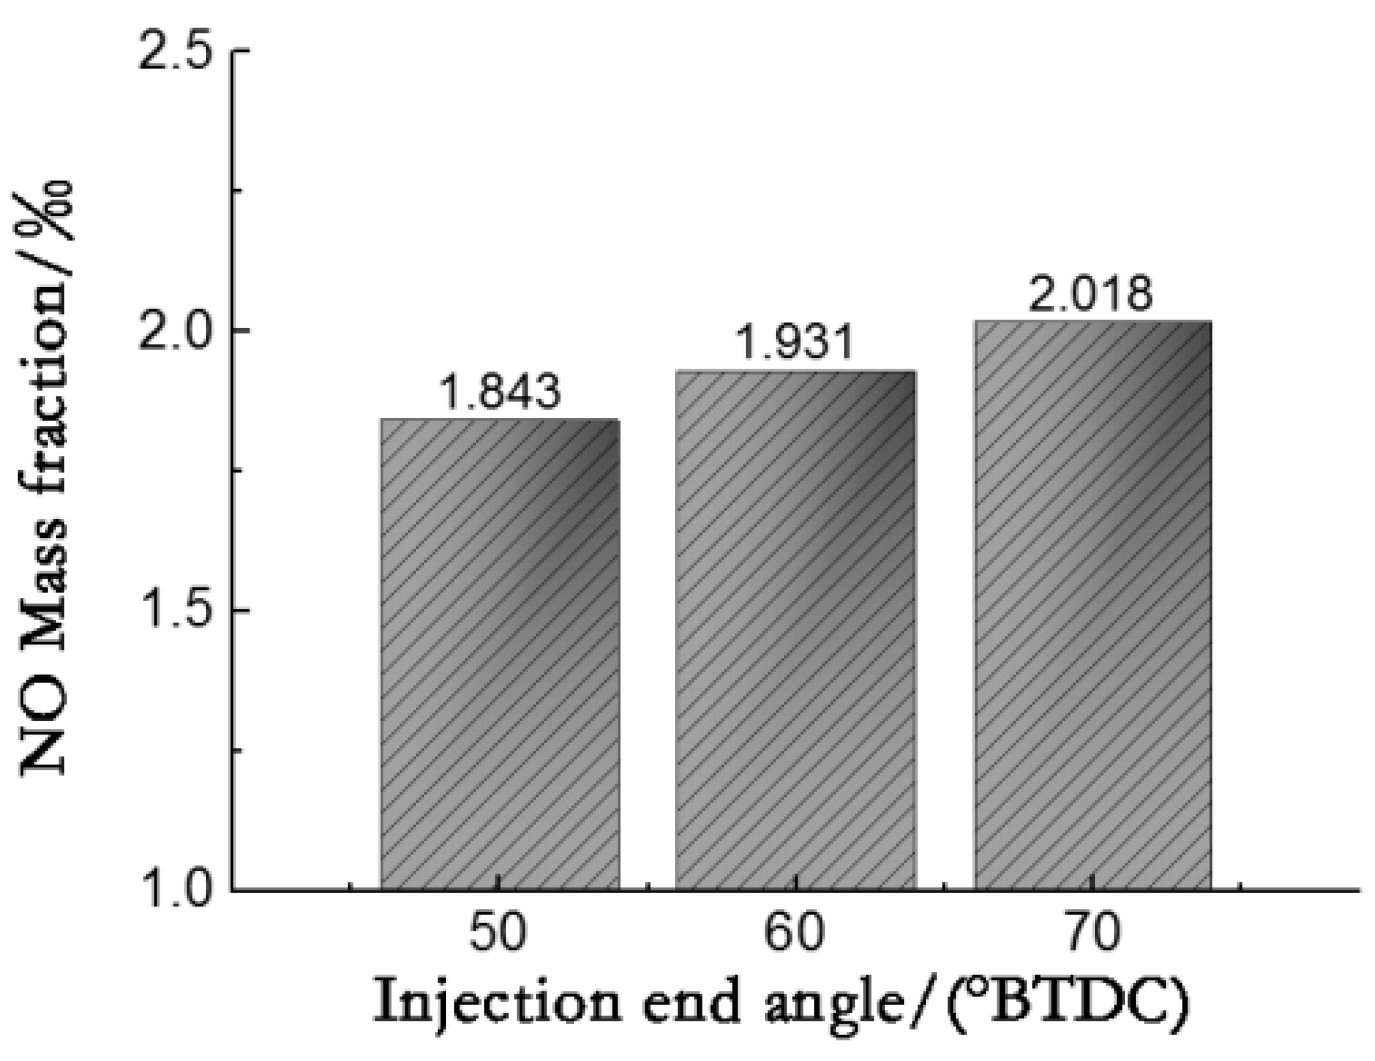
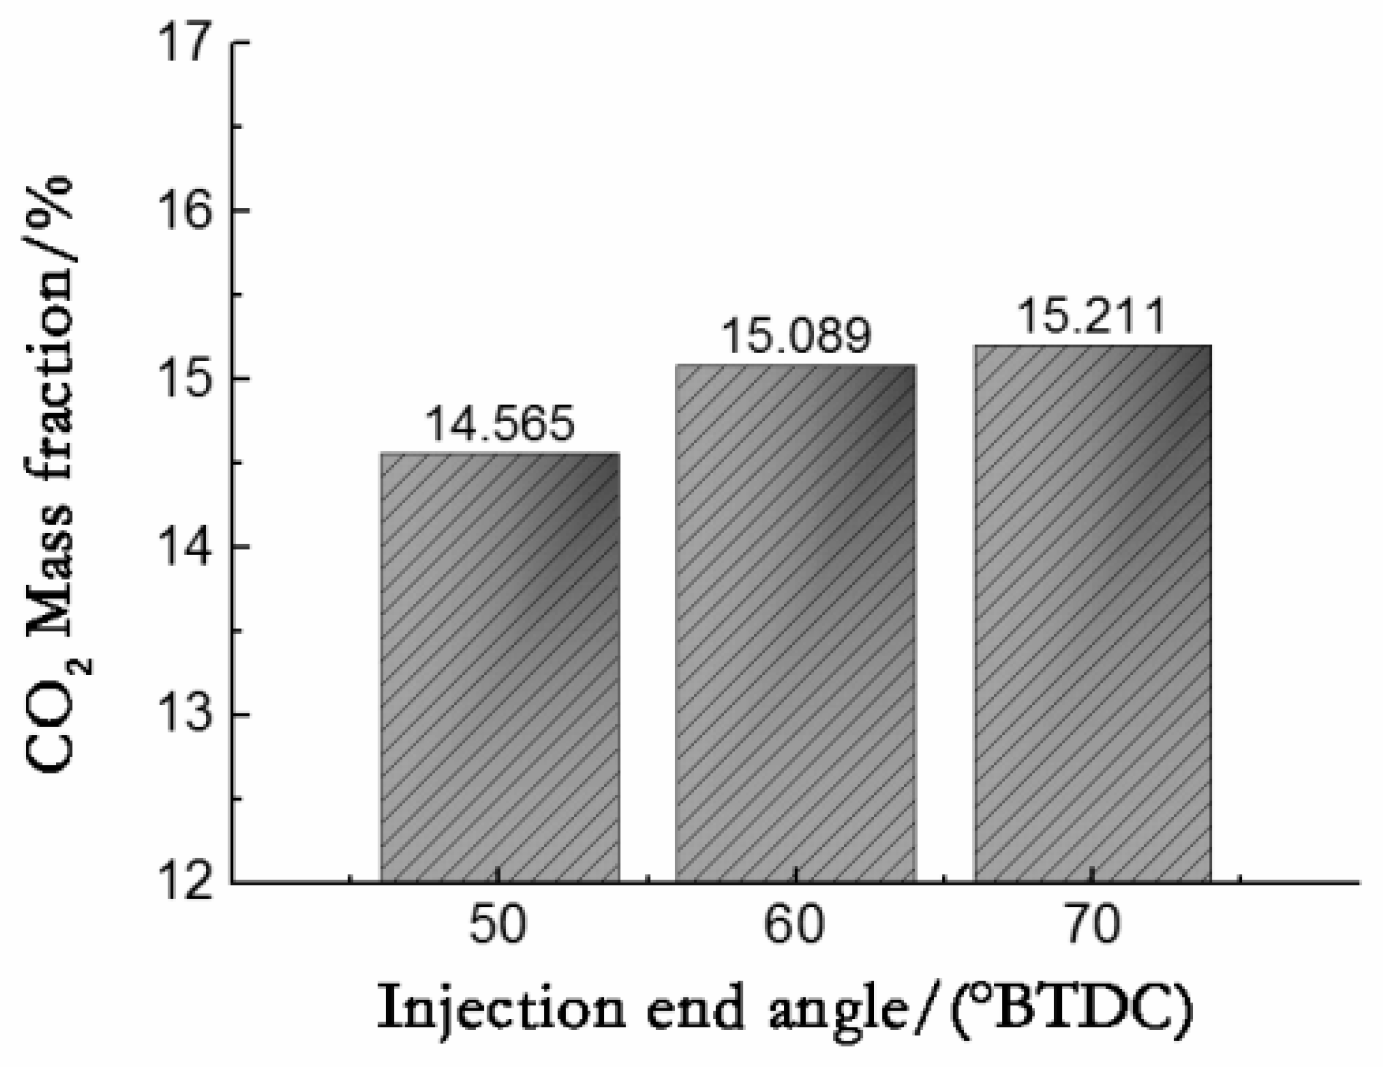
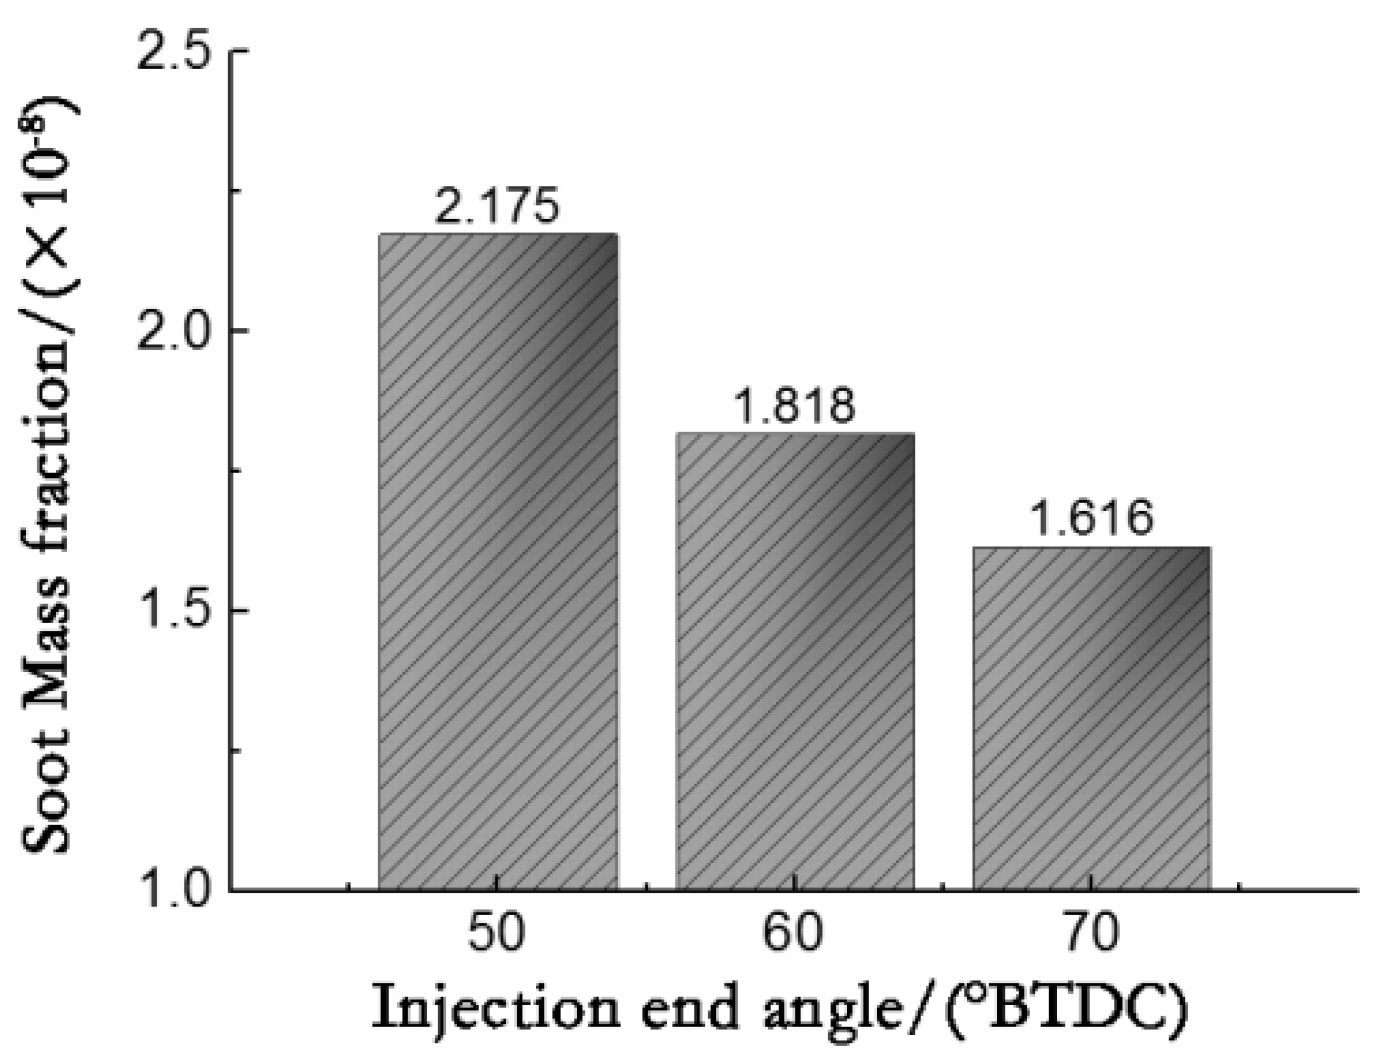
4.3. Effect of the Injection End Angle on the Concentration of Each Emission Component

Figure 13 and Figure 14 show the trends of CO and CO2 in the cylinder within the range of 325~385 °CA, respectively; Figure 15 and Figure 16 show the trends of NO and soot, respectively.
Figure 17, Figure 18, Figure 19 and Figure 20 show the concentration data of each emission component when the exhaust port was opened. When the injection end angle changed from 50° to 70° BTDC, CO and soot gradually decreased, and CO2 and NO gradually increased.
Through research on the influence of the injection end angle on the combustion characteristics, temperature field distribution, and emission component concentration, it can be seen that of the three injection end angles 50° BTDC, 60° BTDC, and 70° BTDC, 70° BTDC yields the best cylinder combustion and the lowest CO and soot emissions.

5. Effect of Fuel Injection Volume on Combustion and Emission

With the rotating speed set to 3000 r/min, the load set to 16%, the ignition advance angle set to 30° BTDC, the ignition energy set to 30 mJ, and the injection end angle set to 50° BTDC, the trend of the engine during the cylinder working process when the injection amount was 7.5–8.5 mg was calculated.

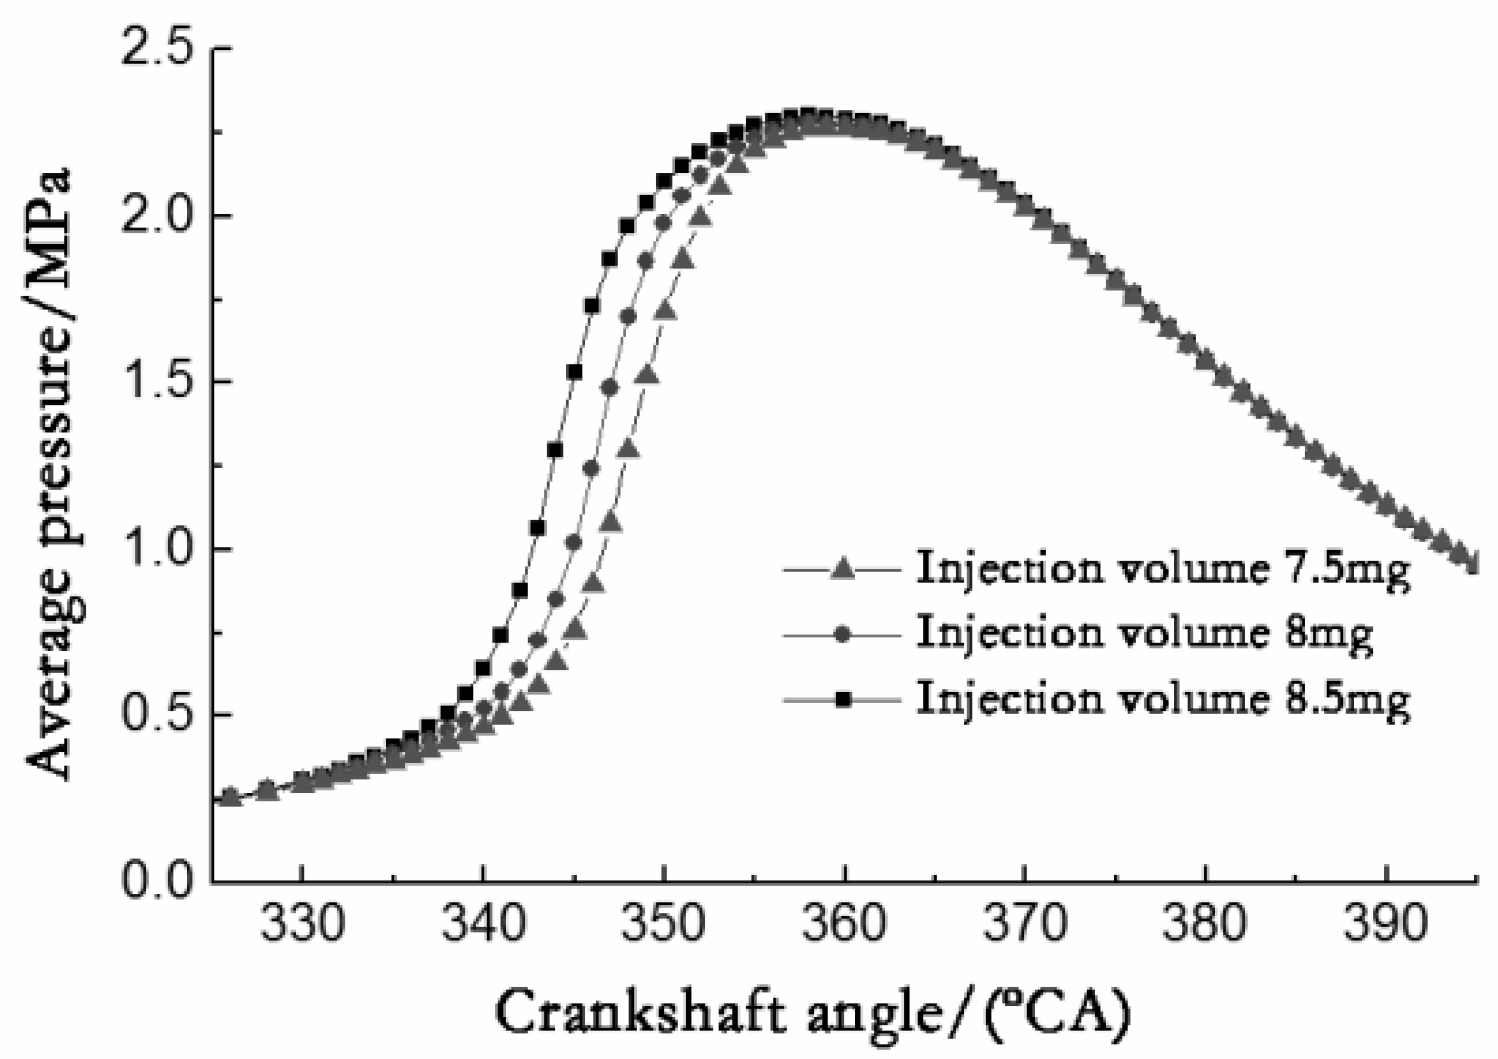
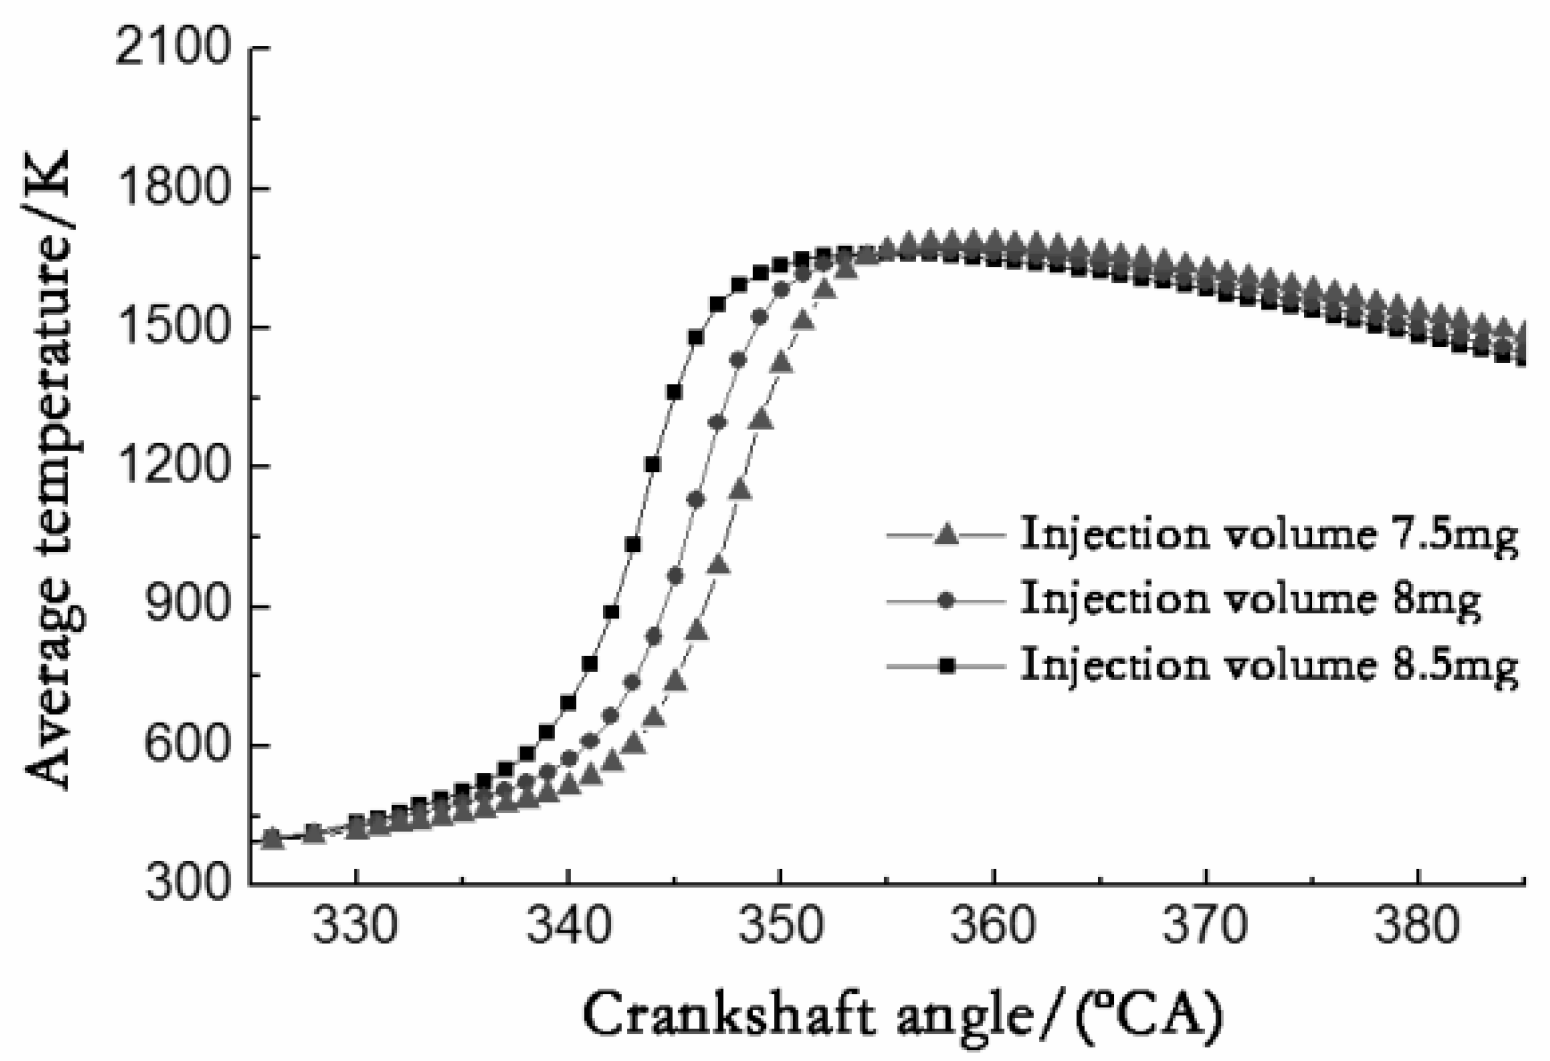
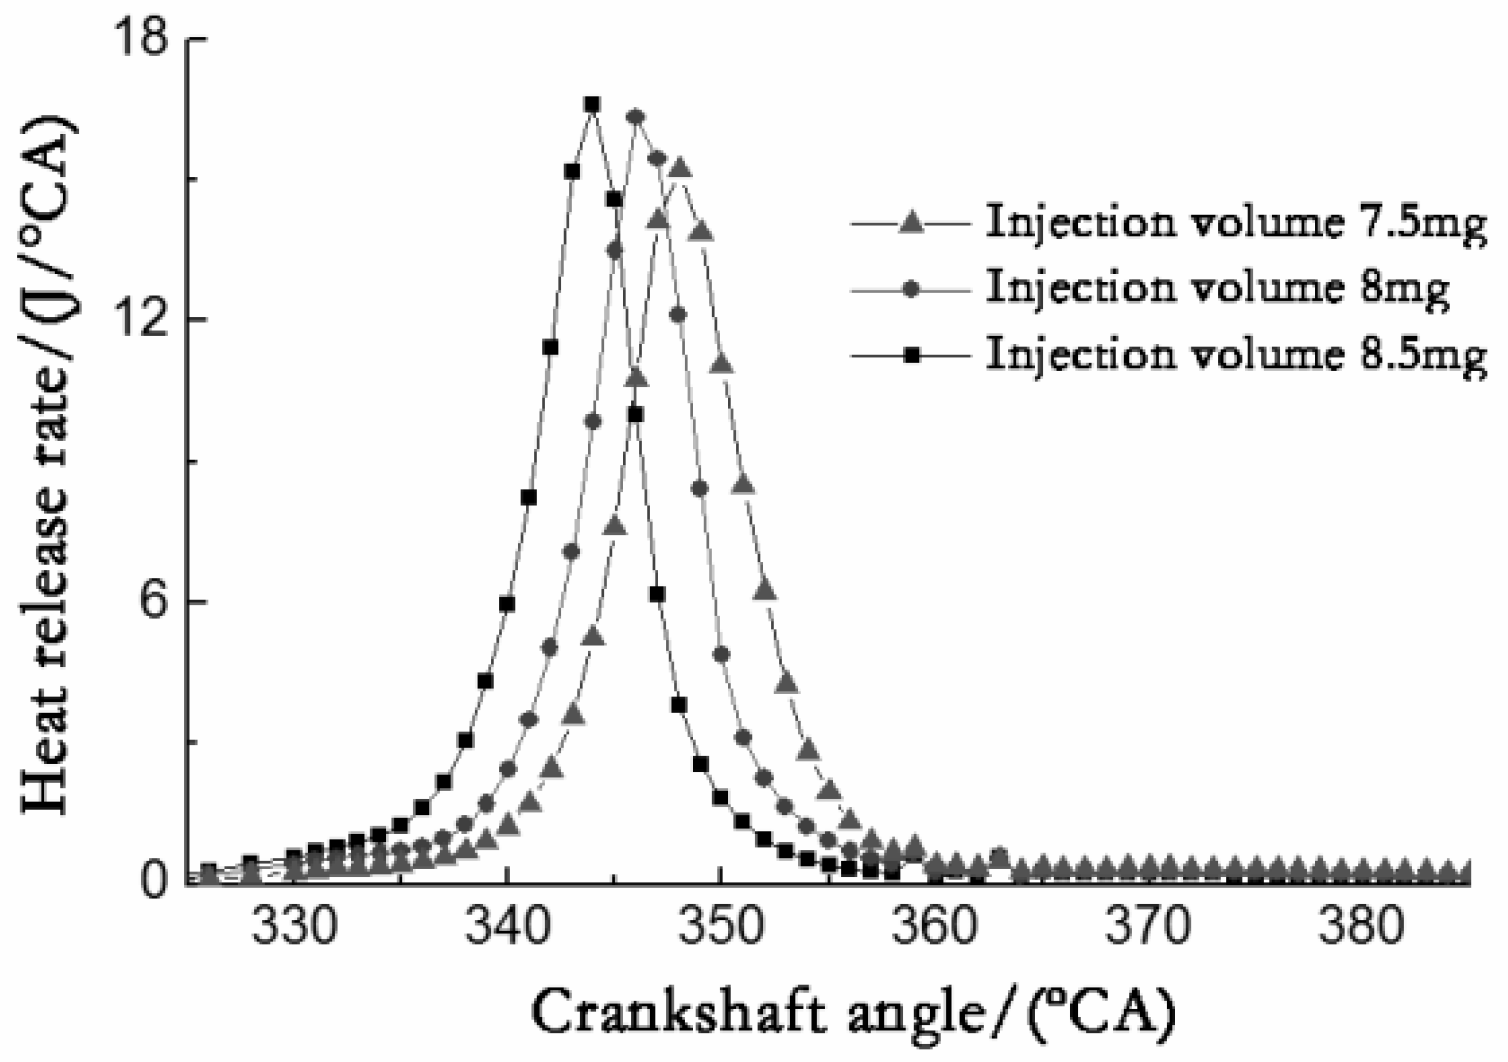
5.1. Effect of Fuel Injection Volume on Combustion Characteristics in a Cylinder

Figure 21 shows the simulation results of the average pressure in the cylinder when the injection volume was 7.5 mg, 8 mg, and 8.5 mg. As seen in Figure 21, when the injection volume was 7.5 mg, 8 mg, and 8.5 mg, the average in-cylinder pressure rapidly increased, and with increasing injection volume, the rapid increase occurred earlier, and the pressure peak value was larger.
Figure 22 shows the simulation results of the average in-cylinder temperature at 7.5 mg, 8 mg, and 8.5 mg fuel injections. As seen in Figure 22, the average in-cylinder temperature sharply increased in the range from 345 °CA to 360 °CA at all times, and the time when the temperature rapidly rose was at an advanced stage during the course of the gradual change in the injection volume from 7.5 mg to 8.5 mg.
Figure 23 and Figure 24 show the simulation results of the heat release rate and cumulative heat release, respectively, for the three different injection volumes.
As seen in Figure 23 and Figure 24, both the simulation results of the heat release rate and the accumulated heat release showed a gradually increasing trend during the process of fuel injection volume changing from 7.5 mg to 8.5 mg, and the corresponding time of peak and the rapid increase stages of the heat release rate and the accumulated heat release were gradually advanced.

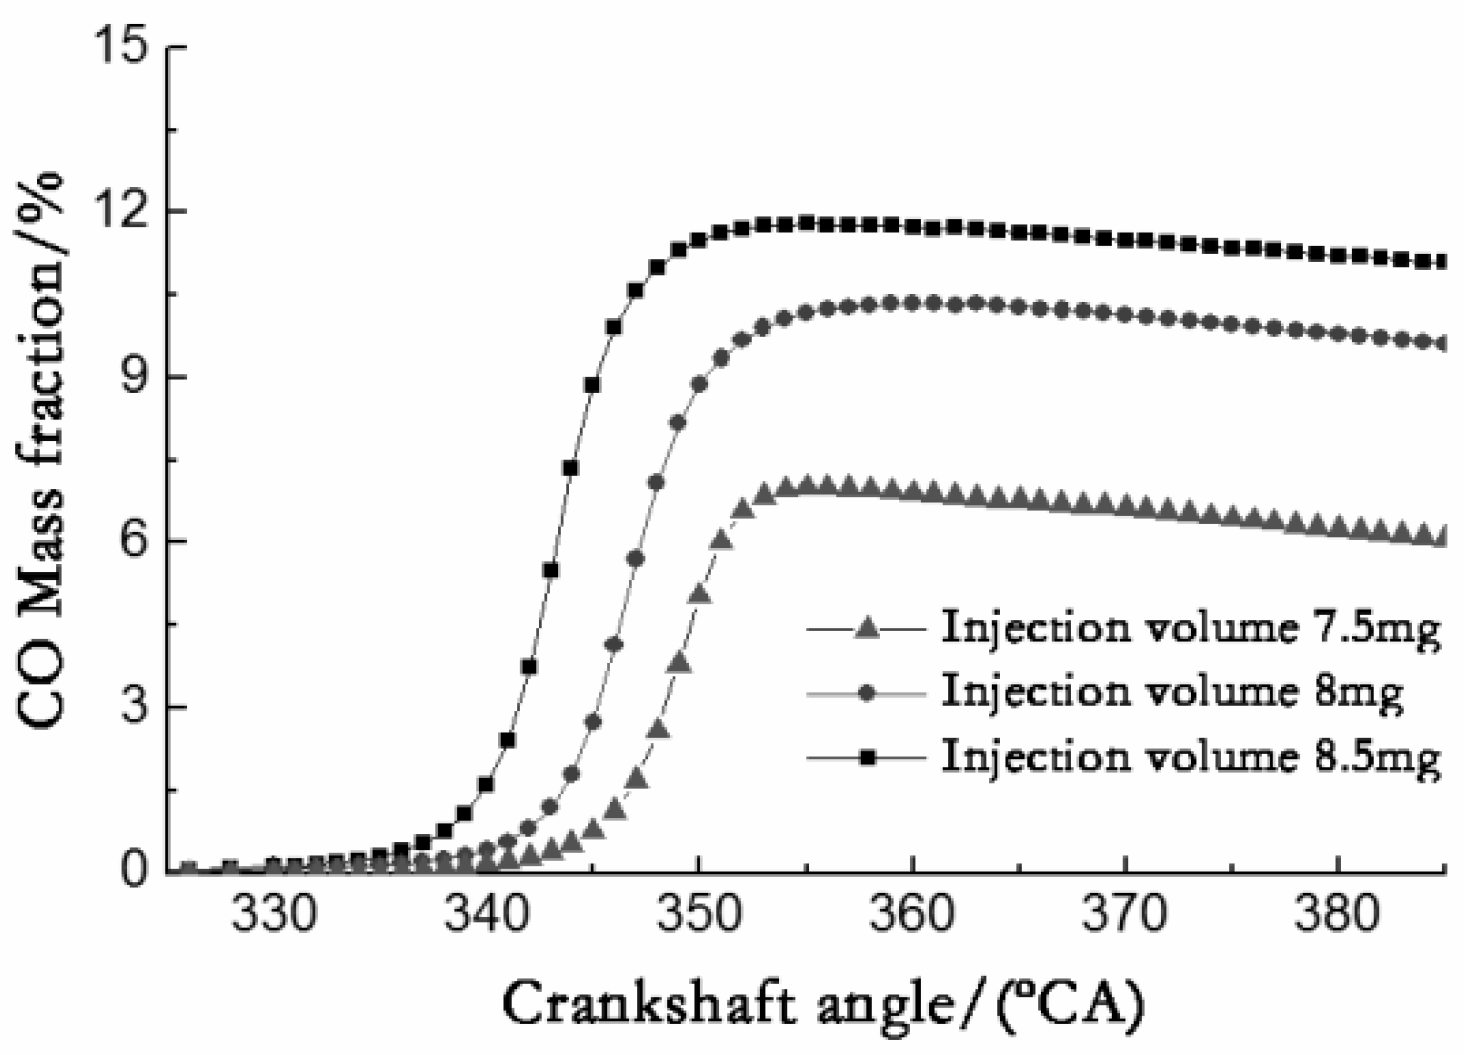
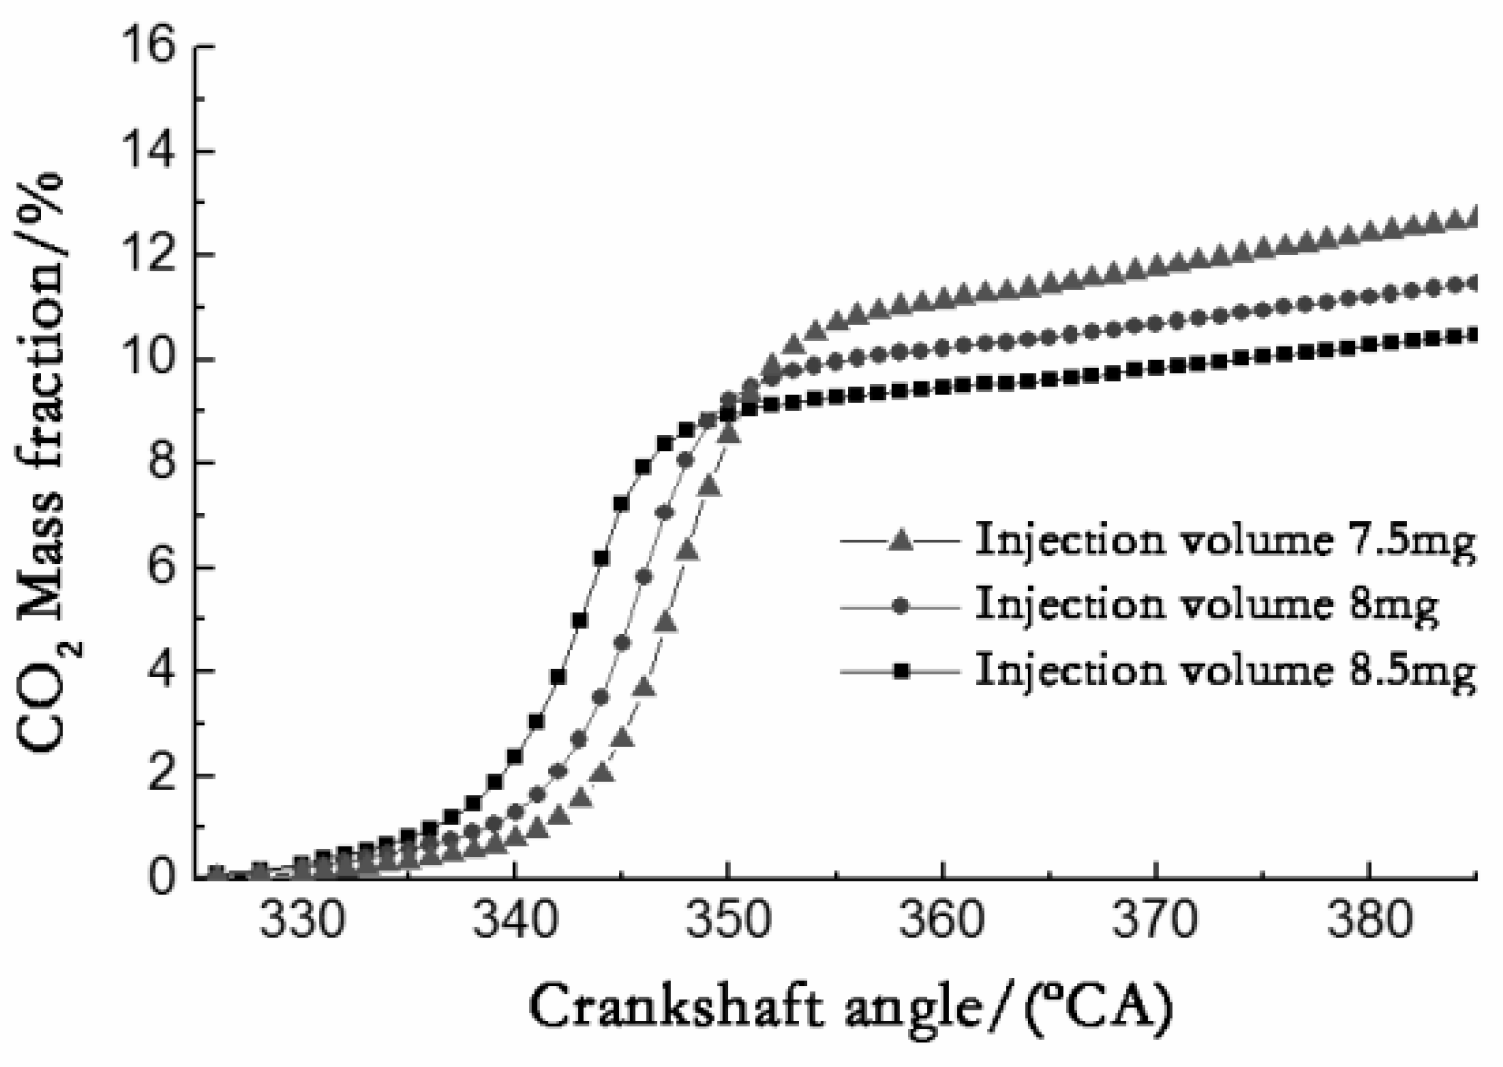
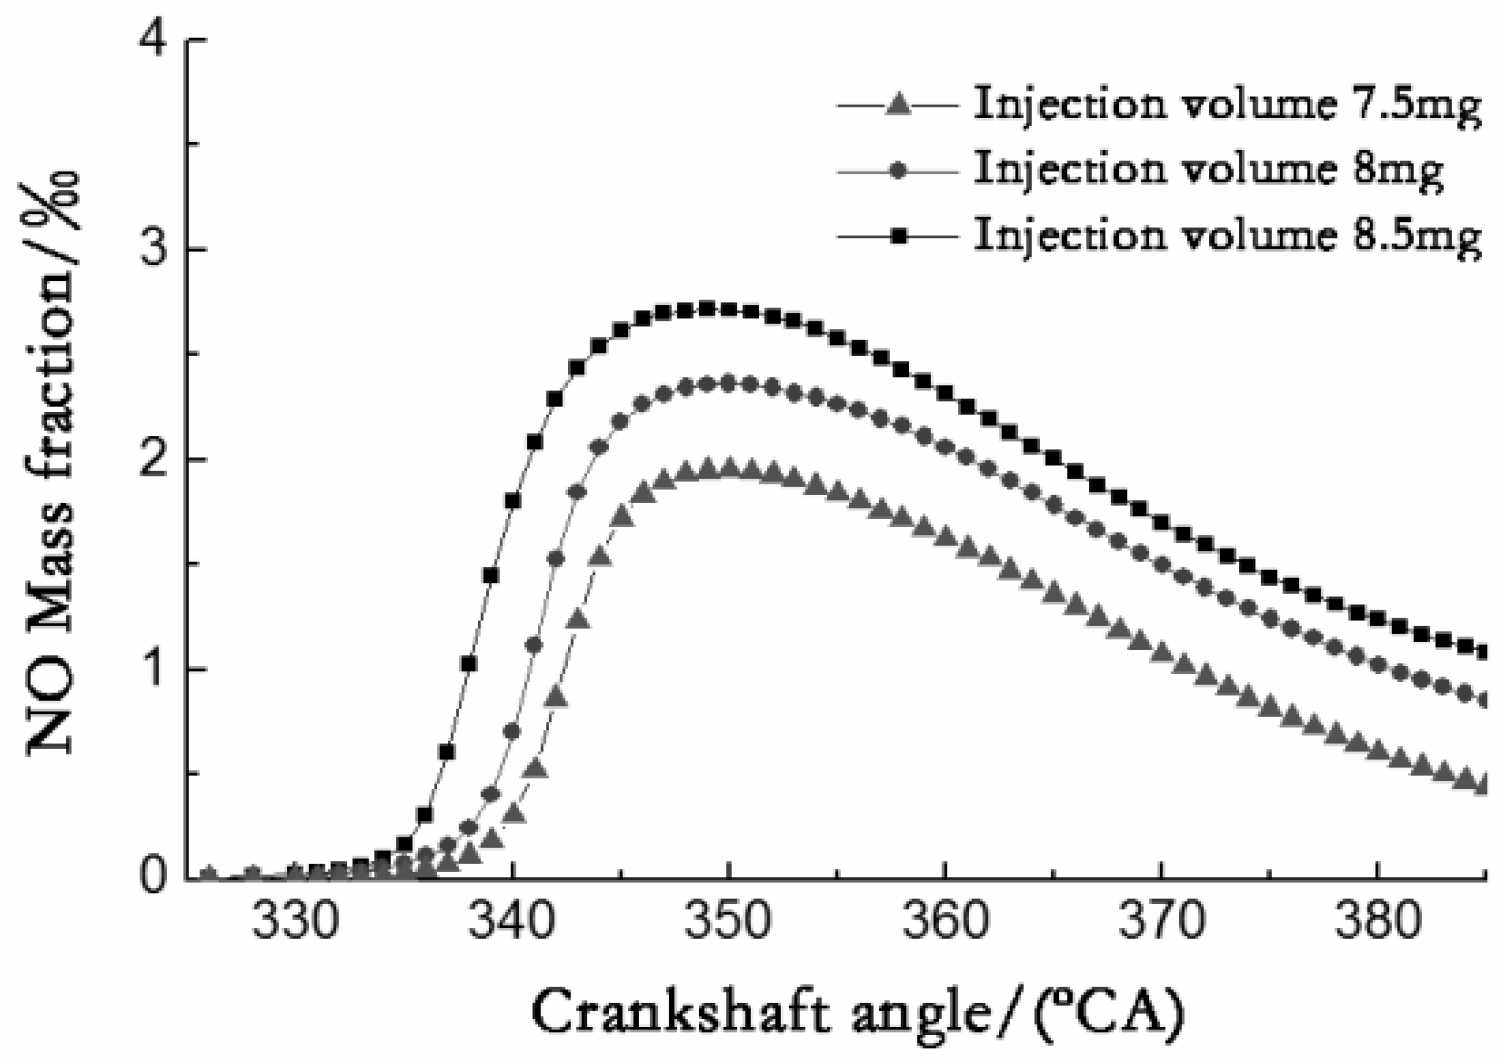
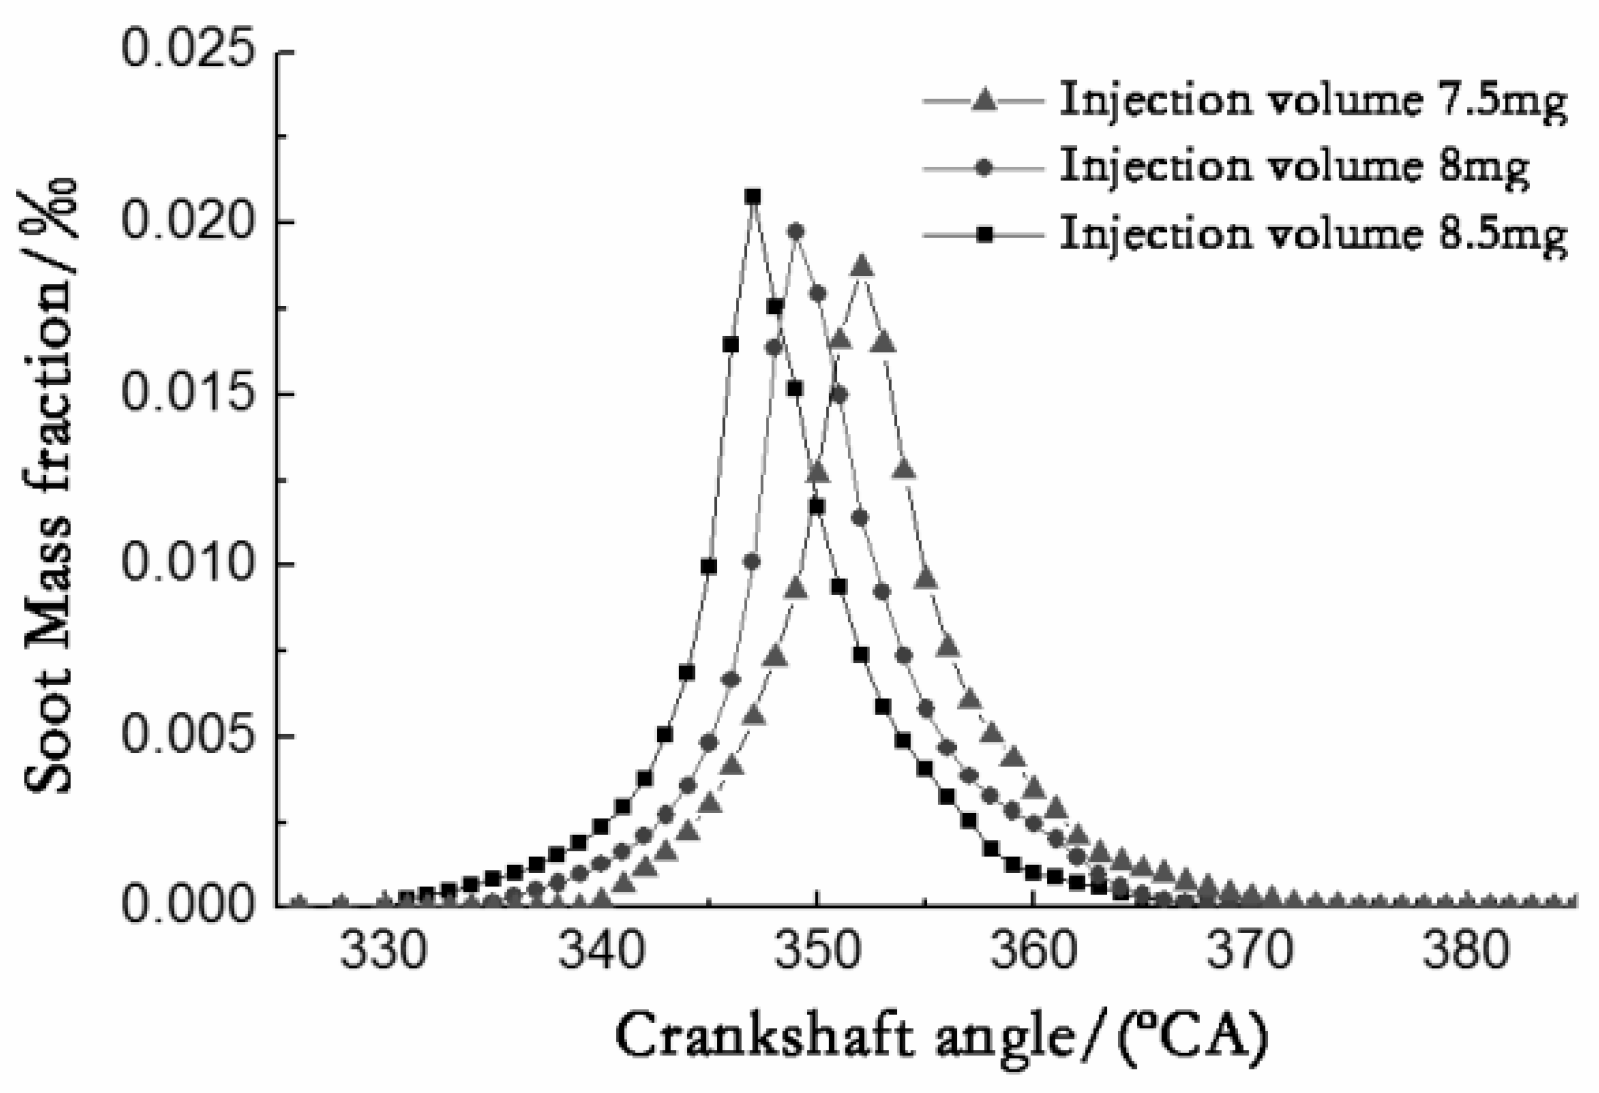
5.2. Effect of the Fuel Injection Volume on the Concentration of Each Emission Component

Figure 25 and Figure 26 show the trends of CO and CO2 in the cylinder in the range of 325~385 °CA, respectively. Figure 27 and Figure 28 show the corresponding trends of NO and soot, respectively.
Figure 29, Figure 30, Figure 31 and Figure 32 show the simulation data of the concentration of each emission component when the exhaust port was opened. It is obvious that the concentration of each component changed with the amount of fuel injected: As the injection volume gradually increased from 7.5 mg to 8.5 mg, the mass fractions of CO, NO, and soot all showed a gradually increasing trend, with a slightly reduced CO2 mass fraction.
The influence of the injection volume on the combustion characteristics, temperature field distribution, and concentration of exhaust components were observed as follows: Of the three injections of 7.5 mg, 8 mg, and 8.5 mg, the CO, NO, and soot emissions were the lowest at 7.5 mg. According to the emission data, when the exhaust port was open, the mass fractions of CO decreased by 32.0% and 43.0%, the mass fractions of NO decreased by 70.9% and 81.7%, and the mass fractions of soot decreased by 13.1% and 19.6%, compared with those at 8 mg and 8.5 mg, respectively.

6. Conclusions

In this study, an engine was simulated using GT-POWER and AVL FIRE software. The engine speed was set at 3000 r/min, the load was set at 16%, and the ignition advance angle was set at 30° BTDC. The effects of injection time and volume on engine combustion were analyzed. The conclusions are as follows:
(1)
The injection volume was set at 8.5 mg, and the injection end angle was set at 50–70° BTDC.
When the injection end angle gradually increased from 50 to 70° BTDC, the average pressure and temperature rapidly increased in the course of 335 °CA~350 °CA, while the peak pressure, temperature, and accumulated heat release gradually increased. After the piston reached 350 °CA, the combustion in the cylinder advanced more toward completion, and the area of the combustible zone in the cylinder was the largest near the completion of combustion.
The mass fraction of CO and soot decreased when the injection end angle increased from 50° to 70° BTDC. The mass fractions of CO2 and NO slightly increased, and CO and soot emissions were minimized at an injection end angle of 70° BTDC.
(2)
The injection end angle was set to 50° BTDC, and the injection volume was set to 7.5 mg, 8 mg, and 8.5 mg.
With a gradual increase in injection volume, the average pressure and temperature in the cylinder first increased and then decreased; these parameters rapidly increased at 345~360 °CA and gradually increased at peak value. When the fuel injection volume changed from 7.5 mg to 8.5 mg, the corresponding moment when the heat release rate and the accumulated heat release sharply increased was advanced, the peak value gradually increased, and the combustion advanced more toward completion.
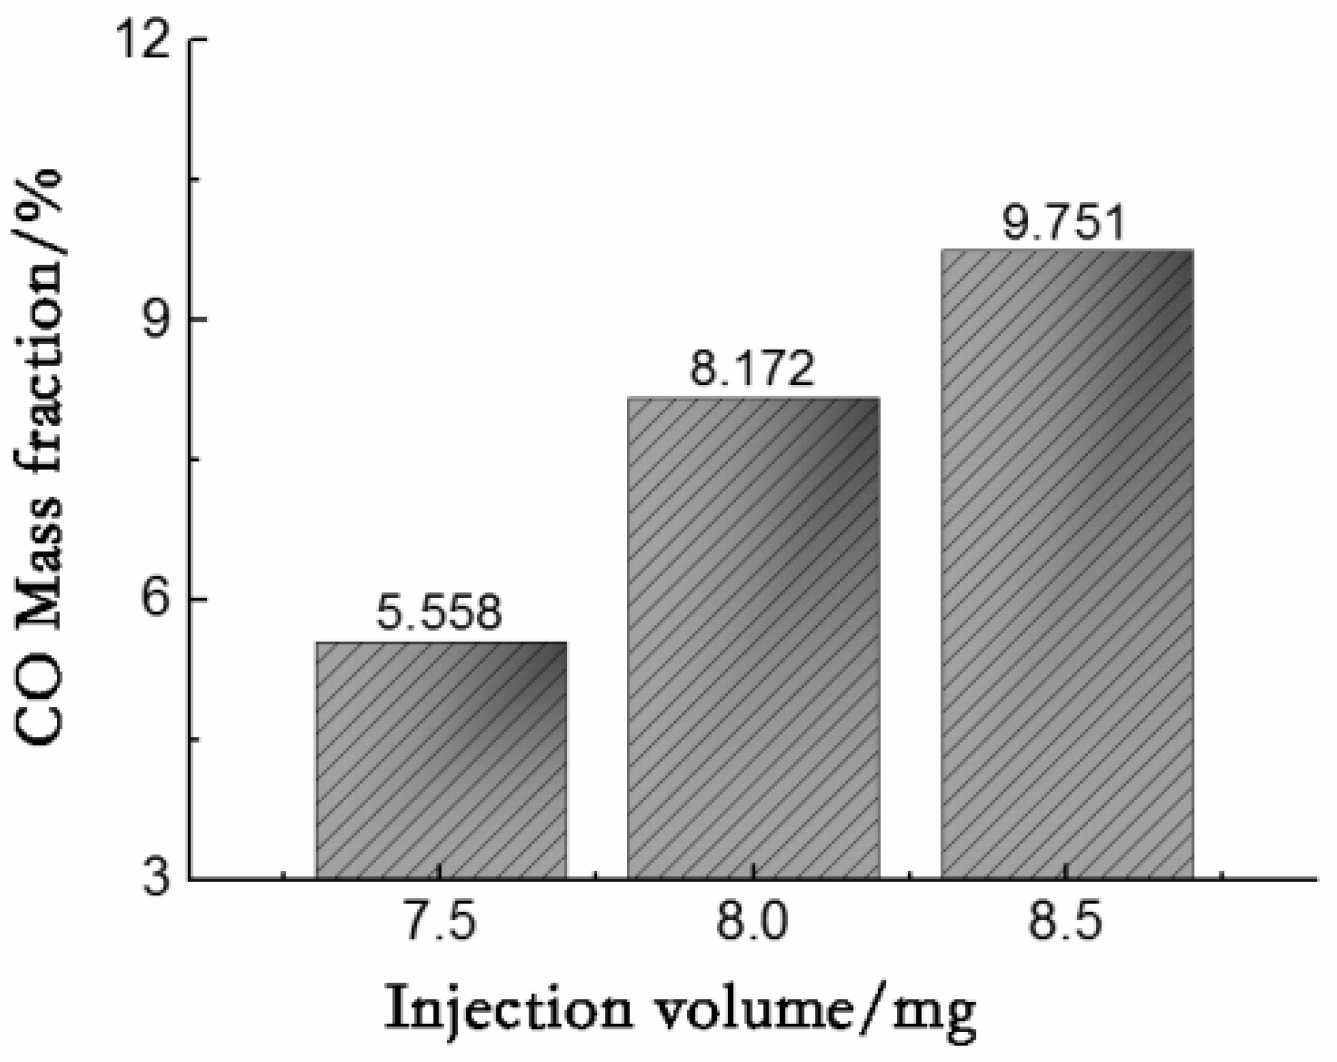
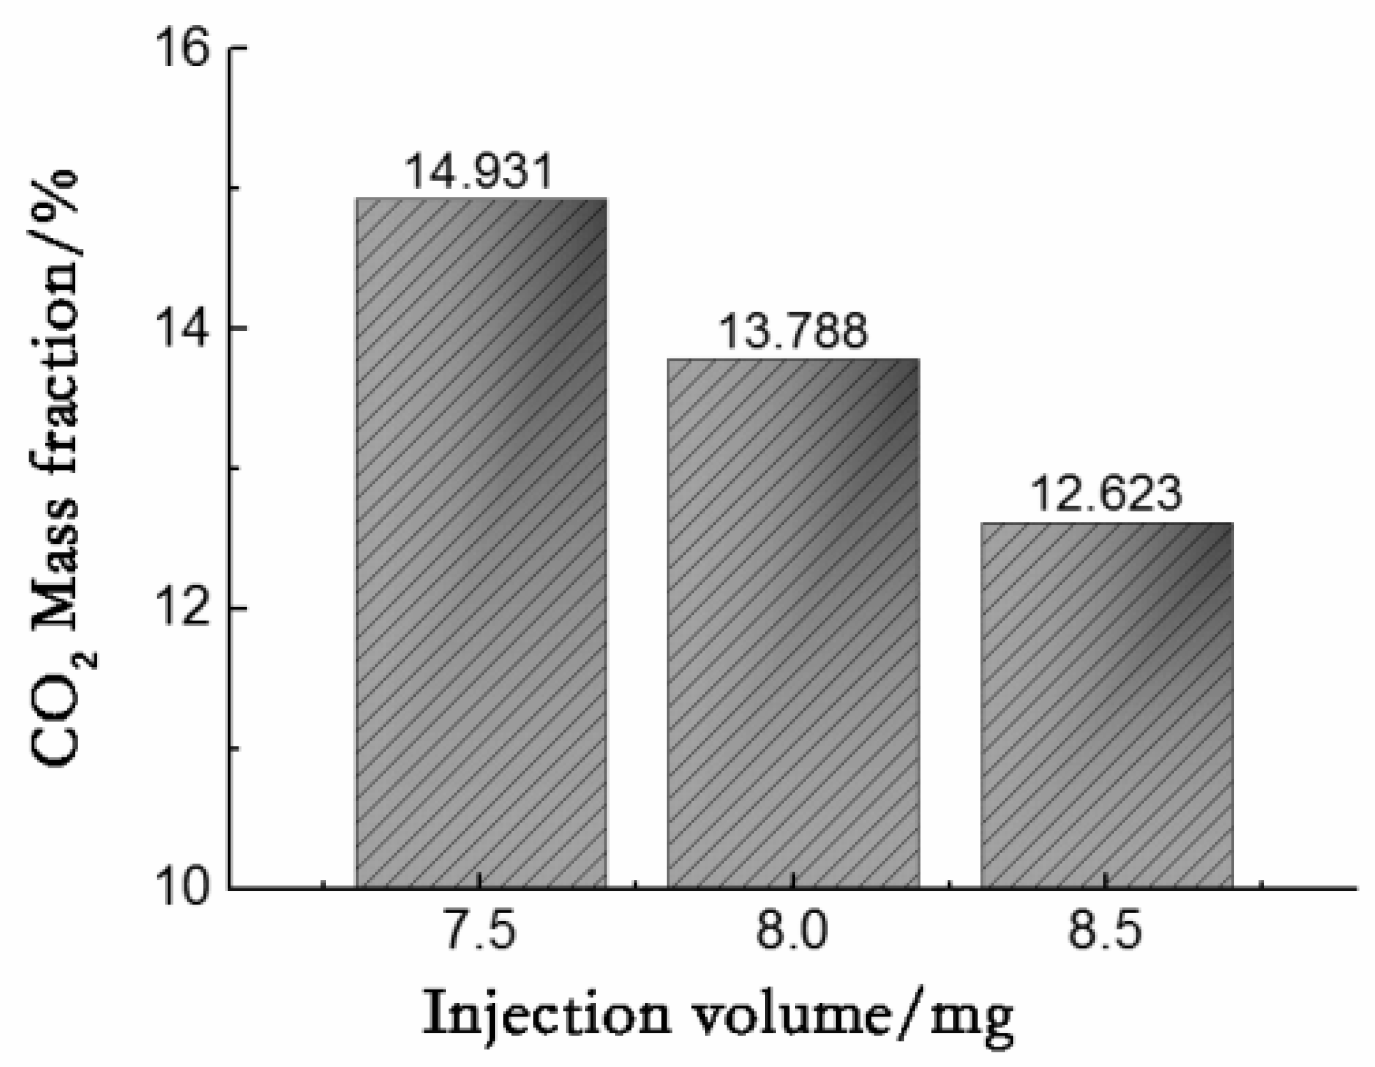
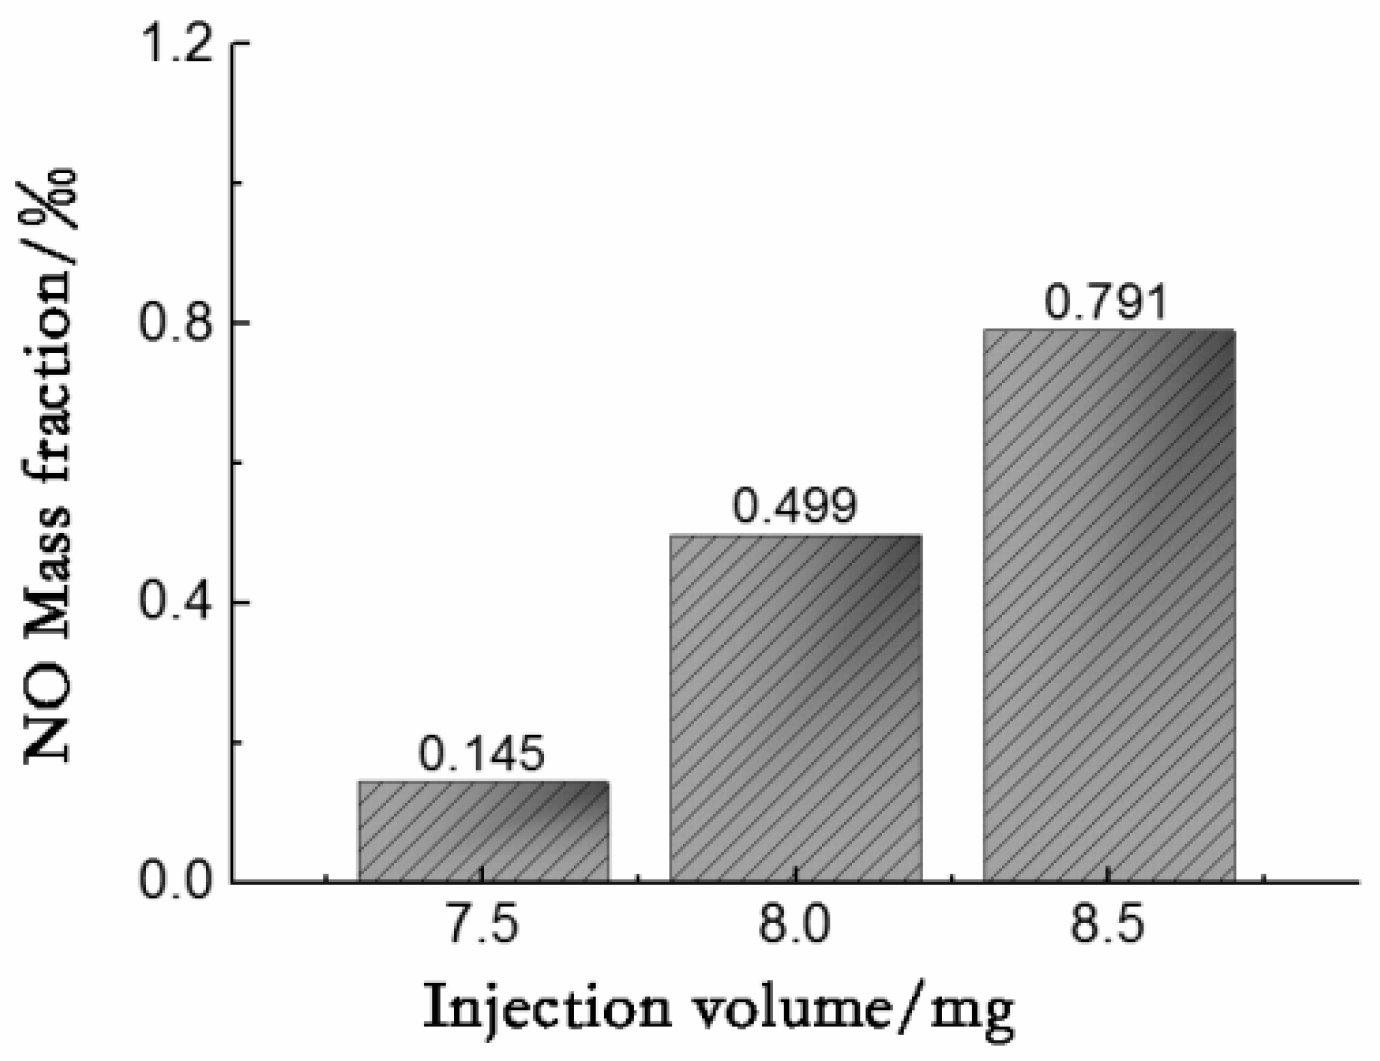
As the injection volume increased, the quantities of CO, NO, and soot gradually increased, and that of CO2 slightly decreased.
(3)
For a two-stroke kerosene direct injection engine, it is recommended to set the injection end angle to 50° BTDC and the fuel injection quantity to 7.5 mg considering the effects on pollutant emissions and combustion.

Author Contributions

Conceptualization, T.B., R.L., and B.L.; software, J.H. and B.Z.; formal analysis, T.B., B.L., and J.H.; investigation, B.L, R.L., and B.Z.; resources, T.B. and J.H.; writing—original draft preparation, T.B. and B.L.; writing—review and editing, T.B., B.L., J.H., and B.Z.; supervision, T.B. and B.L.; funding acquisition, T.B. All authors have read and agreed to the published version of the manuscript.

Funding

This research was supported by the Major Scientific and Technological Innovation Program of Shandong Provincial (2018YFJH0306); it is also supported by the Key R&D Program of Shandong Provincial (2019GGX104056) and the Doctoral Research Fund of Shandong Jianzhu University (X18067Z).

Institutional Review Board Statement

Not applicable.

Informed Consent Statement

Not applicable.

Data Availability Statement

All data used to support the findings of this study are included within the article.

Conflicts of Interest

The authors declare no conflict of interest.

References

  1. Wu, H.; Zhang, F.; Zhang, Z. Fundamental spray characteristics of air-assisted injection system using aviation kerosene. Fuel 2021, 286, 119420. [Google Scholar] [CrossRef]
  2. Miao, J.; Fan, Y.; Wu, W. Characteristics of flash boiling spray of aviation kerosene in the twin-orifice nozzle. Fuel 2021, 297, 120771. [Google Scholar] [CrossRef]
  3. Ma, H.; Xie, M.; Zeng, W.; Chen, B. Experimental study on combustion characteristics of Chinese RP-3 kerosene. Chin. J. Aeronaut. 2016, 29, 375–385. [Google Scholar] [CrossRef]
  4. Garg, P.; Sharma, A.; Agarwal, D.K.; Varma, M. Numerical modeling of liquid oxygen and kerosene combustion at high pressures. In Proceedings of the 55th AIAA Aerospace Sciences Meeting, Grapevine, TX, USA, 9–13 January 2017. [Google Scholar] [CrossRef]
  5. Wu, H.; Dong, X.; Shi, Z.; Li, H.; Cao, W.; Zhang, L.; Bo, Y.; Li, X. Effect of injection timing on knock combustion and pollutant emission of heavy-duty diesel engines at low temperatures. Chemosphere 2022, 305, 135519. [Google Scholar] [CrossRef] [PubMed]
  6. Hu, C.; Gu, J.; Zhou, H. Combustion characte- ristics of piston aero direct injection engine. J. Aeronaut. Dyn. 2015, 30, 2368–2375. [Google Scholar] [CrossRef]
  7. Lu, Y.; Su, W.; Pei, Y. Effect of injection parameters on premixed combustion and emission of diesel engine. J. Intern. Combust. Engines 2016, 34, 9–15. [Google Scholar] [CrossRef]
  8. Ning, L.; Duan, Q.; Wei, Y.; Zhang, X.; Yu, K.; Yang, B.; Zeng, K. Effects of injection timing and compression ratio on the combustion performance and emissions of a two-stroke DISI engine fuelled with aviation kerosene. Appl. Therm. Eng. 2019, 161, 114124. [Google Scholar] [CrossRef]
  9. Su, Y.; Wang, B.; Liu, Y.; Xie, F.; Hu, Y.; Duan, Q. Effects of diesel injection time and gasoline ratio on emission performance of homogeneous mixture ignition mode. J. Jilin Univ. 2022, 52, 37–45. [Google Scholar] [CrossRef]
  10. Gu, W.; Yang, Y.; Cai, X.; Chen, D. Multi- dimensional numerical simulation of in cylinder flow field of FAI two-stroke direct injection gasoline engine. J. Intern. Combust. Engines 2007, 25, 150–156. [Google Scholar] [CrossRef]
  11. Jiang, S.; Hua, W.; Jianping, J.; Hong, L. Numerical simulation of in cylinder concentration field of direct injection gasoline engine. Intern. Combust. Engine Eng. 2010, 31, 65–68. [Google Scholar] [CrossRef]
  12. Wei, C. Influences of Ignition Advance Angle on GDI Engine Particulate Emission. J. Vehicle Engine 2014, 3, 25–28. [Google Scholar] [CrossRef]
  13. Taamallah, S.; Shanbhogue, S.J.; Ghoniem, A.F. Turbulent flame stabilization modes in premixed swirl combustion: Physical mechanism and Karlovitz number-based criterion. Combust. Flame 2016, 166, 19–33. [Google Scholar] [CrossRef]
  14. Hélie, J.; Trouvé, A. A modified coherent flame model to describe turbulent flame propagation in mixtures with variable composition. Proc. Combust. Inst. 2000, 28, 193–201. [Google Scholar] [CrossRef]
  15. Tang, J.; Zhu, G.G.; Men, Y. Review of engine control-oriented combustion models. Int. J. Engine Res. 2022, 23, 347–368. [Google Scholar] [CrossRef]
Figure 1. Calculation flowchart of AVL FIRE.
Processes 10 01728 g001
Figure 2. Photographs of the direct injection nozzle and direct injection cylinder head.
Processes 10 01728 g002
Figure 3. Basic composition diagram of experimental prototype.
Processes 10 01728 g003
Figure 4. Photograph of the experimental prototype.
Processes 10 01728 g004
Figure 5. Differential pressure regulation system.
Processes 10 01728 g005
Figure 6. Control software interface.
Processes 10 01728 g006
Figure 7. Comparison of numerical simulation results with experimental results.
Processes 10 01728 g007
Figure 8. Average pressure in the cylinder at different injection end angles.
Processes 10 01728 g008
Figure 9. Average temperature in the cylinder at different injection end angles.
Processes 10 01728 g009
Figure 10. Heat release rate at different injection end angles.
Processes 10 01728 g010
Figure 11. Cumulative heat release at different injection end angles.
Processes 10 01728 g011
Figure 12. Temperature field distributions corresponding to different injection end angles.
Processes 10 01728 g012aProcesses 10 01728 g012b
Figure 13. CO curves corresponding to different injection end angles.
Processes 10 01728 g013
Figure 14. CO2 curves corresponding to different injection end angles.
Processes 10 01728 g014
Figure 15. NO curves corresponding to different injection end angles.
Processes 10 01728 g015
Figure 16. Soot curves corresponding to different injection end angles.
Processes 10 01728 g016
Figure 17. CO data corresponding to different injection end angles.
Processes 10 01728 g017
Figure 18. NO data corresponding to different injection end angles.
Processes 10 01728 g018
Figure 19. CO2 data corresponding to different injection end angles.
Processes 10 01728 g019
Figure 20. Soot data corresponding to different injection end angles.
Processes 10 01728 g020
Figure 21. Average pressure in the cylinder with different injection volumes.
Processes 10 01728 g021
Figure 22. Average temperatures of different fuel injection volumes.
Processes 10 01728 g022
Figure 23. Heat release rate of different fuel injection volumes.
Processes 10 01728 g023
Figure 24. Cumulative heat release of different fuel injection volumes.
Processes 10 01728 g024
Figure 25. CO curves corresponding to different fuel injection volumes.
Processes 10 01728 g025
Figure 26. CO2 curves corresponding to different fuel injection volumes.
Processes 10 01728 g026
Figure 27. NO curves corresponding to different fuel injection volumes.
Processes 10 01728 g027
Figure 28. Soot curves corresponding to different fuel injection volumes.
Processes 10 01728 g028
Figure 29. CO data corresponding to different injection volumes.
Processes 10 01728 g029
Figure 30. CO2 data corresponding to different injection volumes.
Processes 10 01728 g030
Figure 31. NO data corresponding to different injection volumes.
Processes 10 01728 g031
Figure 32. Soot data corresponding to different injection volumes.
Processes 10 01728 g032
Table 1. Mechanism of thermal nitrogen oxides.
Chemical Reaction EquationPositive Reaction Rate ConstantReverse Reaction Rate Constant
N 2 + O N O + N k f , 1 = 1.8 × 10 8 e 38 , 370 / T k r , 1 = 3.8 × 10 7 e 425 / T
N + O 2 N O + O k f , 2 = 1.8 × 10 4 T e 4680 / T k r , 2 = 3.81 × 10 3 T e 20 , 820 / T
N + O H N O + H k f , 3 = 7.1 × 10 7 e 450 / T k r , 3 = 1.7 × 10 8 e 24 , 560 / T
Table 2. Physicochemical properties of gasoline and 3 # aviation kerosene.
Physicochemical PropertiesGasoline3# Saviation Kerosene
CompositionC5~C11C7~C16
Molecular weight114141
Liquid density (kg/L)0.70~0.750.73~0.82
Solidifying point (°C)−80−60
Boiling point (°C)25~220147~230
Self-ignition temperature (°C)220~250275
Flashpoint (°C)−4535~51
Ignition concentration limit (vol%)1.4~7.60.71~5.19
Theoretical air-fuel ratio14.8214.65
Latent heat of vaporization (kJ/kg)310~350353~361
Lower calorific value (kJ/kg)44,00043,350
Heat value of mixture (kJ/kmol)84,46784,423
Table 3. Comparison of the main parameters of the engine before and after direct injection transformation.
Parameter NameBefore ModificationAfter Modification
Cylinder bore (mm)7676
Stroke (mm)6969
Displacement (cm3)939939
Combustion chamberBasin shapeOffset tub
FuelGasolineKerosene
Actual compression ratio5.75.6
Crankcase compression ratio1.451.45
Scavenging modeReflux scavengingReflux scavenging
Ignition modeDual-spark plug ignitionDual-spark plug ignition
Lubrication methodSeparation lubricationSeparation lubrication
Publisher’s Note: MDPI stays neutral with regard to jurisdictional claims in published maps and institutional affiliations.

