

CerealNet: A Hybrid Deep Learning Architecture for Cereal Crop Mapping Using Sentinel-2 Time-Series

 ,
,  ,
,
Abstract
1. Introduction
2. Study Area and Data
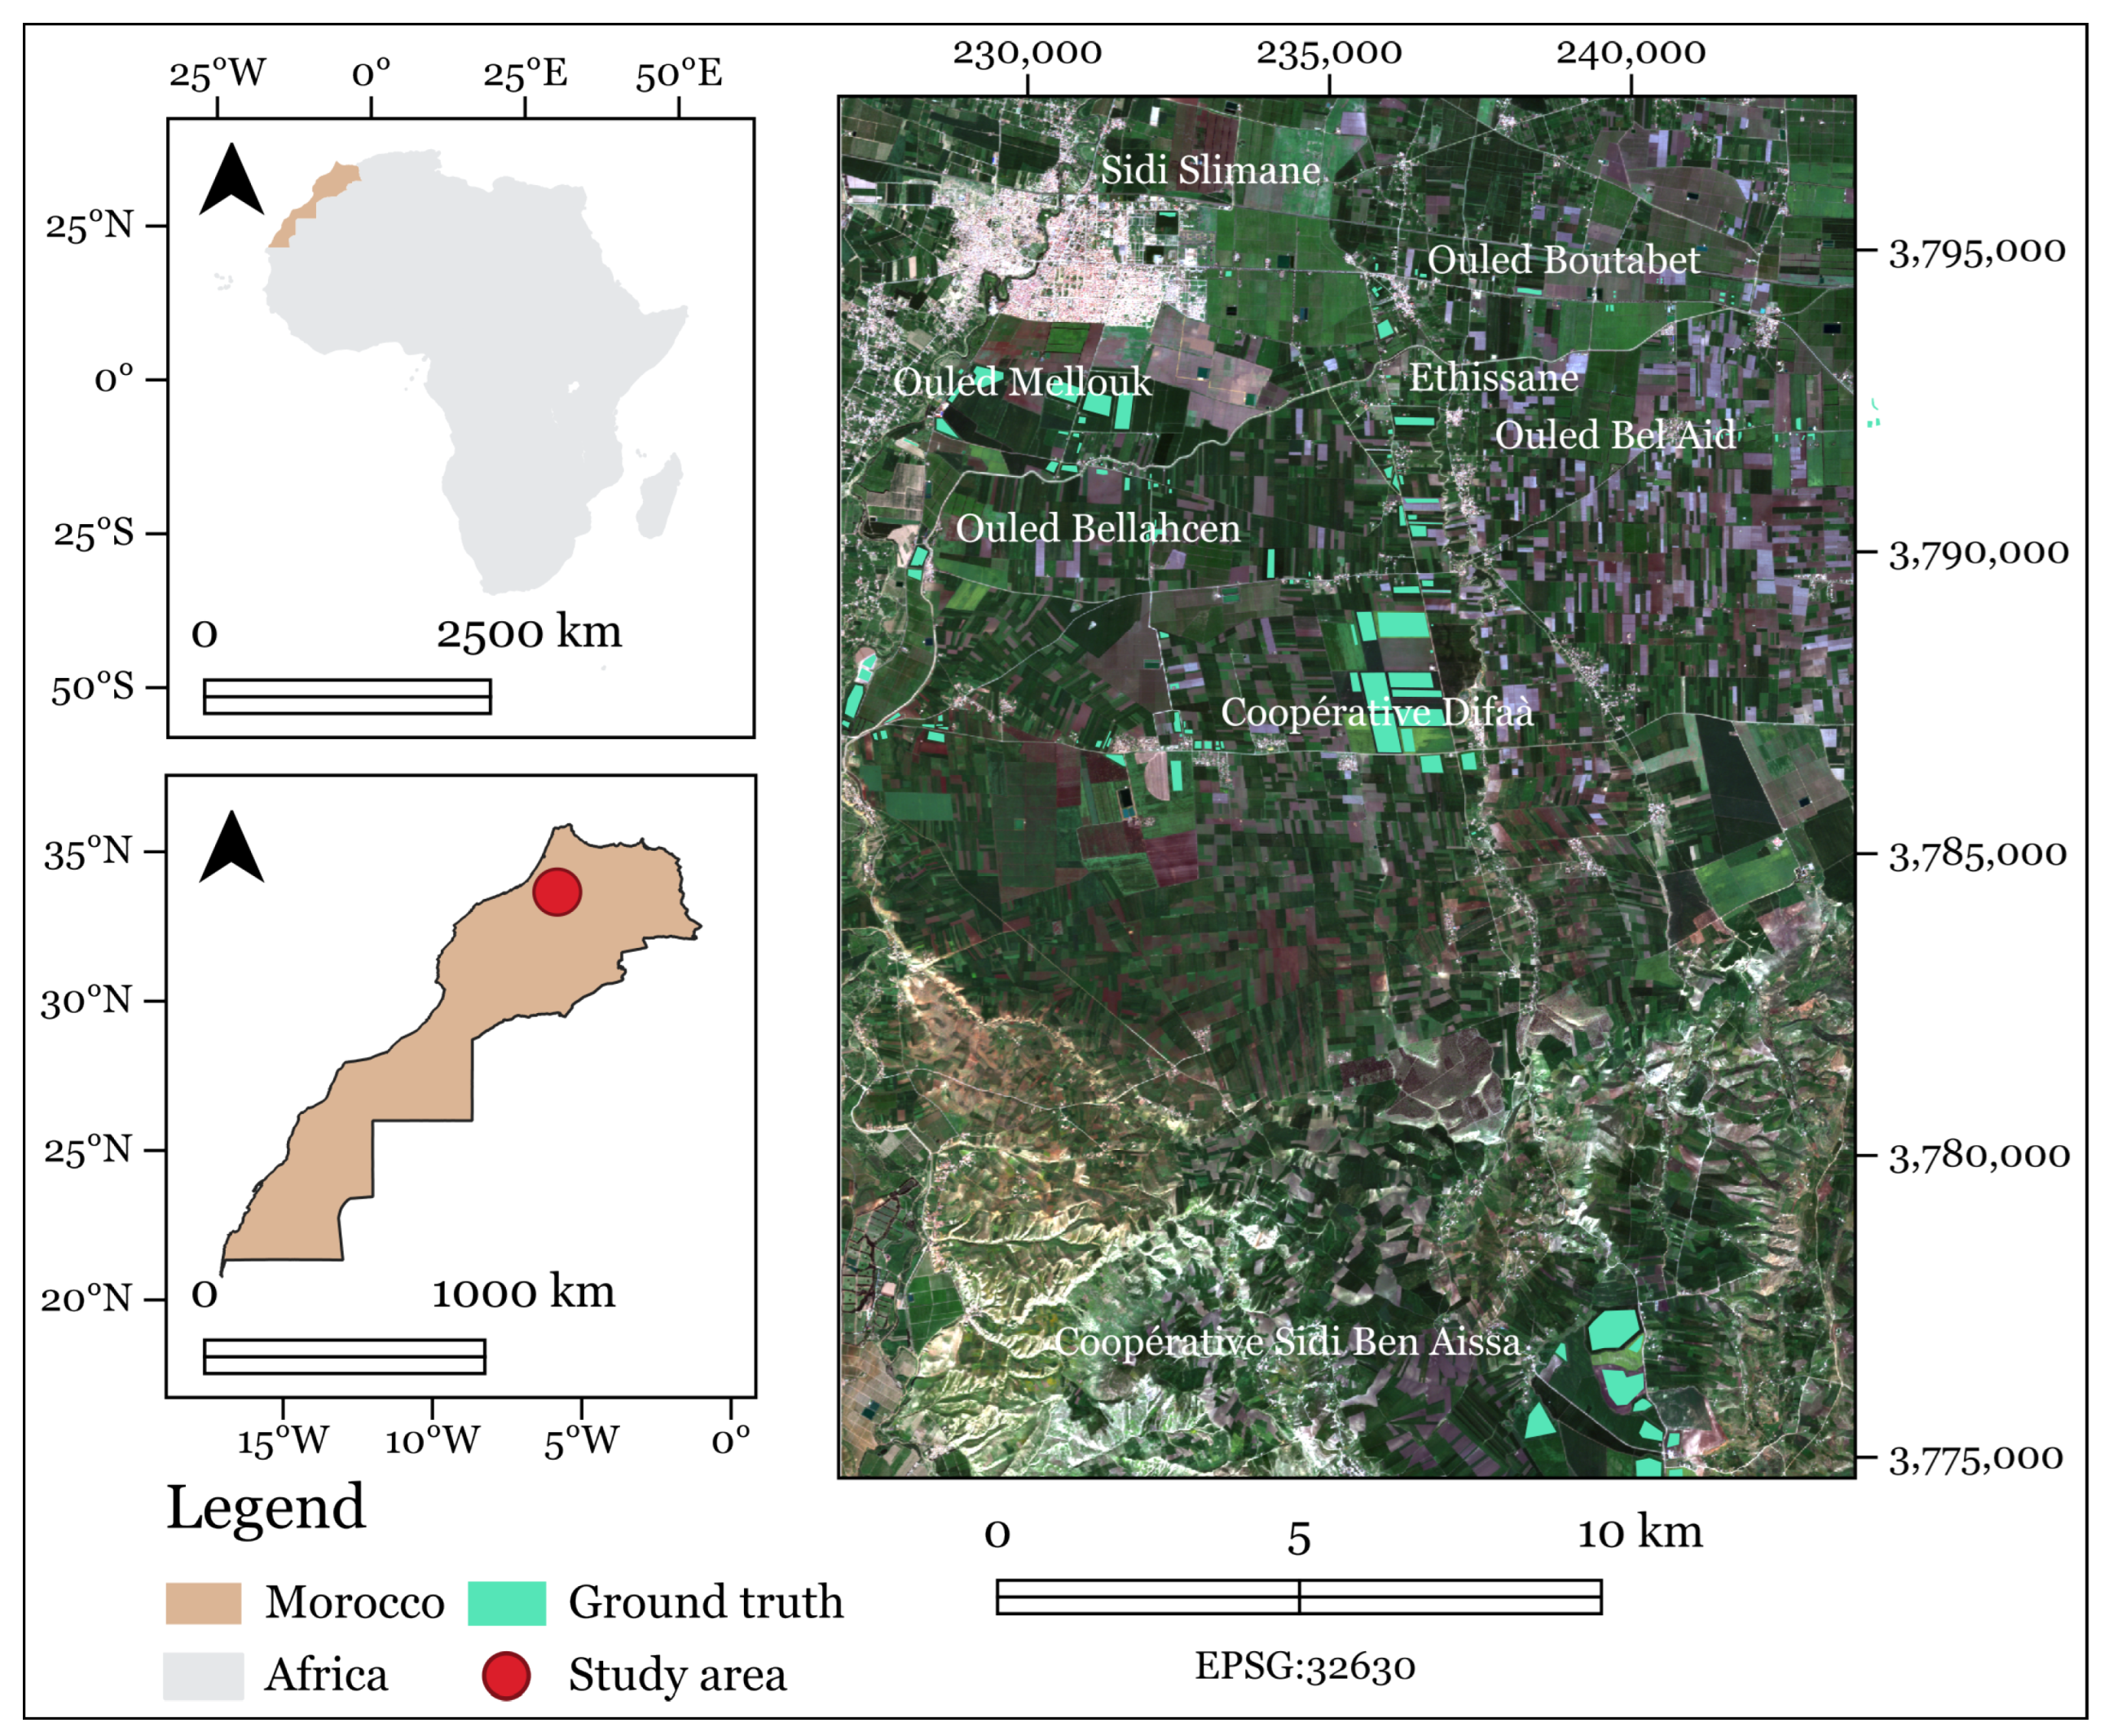
2.1. Study Area
2.2. Data
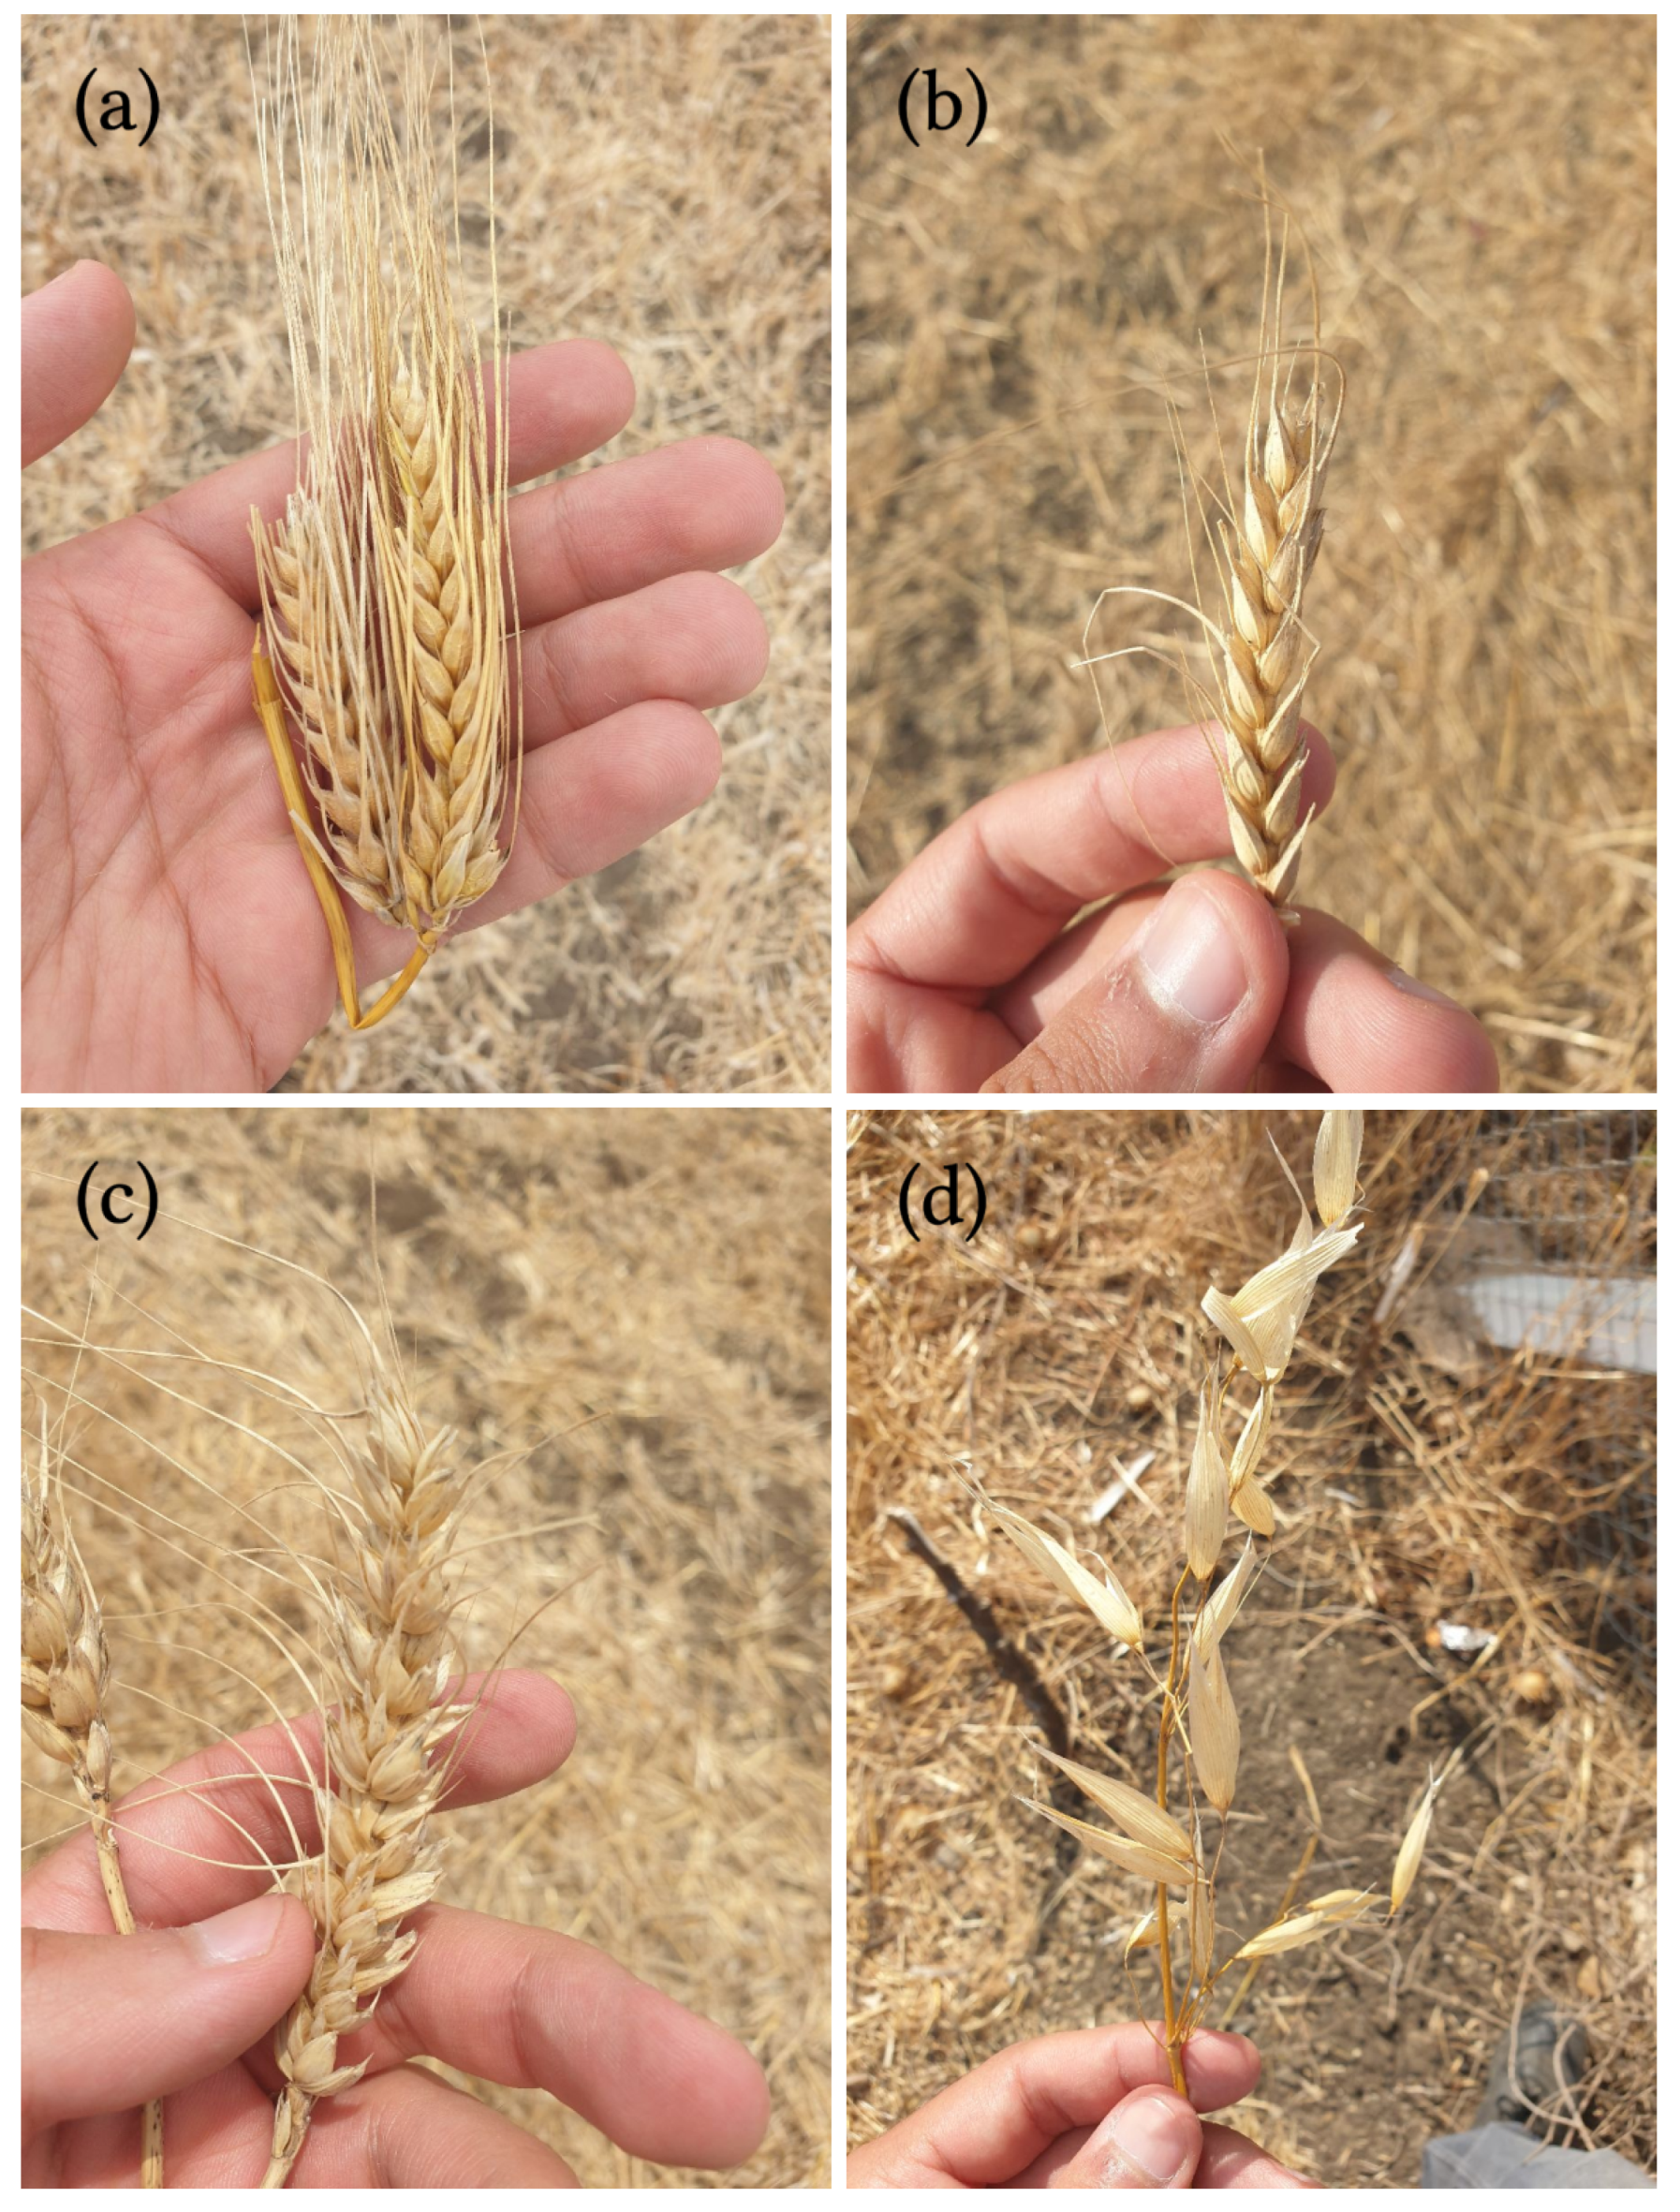
2.2.1. Ground Truth
2.2.2. Remote Sensing Data
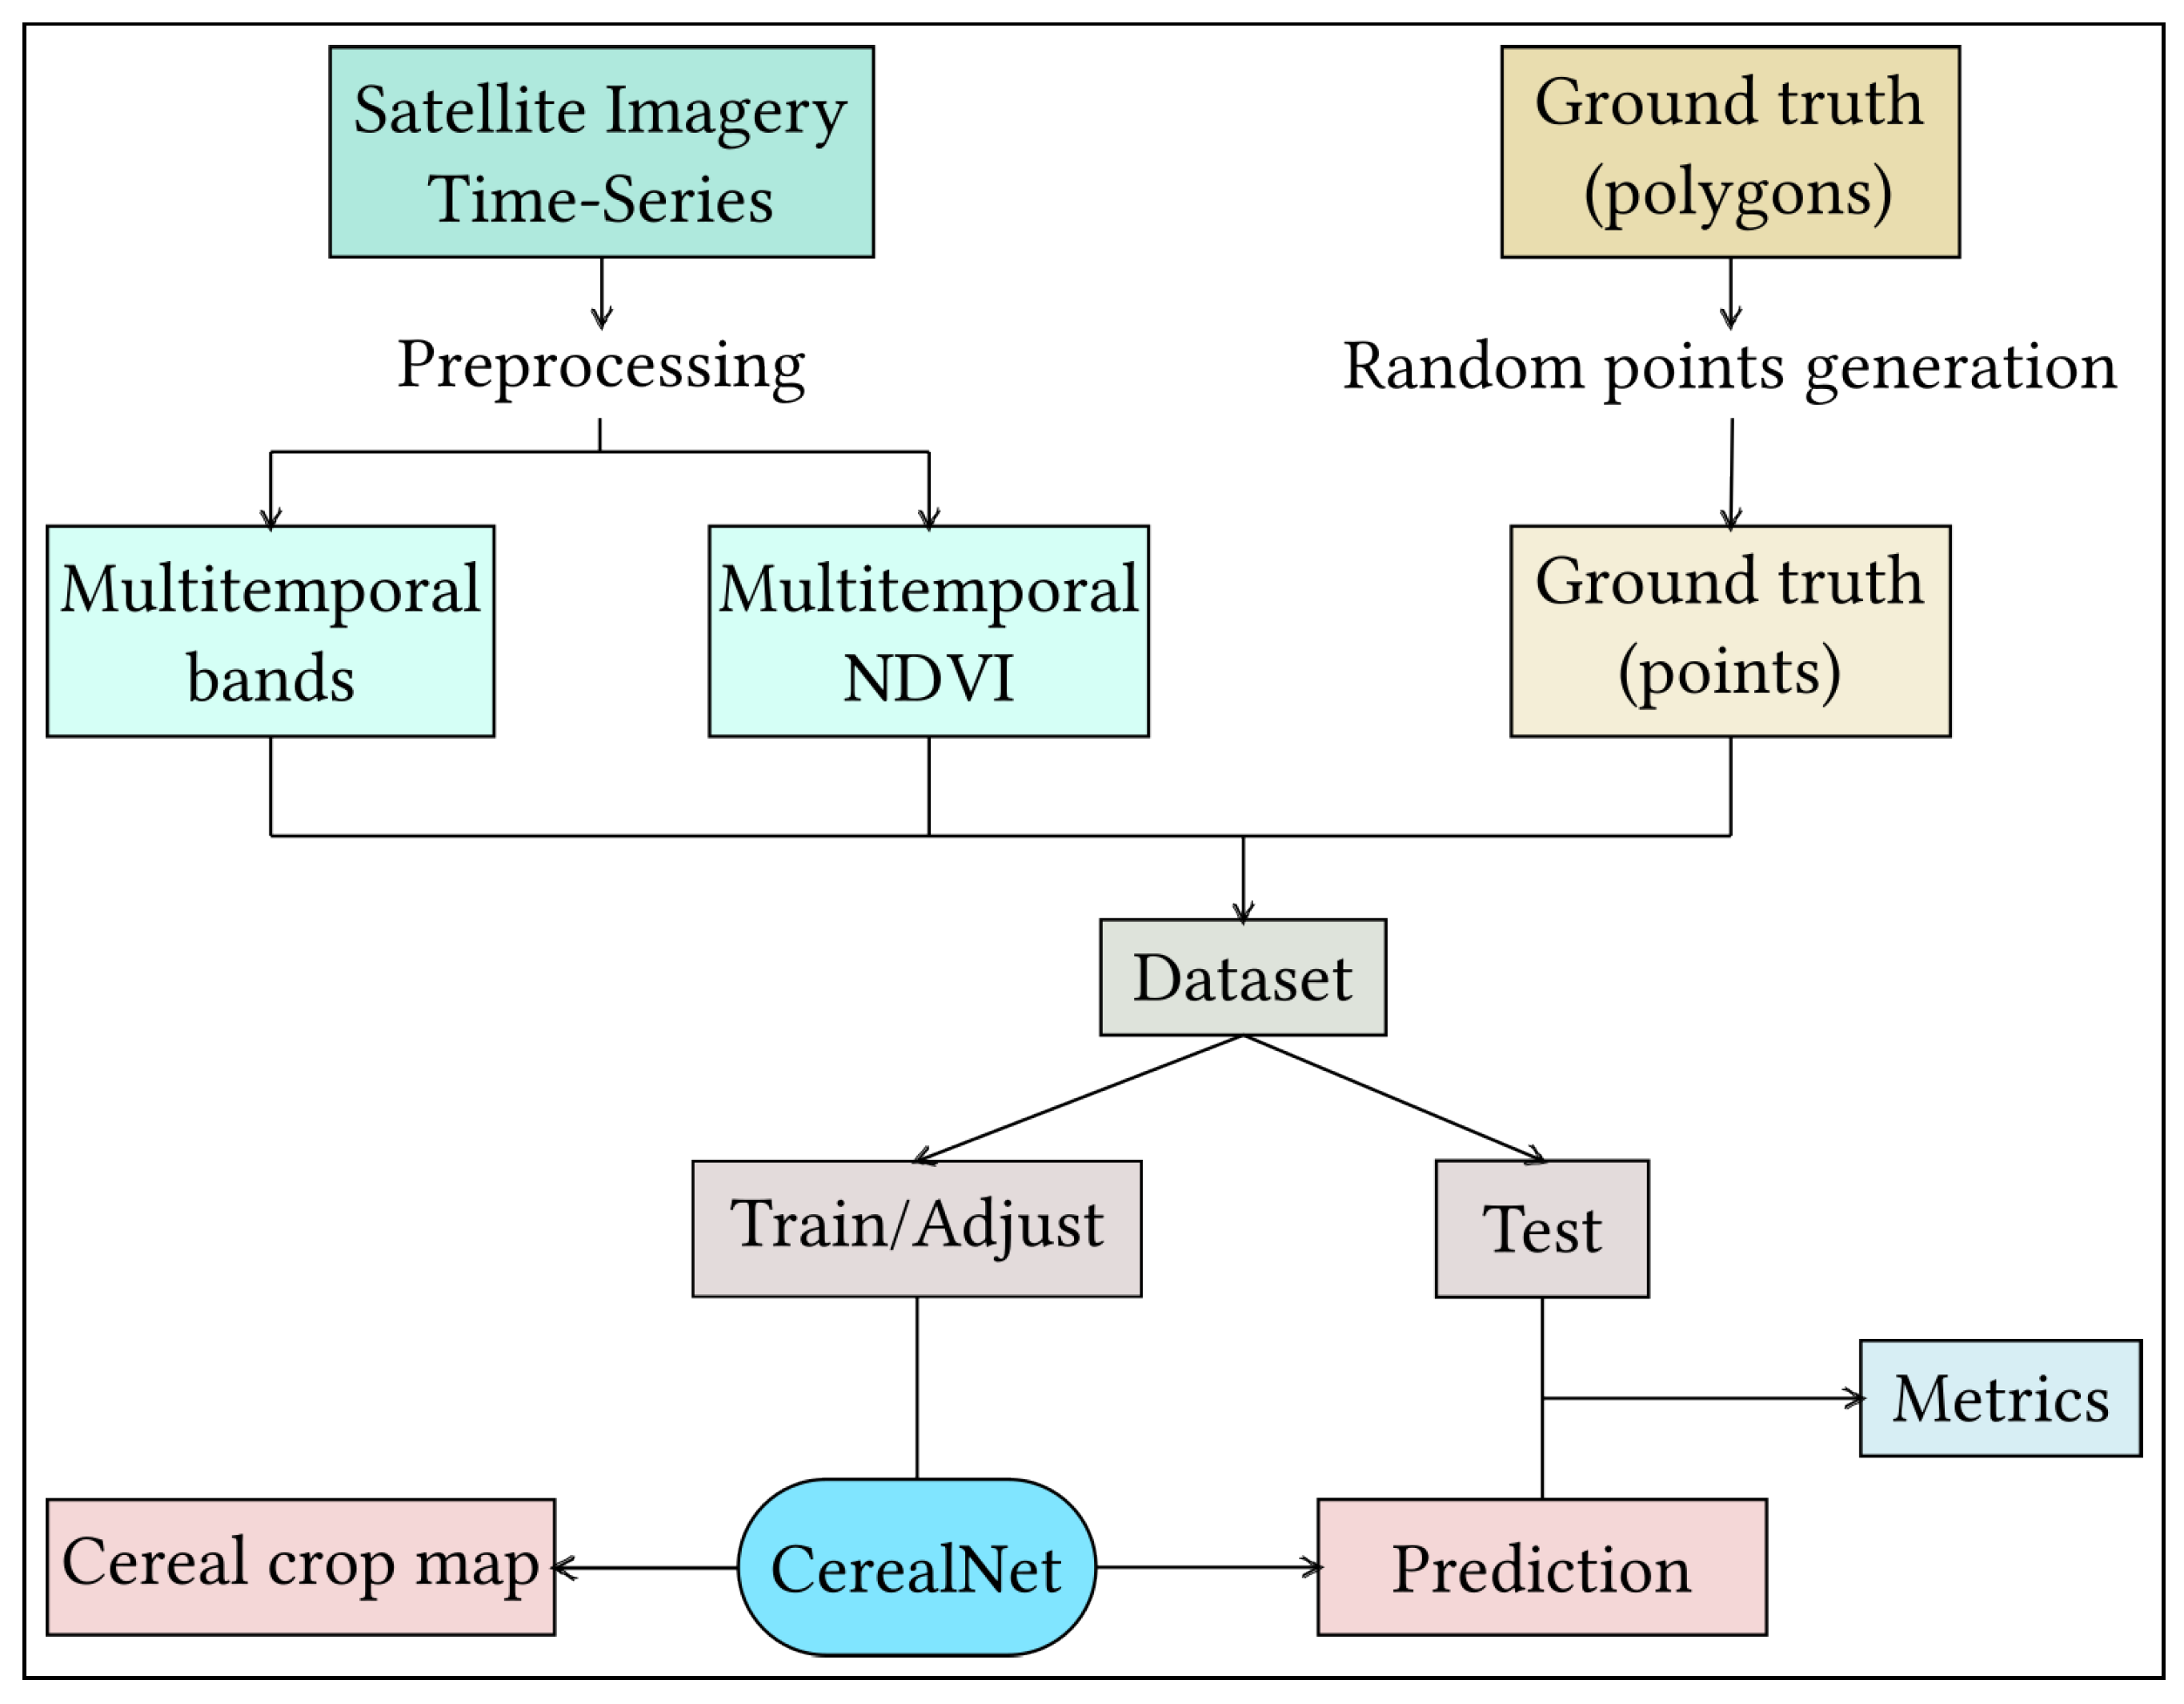
3. Methodology
3.1. Traditional Machine Learning
3.1.1. Support Vector Machine
3.1.2. Random Forest
3.2. Deep Learning
3.2.1. LSTM
3.2.2. CNN
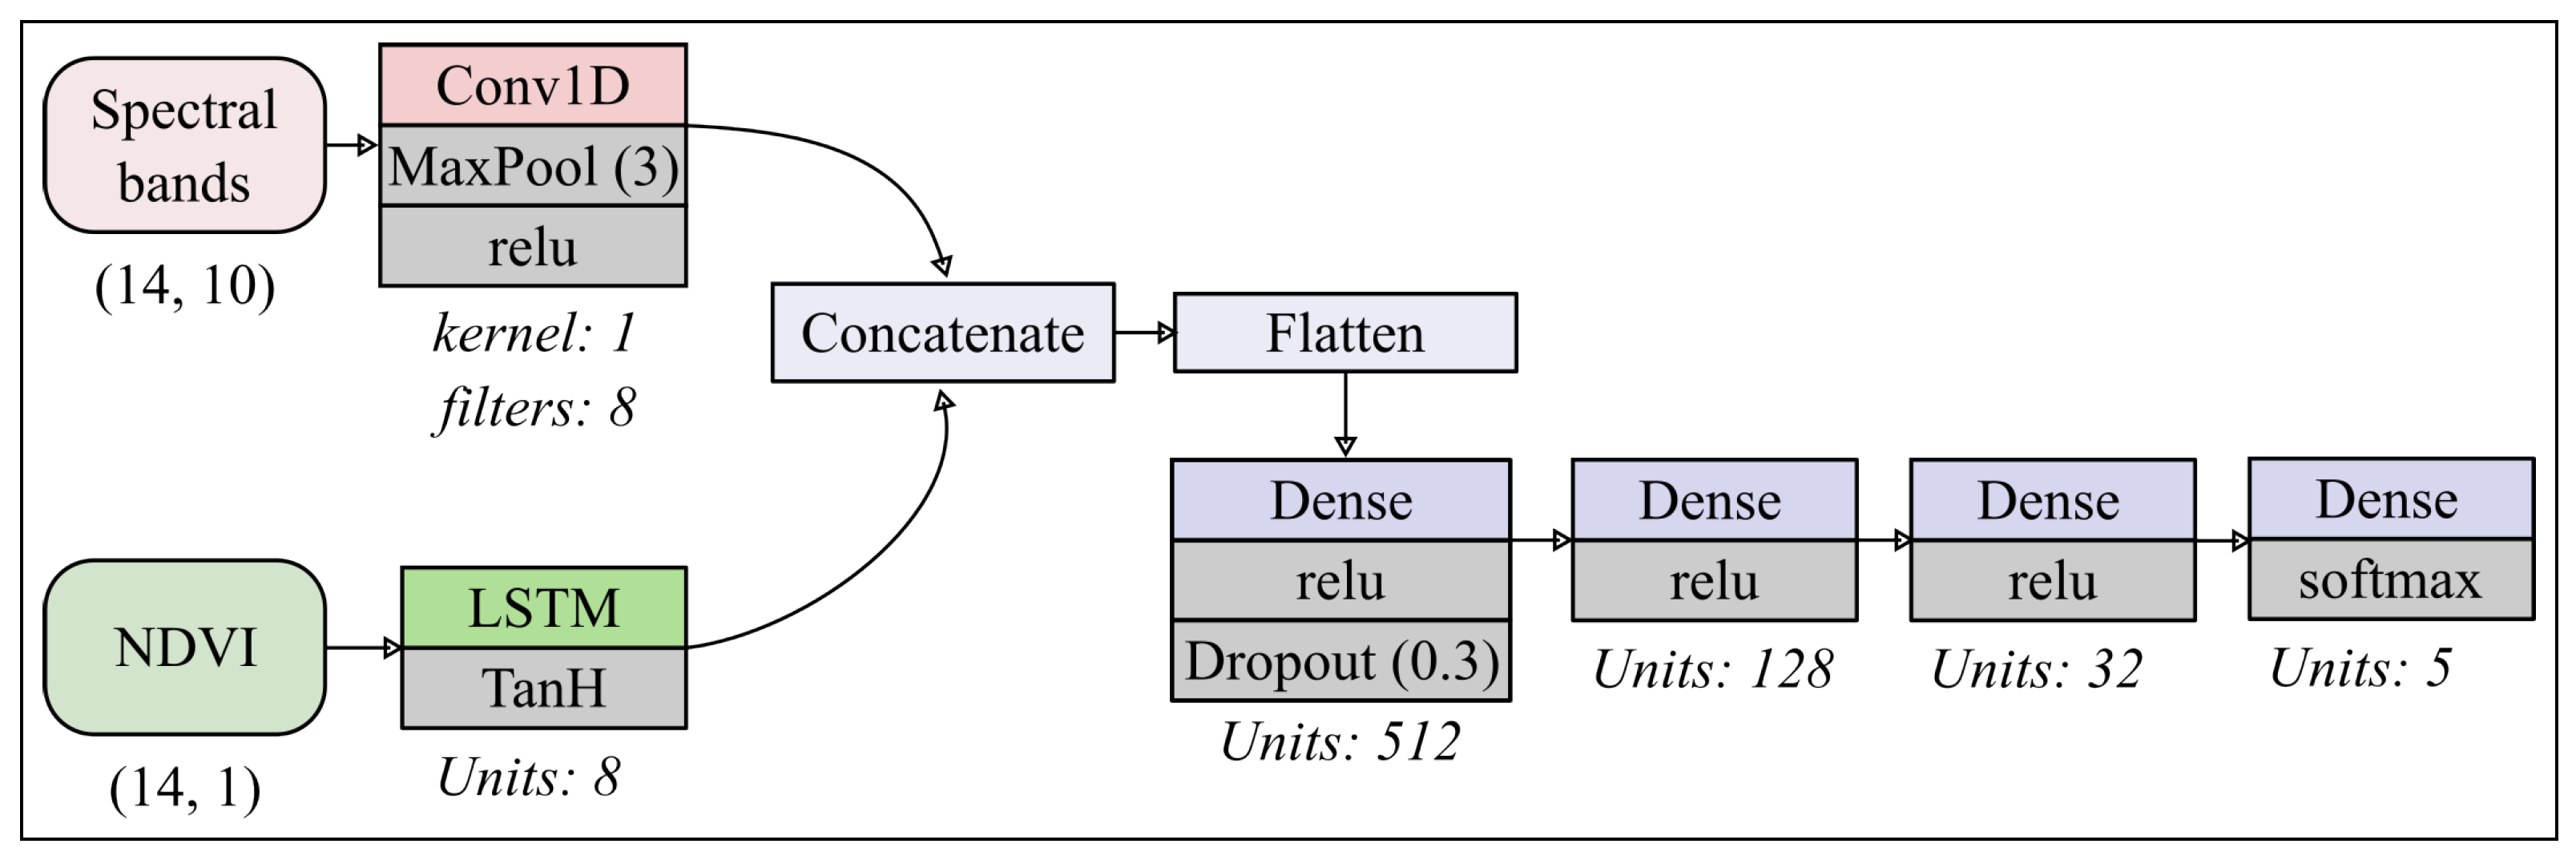
3.2.3. CerealNet
4. Results and Discussion
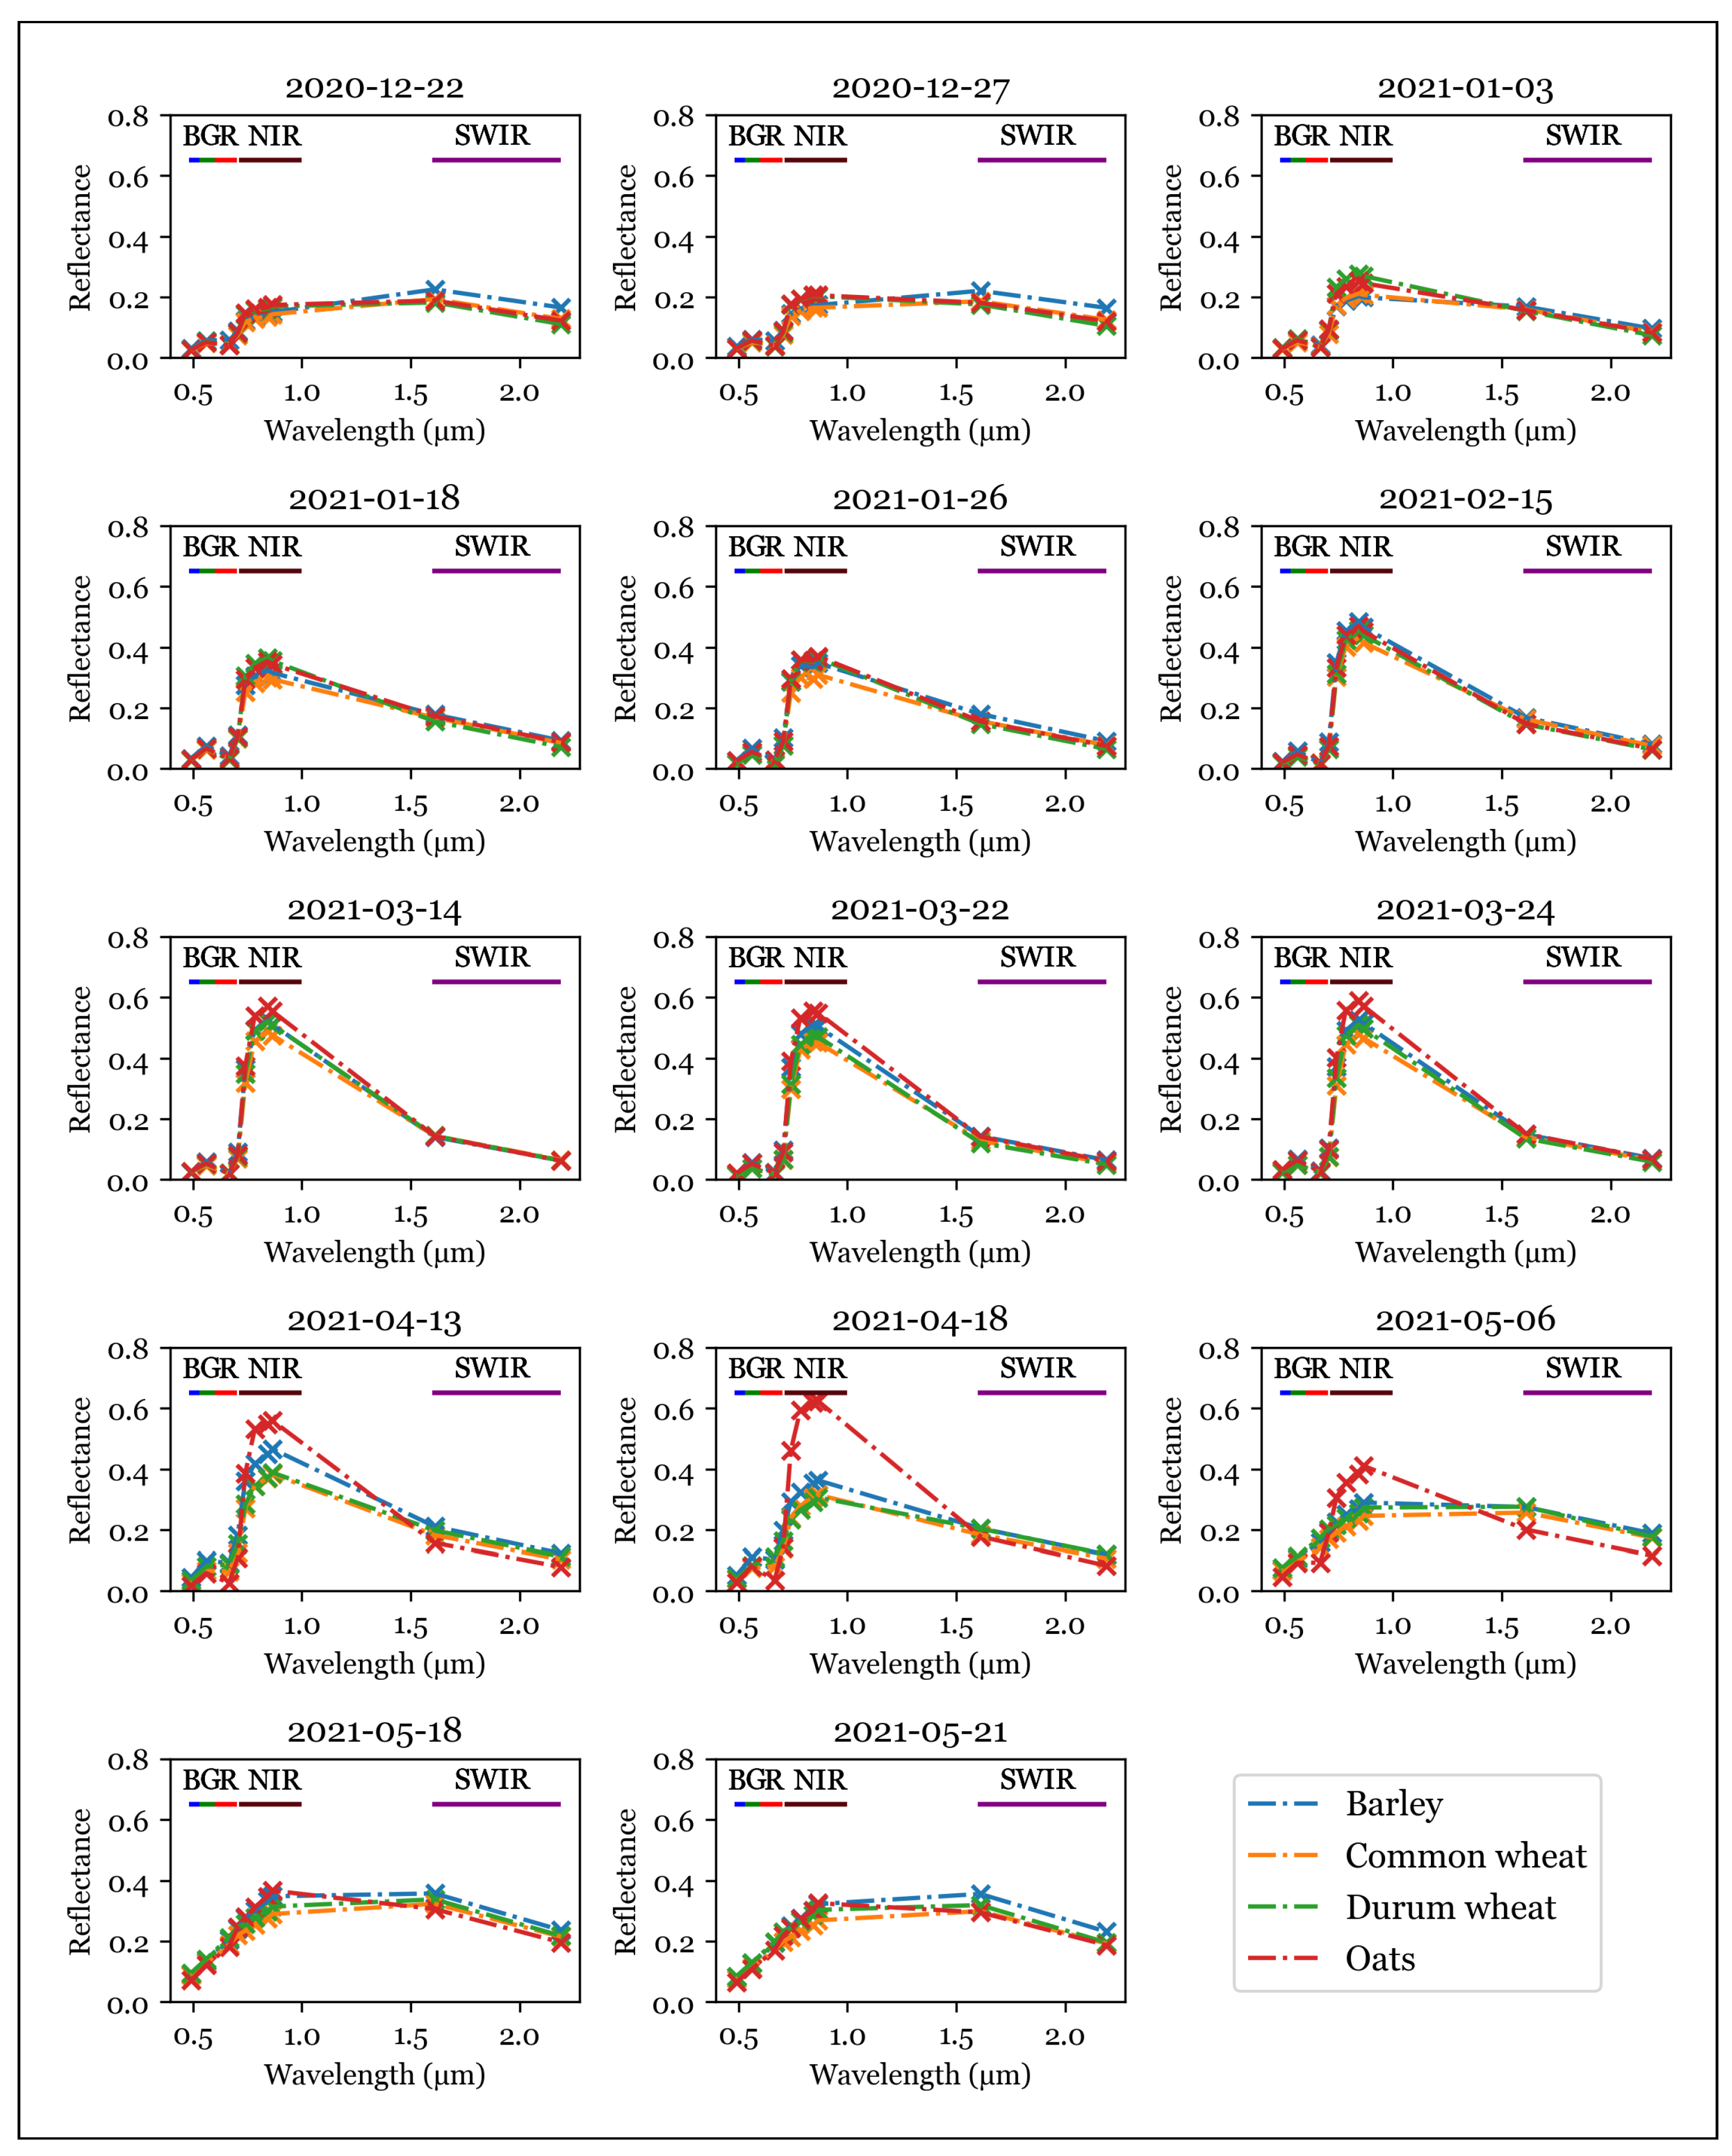
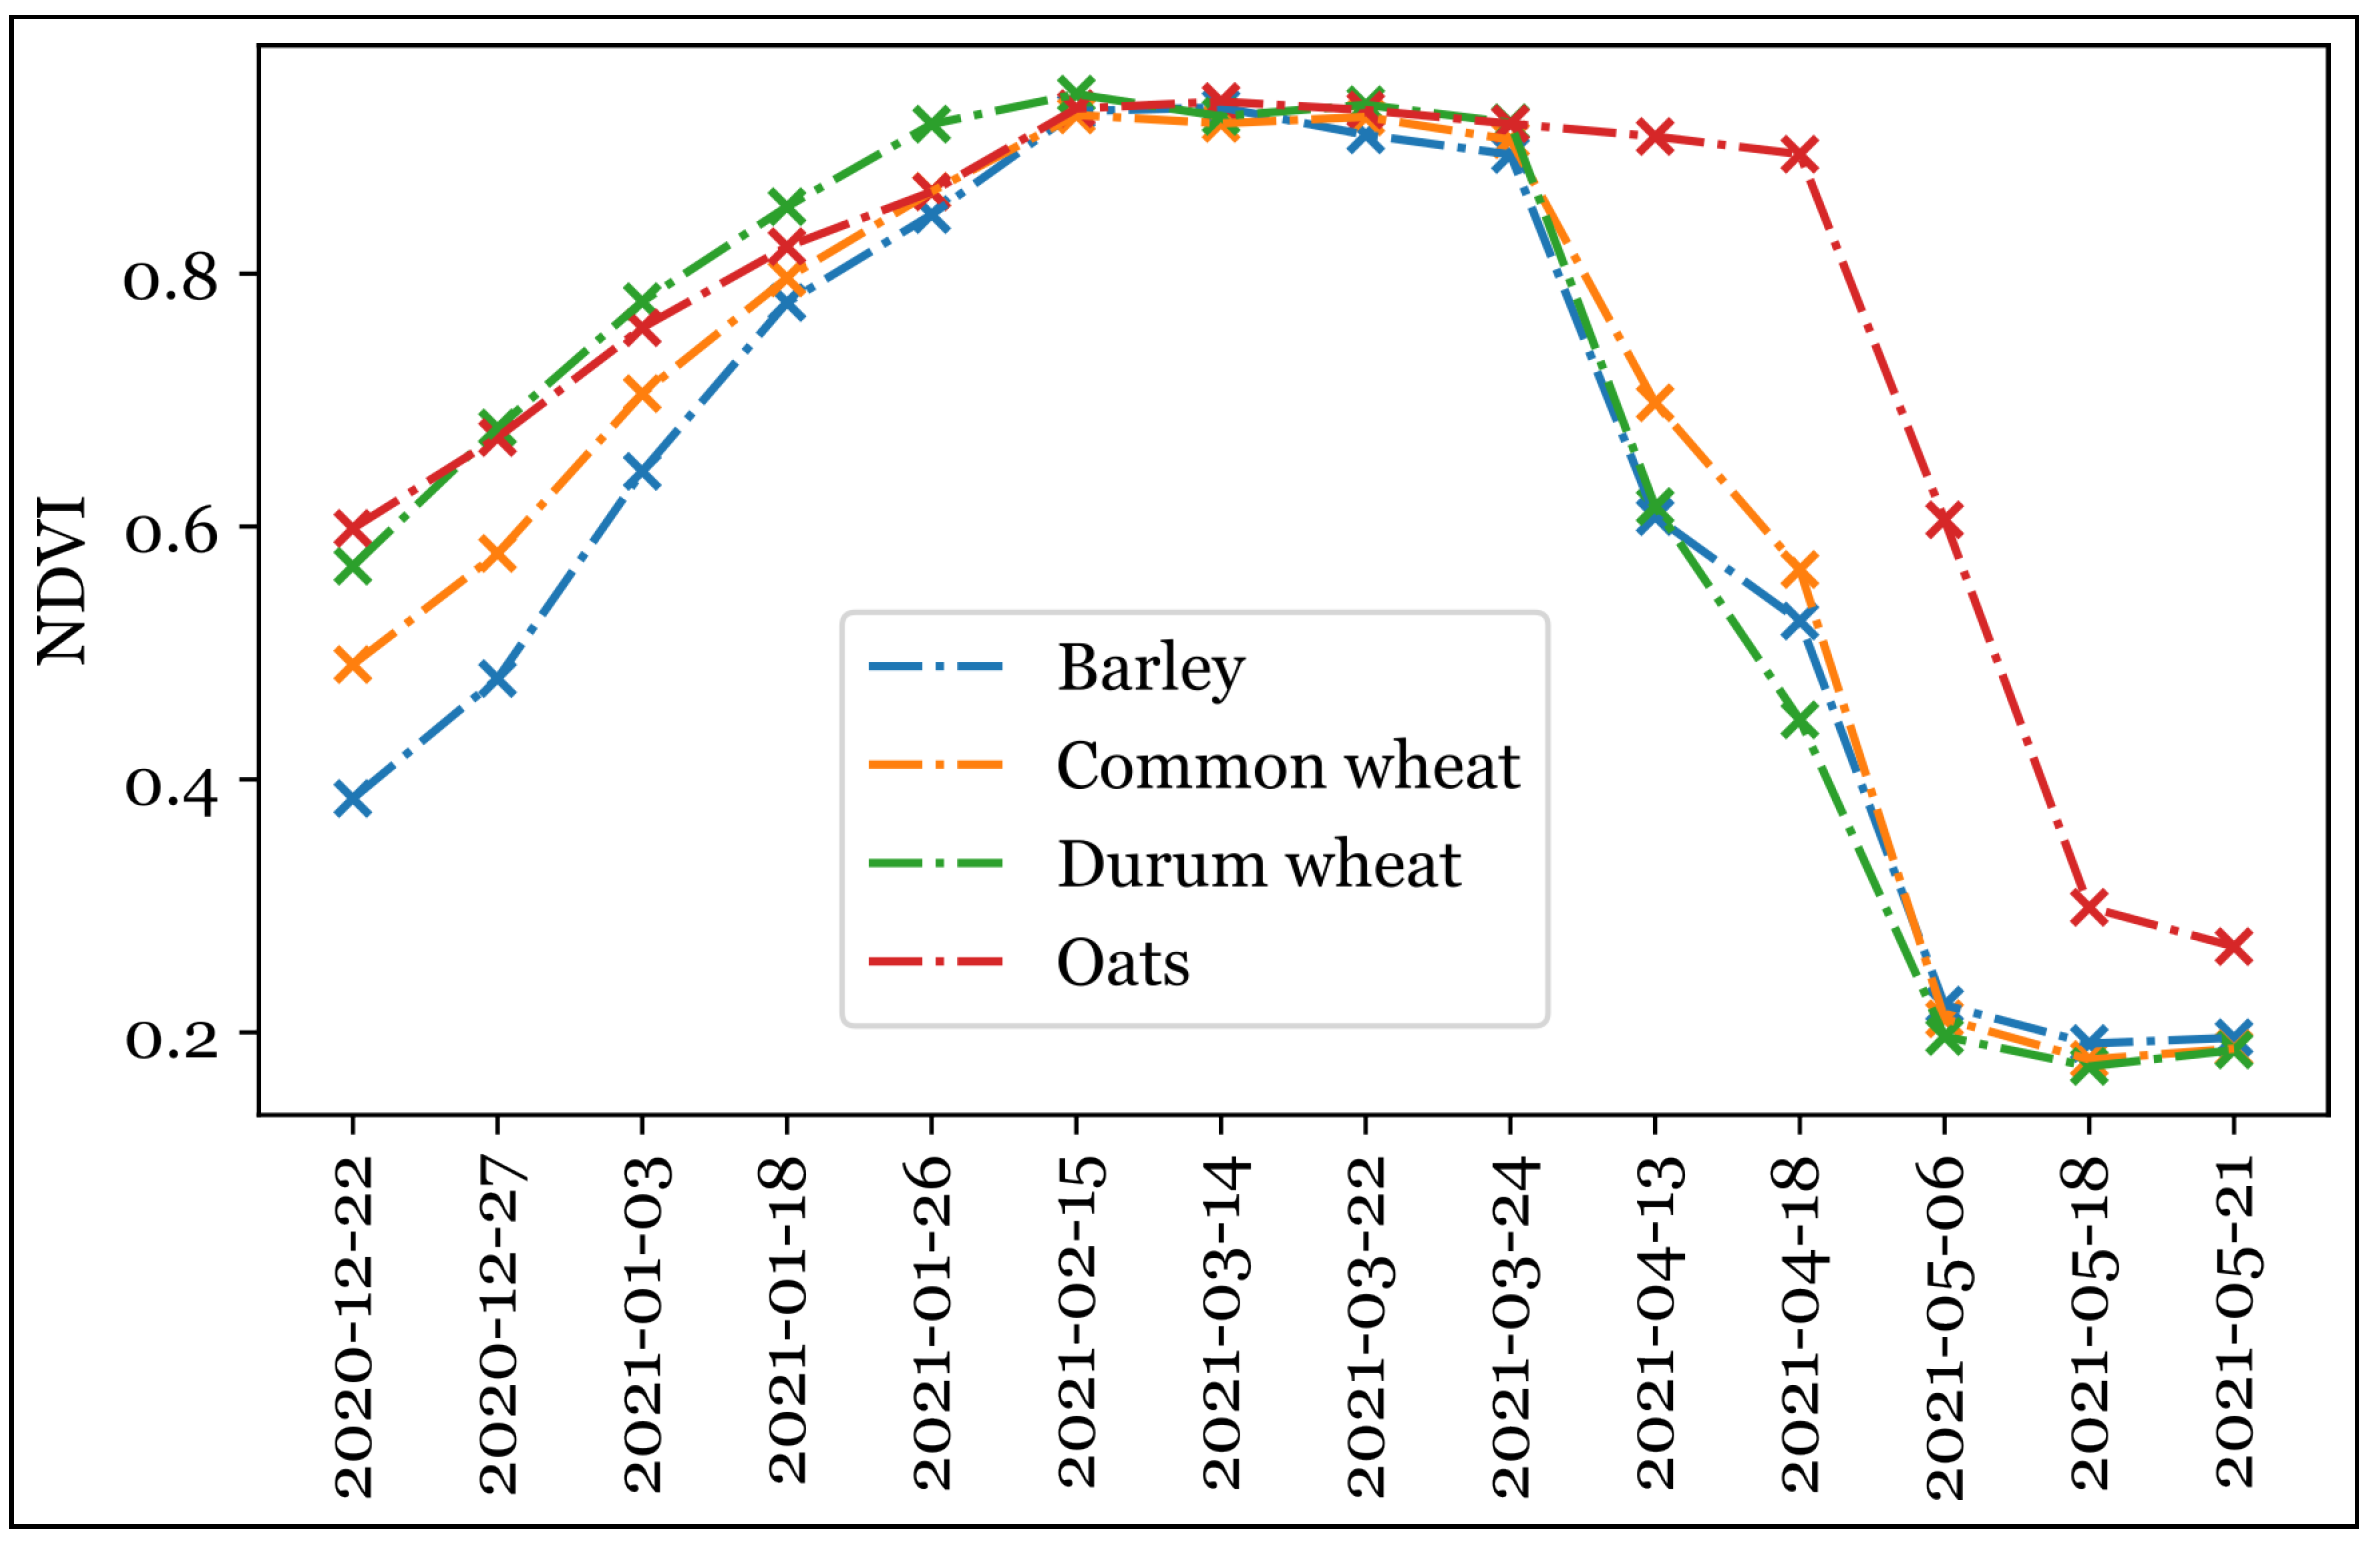
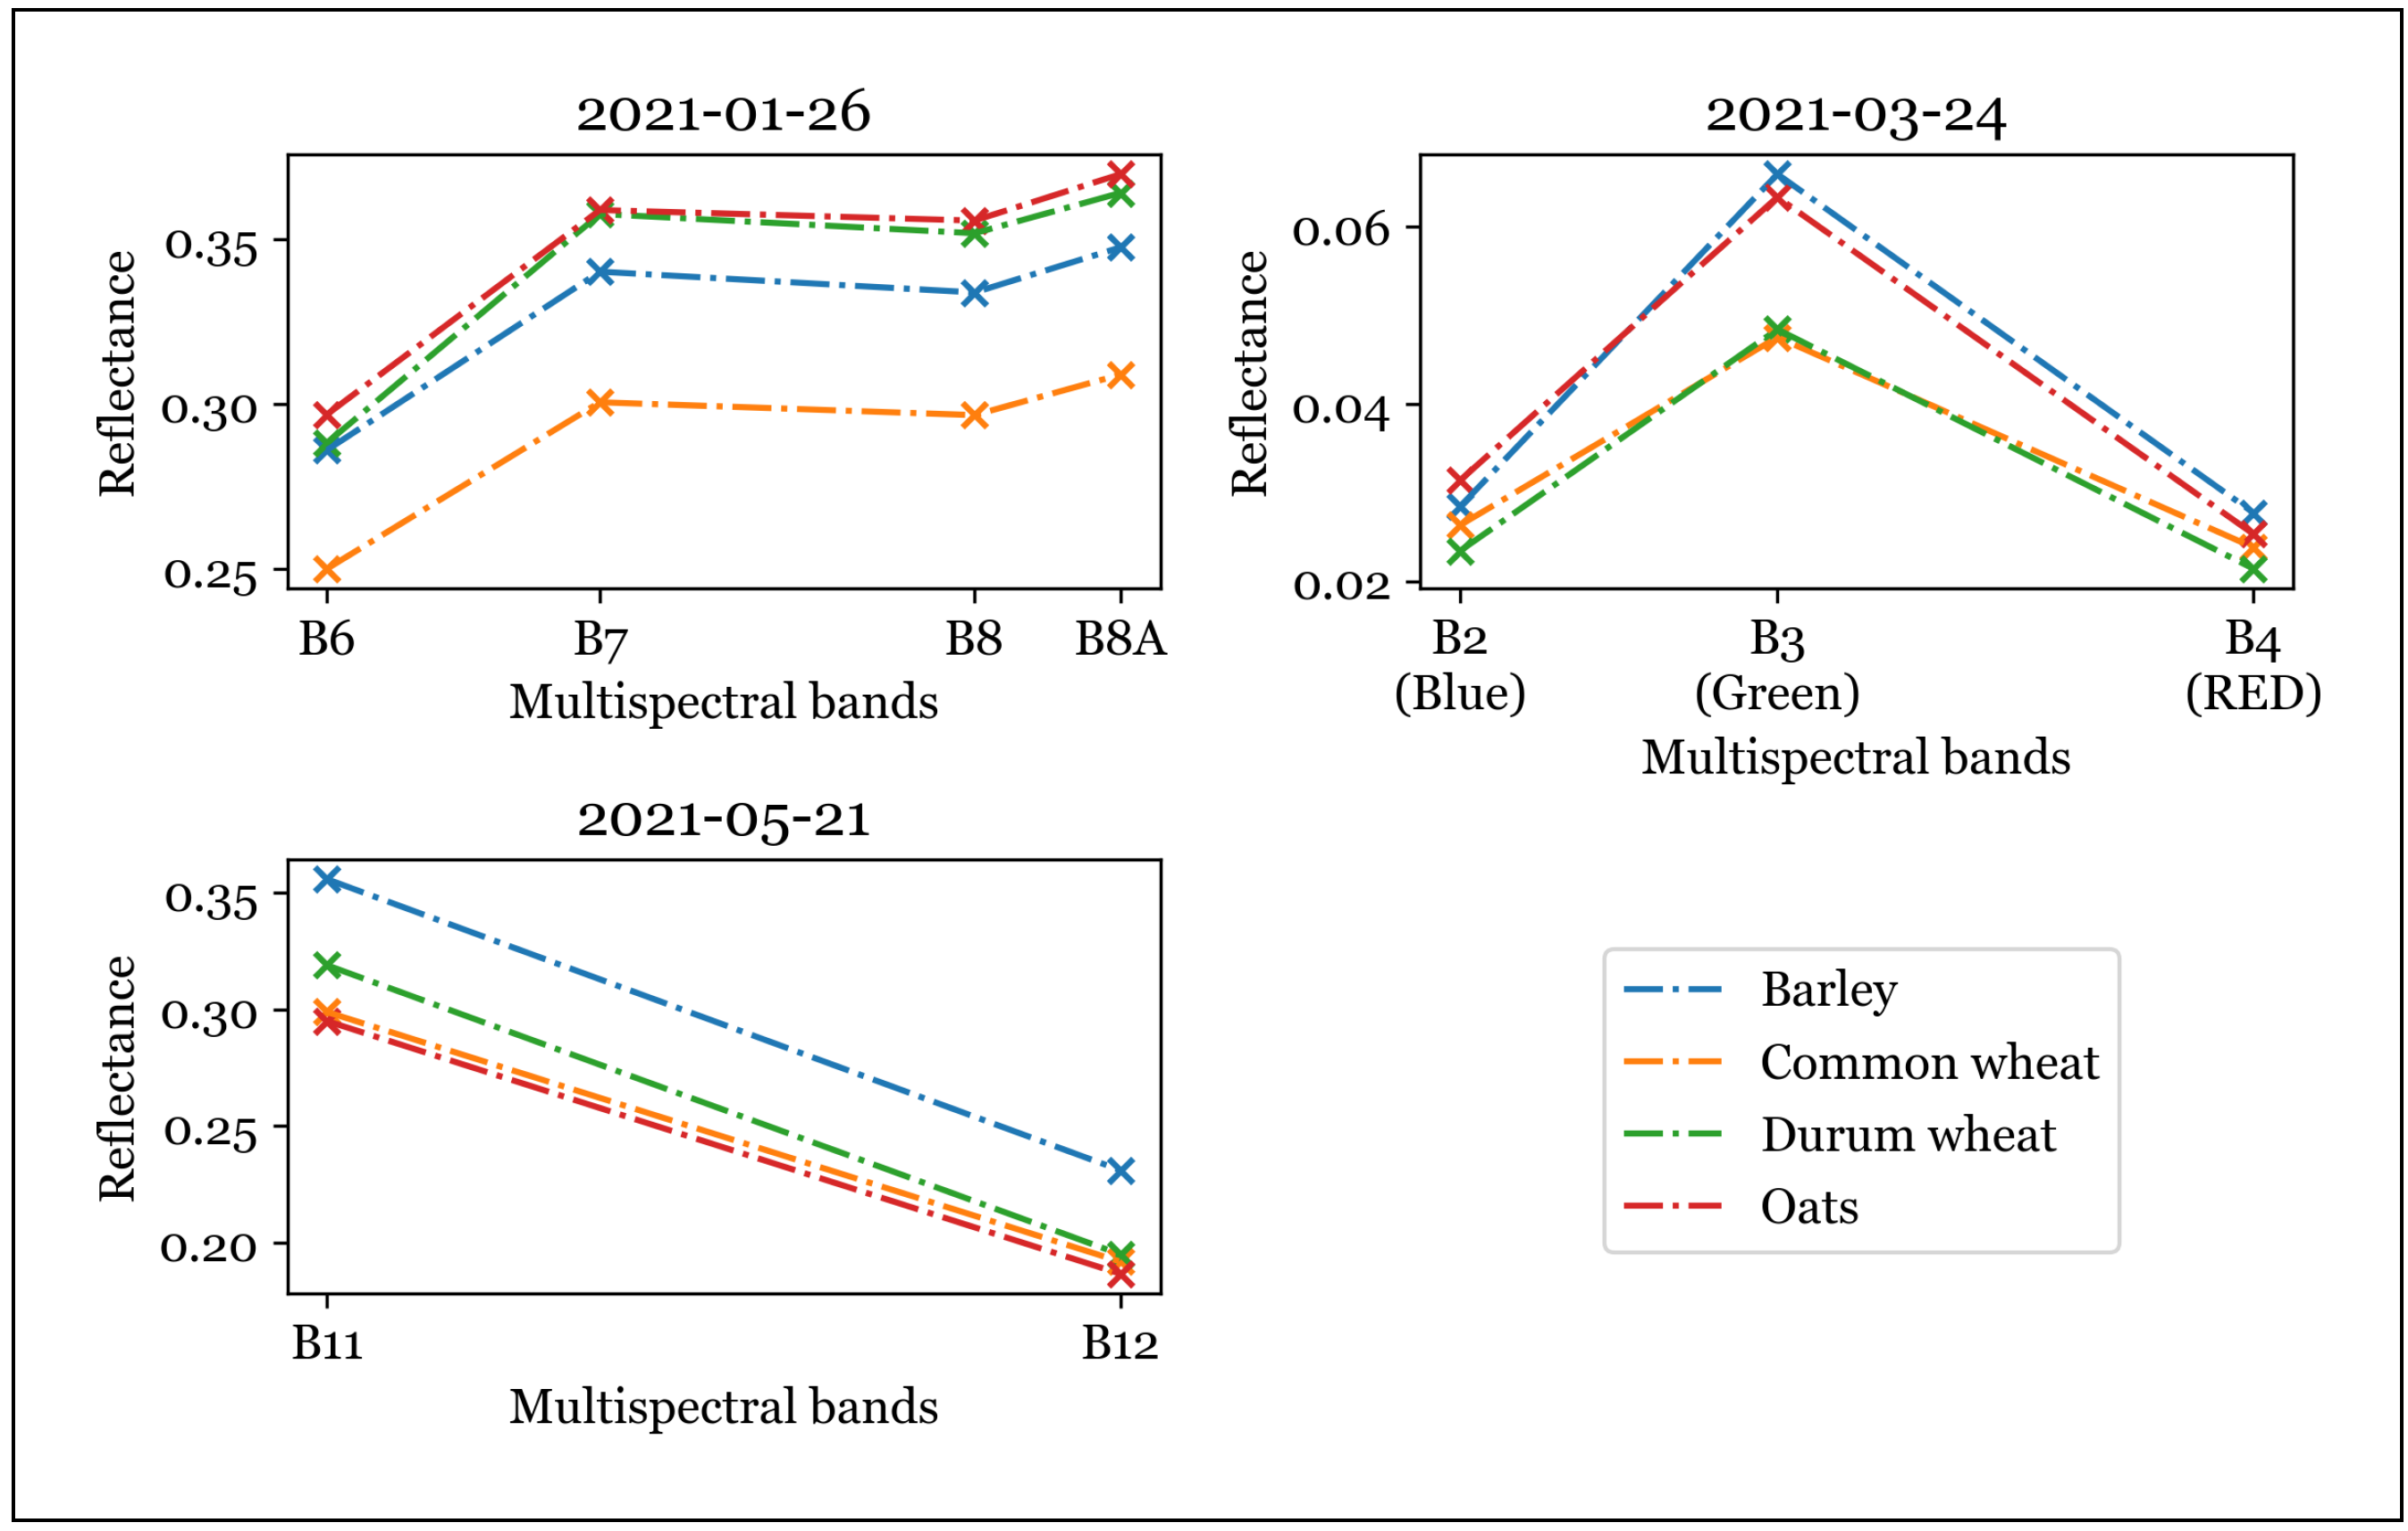
4.1. Spectro-Temporal Analysis
4.2. CerealNet Results
4.3. Comparison with State-Of-The-Art Classifiers
5. Conclusions
Author Contributions
Funding
Institutional Review Board Statement
Informed Consent Statement
Data Availability Statement
Acknowledgments
Conflicts of Interest
Abbreviations
| CNN | Convolutional Neural Networks |
| DT | Decision Tree |
| KNN | K-Nearest Neighbor |
| LSTM | Long Short-Term Memory |
| ML | Machine Learning |
| NDVI | Normalized Difference |
| NIR | Near Infrared |
| RF | Random Forest |
| RNN | Recurrent Neural Networks |
| SAR | Synthetic Aperture Radar |
| relu | Rectified Linear Unit |
| SGD | Stochastic Gradient Descent |
| SVM | Support Vector Machine |
| SWIR | Short Wave Infrared |
| VNIR | Visible and Near Infrared |
| relu | Rectified Linear Unit |
References
- Robert, P.C. Precision agriculture: A challenge for crop nutrition management. Plant Soil 2002, 247, 143–149. [Google Scholar] [CrossRef]
- Food and Agriculture Organization of the United Nations. The future of food and agriculture–Trends and challenges. Annu. Rep. 2017, 296, 1–180. [Google Scholar]
- Foley, J.A.; Ramankutty, N.; Brauman, K.A.; Cassidy, E.S.; Gerber, J.S.; Johnston, M.; Mueller, N.D.; O’Connell, C.; Ray, D.K.; West, P.C.; et al. Solutions for a cultivated planet. Nature 2011, 478, 337–342. [Google Scholar] [CrossRef] [PubMed]
- Santos, C.; Lamparelli, R.; Figueiredo, G.; Dupuy, S.; Boury, J.; Luciano, A.; Torres, R.; le Maire, G. Classification of Crops, Pastures, and Tree Plantations along the Season with Multi-Sensor Image Time Series in a Subtropical Agricultural Region. Remote Sens. 2019, 11, 334. [Google Scholar] [CrossRef]
- El Mansouri, L. Multiple classifier combination for crop types phenology based mapping. In Proceedings of the 2017 International Conference on Advanced Technologies for Signal and Image Processing (ATSIP), Fez, Morocco, 22–24 May 2017; pp. 1–6. [Google Scholar] [CrossRef]
- Suits, G.H. The calculation of the directional reflectance of a vegetative canopy. Remote Sens. Environ. 1972, 2, 117–125. [Google Scholar] [CrossRef]
- El Mansouri, L.; Lahssini, S.; Hadria, R.; Eddaif, N.; Benabdelouahab, T.; Dakir, A. Time Series Multispectral Images Processing for Crops and Forest Mapping: Two Moroccan Cases. Geospat. Technol. Eff. Land Gov. 2019, 24. [Google Scholar] [CrossRef]
- Hadria, R. Classification multi-temporelle des agrumes dans la plaine de triffa a partir des images sentinel 1 en vue d’une meilleure gestion de l’eau d’irrigation. In Proceedings of the 2018 Atelier International sur l’apport des Images Satellite Sentinel-2: état de L’art de la Recherche au Service de l’Environnement et Applications Associées, Rabat, Morocco, 6–7 March 2018. [Google Scholar]
- Zhao, J.; Zhong, Y.; Hu, X.; Wei, L.; Zhang, L. A robust spectral-spatial approach to identifying heterogeneous crops using remote sensing imagery with high spectral and spatial resolutions. Remote Sens. Environ. 2020, 239, 111605. [Google Scholar] [CrossRef]
- Moussaid, A.; Fkihi, S.E.; Zennayi, Y. Tree Crowns Segmentation and Classification in Overlapping Orchards Based on Satellite Images and Unsupervised Learning Algorithms. J. Imaging 2021, 7, 241. [Google Scholar] [CrossRef]
- Zhou, Y.; Luo, J.; Feng, L.; Yang, Y.; Chen, Y.; Wu, W. Long-short-term-memory-based crop classification using high-resolution optical images and multi-temporal SAR data. Giscience Remote Sens. 2019, 56, 1170–1191. [Google Scholar] [CrossRef]
- Yan, J.; Liu, J.; Wang, L.; Liang, D.; Cao, Q.; Zhang, W.; Peng, J. Land-Cover Classification With Time-Series Remote Sensing Images by Complete Extraction of Multiscale Timing Dependence. IEEE J. Sel. Top. Appl. Earth Obs. Remote Sens. 2022, 15, 1953–1967. [Google Scholar] [CrossRef]
- Wang, X.; Zhang, J.; Xun, L.; Wang, J.; Wu, Z.; Henchiri, M.; Zhang, S.; Zhang, S.; Bai, Y.; Yang, S.; et al. Evaluating the Effectiveness of Machine Learning and Deep Learning Models Combined Time-Series Satellite Data for Multiple Crop Types Classification over a Large-Scale Region. Remote Sens. 2022, 14, 2341. [Google Scholar] [CrossRef]
- Martin, M.P.; Barreto, L.; Riano, D.; Fernandez-Quintanilla, C.; Vaughan, P. Assessing the potential of hyperspectral remote sensing for the descrimination of grassweeds in winter cereal crops. Int. J. Remote Sens. 2011, 32, 49–67. [Google Scholar] [CrossRef]
- Basukala, A.K.; Oldenburg, C.; Schellberg, J.; Sultanov, M.; Dubovyk, O. Towards improved land use mapping of irrigated croplands: Performance assessment of different image classification algorithms and approaches. Eur. J. Remote Sens. 2017, 50, 187–201. [Google Scholar] [CrossRef]
- Paul, S.; Kumar, D.N. Evaluation of Feature Selection and Feature Extraction Techniques on Multi-Temporal Landsat-8 Images for Crop Classification. Remote Sens. Earth Syst. Sci. 2019, 2, 197–207. [Google Scholar] [CrossRef]
- Karakizi, C.; Tsiotas, I.A.; Kandylakis, Z.; Vaiopoulos, A.; Karantzalos, K. Assessing the Contribution of Spectral and Temporal Features for Annual Land Cover and Crop Type Mapping. Int. Arch. Photogramm. Remote. Sens. Spat. Inf. Sci. 2020, 43, 1555–1562. [Google Scholar] [CrossRef]
- Kaijage, B. Development of a Spatially Explicit Active Learning Method for Crop Type Mapping from Satellite Image Time Series. Ph.D. Thesis, University of Twente, Enschede, The Netherlands, 2021. [Google Scholar]
- Yan, Y.; Ryu, Y. Google street view and deep learning: A new ground truthing approach for crop mapping. arXiv 2019, arXiv:1912.05024. [Google Scholar]
- Muhammad, S.; Zhan, Y.; Wang, L.; Hao, P.; Niu, Z. Major crops classification using time series MODIS EVI with adjacent years of ground reference data in the US state of Kansas. Optik 2016, 127, 1071–1077. [Google Scholar] [CrossRef]
- Piedelobo, L.; Hernández-López, D.; Ballesteros, R.; Chakhar, A.; Del Pozo, S.; González-Aguilera, D.; Moreno, M.A. Scalable pixel-based crop classification combining Sentinel-2 and Landsat-8 data time series: Case study of the Duero river basin. Agricultural Systems 2019, 171, 36–50. [Google Scholar] [CrossRef]
- Momm, H.G.; ElKadiri, R.; Porter, W. Crop-type classification for long-term modeling: An integrated remote sensing and machine learning approach. Remote Sens. 2020, 12, 449. [Google Scholar] [CrossRef]
- Kwak, G.H.; Park, C.; Lee, K.; Na, S.; Ahn, H.; Park, N.W. Potential of Hybrid CNN-RF Model for Early Crop Mapping with Limited Input Data. Remote Sens. 2021, 13, 1629. [Google Scholar] [CrossRef]
- Zheng, B.; Myint, S.W.; Thenkabail, P.S.; Aggarwal, R.M. A support vector machine to identify irrigated crop types using time-series Landsat NDVI data. Int. J. Appl. Earth Obs. Geoinf. 2015, 34, 103–112. [Google Scholar] [CrossRef]
- Kaiser, A.; Duchesne-Onoro, R. Discrimination of wheat and oat crops using field hyperspectral remote sensing. In Proceedings of the Hyperspectral Imaging Sensors: Innovative Applications and Sensor Standards 2017; SPIE: Bellingham, WA, USA, 2017; Volume 10213, pp. 55–60. [Google Scholar] [CrossRef]
- Li, Z.; Zhou, G.; Zhang, T. Interleaved group convolutions for multitemporal multisensor crop classification. Infrared Phys. Technol. 2019, 102, 103023. [Google Scholar] [CrossRef]
- Zhang, X.; Zheng, Z.; Xiao, P.; Li, Z.; He, G. Patch-Based Training of Fully Convolutional Network for Hyperspectral Image Classification With Sparse Point Labels. IEEE J. Sel. Top. Appl. Earth Obs. Remote Sens. 2022, 15, 8884–8897. [Google Scholar] [CrossRef]
- Sykas, D.; Sdraka, M.; Zografakis, D.; Papoutsis, I. A Sentinel-2 Multiyear, Multicountry Benchmark Dataset for Crop Classification and Segmentation With Deep Learning. IEEE J. Sel. Top. Appl. Earth Obs. Remote Sens. 2022, 15, 3323–3339. [Google Scholar] [CrossRef]
- Metzger, N.; Turkoglu, M.O.; D’Aronco, S.; Wegner, J.D.; Schindler, K. Crop Classification Under Varying Cloud Cover With Neural Ordinary Differential Equations. IEEE Trans. Geosci. Remote Sens. 2022, 60, 1–12. [Google Scholar] [CrossRef]
- Yao, J.; Wu, J.; Xiao, C.; Zhang, Z.; Li, J. The Classification Method Study of Crops Remote Sensing with Deep Learning, Machine Learning, and Google Earth Engine. Remote Sens. 2022, 14, 2758. [Google Scholar] [CrossRef]
- Wu, H.; Zhou, H.; Wang, A.; Iwahori, Y. Precise Crop Classification of Hyperspectral Images Using Multi-Branch Feature Fusion and Dilation-Based MLP. Remote Sens. 2022, 14, 2713. [Google Scholar] [CrossRef]
- Manjunath, K.R.; Ray, S.S.; Panigrahy, S. Discrimination of Spectrally-Close Crops Using Ground-Based Hyperspectral Data. J. Indian Soc. Remote. Sens. 2011, 39, 599–602. [Google Scholar] [CrossRef]
- Serna-Saldivar, S.O. Cereal Grains: Properties, Processing, and Nutritional Attributes; CRC Press: Boca Raton, FL, USA, 2010. [Google Scholar]
- Delcour, J.A.; Hoseney, R. Principles of Cereal Science and Technology, 3rd ed.; AACC International: Washington, DC, USA, 2010. [Google Scholar]
- Softwel (p) Ltd. SW MAPS User’s Manual; Softwel (p) Ltd.: Kathmandu, Nepal, 2016; Available online: http://softwel.com.np (accessed on 20 December 2021).
- European Space Agency. Sentinel-2-Missions-Sentinel Online. Available online: https://sentinel.esa.int/web/sentinel/missions/sentinel-2 (accessed on 20 April 2022).
- Foody, M.; Mathur, A. A Relative Evaluation of Multiclass Image Classification by Support Vector Machines. IEEE Trans. Geosci. Remote Sens. 2004, 42, 1335–1343. [Google Scholar] [CrossRef]
- Foody, M.; Mathur, A. Toward Intelligent Training of Supervised Image Classifications: Directing Training Data Acquisition for SVM Classification. Remote Sens. Environ. 2004, 93, 107–117. [Google Scholar] [CrossRef]
- Vapnik, V. The Nature of Statistical Learning Theory, 1st ed.; Springer: New York, NY, USA, 1995. [Google Scholar]
- Pedregosa, F.; Varoquaux, G.; Gramfort, A.; Michel, V.; Thirion, B.; Grisel, O.; Blondel, M.; Prettenhofer, P.; Weiss, R.; Dubourg, V. Scikit-learn: Machine learning in python. J. Mach. Learn. Res. 2011, 12, 2825–2830. [Google Scholar]
- Python Software Foundation. Python 3.10.0 Documentation. Available online: https://www/python.org (accessed on 21 October 2022).
- Breiman, L. Random Forests. Mach. Learn. 2001, 35, 5–32. [Google Scholar] [CrossRef]
- Belgiu, M.; Drăguţ, L. Random forest in remote sensing: A review of applications and future directions. Isprs J. Photogramm. Remote Sens. 2016, 114, 24–31. [Google Scholar] [CrossRef]
- Hochreiter, S.; Schmidhuber, J. Long Short-Term Memory. Neural Comput. 1997, 9, 1735–1780. [Google Scholar] [CrossRef]
- Gers, F.A.; Schmidhuber, J.; Cummins, F. Learning to forget: Continual prediction with LSTM. Neural Comput. 2000, 12, 2451–2471. [Google Scholar] [CrossRef] [PubMed]
- Lyu, H.; Lu, H.; Mou, L. Learning a transferable change rule from a recurrent neural network for land cover change detection. Remote Sens. 2016, 8, 506. [Google Scholar] [CrossRef]
- Reddy, D.S.; Prasad, P.R.C. Prediction of vegetation dynamics using NDVI time series data and LSTM. Model. Earth Syst. Environ. 2018, 4, 409–419. [Google Scholar] [CrossRef]
- Zhang, J.; Zhu, Y.; Zhang, X.; Ye, M.; Yang, J. Developing a Long Short-Term Memory (LSTM) based Model for Predicting Water Table Depth in Agricultural Areas. J. Hydrol. 2018, 561, 918–929. [Google Scholar] [CrossRef]
- Meng, X.; Liu, M.; Wu, Q. Prediction of rice yield via stacked LSTM. Int. J. Agric. Environ. Inf. Syst. 2020, 11, 86–95. [Google Scholar] [CrossRef]
- LeCun, Y.; Bengio, Y.; Hinton, G. Deep learning. Nature 2015, 521, 436–444. [Google Scholar] [CrossRef]
- Chollet, F. Deep Learning with Python; Manning Publications Co.: Shelter Island, NY, USA, 2018. [Google Scholar]
- PLAN, H.C.A. Annuaire Statistique du Maroc; Haut Commissariat au Plan: Casablanca, Morocco, 2020. [Google Scholar]
- Liao, C.; Wang, J.; Xie, Q.; Al Baz, A.; Huang, X.; Shang, J.; He, Y. Synergistic Use of Multi-Temporal RADARSAT-2 and VEN mu S Data for Crop Classification Based on 1D Convolutional Neural Network. Remote Sens. 2020, 12, 832. [Google Scholar] [CrossRef]
- Ofori-Ampofo, S.; Pelletier, C.; Lang, S. Crop Type Mapping from Optical and Radar Time Series Using Attention-Based Deep Learning. Remote Sens. 2021, 13, 4668. [Google Scholar] [CrossRef]
- Mazza, A.; Gargiulo, M.; Scarpa, G.; Gaetano, R. Estimating the NDVI from SAR by Convolutional Neural Networks. In Proceedings of the IGARSS 2018-2018 IEEE International Geoscience and Remote Sensing Symposium, Valencia, Spain, 22–27 July 2018; pp. 1954–1957. [Google Scholar] [CrossRef]


| Crop | Plots | Pixels | ||||
|---|---|---|---|---|---|---|
| Train | Test | Total | Train | Test | Total | |
| Barley | 63 | 23 | 86 | 3117 | 979 | 4217 |
| Soft wheat | 359 | 67 | 426 | 17,200 | 5744 | 23,006 |
| Durum wheat | 50 | 16 | 66 | 3004 | 1040 | 4157 |
| Oats | 61 | 21 | 82 | 1727 | 540 | 2291 |
| Total | 533 | 127 | 660 | 25,048 | 8303 | 33,671 |
| Band | Resolution (m) | Central Wavelength (nm) | Description |
|---|---|---|---|
| B2 | 10 | 490 | Blue |
| B3 | 10 | 560 | Green |
| B4 | 10 | 665 | Red |
| B5 | 20 | 705 | VNIR |
| B6 | 20 | 740 | VNIR |
| B7 | 20 | 783 | VNIR |
| B8 | 10 | 842 | VNIR |
| B8A | 20 | 865 | VNIR |
| B11 | 20 | 1619 | SWIR |
| B12 | 20 | 2190 | SWIR |
| Observation Date | Tiles | Cloud Cover % |
|---|---|---|
| 2020-12-22 | 30STC - 30STD | 0 |
| 2020-12-27 | 30STC - 30STD | 1 |
| 2021-01-03 | 30STC - 30STD | 1 |
| 2021-01-18 | 30STC - 30STD | 1 |
| 2021-01-26 | 30STC - 30STD | 0 |
| 2021-02-15 | 30STC - 30STD | 0 |
| 2021-03-14 | 30STC - 30STD | 2 |
| 2021-03-22 | 30STC - 30STD | 0 |
| 2021-03-24 | 30STC - 30STD | 0 |
| 2021-04-13 | 30STC - 30STD | 4 |
| 2021-04-18 | 30STC - 30STD | 1 |
| 2021-05-06 | 30STC - 30STD | 3 |
| 2021-05-18 | 30STC - 30STD | 1 |
| 2021-05-21 | 30STC - 30STD | 0 |
| Barley | Soft Wheat | Durum Wheat | Oats | Other | UA | PA | |
|---|---|---|---|---|---|---|---|
| Barley | 788 | 134 | 10 | 0 | 24 | 0.84 | 0.82 |
| Soft wheat | 155 | 5355 | 4 | 0 | 90 | 0.96 | 0.96 |
| Durum wheat | 0 | 99 | 916 | 0 | 0 | 0.98 | 0.90 |
| Oats | 0 | 0 | 0 | 508 | 10 | 1.00 | 0.97 |
| Other | 0 | 3 | 0 | 0 | 3765 | 0.97 | 1.00 |
| Crop | SVM | RF | ||||
|---|---|---|---|---|---|---|
| UA | PA | F1-Score | UA | PA | F1-Score | |
| Barley | 0.73 | 0.67 | 0.70 | 0.79 | 0.83 | 0.81 |
| Soft wheat | 0.91 | 0.93 | 0.92 | 0.96 | 0.91 | 0.94 |
| Durum wheat | 0.95 | 0.63 | 0.76 | 0.93 | 0.93 | 0.93 |
| Oats | 0.78 | 0.96 | 0.86 | 1.00 | 0.90 | 0.95 |
| Other | 0.96 | 1.00 | 0.98 | 0.93 | 1.00 | 0.96 |
| Total | 0.86 | 0.84 | 0.84 | 0.92 | 0.91 | 0.92 |
| Crop | CNN | LSTM | CerealNet | ||||||
|---|---|---|---|---|---|---|---|---|---|
| UA | PA | F1-Score | UA | PA | F1-Score | UA | PA | F1-Score | |
| Barley | 0.85 | 0.82 | 0.86 | 0.80 | 0.81 | 0.81 | 0.84 | 0.82 | 0.83 |
| Soft wheat | 0.96 | 0.91 | 0.94 | 0.94 | 0.87 | 0.90 | 0.96 | 0.96 | 0.96 |
| Durum wheat | 1.00 | 0.93 | 0.95 | 0.85 | 0.90 | 0.87 | 0.98 | 0.90 | 0.94 |
| Oats | 1.00 | 0.99 | 0.99 | 0.96 | 0.76 | 0.85 | 1.00 | 0.97 | 0.98 |
| Other | 0.89 | 1.00 | 0.91 | 0.89 | 1.00 | 0.94 | 0.97 | 1.00 | 0.98 |
| Total | 0.94 | 0.92 | 0.93 | 0.89 | 0.87 | 0.87 | 0.95 | 0.93 | 0.94 |
Publisher’s Note: MDPI stays neutral with regard to jurisdictional claims in published maps and institutional affiliations. |
© 2022 by the authors. Licensee MDPI, Basel, Switzerland. This article is an open access article distributed under the terms and conditions of the Creative Commons Attribution (CC BY) license (https://creativecommons.org/licenses/by/4.0/).
Share and Cite
Alami Machichi, M.; El Mansouri, L.; Imani, Y.; Bourja, O.; Hadria, R.; Lahlou, O.; Benmansour, S.; Zennayi, Y.; Bourzeix, F. CerealNet: A Hybrid Deep Learning Architecture for Cereal Crop Mapping Using Sentinel-2 Time-Series. Informatics 2022, 9, 96. https://doi.org/10.3390/informatics9040096
Alami Machichi M, El Mansouri L, Imani Y, Bourja O, Hadria R, Lahlou O, Benmansour S, Zennayi Y, Bourzeix F. CerealNet: A Hybrid Deep Learning Architecture for Cereal Crop Mapping Using Sentinel-2 Time-Series. Informatics. 2022; 9(4):96. https://doi.org/10.3390/informatics9040096
Chicago/Turabian StyleAlami Machichi, Mouad, Loubna El Mansouri, Yasmina Imani, Omar Bourja, Rachid Hadria, Ouiam Lahlou, Samir Benmansour, Yahya Zennayi, and François Bourzeix. 2022. "CerealNet: A Hybrid Deep Learning Architecture for Cereal Crop Mapping Using Sentinel-2 Time-Series" Informatics 9, no. 4: 96. https://doi.org/10.3390/informatics9040096
APA StyleAlami Machichi, M., El Mansouri, L., Imani, Y., Bourja, O., Hadria, R., Lahlou, O., Benmansour, S., Zennayi, Y., & Bourzeix, F. (2022). CerealNet: A Hybrid Deep Learning Architecture for Cereal Crop Mapping Using Sentinel-2 Time-Series. Informatics, 9(4), 96. https://doi.org/10.3390/informatics9040096