Article

CerealNet: A Hybrid Deep Learning Architecture for Cereal Crop Mapping Using Sentinel-2 Time-Series

1
Geomatics and Topography Department, Agronomic and Veterinary Institute Hassan 2, Rabat 10112, Morocco
2
Agronomy Department, Agronomic and Veterinary Institute Hassan 2, Rabat 10112, Morocco
3
Embedded System and AI Department, Moroccan Foundation for Advanced Science Innovation and Research (MAScIR), Rabat 10112, Morocco
4
Research Department, National Institute of Agriculture Research, Oujda 60033, Morocco
5
Les Domaines Agricoles, Casablanca 21000, Morocco
*
Author to whom correspondence should be addressed.
Informatics 2022, 9(4), 96; https://doi.org/10.3390/informatics9040096
Submission received: 2 October 2022 / Revised: 7 November 2022 / Accepted: 11 November 2022 / Published: 30 November 2022
(This article belongs to the Special Issue Applications of Machine Learning and Deep Learning in Agriculture)

Abstract

:
Remote sensing-based crop mapping has continued to grow in economic importance over the last two decades. Given the ever-increasing rate of population growth and the implications of multiplying global food production, the necessity for timely, accurate, and reliable agricultural data is of the utmost importance. When it comes to ensuring high accuracy in crop maps, spectral similarities between crops represent serious limiting factors. Crops that display similar spectral responses are notorious for being nearly impossible to discriminate using classical multi-spectral imagery analysis. Chief among these crops are soft wheat, durum wheat, oats, and barley. In this paper, we propose a unique multi-input deep learning approach for cereal crop mapping, called “CerealNet”. Two time-series used as input, from the Sentinel-2 bands and NDVI (Normalized Difference Vegetation Index), were fed into separate branches of the LSTM-Conv1D (Long Short-Term Memory Convolutional Neural Networks) model to extract the temporal and spectral features necessary for the pixel-based crop mapping. The approach was evaluated using ground-truth data collected in the Gharb region (northwest of Morocco). We noted a categorical accuracy and an F1-score of 95% and 94%, respectively, with minimal confusion between the four cereal classes. CerealNet proved insensitive to sample size, as the least-represented crop, oats, had the highest F1-score. This model was compared with several state-of-the-art crop mapping classifiers and was found to outperform them. The modularity of CerealNet could possibly allow for injecting additional data such as Synthetic Aperture Radar (SAR) bands, especially when optical imagery is not available.

1. Introduction

The world population is increasing at an alarming rate. It has almost quadrupled to 6.2 billion during the last century [1], and this number is expected to reach 10 billion by 2050 [2]. To be able to keep up with the ever-increasing global food demand, crop production needs to approximately double by 2050 [3]. To do so, the public and private sectors need timely, efficient, and, most importantly, reliable agricultural data. Such data would help to better monitor food demand, reduce costs, and target agricultural policies [4]. Agricultural data in Morocco can be obtained using one of three methods: (I) direct communication with farmers, (II) photo-interpretation of high-resolution digital imagery, and (III) spatially limited land surveys. The first two methods are liable to produce subjective, biased, and limited information. The third method, however, is the most accurate when it comes to crop mapping. However, it is not without its drawbacks, for it is time-consuming and expensive, which limits its use as a practical periodic crop-monitoring tool [5].
Identifying vegetation canopies in agricultural landscapes using earth observation techniques such as satellite imagery, drone imagery, and smart ground sensors has continued to grow in economic importance [6]. This is mainly because traditional data-collection techniques such as survey missions are now outdated, costly, and inefficient. Traditional Machine Learning (ML) classifiers have proven their effectiveness in crop mapping using multispectral aerial and satellite imagery [7,8,9,10]. Support Vector Machine (SVM) and Random Forest (RF) in particular are frequently used in the literature for crop identification based on multi-temporal satellite imagery [11,12,13]. Although used as a baseline, these models have achieved competitive overall accuracy on multiple occasions. The performance of these classifiers is especially high when the classes belong to different crop types whose spectral signatures are very different (cereals, pulses, vegetables, …etc.) [14]. ML models have been known to struggle when presented with crops that belong to the same family; this issue presents itself time and time again in the literature [15,16,17,18,19,20,21,22,23,24]. For this reason, it is common to merge crops that have similar spectral responses such as small-grain cereal crops (soft wheat and durum wheat) in a single class (wheat) so as to minimize class confusion [25]. This solution does not allow for estimating the real area and production of each crop. Deep Learning (DL) approaches have been recommended as a potential route to distinguish between crops with similar biological characteristics [26]. Unlike traditional ML classifiers, where each input feature is an independent variable, the Long Short-Term Memory unit (LSTM) processes time-series as sequences where the order of the time-series has a significant effect on the results. This quality could help in mining small differences that might exist in the phenological cycle of problematic crops. While DL has been used extensively for crop mapping [12,13,27,28,29,30,31], we could not find a study dealing with crops from the same family.
Ground-based hyperspectral data has the capability of extracting discriminant features based on fine variations in the full-wave spectral profile [32]. These differences are thought to be indiscernible with multispectral aerial or satellite imagery [25]. Small-grain cereal crops (soft wheat, durum wheat, oat, and barley) are notorious for being difficult to classify accurately. This issue stems from the fact that these crops have a near identical spectral profile throughout their entire phenological cycle. Cereal crops are considered to be the most prolific food source on the planet [33]. They are grown on more land than any other food crop [34], amounting to 86% of the total area sown in Morocco in 2021. It is therefore imperative that they are accurately mapped. Our overall goal in this paper is to contribute to food security and balance in food imports and exports, as well as the currency regulations that comes with it. This is why decision-makers and managers of the agricultural sector need fast and precise satellite-based solutions.
In this study, we propose a unique deep learning-based approach for mapping four cereal crops: soft wheat, durum wheat, oats, and barley. The proposed model architecture, dubbed “CerealNet”, uses unidimensional convolutional neutral networks (Conv1D) to extract spectral features from Sentinel-2 satellite imagery, and employs Long a Short-Term Memory unit (LSTM) to derive phenological features from the Normalized Difference Vegetation Index (NDVI). The NDVI itself is calculated from the Sentinel-2 time-series. The rest of this document is structured as follows: In Section 2, we present the study area and the data used in the study. Section 3 details the methodology and the motivation behind the adopted approach. In Section 4, the results of the crop mapping are showcased and comparisons with state-of-the-art models are made, evaluated and discussed. Finally, in Section 5, we conclude by listing the main findings of the study, as well as some recommendations going forward.

2. Study Area and Data

2.1. Study Area

The study area is located in the Gharb plain, northwest of Morocco. It covers an area of more than 50,000 ha centered around the city of Sidi Slimane (Figure 1). It is characterized by a hot Mediterranean climate with a dry summer, an average temperature of 19 °C, and an annual precipitation of 451 mm. These climatic conditions are sufficient to maintaining traditional agriculture. Intensive agriculture has been promoted in the Gharb plain, owing to good alluvium soils and an efficient irrigation system [7]. The plain has approximately 114,000 ha of land that is equipped and suitable for large-scale hydraulic development.

2.2. Data

2.2.1. Ground Truth

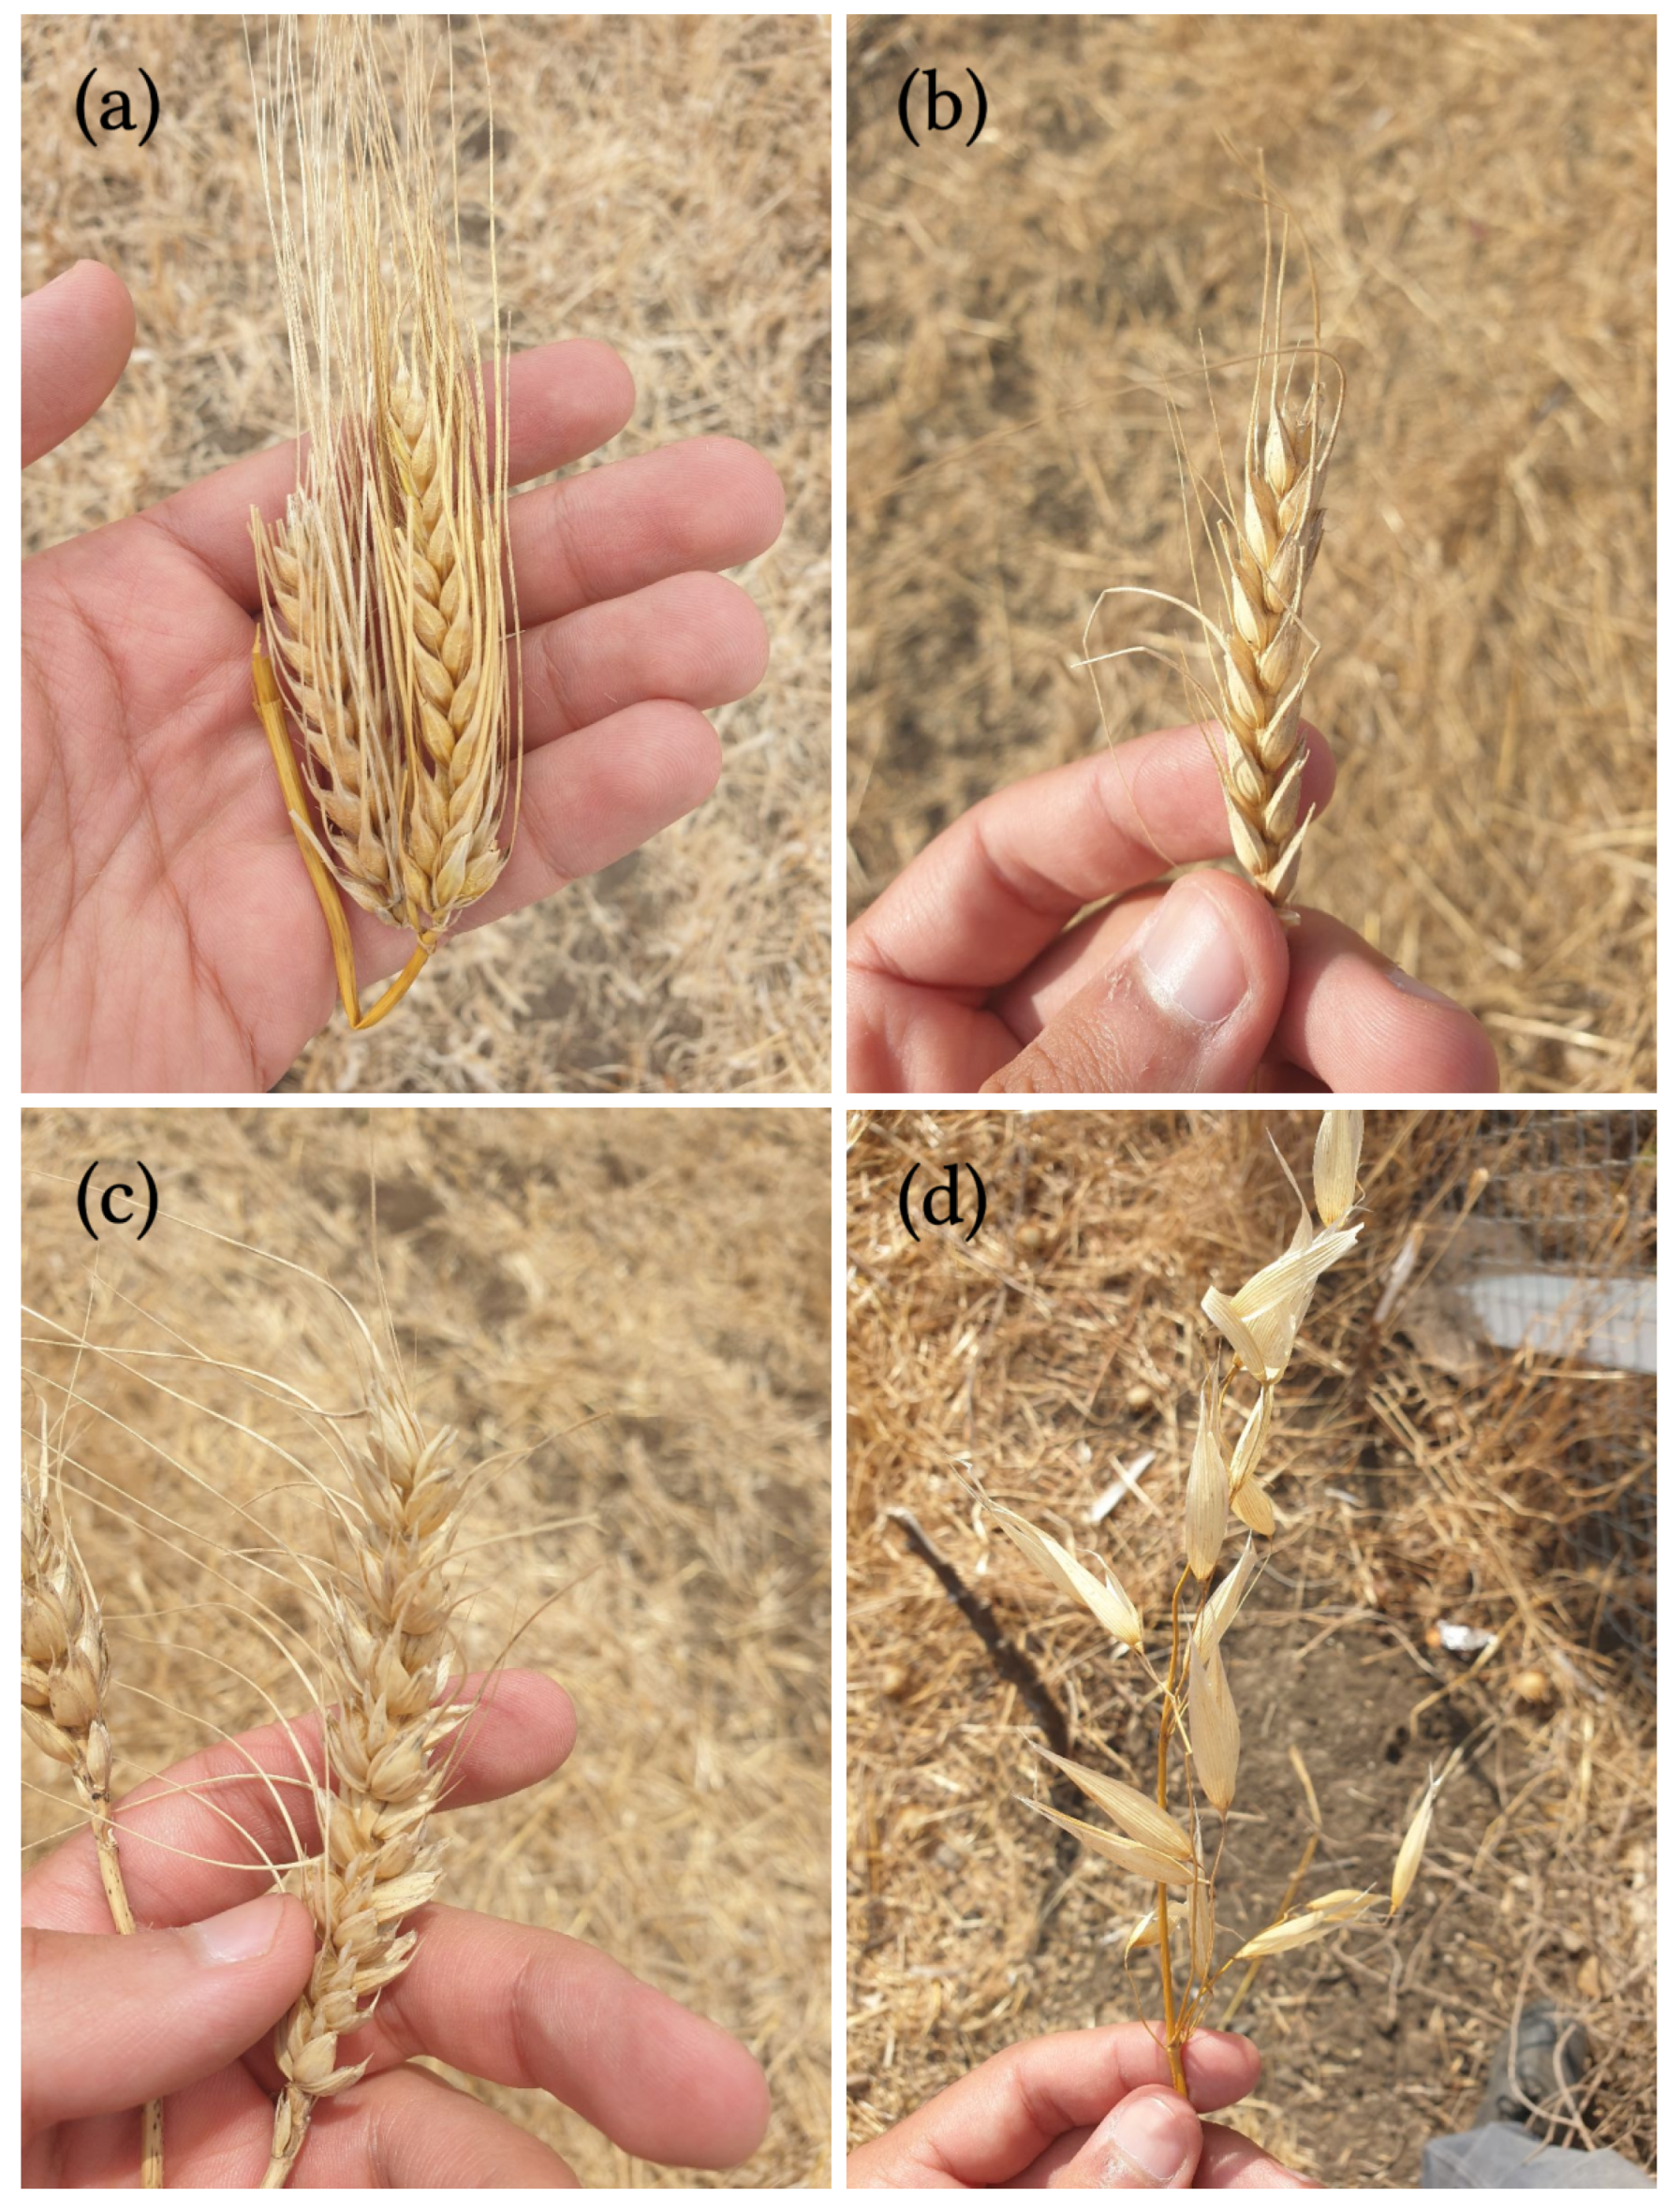
Ground truth data were collected through a field survey on June 2021 in the study area. During this period, most of cereal plots were at the maturity stage. Small-grain cereal crops—apart from oats—are notorious for being difficult to classify due to their biological similarities (Figure 2). Soft wheat, durum wheat, and barley all have spikelets (elementary inflorescence characteristic of grasses) that are grouped into spikes. These crops were identified by an agricultural expert on site. Then, the limits of the plots were recorded digitally using SW-Maps in the shapefile format [35]. Along with the geographical coordinates, other information such as crop type, previous campaign’s crop, and irrigation system were collected.
In the study area, cereals are generally rain-fed crops, and are sown between mid-November and early December. The harvest occurs between late May and mid-June. Concerning the details of the collected data, we recorded 660 cereal plots: 426 of which were of soft wheat, 86 barley, 82 oats, and 66 durum wheat parcels. For each field, Sentinel-2 ground pixel values were sampled. The fields were then randomly split into a training set and a testing set. This split was performed to ensure that training and testing pixels are not taken from the same field. Table 1 shows the number of samples generated for each cereal crop type.

2.2.2. Remote Sensing Data

In this study, we needed an imagery dataset with a high revisit frequency, as well as high spatial and spectral resolutions. On top of being a public dataset, level 2-A bottom-of-atmosphere Sentinel-2 satellite imagery has a high revisit frequency, with the constellation of Sentinel-2A and 2B [36]. More importantly, this dataset offers both a high spectral and spatial resolution. The bands used in this study are listed in Table 2.
A number of 14 cloud-free images were selected throughout the phenological cycle of the four cereal crops. Table 3 provides an overview of the different images used. The length of the time series was limited by the cloud presence in the study area, as only imagery with less than 5% cloud cover was used. The study area is covered by two Sentinel-2 tiles—30STC and 30STD; the tiles were therefore merged and co-registered to correct for pixel shift. Since the spectral bands have different resolutions, we re-sampled the Visible and Near Infra-Red bands (VNIR), as well as the Short Wave Infra-Red bands (SWIR) to 10 m . The re-sampling was performed by splitting each 20 m pixel into four 10 m pixels and keeping the original pixel value. After this operation, the study area was extracted.

3. Methodology

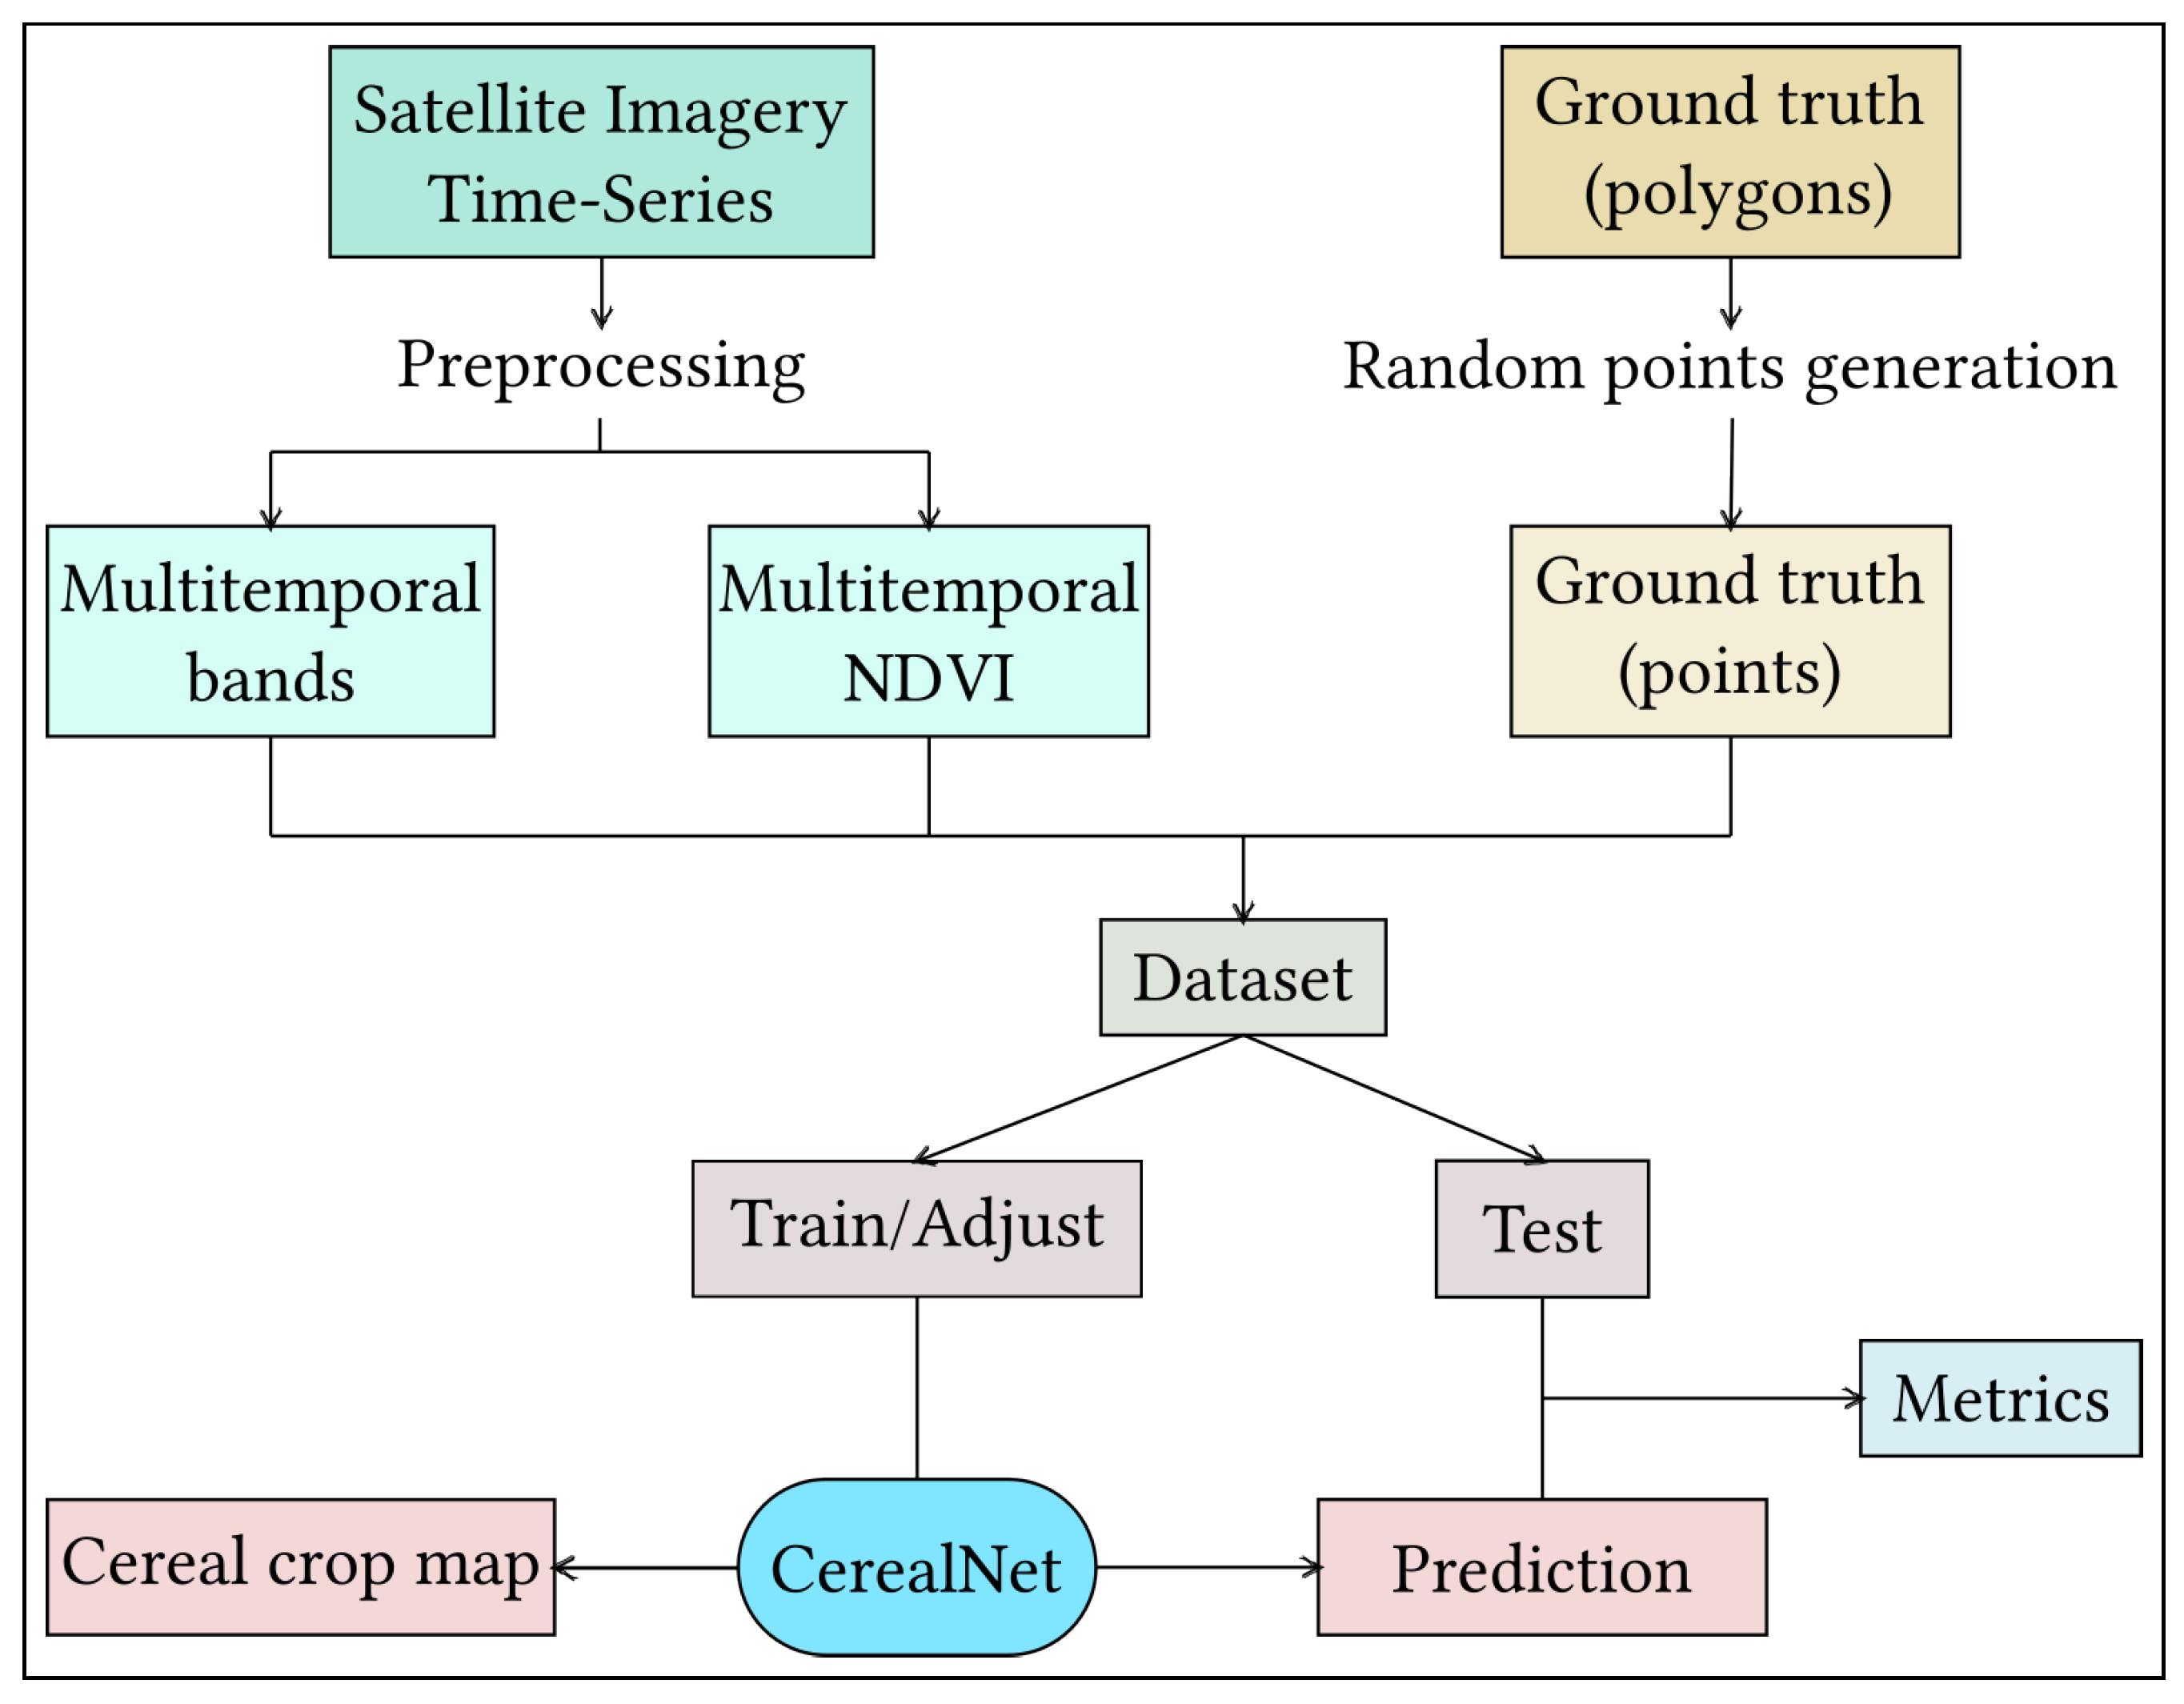
In this study, we aimed to develop an efficient and accurate approach for cereal crop mapping (Figure 3). The proposed methodology uses a pixel-based image analysis (PBIA) approach for multi-spectral satellite imagery time-series. First, a field survey was performed to collect ground truth data. Then, Sentinel-2 satellite imagery was downloaded and preprocessed. Feature engineering was conducted to select eliminate unnecessary bands and to generate the vegetation index. Pixel values from multispectral satellite imagery and the vegetation index were then combined with the ground truth data in order to build the dataset. This dataset was then used to train the CerealNet model. Additionally, four different crop mapping classifiers were compared to the proposed method to evaluate its performance.

3.1. Traditional Machine Learning

3.1.1. Support Vector Machine

An SVM is a robust supervised non-parametric classification method that is capable of handling noisy and complex data [37,38,39]. Based on the statistical learning theorem, the SVM first transforms the inputs into a higher-dimensional space using a specified kernel, and then searches for a linear decision boundary in this space [37,38]. Taking as input a set of points belonging to two classes, a linear SVM finds a hyper-plane that leaves the maximum possible number of points of the same class on the same side while maximizing the distance between the hyper-plane and the two classes. According to [39], this hyper-plane minimizes the risk of having misclassified points.
The SVM model used in this paper was trained using the Scikit-learn library [40] in Python [41]. The optimal hyperparameters of the SVM model were identified using the GridSearch function in Scikit. The best weights were generated using the polynomial kernel. The optimal value of C, which defines the regularization of the error, was 1, whereas gamma, a hyperparameter that indicates how loosely the model will fit the training, was scaled based on the input features (Equation (1)).
γ = 1 n × v
where γ represents the value of gamma, n is the number of features, and v is the variance.

3.1.2. Random Forest

The random forest classifier is an extension of the standard Decision Tree (DT) algorithm [42]. RF is robust and resistant to overfitting. The majority vote of all decision trees in an RF is used to assign a target class of each input. Its capability of handling huge amounts of data, along with its few user-defined inputs and fast execution time [43], make RF one of the most popular classifiers for crop mapping.
Similar to the SVM, the RF classifier used in this study was trained using Sickit-learn, and the hyperparameters were identified using GridSearch. The optimal number of trees was found to be 200, with a maximum depth of 8. The criterion for the quality of the split was entropy, and the maximum number of features to consider when looking for the best split was set to sqrt, the square root of the number of features.

3.2. Deep Learning

3.2.1. LSTM

Traditional Recurrent Neural Networks (RNNs) are a type of network where feedback connections are used to store representations of recent input events in the form of activation [44]. This feature makes RNN appropriate for solving tasks that rely on processing sequential data. However, because of the vanishing gradient problem, RNNs are unable to learn in the presence of time lags greater than 5–10 discrete time-steps between relevant input events and target signals [45]. This issue has led to the development of LSTM, which can prevent older signals from vanishing during processing. Even though LSTM has been developed since the late 1990s, it has only recently (2016) begun attracting attention in the fields of agriculture and remote sensing [46,47,48,49].
The hyperparameters for the LSTM classifier were identified empirically. We found that the model performs best with only one LSTM layer containing eight units. The activation function of choice was tanh, and the best optimizer was found to be the Stochastic Gradient Descent (SGD). Additionally, a dropout of 0.5 was used to reduce overfitting.

3.2.2. CNN

Convolutional Neural Networks (CNNs) are a type of neural network designed to process data that come in the form of multiple arrays [50]. In the case of multispectral satellite imagery, each pixel can be represented by a 1D array. In a time-series, the shape of the array becomes (s, t, b), where “s” is the number of samples, “t” refers to the number of dates in the time-series, and “b” indicates the number of multispectral bands used.
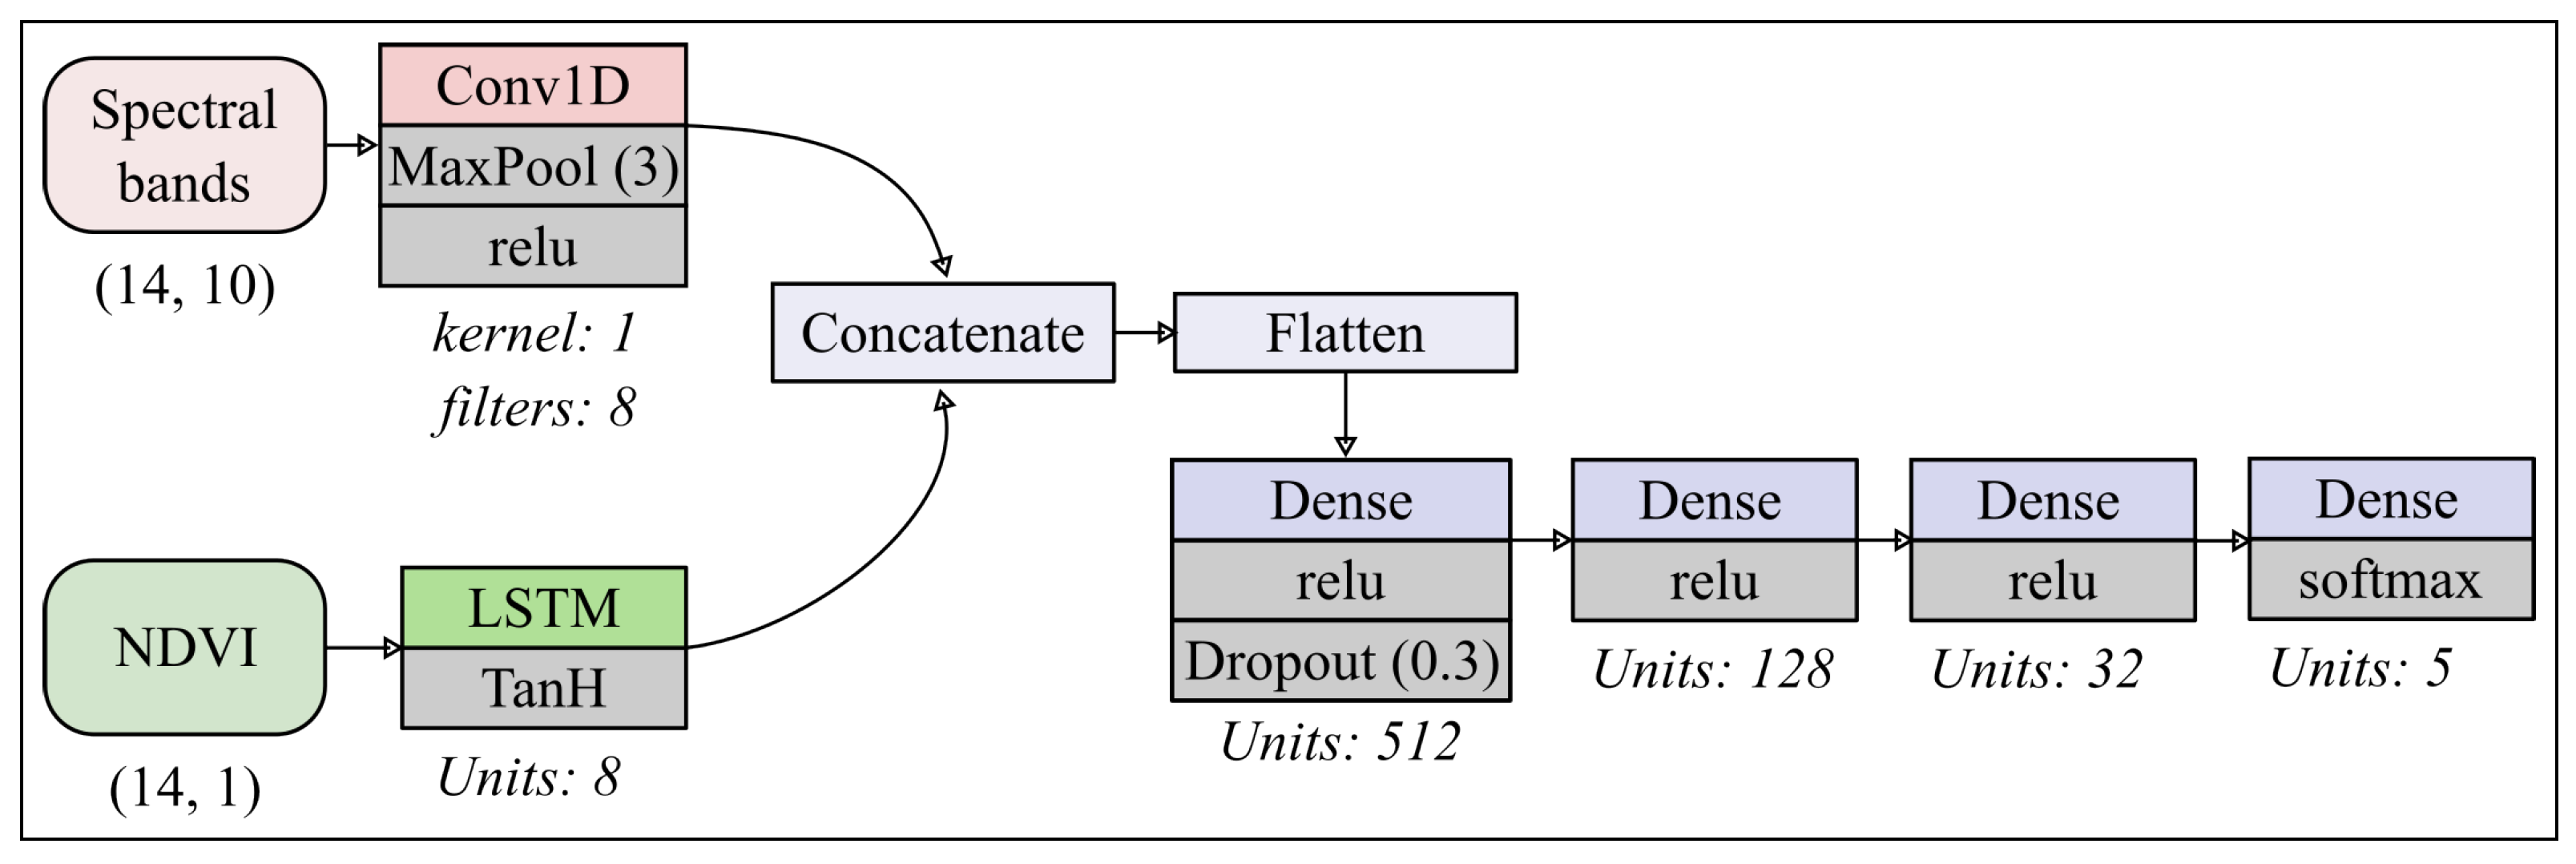
What makes CNNs powerful is their ability to recognize patterns that they learn regardless of their location. Because the patterns they learn are translation invariant, they need less training samples than regular dense layers to make generalizations [51]. The input to the CNN was 14 sets of 10 (14, 10). 14 dates, and 10 Sentinel-2 bands. Much like LSTM, the hyperparameters of the CNN were identified empirically. The best weights were generated using one unidimensional CNN layer with 16 filters, a kernel size of 1, and rectified linear unit (relu) activation function. A dropout of 0.5 was used to correct for overfitting. Prior to the output layer, a fully connected layer of eight units was used. The best activation function for this layer was also relu, and SGD was the best choice for the optimizer.

3.2.3. CerealNet

For the purposes of this study, we developed a unique deep neural network model, specifically designed to accurately identify and discriminate between four cereal crop types, hence the name CerealNet. This is a hybrid architecture with two branches and two separate inputs. The flowchart gives an overview of the architecture used (Figure 4). The LSTM branch is made of two layers with the same number of units (eight). The transfer function for each layer is tanh. This branch takes the Normalized Difference Vegetation Index (NDVI) as input (Equation (2)). This input is a handcrafted time-series feature derived from Sentinel-2 bands. In this model, the NDVI time series of size 14 (14 dates) is used to simulate the phenological cycle of the four cereal crops. The second branch is made from one unidimensional CNN layer with the goal of extracting spectral features from the Sentinel-2 reflectance time series. The optimal kernel size was found to be 1 and the number of filters used was set to 8, matching the size from the last LSTM layer. Additionally, a unidimensional MaxPooling layer of size 3 was used. The temporal and spectral features extracted were then flattened and passed through three fully connected (dense) layers with decreasing width (512, 128, 32), with the same activation function as the 1D-CNN (relu). After the first dense layer (512 units), a dropout of 0.3 was applied to prevent overfitting. The softmax transfer function was used for the output layer. This dense layer has five nodes, one for each crop type and an additional node for the class “other”. We found that the model performed best with the SGD optimizer. As CerealNet is a multi-class classifier, the loss was calculated using the categorical cross-entropy function. Categorical accuracy, F-measure, and Cohen Kappa were calculated, as they provide useful information on the performance of the model. After the compilation of the model, the network had 144,605 trainable parameters.
N D V I = N I R R E D N I R + R E D
where N I R represents the NIR band (B8) and R E D corresponds to the red band (B4).

4. Results and Discussion

4.1. Spectro-Temporal Analysis

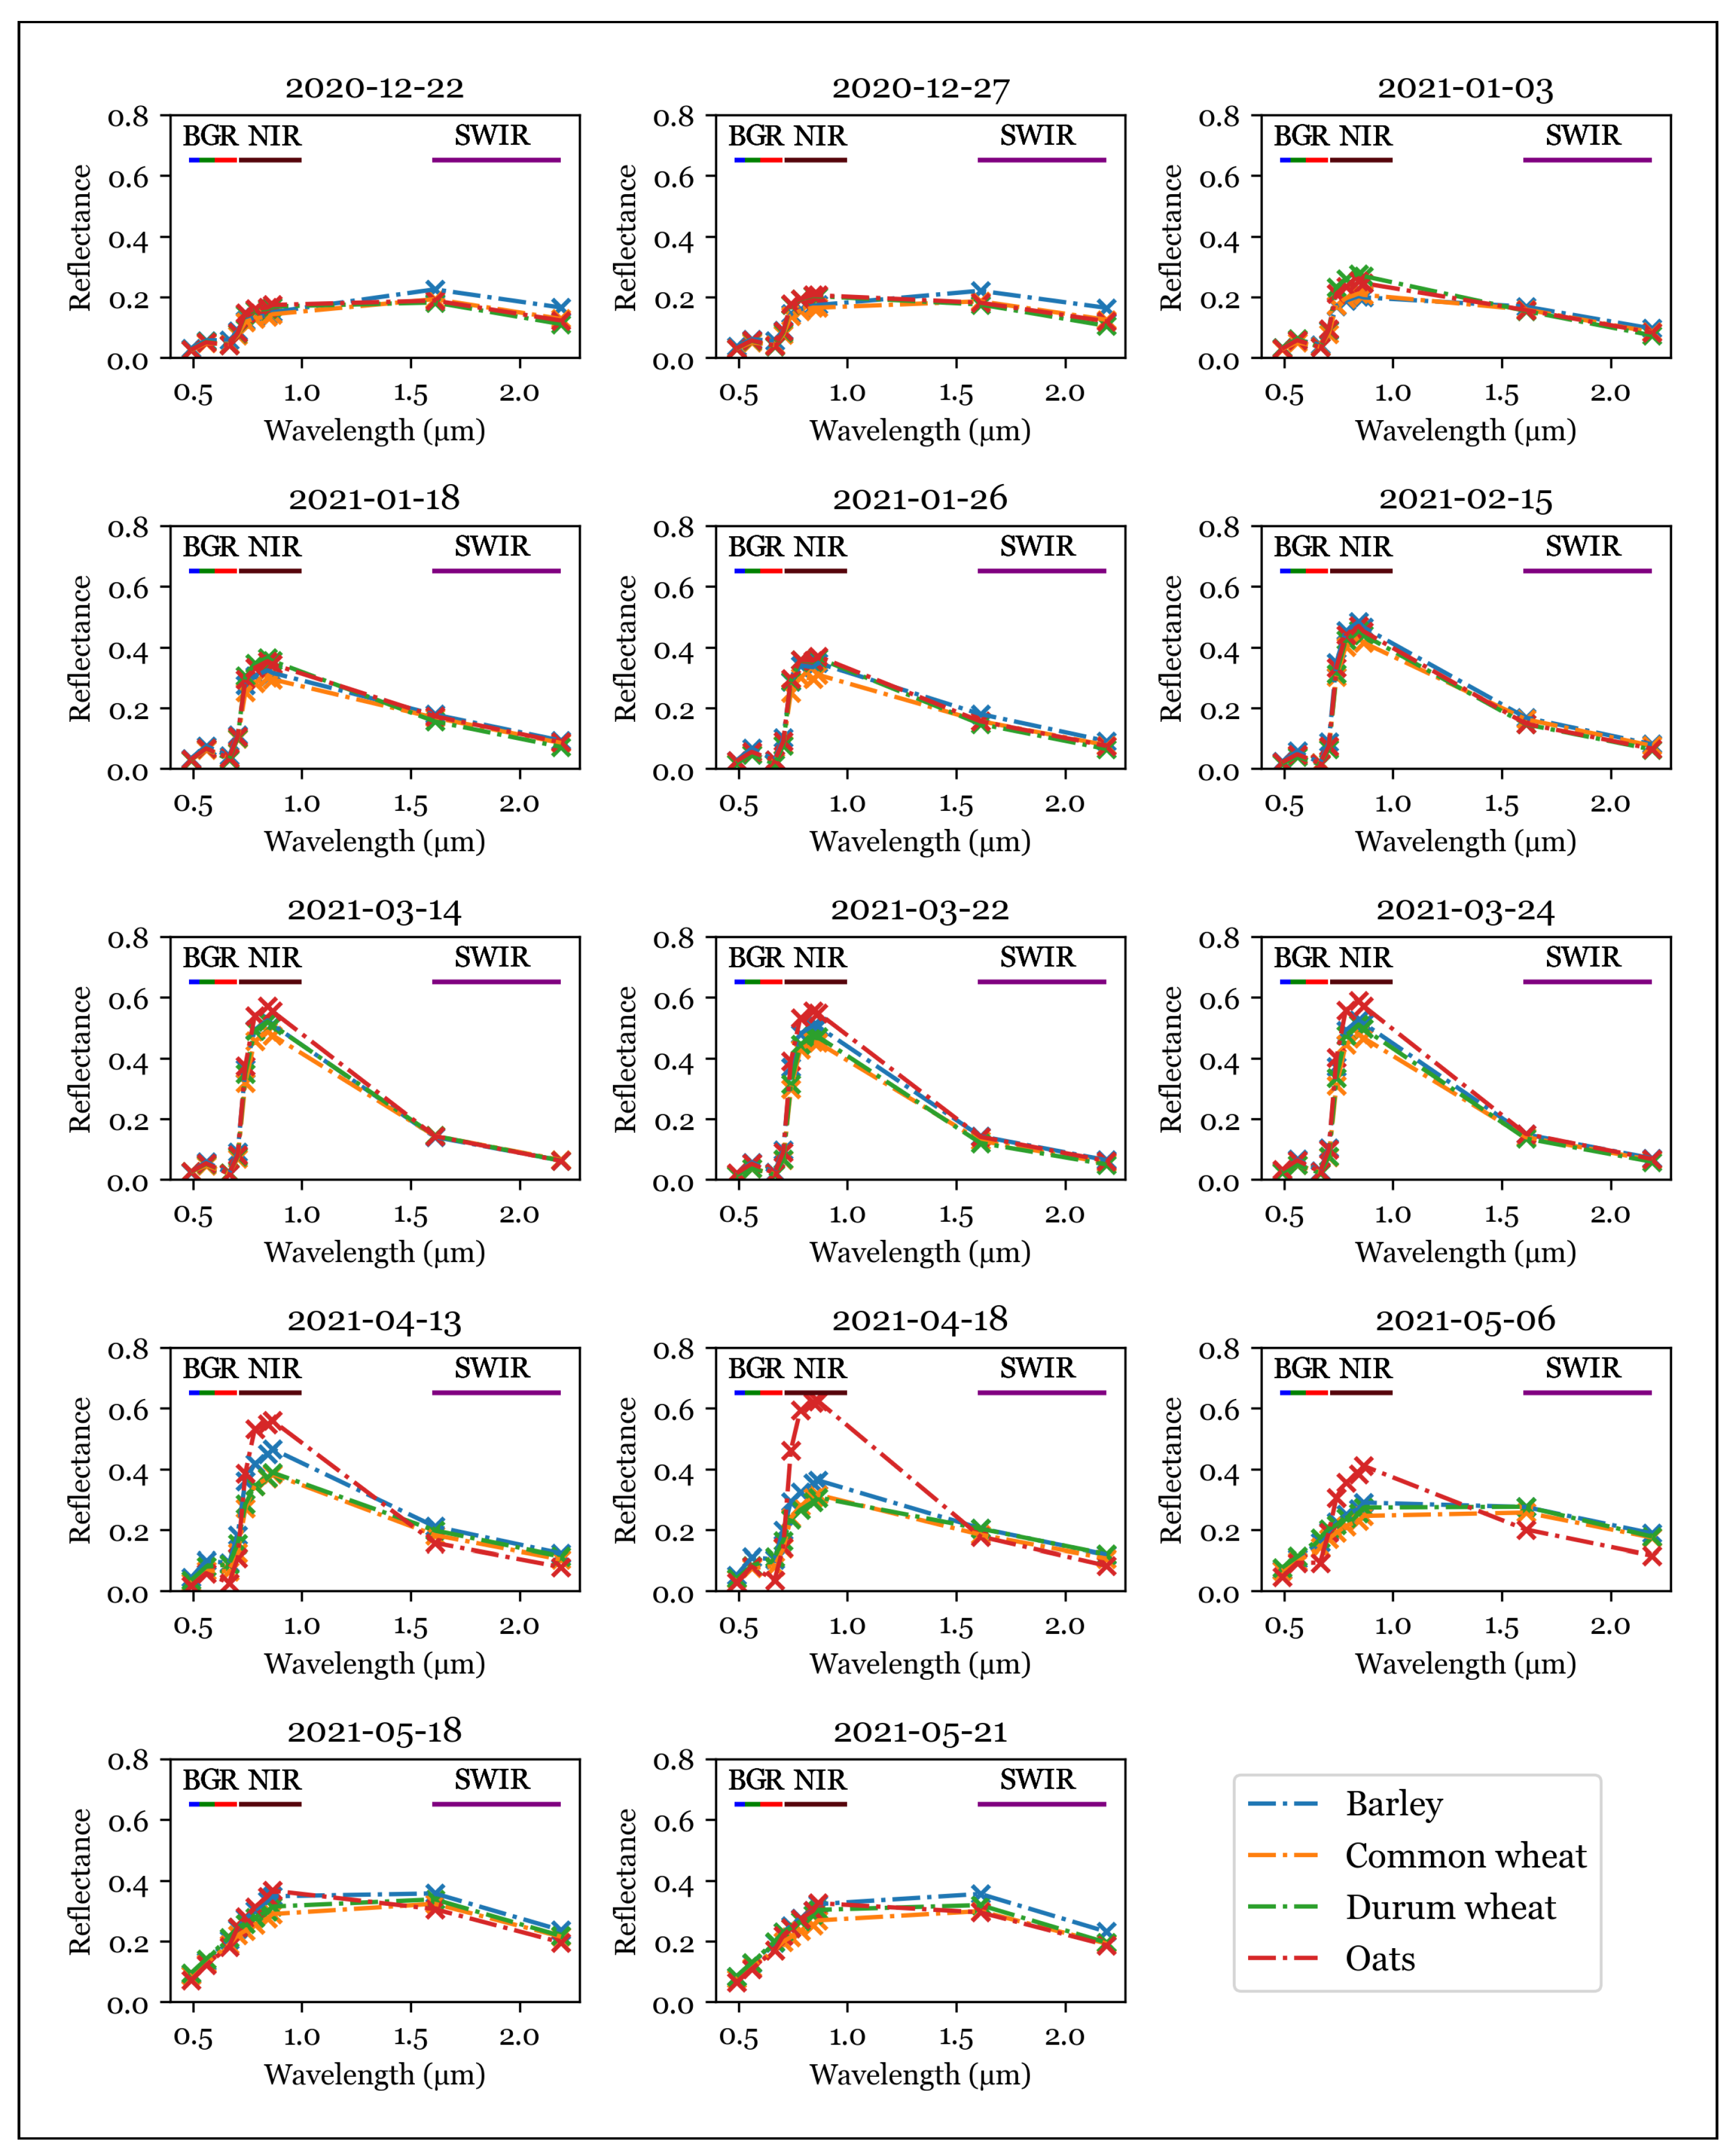
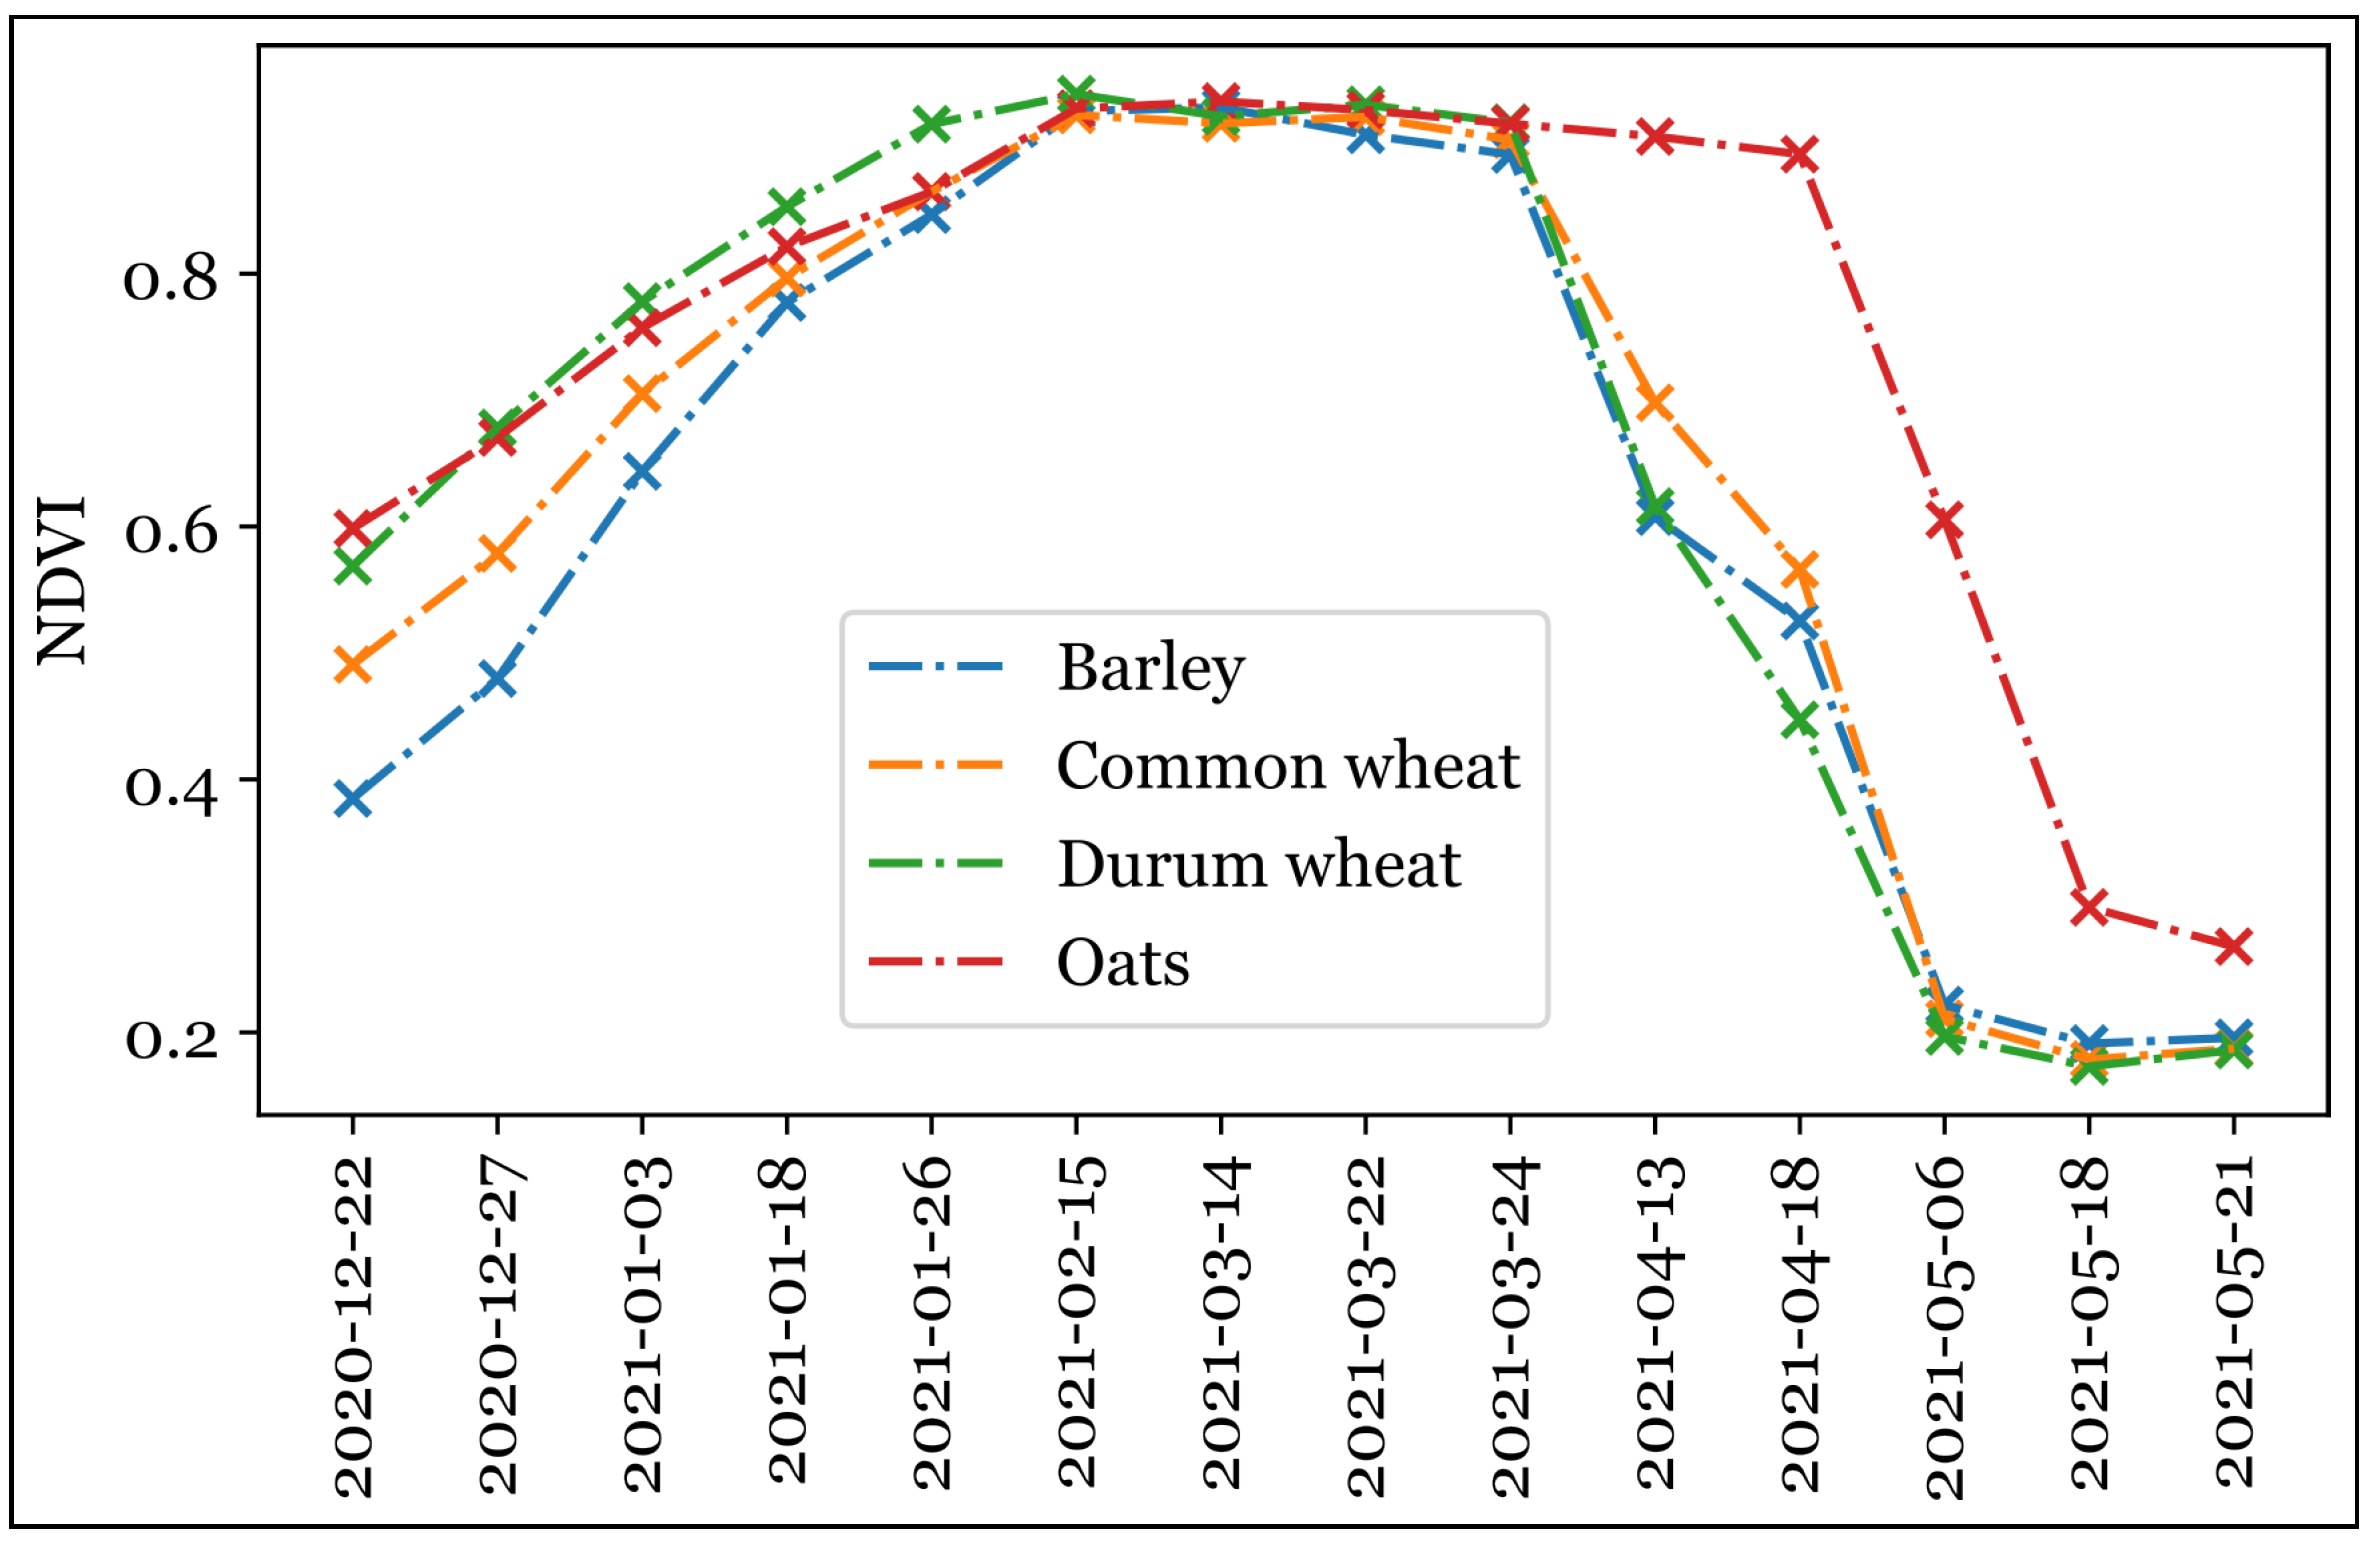
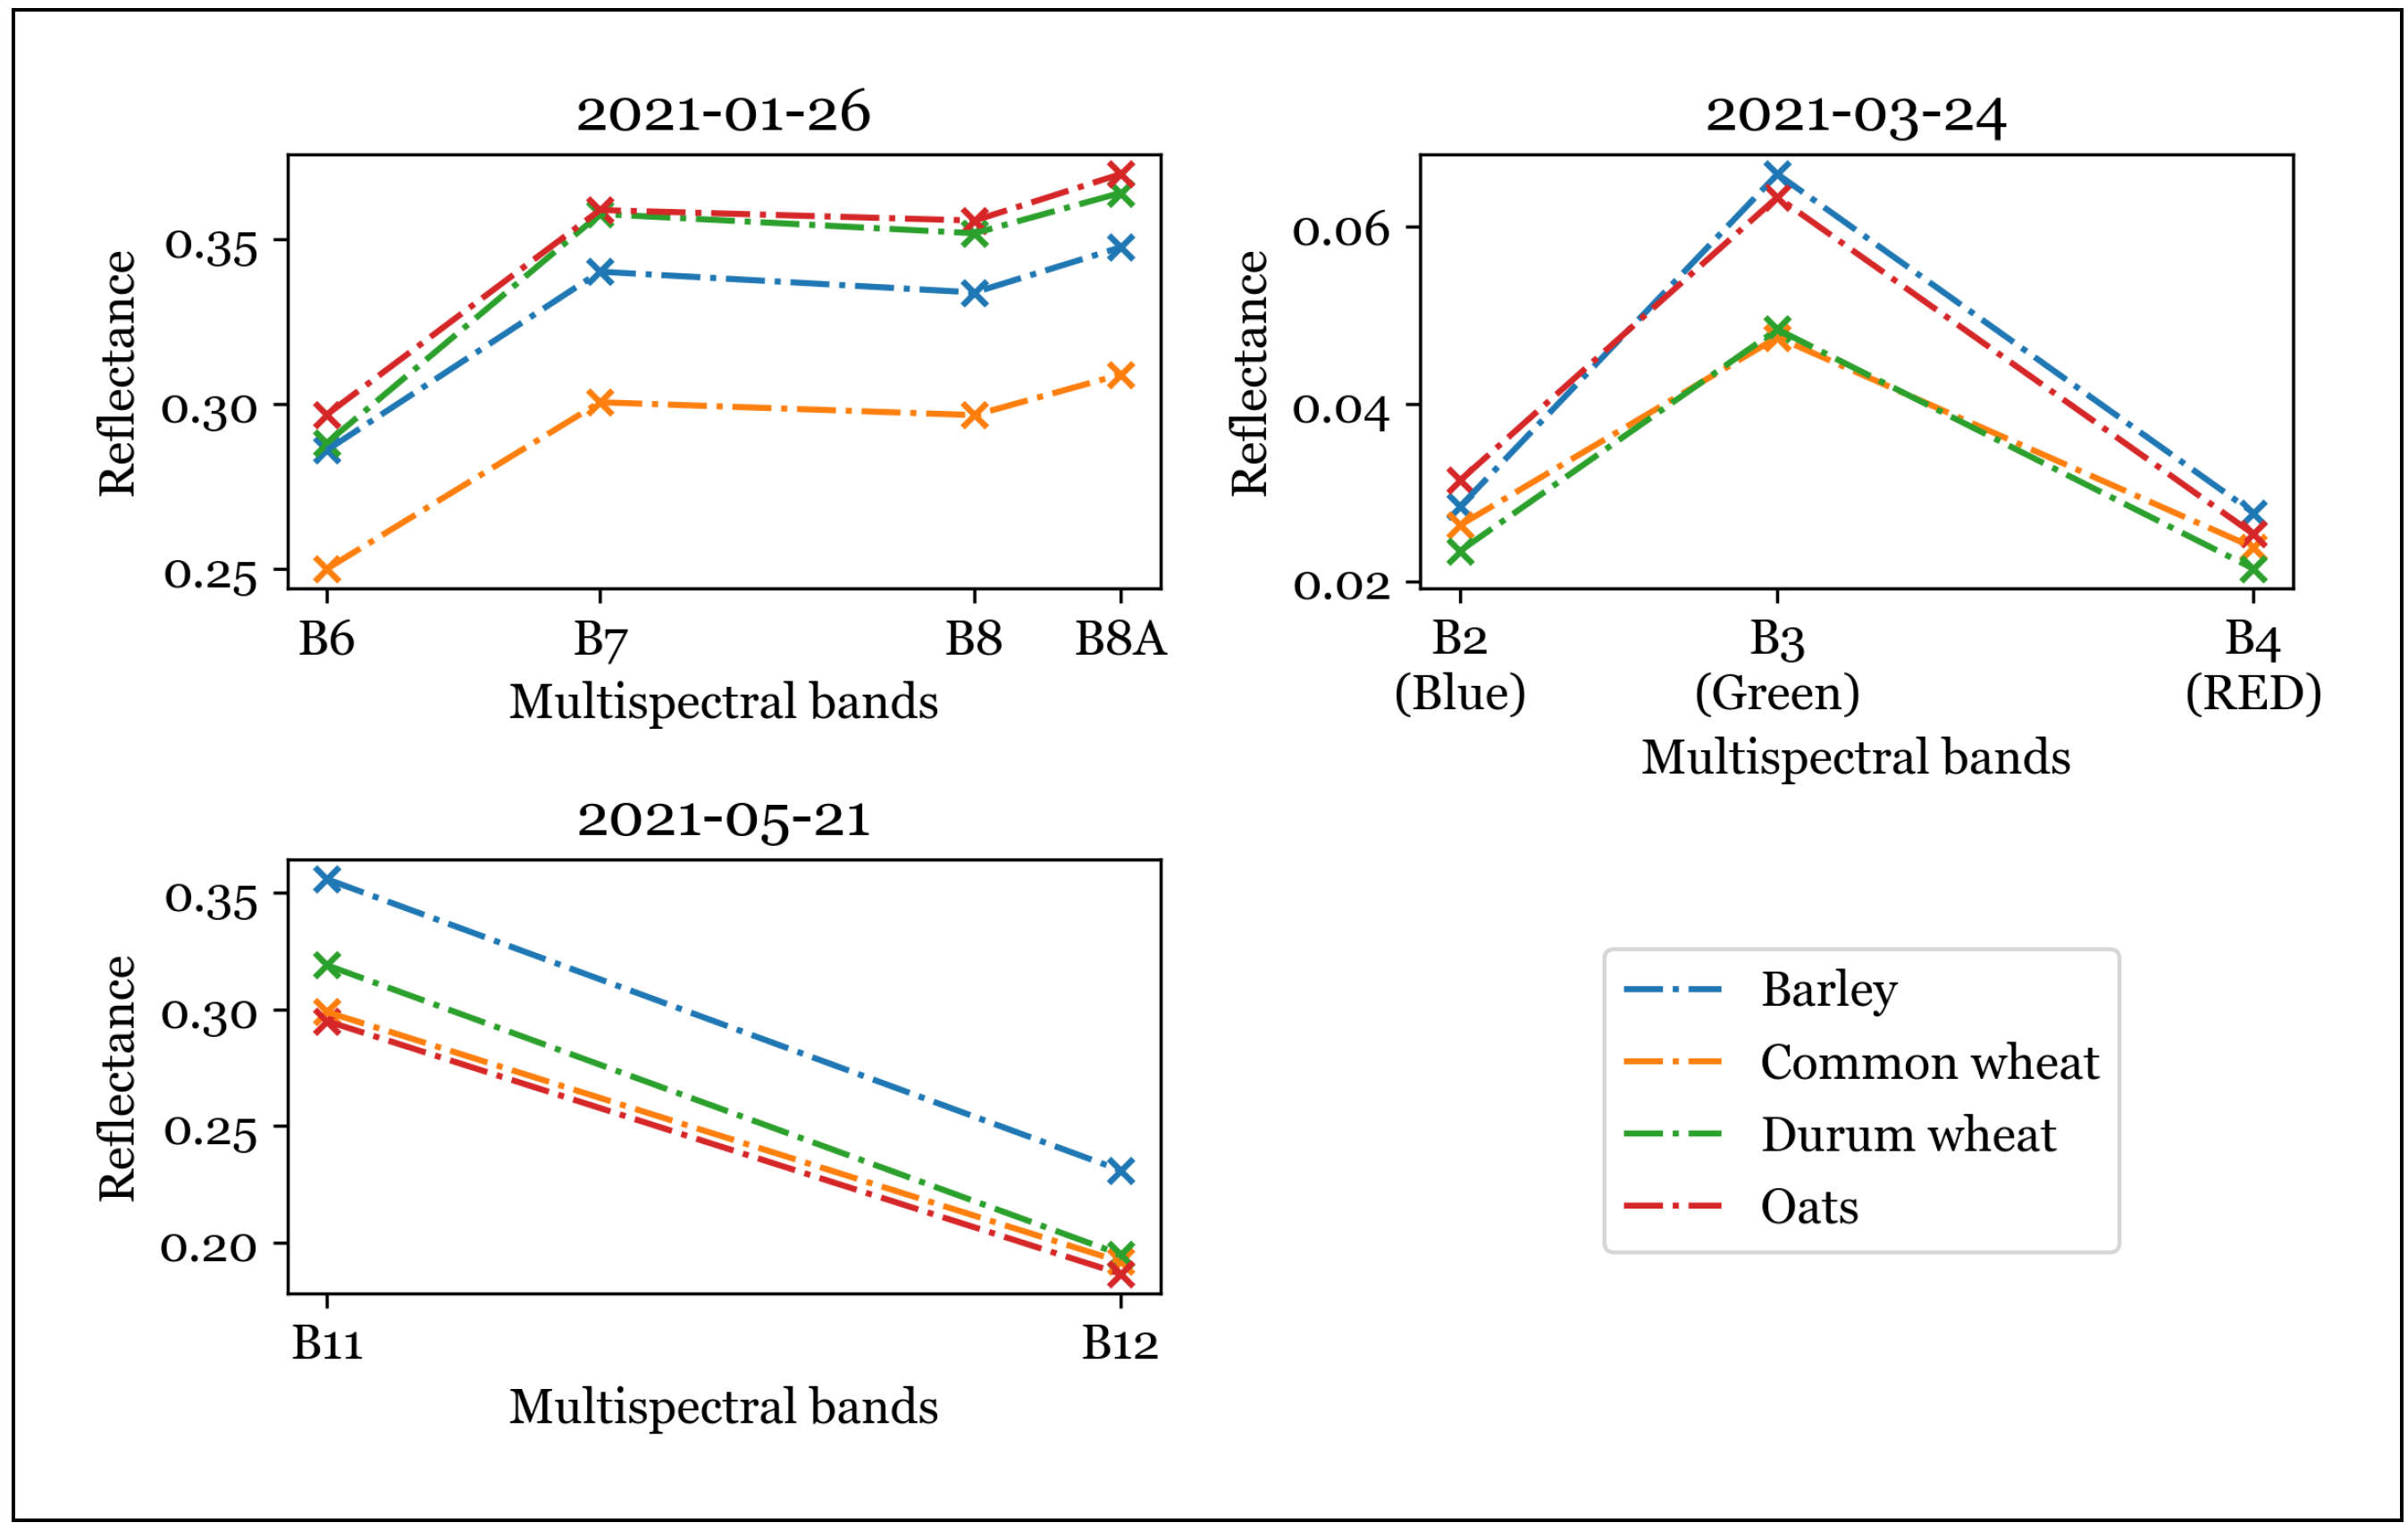
In order to study the evolution of cereal crops throughout their vegetative cycle, the spectral profiles of the four cereal crops were extracted (Figure 5). We discovered that all four crops exhibit the same spectro-temporal patterns throughout the season, with the profiles distinctly tracing the different growing stages. The amplitude difference between the reflectance in the green and NIR bands is minimal during the tillering stage; after that, it rises gradually, reaching its maximum value in mid-March. After this date, the reflectance values in the NIR bands drop in a uniform way as the crops reach the maturity stage. Owing to a difference in its physiology, oats have a higher reflectance in NIR throughout April, effectively giving this crop a distinct characteristic that allows for its identification. This feature is further reflected in Figure 6, where the NDVI of oats stays saturated for much longer than that of the other three crops, only dropping by May. For soft wheat, durum wheat, and barley, the difference in reflectance was not as prominent. We found that both wheat classes had a lower reflectance in the green band in 22–24 March 2022 (Figure 7). Additionally, soft wheat tends to have a lower reflectance in comparison with durum wheat across the NIR bands at the start of the season. As for barley, it had a higher reflectance value in the Short Wave Infrared (SWIR) bands at the end of the agricultural season.

4.2. CerealNet Results

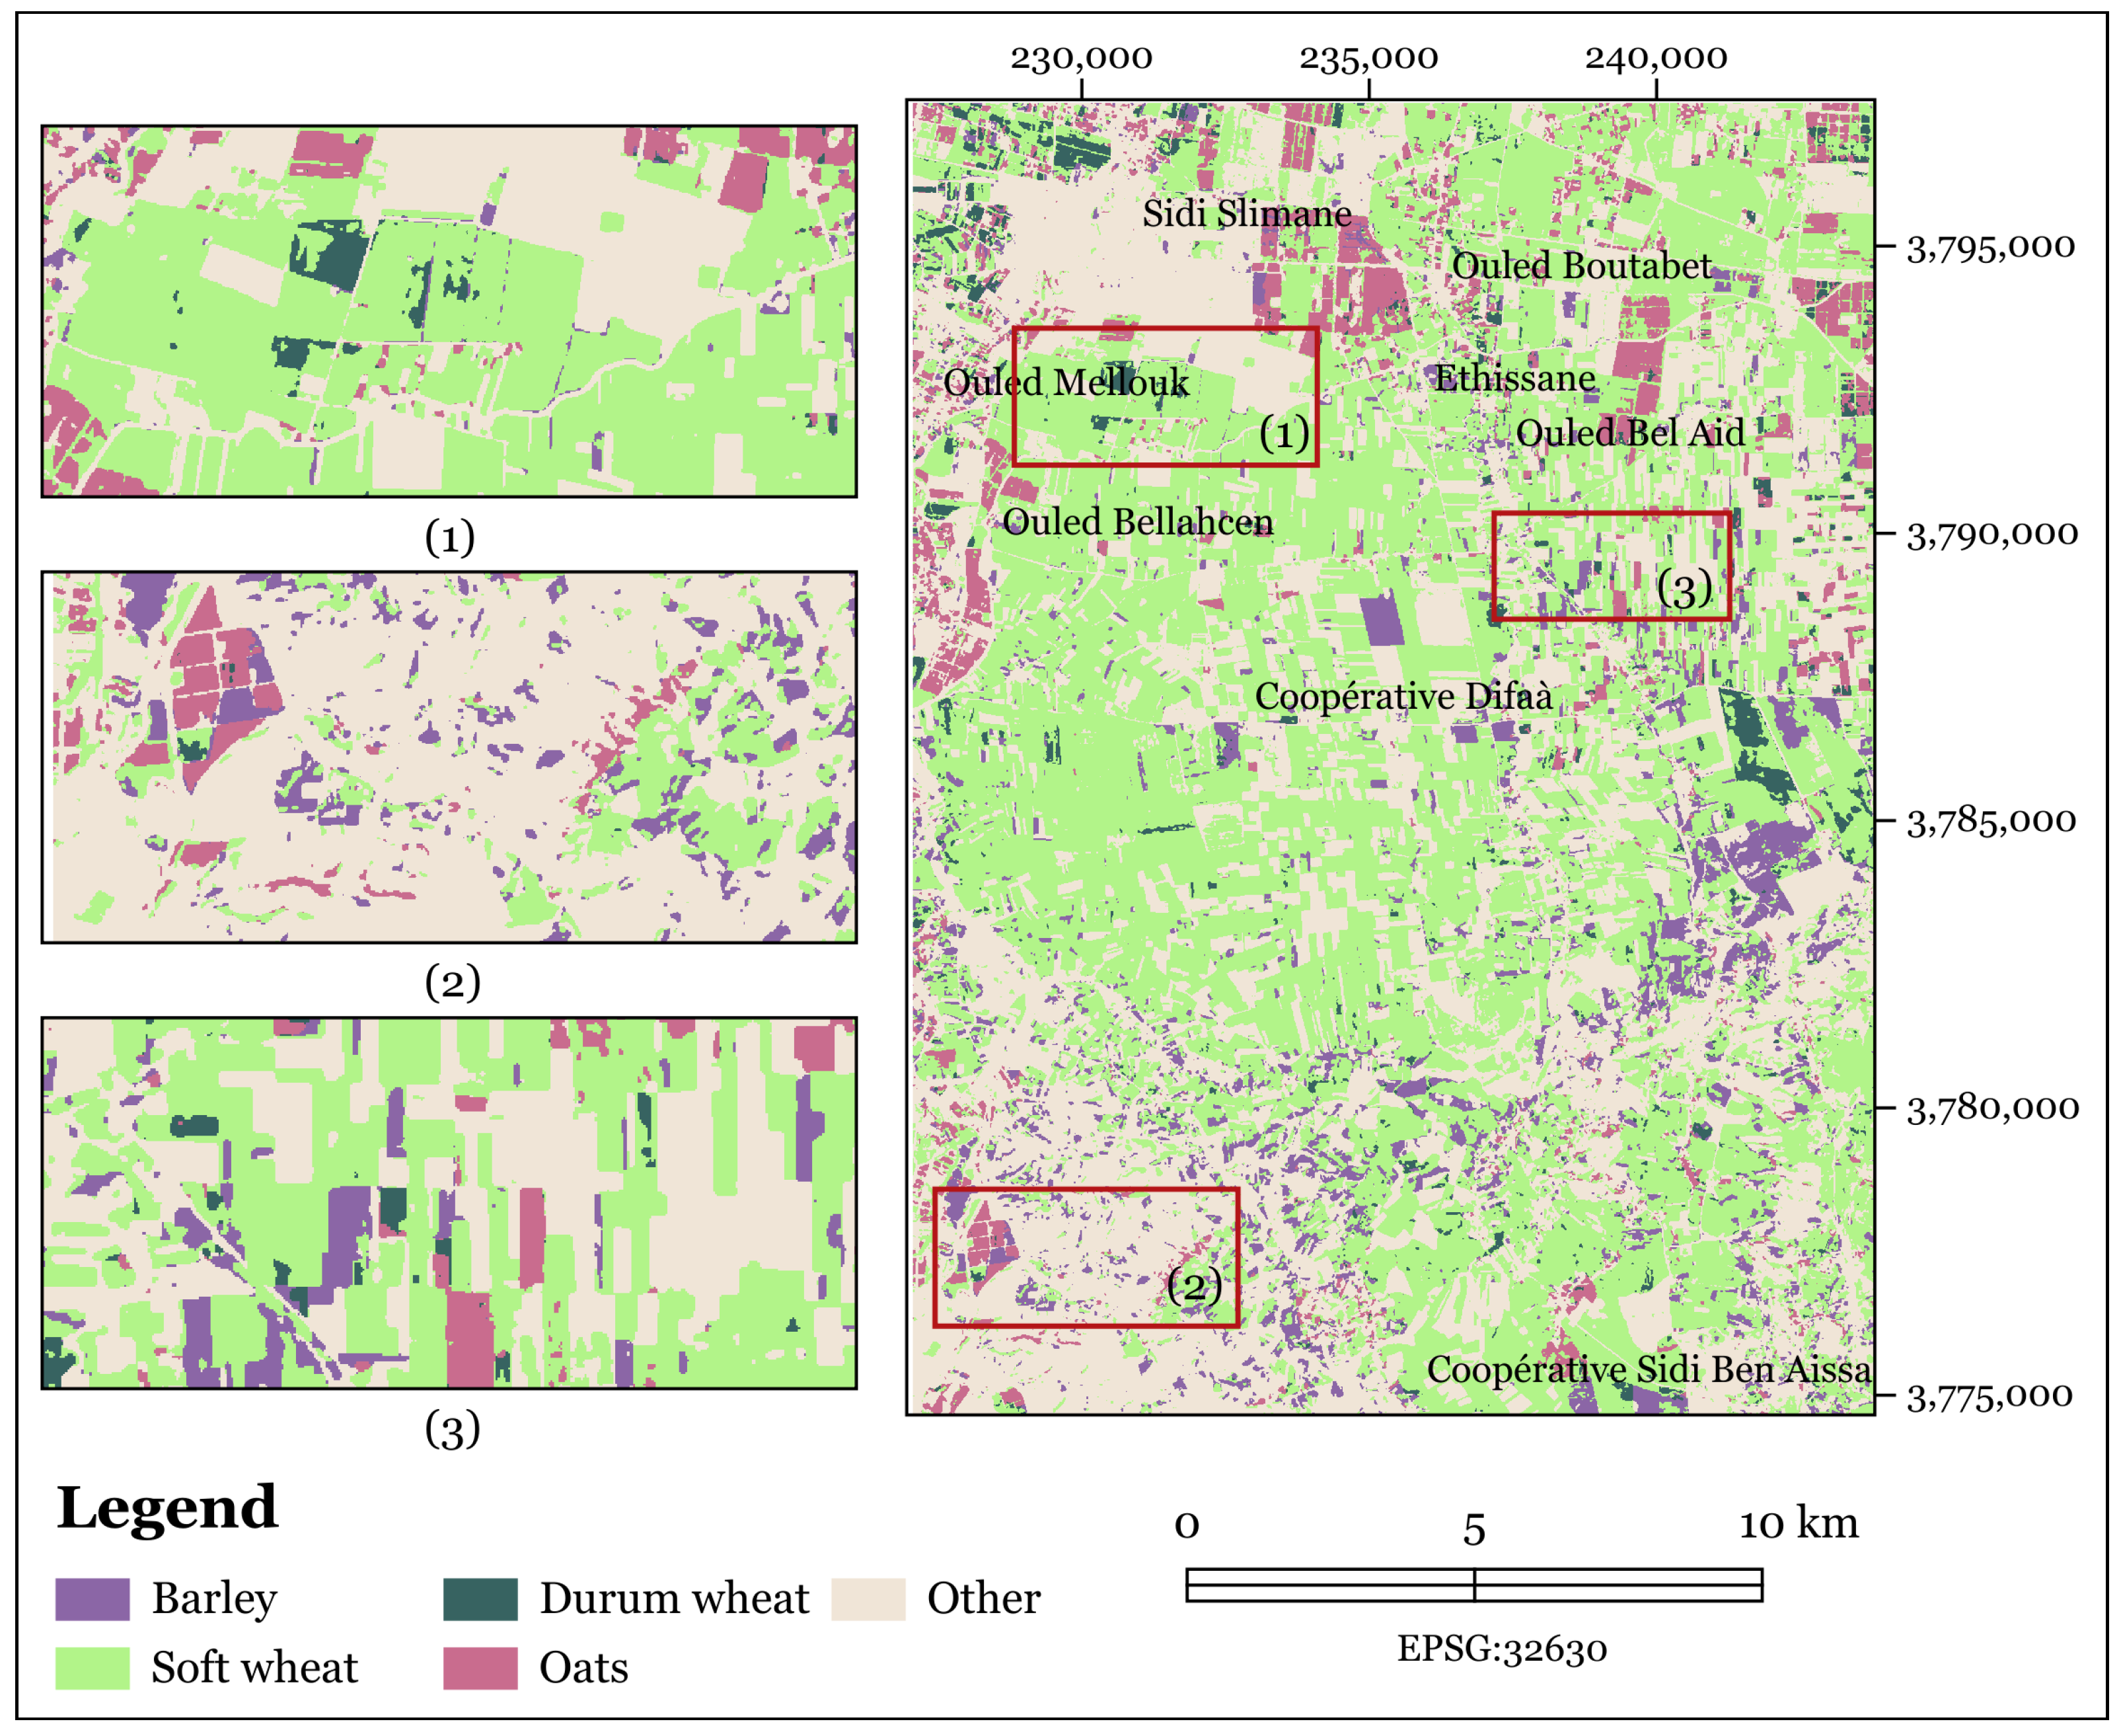
After training the CerealNet model on the Gharb dataset, it was applied to the multi-temporal Sentinel-2 imagery of the study area with the goal of illustrating the output of the model. Figure 8 shows the output cereal crops map. The output of the model shows that cereal crops cover the vast majority of the study area. Except for the city of Sidi Slimane located to the north and the steep hills in the south-west, cereal plants seem to cover the extent of the whole zone. In fact, cereal crops are sown on more land than all the other crops combined, with an area of 23,484 ha, making over 60% of the study area. The rest of the pixels in the output map represented built-up areas and non-cereal crops, which amounted to 15,420 ha.
The cereal crop map shows a clear dominance of soft wheat over the other cereal classes, covering over 75% of the cereal area. Barley ranks second, with 11.5% area of coverage. Oats are not too far behind, with 9% area sown. Durum wheat, however, has the smallest contribution to the total area sown by cereal with only 4%. The statistics derived from the predicted cereal crop map were in line with the ratio of soft wheat, durum wheat, and barley reported by the Haut Commisariat au Plan (HCP) of Morocco for the Rabat-Sale-Kenitra region where the study area is located in 2021 [52]. The spatial distribution of the four cereal crops is not random. After analyzing the geography of the region, it is clear that soft wheat, durum wheat, and oats favor the plain with its small slope angles, whereas barley has a more frequent abundance in the southwest, where the altitudes are much higher and slopes steeper. This distribution is due to the high adaptability of barley to harsh terrain. Even though we used a pixel-based approach, parcel limits are clearly distinguishable in the map. This is especially true for oats, which could be found adjacent to or surrounded by soft wheat parcels.
When it comes to parcel size, all crop classes—apart from barley—are sown in groups of large parcels that can reach up to more than 200 h a . The size of barley parcels is relatively smaller, not surpassing 80 h a . Oats, on the other hand, have very small parcels on average, not surpassing 5 ha, usually in groups. Unlike soft wheat, durum wheat, and barley, this fodder crop’s main purpose is feeding horses, which explains the small parcel size in comparison with other cereal crops. In fact, there are some cases where oats were grown in the limits of other cereal parcels as a measure of protection against cattle. Sheep would eat the oats at the border and not intrude on the soft wheat inside the parcel.
Out-of-sample data were used to evaluate the performance of the model. We noted an overall categorical accuracy of 95%, which indicates that the model was successful in the generalization process. A confusion matrix was used to provide a detailed view of the performance of CerealNet in classifying the four cereal classes (Table 4). The rows represent the ground truth target values, whereas the columns represent the model’s predictions. The maximum number of pixels is located along the diagonal of the matrix. This indicates that the model was able to extract meaningful features from the data, which was useful in discriminating between the four cereal crops. Due to the distinctive characteristics of oats, which were discussed previously, our model was able to correctly identify it even though it is a minority class. In fact, oats had the highest user and producer accuracy (UA and PA) of the four cereal crops. Barley, on the other hand, had a moderate level of confusion with all classes and therefore had the lowest UA and PA (<85%), as it closely resembles soft wheat and durum wheat.

4.3. Comparison with State-Of-The-Art Classifiers

The proposed methodology was compared with two traditional ML classifiers (SVM and RF) (Table 5) and two DL models (LSTM and CNN) (Table 6). We found that CerealNet outperformed the competition with an F1-score of 0.94, and high class accuracy. Among the classifiers used in this study, the SVM had the lowest performance metrics, with an F1-score of 0.84. RF, on the other hand, reached an F1-score of 0.92, 8% higher than that of the SVM. Out of the three DL classifiers, LSTM performed the worst. In fact, LSTM is the only classifier (other than the SVM) that had an F1-score lower than 0.90. By contrast, the CNN had a much higher ranking, only 1% lower than the F1-score of CerealNet.

5. Conclusions

In this study, we successfully developed a novel deep learning architecture for identifying four spectrally similar cereal crops using multi-temporal Sentinel-2 imagery. The hybrid LSTM-Conv1D model, dubbed CerealNet, was evaluated using ground truth data collected from the Gharb region in Morocco. We noted an out-of-sample categorical accuracy of 95% and an F1-score of 94%. These values were higher than those of several state-of-the-art deep learning crop classifiers with which we compared our model. Despite the fact that the dataset utilized had a significant imbalance in the number of samples, our model was able to generalize such that the class accuracy was unaffected by the sample size. As a matter of fact, oats, while having the lowest number of ground truth samples, had the highest accuracy and F1-score of the four cereal classes. This is due to the specific temporal characteristics of oats, which makes it simpler to distinguish them from other cereal crops. Barley had the lowest F1-score (0.83) out of all the classes, due to the fact that it is too similar to both common and durum wheat. We suggest gathering more ground truth samples to address this problem, as well as using a longer time-series. During this study, only cloud-free Sentinel-2 level 2-A imagery was used to build the dataset. The presence of clouds in the study area reduced the amount of usable data. It is well known that the length of the time series has a direct effect on the performance of crop mapping models [1]. This is especially true if the missing imagery coincides with key phenological stages. Increasing the length of the time series by adding SAR (Synthetic Aperture Radar) imagery could be beneficial in increasing the model’s performance [53,54]. In fact, thanks to the modularity of CerealNet, SAR could be used to estimate the NDVI when optical imagery is not available [55]. Additionally, SAR polarimetric bands could be used as a separate feature set to identify crops [30].

Author Contributions

Conceptualization, M.A.M., L.E.M., O.B., Y.I., O.L., Y.Z., and F.B.; methodology, M.A.M., L.E.M., O.B., and Y.Z.; software, M.A.M.; validation, M.A.M.; formal analysis, M.A.M.; investigation, M.A.M.; resources, S.B.; data curation, M.A.M.; writing—original draft preparation, M.A.M.; writing—review and editing, M.A.M., L.E.M., and R.H.; visualization, M.A.M.; supervision, L.E.M., O.B., Y.I., O.L., Y.Z., and F.B.; project administration, L.E.M., O.B., Y.I., O.L., Y.Z., and F.B.; funding acquisition, F.B. All authors have read and agreed to the published version of the manuscript.

Funding

This research was funded by Hassan II Academy of Science and Technology under the project entitled “multispectral satellite imagery, data mining, and agricultural applications”.

Institutional Review Board Statement

Not applicable.

Informed Consent Statement

Not applicable.

Data Availability Statement

Data sharing is not applicable to this manuscript.

Acknowledgments

The authors thank the Moroccan company Les Domaines Agricoles for giving us access to their parcels as we conducted the data collection survey for this research.

Conflicts of Interest

The authors declare no conflict of interest. The funders had no role in the design of the study; in the collection, analyses, or interpretation of data; in the writing of the manuscript, or in the decision to publish the results.

Abbreviations

The following abbreviations are used in this manuscript:
CNNConvolutional Neural Networks
DTDecision Tree
KNNK-Nearest Neighbor
LSTMLong Short-Term Memory
MLMachine Learning
NDVINormalized Difference
NIRNear Infrared
RFRandom Forest
RNNRecurrent Neural Networks
SARSynthetic Aperture Radar
reluRectified Linear Unit
SGDStochastic Gradient Descent
SVMSupport Vector Machine
SWIRShort Wave Infrared
VNIRVisible and Near Infrared
reluRectified Linear Unit

References

  1. Robert, P.C. Precision agriculture: A challenge for crop nutrition management. Plant Soil 2002, 247, 143–149. [Google Scholar] [CrossRef]
  2. Food and Agriculture Organization of the United Nations. The future of food and agriculture–Trends and challenges. Annu. Rep. 2017, 296, 1–180. [Google Scholar]
  3. Foley, J.A.; Ramankutty, N.; Brauman, K.A.; Cassidy, E.S.; Gerber, J.S.; Johnston, M.; Mueller, N.D.; O’Connell, C.; Ray, D.K.; West, P.C.; et al. Solutions for a cultivated planet. Nature 2011, 478, 337–342. [Google Scholar] [CrossRef] [PubMed] [Green Version]
  4. Santos, C.; Lamparelli, R.; Figueiredo, G.; Dupuy, S.; Boury, J.; Luciano, A.; Torres, R.; le Maire, G. Classification of Crops, Pastures, and Tree Plantations along the Season with Multi-Sensor Image Time Series in a Subtropical Agricultural Region. Remote Sens. 2019, 11, 334. [Google Scholar] [CrossRef] [Green Version]
  5. El Mansouri, L. Multiple classifier combination for crop types phenology based mapping. In Proceedings of the 2017 International Conference on Advanced Technologies for Signal and Image Processing (ATSIP), Fez, Morocco, 22–24 May 2017; pp. 1–6. [Google Scholar] [CrossRef]
  6. Suits, G.H. The calculation of the directional reflectance of a vegetative canopy. Remote Sens. Environ. 1972, 2, 117–125. [Google Scholar] [CrossRef] [Green Version]
  7. El Mansouri, L.; Lahssini, S.; Hadria, R.; Eddaif, N.; Benabdelouahab, T.; Dakir, A. Time Series Multispectral Images Processing for Crops and Forest Mapping: Two Moroccan Cases. Geospat. Technol. Eff. Land Gov. 2019, 24. [Google Scholar] [CrossRef]
  8. Hadria, R. Classification multi-temporelle des agrumes dans la plaine de triffa a partir des images sentinel 1 en vue d’une meilleure gestion de l’eau d’irrigation. In Proceedings of the 2018 Atelier International sur l’apport des Images Satellite Sentinel-2: état de L’art de la Recherche au Service de l’Environnement et Applications Associées, Rabat, Morocco, 6–7 March 2018. [Google Scholar]
  9. Zhao, J.; Zhong, Y.; Hu, X.; Wei, L.; Zhang, L. A robust spectral-spatial approach to identifying heterogeneous crops using remote sensing imagery with high spectral and spatial resolutions. Remote Sens. Environ. 2020, 239, 111605. [Google Scholar] [CrossRef]
  10. Moussaid, A.; Fkihi, S.E.; Zennayi, Y. Tree Crowns Segmentation and Classification in Overlapping Orchards Based on Satellite Images and Unsupervised Learning Algorithms. J. Imaging 2021, 7, 241. [Google Scholar] [CrossRef]
  11. Zhou, Y.; Luo, J.; Feng, L.; Yang, Y.; Chen, Y.; Wu, W. Long-short-term-memory-based crop classification using high-resolution optical images and multi-temporal SAR data. Giscience Remote Sens. 2019, 56, 1170–1191. [Google Scholar] [CrossRef]
  12. Yan, J.; Liu, J.; Wang, L.; Liang, D.; Cao, Q.; Zhang, W.; Peng, J. Land-Cover Classification With Time-Series Remote Sensing Images by Complete Extraction of Multiscale Timing Dependence. IEEE J. Sel. Top. Appl. Earth Obs. Remote Sens. 2022, 15, 1953–1967. [Google Scholar] [CrossRef]
  13. Wang, X.; Zhang, J.; Xun, L.; Wang, J.; Wu, Z.; Henchiri, M.; Zhang, S.; Zhang, S.; Bai, Y.; Yang, S.; et al. Evaluating the Effectiveness of Machine Learning and Deep Learning Models Combined Time-Series Satellite Data for Multiple Crop Types Classification over a Large-Scale Region. Remote Sens. 2022, 14, 2341. [Google Scholar] [CrossRef]
  14. Martin, M.P.; Barreto, L.; Riano, D.; Fernandez-Quintanilla, C.; Vaughan, P. Assessing the potential of hyperspectral remote sensing for the descrimination of grassweeds in winter cereal crops. Int. J. Remote Sens. 2011, 32, 49–67. [Google Scholar] [CrossRef]
  15. Basukala, A.K.; Oldenburg, C.; Schellberg, J.; Sultanov, M.; Dubovyk, O. Towards improved land use mapping of irrigated croplands: Performance assessment of different image classification algorithms and approaches. Eur. J. Remote Sens. 2017, 50, 187–201. [Google Scholar] [CrossRef] [Green Version]
  16. Paul, S.; Kumar, D.N. Evaluation of Feature Selection and Feature Extraction Techniques on Multi-Temporal Landsat-8 Images for Crop Classification. Remote Sens. Earth Syst. Sci. 2019, 2, 197–207. [Google Scholar] [CrossRef]
  17. Karakizi, C.; Tsiotas, I.A.; Kandylakis, Z.; Vaiopoulos, A.; Karantzalos, K. Assessing the Contribution of Spectral and Temporal Features for Annual Land Cover and Crop Type Mapping. Int. Arch. Photogramm. Remote. Sens. Spat. Inf. Sci. 2020, 43, 1555–1562. [Google Scholar] [CrossRef]
  18. Kaijage, B. Development of a Spatially Explicit Active Learning Method for Crop Type Mapping from Satellite Image Time Series. Ph.D. Thesis, University of Twente, Enschede, The Netherlands, 2021. [Google Scholar]
  19. Yan, Y.; Ryu, Y. Google street view and deep learning: A new ground truthing approach for crop mapping. arXiv 2019, arXiv:1912.05024. [Google Scholar]
  20. Muhammad, S.; Zhan, Y.; Wang, L.; Hao, P.; Niu, Z. Major crops classification using time series MODIS EVI with adjacent years of ground reference data in the US state of Kansas. Optik 2016, 127, 1071–1077. [Google Scholar] [CrossRef]
  21. Piedelobo, L.; Hernández-López, D.; Ballesteros, R.; Chakhar, A.; Del Pozo, S.; González-Aguilera, D.; Moreno, M.A. Scalable pixel-based crop classification combining Sentinel-2 and Landsat-8 data time series: Case study of the Duero river basin. Agricultural Systems 2019, 171, 36–50. [Google Scholar] [CrossRef]
  22. Momm, H.G.; ElKadiri, R.; Porter, W. Crop-type classification for long-term modeling: An integrated remote sensing and machine learning approach. Remote Sens. 2020, 12, 449. [Google Scholar] [CrossRef] [Green Version]
  23. Kwak, G.H.; Park, C.; Lee, K.; Na, S.; Ahn, H.; Park, N.W. Potential of Hybrid CNN-RF Model for Early Crop Mapping with Limited Input Data. Remote Sens. 2021, 13, 1629. [Google Scholar] [CrossRef]
  24. Zheng, B.; Myint, S.W.; Thenkabail, P.S.; Aggarwal, R.M. A support vector machine to identify irrigated crop types using time-series Landsat NDVI data. Int. J. Appl. Earth Obs. Geoinf. 2015, 34, 103–112. [Google Scholar] [CrossRef]
  25. Kaiser, A.; Duchesne-Onoro, R. Discrimination of wheat and oat crops using field hyperspectral remote sensing. In Proceedings of the Hyperspectral Imaging Sensors: Innovative Applications and Sensor Standards 2017; SPIE: Bellingham, WA, USA, 2017; Volume 10213, pp. 55–60. [Google Scholar] [CrossRef]
  26. Li, Z.; Zhou, G.; Zhang, T. Interleaved group convolutions for multitemporal multisensor crop classification. Infrared Phys. Technol. 2019, 102, 103023. [Google Scholar] [CrossRef]
  27. Zhang, X.; Zheng, Z.; Xiao, P.; Li, Z.; He, G. Patch-Based Training of Fully Convolutional Network for Hyperspectral Image Classification With Sparse Point Labels. IEEE J. Sel. Top. Appl. Earth Obs. Remote Sens. 2022, 15, 8884–8897. [Google Scholar] [CrossRef]
  28. Sykas, D.; Sdraka, M.; Zografakis, D.; Papoutsis, I. A Sentinel-2 Multiyear, Multicountry Benchmark Dataset for Crop Classification and Segmentation With Deep Learning. IEEE J. Sel. Top. Appl. Earth Obs. Remote Sens. 2022, 15, 3323–3339. [Google Scholar] [CrossRef]
  29. Metzger, N.; Turkoglu, M.O.; D’Aronco, S.; Wegner, J.D.; Schindler, K. Crop Classification Under Varying Cloud Cover With Neural Ordinary Differential Equations. IEEE Trans. Geosci. Remote Sens. 2022, 60, 1–12. [Google Scholar] [CrossRef]
  30. Yao, J.; Wu, J.; Xiao, C.; Zhang, Z.; Li, J. The Classification Method Study of Crops Remote Sensing with Deep Learning, Machine Learning, and Google Earth Engine. Remote Sens. 2022, 14, 2758. [Google Scholar] [CrossRef]
  31. Wu, H.; Zhou, H.; Wang, A.; Iwahori, Y. Precise Crop Classification of Hyperspectral Images Using Multi-Branch Feature Fusion and Dilation-Based MLP. Remote Sens. 2022, 14, 2713. [Google Scholar] [CrossRef]
  32. Manjunath, K.R.; Ray, S.S.; Panigrahy, S. Discrimination of Spectrally-Close Crops Using Ground-Based Hyperspectral Data. J. Indian Soc. Remote. Sens. 2011, 39, 599–602. [Google Scholar] [CrossRef]
  33. Serna-Saldivar, S.O. Cereal Grains: Properties, Processing, and Nutritional Attributes; CRC Press: Boca Raton, FL, USA, 2010. [Google Scholar]
  34. Delcour, J.A.; Hoseney, R. Principles of Cereal Science and Technology, 3rd ed.; AACC International: Washington, DC, USA, 2010. [Google Scholar]
  35. Softwel (p) Ltd. SW MAPS User’s Manual; Softwel (p) Ltd.: Kathmandu, Nepal, 2016; Available online: http://softwel.com.np (accessed on 20 December 2021).
  36. European Space Agency. Sentinel-2-Missions-Sentinel Online. Available online: https://sentinel.esa.int/web/sentinel/missions/sentinel-2 (accessed on 20 April 2022).
  37. Foody, M.; Mathur, A. A Relative Evaluation of Multiclass Image Classification by Support Vector Machines. IEEE Trans. Geosci. Remote Sens. 2004, 42, 1335–1343. [Google Scholar] [CrossRef] [Green Version]
  38. Foody, M.; Mathur, A. Toward Intelligent Training of Supervised Image Classifications: Directing Training Data Acquisition for SVM Classification. Remote Sens. Environ. 2004, 93, 107–117. [Google Scholar] [CrossRef]
  39. Vapnik, V. The Nature of Statistical Learning Theory, 1st ed.; Springer: New York, NY, USA, 1995. [Google Scholar]
  40. Pedregosa, F.; Varoquaux, G.; Gramfort, A.; Michel, V.; Thirion, B.; Grisel, O.; Blondel, M.; Prettenhofer, P.; Weiss, R.; Dubourg, V. Scikit-learn: Machine learning in python. J. Mach. Learn. Res. 2011, 12, 2825–2830. [Google Scholar]
  41. Python Software Foundation. Python 3.10.0 Documentation. Available online: https://www/python.org (accessed on 21 October 2022).
  42. Breiman, L. Random Forests. Mach. Learn. 2001, 35, 5–32. [Google Scholar] [CrossRef] [Green Version]
  43. Belgiu, M.; Drăguţ, L. Random forest in remote sensing: A review of applications and future directions. Isprs J. Photogramm. Remote Sens. 2016, 114, 24–31. [Google Scholar] [CrossRef]
  44. Hochreiter, S.; Schmidhuber, J. Long Short-Term Memory. Neural Comput. 1997, 9, 1735–1780. [Google Scholar] [CrossRef]
  45. Gers, F.A.; Schmidhuber, J.; Cummins, F. Learning to forget: Continual prediction with LSTM. Neural Comput. 2000, 12, 2451–2471. [Google Scholar] [CrossRef] [PubMed]
  46. Lyu, H.; Lu, H.; Mou, L. Learning a transferable change rule from a recurrent neural network for land cover change detection. Remote Sens. 2016, 8, 506. [Google Scholar] [CrossRef] [Green Version]
  47. Reddy, D.S.; Prasad, P.R.C. Prediction of vegetation dynamics using NDVI time series data and LSTM. Model. Earth Syst. Environ. 2018, 4, 409–419. [Google Scholar] [CrossRef]
  48. Zhang, J.; Zhu, Y.; Zhang, X.; Ye, M.; Yang, J. Developing a Long Short-Term Memory (LSTM) based Model for Predicting Water Table Depth in Agricultural Areas. J. Hydrol. 2018, 561, 918–929. [Google Scholar] [CrossRef]
  49. Meng, X.; Liu, M.; Wu, Q. Prediction of rice yield via stacked LSTM. Int. J. Agric. Environ. Inf. Syst. 2020, 11, 86–95. [Google Scholar] [CrossRef]
  50. LeCun, Y.; Bengio, Y.; Hinton, G. Deep learning. Nature 2015, 521, 436–444. [Google Scholar] [CrossRef]
  51. Chollet, F. Deep Learning with Python; Manning Publications Co.: Shelter Island, NY, USA, 2018. [Google Scholar]
  52. PLAN, H.C.A. Annuaire Statistique du Maroc; Haut Commissariat au Plan: Casablanca, Morocco, 2020. [Google Scholar]
  53. Liao, C.; Wang, J.; Xie, Q.; Al Baz, A.; Huang, X.; Shang, J.; He, Y. Synergistic Use of Multi-Temporal RADARSAT-2 and VEN mu S Data for Crop Classification Based on 1D Convolutional Neural Network. Remote Sens. 2020, 12, 832. [Google Scholar] [CrossRef]
  54. Ofori-Ampofo, S.; Pelletier, C.; Lang, S. Crop Type Mapping from Optical and Radar Time Series Using Attention-Based Deep Learning. Remote Sens. 2021, 13, 4668. [Google Scholar] [CrossRef]
  55. Mazza, A.; Gargiulo, M.; Scarpa, G.; Gaetano, R. Estimating the NDVI from SAR by Convolutional Neural Networks. In Proceedings of the IGARSS 2018-2018 IEEE International Geoscience and Remote Sensing Symposium, Valencia, Spain, 22–27 July 2018; pp. 1954–1957. [Google Scholar] [CrossRef]
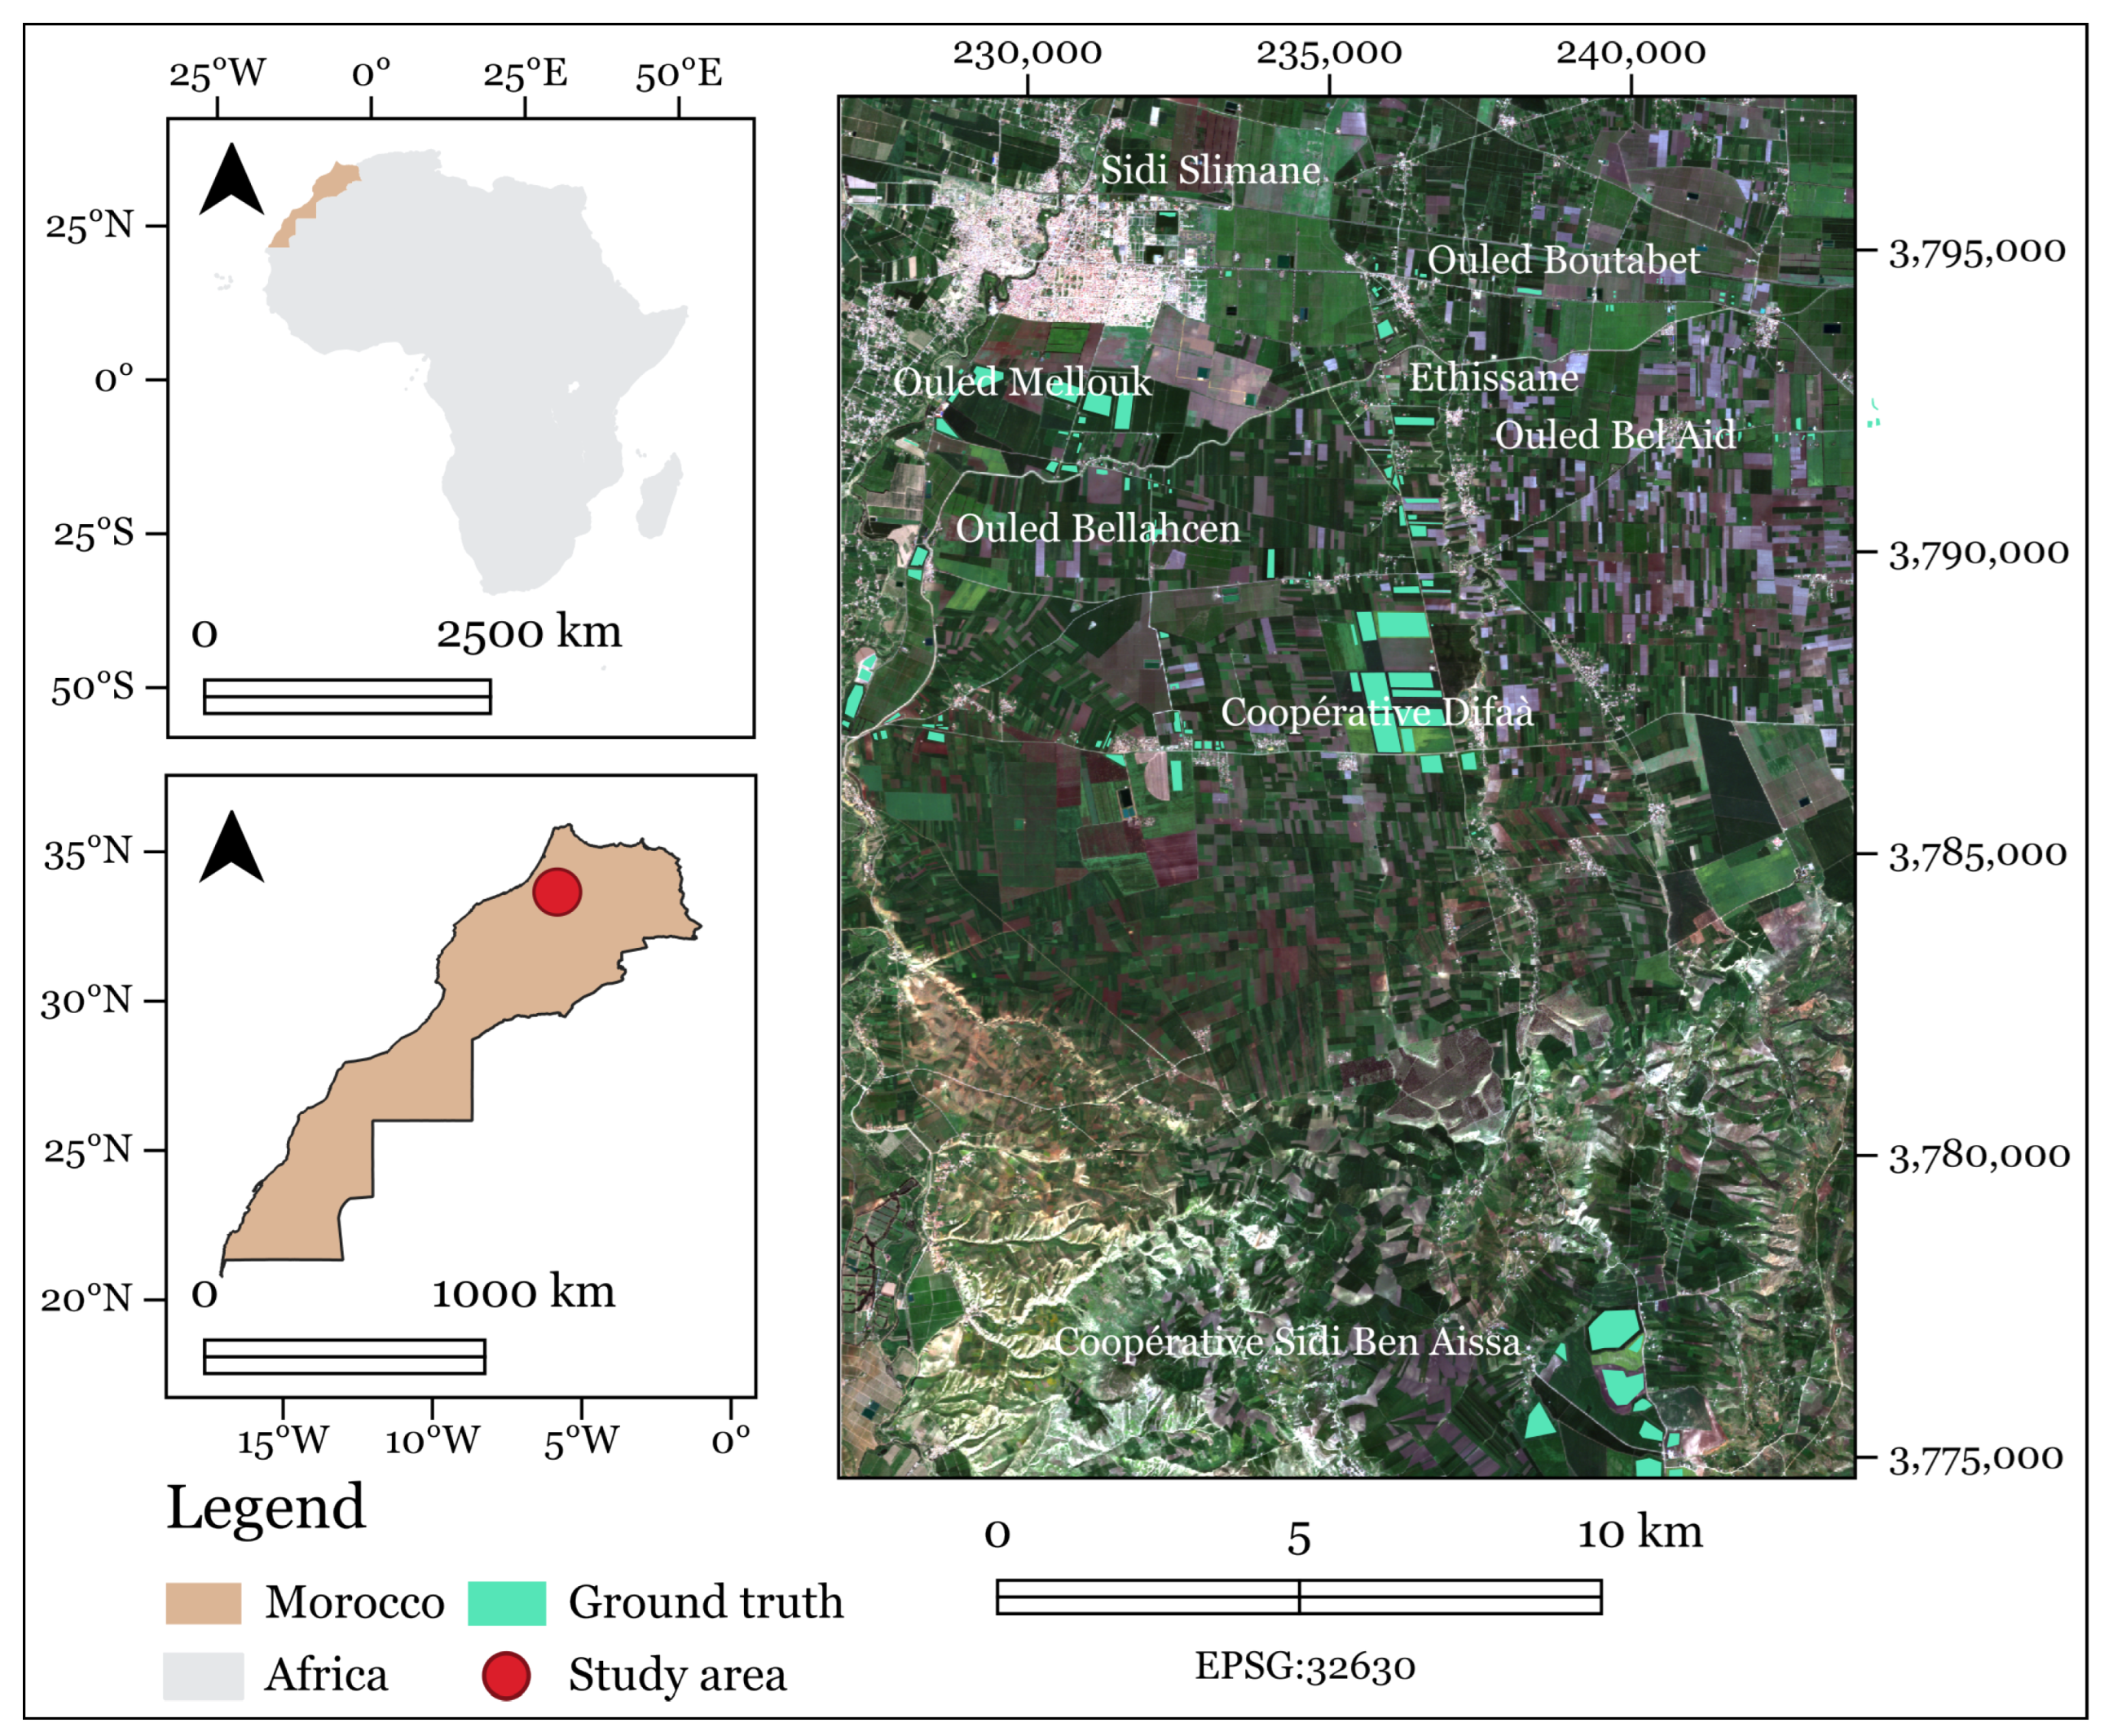
Figure 1. Study area.
Informatics 09 00096 g001
Figure 2. Cereal crops at the maturity stage. (a) barley. (b) soft wheat. (c) durum wheat. (d) oats.
Informatics 09 00096 g002
Figure 3. Methodology overview.
Informatics 09 00096 g003
Figure 4. Overview of the CerealNet architecture.
Informatics 09 00096 g004
Figure 5. Spectro-temporal profiles of small-grain cereal crops.
Informatics 09 00096 g005
Figure 6. NDVI temporal profiles of the four small-grain cereal crops.
Informatics 09 00096 g006
Figure 7. Spectral profiles of small-grain cereal crops at key phenological dates.
Informatics 09 00096 g007
Figure 8. Classification of the study area using CerealNet.
Informatics 09 00096 g008
Table 1. Summary of the number of plots and pixels per cereal crop in the study area.
CropPlotsPixels
TrainTestTotalTrainTestTotal
Barley63238631179794217
Soft wheat3596742617,200574423,006
Durum wheat501666300410404157
Oats61218217275402291
Total53312766025,048830333,671
Table 2. Sentinel-2 bands used in this study. VNIR: Visible and Near-Infrared; SWIR: Short Wave Infrared.
BandResolution (m)Central Wavelength (nm)Description
B210490Blue
B310560Green
B410665Red
B520705VNIR
B620740VNIR
B720783VNIR
B810842VNIR
B8A20865VNIR
B11201619SWIR
B12202190SWIR
Table 3. Satellite imagery used in this study.
Observation DateTilesCloud Cover %
2020-12-2230STC - 30STD0
2020-12-2730STC - 30STD1
2021-01-0330STC - 30STD1
2021-01-1830STC - 30STD1
2021-01-2630STC - 30STD0
2021-02-1530STC - 30STD0
2021-03-1430STC - 30STD2
2021-03-2230STC - 30STD0
2021-03-2430STC - 30STD0
2021-04-1330STC - 30STD4
2021-04-1830STC - 30STD1
2021-05-0630STC - 30STD3
2021-05-1830STC - 30STD1
2021-05-2130STC - 30STD0
Table 4. Confusion matrix of the CerealNet classification.
BarleySoft WheatDurum WheatOatsOtherUAPA
Barley788134100240.840.82
Soft wheat155535540900.960.96
Durum wheat099916000.980.90
Oats000508101.000.97
Other030037650.971.00
Table 5. Accuracy comparison of the traditional ML classifiers.
CropSVMRF
UAPAF1-ScoreUAPAF1-Score
Barley0.730.670.700.790.830.81
Soft wheat0.910.930.920.960.910.94
Durum wheat0.950.630.760.930.930.93
Oats0.780.960.861.000.900.95
Other0.961.000.980.931.000.96
Total0.860.840.840.920.910.92
Table 6. Accuracy comparison of the DL classifiers.
CropCNNLSTMCerealNet
UAPAF1-ScoreUAPAF1-ScoreUAPAF1-Score
Barley0.850.820.860.800.810.810.840.820.83
Soft wheat0.960.910.940.940.870.900.960.960.96
Durum wheat1.000.930.950.850.900.870.980.900.94
Oats1.000.990.990.960.760.851.000.970.98
Other0.891.000.910.891.000.940.971.000.98
Total0.940.920.930.890.870.870.950.930.94
Publisher’s Note: MDPI stays neutral with regard to jurisdictional claims in published maps and institutional affiliations.